Embed Size (px)
Citation preview

Chemical Interactions of Aluminum with Aqueous Silica at 25°C
GEOLOGICAL SURVEY WATER-SUPPLY PAPER 1827-E

Chemical Interactions of Aluminum with Aqueous Silica at 25°CBy J. D. HEM, C. E. ROBERSON, C. J. LIND, and W. L. POLZER
CHEMISTRY OF ALUMINUM IN NATURAL WATER
GEOLOGICAL SURVEY WATER-SUPPLY PAPER 1827-E
An evaluation of the chemical properties of colloidal clay like material formed by mixing solutions of aluminum and silica
UNITED STATES GOVERNMENT PRINTING OFFICE, WASHINGTON : 1973

UNITED STATES DEPARTMENT OF THE INTERIOR
ROGERS C. B. MORTON, Secretary
GEOLOGICAL SURVEY
V. E. McKelvey, Director
Library of Congress catalog-card No. 72-600332
For sale by the Superintendent of Documents, U.S. Government Printing OfficeWashington, D.C. 20402 - Price 70 cents
Stock Number 2401-00229

CONTENTS
Page
Abstract----_--_--__-______-______________________________________ ElScope and purpose,---__------__-__________________________________ 1Previous work.-___________________________________________________ 2Theoretical considerations,_________________________________________ 5Preparation of aluminum hydroxide polymer._________________________ 8Introduction of silica_ _____________________________________________ 9Composition of aged solutions_______________________________________ 10Tests for equilibrium_______________________________________________ 12Effect of dissolved-silica activity..___________________________________ 16Reactions in alkaline solutions.__ ___________________________________ 16Stability fields and alu minum solubility graphs ________________________ 20Effects of fluoride________________________________________________ 23Application to natural-water composition.____________________________ 33Chemical composition of precipitates- _______________________________ 40Crystallinity of solids ______________________________________________ 40Validity of equilibrium model_______________________________________ 47References cited___________________________________________________ .55
ILLUSTRATIONS
Page FIGURES 1-4. Graphs showing:
1. Log of activity of uncomplexed aluminum versus pHin aged solutions containing silica._____________ E13
2. Sums of logs of activities of uncomplexed aluminumand aqueous silica versus pH in aged solutions--- 14
3. Log of activity of A1(OH) 4 ~ versus pH in aged solu tions containing silica and solutions containing crystalline bayerite___________________________ 18
4. Sum of logs of activities of Al(OH),r and undis-sociated aqueous silica versus pH in aged solutions _ 19
5-9. Diagrams showing stability fields of:5. Synthetic halloysite and microcrystalline gibbsite and
solubility of aluminum as functions of pH and activity of undissociated aqueous silica at 25°C and 1 atmosphere. Ionic strength 0.01; fluoride absent._____________________________________ 21
6. Synthetic halloysite and microcrystalline gibbsite and solubility of aluminum as functions of pH and activity of undissociated aqueous silica at 25° C and 1 atmosphere. Ionic strength 0.10; fluoride absent_____________________________________. 22
in

IV CONTENTS
FIGURES 5-9. Diagrams showing stability fields of Continued Page7. Synthetic halloysite and microcrystalline gibbsite
and solubility of aluminum as functions of pH and activity of undissociated aqueous silice, at 25° C and 1 atmosphere. Ionic strength 0.01; total fluoride concentration 0.19 mg/1 as F___________ E24
8. Synthetic halloysite and microcrystalline gibb&ite and solubility of aluminum as functions of pH and activity of undissociated aqueous silic?, at 25° C and 1 atmosphere. Ionic strength 0.01; total fluoride concentration 1.9 mg/1 as F____________ 25
9. Cryolite, synthetic halloysite, and microcrystalline gibbsite and solubility of aluminum as functions of pH and concentration of dissolved silica at 25°C and 1 atmosphere. Ionic strength 0.10; total fluoride concentration 190 mg/1 as F; sodium con centration 2,300 mg/1 as Na___________________ 27
10. Graph showing relationship of log [Al] or log [A1(OH) 4 ] + log [H4 SiOJ to pH for selected water samples from ground- and surface-water sources ____________________ 38
11-23. Electron micrographs of :11. Microcrystalline gibbsite synthesized at 25°C______ 4212. Crystalline bayerite from solution 14E____________ 4313. Fragments of Lewistown, Mont., standard kaolinite. 4414. Montmorillonite (Arizona bentonite)_____________ 4515. Solid recovered from solution 12E________________ 4616. Solid recovered from solution l7D-._---_-________ 4717. Solids recovered from solution 17A_______________ 4818. Solids recovered from solution 17C_____________ 4919. Solids recovered from solution 11J_ ______________ 5020. Solid recovered from solution 4D_________________ 5121. Solids recovered from solution 18A_______________ 5222. Solids recovered from solution 18B_-_____________ 5323. Solids passing 0.45/-m filter caught on O.lOjum filter, 54
TABLES
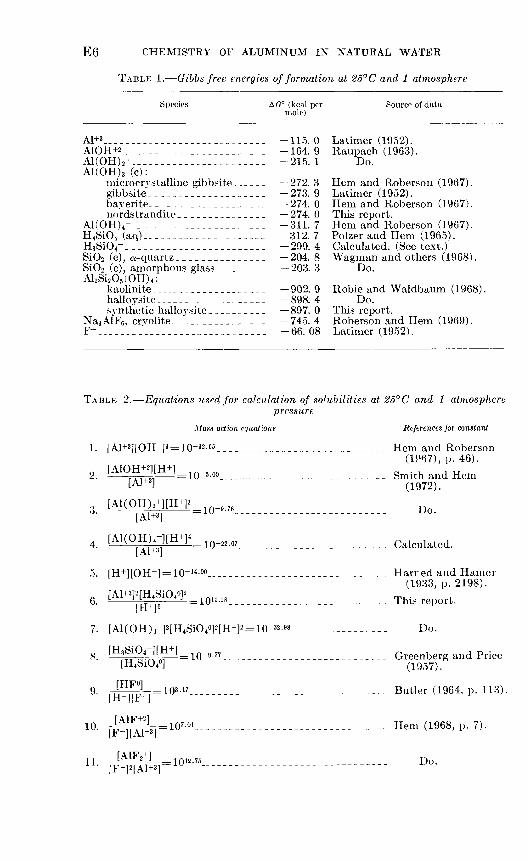
Page TABLE 1. Gibbs free energies of formation at 25°C and 1 atmosphere- _____ EG
2. Equations used for calculation of solubilities at 25° C and 1 at mosphere pressure_ _____________________________________ 6
3. Experimental solutions in which mole ratio OH :A1 wa,s less than3.0._-____----_____-__________________-_-__-------_--- 11
4. Experimental solutions in which mole ratio OH :A1 was greaterthan3.0 _-______-__-___-_---__-_----------_----------- 12
5. Composition of solutions A-F after 16 months aging- __________ 306. Ion-activity products for solutions A-F after 16 months aging _ _ _ 317. Analytical data from actual water samples. _____________--_--- 36

CHEMISTRY OF ALUMINUM IN NATURAL WATER
CHEMICAL INTERACTIONS OF ALUMINUM WITH AQUEOUS SILICA AT 25°C
By J. D. HEM, C. E. ROBERSON, C. J. LIND, and W. L. POLZER
ABSTRACT
Solutions containing from 10~ 5 to 10~ 2 moles per liter of aluminum and dissolved silica in various ratios were aged at pH levels between 4 and 10 at 25°C. A colloidal amorphous product having the composition of halloysite was produced in most solutions. It had a consistent and reversible equilibrium solubility equivalent to a standard free energy of formation of 897 ±1.0 kcal per mole for the for-nula Al2 Si 2 O5 (OH)4. Some aging times were longer than 4 years, but most solutions gave consistent solubilities after only a few months of aging. Where silica concen trations were below about 10~4 molar, microcrystalline gibbsite was formed below pH 6.0 and crystalline bayerite above pH 7.0, but only after much longer s ging than was required for crystallization in silica-free solutions.
Electron micrographs and diffraction patterns of the synthesized material indicate some crystallinity in the aluminosilicate, but no X-ray diffraction pat terns could be obtained even in the material aged 4 years.
Solubility relationships for solutions containing fluoride as well as silica and aluminum are explainable by using cryolite stabilities determined in previous work.
Aluminum contents of 51 samples of water analyzed for other purposes are in reasonable agreement with the assumption of equilibrium with amorphous clay mineral species similar to the material synthesized in this work. Solubility calculation? are summarized graphically for solutions of ionic strength of 0.01 and 0.10.
SCOPE AND PURPOSE
Framework structures of various types in which oxygen ions are bonded to silicon and aluminum cations are present in most common rock minerals. When such structures are attacked by water in proc esses of weathering, the frameworks will be extensively rearranged, and both aluminum and silicon will become available for solution, along with other cations present in the structure. The aluminum and silicon contents of natural water must depend upon the rates at which these elements become available for solution and how they are recom- bined into clay minerals or hydroxides. This recombination seems to, be a particularly important natural chemical control of aluminum solubility, but it is not well understood.
El

E2 CHEMISTRY OF ALUMINUM IN NATURAL WATER
The studies described here were made to obtain a better under standing of the behavior of aqueous aluminum species in the presence of aqueous silica. The techniques used were similar to those used previously for studying the chemistry of dilute solutions of aluminum. Silica was added in various amounts to test solutions that contained aluminum, and the results were compared with observe-tions made in the absence of silica. The resulting hypotheses can be tentatively applied to analyses of natural water. The information available on aluminum contents of natural water is inadequate (1) in the number of reliable published concentrations and in specifying whether reported concentrations represent dissolved or suspended material and (2) in the form in which the aluminum solute occurs. One aim of this study has been to provide a theoretical basis which will help interpret exist ing information on aluminum content of natural water. The study also indicates some possible controls over the dissolved-silica concentra tions in natural water.
Although the investigations shed some light on the composition and stability of certain synthetic aluminosilicate minerals which seem to be related to natural clay minerals and are probably similar to natural metastable weathering products, the synthesis of clays was not a primary purpose of the study. As many other investigators have reported, the synthesis of well-crystallized clay minerals is very difficult to accomplish at 25°C in laboratory-type systems.
The authors' interpretation of the experimental results summarized in this paper have benefited from extensive discussions with colleagues and from their reviews of this paper. In addition to assistance from members of the U.S. Geological Survey, reviews and suggestions were received from Professors J. O. Leckie and G. A. Parks, Stanford University. W. L. Polzer, U.S. Atomic Energy Commission, during his employment by the Geological Survey, performed a considerable part of the experimental work that is described in this pape1'.
PREVIOUS WORK
This report represents a continuation and uniting of two previous lines of research conducted by the authors and their associates. These studies concerned the chemistry of aluminum in dilute aqueous solu tions and the solubility of the clay mineral kaolinite. Reports sum marizing this work were written by Hem and Roberson (1967), Hem (1968), Roberson and Hem (1969), Smith and Hem (1972), Polzer and Hem (1965), and Schoen and Roberson (1970). Mechanisms of formation of gibbsite, bayerite, and nordstranclite (forms of A1(OH) 3 ) appear to be inhibited or altered and aluminum solubility appears substantially decreased by the presence of silica. Polzer and Hem

INTERACTIONS OF ALUMINUM WITH AQUEOUS SILICA E3
(1965) indicated that an apparent equilibrium solubilit}' could be determined for kaolinite at a pH near 3.5 but that more stud}' of mechanisms of solution and precipitation was needed. The kaol: nite used by Polzer and Hem was impure, and the results had to be in terpreted to allow for that complicating factor.
The work described in this paper represents an approach to studies of hydrous aluminosilicate minerals through synthesis by precipite tion from supersaturated solutions. The work of Polzer and Hem (1965) essentially consisted in trying to attain saturation in initialh7 under- saturated solutions.
Literature that concerns the fundamental chemistries of aluminum and silicon, geochemical literature on weathering reactions, mireral syntheses and natural-water compositions, and some applied chemistry in such fields as colloidal behavior and aluminum Irydroxide coagulation as applied in water treatment may be of some interest but will not be fully reviewed here. An extensive literature exists relating to the synthesis of clay minerals in the laboratory. Only a few investigators of this subject, however, have paid much attention to reaction paths or rates, and most workers have relied on high temperature and pressure to bring about the desired results.
It is well known that kaolinite with well-defined crystalling can be produced by subjecting feldspar to aqueous solutions at high pressure and temperature. For example, Hemle}T (1959) subjected potassium feldspar and water to a temperature of 300°C and a pressure of 15,000 pounds per square inch to produce kaolinite and other alteration products. That a crystallized clay mineral can be formed from amorphous aluminosilicate gels by heat (200°-400°C) and pves- sure has been known from the work of various investigators as far back as the 1930's. Kaolinite is a common accessory species in mineral veins, and relative^ high temperature and pressure environments obviously can produce this and other varieties of clay. The clay minerals are by no means restricted to such environments, but they commonly seem to be formed in place during the normal surficial weathering of many igneous rock minerals. Attempts to produce clays in the laboratorjr at 25°C have generally met with complete failure, although during the 1960's a few studies reported limited success in synthesizing solid species having clay mineral character istics identifiable by electron microscopy or other sensitive methods. Yields generally were small and reactions very slow, and the crystal- linity seemed to be poor unless higher temperatures were imposed on the system in some part of the synthesis.
Field observation commonly associates kaolinite, and similar clays having equimolar aluminum and silicon contents, with weathering regimes in which leaching is relative^ rapid, weathering solutions are

E4 CHEMISTRY OF ALUMINUM IN NATURAL WATER
dilute, and soil pH is low. Montmorillonite and other more siliceous clays appear to occur where drainage is poorer, water is less abundant, and dissolved solids and pH are relatively high. These relationships evidently have been considered in the design of some of the more recent experiments attempting synthesis of kaolinite and other clays at 25° C. A series of experiments in Germany (Harder, 1965, 1966, 1967) in which solutions were generally between 10~3 p.nd 10~ 5 molal with respect to silica and aluminum were reported to yield alumino- silicates amorphous to X-rays. On aging at temperatures ranging from 3° to 60° C, several of the precipitates developed crystalline quartz. Kaolinite, chlorite, and probably illite and feldspar vrere identified in material aged for 30 days at 60° C.
Much highly significant recent work has been done elsewhere in Europe, especially by investigators at the University of Louvain in Belgium. DeKimpe (1967, 1969), for example, described syntheses of clay at 175° C, starting with aluminosilicate gel. Related studies were described by DeKimpe, Gastuche, and Brindley (1961) and in many other published papers by members of the research groups at Louvain. In general the technique used by these workers has been to combine solutions of organically complexed aluminum (for example, aluminum isopropoxide) with an organically complexed form of orthosilicate (for example, ethyl orthosilicate). The organic portions of these species react with each other, and relatively high concentrator s of aluminum and silica can be brought together in this way without introducing large amounts of other inorganic ions. Gels of various compositions which can be made to crystallize on aging are produced.
Siffert (1962) reported syntheses of several species of magnesium clays and of kaolinite at room temperatures, using a technique some what similar to that just described. Other recent significant studies of low-temperature aluminosilicate synthesis and related solubilities have been made by Kittrick (1966, 1967) and Reesman, Pickett, and Keller (1969).
Kittrick (1970) precipitated kaolinite with a relatively well defined crystallinity at 25° C in solutions supersaturated with respect to kaolinite, in which montmorillonite was suspended at the start of the experiment. Reaction time in this experiment was 3-4 years.
Linares and Huertas (1971) reported a synthesis of kaolinite at 25° C, starting with an aluminum-fulvic acid complex and silicic acid in dilute solutions.
A general discussion of coagulation processes by Stumm and O'Melia (1968) contains some data of interest relating to interactions between aluminum hydroxide and silica and gives many references to work of others.

INTERACTIONS OF ALUMINUM WITH AQUEOUS SILICA E5
THEORETICAL CONSIDERATIONS
The simplest mineral structures which might be formed by raising the pH of solutions containing aluminum and silicic acid are aluminum hydroxide in its various forms and arrangements where both silicon and aluminum are coordinated with hydroxide, or possibly oxygen ions or water molecules. Because of differences in ionic radius and charge, aluminum is generally octahedrally coordinated with six of tl^se species, and silicon is tetrahedrally coordinated with four. Hence, eub- stitution of silicon for aluminum within the gibbsite structural Iryer seems unlikely. The silicon may, however, form a tetrahedral structure with oxygen that in effect attaches an oxygen layer to the double Iryer of hydroxide in the structure of gibbsite. Each silicon ion associated with this third layer must displace a proton from an OH ion in the gibbsite structure in order to maintain a charge balance. Thus, two- thirds of the ions in the middle layer are oxygens and the remaining one-third are hydroxides. Structural formulas for this type of clay mineral (kaolinite or halloysite are common examples) are given in textbooks and elsewhere and will not be repeated here. The composi tional formula for kaolinite is Al2Si2O5 (OH) 4 . Halloysite has essentially the same structure, but its formula usually is written with some addi tional water. It can be represented by the kaolinite formula for stoi- chiometric or equilibrium computations.
A convenient starting point for the development of a conceptual model is the knowledge already obtained for the structure and syn thesis of gibbsite. Introduction of aqueous silica at the stage of gibtsite synthesis where the ordered structure is forming should give the oppor tunity for synthesizing a 1:1 clay mineral, and some prelimiranr electron micrographs published by Polzer, Hem, and Gabe (1967) show what appear to be halloysite particles synthesized by aging such mixed solutions at 25°. Gibbsite might also form in these solutions. The ultimate equilibrium condition ought to represent a system in which equilibrium exists among the participating aluminum, silicon, and hydrogen ionic species and the solids that are formed.
Table 1 presents Gibbs free energies of species, and table 2 contains mass-law and solubilit}^ expressions that are needed for calculating the equilibrium relationships of interest. Most of the free energy and equilibrium constant values were taken from published literature. The free energy of the silicate ion was computed by using the disso ciation constant given for silicic acid and the free energies for other species involved. Some of the equilibrium constants were determined experimentally by procedures that will be described in this paper.
476-920 O - 73 - 2
E6 CHEMISTRY OF ALUMINUM IN NATURAL WATER
TABLE 1. Gibbs free energies of formation at 25°C and 1 atmosphere
Species AG° (kcal per mole)
Source of data
Al+3 _______-_.__________________ 115.0 Latimer (1952).AlOH+2________________________ -164.9 Raupach (1963).Al(OH) 2+_______________________ -215. 1 Do.Al(OH)j (c):
microcrystalline gibbsite______ 272. 3 Hem and Roberson (1967).gibbsite-___________________ -273.9 Latimer (1952).bayerite_-_-_________.______ -274.0 Hem and Roberson (1967).nordstrandite.______________ 274. 0 This report.
Al(OH) 4-_______________________ -311.7 Hem and Roberson (1967).H4SiO4 (aq)---_-___________.____ -312.7 Polzer and Hem (1965).H3 SiO4-________________________ -299.4 Calculated. (See text.)SiO2 (c), a-quartz_______________ -204.8 Wagman and others (1968).SiO2 (c), amorphous glass. ________ 203. 3 Do.Al2Si2 O5 (OH) 4 :
kaolinite...._____.__________ 902.9 Robie and Waldbaum (1968).halloysite _________________ - 898. 4 Do.synthetic halloysite__________ 897. 0 This report.
Na3 AlF6 , cryolite__'______________ 745.4 Roberson and Hem (1969).F-.____________________________ -66.08 Latimer (1952).
TABLE 2. Equations used for calculation of solubilities at 25°C o,nd 1 atmospherepressure
Mass action equations References for constant
1. [A1+3][OH-] 3 = 10-32 - 65 _________ ___ _ _________ Hem and Roberson(1967), p. 46).
[A1OH +21[H+12. = 10~ 5 - 00 _ __________________________ Smith and Hem
L AJ J (1972).
^=10-'-w_--_----__--------------- Do.
H L = iQ-22.07 _ _ _ ______ Calculated.IAITO J
o. [H+][OH-] = 10- 14 - 00 _________ Harred and Hamer(1933, p. 2198).
6. [A1+3]|tH*SiO40] 2 = 1011 - 28 --------------------------- This report.
8 - [Hrw^-n [o?+] = 10" 9 - 77 - -------------------------- Greenberg and Price[H4SiO4°] (1957).
9- r4§^,L = 103 - 17 _______________-________-------- Butler (1964, p. 113).
10. -At±^ ^^io?.oi __________________________ Hem (1968, p. 7).
11 [AIF-+] = 1Q12 .75 DO.[F-] 2 [A1+ 3 ] ----------------------------

INTERACTIONS OF ALUMINUM WITH AQUEOUS SILICA E7
TABLE 2. Equations used for calculation of solubilities at 25° C and 1 atmospherepressure Continued
Mass action equations References for constant
12' [F^^I=1 ° 17 - 02- - - Hem (1968, p. 7).
13 [All 4 J _jfl1972 ,-j [F-] 4 [A1+ 3 ] U ------------------------------ i;o.
[A1F5 -] ^20.91 J-) [F-]«[A1+8] ----------------------------- uo.
15 [Albs ] 1 Q20 . 86 j-v[F-RA1+3 ] ------------------------------- uo.
16. [Na+]3 [Al+3][F-]6 = l(r33 - 84 _ ________________________ Roberson and Hem(1969, p. 3).
Mass balance equations
, [A1(OH) 2 +] , [A1(OH) 4-] [A1F+2 ]it. OAI = ~~i ~T~ ~T~ ~T~ 7A1+ 3 7A1OH+ 2 7A1(OH) 2 + TA1(OH) 4- 7A1F+ 2
, [H4Si04] , [H3 SiQ4-] 18. Cs
[A1F 2 +] [A1F,°] [A1F 4-] [A1F5-2 ] [A1F6~ 3 ]7A1F2 + 7A1F3 ° 7A1F4~
7H 4 8i0 4 7H3 8i0 4 ~
1Q [F-] [HF] [A1F+ 2 ] 2[A1F2 +] 3[A1F3] 4[A1F4~] 5[A1F5-2 ] 6[A1F5~3 ]iy. O F= | -| - h -| h I ; I TF~ THF TAIF+- 7AiF2+ TAiF3
Relationships among the various species at equilibrium can be conveniently represented b}T stabilit}^-field diagrams, based on thermo- dynamic calculations. In the diagrams presented here the activit}^ of aqueous silica, considered as Si(OH) 4 or H4SiO4 , is used as ordinate, and hydrogen-ion activit}^, pH, as abscissa. Aluminum activity in solution at equilibrium is shown by contours plotted on the stability fields of the solids.
Stability-field diagrams such as those used by Feth, Roberson, and Polzer (1964) have been rather widely used for representing the domains of gibbsite, clays, and other minerals in terms of dissolved silica and the ratio of certain cations to hydrogen-ion activity. The calculations on which the diagrams are based assume that aluminum is conserved and that none of the chemical equilibria treated contain dis solved aluminum as a variable. It seems obvious, however, that soHite species of aluminum do occur; otherwise, it is difficult to see how changes of one form of solid to another could take place in an aqueous system.

E8 CHEMISTRY OF ALUMINUM IN NATURAL WATER
If the
reaction
,8 CHEMISTRY OF ALUMINUM IN NATURAL WATER
If the synthesis of a clay mineral is represented by the summarizing ;action
2Al(OH) a (c) + 2H4SiO4 (aq) = Al2Si2Os (OH) 4 +5H2O,
one may calculate from data in table 1 the value of Kicr the resulting equilibrium:
#=[H4SiO4] 2 .
The other species in the original reaction do not appear here because their activities are unity by definition. The boundary between the aluminum hydroxide field and the clay mineral field thus is only a function of aqueous silica concentration. Along this line the system is in simultaneous equilibrium with two solids and has only one degree of freedom.
This relationship provides a simple starting point for preparation of an equilibrium solubility diagram for aluminum in the presence of silica. The equilibrium constant to be used, however, poses somewhat of a problem because it depends on the free-energy values selected for the solid species. Normally in depicting a final equilibrium situation one might select the most negative free energies of solids involved, assuming these values are believed reasonably free from errors caused by impurity and disorder in the solids. One might reason that the less negative free energies would represent metastable material that would alter on aging to a final lower equilibrium value. In this instance, however, both the previous laboratory work with aluminum hydroxides and field observations of clay mineral characteristics suggest that the most stable species are not readily synthesized at ordinary temperature and pressure, and therefore a diagram that depicts natural systems realistically should be based on free energies for less stable forms. In the absence of solute silica, the precipitated alumirum hydroxide forms micro crystalline gibbsite at first, with a free energy of 272.3 kcal per mole. An aluminosilicate species less stable than kaolinite seems likely as well; therefore, some laboratory experiments were con ducted to try to evaluate the behavior of synthetic aluminosilicates and give a logical basis for assignment of a free-energy value.
PREPARATION OF ALUMINUM HYDROXIDE POLYMER
In previous work (Hem and Roberson, 1967) experimental solutions containing aluminum hydroxide species were prepared by a technique of mixing measured volumes of three stock solutions. The same pro cedure was generally followed here. The first of the three solutions contained aluminum, sodium, hydrogen, and perchlorate ions, with an aluminum concentration 4.5X 1CT 4 molar, a pH near 2.5, and a perchlo-

INTERACTIONS OF ALUMINUM WITH AQUEOUS SILICA E9
rate concentration of 10~ 2 molar. The second stock solution was made up of sodium, hydroxide, and perchlorate, with a pH near 11.0 and the same perchlorate concentration as solution 1. The third solution was the same as solution 1 except that it had 9.0X 10~ 4 moles per liter of aluminum and was less acid (pH near 3.5). Aliquots of solution 1 v^ere put in polyethylene containers, and selected volumes of solution 2 vere added to each to provide different quantities of OH ions. At the same time a volume of solution 3 equal to the amount of solution 2 used was added so as to maintain a constant total aluminum concentration. This technique makes possible the preparation of a series of test solutions in which all are alike except for concentrations of free and bound OH ions. Successive series of such solutions can be prepared to investigate the effect of other factors where the starting quantity of OH is the same. The ionic strength and total content of aluminum are essentially the same throughout, which simplifies some of the necessary calcula tions. The amounts of free and bound OH can be calculated from measurements of pH, and the composition and proportions of solutions 1,2, and 3 can be used.
Some solutions also were made in which the ionic strength was higher or lower (range 0.1-0.001) by using larger or smaller amounts of sodium and perchlorate. In addition, some experiments were irade in which aluminum and all other concentrations were increased by a factor of 10 over the levels used by Hem and Roberson (19^7). The calculations of bound OH were checked for some solutions by blank titrations in which all conditions were the same except that aluminum in the solutions was replaced by an equivalent concentration of sodium. The calculated value for the ratio of moles of bound OH to total moles of aluminum per liter, termed r in our earlier work, is a convenient parameter for characterizing these solutions. Data for solutions in which r<3.0 are listed separately from those in which r>3.0 for convenience in discussing the results.
The value of r remains nearly constant during the aging of the mixed solutions, but the pH tends to shift downward somewhat in most solutions. These changes are related to alteration of the OH ions from nonbridgiiig to bridging positions in the polymer and to changes in distribution of ionic hydroxy-aluminum complexes (Hem and Roberson, 1967; Smith and Hem, 1972).
INTRODUCTION OF SILICA
Silica was introduced into the test solutions by one of two different techniques. For some experiments a fourth stock solution was used to add silica. This stock solution was prepared from sodium silicate reagent (Na2SiO3 -9H2 O) which was dissolved in demineralized, distilled water and passed through a cation-exchange column (IR 120) to

E10 CHEMISTRY OF ALUMINUM IN NATURAL WATER
replace sodium with hydrogen. The ionic strength of this solution was brought to the same level as the other three stock solutions with sodium perchlorate, and it had a final pH near 5.0. In other experiments the silica was introduced simply by dissolving the desired weight of sodium silicate or silicic acid reagent in the basic solution 2. This technique avoided dilution of the aluminum concentration in the mixed solutions but introduced the silica as dissociated silicate (SiO3 ~ 2 or related species) ions rather than as H4SiO4 . The first pro cedure was used in the first part of the study and onhT for solutions whose final pH was below neutrality.
The molar proportion of silicon to aluminum in the experimental aging solutions ranged from about 1:10 to near 5:1. Concentrations of silica ranged from near 10~ 5 to about 3X 10~3 molar, or from a little less than 2 mg/1 to about 200 mg/1.
COMPOSITION OF AGED SOLUTIONf
After preparation the solutions were stored in polyethylene con tainers at or near 25° C in a controlled atmosphere box from which carbon dioxide was excluded and were agitated occasionally to insure adequate mixing. From time to time a portion was removed from each solution, and its pH determined. Part of the aliquot was then filtered through a 0.10/mi porosity filter, and the silica and aluminum contents were determined on the filtered and sometimes also on the unfiltered fractions. Material caught by the filter wa? examined by X-ray diffraction and by the electron microscope or electron diffrac tion; some residues were analyzed quantitatively by wet chemical procedures. The aging times were as much as 4 years for a few of the solutions, but an equilibrium or steady state appeared to be closely approached in many of them after as short a time as 3 or 4 months; few significant changes occurred after 1 year in solutions where silica was added as silicate ions.
Previous studies have shown that it is important to measure as many properties of systems of this kind as possible, and thereby decrease the number of assumptions and uncontrolled or unknown variables. An important factor is the filtration to remove participate material. The 0.10/mi porosit}^ filters generally passed solutions very slowly, for a filter cake built up soon after the start of the filtration process. This cake probably lowered the effective pore size sufficiently to decrease the particulate material in the filtrate to an insignificant concentration. Smith and Hem (1972) showed that polynuclear aluminum hydroxide species react slowly with ferron, and colloidal gibbsite is almost completely unreactive. Species having these charac teristics could not be detected in the filtrates.

INTERACTIONS OF ALUMINUM WITH AQUEOUS SILICA Ell
Initial and final aluminum and silica concentrations in the filtrates for 56 solutions are given in tables 3 and 4. These tables also give some information on apparent composition of material removed by filtration. This was calculated from the difference between the initial solution composition and the final composition observed in the filtrate and probably is not very accurate. These calculations indicate, nevertheless, the approximate aluminum to silica ratio in the precipi tates and show which of the precipitates were the most enriched in silica. Some of the precipitates were probably mixtures of amorphous aluminum hydroxide and aluminosilicate and are generally those in which the amount of silica removed by filtration was relatively small.
Wet chemical analyses were performed on many of the precipitates that contained substantial amounts of silica, and these showed a mole ratio of silica to aluminum near or somewhat less than 1.0. No evidence of more siliceous mineral species was obtained from these analyses. For this reason and because the final aluminum and silica concentra tions of aged solutions fit calculations based on a 1:1 aluminum to
TABLE 3. Experimental solutions in which mole ratio OH:A1 was less than 3.0[IAP=ion-activity product]
After aging (mg/1)
Solution
IV2._____113...---.IV3._____114.......IV4......116.......IV6......117.......IV7.__...1C.......ID ....2C_ ......2D. ......119. .......IV9. ......3D.......2C2......4D. ......6D___.__.7D.......8D_......10D2.....10D4_..__11A......11B..____11C......12A......12B_...._15A......15B......15C......15D......17A......17B..._._17B1.....17B2..._.
Meaii..
Age (days)
.. 1,479761
. . 1, 456
.. 1,439
.. 1,439
.. 1,403
.. 1,403
.. 1,373
.. 1,373
.. 1,362669667667634634528
.. 1,195490379
.. 1,04533089789764
5945945635831191193901185151
.. 86+55
. 41+55
Initial contents (nig/1)
Al
8.4 8.4 8.4 8.4 8.4 8.4 8.4 8.4 8.4 8.4 8.4 8.4 8.4
16.9 16.3 8.4 8.4 7.9 8.4 8.3 9.4 4.4 4.1
12 12 12 12 12
12 12 12
123 123 123 123
SiO>
21 100 100 100 100 100 100 100 100
18 96 18 98 94 94
100 26 98 98 92 98 50 49 34 37 40 17 17 42 44 46 47
2511 138 13S 138
PH
5.24 4. 69 4.91 4.66 4.85 4.68 4.91 4. 69 4.96 4.85 4.67 5.12 4.93 4.55 4.80 4.57 5.03 4.60 4.51 4.57 4.83 4.60 4.64 4.48 4.59 4.82 4.90 5.15 4.52 4.64 4.84 5.52 4.46 5.09 2 29 2.35
Passing 0.10 M m filter
Al
0.20 1.15 .34
1.60 .35
1.32 .10
1.24 1.30 3.20 2.24 2.13 .56
5.6 1.34 3.48 1.82 3.0 2.5 2.3 1.7 1.9 1.2 6.4 5.3 2.0 6.5 4.0 5.2 5.5 1.1 .04
~. 1096 99
SiOj
9.3 82 68 75 76 76 75 78 68 14 76 9.1
70 70 63 88 14 86 88 77 84 3il 35 31 32 34 15 16 38 40 35 26
181 16
128 132
Removed Ionic by filter strength
Al
8.2 7.3 8.1 6.8 8.0 7.1 8.3 7.2 7.1 5.2 6.4 6.3 7.8
11.3 15 4.9 6.6 4.9 5.9 6.0 7.7 2.5 2.9 5.6 6.7
10 5.5 8.0 5.8 6.5
10.9 12
101 123 27 24
SiO:
12 18 32 25 24 24 25 22 32 4
20 8.9
28 24 29 12 12 12 10 15 14 11 14 3 5 6
1 4 4 9
21 78
122 10 6
0.01 .01 .01 .01 .01 .01 .01 .01 .01 .01 .01 .01 .01 .01 .01 .01 .01 .01 .005 .005 .01 .10 .01 .01 .01 .01 .01 .01 .01 .01 .01 .01 .10 .10 . 10 .10
log activities in aged solutions
Al+3 H 4 Si04°
5.94 4.73 5.46 4.70 5.46 4.80 6.07 4.82 4.84 4.41 4.51 4.68 5.16 4.11 4.78 4.30 4.65 4.44 4.39 4.44 5.08 4.62 4.84 3.98 4. 19 4.67 4.11 4.41 4.10 4.16 4.89 8.09 3.87 6.65 3.21 3.22
3.81 2.86 2. 95 2. 90 2.90 2.90 2.90 2. 89 2. 95 3.63 2.85 3.82 2.93 2. 93 2.98 2.83 3.33 2.84 2.83 2. 90 2.85 3.19 3.23 3.29 3.27 3.25 3.60 3.57 3.19 3.18 3.23 3.36 2.52 3.58 2.67 2. 68
H>
5.20 4.35 4.68 4.47 4.73 4. 49 4. 92 4.40 4.59 4.50 4.23 4.74 4.45 4.15 4.45 4.11 4.65 4.26 4.27 4.35 4.53 4.37 4.51 4.30 4.33 4.66 4.49 4.77 4.33 4.41 4.58 5.78 4.02 5.33 3.84 3.85
logIAPa
11.70 10. 92 11.26 11.62 11.66 11.54 11.58 10. 98 11.96 10. 92 10.66 11.44 10.52 10.82 11.18 10.40 10.14 11.00 11.18 11.42 11.32 10.60 10. 92 11. 26 11.08 12. 12 11.52 12. 66 11.40 11.78 11.24 11.78 11.34 11.52 11. 28 11.34
.11.28

E12 CHEMISTRY OF ALUMINUM IN NATURAL W^TER
TABLE 4. Experimental solutions in which mole ratio OH:A1 was greater than 3.0[IAP =ion-activity product]
After aging (mg/1) log activities in aged Initial contents solutions
Solution Age (mg/1) Passing 0.10 Removed by Ionic log (days) ton filter filter strength IAP b
_____________ ______________ A 1 JJ. JJ+
Al SiO 2 pH Al SiCh Al SiO 2 (OH).~ SiCM
11D-. _ _ 64
11F_______ 6411H. 659
12C.______ 19912D 199 12E--.!.!_ 19912E2. 659
15E.______ 11815F_.____ 11815G__ _ 39015H ______ 390
16A.__.___ 361
17C_______ 10617D__.__ 95
1912121219
1212 1212121212121212121212
123123
4345
56CO
1819 3032283049505153541148
130218
7.608.679.08
10.209.796.508.65 9.858.909.159.226.657.678.148.498.909.759.258.687.02
0.011.45.2
11.68.0.03.06
2.3.18.40.46.05.36.83.62.90.50.24
1.4.03
25233841
6.66.9
1611119.4
25232322234.7
152.2
24
1210.66.8.4
4.012129.7
12121212121111
1112
121123
1822
9151311.412 1421172124272831316.3
33128194
0.01.01.01.01.01.01.01 .01.01.01.01.01.01.01.01.01.01.01.10.10
6.484.333.763.414.046.035.70 4.115.224.874.815.804.924.564.684.523.735.104.406.11
3.383.423.313.423.653.963.94 3.583.743.753.823.373.423.493.443.424.183.604.433.40
7.127.729.139.548.906.557.24 8.167.927.878.197.278.468.948.088.078.957.548.176.65
-33. 96-30.94-32.40-32.74-33. 18-33.08-33.76 -31.70-33. 76-32. 98-33.64-32. 88-33.60-33.98-32.40-32.02 33.72-32. 48-34.00-32. 32
-32.98
silicon ratio better than other ratios, significant amounts of 2:1 l&yer silicate structures probably were not formed.
Additional data for solutions given in tables 3 and 4 include values for the negative log of the molar activity of uncomplexed A1+3 in acid solutions (or of A1(OH) 4 ~ in basic solutions), negative log activity of H4SiO4 (aq) and pH, and the computed ion-activity product for each aged solution. Appropriate equations from table 2 and the Debye- Hiickel equation were used to compute activities of sclutes and ion activity produced.
Nearly all the solids present at the end of the aging period in the solutions given in tables 3 and 4 were amorphous to X-rays. Precipi tates from some solutions in which silica concentrations were very low did not contain significant proportions of silica. These results are not included here, but these precipitates did give X-ray patterns for gibbsite or bayerite, depending on pH. Additional data on composition of precipitates are given later in this paper.
TESTS FOR EQUILIBRIUM
Although the solids produced from solutions given in tables 3 and 4 did not show any definite evidence of containing aluminum hydroxide in crystalline form, it is of interest to see if the aluminum concentra tions observed might obey predictions based on solubilities of alumi num hydroxide species alone. Figure 1 is a plot of log [A1+3 ] in moles per liter against pH for the samples in table 3, all of which had a final pH below 6.0. Solutions IV2-10D4 were prepared \)y adding a

INTERACTIONS OF ALUMINUM WITH AQUEOUS SILICA
3.0
E13
9.0
FIGURE 1. Log of activity of uncomplexed aluminum versus pH in aged solutions containing silica. Dashed line is equilibrium line for micro- crystalline gibbsite. O = nrst 23 solutions, table 3; X =last 13 solutions, table 3.
separate solution of silicic acid (method 1), and the remaining solutions were prepared by adding silicate that was included in the basic stock solution.
It is evident that the microcrystalline gibbsite solubility relation ship does not satisfactorily explain the results observed in these solu tions because the points scatter and tend to show too low a solubility between pH 4.0 and 5.0.
If the synthesis reaction is postulated to be the reverse of
Al2Si2O5 (OH) 4 +6H+-2Al+3 +2H4SiO4(aq) + H2O,
the solubility relationship at equilibrium would be
[Al+ 3 ] 2[H 4Si04 ] 2[H +]8 ~ AS0 .

E14 CHEMISTRY OF ALUMINUM IN NATURAL WATER
Figure 2 shows log activities of Al+3 and H4SiO4 added together and plotted against pH. This gives a relatively well defined relationship. Aline with slope 3 drawn through the points is a good fit and sug gests the reaction postulated shows correctly the proportions of reactants and products. The equilibrium constant estimated from the graph is 10 11 3 . A more exact value calculated from the mean of the 36 sets of data is 10 11 - 28 and is given in table 3.
By using 10 11 28 as the equilibrium constant and the standard free- energy data in table 1, the standard free energy of the aluminosilicate
4.0
5.0
6.0
9 7.0CO
8.0
o 9.0
10.0
11.0 -
\\\\\\
o°\
00 X0 \oo
o
\
\V\
\
12.0 3.0
\ \ \
\x _|
\___:
4.0 5.0 6.0
PH
FIGURE 2. Sum of logs of activities of uncomplexed aluminum and aqueous silica versus pH in aged solutions. Dashed line is equilibrium line for syn thetic halloysite. Q = first 23 solutions, table 3; X = last 13 solutions, table 3.

INTERACTIONS OF ALUMINUM WITH AQUEOUS SILICA El5
solid is calculated to be 896.7 kcal per mole. This calculation assumes the formula for this material is equivalent to kaolinite or halloysite without considering added water of hydration.
The spread in values of ion-activity products in table 3 suggests that an uncertainty of about ± 1 kcal is a reasonable estimate. The material produced in this set of solutions is somewhat less stable than halloysite that has a readily recognized crystalline character, for which Robie and Waldbaum (1968) gave a value of 898.4 kcal per mole.
Several of the sets of data in table 3 are of special significance in evaluating the validity of the equilibrium assumption. A special experiment was made by using solution 17B and a duplicate of that solution. The analytical data for 17B after 51 days of aging are shewn in table 3. The duplicate sample had essentially the same composition and behavior. The solutions initially contained 123 mg/1 Al and 138 mg/1 SiO2 (aq), with an ionic strength near 0.1. During aging the pU of 17B increased slowly from an initial value near 5 to a value of 5.33 after 51 days. At that time nearly 90 percent of the silica and almost all the aluminum could be removed from this solution by filtration through a O.lOjttm porosity filter. Although solution 17B was opalescent when originally prepared, it appeared to be practical^ clear after a few weeks of aging. The point in figure 2 representing the composition of the solution after 51 days falls essentially on the equilibrium line. The duplicate solution prepared December 3 had a very similar composi tion to 17B after a similar period of aging and thus is not included in table 3.
After 3 months of aging, aliquots of 17B and the duplicate solution were put into separate polyethylene bottles, and 1.0 ml of 0.863 molar perchloric acid was added for each 100 ml of solution. This amount of H+ was sufficient to react with about two-thirds of the cal culated bound OH in the aluminosilicate. The bottles were allowed to stand at 25°C, and the pH of the solutions was measured from time to time until it had stabilized. One hour after the acid was added the pH values were near 2.3. A gradual increase in pH occurred for several weeks, but after about a month no further significant change took place. After 55 days of reaction the solutions were filtered through 0.10 jttm porosity filters, and the concentrations of aluminum and silica in the filtrate were determined. Calculating the activities of A1+3 and H4SiO4 in these solutions gave the closely agreeing values reported for solutions 17B1 and 17B2 in table 3. These values plot almost exactly on the equilibrium line in figure 2. This demonstration of the reversibility of the precipitation reaction to reattain equilib-

E16 CHEMISTRY OF ALUMINUM IN NATURAL WATER
rium at a much lower pH greatly strengthens the interpretation that the material formed in the test solutions has a well-defined equilib rium solubility, even though its crystal structure is not well defined.
EFFECT OF DISSOLVED-SILICA ACTIVITY
The initial amounts of silica in the aging study solutions so far considered were generally rather substantial. Replicates of most of the samples in the first part of table 3 (IV2-10D4), however, were made by using lower silica concentrations. Where the initial silica content was 2.0 mg/1 or less as SiO2 and the aging was a few weeks or months, the precipitates all contained gibbsite identif able by X-ray diffraction. Solutions that contained 20 mg/1 of SiO2 did not produce gibbsite and generally gave equilibrium results after long aging that agreed well with the data shown in figure 2. Solutions containing silica concentrations between 2 and 10 did not all show crystalline gibbsite. The highest silica concentration observed in solutions that did produce gibbsite was about 9 mg/1. Solutions in this range may have tended to form mixed solids consisting of aluminum hydroxide and aluminosilicate structures. The relationship of the boundary between the aluminum hydroxide and aluminosilicate stability fields to dissolved-silica concentration indicates there should be a silica concentration at which both solids are stable. These experiments suggest this boundary probably lies near a silica concentration of 9 mg/1 SiO2 . Solubility calculations for the solutions lov^ in silica sug gest that they are generally close to equilibrium with respect to microcrystalline gibbsite and near the equilibrium line in figure 1.
REACTIONS IN ALKALINE SOLUTIONS
A considerable number of solutions were prepared to explore the behavior of aluminum and silica in systems where the pH remained above neutrality during aging. These solutions were prepared by using the techniques already described for the pH 4.5-6.0 rarge. Solution II contained silicate ions, and the silicate concentration was varied in the different groups to give a range of silica to aluminum mole ratios from as much as 3 in some solutions to as little as 0.1 in others.
The alkaline solutions all appeared to decrease substantially in concentration of dissolved aluminum and silica during aging. Initial and final concentrations are given in table 4. The activities of silica and A1(OH) 4 ~ for these at the end of the aging period were determined by analysis and corrected for ionic strength. Aging times ranged from about 2 months to more than 2 years. As with solutiors at lower pH, the material reported in solution was determined on filtrates passing 0.1 nm porosity filter membranes. Calculated activities of A1(OH) 4 ~

INTERACTIONS OF ALUMINUM WITH AQUEOUS SILICA El7
were obtained by solving appropriate solute species equilibria from table 2. This form of aluminum is strongly predominant in solutions with pH>7.0. The silicic acid activities were calculated by correcting total dissolved silica for the effects of dissociation.
Solutions in the alkaline pH ranges that were low in dissolved silica (SiO2 <^10 mg/1) yielded bayerite on aging. Crystallinity was slow to develop but was detectable by X-ray diffraction after two months in a few solutions and in a total of six solutions after a year of aging. Data for these solutions are not included in table 4.
Although there may be some question as to the applicability of the aluminosilicate solubility data for low pH solutions in table 3 to these more alkaline solutions, the same general approach was tested to see what results would be obtained. As a first approximation, figure 3 was prepared to show the relation of pH and dissolved aluminum where bayerite was identified in the precipitate and where no crystal line aluminum hydroxides were identified. The dashed line is the solubility at equilibrium of bayerite synthesized in the absence of silica (Hem and Roberson, 1967). Five of the six experimental points for the solutions where bayerite was present plot very near the dashed line. Deviations from the equilibrium value could be related to impurities in the precipitate or to slowness of reactions as equilibrium is approached. The aluminum solubility in the other solutions is obviously not controlled by bayerite precipitation.
Solutions which showed substantial losses in silica concentration during aging were then tested for equilibrium with 1:1 aluminosilicate by plotting the sum of log [A1(OH) 4 ~] + log [H4Si04] against pH in figure 4. The dashed line here represents equilibrium with a solid having the same composition and standard free energy of formation as the halloysite synthesized in the solutions below pH 6.
Although the experimentally determined points in figure 4 are somewhat more scattered than those in figure 2, they do follow the trend of the dashed regression line, which represents the solubility of halloysite determined from data for samples at lower pH. In fact, this is about as close a fit to the points as can be drawn visually. The possibility of a 2:1 silicon to aluminum mole ratio in the precipitated product was explored by plotting the relationship log [A1(OH) 4 ~] + 2 log [H4Si04 ] versus pH for solutions in table 4. That the resulting points (not shown) were substantially more widely scattered than the ones in figure 4 indicates a 1:1 composition.
An average value for the ion-activity product for the relationship
[Al(OH)r] 2 [H4Si04] 2 [H] 2 =IAP,

E18 CHEMISTRY OF ALUMINUM IN NATURAL WATER
1 1 1 1 1 1 1 1 1
\\\\\\\
0 X
\o o x
\\\x° \\
00° \
\xX \ x
0 \\\\\\\
V
\\\
\\ -\\\
1 1 1 1 1 1 1 1 1
o -g'3"So0
cc
-g
co
1̂_^
0 Q,o> ^ c1 3
"m «bD M
S So3 o
"S fl0 0o '^3cc c3
.2 -2
o i "3 °00 D. ^ o
bD -g^ SM "*^w "CC x-x
1 ^'-1w ^
R O^^ ^ a <tj .S
"o J
>i CC
'^ 0 +30c3
ObDOh?
o3 o o O o o * a;<o ^r iri co r-' cd f=
Bo|-

INTERACTIONS OF ALUMINUM WITH AQUEOUS SILICA E19
°. X co a
wa
£ £C3 CO
co o
1 g
w

E20 CHEMISTRY OF ALUMINUM IN NATURAL WATER
was calculated from data in table 4 as 10~32- 98 . This value gives for the free energy of formation of the aluminosilicate precipitate 897. 0 kcal per mole. The uncertainty in the number is probably at least 1 kcal. This value is nearly the same as the 896.7 kcal obtained for material produced between pH 4.5 and 6.0 and suggests the same kind of material is formed in all sets of solutions. Because of the experi mental uncertainty the value should be rounded to the nearest kilocalorie, or 897 ±1 kcal per mole.
STABILITY FIELDS AND ALUMINUM SOLUBILITY GRAPHS
The determined value for halloysite free energy can be used with the value for microcrystalline gibbsite to prepare stability-field diagrams. For the boundary between solids, the reaction
2Al(OH) 8 (c) +2H4SiO4 (aq) - Al2Si2O5 (OH) 4 (c) +5H2O
reduces to[H4SiO4] 2 =10-7 - 66
or
This activity is equivalent to a concentration of 8.9 mg/1 dissolved SiO2 . Because the dissolved silicic acid carries no ionic charge, the activity coefficient will be near 1.0. When the pH is high enough, however a significant fraction of the silicic acid will be dissociated into silicate anions, and the total silica concentration will not be equivalent to the calculated boundary based on [H4SiO4]. Data ob tained by Hem and Roberson (1967, p. 48) showed that above neutral pH the freshly precipitated form of aluminum hydroxide had the same solubility as microcrystalline gibbsite.
Figure 5 is a stability-field diagram for microcrystalline gibbsite and synthetic halloysite with aluminum solubility contours in both fields. This diagram specifies an ionic strength of 0.01. The differences between this diagram and one for ionic strength 0.00 are very small, and this figure should be applicable to most natural waters whose dissolved-solids concentration is not greater than 1,000 mg/1. Figure 6 shows the same system at an ionic strength of 0.10. The effect of increased ionic strength is to increase aluminum solubility in the pH range where multivalent aluminum species predominate. The solu bility of aluminum is calculated from equations 1-5 and 17 in table 2 for gibbsite and from equations 2-8 and 17 in table 2 for halloysite.
As noted earlier the laboratory results showed qualitatively that crystalline gibbsite did not appear in solutions whose dissolved-silica

INTERACTIONS OF ALUMINUM WITH AQUEOUS SILICA E21
IN MILLIGRAMS PER LITER
pb
o o o
1000
§ o' o o'
500 -
9.0 100
FIGURE 5. Stability fields of synthetic halloysite and microcrystalline gibbsite and solubility of aluminum as functions of pH and activity of undissociated aqueous silica at 25°C and 1 atmosphere. Ionic strength 0.01; fluoride absent.
476-920 O - 73 - 4

3O
G
CR
O
^ g,
5s a
0 2
r o-
»-
co
co
W
g.p
S g
-
[H4S
i04
] as
Si0
2,
IN M
ILL
IGR
AM
S P
ER
LIT
ER
II I
I<*
o
cs'
? ,?
i-h
co
*<d
^ O>2.
o
aH
"-H
M
2
SB tf.
^ g^ r&
t-l
a
P
2.
CO
O
co
y. ^
g-
<!
M
N)
CO
Ul
O
O
OO
O
O
to
to

INTERACTIONS OF ALUMINUM WITH AQUEOUS SILICA E23
concentration remained above about 9 mg/1 as SiO2 . The solubility data provide a more quantitative verification of this.
The position of the aluminum hydroxide-aluminosilicate boundary is shifted if other values are selected for free energies of the solids. The ones used for figures 5 and 6 are appropriate for systems in which freshly precipitated material is present. If the clay miner?,! is considered to be a well-organized kaolinite, the boundary between hydroxide and silicate fields is shifted to a considerably lower eilica concentration. The value of 902.9 kcal per mole for kaolinite, for example, would give an equilibrium silica concentration at the two- solid boundary between kaolinite and well-crystallized gibbsite of about 1.0 mg/1 SiO2 . If the aluminum hydroxide species were micro- crystalline gibbsite in equilibrium with this kaolinite, the value for silica would be less than 0.1 mg/1 SiO2 .
Reversible equilibria in systems involving crystalline kaolinite probably are unrealistic for predicting conditions in the experimental solutions used in this study because our material did not display good crystallinity.
The silica concentrations shown in figures 5 and 6 extend to values higher than the usually accepted solubility of amorphous forms of silica at 25°C (100-200 mg/1 as SiO2). The highest silica activities shown are unlikely to be encountered in natural water with ionic strength less than 0.1.
Once the spacing of solubility lines on the aluminum solubility grid has been calculated for a given ionic strength, the grid can be used to estimate equilibrium conditions involving any pair of aluminum hydroxide and 1:1 clay mineral species to which the kaolinite formula applies. It is only necessary to calculate the correct equilibrium position of the horizontal boundary between the solids on the silica concentration axis and aline the vertical edge of the grid with the proper pH. The grid then is moved up or down so the horizontal phase boundary lies on the calculated equilibrium value for silica.
The solubility lines in figures 5 and 6 take into account the hydroxy complexes of aluminum but ignore other solute complex species. For a satisfactory fit to natural water, it may be necessary to consider the effect of other aluminum complexes.
EFFECTS OF FLUORIDE
As noted elsewhere (Hem, 1968; Roberson and Hem, 1969) the complexes formed in solution between aluminum and fluoride are particularly strong and can exert an important influence on aluminum solubility. Calculations adapted from Roberson and Hem (1969) were grafted to the aluminum-silica system calculations to give the addi tional solubility diagrams, figures 7 and 8, which show the influence of

E24 CHEMISTRY OF ALUMINUM IN NATURAL WA^ER
CA | IN MILLIGRAMS PER LITER
1000
4.0 5.0 6.0 7.0 8.0 9.0 10.0
PH
FIGURE 7. Stability fields of synthetic halloysite and microcrystalline gibbsite and solubility of aluminum as functions of pH and activity of undissociated aqueous silica at 25°C and 1 atmosphere. Ionic strength 0.01; total fluoride concentration 0.19 mg/1 as F.

INTERACTIONS OF ALUMINUM WITH AQUEOUS SILICA E25
IN MILLIGRAMS PER LITER
4.0 5.0 6.0 7.0 8.0 9.0 10.0
FIGURE 8. Stability fields of synthetic halloysite and microcrystall : ne gibbsite and solubility of aluminum as functions of pH and activity of undissociated aqueous silica at 25°C and 1 atmosphere. Ionic strength 0.01; total fluoride concentration 1.9 mg/1 as F.
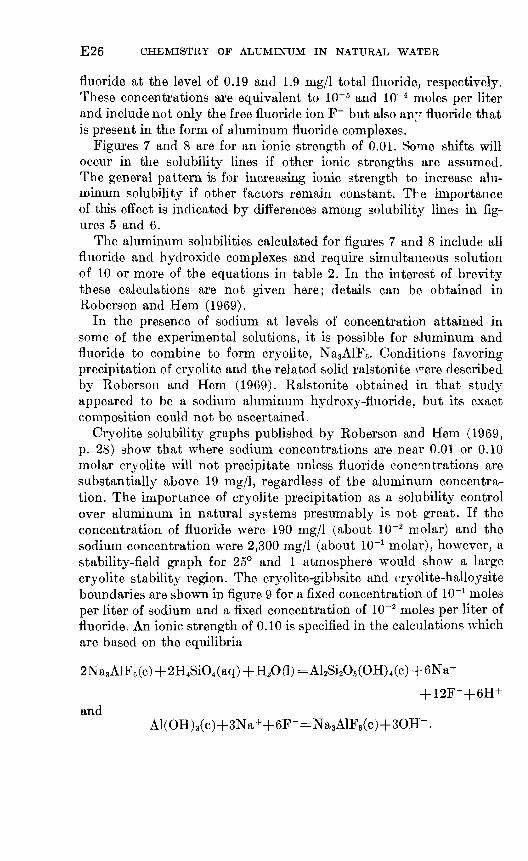
E26 CHEMISTRY OF ALUMINUM IN NATURAL WATER
fluoride at the level of 0.19 and 1.9 mg/1 total fluoride, respectively. These concentrations are equivalent to 10~ 5 and 10~4 moles per liter and include not only the free fluoride ion F~ but also an^ fluoride that is present in the form of aluminum fluoride complexes.
Figures 7 and 8 are for an ionic strength of 0.01. Some shifts will occur in the solubility lines if other ionic strengths are assumed. The general pattern is for increasing ionic strength to increase alu minum solubility if other factors remain constant. The importance of this effect is indicated by differences among solubility lines in fig ures 5 and 6.
The aluminum solubilities calculated for figures 7 and 8 include all fluoride and hydroxide complexes and require simultaneous solution of 10 or more of the equations in table 2. In the interest of brevity these calculations are not given here; details can be obtained in Roberson and Hem (1969).
In the presence of sodium at levels of concentration attained in some of the experimental solutions, it is possible for aluminum and fluoride to combine to form cryolite, Na3AlF6 . Conditions favoring precipitation of cryolite and the related solid ralstonite vrere described by Roberson and Hem (1969). Ralstonite obtained in that study appeared to be a sodium aluminum hydroxy-fluoride, but its exact composition could not be ascertained.
Cryolite solubility graphs published by Roberson and Hem (1969, p. 28) show that where sodium concentrations are near 0.01 or 0.10 molar cryolite will not precipitate unless fluoride concentrations are substantially above 19 mg/1, regardless of the aluminum concentra tion. The importance of cryolite precipitation as a solubility control over aluminum in natural systems presumably is not great. If the concentration of fluoride were 190 mg/1 (about 10~ 2 molar) and the sodium concentration were 2,300 mg/1 (about 10" 1 molar), however, a stability-field graph for 25° and 1 atmosphere would show a large cryolite stability region. The cryolite-gibbsite and cryolite-halloysite boundaries are shown in figure 9 for a fixed concentration of 10" 1 moles per liter of sodium and a fixed concentration of 10~2 moles per liter of fluoride. An ionic strength of 0.10 is specified in the calculations which are based on the equilibria
2Na3AlF6 (c) +2H4SiO4 (aq) +H2O(1) = Al2Si2O5 (OH) 4 (c) +6Na+
+ 12F-+6H+and
Al(OH) 3(c)+3Na+ +6F-=Na3AlF6 (c)+3OH'-.

INTERACTIONS OF ALUMINUM WITH AQUEOUS SILICA E27
Al
1000
500
300
S 200I-
IIM MILLIGRAMS PER LITER
100
50
20 k
- 30C4
O
V) LL O
2gi-
10
3h
Cryolite
3.0 4.0 5.0 6.0 7.0 8.0 9.0 10.0
pH
FIGURE 9. Stability fields of cryolite, synthetic halloysite, and micro- crystalline gibbsite and solubility of aluminum as functions of pH and concentration of dissolved silica at 25°C and 1 atmosphere. Ionic strength 0.10; total fluoride concentration 190 mg/1 as F; sodium concentration 2,300 mg/1 as Na.
E28 CHEMISTRY OF ALUMINUM IN NATURAL WATER
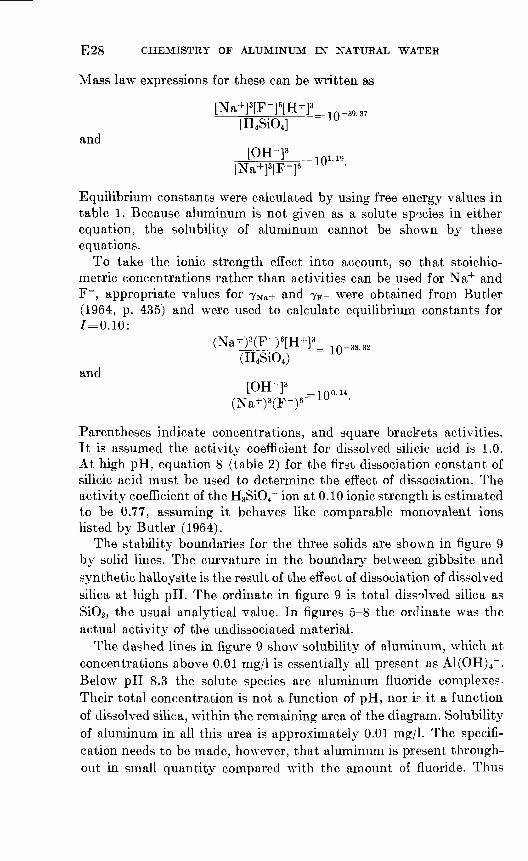
Mass law expressions for these can be written as
I J.1 u> I L-J- I l-L-L I - rt _ no 07 ± : r__^ J___iii o». 6t
[H4Si04 ] U and
ITkTT-13.^ini.19 ft J-" [Na+]3[F-
Equilibrium constants were calculated by using free energy values in table 1. Because aluminum is not given as a solute species in either equation, the solubility of aluminum cannot be shown by these equations.
To take the ionic strength effect into account, so that stoichio- metric concentrations rather than activities can be used for Na+ and F~, appropriate values for TNa+ and JF- were obtained from Butler (1964, p. 435) and were used to calculate equilibrium constants for 7=0.10:
(Na+) 3 (F-) 6[H+] 3 n_ 3, 32(H4Si04 )
and
=io-
__ 14 \R iu(Na+) 3(F-)
Parentheses indicate concentrations, and square brackets activities. It is assumed the activity coefficient for dissolved silicic acid is 1.0. At high pH, equation 8 (table 2) for the first dissociation constant of silicic acid must be used to determine the effect of dissociation. The activity coefficient of the H3SiO4~ ion at 0.10 ionic strength is estimated to be 0.77, assuming it behaves like comparable monovalent ions listed by Butler (1964).
The stability boundaries for the three solids are shown in figure 9 by solid lines. The curvature in the boundary between gibbsite and synthetic halloysite is the result of the effect of dissociation of dissolved silica at high pH. The ordinate in figure 9 is total dissolved silica as SiO2 , the usual analytical value. In figures 5-8 the ordinate was the actual activity of the undissociated material.
The dashed lines in figure 9 show solubility of aluminum, which at concentrations above 0.01 mg/1 is essentially all present as A1(OH) 4 ~. Below pH 8.3 the solute species are aluminum fluoride complexes- Their total concentration is not a function of pH, nor ir it a function of dissolved silica, within the remaining area of the diagram. Solubility of aluminum in all this area is approximately 0.01 mg/1. The specifi cation needs to be made, however, that aluminum is present through out in small quantity compared with the amount of fluoride. Thus
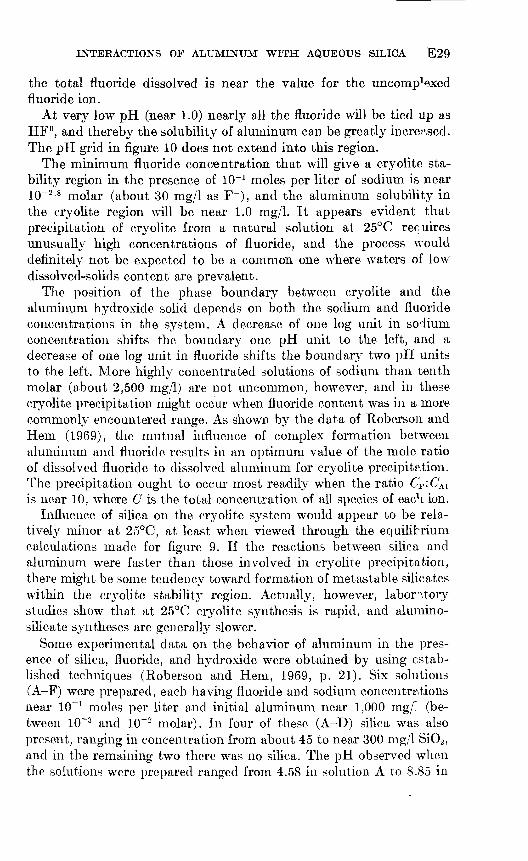
INTERACTIONS OF ALUMINUM WITH AQUEOUS SILICA E29
the total fluoride dissolved is near the value for the uncomp^xed fhioride ion.
At very low pH (near 1.0) nearly all the fluoride will be tied up as HF°, and thereby the solubility of aluminum can be greatly increased. The pH grid in figure 10 does not extend into this region.
The minimum fluoride concentration that will give a cryolite sta bility region in the presence of 10~ J moles per liter of sodium is near 10-2.8 moiar (about 30 mg/1 as F~), and the aluminum solubility in the cryolite region will be near 1.0 mg/1. It appears evident that precipitation of cryolite from a natural solution at 25°C requires unusually high concentrations of fluoride, and the process would definitely not be expected to be a common one where waters of low dissolved-solids content are prevalent.
The position of the phase boundary between cryolite and the aluminum hydroxide solid depends on both the sodium and fluoride concentrations in the system. A decrease of one log unit in sodium concentration shifts the boundary one pH unit to the left, and a decrease of one log unit in fluoride shifts the boundary two pH units to the left. More highly concentrated solutions of sodium than tenth molar (about 2,500 mg/1) are not uncommon, however, and in these cryolite precipitation might occur when fluoride content was in a more commonly encountered range. As shown by the data of Roberson and Hem (1969), the mutual influence of complex formation between aluminum and fluoride results in an optimum value of the mole ratio of dissolved fluoride to dissolved aluminum for cryolite precipitation. The precipitation ought to occur most readily when the ratio CF :CA i is near 10, where C is the total concentration of all species of each ion.
Influence of silica on the cryolite system would appear to be rela tively minor at 25°C, at least when viewed through the equilibrium calculations made for figure 9. If the reactions between silica and aluminum were faster than those involved in cryolite precipitation, there might be some tendency toward formation of metastable silicates within the cryolite stability region. Actually, however, laboratory studies show that at 25°C cryolite synthesis is rapid, and alumino- silicate syntheses are generally slower.
Some experimental data on the behavior of aluminum in the pres ence of silica, fluoride, and hydroxide were obtained by using estab lished techniques (Roberson and Hem, 1969, p. 21). Six solutions (A-F) were prepared, each having fluoride and sodium concentrations near 10" 1 moles per liter and initial aluminum near 1,000 mg/~ (be tween 10~3 and 10~ 2 molar). In four of these (A-D) silica was also present, ranging in concentration from about 45 to near 300 mg/1 SiO2 , and in the remaining two there was no silica. The pH observed when the solutions were prepared ranged from 4.58 in solution A to 8.85 in

E30 CHEMISTRY OF ALUMINUM IN NATURAL WATER
solution D. A finely divided precipitate appeared almost immediately in all six solutions. Most of the silica disappeared from solutions C and D. Essentially no loss of silica occurred in solutions A and B. Solubility calculations showed all these solutions to be strongly super saturated with respect to cryolite at the time they were prepared. Composition data are given in table 5 for solutions A-F after 16 months of aging at 25°C. Aluminum and silica were determined by atomic absorption spectrophotometry and represent total concentra tions of all aluminum and silicon species in solution. Activities of uncomplexed Na+ , F~, and H+ were measured with specific ion elec trodes. The solids which had precipitated were examined by X-ray diffraction. The solids were removed from the solution before analysis by filtering the aliquots through membranes with 0.10/mi maximum diameter pores.
As indicated in table 5 cryolite was formed in all ^x solutions. Two solutions having the lowest pH precipitated ralstonite, and the three most alkaline solutions had a form of aluminum hydroxide, identified by X-ray diffraction as nordstrandite. No silicate species was identified by X-ray, although the initial silica concentrations near 10~ 2 - 5 molar in solutions C and D had nearly all disappeared from solution when the first analyses were made six days after the solutions were prepared. The quantities of cryolite precipitated in these two solutions was nearly 10 times as great as the maximum possible quantity of silicate precipitate, and it is possible that the X-ray diffraction technique could not have detected so small a proportion, even if the aluminosilicate had been well crystallized.
The silica present after 16 months in solutions E and F apparently came from impurities introduced into the reagents or by other means, for none had been added originally.
TABLK 5. Composition of solutions A-F after 16 months aging
[C is total concentration of all species of ion)
Moles per liter
A. ___________B.__ _C. .....___.__D......EF._
tin
______ 4. 41______ 4. 32______ 6.72______ 9. 40______ 4.19______ 8.29
PIT J
4. 064. 023. 191. 824. 012. 27
PU> aj
1. 061. 041. 081. 011. 041. 06
CAI
3. 34X10-21. 57X10-21. 26X10-"
. 74X10-52. 07 X 1C-2
1. 1X10⁻⁵
Csio2
7. 17X10-"1. 57X10-34. 50X10- 51. 12X10-"
1. 3X10⁻⁵. 5X10- 5
NOTE. Solid species identified by X-ray diffraction: Cryolite A-P; Ralstonite B and E; Aluminum hydroxide C, D, and P.

INTERACTIONS OF ALUMINUM WITH AQUEOUS SILICA E31
In table 6 are results of three different calculations using data from table 5 for solutions A-F. The first calculation tests for adherence to a two-solid equilibrium involving cryolite and a clay mineral with the formula and stability of the synthetic aluminosilicate material precipitated in earlier experiments. The equilibrium relationship is that used for establishing the cryolite-halloysite (c+h) boundary in figure 9. Although the calculated ion-activity products are about the same for all four solutions that initially contained silica, they are consistently less negative than the theoretical value.
The second calculation tests for a two-solid equilibrium involving cryolite and microcrystalline gibbsite (c+g). The three lowest activity products, which come the closest to the theoretical value, are for the three solutions from which precipitates did contain aluminum hydroxide as identified by X-ray diffraction.
The third calculation tests for agreement with the cryolite solubility (cs) product reported by Roberson and Hem (1969). The average of the six values is 10~33 - 78 , which is in good agreement with their theoretical value of 10~33 - 84 . Cryolite was identified in all these precipitates. Considering the large exponents on some of the measured activities, the spread of the values is probably within experimental error.
One can also test these results for possible adherence to hydroxide or aluminosilicate equilibria by plugging appropriate values into figures 1-4. Solutions C, D, and F plot reasonably close to the equilib rium line in figure 3, but none of the other pertinent sets of data come close to any equilibrium lines in these four figures. It would be pos sible to interpret the results for solutions C and D by postulating the precipitation of a somewhat more stable form of halloysite than the material synthesized in solutions that did not contain fluoride. The
TABLE 6. Ion-activity prodiicts for solutions A-F, after 16 months aging
[Text explains abbreviations in boxheads]
Solution
A. ..____.___.__._B. ...__.._.._.___C..._D ____ _E. ..__._____.___.F
IAPc+h
10-37.63
ID"37 M
1Q-38.19
._.____ ID-3?- 9 *
IAPc+e
101 -231Q1.80
lQ-0.54
1Q-0.15
1Q2 .25
1Q0.33
IAPc,
1Q-34.16
1Q-34.38
1Q-33.92
10-34.75
10-34.11
10-33.17
[Al]
1Q-6.61
10-7.03
1 0~n - 5410~20.81
10-6 .93
10-16 .37
Theoretical ___________ 10-39.37 1Q- 1 - 19 10-33.84
Equations:IAPc+h=[Na+p [F-]« [H+p [H4Si0 4]-i lAP c+B=[Na+P [F-]« [OH-]-3 IAP cs=[Na+]

E32 CHEMISTRY OF ALUMINUM IN NATURAL WAT^R
standard free energy of formation of such a species would need to be near 900 kcal per mole to correct for the deviations of the activity products for these solutions from the theoretical value. The evidence for existence of aluminosilicate species in solutions A-F is incon clusive, and no quantitative interpretation seems justifiable.
Somewhat more conclusive evidence is available for the aluminum hydroxide, which was detected by X-ray diffraction in the precipitate from solutions C, D, and F. The strongest hydroxide peak observed is at the spacing of nordstrandite (Robert Schoen, oral commun., 1970). This form of aluminum hydroxide was produced in an earlier experi ment through alteration of a previously formed precipitate of bayerite during aging in solution at pH near 9 (Schoen and Roberson, 1970). The earlier experiments had all produced mixtures of nordstrandite and bayerite, however, and did not seem to give a basis for calculating the standard free energy of formation of nordstrandite. As pointed out by Schoen and Roberson (1970), the crystal form of the aluminum hydroxide species seems to be related to the pH of the solution from which they are precipitated. Thus, gibbsite does not seem to be reversibty altered to bayerite without substantial changes in the solution. Baj^erite to nordstrandite alteration does appear to occur, however, in mildly alkaline systems, and the two species would be expected to have similar free energies of formation. The value given by Hem and Roberson (1967) for bayerite is 274.0 kcal per mole.
Solubility data from solutions C, D, and F offer a basis for calculat ing a free energjr of formation for nordstrandite. The average of the three ion-activitjr products for the aluminum and hydroxide in these solutions gives a value of 273.6 kcal per mole. This must be con sidered as not significantly different from the value for bayerite, because the uncertainty in this value is near ±1.0 kcal.
The experimental data for solutions containing both fluoride and silica show that the dissolved silica has no important inhibiting effect on the formation of crystalline cryolite in systems that are supersaturated with respect to cryolite. Reservations were expressed by Roberson and Hem (1969, p. 36) that the relative rarity of cryolite as a rock mineral might be due to inhibition of cryolite precipitation by silica. Such an effect was not observed in these experiments, and it probably is not important in most natural systems, Tie solutions that precipitate cryolite, however, must be higher in sodium and fluoride than can ordinarily be expected in ordinary circulating waters near the land surface. It seems likely the rarity of such solutions, especially with respect to fluoride concentration, is the principal reason that cryolite is a rather rare mineral.
Solutions A-F have about the sodium activity and ionic strength assumed for figure 9 but differ in other respects from the system

INTERACTIONS OF ALUMINUM WITH AQUEOUS SILICA E33
conditions used in preparing the diagram. Solutions D and F, however, are fairly close to the assumed fluoride activity. The shifts of the cryolite-gibbsite boundary required bring the aluminum solubility grid into close agreement with the CM values reported in table 5 f c r the two solutions.
Eugster and Jones (1968) described sodium-aluminum silicate gels that formed at Lake Magadi, Kenya. These apparently formed by water from hot springs that was alkaline and rich in sodium, fluoride, and silica coming in contact with extrusive igneous rocks. The gel could be crystallized in the laboratory to form analcite (a zeolite). Cryolite evidently was not produced, but the composition of the spring water indicated by analyses in the paper of Eugster and Jones would not be within the cryolite stability region in figure 9.
APPLICATION TO NATURAL-WATER COMPOSITION
The practical value of experiments and calculations of the type described here lies mainly in their applicability to natural systems. Hopefully the solubilities of the synthetic aluminosilicate might ap proximate some of the natural products of rock-weathering reactions at ambient earth-surface temperatures.
There are many references in the literature to the occurrence of X-ray amorphous clay-type minerals in soils and stream sednrents, and they probably are also present in most ground water systems .
Most of the chemical analyses of natural water that can be obtained in published literature are not satisfactory for testing alumino silicate solubility calculations. Generally aluminum concentrations are not determined in the water analyses, and even when they are, the results may be unreliable. Metastable colloidal aluminum hydrox ide or aluminosilicate with some of the properties observed in our synthetic halloysite can be expected to occur in river water. Removal of such material by filtration may be incomplete unless a very low porosity filter is used.
Samples of high flow in the Mattole River near Petrolia, Calif. , collected November 8, 1969, as part of geochemical investigations by Kennedy (1971) were filtered at the time of collection through plastic membrane filters with 0.45jum maximum diameter pores, and alumi num and iron concentrations were determined in the filtrates. The filtered samples were passed through another plastic membrane filter, one having O.lOjum maximum diameter pores, and the alumi num and iron concentrations were determined on these filtrates also.
Sample Filter, O.tfum (nig/l) Filter, O.lO^m (mg/l)Al Fe Al Fe
2092... ________ 0.11 0.10 0.08 0.032093___________ .14 .08 .09 .04
E34 CHEMISTRY OF ALUMINUM IN NATURAL WATER
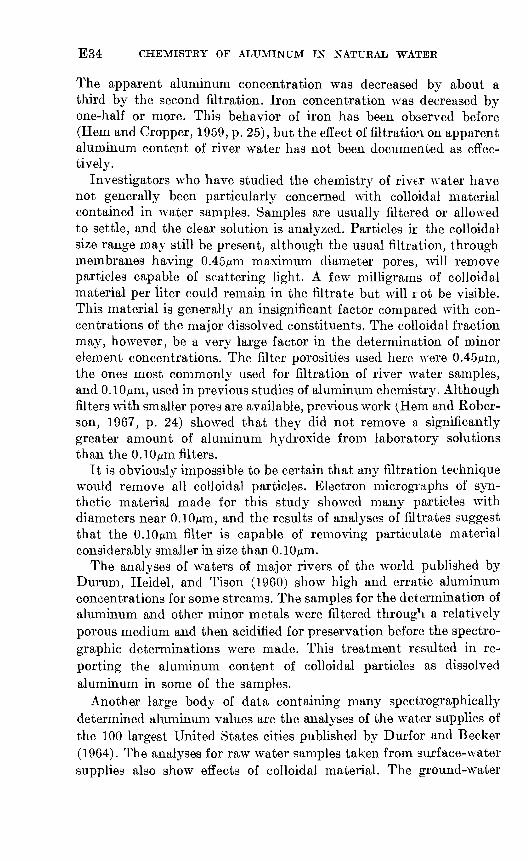
The apparent aluminum concentration was decreased by about a third by the second filtration. Iron concentration was decreased by one-half or more. This behavior of iron has been observed before (Hem and Cropper, 1959, p. 25), but the effect of filtration on apparent aluminum content of river water has not been documented as effec tively.
Investigators who have studied the chemistry of river water have not generally been particularly concerned with colloidal material contained in water samples. Samples are usually filtered or allowed to settle, and the clear solution is analyzed. Particles ir the colloidal size range may still be present, although the usual filtration, through membranes having 0.45Mm maximum diameter pores, will remove particles capable of scattering light. A few milligrams of colloidal material per liter could remain in the filtrate but will rot be visible. This material is generally an insignificant factor compared with con centrations of the major dissolved constituents. The colloidal fraction may, however, be a very large factor in the determination of minor element concentrations. The filter porosities used here were 0.45jum, the ones most commonly used for filtration of river water samples, and O.lOjum, used in previous studies of aluminum chemistry. Although filters with smaller pores are available, previous work (Hem and Rober- son, 1967, p. 24) showed that they did not remove a significantly greater amount of aluminum hydroxide from laboratory solutions than the O.lOjum filters.
It is obviously impossible to be certain that any filtration technique would remove all colloidal particles. Electron micrographs of syn thetic material made for this study showed many particles with diameters near O.lOMm, and the results of analyses of filtrates suggest that the O.lOAtm filter is capable of removing particulate material considerably smaller in size than O-lO^m.
The analyses of waters of major rivers of the world published by Durum, Heidel, and Tison (1960) show high and erratic aluminum concentrations for some streams. The samples for the determination of aluminum and other minor metals were filtered througH a relatively porous medium and then acidified for preservation before the spectro- graphic determinations were made. This treatment resulted in re porting the aluminum content of colloidal particles as dissolved aluminum in some of the samples.
Another large body of data containing many spectrographically determined aluminum values are the analyses of the water supplies of the 100 largest United States cities published by Durfor and Becker (1964). The analyses for raw water samples taken from surface-water supplies also show effects of colloidal material. The ground-water

INTERACTIONS OF ALUMINUM WITH AQUEOUS SILICA E35
samples should have been more reliable in this respect, and some analyses appear to give reasonable results. Treatment of a public water supply before putting it into the distribution system tends to upset any aluminosilicate equilibria that might have existed before treatment. The process of coagulation with alum seems almost in variably to cause a measurable increase in dissolved aluminum con tent, probably because colloidal or polymeric aluminum hydroxide species are formed that can pass through the filters. Adjustments of pH are commonly made also during treatment processes.
Presumably spectrographic aluminum determinations include all species present. Regular wet chemical analyses for aluminum are relatively insensitive and require very careful work to obtain results at concentrations below 0.1 or 0.2 mg/1. This low concentration range is the one to be expected in most natural water near neutral pH, if the solubility calculations given in this paper are applicable. Most of the available analytical data report aluminum determined by wet chemical methods and cannot be relied upon closely enough to give a fair test of our solubility calculations.
A further shortcoming of most published analyses is that the pH reported was usually determined after the sample had been brought to the laboratory and commonly after days, weeks, or even months of storage. Such pH values may not apply to the water in its original environment.
After careful consideration of their reliability and the likelihood of their representing systems where aluminosilicate equilibria might occur about 50 published analyses were selected from three principal sources, and pertinent data from these supplemented with data from a few analyses especially made for this study are given in table 7. They pro vide what is believed to be a valid test of the solubility calculations. Most of the analyses were taken from the study by Feth, Roberson, and Polzer (1964) of water that had been in contact with the granitic rocks of the Sierra Nevada in California and Nevada. The sampling and analytical work done for this study were very carefully conducted to obtain the best possible values for aluminum, and pH determinations were made at the sampling site. The pH range covered by these samples was from near 8.0 to about 5.5. Observations made by these investiga tors indicated that most of these waters were associated with kaolinitic or amorphous clay mineral species. A few analyses of waters with higher and lower pH values were obtained from the compilation of White, Hem, and Waring (1963) of analyses of ground waters from various geologic environments in which clay minerals are considered likely to be present. A few analyses of acid waters from various depths in three mines in the Pennsylvania anthracite region were published

E36 CHEMISTRY OF ALUMINUM IN NATURAL WATER
TABLE 7. Analytical data from actual water samples
[Source of data: 1-39: Feth, Roberson, and Polzer (1964); 40-45: White, Hem, and Waring (1963); 46-48: Barnes, Stuart, and Fisher (1964); 49-51: unpub. data, U.S. Geological Survey files]
No.
19
345
6789
101112131415
16171819202199
2324252627
^829303132333435363738394041424344454fi4748495(151
Source
Ephemeral springs:1,218 1,222...---.----.---.-.-.- . ... .1,226......_ -.--....---.............1,233 1,256. .
Quartz monzonite springs:1,138 1,217----.---.--..-----..-.-.......1,250.. ......................_._....1,255.. .--..---_-------_...._...-...1,257 -- -- .. -----------1,224 .1,529-..----------------.---..--.-.1,561 -- 1,565.-----... --..-...._.--._.-_.__.1,569
Graiiodiorite springs:1,170...---------------.-...--......1,172 _1,572 (resampled),-. ........ ....___-1,286--.---.-----------.-.-...-...-.1,287--.---------.-----------------.1,293_- - -- - --------- ------------1,294...............................1,295 . 1,566.-. .....-.-----....._.-.--_-...1,567----... ---------------- -----1,573 ----------------------------1,574.. ....... -.-..-.....---------
Granitic rock springs:811-- - 1,147--..-. --------- ------------1,246.--------------.-----....-----.1,247.-----.---.--------.-----.-.--.1,248 ------------ --. ... ..-.--1,249. 1,251 . 1,252.----....------------....----.1,259.........-------------.-----.1,541.----------------.--.--..-----.1,542.----.-.-.-.-.-----.-------.--.1,543..------ -----------------------
Well, Park Lake, Ky-_. .............._Well, Montieello, Ark_____. _______._Well, Lake Roland, Md . ............Spring Yellowstone Park upper basin.Sisjodandi Spring, Iceland............Well, Mexican Water, Ariz. ............Mine water, Storrs No. 1 shaft- -.--.-.Mine water, South Wilkes-Barre No. 5- .Mine water, Loree No. 2 shaft. .........Mattole River, Calif., filtered 0.10/um. _ . do . _ ... . .-Conklin Creek, Calif., filtered 0.10/um--
Date ofsampling
5- 2-605- 3-605- 4-605- 5-606- 3-60
10-21-595- 2-606- 2-606- 2-606- 3-605- 4-608-22-619-26-619-27-61
10-17-61
12-11-5912-12-5910-17 618- 9-608- 9-608-11-60
8-11-609-27-619-27-61
10-18-6110-18-61
8-29-5811- 8-596- 1-606- 1-606- 1-606- 2-606- 2-606- 2-606- 3-609-14-619-14-619-14-611- 5-55
12-13-553-19-54
10-16-578-31-583-11-55
11- 8-6911- 8-6911- 8-69
I
0.0002.0003.001.0004.0003
.001
.002
.002
.0003.0002.002.003.003.0005.0005
.001
.003.003.0004.0002.005004
.0007
.001.0009.0004.0006
.002.001.002.001.0007.001.001.002.0002.002.002.002.004.003.007.02.015.007.05.1.1+.001.001.001
CAI(mg/1)
0.04.12.04.08.02
.02
.02
.02
.02.04.02.06.03.02.03
.01
.02.02.02.01.02.03.01.03.02.03.02
.05
.01
.03.02.02.02.03.04.02.19.04.02
1.528
2.9.64.2
2420
143.10.08.09
Csi0(mg/1)
2413371715
23352220112457512629
272020241139432816131523
261919151424171913252420229831
363359
112549857.88.7
13
(P[A1] or[A1(OH) 4])
9.23i 10. 79
9.18i 10. 08
9.75
9.569.389.59
i 9.889.609.568.699.079.579.29
9.789.639.639.54
10.819.469.30
11.219.54
i 10. 099.579.57
9.119.939.469.759.789.549.509.35
10.998.559.269.628.436.558.476.016.217.927.116.995.959.329.379.14
I PH
7.55.6
2 6.95.96.3
2 6.96.27.96.26.97.07.457.556.56.7
= 7.126.8
7. 727.0
5.96.46.35.. 57.66.27.37.25
27.627.6
7.97.57.47.77.37.45.67.906.656.60
2 4.924.0- 8. 329.629.729.2
3.954.203.927.427.607.80
i Effects of A1F complexes included. - pH measured in laboratory.
by Barnes, Stuart, and Fisher (1964), who postulated a pH control in these systems exerted by reversible solution of kaolinitic clays. Three analyses representing the deepest waters from three mines were also included.
The activity of [H4SiO4] was calculated directly from the analytical data, assuming an activity coefficient of 1.0 and correcting for the effect of dissociation at high pH if necessary by means of equation 8

INTERACTIONS OF ALUMINUM WITH AQUEOUS SILICA E37
in table 2. The reported pH was considered to represent the activity of hydrogen ions. Most of the measurements were made at tempera tures between 10° and ]5°C. The solubility calculations refer to 25°. Although this discrepancy can be expected to cause some disagree ment between observed and calculated solubilities, the effect should not be great enough to be of major concern at this point.
Figure 10 is a plot of the sum of activities of aluminum ([Al+3 ] or [A1(OH) 4 ~] only) and silica against pll. Dashed regression lines shown are the same as the ones established from laboratory data, plotted in figures 2 and 4.
In genera] the aluminum and silica activities for the Sierra Nevada springs follow the predicted pattern. Some of the individual analyses plot as much as one log unit away from the line, but most are much closer. Notes in the table of analyses from which the data came (Feth, Roberson, and Polxer, 1964, p. 4-15) show that kaolinite-type as well as X-ray amorphous clay minerals were present in association with the water at most sites. The experimental solubility data reported here for the synthetic halloysite thus appear to have some value as indicating the aluminum concentrations likely to be found in natural weathering solutions, where an equilibrium involving amorphous clay- type minerals could be expected.
The activities of uncomplexed aluminum, [Al+3] for acid waters and [A1(OH) 4 ~] for all waters whose pH was 5.6 or over, were calculated from the analytically determined A1(2A1) by means of the equation
, [A10H+2] [A1(OH) 2 -1 [Al(OH)r],~T~ 0.9 i , ~r _
" TAKOHV 7Ai(OH) 4
in combination with equations 2, 3, and 4 in table 2. Because pH and SA1 are known, for a given ionic strength there are four equations and four unknown variables. The final working expressions for ionic strength 0.001, for example, are
and[Al(OH)r]=SAl/(1.04+1012 - 33[H + ] 2 +1017 - 13[H+]3 +102220[H +]').
For most of the natural waters, fluoride complexing effects are insig nificant compared with the hydroxide complexing (Hem, 1968, p. 29), but if necessary the expressions can be expanded by adding ter-ns for fluoride complexes and using equations 10-15 (table 2) to evaluate them.

5.0
g a-
7
7.0
T + I?
8'°
i 0 ^
9>0
T " 1
0-°
en -2
11.0
'
12 0
i i i i i I i
\ \A \ *
\
^
A \
^^
~
\
^
\
^^
-
\
^
\
^^
\
0 ^
^
, \
_^
^
o
-
\
^o
°°
^
2T
°~x
\ °°
0 %
8 oo
8<
*> 8
\
-o-
^^
o
o
°
\
-o
S/^
Ox^
" o
_
^6-
o
: i
ill
i I
i
H CO
00 o H g I I S3 0 >. s g h
H
§
hH !2! > d S3 F Si
's.O
4
.0
5.0
6
.0
7.0
8
.0
9.0
10
.0
j>P
H
FIG
UR
K 1
0. R
elat
ionsh
ip o
f l
og
[A
l] o
r l
og [
A1(
OH
)4]+
lo
g [H
4SiO
4] to
pH
fo
r se
lect
ed w
ater
sam
ple
s fr
om g
rou
nd
- an
d
surf
ace-
wat
er s
ourc
es:
Sie
rra
Nev
ada
per
enn
ial
spri
ngs,
cir
cle;
Sie
rra
Nev
ada
ephe
mer
al s
prin
gs,
circ
le w
ith b
ar;
mis
cell
aneo
us
grou
nd w
ater
, dot;
fil
tere
d M
atto
le R
iver
wat
er,
x; f
ilte
red
min
e w
ater
, tr
ian
gle
. S
ee t
ext
for
expla
nat
ion o
f d
ash
ed l
ines
.

INTERACTIONS OF ALUMINUM WITH AQUEOUS SILICA E39
For reasons already cited, the solubility graphs should not be ex pected to apply to all natural water. There usually is no way of know ing if such systems are at equilibrium and if the necessary solid prod ucts are present. Thus, many analyses will yield points that are off the equilibrium line, either above or below saturation for the measured pH.
Because most analyses are riot reliable indicators of actual dissolved aluminum and the pH reported also may be unreliable for equilibrium calculations, no extensive further study of existing analytical data seems justified. However, at extreme values of pH, either substan tially higher or lower than the 5.5-8.0 range represented by the Sierra granitic water, aluminum is more soluble, and existing analytical data may be more significant. There are a few analyses of ground waters in a compilation by White, Hem, and Waring (1963) which are shown by solid dots in figure 10. The solutions more alkaline than pH 8.5 seem generally to contain less aluminum than would be predicted at equilibrium. It seems likely the pH of such waters might be controlled by some reaction other than aluminosilicate dissolution. Dissolution of clay minerals in mildly alkaline solutions is likely to be extremely slow. Hence their failure to attain equilibrium is not surprising. The two points above pH 9.5 represent water from thermal springs, and solubilities at these high temperatures probably are greater than would be expected at 25°.
The solutions at low pH ought to attain equilibrium more readily. Analyses for two ground waters from fine sediments reported by White, Hem, and Waring (1963) give points very near the theoretical solu bility line for pH 4.0 and 4.9.
Another type of acid solution which might be expected to equilibrate with clay minerals is water affected by pyrite oxidation. Waters of this kind occur in abundance in coal mines, and analyses for such solutions are relatively abundant. Three analyses of this type of water were taken from a paper by Barnes, Stuart, and Fisher (1964). They represent water from three mine shafts in eastern Pennsylvania. The observed pH ranged from 3.9 to 4.2, and substantial amounts of aluminum were present. Barnes, Stuart, and Fisher (1964, p. 5) ascribed a buffering effect in these water bodies to reactions of H+ with silicates and clays.
Although the deepest water sampled in each of the three shafts gave points that plot near the theoretical solubility line, the significance of the results is open to some question. The mine waters were high in sulfate, iron, calcium, and magnesium. As Hem (1968) pointed out, the complexing effect of sulfate may influence aluminum solubility. The calculations of aluminum activity in the mine waters, however, were made without considering sulfate complexes. The availability of

E40 CHEMISTRY OF ALUMINUM IN NATURAL WAT^R
sulfate for entering into aluminum complexes in these solutions cannot be readily calculated, as there are other sulfate complexes with Ca+2 , Fe+2 , and Mg+2 , and these will compete with aluminum for the available sulfate.
If the complexing effect of sulfate is considered, the points calculated for the mine-water samples will lie near the theoretical solubility for a kaolinite having a standard free energy of formation of 903 kcal per mole. The laboratory studies of Polzer and Hem (1965) in which a natural kaolin was placed in distilled water acidified to a pH between 3.5 and 4.0 suggest that a reversible equilibrium with this more stable kaolinite is possible at low pH. In any event the data from their experiments also lie near the solubility referred to previously for the mine water. This solubility line is not entered in figure 10 but would parallel the left-hand segment of the dashed line, displaced downward by two log units.
CHEMICAL COMPOSITION OF PRECIPITATES
The amounts of aluminum and silica which disappeared from the test solutions were determined from the analytical data and are indicated in tables 3 and 4. The composition of particulate material is not very closely indicated by this type of information, however, because each of the aging solutions was analyzed many times during the aging period and very little solution was left at the time of the f nal observa tion. Nevertheless, the average of mole ratios of silica to aluminum in the solid materials was near 1.0 for all the observations in table 3.
Analyses of recovered solid material were made by wet chemical procedures for many of the aging solutions. These also usually showed a mole ratio near 1.0. Some of the material filtered out contained an excess of aluminum that is, the aluminum to silica ratio was greater than 1. These solids probably were mixtures of aluminum hydroxide and 1:1 aluminosilicate.
CRYSTALLINITY OF SOLIDS
Crystal structure of the solids synthesized in this studT^ was inves tigated by X-ray diffraction and electron microscopy. As noted earlier in the discussion, the materials recovered from solutions given in tables 3 and 4 did not give identifiable peaks in their X-ray diffrac tion scans, with the single exception of solution 12E. A peak charac teristic of quartz appeared in the diffractogram for the solid recovered from solution 12E after three weeks of aging and was present in all later scans of the precipitate up to the termination of the experiment after 6 months. The occurrence of crystalline silica in this particular solution is anomalous, and several attempts to duplicate the result

INTERACTIONS OF ALUMINUM WITH AQUEOUS SILICA E41
by preparing similar solutions were not successful. At the high pH (initially 9.85) of this solution, the amount of silica retained in solu tion probably is near the equilibrium solubility of quartz, but no particular significance is attributable to this single occurrence.
Where the initial silica concentrations were below about 9.0 mg/1, the diffractograms of solids produced ultimately showed character istic peaks for aluminum hydroxide species. Gibbsite patterns appeared in material recovered from solutions whose pH was below neutrality, and bayerite and nordstrandite could be identified in material aged in alkaline solutions. These observations are similar to results described earlier (Schoen and Roberson, 1970) for solutions where silica was absent. The presence of small amounts of silica, however, does slow down the crystallization process. Where silica was absent, material giving characteristic X-ray diffraction peaks was formed in a few days or weeks of aging. Where silica was present, even in concentra tions as low as 2.0 mg/1, the development of crystals that would give X-ray diffraction peaks required 2 months or more of aging. Data for solutions that precipitated crystalline aluminum hydroxide are not included in tables 3 and 4.
Failure of the precipitates of aluminosilicate material to give X-ray diffraction peaks does not mean complete absence of crystallinity. The individual crystals may have been too small, or perhaps the better organized particles were too few in number to be detected by that technique. A considerable amount of information on the degree of organization of the precipitates was obtained by means of the electron microscope. Particulate material from all the solutions was examined this way. The results showed that many of the precipitates contained aggregates of small crystals, and some forms showed lay ering and other general resemblances to clay minerals when viewed by the electron microscope. Examples of the micrographs obtained are given in figures 11-22.
Figures 11-14 represent materials of known composition which also could be identified by X-ray diffraction. Figure 11 represents gibbsite obtained from a solution that contained no silica. Figure 12 represents bayerite obtained from a solution that contained a small amount of silica. The bayerite crystal habit, as noted by Schoen and Roberson (1970), displays a tendency for stacking of the A1(OH)3 sheets in the c direction rather than lateral growth to form the thin plates of gibbsite. The bayerite crystals in figure-12 are of a shape generally similar to those portrayed by Schoen and Roberson (1970, p. 59) and are sim ilarly oriented.
Figure 13 represents two particles of a standard Montana kaoJinite. Typical micrographs of kaolinite that is well crystallized show abun dant layered crystals with rather irregular, generally hexagonal

E42 CHEMISTRY OF ALUMINUM IN NATURAL WATER
FIGURE 11. Electron micrograph of microcrystalline gibbsite synthesized at 25°C. Silica absent; pH of solution near 5.00; aged 18 months.
outlines (Beutelspacher and Van der Marel, 1968, p. 53-61). The particles in figure 13 are relatively thick, and part of their somewhat rounded appearance results from the carbon shadowing given the specimen before it in the electron beam. There was also a tendency for some of the specimens to deteriorate while being subjected to the electron beam.
Figure 14 is an electron micrograph of montmorillonite (Arizona bentonite) showing the very thin plates characteristic of this mineral. Nothing resembling this structure was seen in any of the synthesized aluminosilicates, which is considered to be further evidence that these materials have 1:1 rather than 2:1 silicon to aluminum ratios.
Figure 15 represents synthesized aluminosilicate from solution 12E (table 4). The layered nature of the material and its generally hexag onal structure and appearance resemble kaolinite. Very few units this well developed were seen.
Polzer, Hem, and Gabe (1967) published electron micrographs of aluminosilicates synthesized early in this study. Among the materials observed were some lathlike or tubular particles similar to halloysite portrayed by Beutelspacher and Van der Marel (1968), p. 62-68. It is characteristic of this mineral that the thin sheets roll up into tubes.
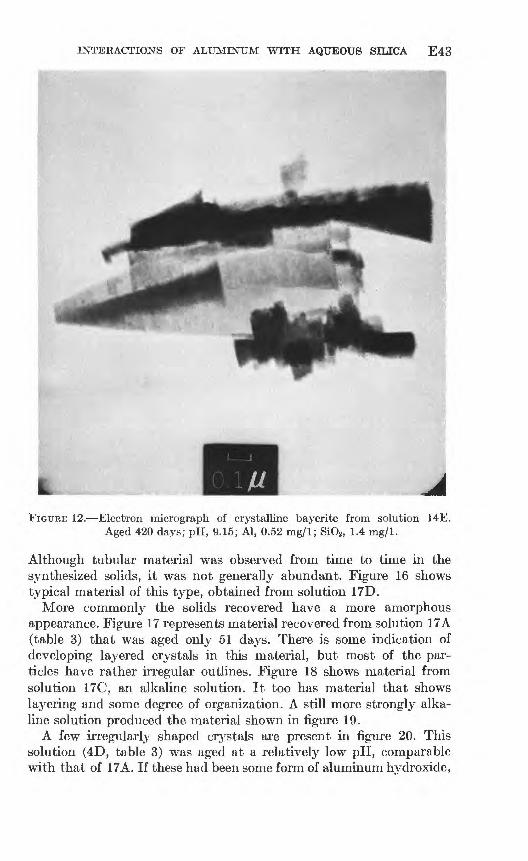
INTERACTIONS OF ALUMINUM WITH AQUEOUS SILICA E43
FIGURE 12. Electron micrograph of crystalline bayerite from solution 14E. Aged 420 days; pH, 9.15; Al, 0.52 mg/1; SiO2 , 1.4 mg/1.
Although tubular material was observed from time to time in the synthesized solids, it was not generally abundant. Figure 16 shows typical material of this type, obtained from solution 17D.
More commonly the solids recovered have a more amorphous appearance. Figure 17 represents material recovered from solution 17A (table 3) that was aged only 51 days. There is some indication of developing layered crystals in this material, but most of the par ticles have rather irregular outlines. Figure 18 shows material from solution 17C, an alkaline solution. It too has material that shows layering and some degree of organization. A still more strongly alka line solution produced the material shown in figure 19.
A few irregularly shaped crystals are present in figure 20. This solution (4D, table 3) was aged at a relatively low pH, comparable with that of 17A. If these had been some form of aluminum hydroxide,

E44 CHEMISTRY OF ALUMINUM IN NATURAL WATER
FIGURE 13. Electron micrograph of fragments of Lewistown, Mont., standardkaolinite.
it should have been detected by X-ray diffraction. The precipitate from 4D was amorphous to X-rays.
One final experiment was conducted to help correlate crystallinity observations and solubility results more closely. In the various studies conducted by Belgian investigators and their associates, alumino- silicate gel was first prepared by reacting aluminum isopropoxide with ethyl orthosilicate. The gel was then aged under various conditions to obtain finally a kaolinite that gave characteristic X-ray diffraction peaks (for example, DeKimpe, 1969). The fact that the alumino- silicate gel prepared in this way will ultimately be converted to a crystalline clay mineral seems to be well established by the many studies that have been made by using this approach. It is of interest to examine aluminosilicate gel that was prepared this way after fairly short aging periods in solutions like the ones we have used and to ana lyze the solutions to compare them with the ones summarized in tables 3 and 4. If the solids appear similar to the ones we have pre pared (figs. 15-20) and they appear to approach a similar equilibrium solubility, this will constitute further evidence that our synthetic materials are the same, essentially, as aluminosilicates prepared by mixing aluminum isopropoxide and ethyl orthosilicate and that they

INTERACTIONS OF ALUMINUM WITH AQUEOUS SILICA E45
FIGURE 14. Electron micrograph, montmorillonite (Arizona bentonite).
can be expected to evolve, given favorable conditions, to well-defined kaolinitic clay minerals.
Aluminosilicate gel was prepared by mixing equimolar quantities of the two organic compounds in an ethyl ether solution. After being freed from most of the organic solvents by gentle warming, 2-gram portions of the gel were placed in two polyethylene bottles. To one of these was added 2 liters of a 0.10 molar solution of sodium perchlorate which had been lowered in pH by addition of 4 milliliters of 0.11 molar HC1O4. To the other bottle a 0.10 molar solution of sodium perchlo rate was added that had been made mildly alkaline by adding sodium hydroxide. The pH's of the two solutions were 4.67 and 8.78, respectively.
After 2 months the analyses of filtered solutions were as follows:
ISA pH, 4.76; Al, 0.58 mg/1; SiO2, 48 mg/1;
18B pH, 6.13; Al, 0.03 mg/1; SiO2 , 25 mg/1.
Ion-activity products were 1010 ' 72 for ISA and 1012-34 for 18B. Both numbers are within the range given for similar solutions in table 3.

E46 CHEMISTRY OF ALUMINUM IN NATURAL WATER
FIGURE 15. Electron micrograph, solid recovered from solution 12E (table 4) after 199 days aging. pH, 8.16; Al, 2.3 mg/1; SiO2 , 16 mg/1.
Thus one may assign a solubility similar to that of our synthetic ' halloysite to the solids.
Figure 21 is an electron micrograph of material from solution ISA. This material appears to be the same as the tubular halloysite obtained in some of the other solutions. The electron micrograph of material i from solution 18B, figure 22, shows tubular material and a few hexag onal flakes of apparently layered material that resembles synthetic kaolinite.
Figure 23 is an electron micrograph of naturally occurring colloidal material from a floodflow in the Mattole River, Calif. A sample col lected November 8, 1969 (also represented by Nos. 2, 49, and 50 in table 7) was filtered through 0.45jum and then through O.lOjum average pore-diameter filters. Material photographed was that caught on the final filter. Resemblance of the poorly crystalline residue to synthetic products in figures 17-19 is obvious.

INTERACTIONS OF ALUMINUM WITH AQUEOUS SILICA E47
FIGURE 16. Electron micrograph, solid recovered from solution 17D (table 4) after 265 days aging. pH, SiO2, and Al contents essentially the same as after 95 days aging.
Some further indication of crystallinity was obtained for some of the residues by means of electron diffraction. This technique permits focusing on what may appear to be promising centers of crystallization seen through the electron microscope and thus is a very sensitive means of detecting crystal organization. Electron diffraction patterns could be obtained from many of the aluminosilicate residues, and these patterns resembled those given in the literature for kaolinite (Siffert, 1962). Similar patterns seem to be obtained, however, for various different related minerals, and we have not been able as yet to use these patterns for positive identification of species.
VALIDITY OF EQUILIBRIUM MODEL
A synthetic aluminosilicate amorphous in crystal form, at least when examined by X-ray diffraction techniques, has been prepared. Its equilibrium solubility has been determined in laboratory solutions at 25°C, and it appears to be consistent with the assumption that the

CHEMISTRY OF ALUMINUM IN NATURAL WATER
FIGURE 17. Electron micrograph of solids recovered from solution 17A (table 3) after 51 days aging. pH, 4.02; Al, 22 mg /I; SiO2 , 181 mg /I.
material is stoichiometrically equivalent to halloysite. We have applied these data to a set of carefully analyzed samples of water from ephemeral and perennial springs in the Sierra Nevada of California and Nevada and have demonstrated a reasonably close fit of the aluminum, silica, and pH to the values predicted by the model. We have also predicted the effect of fluoride on solubility of aluminum in laboratory systems with some success.
There are some fundamental factors that need to be considered, however, before hopes become too high for broad application of these equilibrium solubility calculations. Some of these factors have already been mentioned. But even if the analysis for aluminum is a reliable indicator of the truly dissolved forms and the pH value obtained represents the original system accurately, the kind of equilibrium obtained here should not always be expected.
The synthetic halloysite prepared here may not be identical to the amorphous clays that are produced in weathering of granitic rock minerals, but it is not unreasonable to expect that their behavior

INTERACTIONS OF ALUMINUM WITH AQUEOUS SILICA E49
FIGURE 18. Electron micrograph of solids recovered from solution 17C (table 4), after 106 days aging. pH, 8.17; Al, 1.4 mg/1; SiO2 , 2.2 mg/1.
would be similar. In his study of weathering of a granitic rock in Maryland, Wolff (1967) did identify halloysite, both by X-ray diffraction and electron microscopy of the materials produced. The processes that occur in weathering in the Sierra may resemble some what the ones which occurred in the laboratory when the aging study solutions were prepared. An aggressive dilute runoff water perhaps fortified in dissolved CO2 , and thus in available H+ by the effects of vegetation, attacks the rock minerals and releases silica and aluminum, and at or near the mineral surfaces, conditions in the solution may be highly favorable for these solutes to combine into colloidal alumino- silicate. Most igneous rock minerals contain more silicon than alumi num, and surplus silica remains in solution or perhaps is temporarily precipitated as a relatively soluble amorphous form of silica. There is

E50 CHEMISTRY OF ALUMINUM IN NATURAL WATER
FIGURE 19. Electron micrograph of solids recovered from solution 11J (table 4) after 587 days aging. pH, 8.90; Al, 8.0 mg/1; SiO2 , 39 mg/1.
good evidence from studies by Kennedy (1971, p. 118) and by others, of the chemical composition of runoff, that a stable silica concentra tion is reached after a rather brief time of contact of the water with soil and rocks.
Although only indirect evidence is available for postulating the behavior of aluminum in runoff water, it appears likely that the aluminum released in the breakdown of rock minerals such as feldspar is rather quickly recombined into clay-type structures. The six- coordinated structure of aluminum in the gibbsite or clay mineral sheet is probably established as soon as the aluminum ion is freed from its position in the feldspar, as this is the required configuration of the aquoaluminum ion and its cationic hydroxide complexes. Our previous studies (Hem and Roberson, 1967) showed that these ions polymerize rapidly enough at pH 5 or 6 so that a colloidal form of gibbsite could develop in the weathering solution very near the interface between the fresh mineral and the water.

INTERACTIONS OF ALUMINUM WITH AQUEOUS SILICA E51
FIGURE 20. Electron micrograph, solid recovered from solution 4D (table 3) after 18 months aging. pH, 4.26; Al, 3.0 mg/1; SiO2 , 86 mg/1.
For a clay mineral structure to form, the tetrahedral silica layer must become bonded to the aluminum hydroxide layer. This bonding is through oxygen rather than hydroxide ions that is, the hydroxide ion in the gibbsite layer that is most closely approached by a silicon ion must become a divalent oxygen ion. The other ions coordinated with silicon must also be oxygens rather than hydroxides.
One obvious possible cause of the difficulty of synthesizing clay minerals from aqueous solutions of Al+3 and Si+4 is that dissolved forms of aluminum have OH~ or water molecules in all coordination posi tions and that silicon will occur similarly as Si(OH) 4 (aq). Incorpora tion of aluminum-oxygen-silicon bonds in any structure produced from encounters among these solutes requires removal of a proton and an OH~ from the site of this rearrangement of bonding. Similarly the establishment of silicon-oxygen-silicon bonding in the silica layer re quires elimination of an OH~ and an H+ at each site. Some mechanisms for accomplishing these changes can be visualized in natural systems for example, the conditions near the water-solid mineral interface may

E52 CHEMISTRY OF ALUMINUM IN NATURAL WATER
FIGURE 21. Electron micrograph of solids recovered from solution ISA after7 days aging.
favor deprotonation and dehydration, or the silicon may be incor porated into the clay mineral structure with some of its original bond ing to oxygen and aluminum relatively intact. In a dilute solution of aluminum and silicon species at 25°C, however, it is easy to see why the formation of a clay mineral structure is difficult to accomplish.
Successful kaolinite syntheses at low temperatures reported in the literature, as has been noted, commonly have utilized as the starting materials aluminum propoxide, A1[OCH(CH3) 2]3, and ethyl ortho- silicates, Si(OCH2CH3) 4 . In both these compounds there is a cation- oxygen-carbon bonding structure rather than a cation-OH bonding. The encounter between the complexes provides a good chance for setting up aluminum-oxygen-silicon bonding.

INTERACTIONS OF ALUMINUM WITH AQUEOUS SILICA E53
FIGURE 22. Electron micrograph of solids recovered from solution 18B after7 days aging.
Linares and Huertas (1971) reported a kaolinite synthesis using a "fulvic acid" complex of aluminum and suggested the organic com- plexing of aluminum in natural systems may be important in the natural processes by which clay minerals form. Such a reaction path does not seem to be followed, however, in all natural systems where clays are formed. Further attention to, and study of, the details of aluminum and silicon associations should shed considerable light on this poorly understood but very important weathering reaction.
As noted, the analytical data for samples of Sierra Nevada springs fit the postulate of an equilibrium with respect to synthetic halloysite. It may be supposed that reactions occurring between snowmelt and feldspar surfaces could produce conditions somewhat like those in our laboratory solutions and that once established the equilibrium would be maintained in the solution so long as the water does not move

E54 CHEMISTRY OF ALUMINUM IN NATURAL WATER
FIGUKE 23. Electron micrograph of solids passing 0.45/im filter caught on 0.10/um filter. Water from Mattole River near Petrolia, Calif., November 8, 1969.
into a substantially different chemical environment. Of all the solu tions represented in figure 10, some of the best fits were among the sources listed by Feth, Roberson, and Polzer (1964) as "ephemeral" springs. These are characterized by short contact times between water and rock and presumably would represent systems where there is little chance for the solution to enter a different environment that could upset the equilibrium and where the early stages of rock-water reactions characterized by Carrels and MacKenzie (1967) are still predominant. The "perennial" springs, where contact times and flow paths are longer, include some waters that do not fit the equilibrium model as closely.
Another point of significance in considering aluminosilicate equi libria of this kind is the fact that in most natural water this type of reaction will be subordinate to others that involve larger stoichiometric amounts of reactants. For example, as noted by Wollast (1967), the rate and intensity of weathering of a feldspar are likely to depend

INTERACTIONS OF ALUMINUM WITH AQUEOUS SILICA E55
on the hydrogen-ion supply, derived from dissolved CO2 and main tained by a carbonate buffer system. The aluminum and silica con centrations in the solution may well be expected to arrange themselves at values predicted by the equilibrium model so long as the H+ activity remains high enough that aluminum and silica are extracted from the original rock minerals. A decrease of H+ activity (rising pH) may tend to slow the attack. At relatively alkaline pH, even though one might calculate a rather high solubility for synthetic alumino- silicate, the reaction path whereby the previously formed material can be dissolved is likely to contain a high-energy barrier. The mech anisms for disruption either of aluminum-oxygen-silicon bonds or of double OH bridges between aluminum ions in a solution of high pH must be substantially different from those producing such dis ruptions at low pH.
The introduction of fluoride into a system containing synthetic halloysite would be predicted to increase aluminum solubility. Ag^in, however, the mechanisms for substituting F~ for OH~ in these struc tures probably involve slow steps and energy inputs.
It thus seems possible the aluminum, silica, and pH prevailing in a solution near the original site of synthesis of a clay mineral would be near predicted equilibrium values. An increase in pH brought about by some change in the bicarbonate buffer system, however, might not be balanced by increases in dissolved aluminum and silica, either because of slowness in reactions or lack of sufficient alumino- silicate reactant.
Thus the aluminum concentration in a ground water may tend to reflect the condition in the system at some other pH than the one observed at the sampling point. Examination of published water analyses from many sources suggests most strongly alkaline or high fluoride ground waters contain much less dissolved aluminum than the equilibrium solubility limit.
In spite of the many reservations that must be made in using equilibrium approaches to low temperature aqueous aluminosilicate chemistry, a beginning toward a better understanding of such systems in weathering solutions can be made in this way. With the aid of these models it is possible to deduce explicit areas in which research can be directed to gain more knowledge. For example, more study of mecha nisms that are involved in establishing inter] ayer bonding in clay minerals is definitely necessary.
REFERENCES CITED
Barnes, Ivan, Stuart, W. T., and Fisher, D. W., 1964, Field investigation of mine waters in the northern anthracite field, Pennsylvania: U.S. Geol. Survey Prof. Paper 473-B, 8 p.

E56 CHEMISTRY OF ALUMINUM IN NATURAL WATER
Beutelspacher, H., and Van der Marel, H. W., 1968, Atlas of electron microscopy of clay minerals and their admixtures: Amsterdam, Elsevier Pub. Co., 333 p.
Butler, J. N., 1964, Ionic equilibrium, a mathematical approach: Reading, Mass., Addison-Wesley Pub. Co., 547 p.
De Kimpe, C. R., 1967, Hydrothermal aging of synthetic aluminosilicate gels: Clay Minerals, v. 7, p. 203-214.
1969. Crystallization of kaolinite at low temperature from aluminosilicic gel: Clays and Clay Minerals, v. 17, p. 37-38.
De Kimpe, C. R., Gastuche, M. C., and Brindley, G. W., 1961, Ionic coordination in aluminosilicic gels in relation to clay mineral formation: Am. Mineralogist, v. 46, p. 1370-1381.
Durfor, C. N., and Becker, Edith, 1964, Public water supplies of the 100 largest cities in the United States, 1962: U.S. Geol. Survey Water-Supply Paper 1812, 364 p.
Durum, W. H., Heidel, S. G., and Tison, L. J., 1960, World-wide runoff of dis solved solids: Internat. Assoc. Scientific Hydrology Pub. 51, p. 618-628.
Eugster, H. P., and Jones, B. F., 1968, Gels composed of ?odium-aluminum silicate, Lake Magadi, Kenya: Science, v. 161, p. 160-163.
Feth, J. H., Roberson, C. E., and Polzer, W. L., 1964, Source? of mineral con stituents in water from granitic rocks, Sierra Nevada, California and Nevada: U.S. Geol. Survey Water-Supply Paper 1535-1, 70 p.
Garrels, R. M., and MacKenzie, F. T., 1967, Origin of the chemical compositions of some springs and lakes, in Equilibrium concepts in natural water chemistry: Am. Chem. Soc. Advances in Chemistry Ser., v. 67, p. 222-242.
Greenberg, S. A., and Price, E. W., 1957, The solubility of silica in solutions of electrolytes: Jour. Phys. Chem., v. 61, p. 1539-1541.
Harder, Hermann, 1965, Experiment zur "Ausfallung" der Kiese'saure: Geochim. et Cosmochim. Acta, v. 29, p. 429-442.
1966, Zur "Ausfallung" der Kieselsaure unter natiirlich^n Bedingungen: Sprechsaal fur Keramik, Glas, Email, Silikate, v. 99, Nr 22, p. 1005-1010.
1967, tiber das Kalium-Natrium-Verhaltnis in Gewassern und die Ton-mineralbildung: Die Naturwissenschaften, v. 54, p. 613.
Harned, H. S., and Hamer, W. J., 1933, The ionization constant of water and thedissociation of water in potassium chloride solutions from electromotiveforces of cells without liquid junction: Am. Chem. Soc. Jour., v. 55, p.2194-2206.
Hem, J. D., 1968, Graphical methods for studies of aqueous aluminum hydroxide,fluoride, and sulfate complexes: U.S. Geol. Survey Water-Supply Paper1827-B, 33 p.
Hem, J. D., and Cropper, W. H., 1959, Survey of ferrous-ferric equilibria and redoxpotentials: U.S. Geol. Survey Water-Supply Paper 1459-A, 31 p.
Hem, J. D., and Roberson, C. E., 1967, Form and stability of aluminum hydroxidecomplexes in dilute solution: U.S. Geol. Survey Water-Supply Paper 1827-A,55 p.
Hemley, J. J., 1959, Some mineralogical equilibria in the system ^O-A^Os-SiC^-H2 O: Am. Jour. Sci., v. 257, p. 241-270.
Kennedy, V. C., 1971, Silica variation in stream w'ater with time and discharge,in Nonequilibrium systems in water chemistry: Am. Chem. !?oc. Advances inChemistry Ser., v. 106, p. 94-130.
Kittrick, J. A., 1966, Free energy of formation of kaolinite from solubility measure ments: Am. Mineralogist, v. 51, p. 1457-1466.

INTERACTIONS OF ALUMINUM WITH AQUEOUS SILICA E57
1967, Gibbsite-kaolinite equilibria: Soil Sci. Soc. America Proc., v. 31, p. 314-316.
1970, Precipitation of kaolinite at 25°C and 1 atm: Clays and Clay Min erals, v. 18, p. 261-267.
Latimer, W. M., 1952, Oxidation potentials [2d ed.]: New York, Prentice-Fall,392 p.
Linares, J., and Heurtas, F., 1971, Kaolinite synthesis at room temperature:Science, v. 171, p. 896-897.
Polzer, W. L., and Hem, J. D., 1965, The dissolution of kaolinite: Jour. Geophys.Research, v. 70, p. 6233-6240.
Polzer, W. L., Hem, J. D., and Gabe, H. J., 1967, Formation of crystallinehydrous aluminosilicates in aqueous solutions at room temperature: U.S.Geol. Survey Prof. Paper 575-B, p. 128-132.
Raupach, M., 1963, Solubility of simple aluminum compounds expected in soils;I, Hydroxides and oxyhydroxides: Australian Jour. Soil Research, v. 1, p.28-35.
Reesman, A. L., Pickett, E. E., and Keller, W. D., 1969, Aluminum ions in aqueoussolutions: Am. Jour. Sci., v. 267, p. 99-113.
Roberson, C. E., and Hem, J. D., 1969, Solubility of aluminum in the presence ofhydroxide, fluoride, and sulfate: U.S. Geol. Survey Water-Supply Paper1827-C, 37 p.
Robie, R. A., and Waldbaum, D. R., 1968, Thermodynamic properties of mineralsand related substances at 298.15°K (25.0°C) and 1 atmosphere (1.013 bars)pressure and at higher temperatures: U.S. Geol. Survey Bull. 1259, 256 p.
Schoen, Robert, and Roberson, C. E., 1970, Structures of aluminum hydroxideand geochemical implications: Am. Mineralogist, v. 55, p. 43-77.
Siffert, Bernard, 1962, Quelques reactions de la silice en solution: la formation desargiles: Memoires du Service de al carte geologique d'Alsace et de Lorraine,No. 21, 86 p.
Smith, R. W., and Hem, J. D., 1972, Effect of aging on aluminum hydroxidecomplexes in dilute aqueous solutions: U.S. Geol. Survey Water-SupplyPaper 1827-D, 51 p.
Stumm, Werner, and O'Melia, C. R., 1968, Stoichiometry of coagulation: Am.Water Works Assoc. Jour., v. 60, p. 514-539.
Wagman, D. D., Evans, W. H., Parker, V. B., Halow, L, Bailey, S. M., andSchumm, R. H., 1968, Selected values of chemical thermodynamic properties:National Bureau of Stds. Tech. Note 270-3, 264 p.
White, D. E., Hem, J. D., and Waring, G. A., 1963, Chemical composition ofsubsurface waters, in Data of geochemistry [6th ed.]; U.S. Geol. SurveyProf. Paper 440-F, 67 p.
Wolff, R. G., 1967, Weathering of Woodstock granite near Baltimore, Maryland:Am. Jour. Sci., v. 265, p. 106-117.
Wollast, R., 1967, Kinetics of the alteration of K-feldspar in buffered solutionsat low temperature: Geochlm. et Cosmochim. Acta, v. 31, p. 635-648.
U.S. GOVERNMENT PRINTING OFFICE: 1973 O 476-920