Embed Size (px)
Citation preview
S W E D I S H C H E M I C A L S A G E N C Y
A Repor t f rom the Swedish Chemicals Agency www.kemi .se
ReportNr 5/10
Chemical industry from an economic perspective
Development trends in the world, the EU and Sweden in 2010

Chemical industry from an economic perspectiveDevelopment trends in the world,
the EU and Sweden in 2010

ISSN: 0284-1185Order No. 360 994Stockholm, March 2011Publisher: Swedish Chemicals Agency©Order address: CM Gruppen, P.O. Box 11063, SE-161 11 Bromma, SwedenPhone: +46 8 5059 33 35, Fax +46 8 5059 33 99, E-mail: [email protected] report is available as a downloadable pdf on www.kemikalieinspektionen.se

Preface The chemical industry around the world is becoming increasingly international in character. The challenges facing the control of chemicals are becoming more complex and increasingly necessitate international cooperation. Alongside knowledge of the inherent properties of chemicals and the risks they pose, we also need to understand the market conditions of the chemical industry. The Swedish Chemicals Agency has observed a need to clarify what development trends prevail in order to obtain a basis for understanding what can be expected in the future. This report has been produced as part of business intelligence, and we hope that it can prove of benefit to people who have an interest in control of chemicals in various functions.
The report has been written by Lars Drake, scientific adviser on economics. This report is a translation of the Swedish Rapport 2/10. Several people at the Swedish Chemicals Agency have made contributions of various kinds. Valuable opinions have also been expressed by Michael Reineskog (Swedish Plastics and Chemicals Federation), Viveka Palm (Statistics Sweden) and Andreas Prevodnik (Swedish Society for Nature Conservation).

Contents Summary .................................................................................................................................... 7
Sammanfattning ......................................................................................................................... 9
1. Introduction ................................................................................................................... 111.1 Background ................................................................................................................... 111.2 Purpose .......................................................................................................................... 111.3 Arrangements and limitations ....................................................................................... 12
2. Historical development – the long-term perspective ..................................................... 12
3. Development and conditions internationally ................................................................. 13
4. Development and conditions in the EU ......................................................................... 18
5. Development and conditions Sweden ........................................................................... 225.1 Economic development ................................................................................................. 225.2 Number and quantity of produced and imported substances and products ................... 245.3 Sub-sectors .................................................................................................................... 295.4 Chemicals in articles ..................................................................................................... 31
6. Costs of chemicals policy compared with turnover etc. ................................................ 32
7. Forecasts for the development of the chemical industry ............................................... 337.1 Forecast for the chemical industry in the world ............................................................ 337.2 Forecast for the EU chemical industry .......................................................................... 347.3 Forecast for the Swedish chemical industry .................................................................. 35
8. Summary and consequences for Swedish work with chemicals ................................... 368.1 Summarising assessment of conditions and trends ....................................................... 368.2 Policy implications ........................................................................................................ 36
Glossary and abbreviations ...................................................................................................... 40
References and sources ............................................................................................................ 41
7
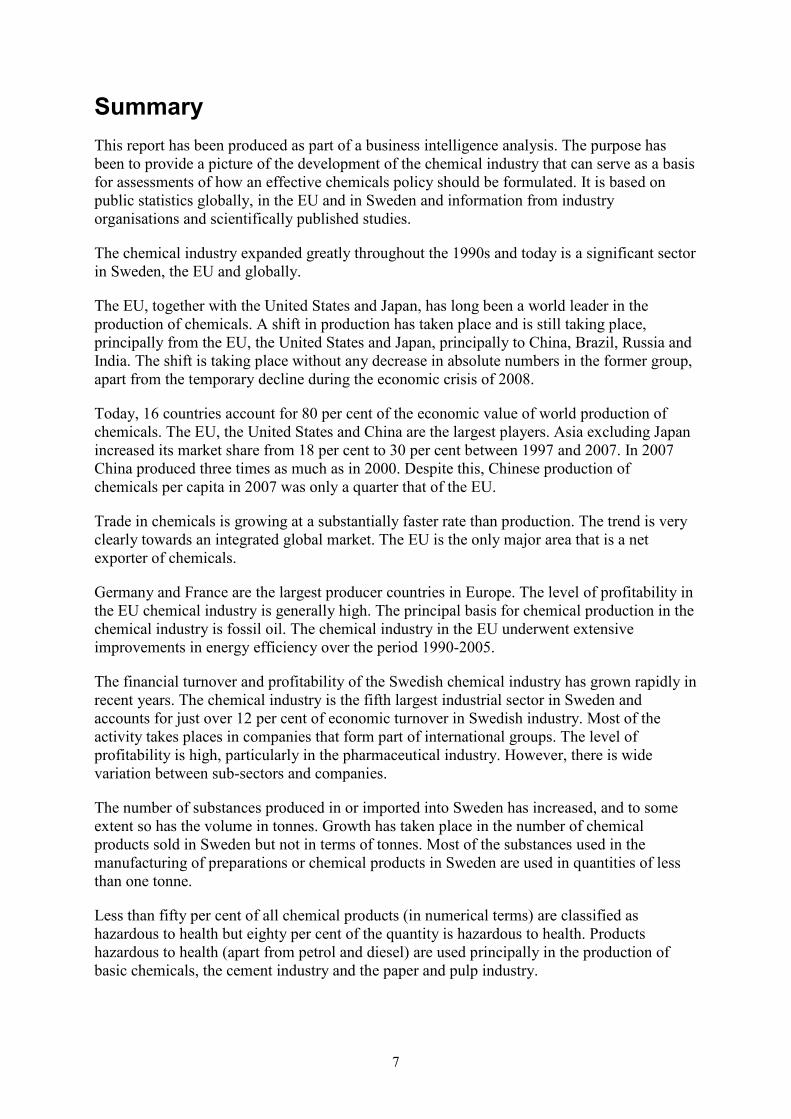
Summary This report has been produced as part of a business intelligence analysis. The purpose has been to provide a picture of the development of the chemical industry that can serve as a basis for assessments of how an effective chemicals policy should be formulated. It is based on public statistics globally, in the EU and in Sweden and information from industry organisations and scientifically published studies.
The chemical industry expanded greatly throughout the 1990s and today is a significant sector in Sweden, the EU and globally.
The EU, together with the United States and Japan, has long been a world leader in the production of chemicals. A shift in production has taken place and is still taking place, principally from the EU, the United States and Japan, principally to China, Brazil, Russia and India. The shift is taking place without any decrease in absolute numbers in the former group, apart from the temporary decline during the economic crisis of 2008.
Today, 16 countries account for 80 per cent of the economic value of world production of chemicals. The EU, the United States and China are the largest players. Asia excluding Japan increased its market share from 18 per cent to 30 per cent between 1997 and 2007. In 2007 China produced three times as much as in 2000. Despite this, Chinese production of chemicals per capita in 2007 was only a quarter that of the EU.
Trade in chemicals is growing at a substantially faster rate than production. The trend is very clearly towards an integrated global market. The EU is the only major area that is a net exporter of chemicals.
Germany and France are the largest producer countries in Europe. The level of profitability in the EU chemical industry is generally high. The principal basis for chemical production in the chemical industry is fossil oil. The chemical industry in the EU underwent extensive improvements in energy efficiency over the period 1990-2005.
The financial turnover and profitability of the Swedish chemical industry has grown rapidly in recent years. The chemical industry is the fifth largest industrial sector in Sweden and accounts for just over 12 per cent of economic turnover in Swedish industry. Most of the activity takes places in companies that form part of international groups. The level of profitability is high, particularly in the pharmaceutical industry. However, there is wide variation between sub-sectors and companies.
The number of substances produced in or imported into Sweden has increased, and to some extent so has the volume in tonnes. Growth has taken place in the number of chemical products sold in Sweden but not in terms of tonnes. Most of the substances used in the manufacturing of preparations or chemical products in Sweden are used in quantities of less than one tonne.
Less than fifty per cent of all chemical products (in numerical terms) are classified as hazardous to health but eighty per cent of the quantity is hazardous to health. Products hazardous to health (apart from petrol and diesel) are used principally in the production of basic chemicals, the cement industry and the paper and pulp industry.

8
The cost of the requirements imposed on the chemical industry to date represents a very small proportion of the economic turnover of this industrial sector. The cost may, however, be relatively large for individual companies.
Growth in the chemical industry globally is expected to increase over the next few years. In the longer term, competition from China and India and other countries might create such problems for the competitiveness of the Swedish and European chemical industry, particularly with regard to basic chemicals, that production decreases in absolute terms. The economic crisis of 2008 hit the EU chemical industry hard, but the trend has turned. It is anticipated that the EU will remain a very important player in the international chemicals market. Its global market share will, however, probably continue to decline.
An overarching conclusion is that the problems are becoming more complex over the course of time. The number of substances and uses is increasing. Patterns of production and trade are also becoming more complex. Although our knowledge is increasing, conditions are becoming more difficult to manage.
At the same time it is becoming increasingly necessary to deal with issues at the international level, which is obviously more difficult than doing so in an individual country or in the EU. This is counteracted to some extent by the awareness of the need for action to reduce the risks posed by chemicals to health and the environment is increasing over the course of time. It can be said that society is facing a dual challenge in its efforts to bring about better control of chemicals.
9
Sammanfattning Denna rapport har tagits fram som en del av en omvärldsanalys. Syftet har varit att ge en bild av utvecklingen i kemiindustrin som kan utgöra ett underlag för bedömningar om hur en effektiv kemikaliepolitik bör vara utformad. Den bygger på offentlig statistik globalt, i EU och i Sverige samt information från branschorganisationer och vetenskapligt publicerade arbeten.
Kemisk industri har expanderat kraftigt under hela 1900-talet och är idag en betydelsefull industribransch i Sverige, EU och globalt.
EU har under lång tid, tillsammans med USA och Japan, varit världsledande inom kemikalieproduktion. Det har pågått och pågår en förskjutning av produktionen från främst EU, USA och Japan till främst Kina, Brasilien, Ryssland och Indien. Förskjutningen sker utan någon minskning i absoluta tal i den förstnämnda gruppen, bortsett från den tillfälliga nedgången under den ekonomiska krisen 2008.
Idag står 16 länder för 80 procent av det ekonomiska värdet av världens kemikalieproduktion. EU, USA och Kina är de största aktörerna. Asien utom Japan har ökat sin marknadsandel från 18 procent till 30 procent mellan 1997 och 2007. År 2007 producerade Kina tre gånger så mycket som 2000. Trots det var Kinas kemikalieproduktion per capita 2007 endast en fjärdedel av EU:s.
Handeln med kemikalier tillväxer väsentligt fortare än produktionen. Utvecklingen går mycket tydligt mot en integrerad global marknad. EU är det enda större område som är nettoexportör av kemikalier.
Tyskland och Frankrike är i Europa de största producentländerna. Lönsamheten i EU:s kemiindustri är generellt sett hög. Den främsta basen för kemikalieproduktionen i kemiindustrin är fossil olja. Kemisk industri i EU har genomgått en omfattande energieffektivisering under perioden 1990-2005.
Den svenska kemiindustrins ekonomiska omsättning och lönsamhet har utvecklats snabbt under senare år. Kemiindustrin är Sveriges femte största industrisektor och står för drygt 12 procent av den ekonomiska omsättningen i svensk industri. Huvuddelen av verksamheten utförs i företag som ingår i internationella koncerner. Lönsamheten är hög, särskilt i läkemedelsindustrin. Spridningen mellan delbranscher och företag är dock stor.
Antalet ämnen som produceras i eller importeras till Sverige har ökat och i viss mån även volymen i ton. För kemiska produkter som säljs i Sverige har det skett en tillväxt i antal produkter men inte mätt i ton. De flesta ämnen som används vid tillverkning av beredningar eller kemiska produkter i Sverige används i mängder under ett ton.
Mindre än femtio procent av alla kemiska produkter (antal) är klassade som hälsofarliga men åttio procent av kvantiteten är hälsofarlig. Hälsofarliga produkter (utöver bensin och diesel) används främst i produktion av baskemikalier, cementindustri och pappers- och massaindustri.
Kostnaden för de krav som hittills ställts på kemiindustrin utgör en mycket liten del av denna industrigrens ekonomiska omsättning. För enskilda företag kan kostnaden dock ha varit relativt stor.

10
Tillväxten i kemiindustrin globalt förväntas öka de närmaste åren. På längre sikt skulle konkurrens från Kina och Indien m.fl. länder kunna skapa sådana problem för svensk och europeisk kemisk industris konkurrenskraft, särskilt avseende baskemikalier, att produktionen minskar i absoluta tal. Den ekonomiska krisen 2008 drabbade EU:s kemiindustri hårt men utvecklingen har vänt. Bedömningen är att EU kommer att förbli en mycket viktig aktör på den internationella kemikaliemarknaden. Dess marknadsandel globalt kommer dock sannolikt att fortsätta att minska.
En övergripande slutsats är att problemen blir mer komplexa över tiden. Det blir fler ämnen och fler användningsområden. Produktions- och handelsmönstren blir också mer komplicerade. Vår kunskap ökar förvisso men förhållandena blir trots det mer svårhanterliga.
Det blir samtidigt i ökande omfattning nödvändigt att hantera frågorna på internationell nivå vilket naturligtvis är svårare än att göra det i ett enskilt land eller EU. Detta motverkas i viss mån av att insikten om behovet av åtgärder för att minska hälso- och miljöriskerna med kemikalier ökar över tiden. Man kan säga att samhället står inför en dubbel utmaning i arbetet för en bättre kemikaliekontroll.

11
1. Introduction 1.1 Background
The responsibilities of the Swedish Chemicals Agency (KemI) include efforts by society to reduce the health and environmental risks associated with increasing production, consumption and trade in chemicals and articles that contain or have been treated with hazardous chemical substances or chemical products. To accomplish these tasks there is obviously a need for knowledge of chemicals and policy instruments to reduce risks that have arisen, but there is also a need for knowledge of the economic conditions and development of production, consumption and trade.
The chemical industry is an economically significant part of the whole industry in the world, in the EU and in Sweden. Its products are of great significance to our prosperity, but several substances also lead to significant adverse effects on health and the environment. It is estimated that adequate knowledge is lacking on around 86 per cent of the approximately 2-3,000 high-volume substances. For the other approximately 30,000 substances manufactured or imported in volumes of more than 1 tonne per company, the shortage of knowledge is probably even greater (Allanou et al 2003). The EU’s new chemicals legislation (REACH) puts great emphasis on companies having to establish knowledge on the properties of substances. For some substances, limitation efforts have led to a decrease in dispersal and concentration in nature in Europe. However, concentrations for some substances are still so high as to pose a risk. The knowledge on the properties of substances that exists is linked to individual substances, but the exposure is made up of a complex mix of substances, which makes it substantially more difficult to assess risks (KemI 2010).
The pace of technical development is rapid, and great structural changes are in progress, for example the rapid increase in production in China and other countries which is leading to a decline in the market shares of the EU and the United States.
Insights into the economic and other conditions of the chemical industry and development trends in the sector are important for a large number of players in Sweden. In connection with the development and introduction of the new European chemicals legislation REACH, and other legislation in the area of chemicals, it is important to understand the conditions in industry. It is also useful to know what shifts are taking place between the countries of the world in order to be able to set suitable priorities and pursue successful work on chemicals in international forums.
With the introduction of REACH, a major change is taking place in the distribution of roles through industry taking greater responsibility for risk reduction and information on chemicals. However, this does not signify any reduction in the need to understand conditions in the chemical industry.
1.2 Purpose
The purpose of this report is to collate statistics and other information that can provide insights into development in the chemical industry and provide a basis for assessments of how chemicals policy should be formulated to be effective.
12
This report is primarily aimed at persons who work on chemicals control in government agencies, companies and environmental organisations.
1.3 Arrangements and limitations
Chapter 2 presents an overarching description of development during the 20th century. It is principally the Swedish chemical industry that is discussed. Chapters 3-5 discuss development between 1990 and 2009 for the world, the EU and Sweden respectively. Chapter 5 also contains a discussion of substances, products and chemicals in articles. Chapter 6 presents an account of the costs and benefits of chemicals control. Chapter 7 describes projections for development over the next ten to twenty years. The concluding chapter presents an overarching summary of the results and discusses their implications for how chemicals control should be pursued and developed.
This document is concerned with what is normally classified as the chemical industry in general statistics, that is to say principally the industrial production of chemicals and input materials and consumer products directly based on such substances. It is principally mixtures of different chemicals that are concerned. Note that materials used as fuel, for example coal, oil or biogas, are not classified as chemical industry products. Nor are refineries included. When fossil raw materials are used to produce plastic and other products, on the other hand, they are included. Pharmaceuticals are often included in statistics on the chemical industry, but far from always. Pharmaceuticals are included in this report unless otherwise stated. Several other industrial sectors, such as mining and the pulp industry, produce chemicals but are not included in the concept of the chemical industry and are therefore not considered in this document. Note that Section 5.2 is based on data from the Swedish Product Register, which does not correspond to domestic production. Section 5.3 is concerned with chemicals in articles, which is a broader approach than in the rest of the document.
2. Historical development – the long-term perspective In brief The chemical industry in Sweden and in the world underwent very rapid development during the 20th century. The chemical industry accounts for just over 12 per cent of economic turnover in Swedish industry.
The production of chemicals and the chemical industry globally have grown sharply in the past 50 years. Annual world production of chemical substances increased during the second half of the 20th century from around 7 million tonnes per year to around 400 million tonnes per year (1950-2000, European Commission 2001). This is equivalent to a 57 times increase.
Viewed in a hundred-year perspective, the chemical industry in Sweden has undergone exceptionally rapid development. The size of the chemical industry increased from SEK 2.8bn in 1900 to SEK 26.6bn in 1950 and SEK 187bn in 2000 (adjusted for inflation to 2000 prices, calculated according to Edvinsson). The production of chemicals was thus worth 66 times more in 2000 than in 1900. All industry and trades increased 19 times in terms of value over the same period.
The chemical industry accounted for around 3 per cent of financial turnover for all industry and trades in Sweden throughout the 19th century. In 1950 this proportion was just over 6 per

13
cent, and by 2000 it had increased to over 12 per cent (calculated according to Edvinsson). This increase in proportion took place alongside a massive increase in the engineering industry. The relative increase took place principally at the expense of food production. These figures cannot be directly compared with those in Chapter 5, as “industry and trades” in these historical data do not exactly correspond to “total industry”.
Development in the chemical industry is highly dependent on knowledge. A special high-technology sub-sector is pharmaceuticals, which also accounts for a large and increasing share of economic turnover in the Swedish chemical industry. The proportion of expenditure on research is approximately twice as high in the chemical industry as in industry as a whole. Pharmaceuticals account for a large share of this expenditure (Swedish Plastics and Chemicals Federation 2006).
In addition, a few hundred new substances come onto the market every year (KemI 2009b, EU 2004). Industrially produced chemicals are used for the manufacturing of a huge number of articles. The computer industry, which has transformed society in recent years, could not have been developed if the chemical industry had not provided certain new chemicals for example for processes for the manufacturing of computer chips. (American Chemistry Council 2004, Figure 1.2).
3. Development and conditions internationally In brief Sixteen countries account for 80 per cent of world production of chemicals. The EU, the United States and China are the largest players. Asia excluding Japan increased its market share from 18 per cent to 30 per cent between 1997 and 2007. In 2007 China produced three times as much as in 2000. Despite this, Chinese production per capita in 2007 was only a quarter that of the EU.
The production of chemicals in the world in 2007 was valued at EUR 1800 billion (CEFIC 2009b). The number of employees was over 10 million (OECD 2001). Production was shared between important areas/countries as shown in the table below.
Table 1. Value of production of chemicals in some countries and groups of countries in 2007 (EUR billion).
EU -27 531 United States 405 Japan 136 China 275 Rest of Asia 279 Latin America 90 Rest of Europe 63 Other 35 Source: CEFIC 2009b.

14
Diagram 1. Relative breakdown of production value for production of chemicals in some countries and groups of countries in 2007.
Source: CEFIC 2009b, own processing.
The sixteen countries with the greatest production accounted for 80 per cent of all world production according to the OECD’s Global Outlook 2001. These countries were the United States, Japan, Germany, China, France, the United Kingdom, Italy, South Korea, Brazil, Belgium/Luxembourg, Spain, the Netherlands, Taiwan, Switzerland and Russia. It can be seen that a large proportion of these countries are Member States of the EU.
The significance of the chemical industry in the international economy is even greater than these figures show, as chemicals are important components in a large proportion of the articles produces in other industries.
Annual growth in the world chemical industry was 4.6 per cent over the period 2002-2007, which can be compared with growth for industry in general of 4.8 per cent. Growth rates in various parts of the world over the same period were EU 1.7, NAFTA 2.2, Latin America 4.5 and ASEAN 8.1 per cent (CEDFIC 2009b). Asia outside Japan increased its market share from 18 per cent to 30 per cent during the period 1997-2007, a surprisingly rapid rate of growth over this ten-year period.
In the first few years of the 21st century around a third of all chemicals produced were exported to some other country (Frost and Sullivan 2004). The International Council of Chemical Associations estimates that 45 per cent of all production was exported in 2007. The proportion of international trade that takes place within companies is more than a third (ICCA 2009). This indicates that a large proportion of chemical production in the world today is undertaken within large and well-integrated companies/groups which primarily act on one market, the international market. The share of the chemical industry in international trade is as high as 11 per cent. It is the third largest sector in a breakdown into 14 sectors (CEFIC
EU-27
USA
Japan
China
Rest of Asia
Latin America
Rest of Europé
Other

15
2009b). The EU today is the only net exporter, while the United States, for example went from being a net exporter to a net importer in 2002 (American Chemistry Council 2004). International trade in chemicals is growing more rapidly than production. Between 2006 and 2007 alone, international trade increased by ten per cent.
One of the most significant trends today is for China, Brazil, Russia and India and a few other countries to expand more rapidly than the EU, the United States and Japan, which previously were completely dominant in the world market for chemicals (UN database, CEFIC 2009b). The new competition was at first noticed principally in bulk production of known compounds, particularly basic chemicals. The knowledge element has been strengthened over the years. This estimate is based on experiences of industrial development in Japan after the Second World War and later in for instance South Korea. The competitive advantage of low wages is first utilised and labour is used in simple production, then increasingly advanced products are made and far later a commitment is made to the country’s own product development and research. This reflects a pattern where more complicated tasks can be performed at earlier stages in individual cases.
Russia has been technically advanced over a longer period, but its change of political system resulted in a decline in production in the 1990s, a decline which the country is now reversing. China, India and other countries are now undergoing a process which in several ways resembles that which Japan and South Korea underwent earlier. In the future we will probably also see such processes in several African and other countries which today are not important players in the world markets for chemicals and industrial products. At first it may be companies in industrialised countries that transfer their production to the newly industrialised companies, but there will gradually be more and more domestic companies undertaking their own production. The production of active substances for pharmaceuticals that are no longer protected by patents has already to a great extent been moved to India and China. As an example of the trend not being purely linear, it may be mentioned that the Indian pharmaceutical company has set up in Uppsala, Sweden, probably in order to utilise the expertise that is present there (UNT 19.5.2010).
It may be of interest to note that it is not primarily high labour costs that mean that the production of basic chemicals first moves from the rich countries with established production. According to an American study comparing the cost breakdown between basic chemicals, specialty chemicals, pharmaceuticals and consumer products, there are no great differences in how large a proportion goes on wages in production (American Chemistry Council 2004). The greatest difference is that energy and the material costs are higher and marketing/selling costs lower for basic chemicals. In addition, the profit margin, which is linked to the degree of monopolisation/patent protection, is lower, which means that capital with alternative uses tends to abandon the production of basic chemicals. A circumstance which, as well as the quantity of patents, suggests a relatively high degree of monopolisation is that 60 per cent of the number of substances in the 10-100 and 100-1000 tonne weight categories which in 2004 were estimated in 2004 to be in the EU were only produced or imported by one company (European Commission 2004). This does not mean that low-wage countries do not utilise their relative advantages with low wages. This is a crucial factor in transferring production, but it is probably weak profitability and the relative simplicity of production that cause the production of basic chemicals to be transferred earlier than more advanced production.
Analysis of the cost breakdown for the various principal parts of the Swedish chemical industry in 2007 shows that pharmaceuticals, and to some extent also the category of other chemical industry, has a higher proportion of expenditure on labour than the chemical

16
industry as a whole (Statistics Sweden database). This, together with the fact that basic chemicals are decreasing and pharmaceuticals are increasing in Sweden, supports the argument above that the proportion of expenditure on labour does not dictate the move away but rather the simplicity of production.
In some cases the poorer control of chemicals, and therefore lower costs, in newly industrialised countries have been a more or less strong contributory factor behind the transfer of production, but in most cases it has not been a decisive driver.
Table 2. Turnover of the chemical industry in the BRIICS countries in 2000 and 2007.
EUR millions and percentage increase.
2000 2007 Increase in %
2000-2007
China 91 450 274 591 200
Brazil 38 096 62 865 65
India 30 547 46 553 52
Russia 9 458 22 939 143
Indonesia 6 700 10 866 62
South Africa 7 012 9 797 40
Total 183 263 427 611 133
Source: ICCA 2009.
Production in economic terms has increased by 133 per cent in the BRIICS countries. China has increased by 200 per cent and Russia by 143 per cent, and the other BRIICS countries by between 40 and 65 per cent. Note that despite the rapid increase, production per capita is approximately four times higher in the EU than in China.
17
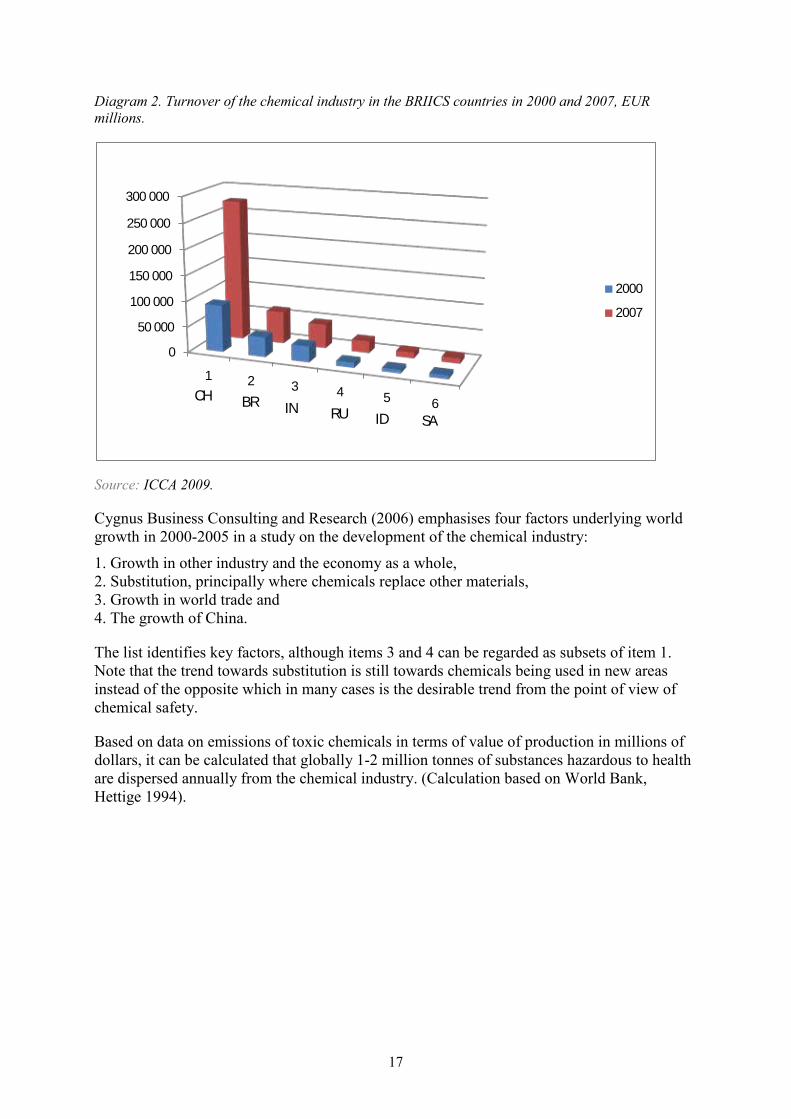
Diagram 2. Turnover of the chemical industry in the BRIICS countries in 2000 and 2007, EUR millions.
Source: ICCA 2009.
Cygnus Business Consulting and Research (2006) emphasises four factors underlying world growth in 2000-2005 in a study on the development of the chemical industry:
1. Growth in other industry and the economy as a whole, 2. Substitution, principally where chemicals replace other materials, 3. Growth in world trade and 4. The growth of China.
The list identifies key factors, although items 3 and 4 can be regarded as subsets of item 1. Note that the trend towards substitution is still towards chemicals being used in new areas instead of the opposite which in many cases is the desirable trend from the point of view of chemical safety.
Based on data on emissions of toxic chemicals in terms of value of production in millions of dollars, it can be calculated that globally 1-2 million tonnes of substances hazardous to health are dispersed annually from the chemical industry. (Calculation based on World Bank, Hettige 1994).
0
50 000
100 000
150 000
200 000
250 000
300 000
1 2 3 4 5 6
2000
2007
CH BR IN RU ID SA

18
4. Development and conditions in the EU In brief The EU is the only major country/area that is a net exporter of chemicals. Germany and France are the largest producer countries in Europe. The level of profitability in the EU chemical industry is high. The principal basis for production of chemicals is fossil oil. The chemical industry in the EU underwent extensive improvements in energy efficiency over the period 1990-2005.
The chemical industry in the EU in 2009 consisted of 29,000 companies which employed 1.84 million people or 6 per cent of the number of employees in manufacturing industry. Aggregate economic turnover was EUR 531bn (CEFIC 2009b).
The EU is the principal player in the world market for chemicals and the only major country/area that is a net exporter. The chemical industry’s share of EU total exports is more than twice as high as its share of production. The chemical industry’s share of EU total imports is around 80 per cent higher than its share of production (Frost and Sullivan 2004). This indicates that the chemical industry is more dependent on international markets than industry in general.
There are all types of chemical production in the EU. The European Commission estimates that in the EU market there are around 30,000 substances that are either manufactured or imported in quantities in excess of one tonne per year. Of these, fewer than 1,500 have been tested and assessed in any detail with regard to effects on health and the environment.
Among the individual Member States of the EU, Germany is the largest producer country. Other important producer countries are France, Italy and the United Kingdom. The ten largest producer countries in the EU-27 in 2005 are shown in the table below. The aggregate value of turnover in these ten countries is equivalent to 92.5 per cent of the value in the EU-27. The four largest producer countries account for 64 per cent of total EU production.
Table 3. Turnover for the chemical industry in 2005 in the ten largest producer countries (EUR million, per cent of EU-27, population and EUR per capita).
Country EUR million Percentage of EU-27 Population EUR per capita Germany 154428 23.4 82.3 1876 France 119074 18.1 61.5 1936 Italy 74839 11.4 59.1 1266 United Kingdom
73450 11.2 60.9 1206
Netherlands 49860 7.6 16.4 3040 Spain 44325 6.7 44.5 996 Belgium 35609 5.4 10.6 3359 Ireland 30593 4.6 4.3 7115 Sweden 14576 2.2 9.1 1602 Poland 12427 1.9 38.1 326 EU -27 658589 100 495.1 1330
Source: Eurostat 2009.
It is striking that half of the countries are between one and two thousand EUR per capita. Only three countries are higher, with Ireland as an outlier with EUR 7115 per capita. Poland is very low with EUR 326 per capita, i.e. at just over a quarter of the EU-27 average of EUR 1330 per capita. However, a comparison based on production of chemicals per GDP unit

19
would give Poland a relatively higher value. It may be interesting to note that Sweden is above the EU average of EUR 1330, but both the United Kingdom and Italy, which are among the very largest producer countries, are below it.
Diagram 3. Turnover for the chemical industry in 2005 in the ten largest producer countries (proportion of EU-27 and EUR 10,000 per capita).
Source: Eurostat 2009, own processing.
Total use of energy carriers (oil, gas, electricity, heat, coal, renewable and other, calculated as oil equivalents) in the EU chemical industry was 137 million tonnes. 59 per cent was used as a basis for production of chemicals and 41 per cent to run processes, heat premises etc. Gas and electricity (note that the electricity may have been produced with coal or other fossil fuel) are the principal sources of energy, and oil is the completely dominant basis for production of chemicals. Only 10 per cent of the oil was used for energy conversion (running processes etc.). Renewable energy accounted for just over one-thousandth of total consumption. Production based on biologically produced raw materials for the time being does not have any impact on statistics at EU level (in Sweden it probably represents a somewhat larger share). (calculated from CEFIC 2009b). The EU chemical industry has been very successful with regard to energy efficiency both in absolute terms and in comparison with the United States. Over the period 1990-2005 chemical production in the EU increased by 50 per cent while energy use fell by 29 per cent (CEFIC 2009b). This is impressive, although part of the improvement is due to a relatively reduced share of energy-demanding production of basic chemicals. Most can be assumed to be genuine efficiency improvements.
0,00
0,10
0,20
0,30
0,40
0,50
0,60
0,70
0,80
1 2 3 4 5 6 7 8 9 10
proportion of EU27
prod/capita 10000€
DE FR IT UK NL ES BE IE SE PL Ranking

20
Diagram 4. Use of energy carriers for energy purposes.
Source: calculated from CEFIC 2009b.
Diagram 5. Use of energy carriers as input material (raw material) in the production of chemicals.
Source: calculated from CEFIC 2009b.
oil
gas
electricity
heat
coal
renewable
other
oil
gas
electricity
heat
coal
renewable
other
21
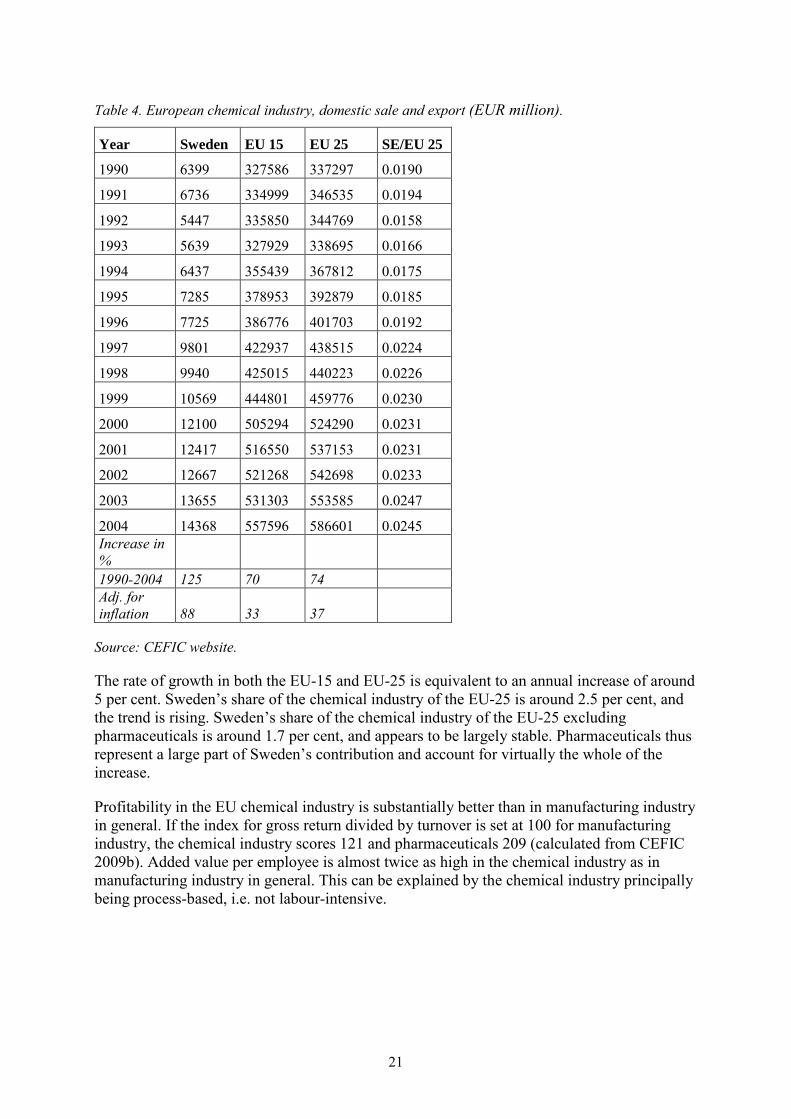
Table 4. European chemical industry, domestic sale and export (EUR million).
Year Sweden EU 15 EU 25 SE/EU 25 1990 6399 327586 337297 0.0190 1991 6736 334999 346535 0.0194 1992 5447 335850 344769 0.0158 1993 5639 327929 338695 0.0166 1994 6437 355439 367812 0.0175 1995 7285 378953 392879 0.0185 1996 7725 386776 401703 0.0192 1997 9801 422937 438515 0.0224 1998 9940 425015 440223 0.0226 1999 10569 444801 459776 0.0230 2000 12100 505294 524290 0.0231 2001 12417 516550 537153 0.0231 2002 12667 521268 542698 0.0233 2003 13655 531303 553585 0.0247 2004 14368 557596 586601 0.0245 Increase in % 1990-2004 125 70 74 Adj. for inflation 88 33 37
Source: CEFIC website.
The rate of growth in both the EU-15 and EU-25 is equivalent to an annual increase of around 5 per cent. Sweden’s share of the chemical industry of the EU-25 is around 2.5 per cent, and the trend is rising. Sweden’s share of the chemical industry of the EU-25 excluding pharmaceuticals is around 1.7 per cent, and appears to be largely stable. Pharmaceuticals thus represent a large part of Sweden’s contribution and account for virtually the whole of the increase.
Profitability in the EU chemical industry is substantially better than in manufacturing industry in general. If the index for gross return divided by turnover is set at 100 for manufacturing industry, the chemical industry scores 121 and pharmaceuticals 209 (calculated from CEFIC 2009b). Added value per employee is almost twice as high in the chemical industry as in manufacturing industry in general. This can be explained by the chemical industry principally being process-based, i.e. not labour-intensive.

22
Table 5. European chemical industry (excl. pharmaceuticals) EUR million.
Year Sweden EU 15 EU 25 1997 5820 328316 340463 1998 5645 320155 331900 1999 5577 329844 341477 2000 7024 386362 401445 2001 7075 390207 406321 2002 6917 393943 410523 2003 6953 397809 414936
Source: CEFIC website 2006.
5. Development and conditions Sweden 5.1 Economic development In brief The chemical industry is Sweden’s fifth largest industrial sector. Most of the activity takes places in companies that form part of international groups. Profitability is high, particularly in the pharmaceutical industry. However, there is a wide spread between sub-sectors and companies.
The chemical industry came fifth within manufacturing industry in 2009 in a breakdown into eleven sectors. The largest was the engineering industry (including automotive manufacturing), the paper and pulp industries, steel mills and metalworks and the pharmaceutical industry (Statistics Sweden 2009).
The large chemicals-producing companies active in Sweden have been independent companies that have based their operations on Swedish development activity, but today they form part of international groups. The largest companies in pharmaceuticals are AstraZeneca, Pfizer and Ferring AB (Swedish Plastics and Chemicals Federation 2006). Akzo Nobel and Hydro AS are important companies in general chemicals.
The rate of economic growth for the Swedish chemical industry in 1997-2003 came second after automotive manufacturing. It is the pharmaceutical industry in particular that is expanding. The comparison is based on the Statistics Sweden classification of 23 industrial sectors (Statistics Sweden 2005, Table 171). The chemical industry has also expanded in relation to other industry in Sweden in a longer-term perspective. This differs from the trends internationally during the past decade. In general terms, the chemical industry is sensitive to economic climate to approximately the same extent as other Swedish industry.
Inflation was low during the years after 1990. Consumer prices rose by 5.8 per cent between 1997 and 2002, and producer prices for the chemical industry rose by 8 per cent. During the period from 1990 to 2004 consumer prices rose by 34.4 per cent and producer prices in the chemical industry by 37.7 per cent. The rates based on change in current prices should be primarily of interest in comparison with each other, i.e. what is increasing more or less, not how much it is increasing in absolute terms. Rates adjusted for inflation have also been calculated based on the change in product price index for the chemical industry.

23
Net turnover in the chemical industry in Sweden increased by 30 per cent between 1997 and 2002, which is equivalent to an annual increase of 5 per cent (see Table 1). Costs of raw materials etc. also increased by 30 per cent and wage costs increased almost as quickly, by 28 per cent. The proportion of wage costs remained steady during a period in which pay for industrial workers increased by around 22 per cent (cf. 8 per cent increase in product prices), which reflects the decrease in the number of employees per SEK of turnover. The number of employees has even decreased somewhat in absolute terms, despite the economic expansion up to 2007.
Operating profit in the Swedish chemical industry increased by 120 per cent over the period from 1997 to 2002. Operating profit as a proportion of total turnover increased by 66 per cent over the same period. This signifies rapid growth for the chemical industry and particularly rapid growth in profitability for pharmaceuticals. Profits from financial investments varied sharply and affected profitability in 1999 and 2000. This is, however, less important in this context as it does not reflect production conditions in the Swedish chemical industry.
Table 6. Chemical industry, income statement 1997-2007.
1997 2002 2007
Percentage increase 97-07 Infl. adj.
Net turnover excl. excise duties 84831 116710 140385 65 36
Other operating income 5385 10911 16849
Goods for resale, raw materials and consumables, other external costs -59903 -74120 -94238 57 29
Personnel expenses -16555 -22510 -24439 47 21
Depreciation and writedowns (incl. reversal thereof) of tangible/intangible assets -4415 -7350 -6752
Other operating expenses -676 -1919
Operating profit 9608 21881 30082 213 157
Operating profit/net turnover 0.113 0.187 0.214
Company statistics, SEK million, sector according to SNI92. Figures for 1997, revised 25.06.2003. Source: Statistics 2005 and 2009, Swedish National Accounts, own calculations.
The rate of return on total investments in 2006 for the chemical industry as a whole was 8.0 per cent, for the chemical industry excluding pharmaceuticals 7.8 per cent and for pharmaceuticals 9.8 per cent. Note that these are median vales (Statistics Sweden database). As in the conditions described above for the EU, it is found that pharmaceuticals are the most profitable part of the chemical industry.

24
5.2 Number and quantity of produced and imported substances and products1
In brief
Most of the substances used in the manufacturing of preparations or chemical products in Sweden are used in quantities of less than one tonne. Income in the Swedish chemical industry increased at twice the rate of the number of products. Less than fifty per cent of all chemical products (in numerical terms) are classified as hazardous to health but eighty per cent of the quantity is hazardous to health. Products hazardous to health (apart from petrol and diesel) are used principally in the production of basic chemicals, the cement industry and the paper and pulp industry.
Note that what is sold in Sweden is presented under this heading. It is based on figures supplied by companies to the Product Register regarding production and imports. In 2007 there were around 2,900 companies that were manufacturers or importers of chemicals in Sweden. All companies that import or manufacture chemical products in a quantity of more than 100 kg during a year have to notify this to the Product Register. (KemI 2009).
The number of substances produced in and imported into Sweden on the Swedish market increased by 64 per cent between 1993 and 2005. The proportion in the group of less than one tonne increased while proportions in the other weight categories decreased. The quantity in tonnes has consequently increased at a lower rate than the number of chemicals. The information supplied to the Product Register improved over the period, so that the number of chemicals and the calculated quantity have probably not increased by as much as 64 per cent in reality.
The economic turnover and profitability are increasing at a far quicker rate than the number of chemicals and to a greater extent in comparison with the volume of chemicals used. This points to a shift towards specialty chemicals and to a greater degree of knowledge-based production. It is also shown by the fact that it is the low-volume chemicals that are growing at the fastest rate. This difference in trend has strengthened rather than weakened in recent years.
There are around 75,000 chemical products in the Product Register that are imported into or manufactured in Sweden every year. The companies have reported that these contain just under 14,000 different substances. Around a quarter of the substances are polymers.
1 This section is principally based on data from the Swedish Chemicals Agency’s Product Register, and parts of the text can be found at www.kemi.se.

25
Diagram 6. Numbers of substances in different quantities.
Source: Brief statistics, Product Register, KemI.
The number of substances notified as ingredients in chemical products is now increasing by a few hundred per year. This is probably largely due to increased knowledge among importers about what is contained in the products and not to so many new substances being introduced.
Very few large-quantity substances are added every year. Only 583 substances were imported or manufactured in volumes higher than 1,000 tonnes in Sweden in 2005. In the same year 7,505 substances were supplied in volumes of less than one tonne in chemical products.
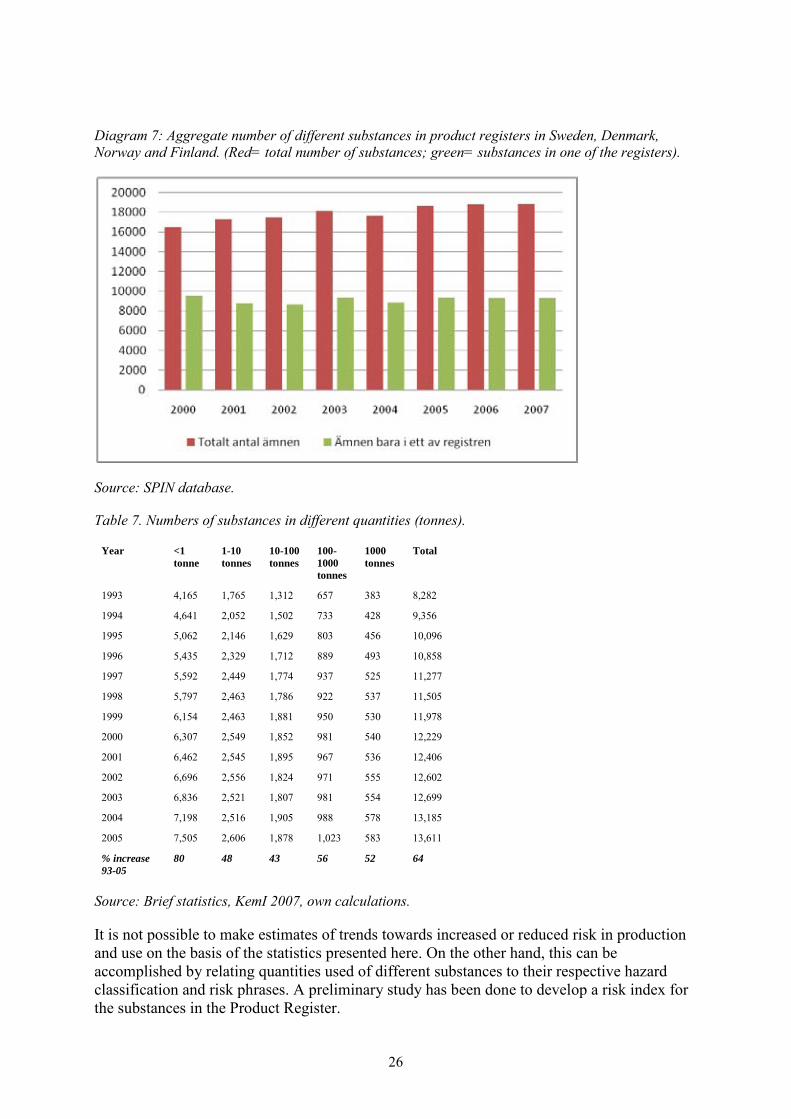
In a Nordic perspective, the number of registered substances increased by around 14 per cent over the period from 2000 to 2007 (see Diagram 4b). In 2007 there were 18,837 different substances in the four registers. Half of the substances are only to be found in one of the Nordic registers, which can be interpreted as meaning that product compositions between the countries show great differences. These unique substances are probably dominated by the low-quantity substances in the special areas. Differences in registration rules mean, however, that some of these unique substances are probably present in several countries but that they have not always been notified.
26
Diagram 7: Aggregate number of different substances in product registers in Sweden, Denmark, Norway and Finland. (Red= total number of substances; green= substances in one of the registers).
Source: SPIN database.
Table 7. Numbers of substances in different quantities (tonnes).
Year <1 tonne
1-10 tonnes
10-100 tonnes
100-1000 tonnes
1000 tonnes
Total
1993 4,165 1,765 1,312 657 383 8,282
1994 4,641 2,052 1,502 733 428 9,356
1995 5,062 2,146 1,629 803 456 10,096
1996 5,435 2,329 1,712 889 493 10,858
1997 5,592 2,449 1,774 937 525 11,277
1998 5,797 2,463 1,786 922 537 11,505
1999 6,154 2,463 1,881 950 530 11,978
2000 6,307 2,549 1,852 981 540 12,229
2001 6,462 2,545 1,895 967 536 12,406
2002 6,696 2,556 1,824 971 555 12,602
2003 6,836 2,521 1,807 981 554 12,699 2004 7,198 2,516 1,905 988 578 13,185 2005 7,505 2,606 1,878 1,023 583 13,611 % increase 93-05
80 48 43 56 52 64
Source: Brief statistics, KemI 2007, own calculations.
It is not possible to make estimates of trends towards increased or reduced risk in production and use on the basis of the statistics presented here. On the other hand, this can be accomplished by relating quantities used of different substances to their respective hazard classification and risk phrases. A preliminary study has been done to develop a risk index for the substances in the Product Register.

27
A risk index has been developed for active substances in plant protection products (KemI 2004). The trend for the period 1988-2007 points to decreasing environmental risks. The decrease for health risks over the same period was appreciable, particularly up to 1995 (KemI website). This is probably a consequence of extensive political control and voluntary efforts in the industry.
It is apparent from the Swedish Chemicals Agency’s Product Register that the number of products increased by a third over the period from 1996 to 2007, from 57,000 to 76,000. This is approximately half the increase that can be observed for turnover, i.e. income, despite the period being one year longer. This may be due to price rises, efficiency improvement and/or a shift from simple bulk products to specialty chemicals that are more expensive per tonne. The likelihood is that it is a combination.
Table 8. Chemical products in Sweden. Year Total number Total of products quantity number thousand tonnes 1996 57,100 73,200 1997 59,900 76,840 1997 61,800 75,400 1999 62,800 70,500 2000 64,900 74,600 2001 65,080 79,687 2002 66,093 70,351 2003 67,739 78,874 2004 69,344 84,298 2005 71,410 84,479 2006 72,343 85,112 2007 75,034 83,932 Increase from 1996 to 2007
31 % 15 %
Source: KemI 2009b.
The quantity fluctuated widely during the period in question, but the trend is for a slight increase. There may be minor changes in reporting by companies to the Register, but a large increase in volume is unlikely to have taken place in reality. The large quantities of petrol, diesel and heating oils mean that the aggregate quantity does not increase as much as a percentage as in terms of the number of products.
The breakdown between different hazard classes is shown in the table below. The non-hazardous products dominate in the total number of products, but the toxic ones dominate in terms of number of tonnes. It is striking that only one per cent of products available to consumers are classified as toxic, but that this one-hundredth of products accounts for 27 per cent of the quantity in tonnes. Petrol accounts for a large part of this 27 per cent.

28
Table 9. Number of products and quantity broken down by hazard class. Health hazard Total Total Number Quantity number of
products % quantity %
consumer-available prod. %
consumer-avail. %
Very toxic (T+) 0 0 0 0 Toxic (T) 3 51 1 27 Corrosive (C) 6 4 2 0 Irritant (Xi) 19 7 20 25 Harmful (Xn) 15 19 14 28 Moderately harmful (V) 1 1 2 2 Non-harmful products
55 18 62 18
Source: Overview of chemicals, KemI 2007.
Diagram 8. Breakdown of number of chemical products by hazard class.
Source: Brief statistics, KemI 2007. ((T+) Very toxic; (T) Toxic; (C) corrosive; (Xi) Irritant; (Xn) Harmful; (V) Moderately harmful; “Ej hälsofarligt” not hazardous to health.)
The use of hazard-classified chemicals is very unevenly distributed. The largest quantities of hazardous chemicals are used in: 1. production of basic chemicals, 2. manufacturing of non-metallic mineral products, and 3. the paper and pulp industries. These three sectors account for 65 per cent of total use. If synthetic chemicals are excepted, manufacturing of non-metallic mineral products becomes the largest user. (Palm and Carlsson 2003).

29
5.3 Sub-sectors
It is apparent from Table 10 that there has been considerable expansion in Sweden since 1990 particularly for pharmaceuticals, with a clear tailing-off after 2006. The change in comparison with 2000 can be directly read off in the table. The increase from 1990 was 140 per cent for the whole of the chemical industry. The chemical industry excluding pharmaceuticals only increased by 27 per cent, and in the periods 1990-1995 and 2000-2003 the trend was even negative. Pharmaceuticals increased by as much as 270 per cent over the period 1990-2008, showing how dominant this sub-sector had become for the trend.
Table 10. Industrial production index (IPI/PVI) (not calendar-corrected, 2000=100 by industry (SNI 2002) and time).
1990 1992 1994 1996 1998 2000 2002 2004 2006 2008
24 chemical industry
52 70.6 75.3 78.4 85.9 100 118 138 151 125
24.4 industry for pharmaceuticals, pharmaceutical chemicals and botanic products 36 61.7 71.3 78.4 86.5 100 134 162 178 134
24 excl. 24.4. chemical industry excl. pharmaceutical industry etc. 84.1 83.2 79.9 77.9 84.5 100 93.8 101 110 107
Source: Statistics Sweden 2009.
Comparisons on the basis of added value show that pharmaceuticals are increasing most rapidly, followed by pesticides and a group which includes photochemical products and recording media. Adhesives and gelatine, as well as other organic basic chemicals, constitute an intermediate group. Other sub-sectors showed weak positive or even negative growth between 1997 and 2002.
In the sub-sectors that did not expand significantly, the number of employees developed at approximately the same rate as turnover in real terms. In the more expansive sectors, turnover has risen faster than the number of employees. This indicates that technical development is proceeding most rapidly in the expansive sub-sectors, which ought not to come as any surprise.

30
Table 11. The trend in sub-sectors of the Swedish chemical industry.
2002 Change in % 1997 to 2002
Sub-sectors Number of compan.
Number of employees
Product value, SEKm
Added value, SEKm
Number of companies
Number of empl.
Prod. value
Added value
24.11-24.13 ind. for industrial gases, dyes and other inorganic basic chemicals 63 3839 8876 3655 2 0.86 1.04 06 24.14 industry for other organic basic chemicals 61 3908 14682 4561 39 0.85 1.41 40 24.15-24.17 ind. for fertilisers and nitrogen products, basic plastic ind. and for synthetic basic rubber 69 4687 16173 4027 -7 0 17 6 24.10 ind. for pesticides and other agrochemical products 14 62 101 33 0 1.05 63 74 24.30 dye industry 119 4027 7885 2352 18 13 26 14 24.41+24.42 ind. for pharmaceuticals, pharmaceutical chemicals and botanical prod. 118 18748 61812 34827 7 19 64 128 24.51+24.52 ind. for cleaning products and toilet articles 201 1219 1817 591 2 -11 -8 -9 24.61 explosives industry 29 724 1062 328 32 -20 4 -30 24.62 industry for adhesives and gelatine 17 668 1710 576 42 8 23 31 24.63-24.79 industry for essential oils, photochemical products, recording media, other chemical ind. and synthetic fibres 151 1363 4607 1366 14 13 110 90
Production value relates to the actual production carried out by the companies. The value is based on net turnover adjusted for changes in inventories and work in progress, capitalised work on own account, other operating income excl. grants, gains on exchange and capital gains as well as the cost of purchasing of goods sold without further processing (goods for resale). Added value is defined as the production value minus costs of purchased goods and services, but not salaries and social security contributions or the purchasing cost of goods sold without further processing (goods for resale). Source: Statistics Sweden 2009b.
31
5.4 Chemicals in articles2
An article is defined in this context as “an object which during production is given a special shape, surface or design, which determines its function to a greater degree than does its chemical composition” (REACH 2.3.3). The sharply increased turnover of consumer goods, with broader ranges of similar products and products with a shorter life, are important causes underlying the spread of articles that contain hazardous chemical substances. Swedish consumption can contribute to global environmental problems as a large proportion of the articles consumed in Sweden are imported from countries where control and consideration of environmental impact and working conditions are deficient. The increasing transfer of chemicals production and manufacturing of articles to low-cost countries probably means that emissions increase in these countries and that production-related emissions decrease primarily in the EU, the United States and Japan. This transfer also signifies reduced opportunities to check that articles are principally free of hazardous substances. The problems concerning substances, as well as direct risks to health and the environment and resource issues, are concerned with issues related to lifestyle, sustainable development and global justice.
A large number of chemical products, for example starting substances for plastics, sealants, adhesives and paint pigments, are used in the manufacturing of materials, components and articles. The chemical substances that are used may be added to maintain a function (e.g. metals in batteries), they may constitute whole materials or be additives to materials to influence properties (e.g. flame retardants or plasticisers in plastics), join parts together (e.g. adhesive, solder) or act as surface treatment (e.g. paint and varnish products). The intention for most articles is not for the substances to be released during use, but there are several examples of articles from which chemical substances are dispersed when used. This may, for example, happen through additives leaching from polymer materials or through wear of the article, for example brake linings and tyres. Care of articles, for example washing, may also cause dispersal of substances from the articles. Hazardous substances in articles may also pose risks in recycling and in waste management.
Emissions from articles, in contrast to industrial point sources, are more spread out in society. However, knowledge on the mechanisms relating to diffuse emissions from articles is deficient. The total consumption of articles has increased rapidly in recent decades. The consequent dispersal of substances released from articles and dispersed in the environment leads to people being exposed by breathing, eating, drinking or through uptake of the substances through the skin. Exposure takes place to a large number of different substances, and knowledge is inadequate on interactions, i.e. how people and the environment are affected by being exposed to several substances at the same time. Such exposure can be particularly critical for sensitive groups such as children.
In order to be able to choose resource-efficient and successful measures and efforts in the area of articles, methodology is needed to sort product groups on the basis of chemical risks and potential for risk reduction. In order to deal with this in an ideal manner, there is a need for figures on flows of articles and volumes, data on the chemical content of articles as well as emissions of hazardous substance and the resulting impact on health and the environment.
2 This section is based on KemI 2009a.

32
There are no statistics that capture trends in production of articles and consumption related to the content of chemicals in articles in a simple way. The rapidly increasing production of articles around the world is an indication. The even more rapid increase in trade in articles shows that an ever greater share of our consumption is produced outside the chemicals control of Sweden or the EU. There is nothing to suggest that present-day articles contain a smaller quantity of chemicals classified as hazardous than previously. The proportion of products (in numerical terms) classified as available to consumers in Sweden in 2007 was 19 per cent (KemI 2009). This does not mean that the remaining just over 80 per cent is used in the manufacturing of articles. The category of products not available to consumers also includes products used directly by professional users, for example plant protection products in agriculture or certain cleaning products, without forming part of any article. Not all consumer-available products are used by private consumers, some are used professionally. Despite this, there is an indication that the proportion used as input material for other production is large. Another indication is data on the breakdown of the use of chemicals into different sectors (Palm and Carlsson 2003, see last paragraph of Section 5.2).
The very rapid increase in trade in chemicals and articles leads to substantial transportation, which in itself has an adverse environmental impact. This may to some extent be counteracted by the possibility of production being made more efficient in large production units.
6. Costs of chemicals policy compared with turnover etc. In brief The costs of chemicals control to the chemical industry are small in comparison with its turnover.
Payment by chemical companies to the Swedish state for fees etc. related to chemicals control, i.e. not general taxes such as VAT, totalled SEK 98.6 million in 2007 (SOU 2008:73). The costs of administration of environmental policy rules etc. for the chemical industry apart from pharmaceuticals and importers of chemicals have been estimated at SEK 51 million (NUTEK 2006). The companies also have costs of changes in production as a consequence of requirements imposed by legislation which are not included in this calculation. The turnover of the Swedish chemical industry in 2007 was SEK 79 billion (excluding pharmaceuticals, Statistics Sweden 2009). This means that the calculated parts of the costs of the chemical industry for chemicals control represented around 0.2 per cent of its turnover (excluding pharmaceuticals but including the costs of importers).
Some of the costs indicated are based on an estimate rather than a well-founded costing. Costs of statutory protective equipment and other technical efforts, for example, may be substantially higher but of the same order of magnitude. Despite these objections, the final result is that the costs of chemicals policy are very small in relation to turnover.
Production being closed down in Sweden and transferred to other countries or Swedish companies becoming bankrupt as a result of foreign competition can only be explained to a small degree by the tougher policy on chemicals that applies in Sweden. There may be exceptions. Companies that have low profitability and in addition have many products on which to pay fees to the Product Register may have such high costs associated with environmental policy requirements that this may contribute to closure. This may also apply exceptionally when requirements imposed by society become particularly demanding and

33
signify particularly high costs for protective or cleaning equipment. There is a wide spread in cost of chemicals control between different companies.
This type of costing has previously been conducted ahead of decisions to introduce REACH. Several studies showed that the cost to companies if REACH were to be introduced amounted to a few per-thousandths of the turnover of the EU chemical industry. The conclusion that was drawn was that REACH will not have any decisive negative impact on the EU chemical industry. Small companies with many different chemical substances are affected more than average (Ackerman and Massey 2004, Ecorys 2004). There is reason to believe that a tougher policy may compel technological development which in the long term will give the companies an advantage if/when similar policy is introduced in other countries. This is expressed in what is known as the Porter hypothesis (Porter and van der Linde 1995).
There are a large number of calculations and estimates of actual and expected positive efforts of chemicals policy instruments, but without monetary valuation of the benefit. They generally show that the benefit is great and that the cost of regulation is limited. The previous tax on cadmium in phosphorus fertilisers which has contributed to reduced dispersal of cadmium and at the same time has only led to small costs for agriculture in Sweden is a prime example (Drake and Hellstrand 1998). There are also a number of studies in the area of health that show that the positive values in monetary terms of certain regulations exceed the negative ones. Mention can be made by way of example of studies based on calculations of reduced IQ due to exposure to mercury. Reduced IQ in children has, for instance, been converted to deterioration in productivity later in life (Norden 2008).
On the other hand, there are not so many environmental economic analyses in the area of chemicals in which the values have been expressed in monetary terms. These studies are often based on interviews where people are asked to state their willingness to pay for environmental improvements (KemI 2005, Norden 2008). In several cases calculations have been made which show that the costs of cleaning up or in some other way dealing with harmful substances that have been released into the environment afterwards are extremely high. Comparisons have sometimes been made with the substantially lower costs of preventing damage through regulation instead (Norden 2004, Forslund et al. 2009).
7. Forecasts for the development of the chemical industry 7.1 Forecast for the chemical industry in the world
The international economic situation was characterised by a sharp downturn between 2007 and 2009. The bottom was reached in mid-2009 and a new phase of expansion began. The economic crisis can be seen as an interlude in stable economic growth and expansion of the world chemical industry over time.
The imbalances in the world economy that were decisive for the current economic crisis became so deep that it largely remained in place and will signify a continued shift in economic capacity from North America/Europe to Asia and to some extent South America. The United States, which has long been the engine driving the world economy, had and has large deficits in its balance of trade and government budget. China and other countries have large trade surpluses, and China, Japan and others have very large dollar reserves (de Vylder

34
2009). The United States today has large debts, and demand from US consumers cannot be the locomotive for growth to the same extent as in the past.
Purchasing power is not the same as willingness to consume, and in China in particular saving accounts for a large part of the economy, providing the necessary basis for investments and therefore continued expansion. In the United States in particular, the proportion of saving out of aggregate incomes has been very low for a prolonged period and even negative in some years, and this provides substantially less scope for investments.
The countries that have expanded in the past 20 years, principally on the basis of low wages, have succeeded to a greater extent in maintaining existing production during the economic crisis than the countries with more established economies. There have been surprisingly small trends towards increased protectionism in the crisis. The evidence is mostly that trade in chemicals and other industrial articles will continue to be fairly free.
The potential for new areas, such as biotechnology, nanotechnology and green chemistry, is judged by many people to be great. This trend may partly contribute to reducing risks to health and the environment and partly mean that they increase. Purely in terms of chemical technology the opportunities are great, but it is not evident that this can lead to equally great commercial use. There must be, or it must be possible to create, demand for relevant products. Many processes are energy-demanding, and energy is expected to become relatively more expensive in the near future. This is more likely to favour than disfavour these new areas of production.
Growth in 2010 will probably be one or a few per cent, both generally and for the chemical industry. More normal development, i.e. relatively rapid expansion, can then be expected. The OECD has forecast annual growth of 3.4 per cent for the period 2005-2030 (OECD 2008). The UK Chemical Industries Association and the US Chemicals Manufacturers Association produced forecasts that were about a per cent lower at the end of the 20th century. The evidence is mostly that demand for chemicals will continue to rise when economic production capacity and purchasing power increase around the world.
The trend has generally been for consumption of chemicals to follow GDP. The link is similar to that for energy and GDP, albeit slightly less clear. The need for chemical products around the world does not appear to be levelling off. The evidence points mostly to an increasing trend for demand. The element of concern that should be mentioned in spite of everything is the large budget deficits the world’s countries have built up as a result of measures implements in part to boost demand.
7.2 Forecast for the EU chemical industry In brief The economic crisis of 2008 hit the EU chemical industry hard, but the trend has reversed. The EU will remain a very important player in the international chemicals market. Its global market share will, however, continue to decline.
The economic downturn, principally during 2008, hit parts of the chemical industry in the EU very hard. Production as a whole decreased by 14.8 per cent (CEFIC 2009a, from the first quarter of 2008 to the first quarter of 2009). There were wide differences between various main parts of the chemical industry. Chemicals except pharmaceuticals declined by 21.5 per cent, while pharmaceuticals increased by 2.6 per cent. Polymers and basic chemicals

35
decreased by around 30 per cent and consumer chemicals by 8.6 per cent. Utilisation of capacity in production in the first quarter of 2009 was just over 70 per cent, compared with the average for the period 1985-2008 of just under 82 per cent (CEFIC 2009a).
Prices fell by around 10 per cent from September 2008 to April 2009, which is no more than a return to the price level that applied in December 2007 (CEFIC 2009a).
Production statistics and expectations in the industry show that the downturn has been curtailed. There are clear signs of an upturn (CEFIC 2009a). Development over the period 2010-2020 should signify continued expansion but reduced market shares for the EU chemical industry. Growth can be expected to be somewhat in excess of one per cent per year. REACH is not judged to have any decisive significance for the distribution between the EU and the rest of the world.
7.3 Forecast for the Swedish chemical industry
The trend in the Swedish chemical industry to date has been stable, apart from the downturn in 2008 and the first half of 2009. The bottom has been reached and growth of one or a few per cent in 2010 and subsequent years is expected.
The area of pharmaceuticals is expanding around the world, but there is tough competition and large changes are under way, so that it is difficult to forecast development in Sweden. It is unlikely that Sweden, which in relation to its size has been and is a very important player in the area of pharmaceuticals, will continue to be able to assert itself so well.
Nor need the potential for new areas such as biotechnology, nanotechnology and green chemistry lead to continued expansion in Sweden. Competition from other EU countries, the United States and Japan remains high, and competition from newly industrialised countries is strengthening. Access to forest raw material gives Swedish produces an advantage with regard to green chemistry (here relating to bio raw material), which will probably be utilised. Those parts of the Swedish chemical industry that have seen negative development in recent years will probably continue to show negative growth. However, there is obviously wide spread between different sub-sectors and companies.
Biomass today accounts for a very small part of the raw materials for chemicals production. If the supply of fossil fuels declines in relation to demand and there is consequently an increase in competition for and rising prices for fossil fuels, demand for biomass from different areas of use, such as foods, energy or as a basis for chemicals and materials will increase. This should in turn lead to an increase in price for several types of biomass. It does not mean that green chemistry is made impossible, but some counteracting forces may arise. Uncertainty about future prices, which is probably greater than normal uncertainty about future prices, may pose difficulties for companies.
There is reason to believe that the use of oil as a material basis for the chemical industry will decrease, but at a lower rate than use for energy conversion as the energy content of oil is easier to replace than its property as a raw material.

36
8. Summary and consequences for Swedish work with chemicals 8.1 Summarising assessment of conditions and trends
The chemical industry expanded sharply throughout the 1990s and today is a significant sector in Sweden, the EU and globally. The economic crisis (2007-2009), which has been the deepest since the 1930s, has meant a rapid decrease in production in the chemical industry throughout the world, particularly in 2008. However, there are a large number of indications that industry is on the way to returning to its normal condition, expansion.
The EU, together with the United States and Japan, has long been a world leader in the production of chemicals. The EU is continuing to produce and export most, and the EU is the only next exporter among the world’s large countries or regions. A shift in production has taken place and is still taking place principally from the EU, the United States and Japan to China, Brazil, Russia and India in particular. It is taking place without any decrease in absolute numbers in the former group, apart from the temporary decline during the economic crisis mentioned.
Trade in chemicals is growing at a substantially faster rate than production. The trend is very clearly towards an integrated global market.
The economic turnover and profitability of the Swedish chemical industry has grown rapidly in recent years. The pharmaceutical industry has been particularly successful. The number of substances produced in or imported into Sweden has increased, and to some extent so too has the volume in tonnes. Growth has taken place for chemical products sold in Sweden in terms of number but not in terms of tonnes. Growth is expected to increase over the next few years. In the longer term, competition from China and India and other countries can create such problems for the competitiveness of the Swedish and European chemical industry, particularly with regard to basic chemicals, that production might decrease in absolute terms.
The cost of the requirements imposed on the chemical industry to date represents a very small proportion of the financial turnover of this industrial sector. The cost may, however, be relatively great for individual companies.
8.2 Policy implications
Knowledge, diffuse emissions and synergistic effects: The increasing complexity of our society, including the increasingly extensive international trade, means that there is a need for more in-depth analyses of the life cycles of chemical substances. It is becoming increasingly important to understand the flow of hazardous chemicals. Fundamental requirements to be met for the environmental quality objective of A Non-Toxic Environment to be attained are that there is knowledge of the hazardous properties of chemical substances, that there is awareness of which products hazardous substances occur in and that this information is available to those who handle the products so that suitable risk management measures can be formulated. It would be good if we also had access to information about substances not classified as hazardous today. Knowledge is still lacking on the hazardous properties of many substances, as well as on the synergistic effects of substances. New findings are continuously being made on the hazardous substances of substances. Particularly in view of substances that are used in long-lived products, it may be a problem if it is later discovered that the

37
substances have hazardous properties. It may be particularly problematic if the substances are persistent and can accumulate in living organisms if they are already dispersed in society with articles. Other consequences of new future findings on the effects of substances may be that recovery of materials is made more difficult or companies are affected by claims for damages and clean-up expenses. There is therefore a general need to increase knowledge in society of the presence of substances in materials and articles in order also to be able to meet future needs. With increased knowledge a number of further substances will be classified as hazardous. New areas with potential to contribute to reduced risks to health and the environment, for example green chemistry in a broader sense than chemicals based on bio raw material, should be supported with special research and development initiatives.
Several of the most serious problems with chemicals which are not related to production have been solved in Sweden. The relative significance of problems following from consumption is increasing today. We have tended to go from point emissions to diffuse emissions. This does not mean that all large point emissions have been stopped or that there were no diffuse emissions previously. It means that a shift takes place over time. Situations with high concentrations of, in many cases very hazardous, substances that affect a small number of individuals or a limited area, i.e. handling of chemicals at workplaces or local emissions, were previously common. Situations now arise to an increased extent with lower concentrations of substances, each separately perhaps less hazardous, which can affect a very large number of people and large parts of the environment. The aggregate health and environmental effects of chemicals, known as synergistic effects, need to be studied more closely.
Resource management is an important goal in waste management, and ever greater demands are being made on the re-use of products and recovery of materials, which may be of great significance to future flows of material in society. These flows of mixed materials also contain hazardous chemicals that can make recovery of materials more difficult. It is a great challenge to handle these flows in a way that does not entail unacceptable risks.
Articles and information: Articles that contain hazardous chemicals are manufactured to a great extent outside Sweden and the EU, sometimes in areas with inadequate control, and imported into Sweden. It may be appropriate to put increased emphasis on the review of chemicals in imported articles, including how the article has been manufactured (see further discussion in KemI 2009a). A special aspect of the extensive importation of articles that contain hazardous substances from newly industrialised countries is that we as final consumers have a responsibility to avoid our consumption contributing to the dispersal of hazardous substances, including in the country of origin. A condition to be met for us to be able to take this responsibility is that the information on production can be made available in connection with the purchasing situation. What is most important, however, is that information on the content of hazardous chemicals in the articles is available. This necessitates either clear legislation regulating access to information or the companies themselves undertaking to create functioning and credible systems. The latter is based on consumers and downstream users imposing requirements on distributors and companies being interested in protecting their brands. Binding rules are probably needed in the EU and international coordination for consumers and other players to have access to important information on the content of hazardous substances in articles as a basis for consumption and policy decisions.3
3 The Swedish Chemicals Agency is developing a strategy on articles which well be ready by the end of 2010.

38
An alternative path is positive ecolabelling, which often precedes legislation. Ecolabelling means that signals are sent backwards from the consumer stage to the production stage – instead of trying to regulate imports of articles that contain chemicals harmful to the environment and health. Ecolabelling means that consumers do not need to concern themselves with technical details.
Pharmaceuticals and the environment: In line with the rapid increase in pharmaceutical production and consumption, the environmental impact of pharmaceuticals should be analysed in more detail than today. The aggregate quantities of certain substances or hormones mean that there are risks that were less serious when the consumption of pharmaceuticals was substantially lower than today. The environment should be a criterion in the authorisation of pharmaceuticals.
Support for developing countries: The development that has taken place in the rich world, where we are increasingly surrounded by various chemicals and articles that contain hazardous chemicals, can be expected to spread rapidly to the newly industrialised countries and later to countries that today are less technically developed. People’s exposure to a number of hazardous chemicals, such as pesticides, is already greater today in developing countries than in the rich countries (Pesticide Action Network Asia and the Pacific 2010). This is due to weak policy on chemicals and inadequate knowledge among the population. In addition to this there is waste or articles containing hazardous chemicals that have been exported from rich countries. Developing countries already face difficult challenges today in steering away from chemicals hazardous to health and the environment. In addition, they will increasingly have to grapple with the massive complexity and quantity of information that follow from the trend towards more and increasingly complex chemicals, including synergistic effects.
Taking everything together, there is potential in an increase in knowledge for users and in efforts that reduce the burden of chemicals and at the same time are cost-effective for companies in poor countries. Capacity-building efforts, in the form of institutions and increased knowledge (both for authorities and companies and for the public), in countries with weak policy on chemicals, should be an area where the money invested produces a good dividend (see also KemI 2007).
International agreements: The chemicals markets have been internationalised to a very great extent. This means that countries that introduce tougher restricts may disfavour their own industry as restrictions represent a disadvantage, in any case in the short term, for domestic manufacturing. In the long term it may be an economic advantage for the regulated industry as it can gain a lead in technical development. In addition, parts of industry are favoured directly, for example downstream users who benefit from several types of regulation. The rules that have been introduced in Sweden and the EU to date have not have any serious effect on the competitiveness of relevant industries in those countries where the restrictions have been applied. Such restrictions as may be needed might have a greater negative impact.
It is in the interests of many chemical companies that there is functioning supervision and identical sanctions in all affected countries so that the conditions in such respects are similar.
The internationalisation of the chemicals market also means that one nation’s chemicals policy can only partly control use. The dispersal of particularly persistent chemicals which accumulate for example in the Arctic is little affected by the policy Sweden conducts within its own borders. Not even the EU can pursue a policy that fully solves the problems. International agreements and policy cooperation are necessary to achieve success. National
39
policy has the best prospects of success in areas such as occupational health and safety and local emissions.
It is also important to put greater effort into international negotiations. Sweden can play a far greater role than our size indicates, less than 0.15 per cent of the world population, if we commit ourselves to producing data showing the need for control and how control should be formed. This applies both in SAICM and in REACH. The preparation of dossiers on which further restrictions of hazardous substances are based is an important element in the latter case.
There are at least three important factors behind the attitude towards regulation of chemicals. One is whether the country is a significant producer of chemicals or principally an importing country. Countries’ governments tend to look after domestic industry, and it is often easier to gain acceptance for regulations in countries that mainly import. Another factor is whether a free-market attitude or a positive attitude to the role of the state dominates policy in the country. The third factor is that health and the environment tend to be given lower priority in countries with a lower level of income as they have to concentrate on making a basic living. International agreements on chemicals which the world’s countries can accept mean a substantially less strict policy on chemicals than Sweden would advocate. The first two factors seem to weigh more heavily than the last one, as several countries in Africa are considerably more open to tougher regulation of chemicals than the United States, for example, which is a very rich country. A factor underlying the positive attitude in African countries is that their chemicals control is partly financed by grants from rich countries.
A condition to be met to enable Sweden to continue to play a leading role in the area of chemicals in international forums is that the country maintains a high profile. It is particularly necessary for strict requirements to be set for Swedish exports of hazardous substances that reach those countries which need to improve their chemicals management. The points made above under Knowledge, diffuse emissions and synergistic effects and Articles and information obviously also apply. The possibility of being able to refer to examples of successful risk reduction efforts which are not unreasonably expensive has been of crucial significance in several international negotiations.
An overarching conclusion is that the problems are becoming more complex over the course of time. The number of substances and uses is increasing. Patterns of production and trade are also becoming more complex. Although our knowledge is increasing, conditions are becoming more difficult to manage.
At the same time it is becoming increasingly necessary to deal with issues at the international level, which is obviously more difficult than doing so in an individual country or in the EU. This is counteracted to some extent by the realisation that the need for measures is increasing over the course of time. It can be said that society is facing a dual challenge in its efforts to bring about better control of chemicals.

40
Glossary and abbreviations Added value Defined as the production value minus costs of purchased goods and services, but not salaries and social security contributions or the purchasing cost of goods sold without further processing (goods for resale) (Statistics Sweden 2009b).
Green chemistry Can be regarded as environmentally sound chemistry. There are twelve principles which, taken together, can be said to define what green chemistry is. Chemicals manufactured industrially from biological material rather than fossil material are one of these principles (Sjöström 2006).
Chemical See chemical product.
Net profit Income minus expenditure.
Turnover The total income of a company, or combined income of a sector or country.
Chemical product “A chemical substance or a preparation of chemical substances which is not an article,” (Environmental Code Chapter 2 Section 1).
Article “An object which during production is given a special shape, surface or design, which determines its function to a greater degree than does its chemical composition.” (REACH Chapter 2(3)(3), Environmental Code Chapter 2 Section 2).
Substances “Chemical element and compounds of this element in natural or manufactured form, including any additives necessary to preserve their stability and such compounds as originate from the manufacturing process, but excluding any solvents that can be separate without affecting the stability of the substance or altering its composition.” (REACH glossary on the Swedish Chemicals Agency website).
High-volume substance Substances manufactured or imported in volumes in excess of 1000 tonnes per year by a company.
SAICM Strategic Approach to International Chemicals Management.
41
References and sources Ackerman, F. and Massey, R. (2004) The True Costs of REACH. TemaNord 2004:557, Norden.
Allanou, R., Hansen B. G. & Van der Bilt, Y., (2004) Public Availability of Data on EU High Production Volume Chemicals, Part 2, European Chemicals Bureau, Chimica Oggi, July/August 2003 American Chemistry Council (2004) Guide to the Business of Chemistry.
CEFIC (2009a) Chemicals Trends Report: Top Indicators.
CEFIC (2009b) Facts and Figures. www.cefic.org/factsandfigures.
Cygnus Business Consulting and Research (2006) Industry insights, Global Chemicals.
Drake, L. and Hellstrand, S. (1998) “The Economics of the Swedish Policy to Reduce Cadmium in Fertilisers”. Swedish Chemicals Agency, Report 2/98.
Ecorys (2004) The impact of REACH. Overview of 36 studies on the impact of the new EU-chemicals policy (REACH) on society and business. Workshop 2004 The Hague. EU2004REACH.
Edvinsson, R. (2009) Bruttoomsättning i löpande priser 1800-2000 (Gross turnover in current prices 1800-2000). www.historia.se (under industry).
EU 2004 REACH, The Impact of REACH. Overview of 36 studies. ECORYS Bart Witmond and Sandra Groot and OpdenKamp Adviesgroup, Wim Groen and Ewout Dönszeimann. The Hague, The Netherlands.
European Commission (2001) “Towards Sustainability”, A European Community Programme of Policy and Action in Relation to the Environment and Sustainable Development, Commission of the European Communities, COM(92) 23/II final, Brussels; White Paper - Strategy for a future Chemicals Policy. Commission of the European Communities, COM(2001) 88 final, Brussels.
European Commission (2004) Statistical Analysis of the Registration Profile of Chemicals. Joint Research Centre.
European Environment Agency (1998) Chemicals in the European Environment: Low Doses, High Stakes? The EEA and UNEP Annual Message on the State of Europe’s Environment.
Europe’s environment: the third assessment.
Eurostat. www.eurostat.eu
Forslund, J., E. Samakovlis, M. Vredin Johansson & L. Barregård (2009), “Does Remediation Save Lives? On the Cost of Cleaning Up Arsenic-Contaminated Sites in Sweden”, Working Paper No 108, Konjunkturinstitutet.
Frost and Sullivan (2004) Country Industry Forecast – European Union Chemicals Industry.
United Nations, Database of economic statistics.

42
ICCA (2009) ICCA Review 2007-2008. International Council of Chemical Associations.
KemI (1990) Kemikalieanvändningen i Sverige (Use of chemicals in Sweden). Report, 9/90.
KemI (2007) Capacity Building for Chemicals Control. PM (Memorandum) 1/07.
KemI (2009a) Varor som innehåller farliga ämnen – underlag för utveckling av strategier för fortsatt arbete (Artcles that contain hazardous substances – basis for development of strategies for continued work), PM (Memorandum) April 2009.
Kemi (2009b) Statistik från produktregistret (Statistics from the Product Register). www.kemi.se
KemI (2010) Hazard and Risk Assessment of Chemical Mixtures under REACH - State of the Art, Gaps and Options for Improvement. (Thomas Backhaus, Hans Blanck and Michael Faust) PM (Memorandum) 3/2010.
Miljöbalken
OECD (2001) OECD Environmental Outlook for the Chemicals Industry.
Norden (2004) Cost of late action – the case of PCB. Von Bahr, J. och Jansson, J. Tema Nord 2004:556.
Norden (2008) Socio-economic costs of continuing the status-quo of mercury pollution (http://www.norden.org/pub/sk/showpub.asp?pubnr=2008:580).
NUTEK (2006) Näringslivets administrativa kostnader på miljöområdet (Administrative costs to trade and industry in the area of the environment). R 2006:1.
Palm, V. and Carlsson, A. (2003) Chemical indicators by industry – SCB.
Pesticides Action Network Asia and the Pacific (2010) Sowing Poison, Growing Hunger, Reaping Sorrow.
Swedish Plastics and Chemicals Federation (Plast- och kemikalieföretagen) (2003 and 2006) Facts & Figures.
Porter, M. and van der Linde, C. 1995 Toward a new conception of the environment-competitiveness relationship. Journal of Economic Perspectives,
9(4):97–118.
SOU 2008:73 Kemikalietillsyn – organisation och finansiering. Miljödepartementet (Chemicals supervision – organisation and financing. Ministry of the Environment).
Statistics Sweden (SCB) (2009a), Databas, Näringslivsverksamhet, Resultaträkningsposter (Database, Commercial activity, Profit and loss items).
Statistics Sweden (SCB) (2005) Statistisk årsbok (Statistical Yearbook).
Statistics Sweden (SCB) (2009) Statistisk årsbok (Statistical Yearbook).
43
Sjöström, J. (2006) Green chemistry in perspective – models for GC activities and GC policy and knowledge areas. Green Chemistry, 8:130-137.
UNEP (2009b) Preliminary Global Outlook: Topic 1 Trends and indicators. Babajide et al.
deVylder, S. (2009) Världens springnota (Global dine and dash).
World Bank (Hettige) (1994) Industrial Pollution Projection System.
WTO (2009) Statistical Database, Time series on international trade (stat.wto.org).

SWEDISH CHEMICALS AGENCY • P.O. Box 2 • 172 13 SUNDBYBERG PHONE +46 8 519 41 100 • FAX +46 8 735 76 98 • www.kemikalieinspektionen.se • E-mail [email protected]