Embed Size (px)
Citation preview

Approved by,
NorHayati Mellon
CERTIFICATION OF APPROVAL
DEVELOPMENT OF VOLUME TO MASS
CONVERSION MODEL FOR
NGV DISPENSING UNIT USING
THERMODYNAMIC PROPERTIES
By
Nadiah Abu Hassan
A project dissertation submitted to the
Chemical Engineering Programme
Universiti Teknologi PETRONAS
in partial fulfillment of the requirement for the
BACHELOR OF ENGINEERING (Hons)
(CHEMICAL ENGINEERING)
vj (nW/^X ^^

CERTIFICATION OF ORIGINALITY
This is to certify that I am responsible for the work submitted in this project, that the
original work is my own except as specified in the references and acknowledgement,
and that the original work contained herein have not been undertaken or done by
unspecified sources or persons.
NADlAH ABU HASSAN
n
TABLE OF CONTENT
1.0 ABSTRACT 1
2.0 INTRODUCTION 2
2.1 Background of the Study 2
2.2 Problem Statement 3
2.3 Objectives 4
2.4 Scope of Study 4
3.0 LITERATURE REVIEW AND THEORY 5
3.1 Theories 5
3.1.1 Equation of State 5
3.1.1.1 Ideal Gas Equation ...5
3.1.1.2 Van derWaals Equation 6
3.1.1.3 Soave Redlich Kwong Equation 7
3.1.1.4 Peng Robinson Equation 8
3.1.1.5 Lee Kesler Plocker Equation 9
3.1.2 Variation ofComposition in Natural Gas 10
3.2 Literature Review 12
4.0 PROJECT OVERVIEW, METHODOLOGY AND PROJECT WORK 18
4.1 Project Work 18
4.1.1 Finding Suitable Equations of State 18
4.1.2 FindingComposition and Natural Gas Properties 19
4.1.3 Find Mass Variation as a Function of Pressure
and Temperature .23
4.2 Tool Used 23
4.2.1 Microsoft Excel 23
4.2.2 HYSIS 24

5.0 RESULT AND DISCUSSION 25
5.1 Choosing Suitable Equation of State -25
5.1.1 Ideal gas 25
5.1.2 Van der Waals Equation of State 26
5.1.3 Soave Redlich Kwong Equation of State 26
5.1.4 Peng Robinson Equation of State 26
5.1.5 Lee Kesler Plocker Equation of State 27
5.2 Finding the Composition of Natural Gas 27
5.3 Finding Natural Gas Properties 28
5.4 Variation in Mass as a Function of Pressure 31
5.4.1 Calculation Using Ideal Gas Equation 32
5.4.2 Calculation Using Soave Redlich Kwong EOS 33
5.4.3 Calculation Using Peng Robinson EOS 36
5.5 Variationin Mass as a Functionof Pressureand Temperature 40
6.0 CONCLUSION AND RECOMMENDATION 45
7.0 REFERENCES 47
LIST OF FIGURES
Figure 1 : Effect of Impurities in Natural Gas .11
Figure 2 : Process Flow For This Research 18
Figure 3 : Ideal Gas Plot At 30°C 33
Figure 4 : SRK PlotAt 30°C 36
Figure 5 : Peng Robinson Plot At 30°C 38
Figure 6 : PVT Plot For The Leanest Composition 39
Figure 7: PVT Plot for the Richest Composition 39
Figure 8: Peng Robinson Plot at Different Composition 41
Figure 9: SRK Plot At Different Composition 42
Figure 10: LKP Plot at Different Composition 42
Figure 11: Plot At 20°C Using Different Equation ofState 43
LIST OF TABLES
Table 1 : Natural Gas Composition 10
Table 2: Recommended Equation of State for Different System 14
Table 3 : Gas Composition As Analyzed By PRSS 28
Table 4 : Mass Fraction ForNatural Gas In Leanest Composition 29
Table 5 : Mass Fraction ForNatural Gas In Richest Composition 29
Table 6 : CriticalProperties Of Natural Gas Component 29
Table 7 : CriticalProperties For Different Composition 30
Table 8 : Constants For Vapor Pressure Calculation 30
Table 9 : Component Vapor Pressure At Different Composition 31
Table 10 : Properties OfNatural Gas ForDifferent Composition 34
Table 11 : Empirical Constant For SRK Calculation 35
Table 12 : Empirical Constant For Peng Robinson Calculation 37
1.0 ABSTRACT
This research project is initiated as one of the sub studies in the implementation ofnatural
gas vehicle usage in Malaysia. Developing a natural gas refueling station at lower cost is
a challenge that needs to be handled by the university. One of the areas of interest is in
the metering system. Regulatory requirement states that natural gas must be measured in
mass flow rate. Coriolis meter is the only available mass flow meter in the market. But
this meter is too costly. Thus a study to develop a cheaper metering system is required.
The best alternative is by measuring the flow rate of natural gas and then converts it to
mass flow rate. This conversion can be done in various ways of calculations. Manual
calculation using Equation of State, combination of several Equations of State and
Activity Coefficient Method are the most commonly used method of calculation for
natural gas component. The author used several equations of state in order to complete
this research. But first, the properties of the natural gas such as its composition, vapor
pressure and critical properties need to be determined first.
The calculation starts with the study to find the variation in mass as pressure of the
natural gas is changed. For this calculation purpose, the tank is considered as an
isothermal system with temperature maintained at 30°C. The system that been studied is
theNGV's tank which volume is constant (55 liters). The calculation is done using Soave
Redlich Kwong EOS and Peng Robinson EOS. To compare the data with the ideal
condition, a plot using ideal gas equation is done as well. The calculation is repeated at
different composition to see how the variations in composition affect the behavior of the
graph.
Finally, the variation in mass as a function of temperature and pressure is done. At this
stage, HYSIS is used to determine the data for the plot. The equations that been
considered in the calculation are Soave Redlich Kwong EOS, Peng Robinson EOS and
LeeKesler Plocker EOS. The graphs areplotted to seetherelationship.
2.0 INTRODUCTION
2.1 Background of the Study
Automotive industry is one of the fastest growing industries in the world. The car usage
is increasing as the economic status is developing year by year. But unfortunately, these
vehicles are major contributors to air pollution problem. Phenomenon such as
photochemical smog, acid rain and increment in air pollution index is mainly contributed
by emission from vehicles' exhaust. Thus, there are more alternatives been developed to
create a more environmental friendly vehicle.
As the pollutant emitted from the vehicle come from its fuel, it is a good approach to
change its fuel from diesel and gasoline to other type of fuel. Natural gas is one of the
best options available. Natural gas is a product that been collected together with
petroleum. It is colorless and odorless gas that can be easily combusted. It believed that
natural gas is one of the cleanest, safest, and most useful of all energy sources.
Natural gas vehicle has become a more popular option of transportation worldwide.
Natural gas contains less carbon than any other fossil fuel and thus produces lower
carbon dioxide emission per vehicle traveled. NGV also emit very low level of carbon
monoxide and volatile organic compound. Exhaust emission from a typical NGV are
much lower than those from gasoline powered vehicles.
From safety point of view also, using natural gas offer a safer system. If a leak were to
occur in an NGV fuel system, the natural gas would dissipate into the atmosphere
because it is lighter than air. Natural gas has a high ignition temperature, about 1200°F
and narrow range of flammability. Besides, natural gas is not toxic and will not
contaminate ground water. Natural gas combustion produces no significant aldehydes or
other air toxins, which are a concern in gasoline and other alternative fuels.
2.2 Problem Statement
UTP in corporation with other universities had conducted a study on the development of
NGV usage in Malaysia. UTP's scope is to focus in designing the natural gas refueling
system. The tasks are broken into smaller scope to be studied. The author scope is to
concentrate in the natural gas metering system. Natural gas need to be measure in mass
flow rate rather than the other fuel that been measured in volumetric flow rate.
There are several types of flow meter in the market that can measure natural gas flow
from the natural gas dispensing unit to the vehicle. Coriolis meter, vortex flow meter,
positive displacement flow meter and differential meter are among the most popular flow
meter that been used to measure flow.
Among this four, only coriolis meter give the reading in mass per unit time while the
other flow meter give the volumetric reading of volume per unit time. The high cost of
this meter lead to the research of finding another alternative to measure mass flow. The
best window that been considered is to have the volumetric flow rate measured, and then
convert it to mass.
The conversion of volume to mass for natural gas is quite complicated as it involves
changes in its properties. There are a lot of correlation been develop that can relate mass
and volume by using thermodynamic properties such as temperature and pressure. The
applicability of each correlation is different depending on its temperature range, pressure
range and also composition of the fluid that been studied. The project to be conducted is
to find several Equations of State that are suitable for natural gas and then use them for
thermodynamic calculation.

2.3 Objectives
The objective of this research is to find the more economical method to measure the mass
of natural gas. This is important in order to comply with SIRIM requirement in
measuring natural gas in mass unit. Conversion from volumetric flow rate to mass flow
rate is believed to be the best option. Using several thermodynamic Equations of State,
the relation between thermodynamic properties such as pressure, temperature and density
is studied. The calculation need to be repeated for several Equations of State.
The other objective is to find the composition effect in the mass of fuel being delivered.
The study is conducted at two different compositions, namely the leanest and the richest
composition. This result will be plotted in a graph and will be compared with the actual
result from the real refueling procedure. Then only the best correlation can be selected.
2.4 Scopes of Study
The project is mainly concentrating in finding the variation mass of natural gas as the
thermodynamic properties which is the temperature and pressure changed. The other
studies such as finding the natural gas composition and volume of the system is
considered done.
The scope of this researchproject can be summarized as follow;
1. Finding Equation of State that is applicable for natural gas calculation
2. calculate the variation of density for those EOS at different temperature and
pressure
3. calculate the variationof densityfor different compositions
4. find the mass of the natural gas for constant volume tank
3.0 LITERATURE REVIEW AND THEORY
3.1 Theories
3.1.1 Equation of State
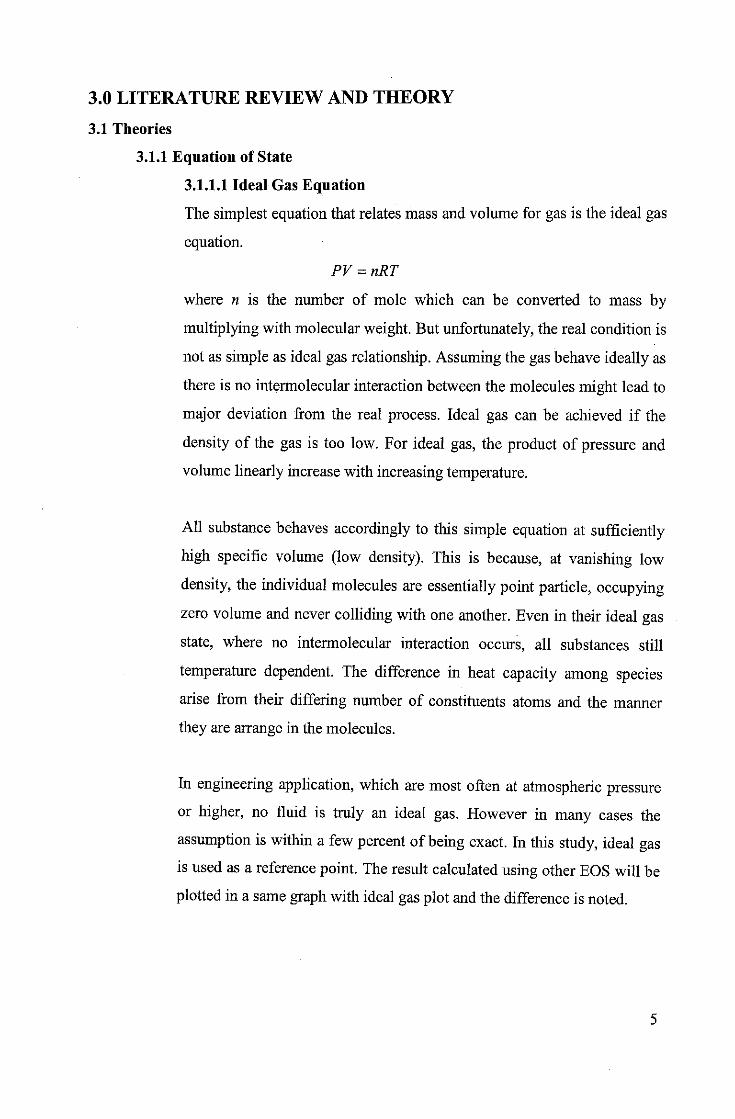
3.1.1.1 Ideal Gas Equation
The simplest equation that relates mass and volume for gas is the ideal gas
equation.
PV = nRT
where n is the number of mole which can be converted to mass by
multiplying with molecular weight. But unfortunately, the real condition is
not as simple as ideal gas relationship. Assuming the gasbehave ideallyas
there is no intermolecular interaction between the molecules might lead to
major deviation from the real process. Ideal gas can be achieved if the
density of the gas is too low. For ideal gas, the product of pressure and
volume linearly increase with increasing temperature.
All substance behaves accordingly to this simple equation at sufficiently
high specific volume (low density). This is because, at vanishing low
density, the individual molecules are essentially point particle, occupying
zero volume and never colliding with one another. Even in their ideal gas
state, where no intermolecular interaction occurs, all substances still
temperature dependent. The difference in heat capacity among species
arise from their differing number of constituents atoms and the manner
they are arrange in the molecules.
In engineering application, which are most often at atmospheric pressure
or higher, no fluid is truly an ideal gas. However in many cases the
assumption is within a few percent of being exact. In this study, ideal gas
is used as a reference point. The result calculated using other EOS will be
plotted in a samegraphwith idealgasplot and the difference is noted.

3.1.1.2 Van der Waal Equation
The Van der Waals equation of state is derived from ideal gas by adding a
term representative of intermolecular attraction, a/v , where a is an
empirical constant specific for each substance. This force has some
theoretical justification; the attractive London forces between molecules
which exist because of mutually induced perturbations in their electron
clouds, decay with the sixth order in intermolecular distance.
The square of volume is roughly proportional to this distance raised to the
sixth power. Van der Waals was the first to use this force in a tractable
equation of state; it is sometime referred to as van der Waals force.
The second modification is the addition of a term, b, specific to each
substance, and the representative of the hard volume of the molecules
themselves, that is the volume below which the system can never be
compressed. The resulting equation is
RT a
Where
P =v-b v2
27R2T2a- c
64PC
bJRTc8 Pcvolume MW
v =
mole p
Because the Van der Walls equation is not a perfect representation of any
substance, no perfect pair of constant will exactly match all the true
isotherms. There are therefore manypairs, a and b, that can be found to fit
best over some limited range.

3.1.1.3 Soave-Redlich-Kwong Equation
An empirical modification to the Van der Waals equation was made by
Otto Redlich. He found that, whereas the first term in the equation was a
reasonable assessment of the repulsive forces, the attractive force term
needed temperature dependence to reproduce a large quantity of
experimental data more accurately. He ended up with an equation known
as Redlich Kwong equation written as;
v~b v(v + b)^IT
where
Irrl.S
a=0.42748^-^
DT
b = 0.08664—£•?c
This Redlich-Kwong equation is reasonably good at describing liquid and
vapor volumes, but when the process is inverted and vapor pressure is
predicted, the results are severely in error. This led Soave to replace the
constant a with the one that was dependent on temperature; he further put
in a dependence on the acentric factor, 6j, which, in its development, was
based onthe vapor pressure behavior. The result is an equation that is not
much better inpredicting vapor pressures ofpure components.
Soave-Redlich Kwong is written as;
p= ^ a(T)v-b v(v + b)
a(Tc) = ac=0A274HRTc)2/Pcb = 0m664RTc/Pc
a(T) = ac.a(T)
m = 0.480 + 1.574<y-0.176ft)2
fl? = -logPr-l
Soave replaces a term in RK with a function that involve temperature and
acentric factor. The a function was devised to fit the vapor pressure data
of hydrocarbons and the equation does fairly well for these material.
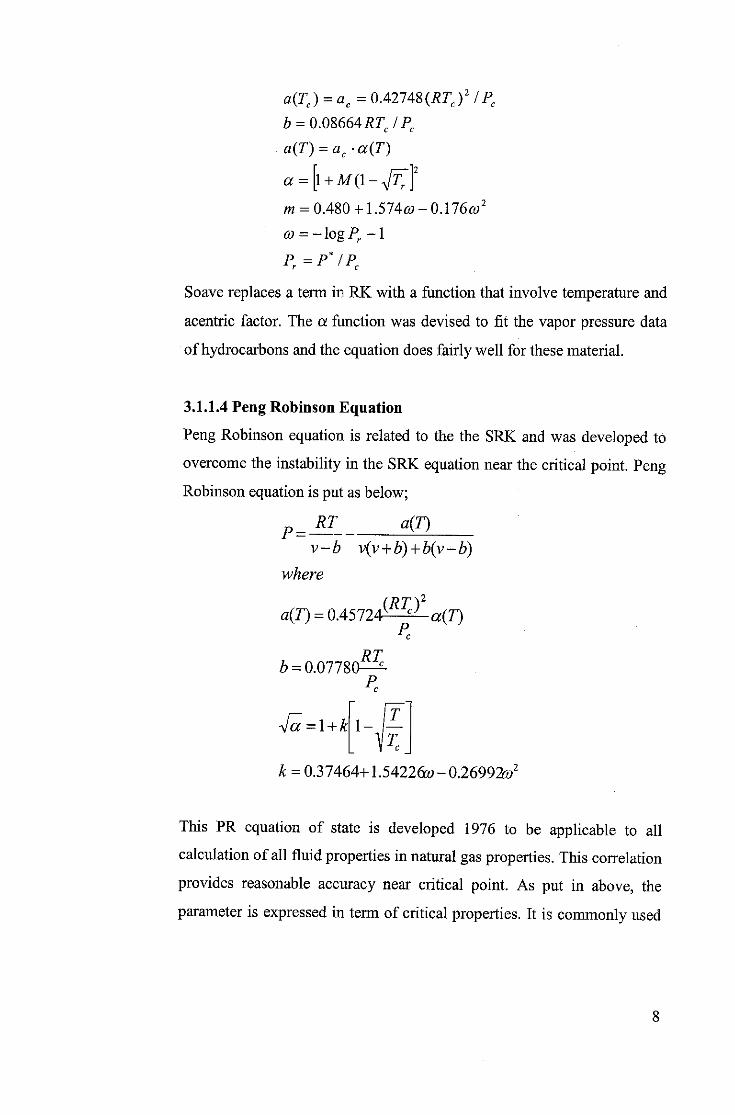
3.1.1.4 Peng Robinson Equation
Peng Robinson equation is related to the the SRK and was developed to
overcome the instability in the SRK equation near the critical point. Peng
Robinson equation is put as below;
p=RT a(T)v~b v(v +b)+b(v~b)
where
a(T) =QA5724^P-a(T)RT
b = 0.07780
<a=l + k
k = 0.3 7464+1.54226y - 0.26992y2
P
P
This PR equation of state is developed 1976 to be applicable to all
calculation of all fluid properties in natural gas properties. This correlation
provides reasonable accuracy near critical point. As put in above, the
parameter is expressed in term of critical properties. It is commonly used
to represent hydrocarbon and inorganic gases such as nitrogen, oxygen
and hydrogen sulfide.
The generalized parameter of PR equation of state is function of critical
pressure, critical temperature and acentric factor of the fluid. Thus this PR
is said to be a three-parameter equation of state, where as the Van der
Waals equation contain only two parameters which are critical pressure
and critical temperature.
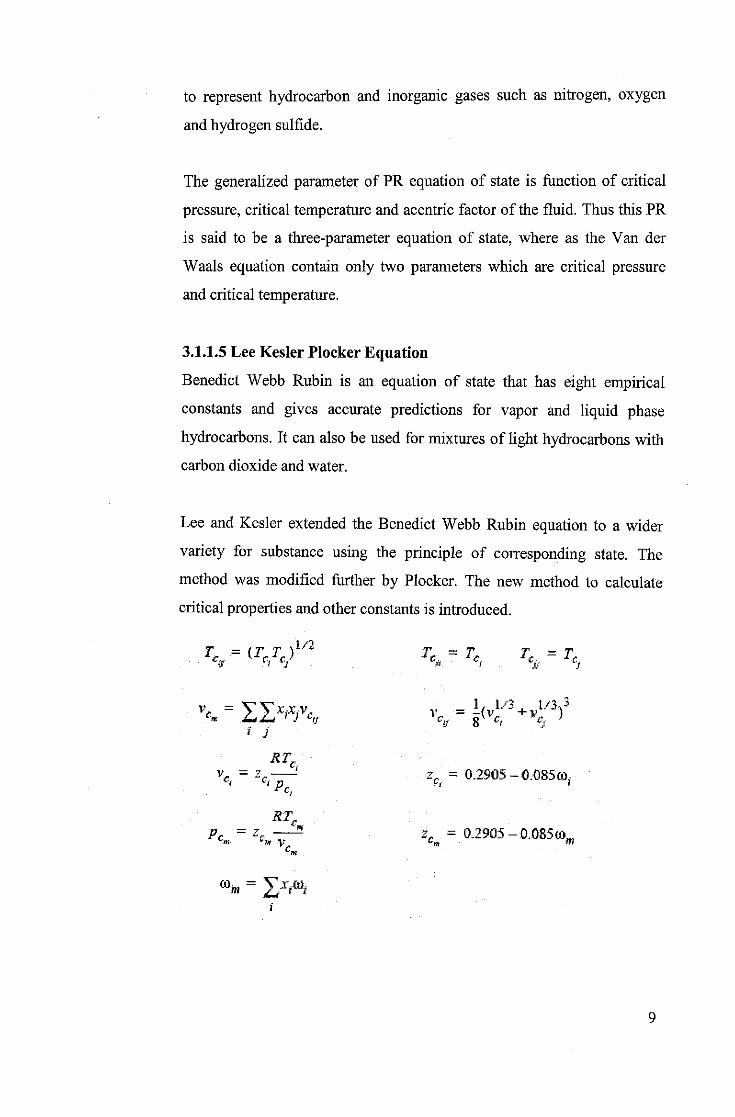
3.1.1.5 Lee Kesler Plocker Equation
Benedict Webb Rubin is an equation of state that has eight empirical
constants and gives accurate predictions for vapor and liquid phase
hydrocarbons. It can also be used for mixtures of light hydrocarbons with
carbon dioxide and water.
Lee and Kesler extended the Benedict Webb Rubin equation to a wider
variety for substance using the principle of corresponding state. The
method was modified further by Plocker. The new method to calculate
critical properties and other constants is introduced.
Tc = iTeTc)in Tc = Tc Tc = Te
» J
lf 1/3. 1/3^3u 8 ct v
RT.
* ctpei zc = 0.2905-0.085©,
p =2 - z. = 0.2905 -0.085t0m
% = 5/W-
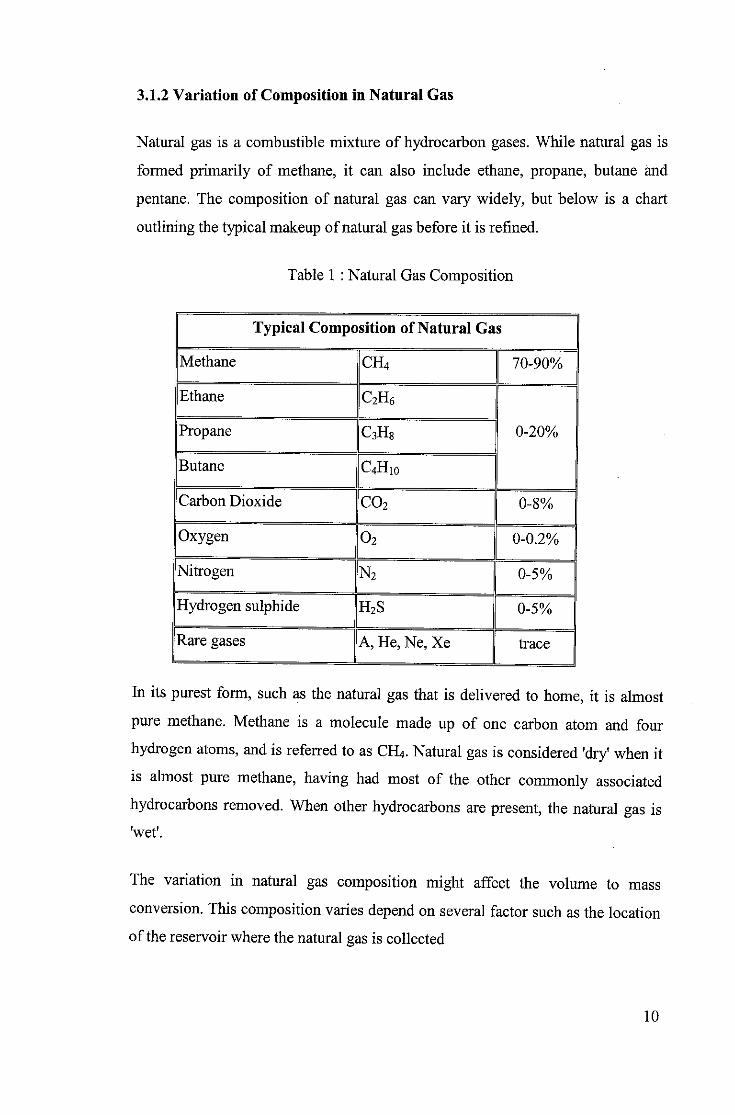
3.1.2 Variation of Composition in Natural Gas
Natural gas is a combustible mixture of hydrocarbon gases. While natural gas is
formed primarily of methane, it can also include ethane, propane, butane and
pentane. The composition of natural gas can vary widely, but below is a chart
outlining the typical makeup of natural gas before it is refined.
Table 1 : Natural Gas Composition
Typical Composition of Natural Gas
Methane CH4 70-90%
Ethane C2H6
0-20%Propane C3H8
Butane C4H10
Carbon Dioxide C02 0-8%
Oxygen 02 0-0.2%
Nitrogen N2 0-5%
Hydrogen sulphide H2S 0-5%
Rare gases A, He, Ne, Xe trace
In its purest form, such as the natural gas that is delivered to home, it is almost
pure methane. Methane is a molecule made up of one carbon atom and four
hydrogen atoms, and is referred to as CH4. Natural gas is considered 'dry' when itis almost pure methane, having had most of the other commonly associated
hydrocarbons removed. When other hydrocarbons are present, the natural gas is'wet'.
The variation in natural gas composition might affect the volume to mass
conversion. This composition varies depend on several factor such as the location
of the reservoir where the natural gas is collected
10
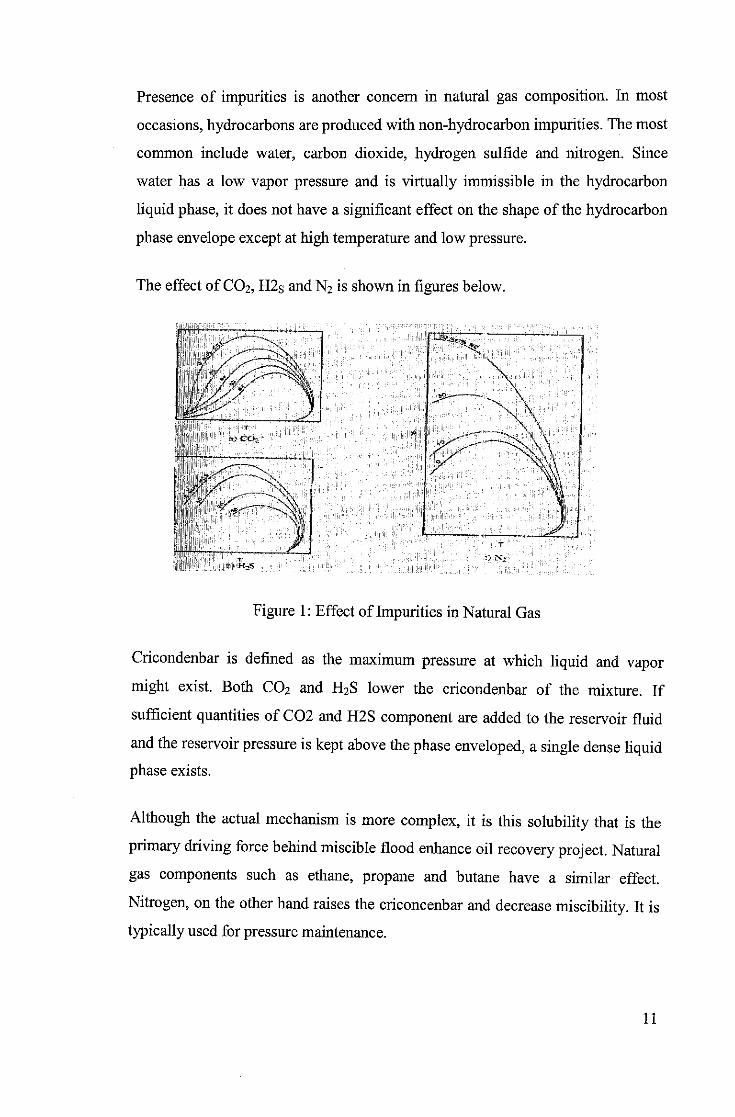
Presence of impurities is another concern in natural gas composition. In most
occasions, hydrocarbons are produced with non-hydrocarbon impurities. The most
common include water, carbon dioxide, hydrogen sulfide and nitrogen. Since
water has a low vapor pressure and is virtually immissible in the hydrocarbon
liquid phase, it does not have a significant effect on the shape of the hydrocarbon
phase envelope except at high temperature and low pressure.
The effect of C02, H2S and N2 is shown in figures below.
.1? CO;
t*.t H-.S"•> **:
Figure 1: Effect of Impurities in Natural Gas
Cricondenbar is defined as the maximum pressure at which liquid and vapor
might exist. Both C02 and H2S lower the cricondenbar of the mixture. If
sufficient quantities of C02 and H2S component are added to the reservoir fluid
and the reservoir pressure is kept above the phase enveloped, a single dense liquidphase exists.
Although the actual mechanism is more complex, it is this solubility that is the
primary driving force behind miscible flood enhance oil recovery project. Natural
gas components such as ethane, propane and butane have a similar effect.
Nitrogen, on the other hand raises the criconcenbar and decrease miscibility. It istypically used for pressure maintenance.
11

3.2 Literature Review
Besides calculating the thermodynamic properties relationship with mass
variation using the equations of state discussed before, there are also some studies
that been conducted to find the best ways to relate all these properties. All these
studies are to find the best solutions for each unique condition that the writer was
working on.
Some of the studies are by incorporating several equation of state together. For
example, the journal entitles efficient method for calculations of compressibility,
density and viscosity of natural gas by N. Varotsis, G Steward and A.C Toddm
Clancy. The writers use Whitson correlation to calculateboiling point, Lee Kesler
Equation to calculate critical temperature and pressure, Edminster correlation to
find acentric factor and Pitzer correlation is used to find critical compressibility
factor.
The calculation involves the usage of a lot of equation and constant. The critical
pressure and temperature is calculated by first finding a constant denoted by Kinfandj^
p•/mf=«b + a,
+ a,•S#
where
fp\
TVJc/
a0 =0.036983
a^ =1.043902
a2 =0.894942
a3 =0.792231
a4 =0.882292
a5 =0.018637
C1-C6
+ OLph2s L Vrc Jj
4^yMw\C7
+ a,rvT^Sl±C
co, L V rc yj N,
12

( rp \yjTc
\rc J^"inf = Po fix
+ A2><f P ^
rrr 0.5
+ PiH,S L
( rp \
p 0.5\^C JJ CO-,
+\P5yiMW]clC1-C6
+ A
r rp \yjTcp °-5
\^C J JJV,
y90 =0.7765003
A =1.0695317
A =0.9850308
A =0.8617653
/?4 =1.0127054
fis ^0.4014645
Then the critical properties ofthe natural gas are calculated using the equation as
below;
KT __ INF
PCJ INF
Tp _ 1PCPC
p =1 PR
J INF
P
P,PC
TT =1 PR
T,PC
Finally, the compressibility factor is found using the equation below before
inserting it in anormal relation to find the density ofthe natural gas.
z =1 T* rp 3 rp 4 rp 5
±PR -LpR IPR lpR2
Pr +c c
Pr-C, ^7 , ^8
+C10(l+CllA2)^T3exp[-Cupr2]+l(24)T T 2J™ 1PR T T 2\_XPR J-PR
13
A
This method of calculation is mainly concern with the presence of heptanes in the
mixture. Thus might not be suitable for this study, but this research gives some
idea on the correlation that normally been used and also prove that a combination
of several equations of state is acceptable for calculation purpose in order to get
the best fit data.
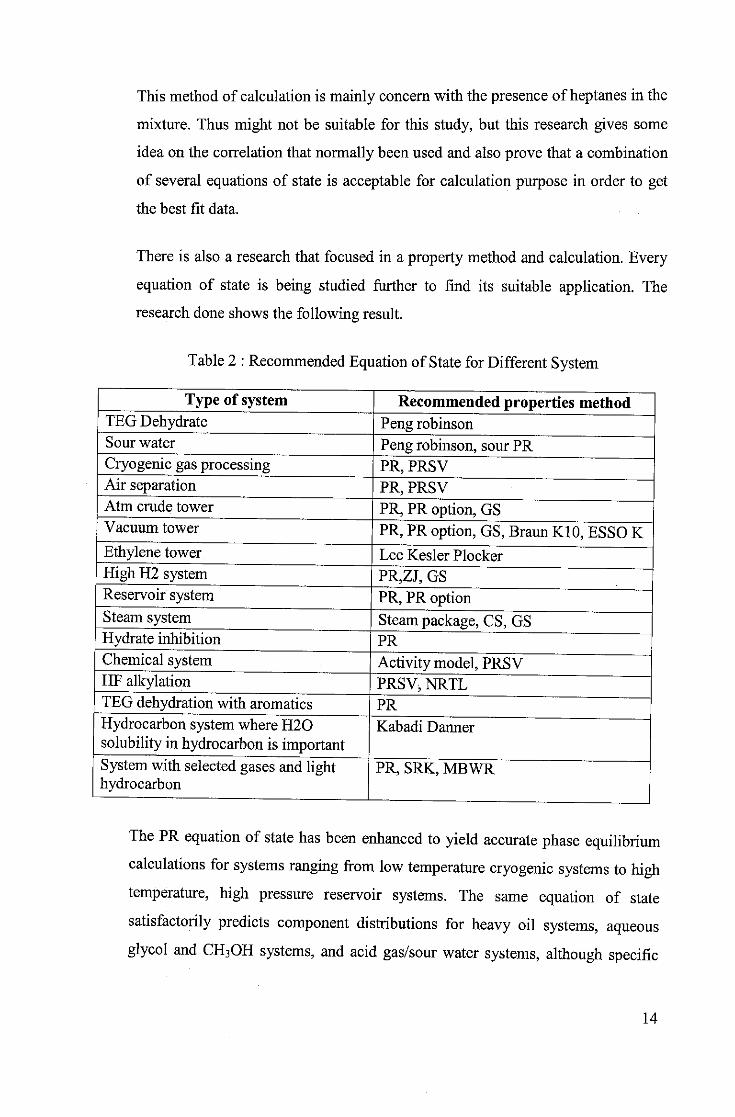
There is also a research that focused in a property method and calculation. Every
equation of state is being studied further to find its suitable application. The
research done shows the following result.
Table 2 : Recommended Equation of State for Different System
Type of system Recommended properties methodTEG Dehydrate Peng robinsonSour water Peng robinson, sour PRCryogenic gas processing PR, PRSVAir separation PR, PRSVAtm crude tower PR, PR option, GSVacuum tower PR, PR option, GS, Braun K10, ESSO KEthylene tower Lee Kesler PlockerHigh H2 system PR,ZJ, GSReservoir system PR, PR optionSteam system Steam package, CS, GSHydrate inhibition PR
Chemical system Activity model, PRSVHF alkylation PRSV, NRTLTEG dehydration with aromatics PR
Hydrocarbon system where H20solubility in hydrocarbon is important
Kabadi Danner
Systemwith selectedgases and lighthydrocarbon
1 _
PR, SRK, MBWR
The PR equation ofstate has been enhanced to yield accurate phase equilibriumcalculations for systems ranging from low temperature cryogenic systems to hightemperature, high pressure reservoir systems. The same equation of state
satisfactorily predicts component distributions for heavy oil systems, aqueousglycol and CH3OH systems, and acid gas/sour water systems, although specific
14
sour water models (Sour PR and Sour SRK) are available for more specialized
treatment.
High recommendation for the PR equation of state is largely due to the
preferential attention that has been given to it by Hyprotech. Although the Soave-
Redlich-Kwong (SRK) equation will also provide comparable results to the PR in
many cases, it has been found that its range of application is significantly limited
and it is not as reliable for non-ideal systems. For example, it should not be used
for systems with CH3OH or glycols.
The PR can also be used for crude systems, which have traditionally been
modeled with dual model thermodynamic packages (an activity model
representing the liquid phase behavior, and an equation of state or the ideal gas
law for the vapor phase properties). These earlier models are suspect for systems
with large amounts of light ends or when approaching critical regions. Also, the
dual model system leads to internal inconsistencies.
The proprietary enhancements to the PR and SRK methods allow these EOSs to
correctly represent vacuum conditions and heavy components (a problem with
traditional EOS methods), as well as handle the light ends and high-pressuresystems.
Although equation of state models have proven to be very reliable in predictingproperties of most hydrocarbon based fluids over a large range of operatingconditions, their application has been limited to primarily non-polar or slightlypolar components. Thus there are some literature that had been conducted usingother method of calculation such as using activity coefficient method.
Polar or non-ideal chemical systems have traditionally been handled using dualmodel approaches. In this approach, an equation ofstate is used for predicting the
vapour fugacity coefficients (normally ideal gas assumption or the Redlich
15
Kwong, Peng-Robinson or SRK equations of state, although a Virial equation of
state is available for specific applications) and an activity coefficient model is
used for the liquid phase.
Although there is considerable research being conducted to extend equation of
state applications into the chemical arena (e.g., the PRSV equation), the state of
the art of property predictions for chemical systems is still governed mainly by
Activity Models. Activity Models are much more empirical in nature when
compared to the property predictions (equations of state) typically used in the
hydrocarbon industry.
For example, they cannot be used as reliably as the equations of state for
generalized application or extrapolating into untested operating conditions. Their
tuning parameters should befitted against a representative sample ofexperimental
data and their application should be limited to moderate pressures. Consequently,
more caution should be exercised when selecting these models for your
simulation.
Although for ideal solutions the activity coefficient is unity, for most chemical
(non-ideal) systems this approximation is incorrect. Dissimilar chemicals
normally exhibit not only large deviations from an ideal solution, but the
deviation is also found to be a strong function of the composition. To account for
this non-ideality, activity models were developed to predict the activity
coefficients of the components in the liquid phase. The derived correlations were
based on the excess Gibbs energy function, which is defined as the observed
Gibbs energy of a mixture in excess of what it would be if the solution behaved
ideally, at the same temperature andpressure.
The individual activity coefficients for anysystem canbe obtained from a derived
expression for excess Gibbs energy function coupled with the Gibbs-Duhem
equation. The early models (Margules, van Laar) provide an empirical
16

representation of the excess function that limits their application. The newer
models such as Wilson, NRTL and UNIQUAC utilize the local composition
concept and provide an improvement in their general application and reliability.
All of these models involve the concept of binary interaction parameters and
require that they be fitted to experimental data.
Since the Margules and van Laar models are less complex than the Wilson, NRTL
and UNIQUAC models, they require less CPU time for solving flash calculations.
However, these are older and more empirically based models and generally give
poorer results for strongly non-ideal mixtures such as alcohol-hydrocarbon
systems, particularly for dilute regions.
The Chien-Null model provides the ability to incorporate the different activity
models within a consistent thermodynamic framework. Each binary can be
represented by the model which best predicts its behavior. The following table
briefly summarizes recommended models for different applications.
17

4.0 PROJECT OVERVIEW, METHODOLOGY AND PROJECT
WORK
4.1 Project Work
Find suitable
EOS
Find compositionrange and natural
gas properties
Find mass variation as a
pressure change
Find mass variation as
pressure and temperaturechange
Plot in graphs
Compare with actual data
Figure 2 : Process Flow For This Research
4.1.1 Finding Suitable Equation of State
The first step in this project is to find the most suitable Equation of State
to be used. Not every equation of state can be used for natural gas
calculation. The application of each equation of state is studied. Several
equations of state are used and comparedamong each other.
18
Most equations of state have some empirical constant that should be used
in the calculation. Thus these constants should be determined first before
proceeding with the detail calculation. Books, journal and also internet
search is the most useful tools to find this constant. HYSIS is also another
option in getting the values to be used to plot graphs.
4.1.2 Finding Composition and Natural Gas Properties
The second step is to find the range of composition variation for natural
gas. The major concern is in the composition of methane, ethane and
propane. The properties such as vapor pressure and critical properties of
each natural gas component (critical temperature and critical pressure)
should be determined as well.
Besides the properties for each component of natural gas, there are some
other calculations that need to de completed first before start the
calculation. The author has to determine the mass faction, molecular
weight of the natural gas mixture, vapor pressure for mixture, acentric
factor for mixture and also criticalpropertiesof the mixture.
a) The calculation for mass fraction is as follow;
1. Assume 1 mole ofnatural gas mixture
2. Mass of component /= mole fraction x molecular weight ofcomponent i
mi = v; x MW
3. Find total mass of the natural gas
total =ZXm
19
This total mass is in gram. As the calculation is done by assuming
1 mole of natural gas, thus, the molecular weight of this natural gas
is equal to this mmai-
4. Find mass fraction for each component
m.
X, = Lm
total
b) Vapor pressure prediction
if the normal boiling point (vapor pressure = 1 atm) and the critical
temperature and pressure are known, then a straight line drawn through
these two points on a plot of log pressure versus reciprocal absolute
temperature can be used to make a rough estimation of the vapor pressure
at intermediate temperature.
Several equations have been developed to express vapor pressure as a
function of temperature. One of the most commonly used is the three term
Antoine equation, which is given by;
lnVP =A BT + C
where, VP = vapor pressure in mmHg
A,B,C - the Antoine coefficient
T= temperature, K
A more accurate equation that might be considered to calculate vapor
pressure for pure component is as follow;
In VP =Ct +Q- +C3 InT+C4 TC5
20
All the five constants are different for each component.
Once the vapor pressure of each composition is known, the vapor pressure
for the mixture ofnatural gas could be determined.
""mixture ~ / *Xr"ii
Where x( is the mass faction of each component in the natural gas.
c) Critical properties prediction
Critical properties that had became a concern here is the critical
temperature and critical pressure. These critical properties can be
determined for the individual component in the natural gas.
The critical values are found through a combination rule. They are not
necessarily true value. Thus they are called pseudocriticals. The word
pseudo means fake or not real. Thus a pseudocritical value is not a point
on the phase curve. It is merely a correlating parameter that uses the
concept of corresponding state format.
The value of critical properties of the mixture can be determined using
Kay's Rule. This rule state that
Pc^foand
Tc =£ xtTG
where xt is the mass fraction of each component in the mixture and Tci and
PCi are the criticalvalues for each component.
From these critical properties, the reduced properties can be determined.
In corresponding state concept, physical and thermodynamic properties
21
are related to critical properties in universal ways. Mathematically,
another way of stating this concept is to say that if an equation of state for
any fluid is written in term of reduced properties, that equation is also
valid for other fluid.
Reduced properties are defined as;
TTr= —
Tc
d) acentric factor estimation
Acentric factor was developed by Pitzer to describe the deviation of a fluid
from simple fluid behavior, or its nonconformity with the corresponding
state principle. Forsimple, noble gases like argon, zenon and the like, 0) is
equal to zero.
Theparameter wis defined by the equation
o)= -logPr -1
where Pr =P*/Pc; P* is the vapor pressure at T* = 0.7 Tc
Once the acentric factor for each component is determined, the acentric
factor of the mixture can be determined.
CQ„:mature =XX^-
Using the raw data that had been determined before, the thermodynamic
calculation can be done using the chosen equations of state. This
calculation is done at constant volume condition. The volume that been
referred to is the volume of the NGV's tank which is 55 liter. For this
22
purpose of calculation, the system is assumed to be exothermic. So, the
calculation isonly done atone temperature which is 30°C.
4.1.3 Find Mass Variation as A Function of Pressure and
Temperature.
The next step is to calculate the variation of mass as pressure changes
using the respective equation of state. This calculation is done by
assuming an isothermal process. The result will be plotted in graph to have
a clearer picture about the different in result given by each equation of
state. Then the variation of temperature will be taken into account. The
calculation will be done at some range of temperature. The result will be
plotted in graph as well.
By right, the result that had been gained will be compared with the actual
data gained from the refueling test. But this stage might not be possible if
the equipment that been purchased cannot reach on time.
4.2 Tool Used
For the completion ofthis project, the most useful packages that been used are:
4.2.1 Microsoft Excel
Microsoft excel is one of the mostpowerful thatbeen wide use for
engineering studies. It can beused to create a spread sheet, doing
repetitive calculation at faster pace and also can beused to plot graphs.
Microsoft Excel is a member of the spreadsheet family of software.
Spreadsheet software is used to store information in columns and rows
which can then be organized and or processed. Spreadsheets are designed
to work well with numbers but often include text. Sometimes text in a
spreadsheet is called a label, because it is labeling columns androws of
numbers. Numbers are called values sometimes, and can includenumbers
23

for counts or measurements, dates, times, and calculations from numbers.
Spreadsheets can help organize information, like alphabetizing a list of
names or other text or reordering records according to a numeric field.
However, spreadsheets are more often used for calculating, such as
totaling a column of numbers or generating a more sophisticated formula
to calculate some statistical measure on a list of numbers.
4.2.2 HYSIS
The property packages available in HYSYS help to predict properties of
mixtures ranging from well defined light hydrocarbon systems to complex
oil mixtures and highly non-ideal (non-electrolyte) chemical systems.
HYSYS provides enhanced equations of state for rigorous treatment of
hydrocarbon systems; semi empirical and vapor pressure models for the
heavier hydrocarbon systems; steam correlations for accurate steam
property predictions and activity coefficient models for chemicalsystems.
All of these equations have their own inherent limitations.
HYSYS currently offers the enhanced Peng-Robinson (PR), and Soave-
Redlich-Kwong (SRK) equations of state. In addition, HYSYS offers
several methods which are modifications of these property packages,
including PRSV, Zudkevitch Joffee (ZJ) and Kabadi Danner (KD). Lee
Kesler Plocker (LKP) is an adaptation of the Lee Kesler equation for
mixtures, which itself was modified from the BWR equation. Ofthese, the
Peng-Robinson equation of state supports the widest range of operatingconditions and the greatest variety of systems. The Peng-Robinson and
Soave-Redlich-Kwong equations of state (EOS) generate all required
equilibrium and thermodynamic properties directly. Although the forms of
these EOS methods are common with other commercial simulators, theyhave been significantly enhanced by HYSIS to extend their range ofapplicability
24

5.0 RESULT AND DISCUSSION
There are two approaches that been used to get the data for this research. The first
attempt is by manual calculation and the second method is by using data from HYSIS.
The result that been get is compared and the best one is then chosen.
5.1 Choosing Suitable Equations of State
Equation of state is an algebraic expression which relates temperature, pressure and
molar volume, for real fluid. Many equations o state had been developed of varying
complexity. No one equation is sufficiently accurate to represent all real gases, under all
condition.
The author has managed to study the application of each equation of state. Those
equations of state that is suitable for natural gas application will be used.
5.1.1 Ideal Gas
Ideal gas equation is too simple to be considered in this process. The
natural gas will be directed to the NGV's tank which originally at
atmospheric pressure. During the refueling process, the pressure in the
tank will be increasing up to 3500psi. At this condition, natural gas no
longer shows an ideal behavior. The attractive and repulsive forces among
the natural gas molecules become significant at higher pressure.
But natural gas plot might be helpful for comparison purpose. By using
ideal gas equation the deviation of the real process from the ideal
condition can be studied.
25
5.1.2 Van Der Waals Equation of State
In some literature, Van der Waals equation of state is called the 'grandpa'
of all equation of state. The development of this equation is done long
time before with a lot of assumption and prediction of the behavior of the
components. Although it had improved the ideal assumption in ideal gas
equation by considering the forces exerted by the molecules, the
applicability of this equation fornatural gas is not satisfying.
The temperature dependent on the forces had been neglected. The forces
are only assumed to be a function of volume and some empirical constant.
But in this research, temperature is one of the main thermodynamic
properties that need to be studied.
5.1.3 Soave-Redlich Kwong Equation of State
SRK was found to be oneof thebestequations of state thatcanbe used for
natural gas calculation. This is because this equation of state is an
upgraded version of Redlich Kwong equation by improving its usage
toward hydrocarbon gases. Thus SRK can be considered as one of the
suitable equation ofstate that can be used for the calculation ofnatural gasproperties.
5.1.4 Peng Robinson Equation of State
Peng Robinson is the improved version of Soave Redlich Kwongequation. The improvement was done to overcome the weaknesses of SRK
equation near the critical point. But in this study, the range of properties
changes that been studied is far away from the critical point. Thus, PengRobinson and SRK can be considered as equally good for natural gasapplication.
26
5.1.5 Lee Kesler Plocker Equation of State
Lee Kesler Plocker equation of state is the improved version of Benedict
Webb Rubin equation of state that is developed mainly for the purpose of
studying hydrocarbon properties both in liquid and vapor phase. So, this
equation can be considered as very suitable to be used to study the
thermodynamic properties of natural gas
5.2 Finding the Composition of Natural Gas
Natural gas composition varies depending on the location where the natural gas is
collected. For this research, natural gas will be supplied by Petronas. Thus, the
composition range that needs to be taken into account should be according to
Petronas's research.
This composition is the composition of natural gas after going through the
treatment process. In the process, the impurities such as sulfur, carbon dioxide
and nitrogen are extracted from the natural gas. This natural gas mainly contains
methane. Other longer chain hydrocarbon such as ethane, propane, iso-butane and
n-butane also present in small amount. There are two types of impurities in the
natural gas composition that is nitrogen and carbon dioxide.
The data used for this variation in composition is collected by Petronas Research
and Scientific Service (PRSS). The studied was conducted between June 1999 to
January 2000 at various NGV dispensers and also at PGB Kapar. The result was
summarized by having the range of gas composition being divided into two
categories namely the leanest and the richest composition.
27
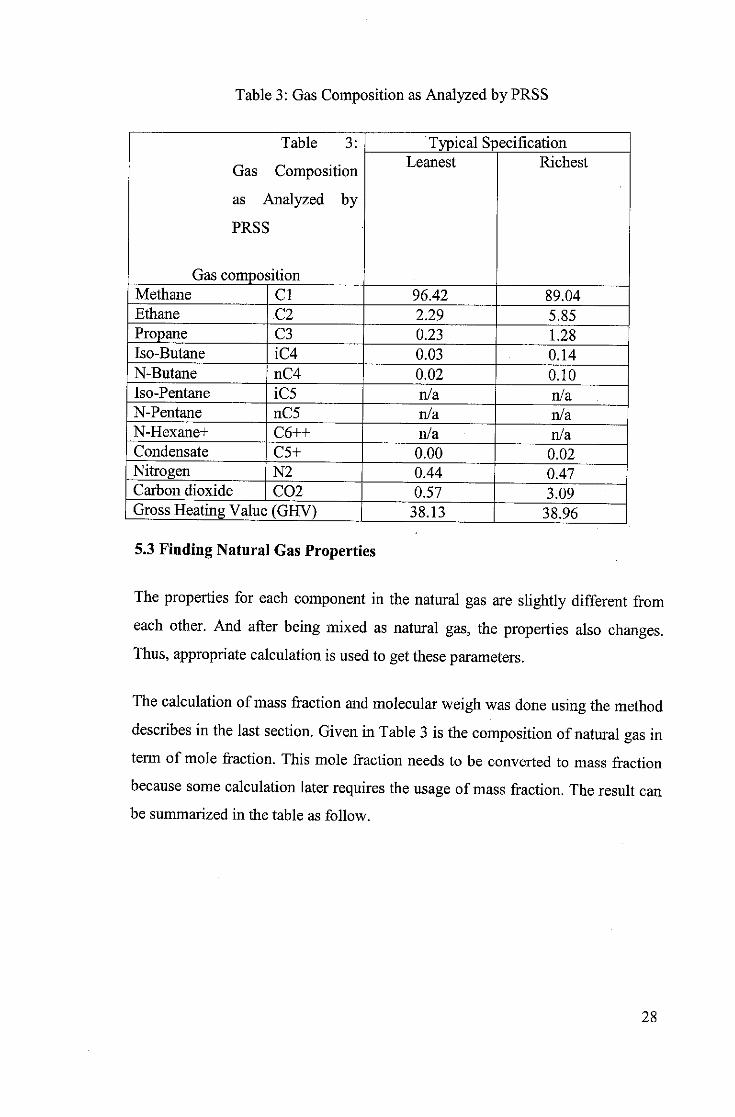
Table 3: Gas Composition as Analyzed by PRSS
Table 3: Typical Specification
Gas Composition
as Analyzed by
PRSS
Gas composition
Leanest Richest
Methane CI 96.42 89.04
Ethane C2 2.29 5.85
Propane C3 0.23 1.28
Iso-Butane iC4 0.03 0.14
N-Butane nC4 0.02 0.10
Iso-Pentane iC5 n/a n/a
N-Pentane nC5 n/a n/a
N-Hexane+ C6++ n/a n/a
Condensate C5+ 0.00 0.02
Nitrogen N2 0.44 0.47Carbon dioxide C02 0.57 3.09Gross Heating Value (GHV) 38.13 38.96
5.3 Finding Natural Gas Properties
The properties for each component in the natural gas are slightly different from
each other. And after being mixed as natural gas, the properties also changes.Thus, appropriate calculation is used to get these parameters.
The calculation ofmass fraction and molecular weigh was done using the method
describes in the last section. Given in Table 3 is the composition ofnatural gas interm of mole fraction. This mole fraction needs to be converted to mass fraction
because some calculation later requires the usage of mass fraction. The result can
be summarized in the table as follow.
28

Table 4 : Mass Fraction For Natural Gas Component In Leanest Composition.
Component Mol fraction Molecular
weightMass Mass fraction
Methane 0.9642 16.04 15.466 0.928
Ethane 0.0229 30.09 0.689 0.0414
Propane 0.0023 44.09 0.101 0.061
Iso-butane 0.0003 58 0.0174 0.00104
n-butane 0.0002 58 0.0116 0.0007
Nitrogen 0.0044 28.02 0.123 0.0074
Carbon
dioxide
0.0057 44.01 0.251 0.00151
Total 1 - 16.66 1
Table 5 : Mass Fraction For Natural Gas Component InRichest Composition.
Component Mol fraction Molecular
weightMass Mass fraction
Methane 0.8905 16.04 14.284 0.783Ethane 0.0586 30.09 1.763 0.0967
Propane 0.0128 44.09 0.564 0.0309Iso-butane 0.0014 58 0.0812 0.00445n-butane 0.001 58 0.058 0.00318Nitrogen 0.0047 28.02 0.1317 0.00722Carbon
dioxide
0.0309 44.01 1.3599 0.0745
Total 1- 18.242 1
The second step is to calculate to critical properties ofthe natural gas. The raw data wasgiven as follow;
Table 6 : Critical Properties ofNatural Gas Component
Component Pc(MPa) Tc(K)Methane 4.6 191
Ethane 4.88 305
Propane 4.25 370
Isobutane 3.65 408
N-Butane 3.8 425
Nitrogen 3.4 126
C02 7.38 304
29
Thus, the critical properties of the mixture can then be calculated using Kay's Rule.
Pc=TxiPaand
Tc=Y< xiTa
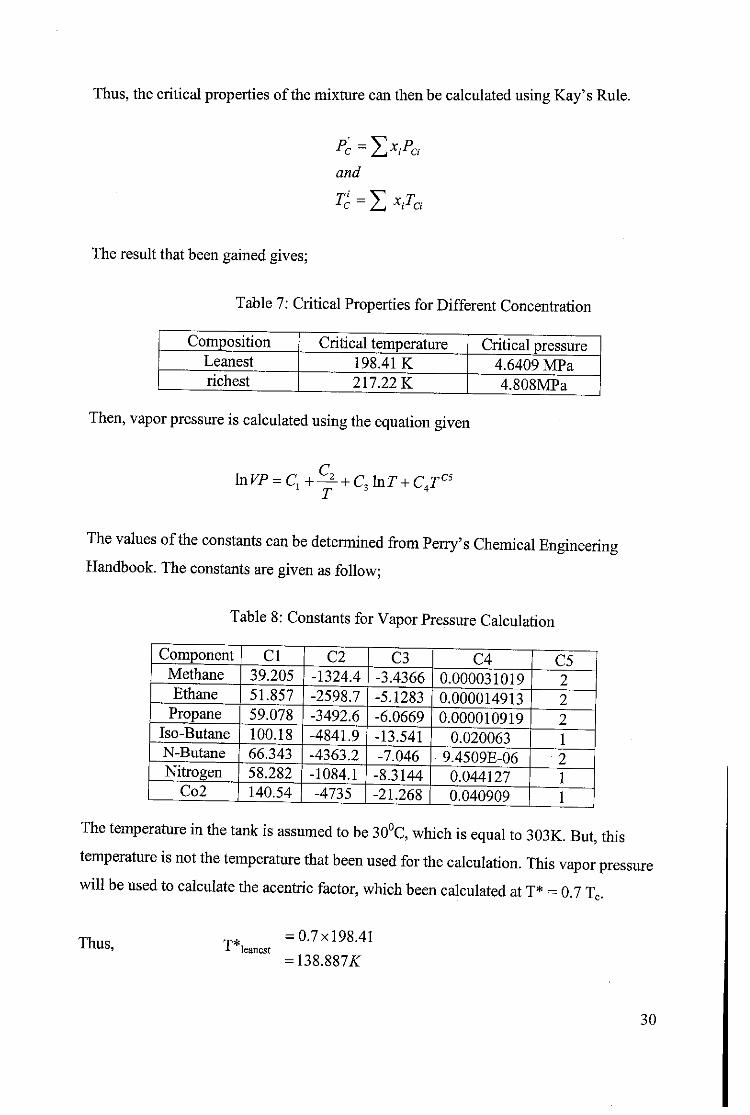
The result that been gained gives;
Table 7: Critical Properties for Different Concentration
Composition Critical temperature Critical pressureLeanest 198.41 K 4.6409 MParichest 217.22 K 4.808MPa
Then, vapor pressure is calculated using the equation given
lnVP =C1+^+C3hiT +C4TC5
The values ofthe constants can be determined from Perry's Chemical EngineeringHandbook. The constants are given as follow;
Table 8; Constants for Vapor Pressure Calculation
Component CI C2 C3 C4 C5Methane 39.205 -1324.4 -3.4366 0.000031019 2Ethane 51.857 -2598.7 -5.1283 0.000014913 2
Propane 59.078 -3492.6 -6.0669 0.000010919 2Iso-Butane 100.18 -4841.9 -13.541 0.020063 1N-Butane 66.343 -4363.2 -7.046 9.4509E-06 2Nitrogen 58.282 -1084.1 -8.3144 0.044127 1
Co21
140.54 -4735 -21.268 0.040909 1
The temperature in the tank is assumed to be 30°C, which is equal to 303K. But, thistemperature is not the temperature that been used for the calculation. This vapor pressurewill be used to calculate the acentric factor, which been calculated at T* - 0.7 T.
Thus,leanest
= 0.7x198.41
= 138.887i:
30
"P*richest
= 0.7x217.22
= 152.24^
The calculation will be done at these two temperature to find vapor pressure at T* for the
respective composition.
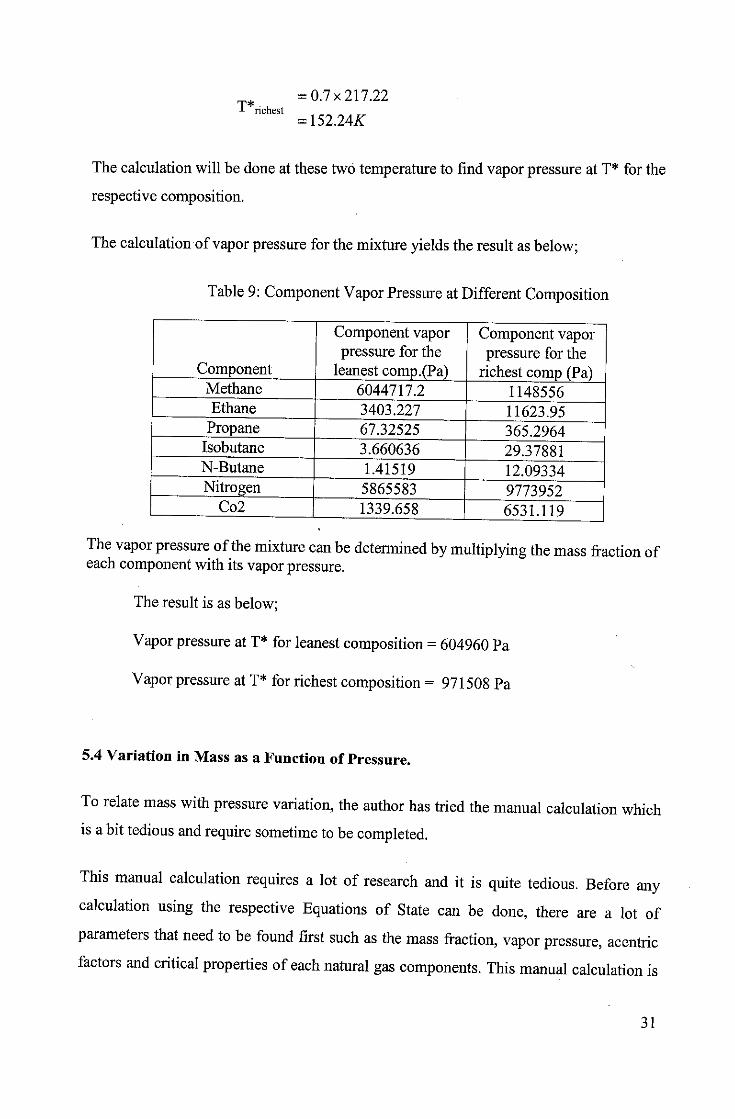
The calculation of vapor pressure for themixture yields theresult as below;
Table 9: Component Vapor Pressure at Different Composition
Component
Component vaporpressure for the
leanest comp.(Pa)
Component vaporpressure for the
richest comp (Pa)Methane 6044717.2 1148556Ethane 3403.227 11623.95
Propane 67.32525 365.2964Isobutane 3.660636 29.37881N-Butane 1.41519 12.09334Nitrogen 5865583 9773952
Co2 1339.658 6531.119
The vapor pressure ofthe mixture can be determined by multiplying the mass fraction ofeach component with its vapor pressure.
The result is as below;
Vapor pressure at T* for leanest composition = 604960 Pa
Vapor pressure at T* for richest composition = 971508 Pa
5.4 Variation in Mass as a Function of Pressure.
To relate mass with pressure variation, the author has tried the manual calculation whichis abit tedious and require sometime to be completed.
This manual calculation requires a lot of research and it is quite tedious. Before anycalculation using the respective Equations of State can be done, there are a lot of
parameters that need to be found first such as the mass fraction, vapor pressure, acentricfactors and critical properties ofeach natural gas components. This manual calculation is
31
done to find mass variation as a function of temperature. The author managed to
performed manual calculation for ideal gas, Peng Robinson and Soave Redlich Kwong
Equation of State.
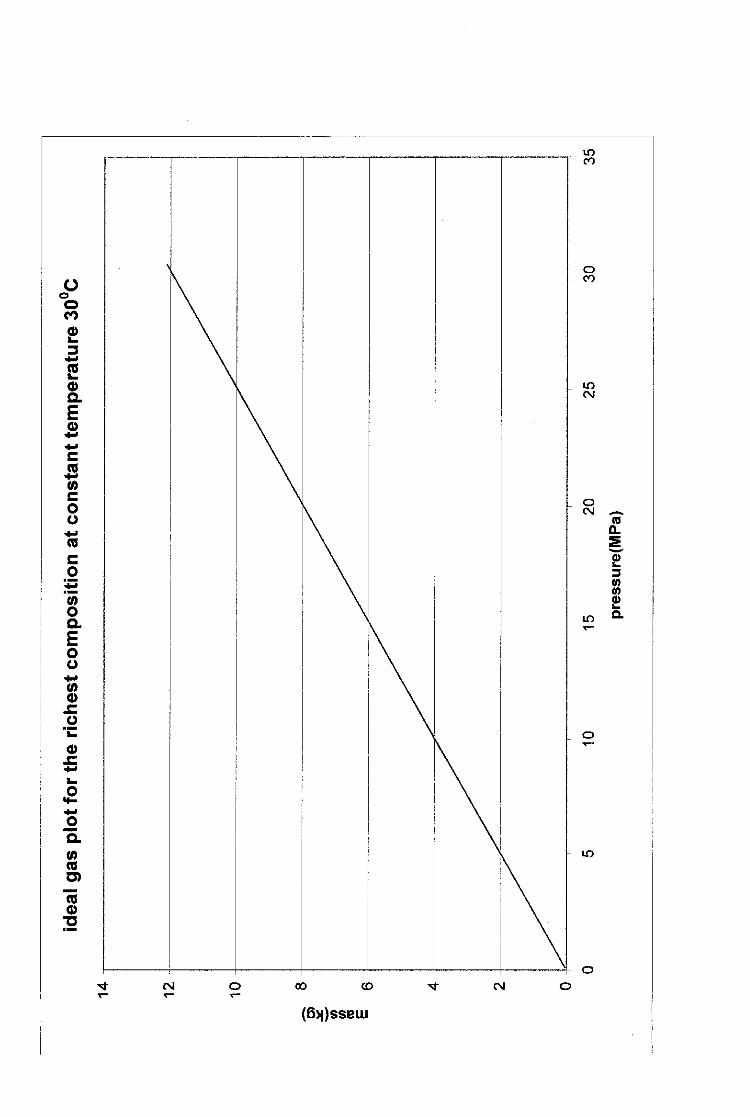
5.4.1 Calculation Using Ideal Gas Equation
Ideal gas equation is given as below;
PV = nRT
where n is the number of mole that can be calculated bydividing the mass
of the natural gas with its molecular weight. For the first part of the
calculation, the temperature is assumed to be constant at 30°C.
Substitute n in term ofmass and molecular weight, and then rearrange theequation will give;
PViMW)m = -
RT
where, V is the volume of NGV's tank, constant at 55 liter
Tis the temperature in the tank(assumed constant at 30°C)
MW is the molecular weight ofnatural gas
P is the pressure in Pascal
R is the gas constant (8.314 J/molK)
mis the mass ofthe natural gas transferred to tank, kg
The pressure is varies and the reading of mass is recorded. The calculation
is done at both compositions. Then the result is plotted in the graph. Thegraph plotted is as below.
32
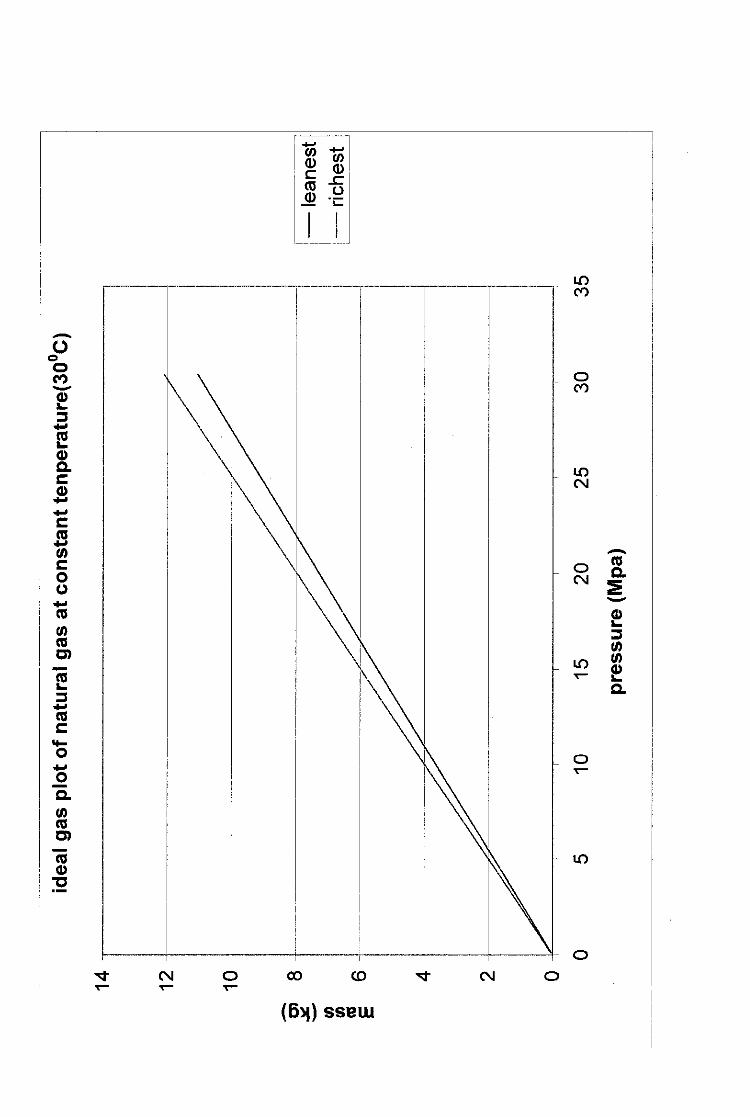
ideal gas plot of natural gas at constant tenperature(30°C)
10 15 20 25 30
pressure (Mpa)
35
•leanest
•richest
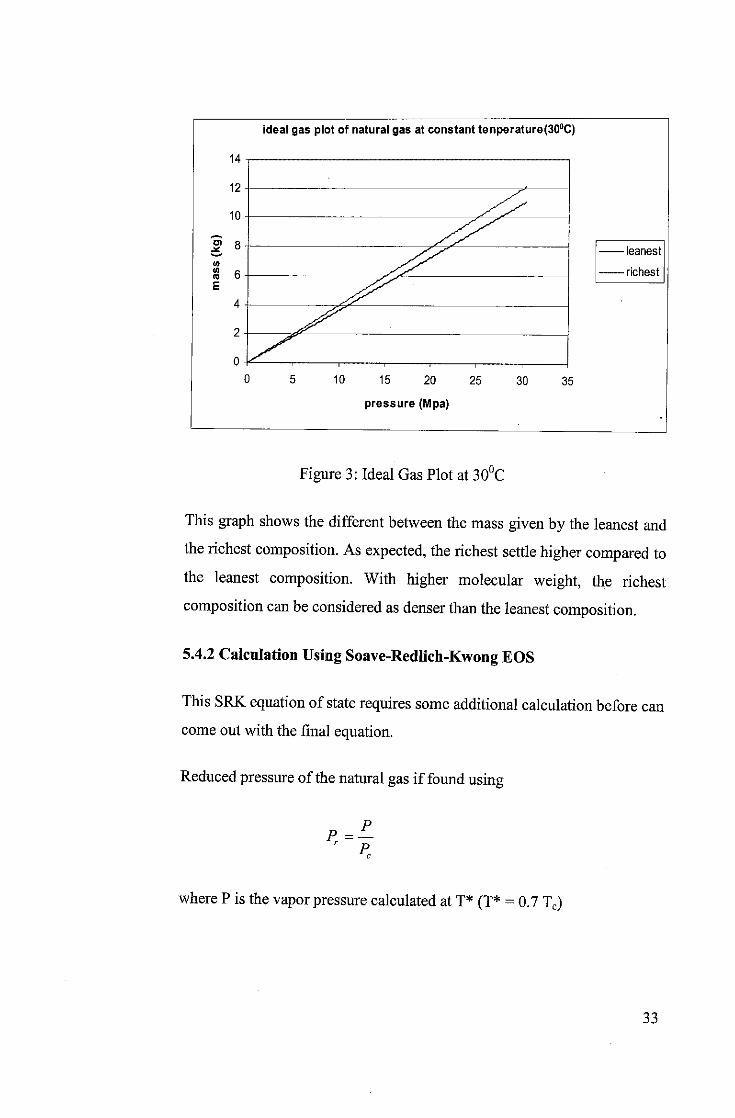
Figure 3: Ideal GasPlot at 30°C
This graph shows the different between the mass given bythe leanest and
the richest composition. As expected, the richest settle higher compared to
the leanest composition. With higher molecular weight, the richest
composition can beconsidered as denser than the leanest composition.
5.4.2 Calculation Using Soave-Redlich-Kwong EOS
ThisSRKequation of state requires someadditional calculation before can
come out with the final equation.
Reduced pressure of the natural gas if found using
'-T.
where Pis the vapor pressure calculated at T* (T* =0.7 Tc)
33
From this reduced pressure, acentric factor is calculated using
CD~-logPr -1
since Pr is already the reduced pressure for the mixture, thus co is can
straight away be considered as the acentric factor for the mixture.
reduced pressure and acentric for both compositions are as below;
Table 10: Properties of Natural Gasfor Different Composition
Leanest
compositionRichest
compositionVapor pressure at T* 0.1330355 0.202059
Acentric factor -0.115126 -0.305478
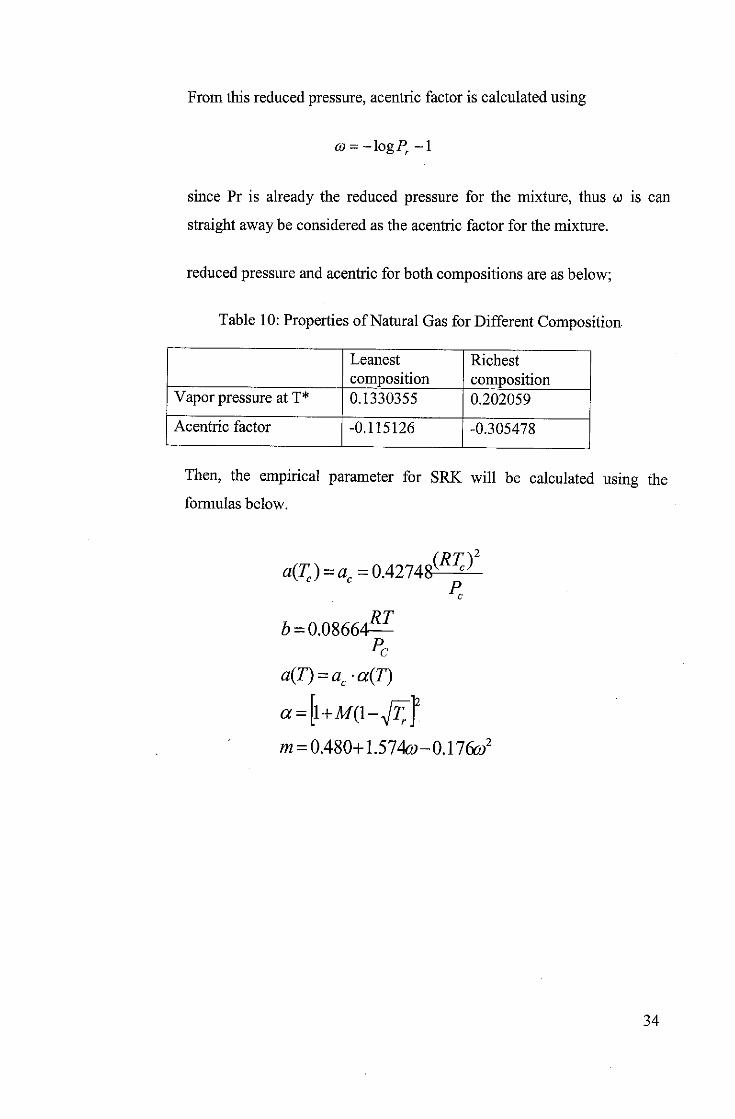
Then, the empirical parameter for SRK will be calculated using theformulas below.
a(Te) =a=0A274&RT^
RT
P^b = 0.08664
a(T) = ac-a(T)
a = 1+M(l-JT
P
/w = 0.480+1.574a>-0.17&>2
34

The calculated empirical constants are summarized in the table below;
Table 11 : Emperical Constant for SRK Calculation
Parameter Leanest composition Richest compositiona(Tc) 0.286923 0.289983
b 3.08x10"^ 3.25 x 10-i
a(T) 0.250659 0.288175
a 1.144671 0.993765
m 0.296459 -0.017246
these parameters will finally inserted in the SRK equation of state to get
the final equation that will beused toplot the graph.
P=RT a(T)v~b v(v + b)
vis the molar volume ofthe natural gas that can be expressed as
MW7 \
v =
Where MW and volume are known. Thus this equation can be inserted inSRK equation to have arelation between pressure and mass.
35
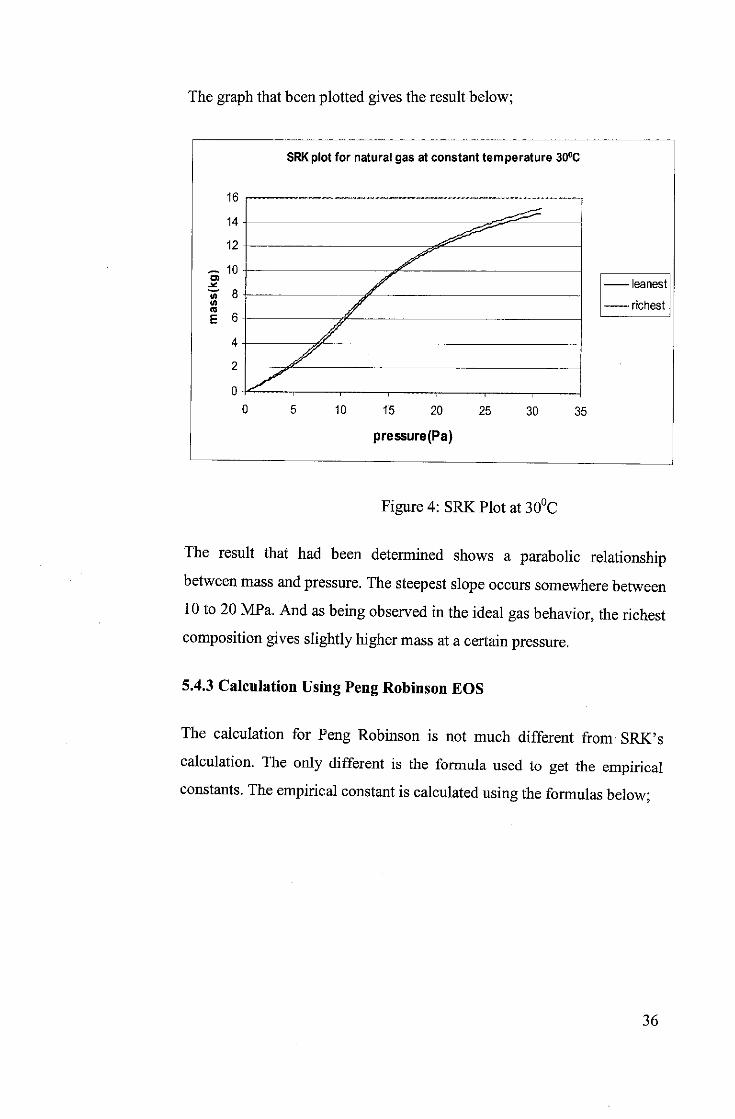
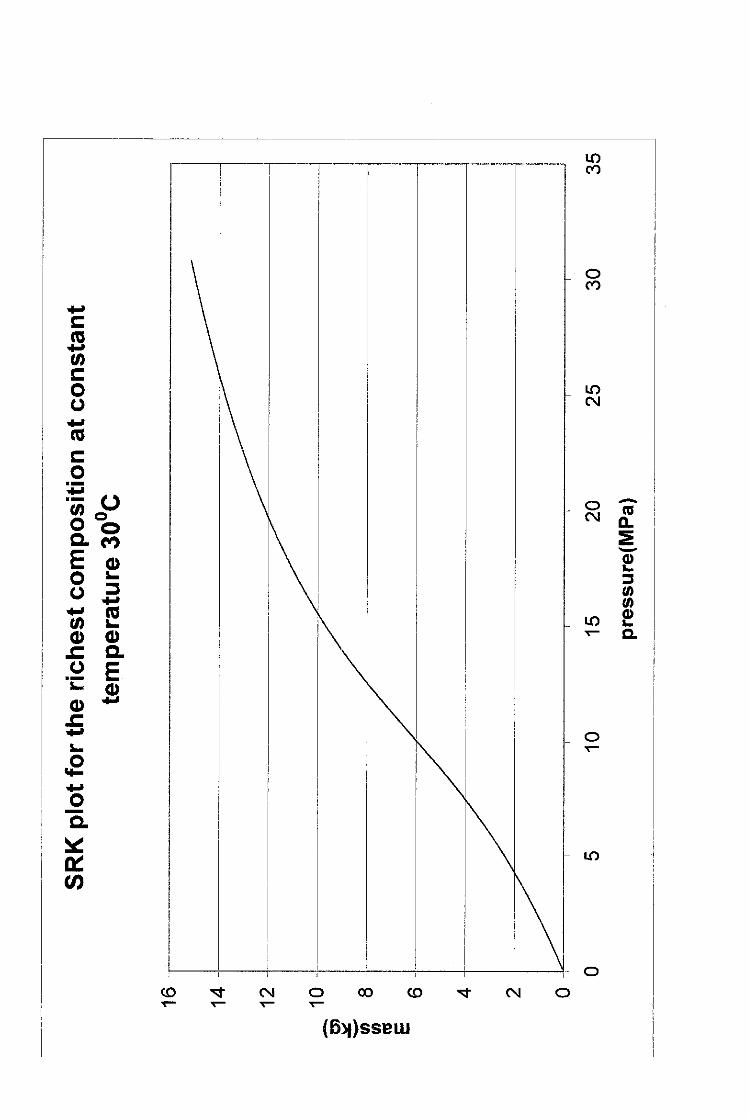
The graph that been plotted gives the result below;
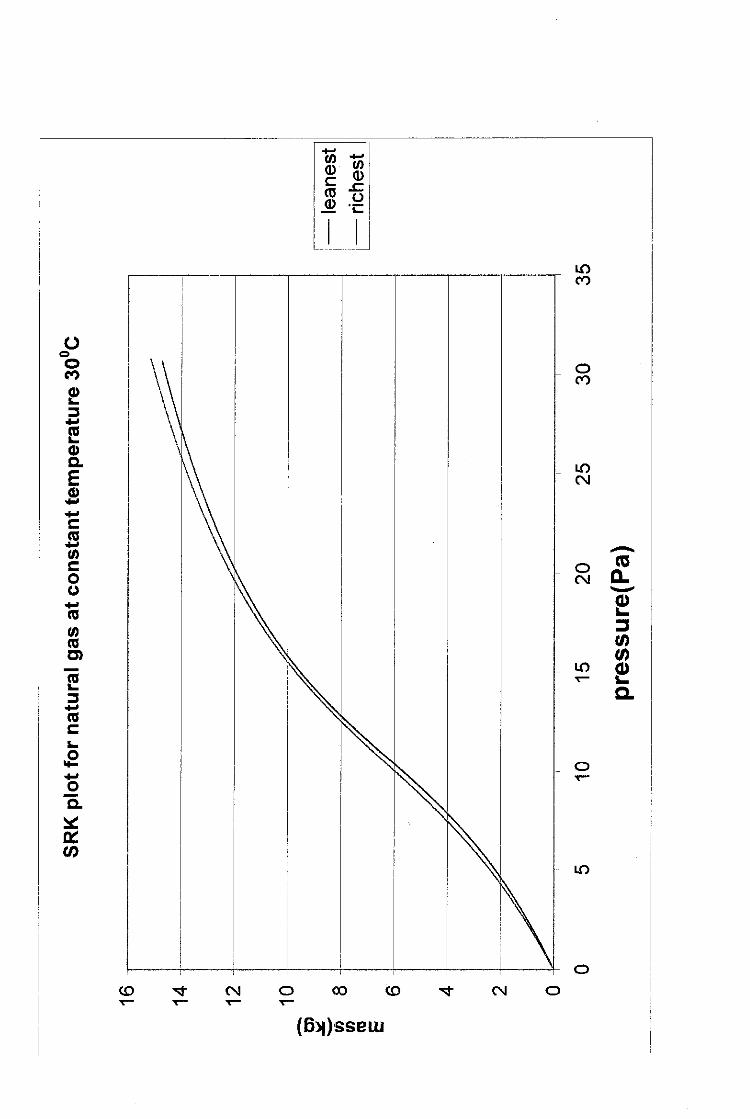
SRK plot for natural gas at constant temperature 30°C
10 15 20 25 30 35
pressure(Pa)
• leanest
•richest
Figure 4: SRKPlot at 30°C
The result that had been determined shows a parabolic relationshipbetween mass and pressure. The steepest slope occurs somewhere between
10 to 20 MPa. And as being observed in the ideal gas behavior, the richest
composition gives slightly higher mass at a certain pressure.
5.4.3 Calculation Using Peng Robinson EOS
The calculation for Peng Robinson is not much different from SRK's
calculation. The only different is the formula used to get the empiricalconstants. The empirical constant is calculated using the formulas below;
36
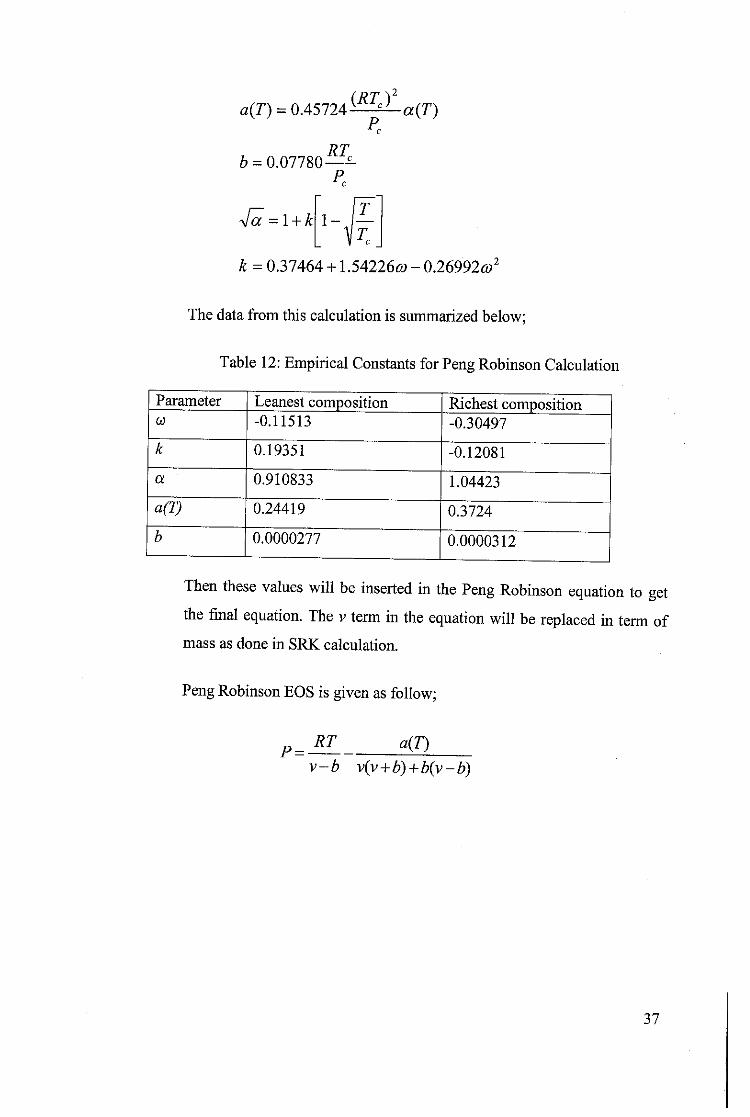
a(T) =0.45724 ^P a(T)P
b = 0.07780
k = 0.37464 +1.542266) - 0.26992^2
RT
1-.1LT
The data from this calculation is summarized below;
Table 12: Empirical Constants forPengRobinson Calculation
Parameter Leanest composition Richest composition0) -0.11513 -0.30497
k 0.19351 -0.12081
a 0.910833 1.04423
a(T) 0.24419 0.3724
b 0.0000277 0.0000312
Then these values will be inserted in the Peng Robinson equation to getthe final equation. The vterm in the equation will be replaced in term ofmass as done in SRK calculation.
Peng Robinson EOS is given as follow;
P =RT a(T)
v-b v{v +b) +b(v-b)
37
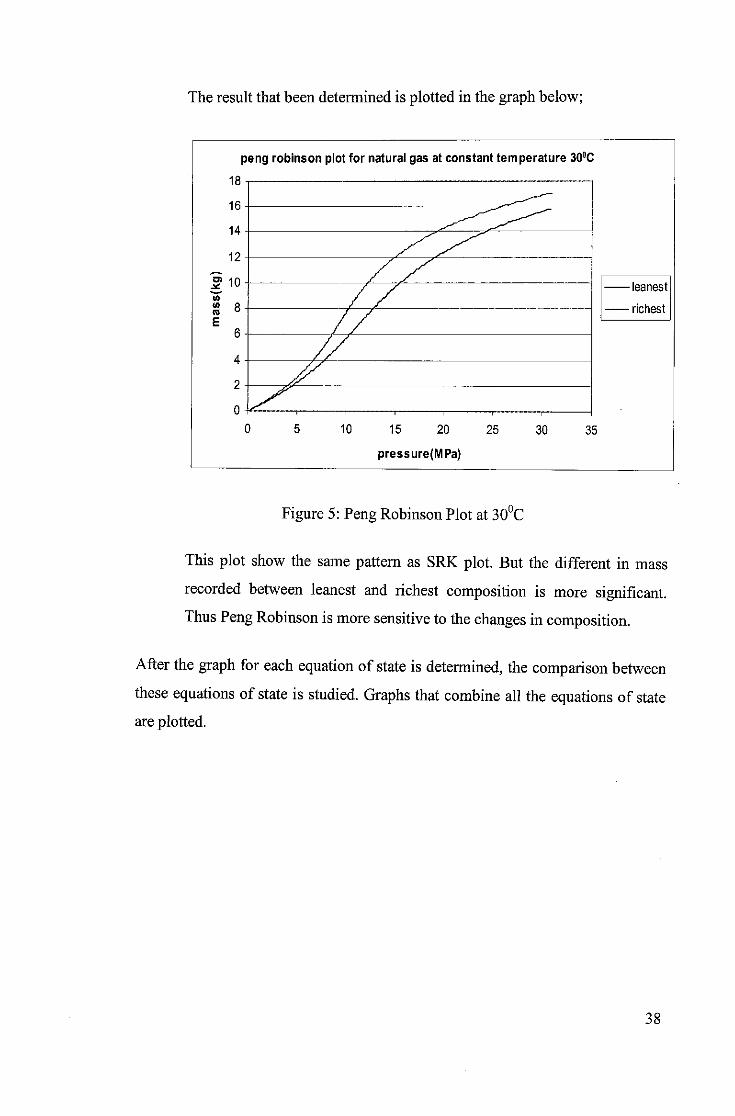
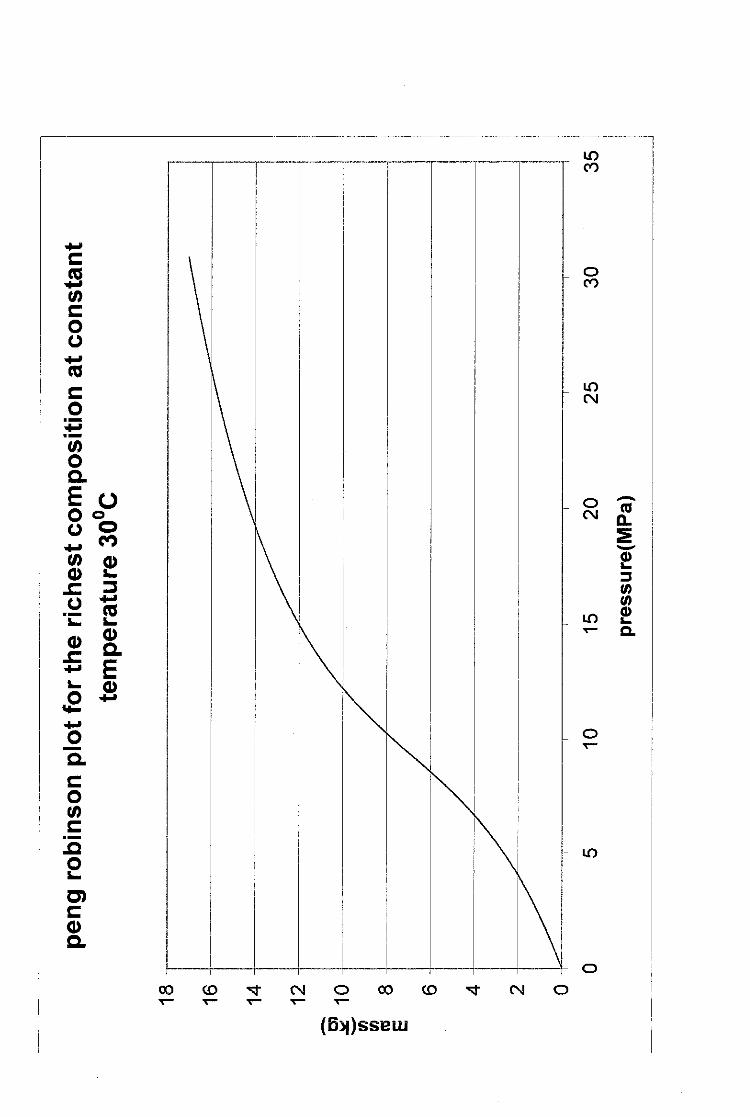
The result that been determined is plotted in the graph below;
peng robinson plot for natural gas at constant temperature 30°C
10 15 20 25
press ure(M Pa)
30 35
•leanest
•richest
Figure 5: Peng Robinson Plotat 30°C
This plot show the same pattern as SRK plot. But the different in mass
recorded between leanest and richest composition is more significant.
Thus Peng Robinson is more sensitive to thechanges in composition.
After the graph for each equation of state is determined, the comparison between
these equations of state is studied. Graphs that combine all the equations of state
are plotted.
38
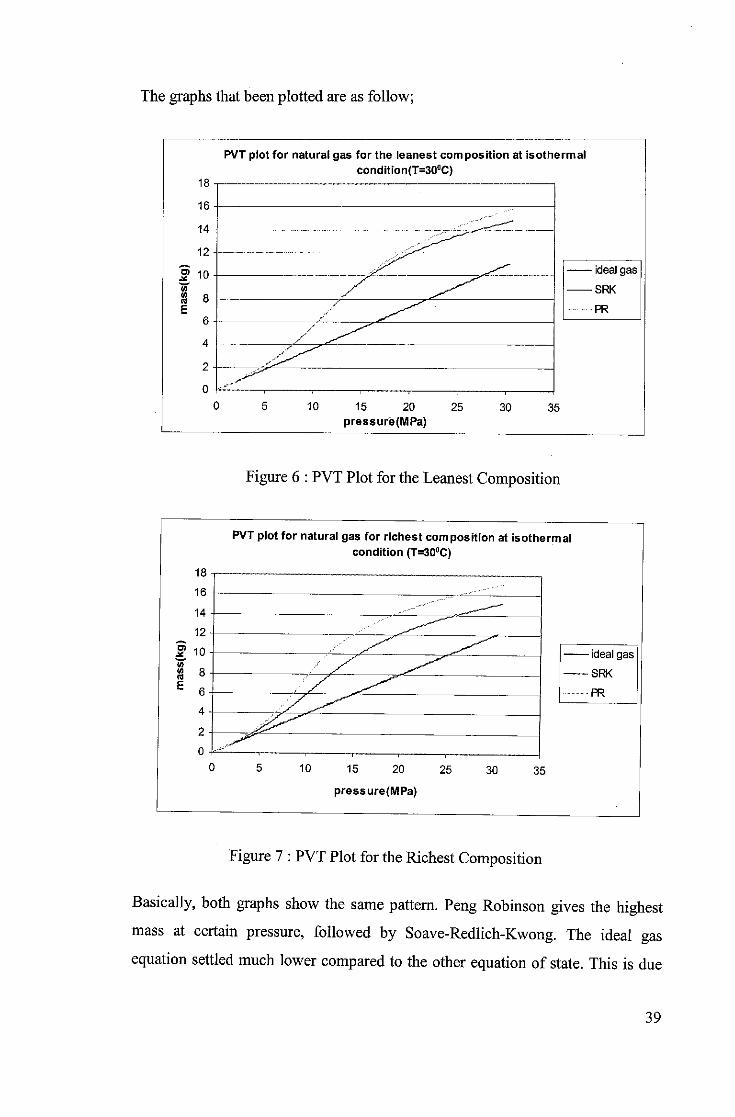
The graphs that been plotted are as follow;
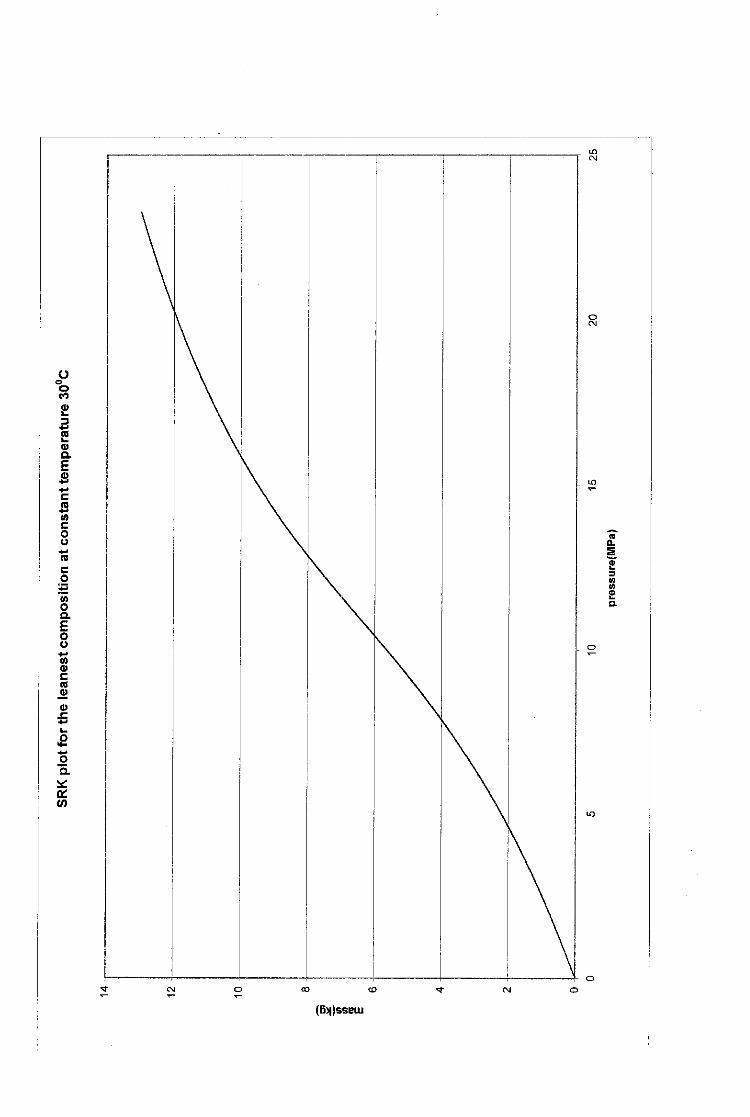
18
16
14
12
3 10
PVT plot for natural gas for the leanest composition at isothermal
condition(T=30°C)
10 15 20
pressure (MPa)25 30 35
Figure 6 : PVTPlot for the Leanest Composition
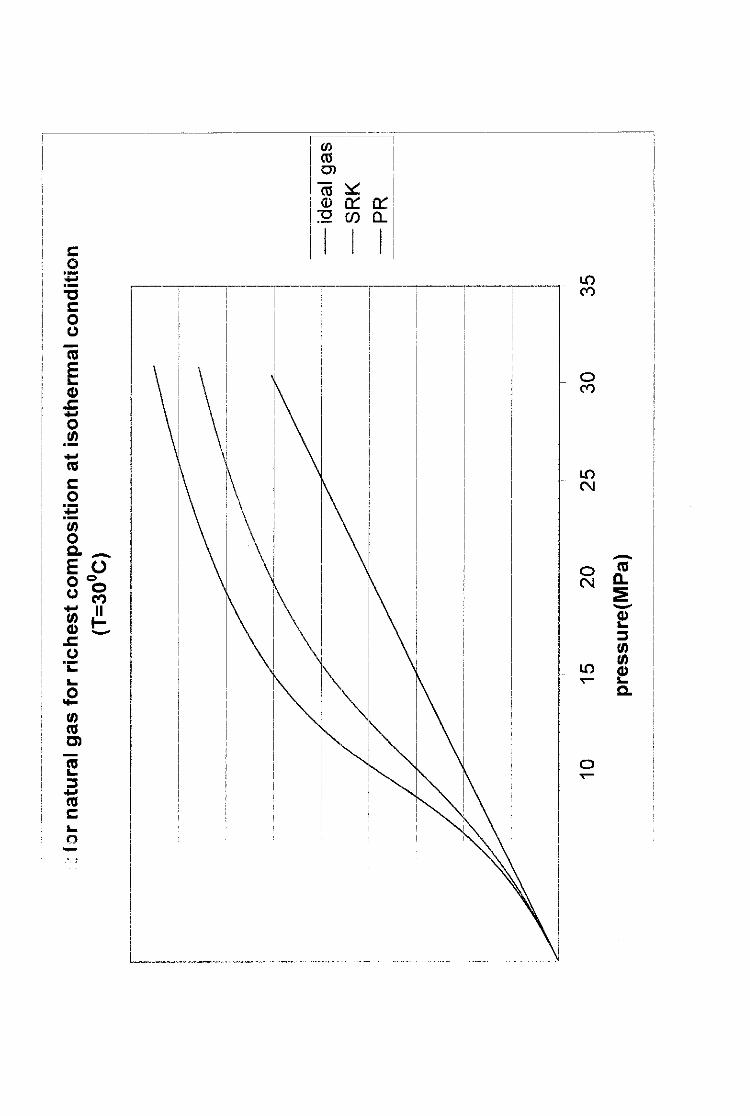
PVTplot for natural gas for richest composition at isothermalcondition (T=30°C)
ideal gas
SRK
PR
•ideal gas
SRK
PR
Figure 7 : PVT Plot for theRichest Composition
Basically, both graphs show the same pattern. Peng Robinson gives the highestmass at certain pressure, followed by Soave-Redlich-Kwong. The ideal gas
equation settled much lower compared to the other equation of state. This is due
39
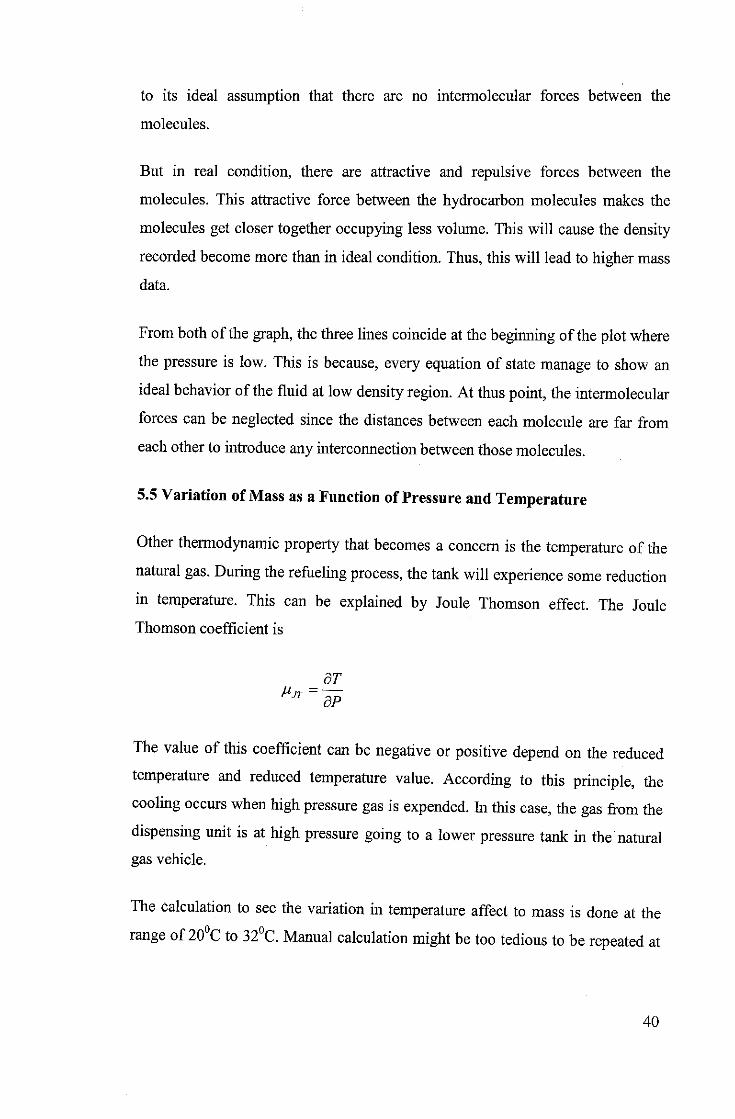
to its ideal assumption that there are no intermolecular forces between the
molecules.
But in real condition, there are attractive and repulsive forces between the
molecules. This attractive force between the hydrocarbon molecules makes the
molecules get closer together occupying less volume. This will cause the density
recordedbecome more than in ideal condition. Thus, this will lead to higher mass
data.
From bothof the graph, the three lines coincide at the beginning of the plotwhere
the pressure is low. This is because, every equation of state manage to show an
ideal behavior of the fluid at low density region. At thus point, the intermolecular
forces can be neglected since the distances between each molecule are far from
each other to introduceany interconnection between those molecules.
5.5 Variation ofMass as a Function ofPressure and Temperature
Other thermodynamic property that becomes a concern is the temperature ofthenatural gas. During the refueling process, the tank will experience some reduction
in temperature. This can be explained by Joule Thomson effect. The Joule
Thomson coefficient is
dT
JT dP
The value of this coefficient can be negative or positive depend on the reducedtemperature and reduced temperature value. According to this principle, thecooling occurs when high pressure gas is expended. In this case, the gas from thedispensing unit is at high pressure going to a lower pressure tank in the naturalgas vehicle.
The calculation to see the variation in temperature affect to mass is done at the
range of 20 Cto 32°C. Manual calculation might be too tedious to be repeated at
40
different temperature. If the temperature is changed, the other properties also
change.
Thus a much simpler approach is considered to perform this calculation. HYSIS
has become the best approach to study the relationship between mass, temperature
and pressure. The method is rather simple. The author only has to choose which
equation of state that want to be used and then enter the composition of the
natural gas. Then, the parameters such as temperature and pressure are keyed in.
The value of density will be displayed. This density will be easily converted to
mass by multiplying with volume of the tank which is 55 liter.
Using this method enable the author to use more equation of state. Here, Lee
Kesler Plocker is also been used as it was found to be suitable for natural gas
application. The result is then plotted in graphs. Below are the results that been
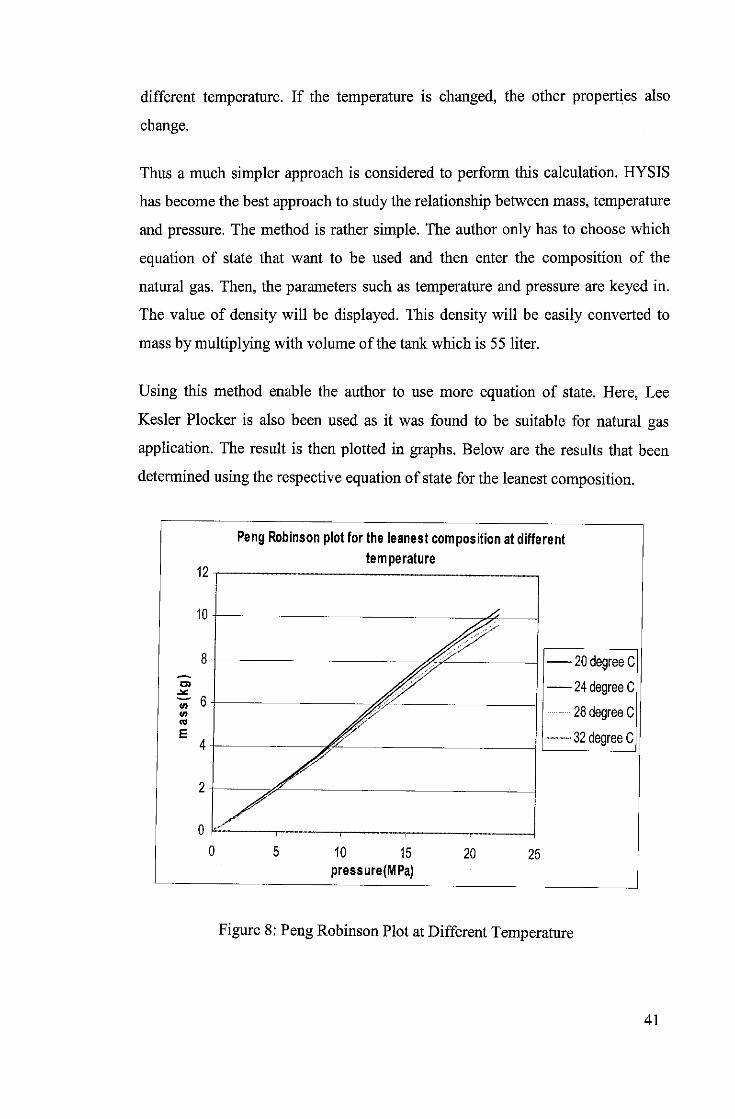
determined using the respective equation ofstate for the leanest composition.
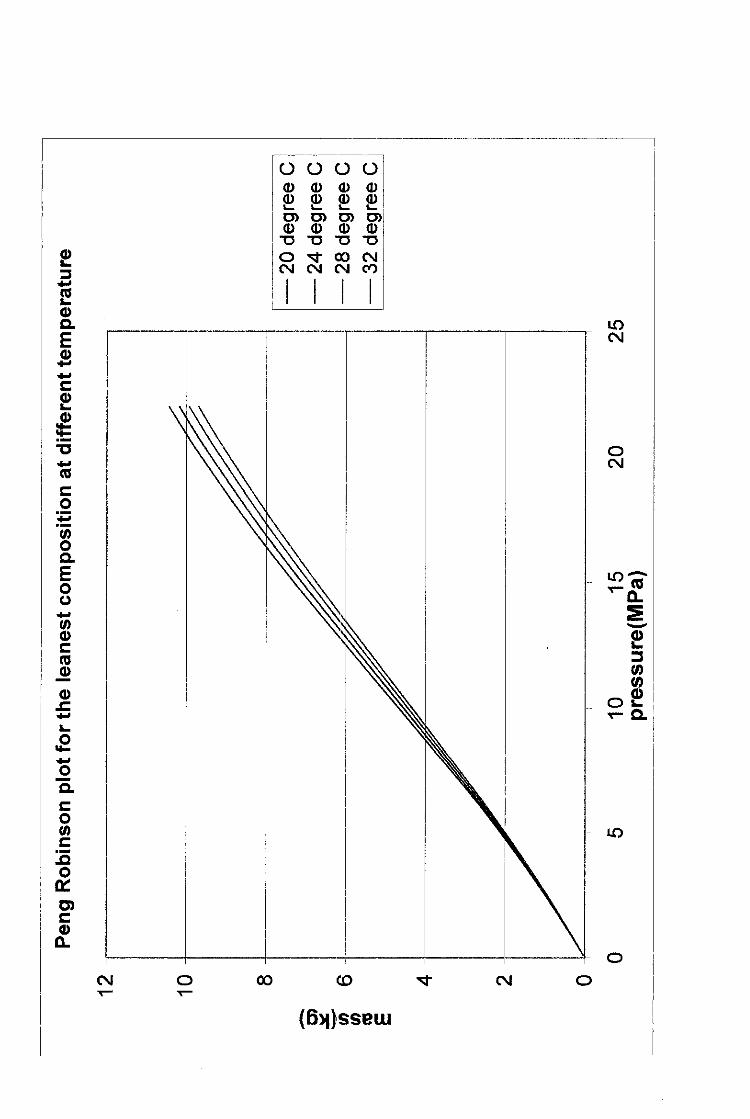
Peng Robinson plot for the leanest composition at differenttemperature
10 15
pressure(MPa)20 25
20degree C
24degree C
28degree C
32 degree C
Figure 8: Peng Robinson Plot atDifferent Temperature
41
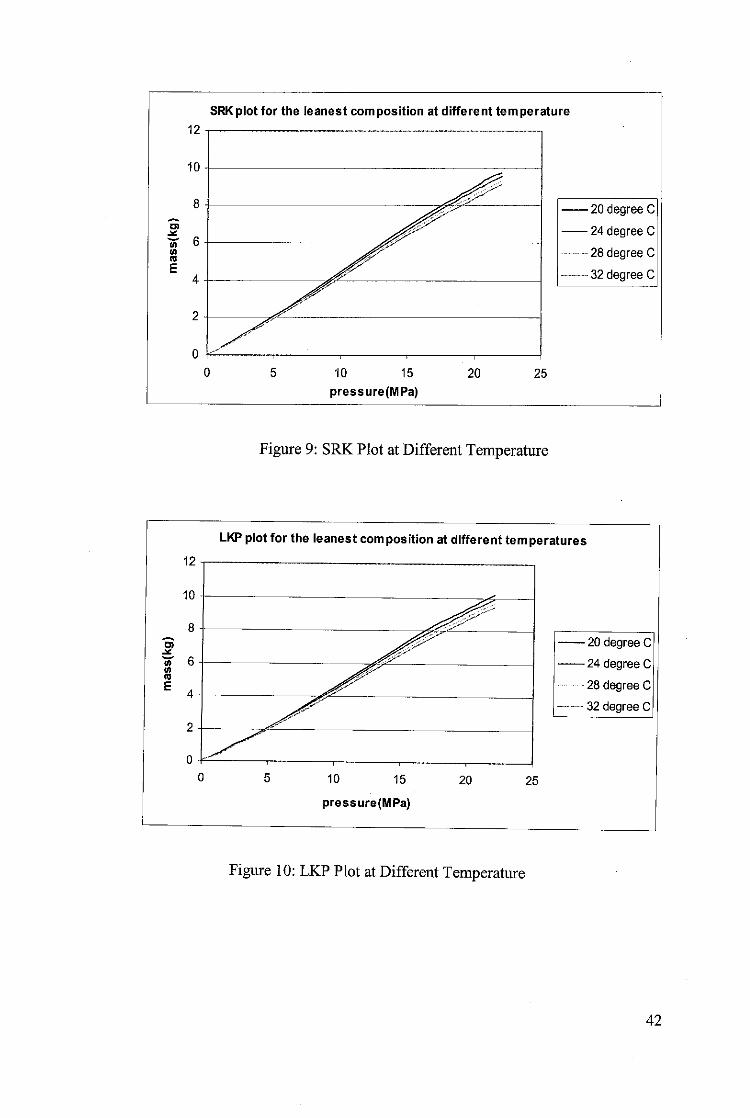
SRK plot for the leanest composition at different temperature
10 15
pressure(MPa)
20 25
Figure 9: SRK Plot at Different Temperature
•20 degree C
24 degree C
28 degree C
32 degree C
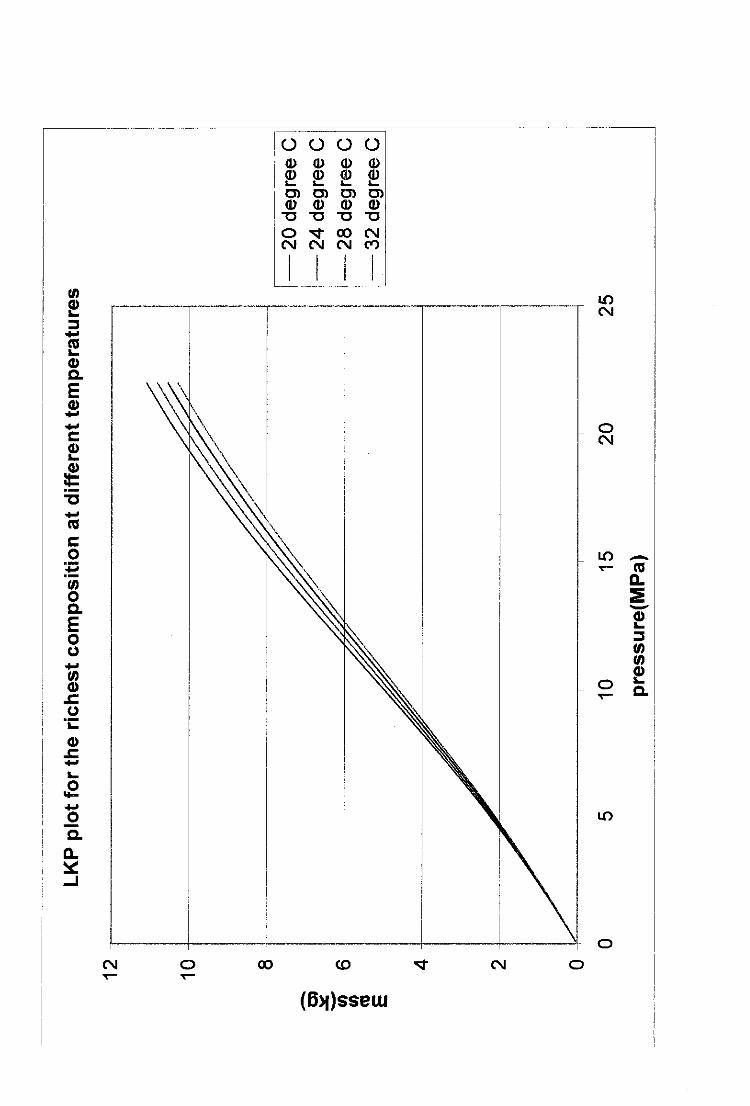
LKP plot for the leanest composition at different temperatures
10 15 20
pressure(MPa)
25
Figure 10: LKP PlotatDifferent Temperature
•20 degree C
•24 degree C
28degree C
32 degree C
42
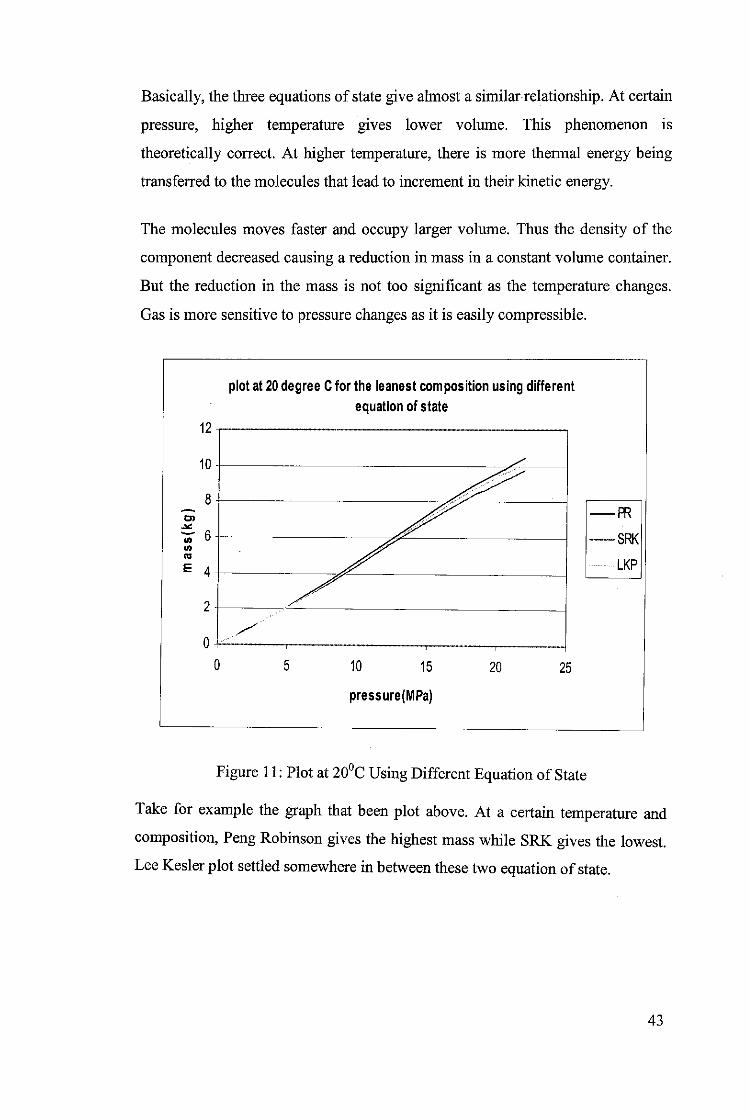
Basically, the three equations of state give almost a similar relationship. At certain
pressure, higher temperature gives lower volume. This phenomenon is
theoretically correct. At higher temperature, there is more thermal energy being
transferred to the molecules that lead to increment in their kinetic energy.
The molecules moves faster and occupy larger volume. Thus the density of the
component decreased causing a reduction in mass in a constant volume container.
But the reduction in the mass is not too significant as the temperature changes.
Gas is more sensitive to pressure changes as it is easily compressible.
12
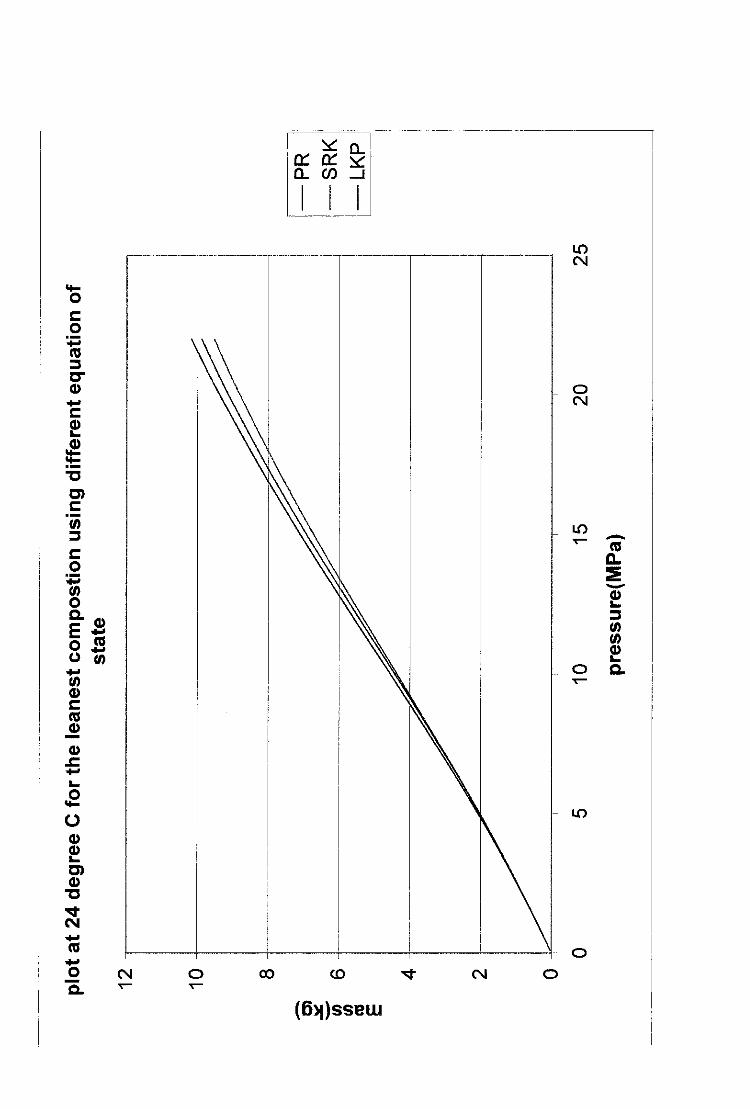
10
J*
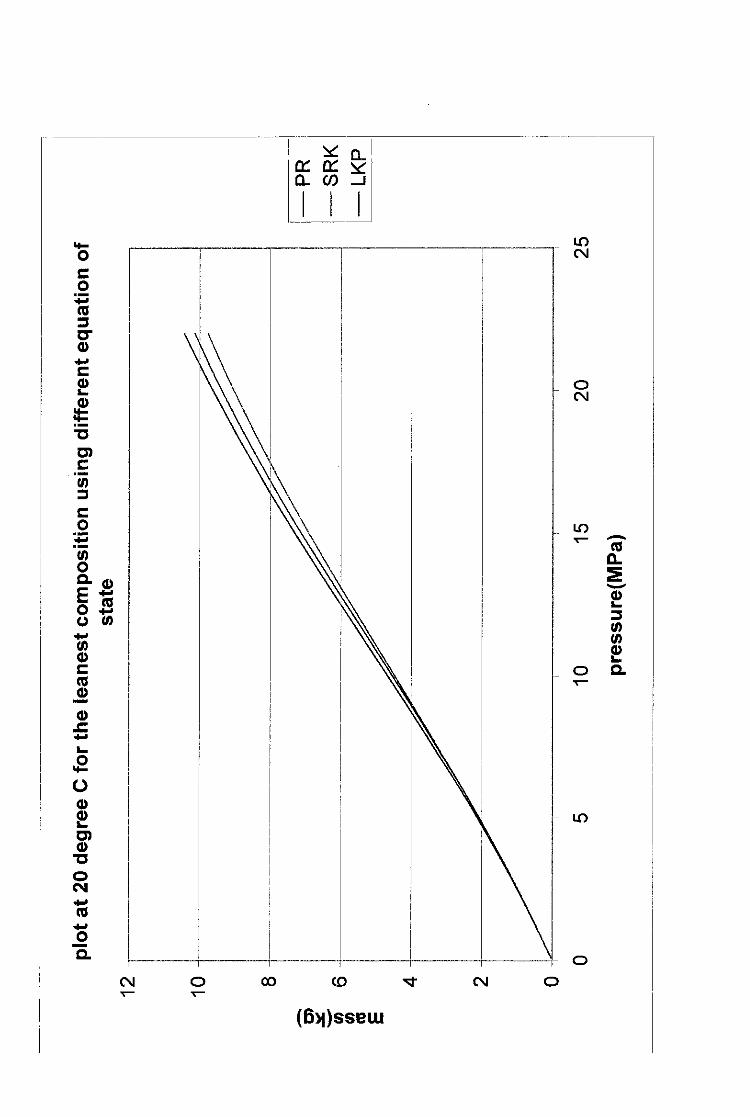
plot at 20 degree Cfor the leanestcomposition using differentequation of state
10 15
pressure(MPa)
20 25
PR
SRK
LKP
Figure 11; Plot at 20°C Using Different Equation ofState
Take for example the graph that been plot above. At a certain temperature and
composition, Peng Robinson gives the highest mass while SRK gives the lowest.
Lee Kesler plot settled somewhere in between these two equation of state.
43
In most literature, Peng Robinson is always the best equation of state for
hydrocarbon. Data gained from calculation is compared with the actual data in
those literatures. The same should have been done in this project. But
unfortunately, the equipment can need to be used for the test cannot reach within
this research period. The only comparison that managed to be done is between the
data determined from this research with data from literature. But this comparison
might not be too accurate as the composition of natural gas used in the literature is
not the same with the one in this research.
Note : for more graph at different composition and temperature, please refer
appendix.
44
6.0 CONCLUSION AND RECOMMENDATION
The objective of the research to convert natural gas volume to its mass using its
thermodynamic properties has been achieved. The relationship between natural gas
properties and its variation in density and mass can be observed as well.
The density and mass is directly proportional with pressure. If pressure in the system
increased, the density will also increase. This is because, at higher pressure, there will be
more force been exerted on the molecules causing them to get closer to each other. This
cause an increase in density and at constant volume, the mass of the system also
increases.
Temperature on the other hand cause reduction in mass as temperature is increased. At
higher temperature, the molecules get more power in form of heat causing them to move
more frequently and occupy larger volume. The distance between the molecules is
increasing causing a reduction in density. And for an isochoric system, the mass of the
natural gaswill decrease if the temperature is increase and the pressure is kept constant.
From the literature, Peng Robinson is the best equation of state that can be applied for
natural gas system. Peng Robinson is developed as an improvement of Soave Redlich
Kwong thus offering a more accurate reading compared to SRK. Besides, many
literatures had been done and conclude that Peng Robinson is best suited for light
hydrocarbon calculation. In this research, PengRobinson gives higher reading of mass at
a certain pressure and temperature compared to Soave Redlich Kwong and Lee Kesler
Plocker.
The effect of composition is been determined in this research. The richest composition
which has higher molecular weight gives a higher reading of mass at certain pressure and
temperature. The same pattern is observed for every Equations of State.
Peng Robinsonis considered as the best by referring to the theoretical research. There is a
necessity to have the data been compared and justified by real test. Since there is no
facilities that can be used to test the data, the procedure could not be performed. Thus, in
45

future, when the equipment is purchased and ready for used, the test to confirm this data
should be conducted. This test is important to determine which Equation of State gives
the best data that can fit the actual process.
Calculation using combination of several equation of state and activity coefficient
method could be test as well. The result might give a better data that can fit the real
process much better compared to the single Equation of State. At some range of
temperature and pressure, one Equation of State might be used and then at another range,
the other Equation of State could be implemented.
A wider range of composition might also be studied. More data from PRSS is required in
order to perform this calculation. Calculation might be done by creating own
composition, but this might not be practical. It would be much better if the compositions
that been used are the one available in market.
Basically, the objectives of the project to convert volume of natural gas to its density had
been achieved. Hopefully, this research can help to build a natural gas refueling station at
lower cost.
46

7.0 REFERENCES
1. Equations of state<http://en.wikipedia.org/wiki.Equation_of_State>
2. Natural gas composition.<http://www.escenter.org/TechProDemo/OtherFuel/natural_Gas.htm>
3. natural gas composition<www.naturalgas.org>
4. Combustion knock < http://www.technocarb.com/natgasproperties.htm>
5. Sandler, I. Stanley (1999) " Chemical and Engineering Thermodynamics" ThirdEdition; John Wiley & Sons, Inc; Universityof Delaware.
6. R K Sinnot (2001) "Coulson &Richardson Chemical Engineering Design, Volume 6"ThirdEdition ; Butterworth Heinemann ; Great Britain.
7. Campbell M. John (1994)" Gas Conditioning and Processing, Volume 1 : The BasicPrinciples" Seventh Edition; Campbell Petroleum Series; Oklohama.
8. Jack Winnick (1996) "Chemical Engineering Thermodynamic : An Introduction toThermodynamic for Undergraduate Engineering Student", Canada
9. N. Varutsis, G. Steward, A.C Tood Mclancey (1986) "Efficient Method for CalculationofCompressibility, Density and Viscosity ofNatural Gas", Petrol Technology JournalVol 38, pg 121-131
10. R.C Reid, J.M Prausnitz, B. Poling (1999) " The Properties ofGases and Liquid,FourthEdition", Mc Graw Hill,United State
11. J.F Estela Uribe, J Jaramillo, M.A Salazar, J.P.M Trusler ( June 2002) "VirialEquation of State for natural Gas System"
47
idea
lgas
plot
fort
hele
anes
tcom
posi
tion
atco
ntan
ttem
pera
ture
30°C
15
20
pre
ssu
re(M
Pa)
25
30
.3
5
SRK
plot
fort
hele
anes
tcom
posi
tion
atco
nsta
ntte
mpe
ratu
re30
°C
pre
ssu
re(M
Pa)

o
peng
robi
nson
plot
for
the
lean
estc
ompo
siti
onat
30°C
10
15
20
pre
ssu
re(M
Pa
)
25
30
35
lor
nat
ura
lg
as
for
rich
est
co
mp
osi
tio
nat
iso
therm
al
co
nd
itio
n
(T=3
0°C
)
10
15
20
25
pre
ssu
re(M
Pa)
30
35
CO
w CO E
0
idea
lgas
plot
for
the
rich
estc
ompo
siti
onat
cons
tant
tem
pera
ture
30°C
10
15
20
pre
ssu
re(M
Pa)
25
30
35
o
SR
Kp
lot
for
the
rich
est
com
po
siti
on
at
co
nst
an
t
tem
pera
ture
30°C
10
15
20
pre
ssu
re(M
Pa
)
25
30
35
o
pen
gro
bin
son
plo
tfo
rth
eri
ch
est
com
po
siti
on
at
co
nst
an
t
tem
pera
ture
30°C
10
15
20
pre
ssu
re(M
Pa)
25
30
35
14
12
10
ra8
(0
6 0
0
idea
lga
spl
otof
natu
ral
gas
atco
nsta
ntte
nper
atur
e(30
°C)
10
15
20
pre
ssu
re(M
pa
)
25
30
35
lean
est
rich
est
Oo
OCO
+j
2a>a
E0)
+•*
+•»
c(0
+•»
(Acoo
(0
(ACOO)
23
+•»
COc
_oa.
a:
CD
tn
c
CO
0)
o
L
CM O 00 CD ^r
(B^)ssblu
CM
CO
oCO
LOCM
OCM
in
o
m
o
(00.
(A0)

0
peng
robi
nson
plot
for
natu
ral
gas
atco
nsta
ntte
mpe
ratu
re30
°C
10
15
20
pre
ssu
re(M
Pa)
25
30
35
lean
est
rich
est
plo
tat
20
deg
ree
Cfo
rth
ele
an
est
com
po
siti
on
usi
ng
dif
fere
nt
equ
atio
no
fsta
te
01
01
5
pre
ssu
re(M
Pa)
20
25
plo
ta
t2
4d
egre
eC
for
the
lea
nes
tco
mp
ost
ion
usi
ng
dif
fere
nt
equ
ati
on
of
sta
te
12
O)
JC ID 10
(0 E
10 8 0
01
01
5
pre
ssu
re(M
Pa
)
20
25

0
plo
tat
28d
egre
eC
for
the
lean
est
com
po
siti
on
usi
ng
dif
fere
nt
equ
atio
ns
of
sta
te
10
15
pre
ssu
rre(M
Pa)
20
25

In to re E
12
10 8 6 0
plo
tat
32
deg
ree
Cfo
rth
ele
an
est
com
po
siti
on
usi
ng
dif
fere
nt
equ
atio
no
fsta
te
01
01
5
pre
ssu
re(M
Pa)
20
25
PR
SR
K
LK
P

0
SR
Kp
lot
for
the
lean
est
co
mp
osi
tio
nat
dif
fere
nt
tem
pera
ture
10
15
pre
ssu
re(M
Pa)
20
25
20
deg
ree
C
24
deg
ree
C
28
deg
ree
C
32
deg
ree
C
Pen
gR
ob
inso
np
lotf
or
the
lean
est
com
po
siti
on
at
dif
fere
nt
tem
per
atu
re
01
01
5p
ress
ure
(MP
a)
20
25
20degreeC
24degreeC
28degreeC
32degreeC

0
LK
Pp
lot
for
the
lea
nest
co
mp
osi
tio
na
td
iffe
ren
tte
mp
era
ture
s
10
15
pre
ssu
re(M
Pa
)
20
25
20
deg
ree
C
24
deg
ree
C
28
deg
ree
C
32
deg
ree
C
0
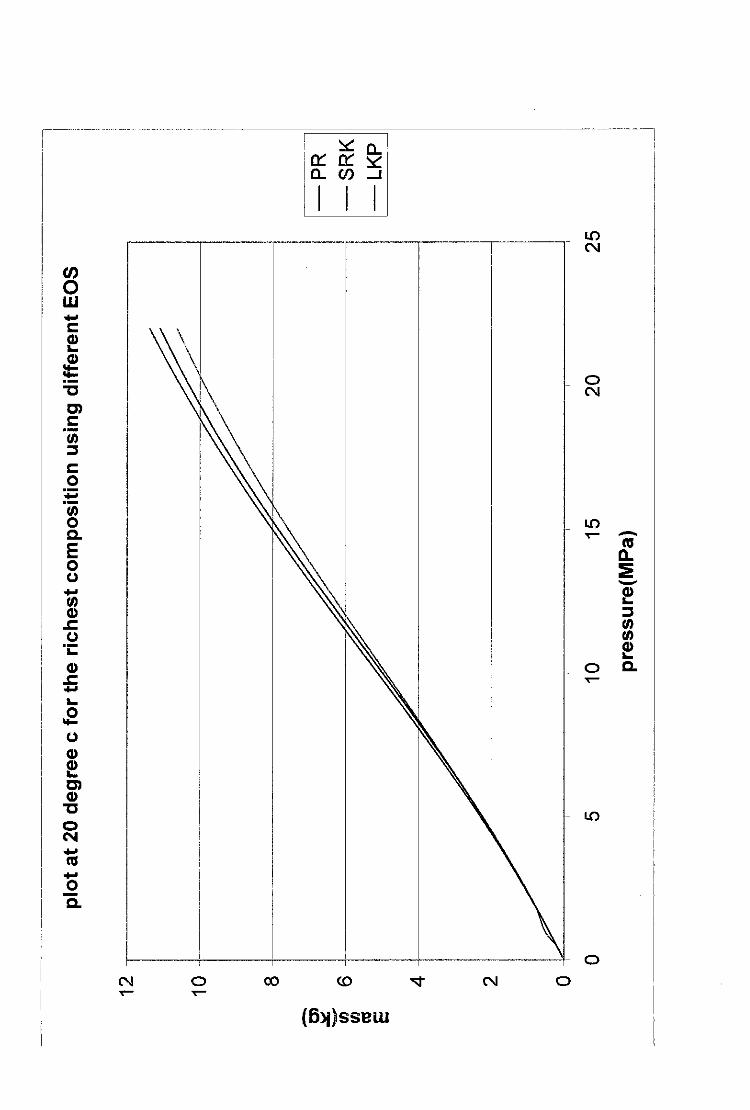
plo
tat
20
deg
ree
cfo
rth
eri
ch
est
com
po
siti
on
usi
ng
dif
fere
nt
EO
S
10
15
pre
ssu
re(M
Pa)
20
25
PR
SR
K
LK
P

0
plo
tat
24
deg
ree
Cfo
rth
eri
ches
tco
mp
osi
tio
nu
sin
gd
iffe
ren
tE
OS
10
15
pre
ssu
re(M
Pa)
20
25
PR
SR
K
LK
P
0
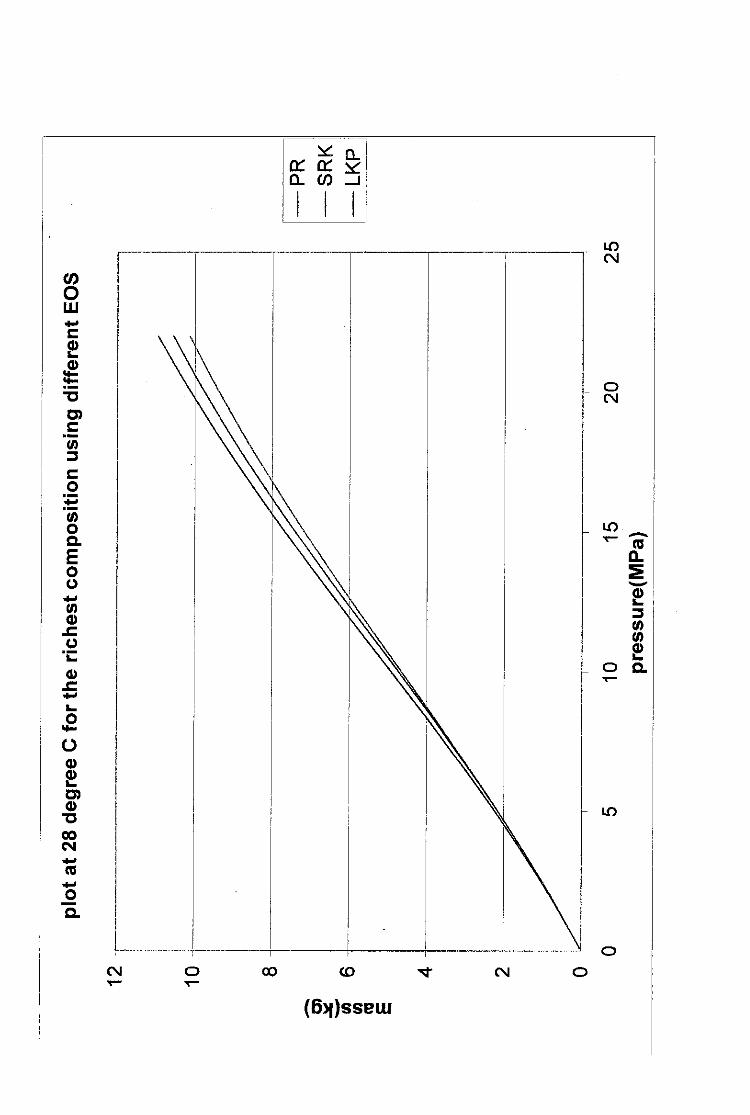
plo
tat
28d
egre
eC
for
the
rich
est
com
po
siti
on
usi
ng
dif
fere
nt
EO
S
10
15
pre
ssu
re(M
Pa
)2
02
5

0
plot
at32
deg
ree
Cfo
rth
eri
ches
tco
mp
osi
tio
nus
ing
diff
eren
tE
OS
10
15
pre
ssu
re(M
Pa)
20
25
PR
SR
K
LK
P

12
10 8 6 0
0
SR
Kp
lot
for
the
rich
est
com
po
siti
on
at
dif
fere
nt
tem
pera
ture
s
10
15
pre
ssu
re(M
Pa)
20
25
20degreeC
24degreeC
28degreeC
32degreec

12
10 8
E
6 0
0
Pen
gro
bin
son
plo
tfo
rth
eri
ch
est
co
mp
osi
tio
na
td
iffe
ren
tte
mp
era
ture
10
15
pre
ssu
re(M
Pa
)
20
25
20
deg
ree
C
24
deg
ree
C
28
deg
ree
C
32
deg
ree
C
CO E
12
10 8 0
0
LK
Pp
lot
for
the
rich
est
co
mp
osi
tio
na
td
iffe
ren
tte
mp
era
ture
s
10
15
pre
ssu
re(M
Pa
)
20
25
20
deg
ree
C
24
deg
ree
C
28
deg
ree
C
32
deg
ree
C