Embed Size (px)
Citation preview
Chemical DegradationChemical DegradationNREM 612
Dr. Greg Bruland
Chemical DegradationChemical Degradation
I. Acid Deposition
A. Types
1. Wet: rain, snow, mist, hail
2. Dry: dust, particulate, aerosols, smog
B. Major cause:
1. SO2 emissions
a. Natural sources:
b Anthropogenic sources:
2
b. Anthropogenic sources:
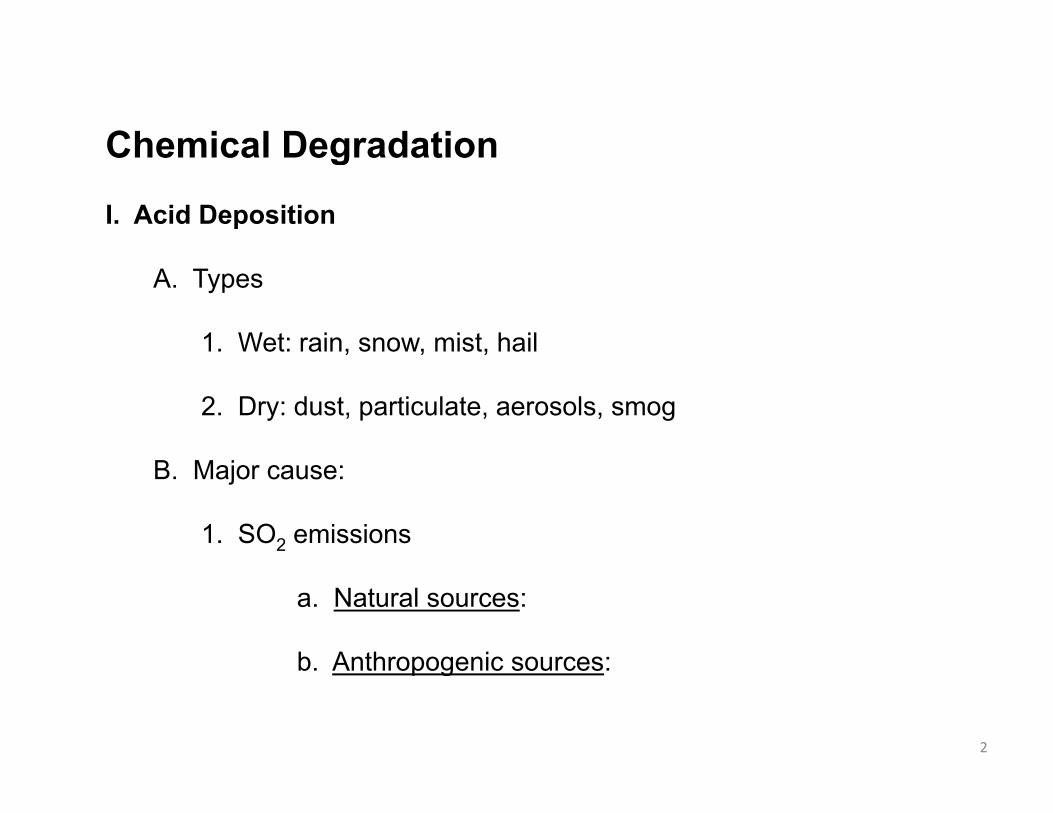
C. Effects on Ecosystems:
1. Damage to plants
2. Alteration of soil, H2O chemistry
i. ↓ in acid neutralization capacity of soil & H2O
3. Alteration of microbial activity, diversity
3
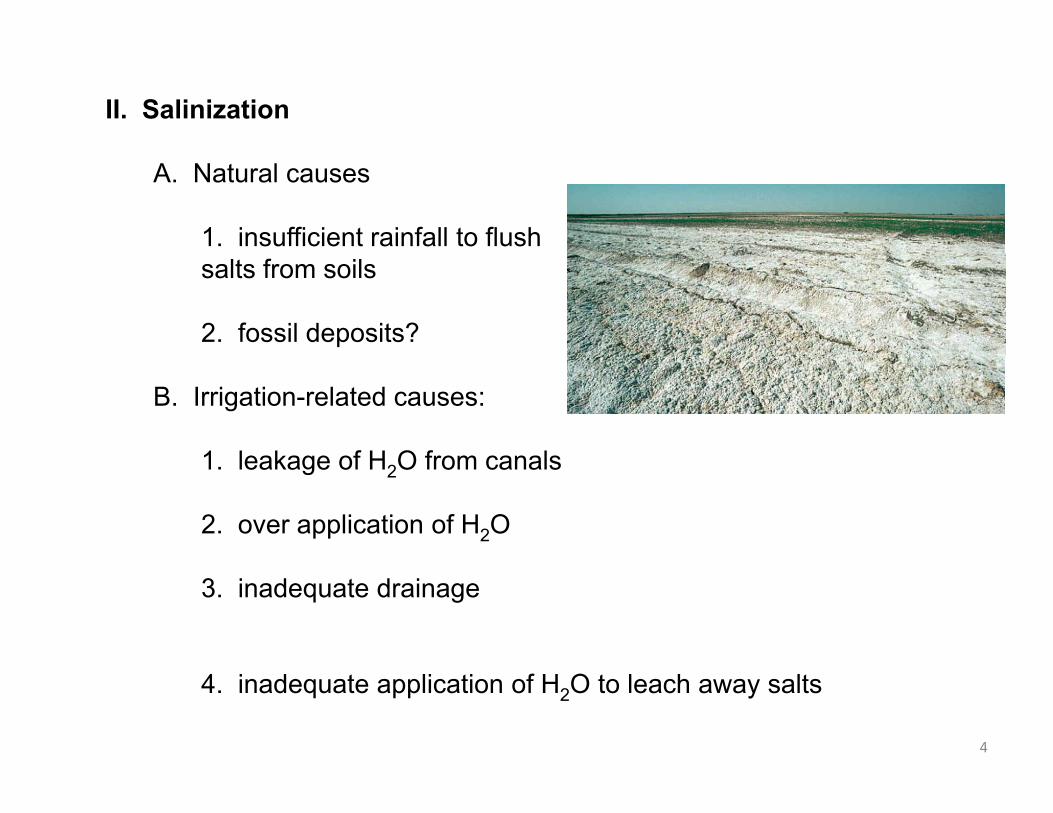
II. Salinization
A. Natural causes
1. insufficient rainfall to flush salts from soils
2. fossil deposits?
B. Irrigation-related causes:
1 leakage of H O from canals1. leakage of H2O from canals
2. over application of H2O
3. inadequate drainage
4
4. inadequate application of H2O to leach away salts
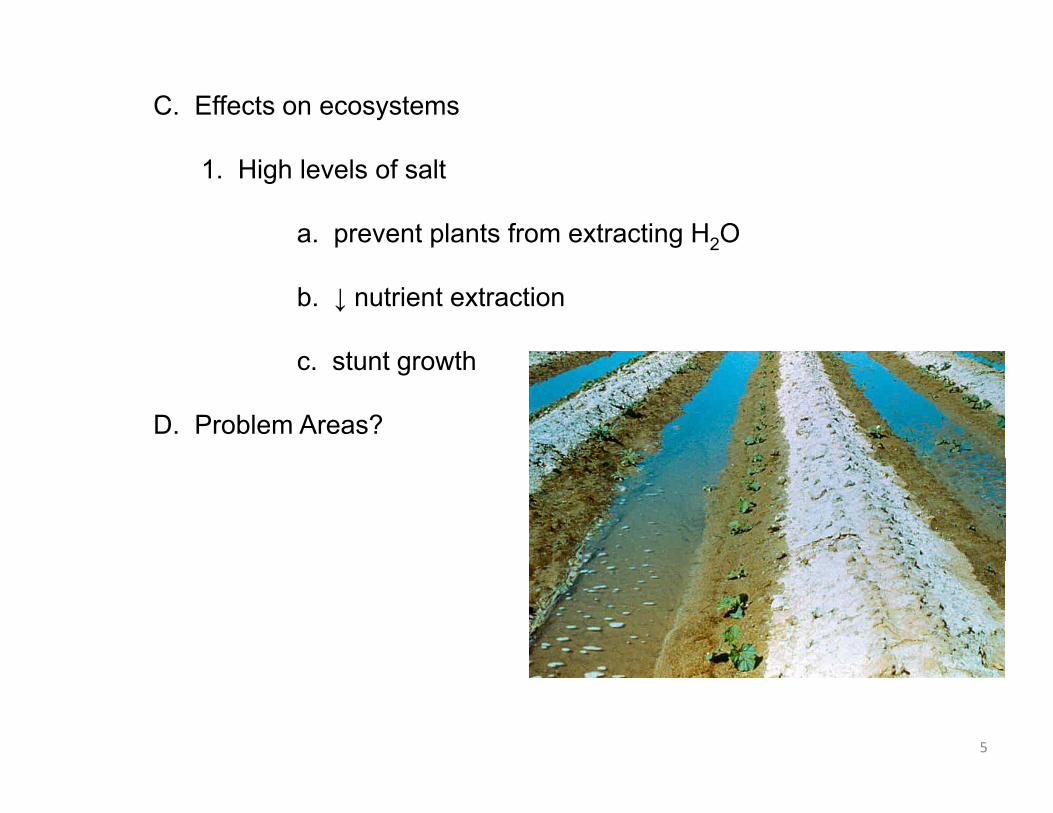
C. Effects on ecosystems
1. High levels of salt
a. prevent plants from extracting H2O
b. ↓ nutrient extraction
t t thc. stunt growth
D. Problem Areas?
5
III. Greenhouse Effect (GHE) & Glob Clim ∆
Explanation:
Solar energy passes thru atmo w/ little absorptionSolar energy passes thru atmo w/ little absorption
Earth’s land & sea surf warmed by radiation, & reradiate energy y , gy@ longer s
Some re-radiated energy (~30 %) absorbed by H2O vapor, some by CO2.
Most trapping takes place in lower atmosphere
6
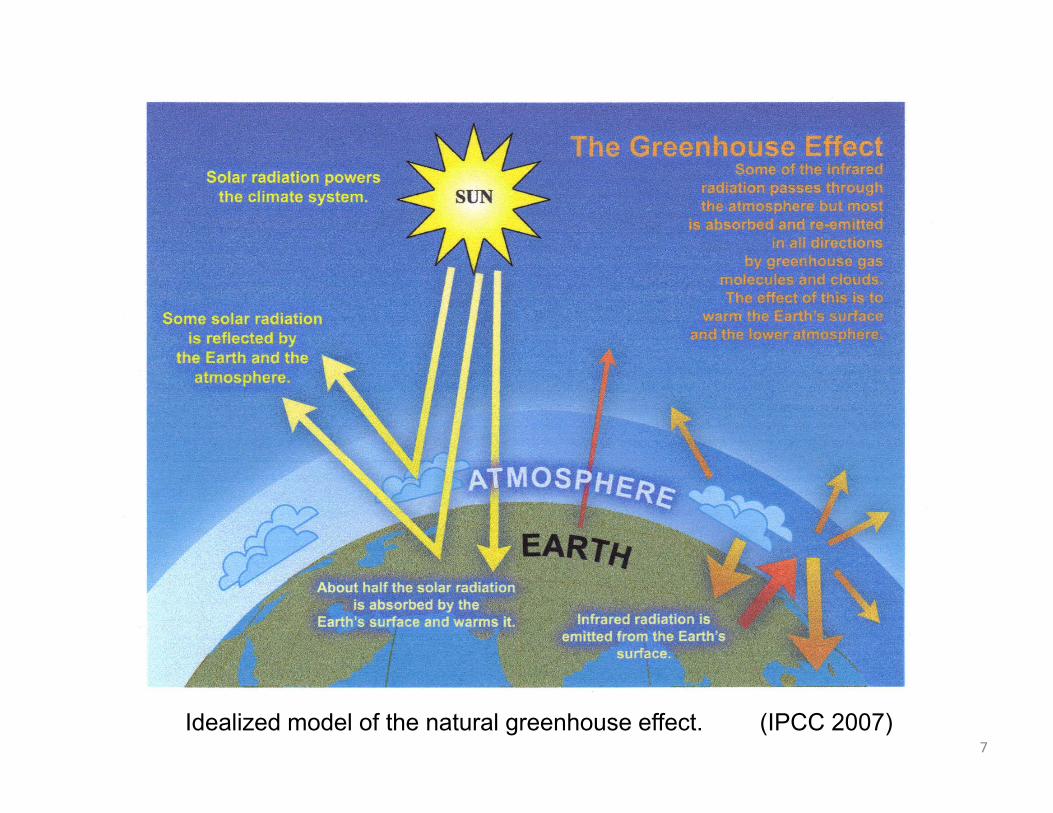
7(IPCC 2007)Idealized model of the natural greenhouse effect.
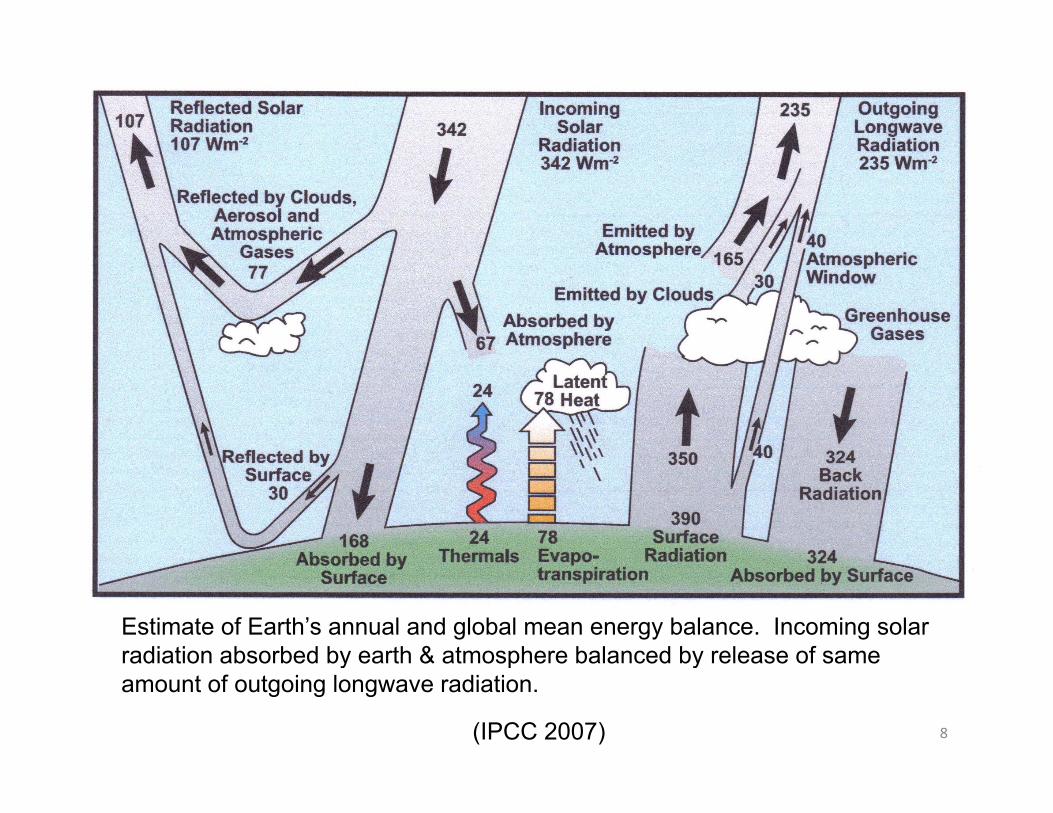
Estimate of Earth’s annual and global mean energy balance. Incoming solar radiation absorbed by earth & atmosphere balanced by release of same
8(IPCC 2007)
radiation absorbed by earth & atmosphere balanced by release of same amount of outgoing longwave radiation.
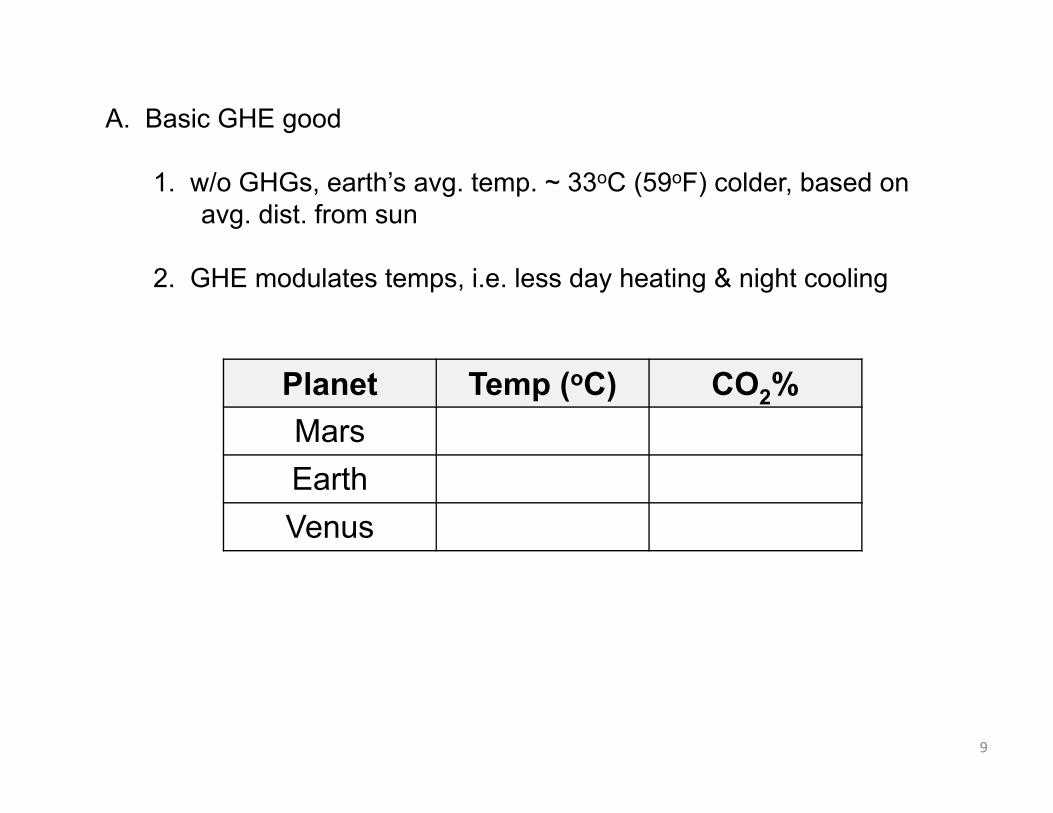
A. Basic GHE good
1. w/o GHGs, earth’s avg. temp. ~ 33oC (59oF) colder, based on avg. dist. from sun
2. GHE modulates temps, i.e. less day heating & night cooling
Planet Temp (oC) CO2%MarsEarthVenus
9
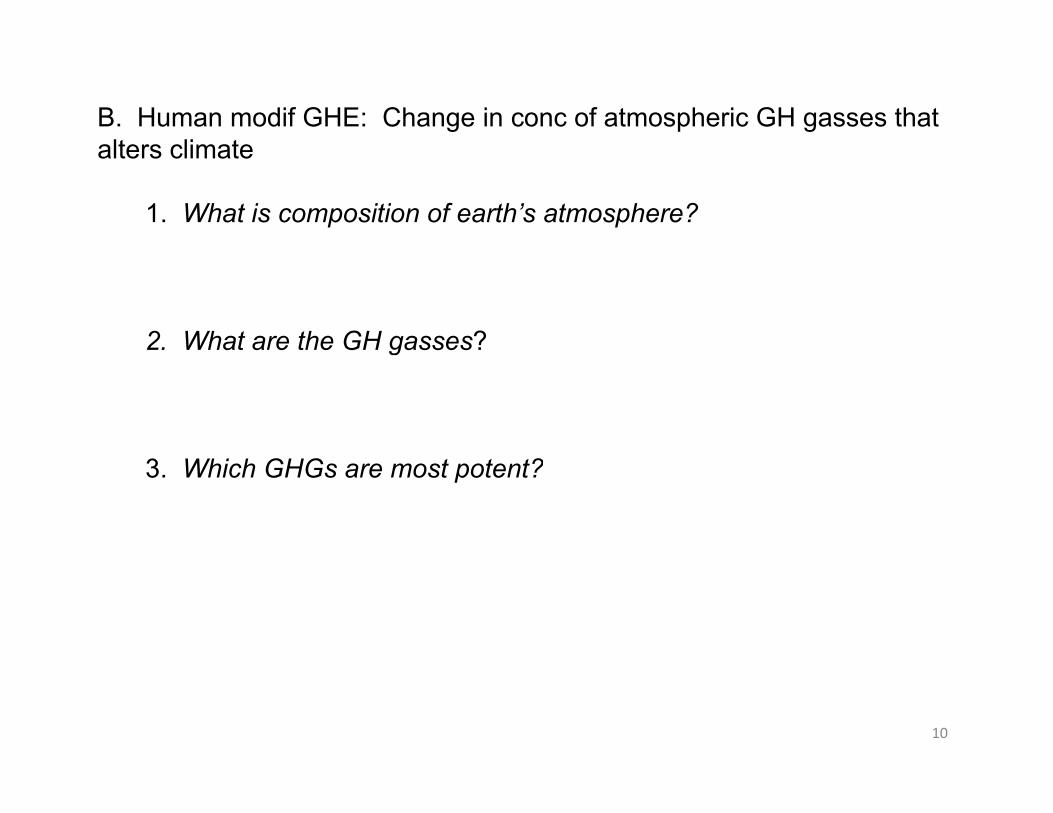
B. Human modif GHE: Change in conc of atmospheric GH gasses that alters climatealters climate
1. What is composition of earth’s atmosphere?
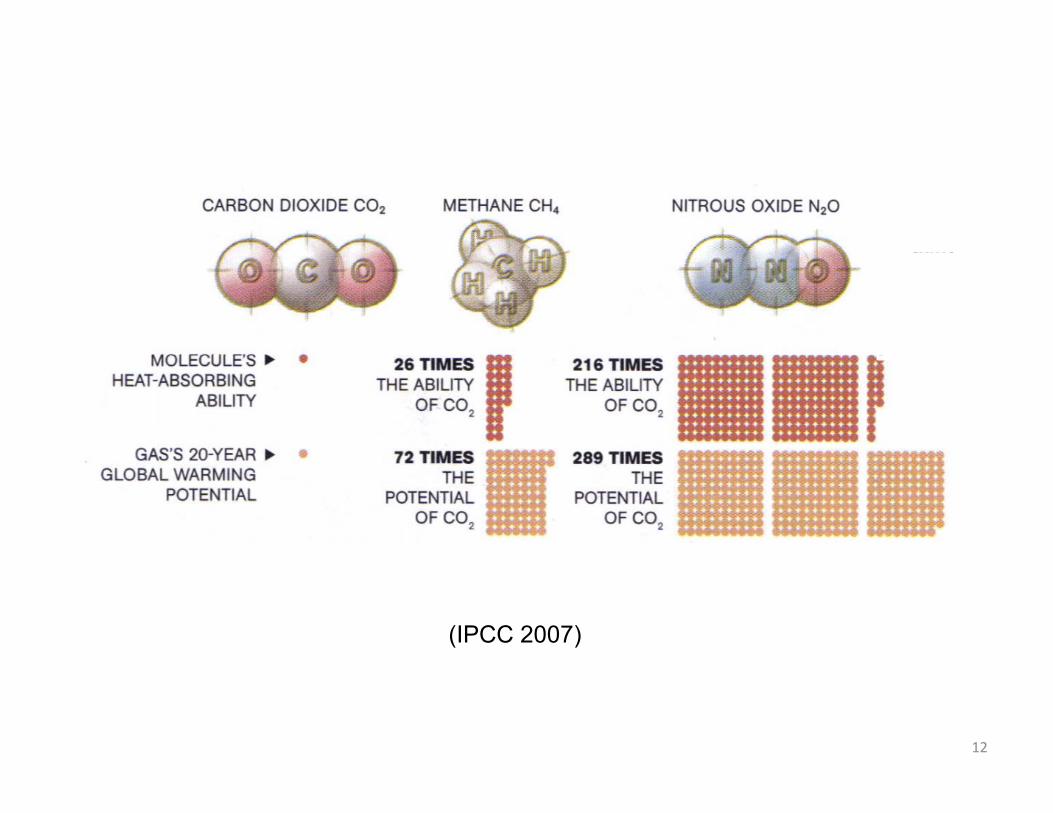
2. What are the GH gasses?
3. Which GHGs are most potent?
10
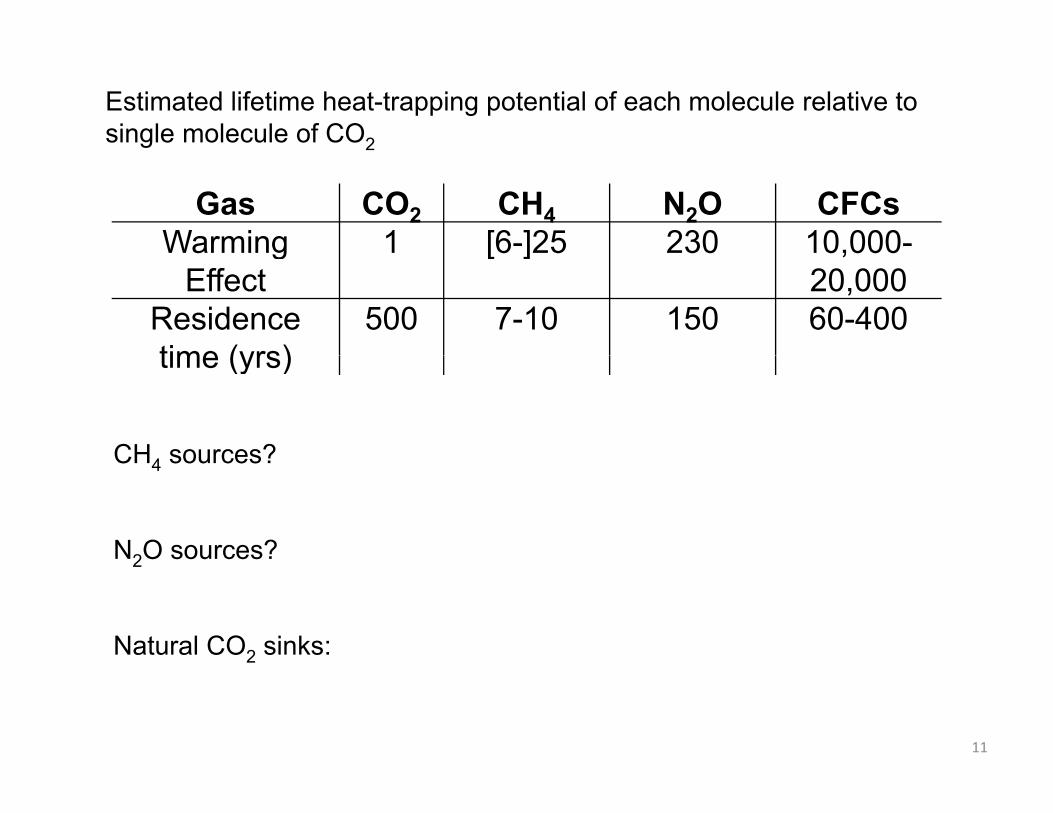
Estimated lifetime heat-trapping potential of each molecule relative to single molecule of CO2
Gas CO2 CH4 N2O CFCsWarming 1 [6-]25 230 10,000-a g
Effect[6 ] 5 30 0,000
20,000Residence time (yrs)
500 7-10 150 60-400time (yrs)
CH sources?CH4 sources?
N2O sources? 2
Natural CO2 sinks:
11
(IPCC 2007)
12
C. Q: w/ fluctuations in climate (i.e. changes in solar radiation [sunspots],C. Q: w/ fluctuations in climate (i.e. changes in solar radiation [sunspots], Milankovitch Cycles, El Nino, volcanoes, etc.) is Clim ∆ real or part of natural variation?
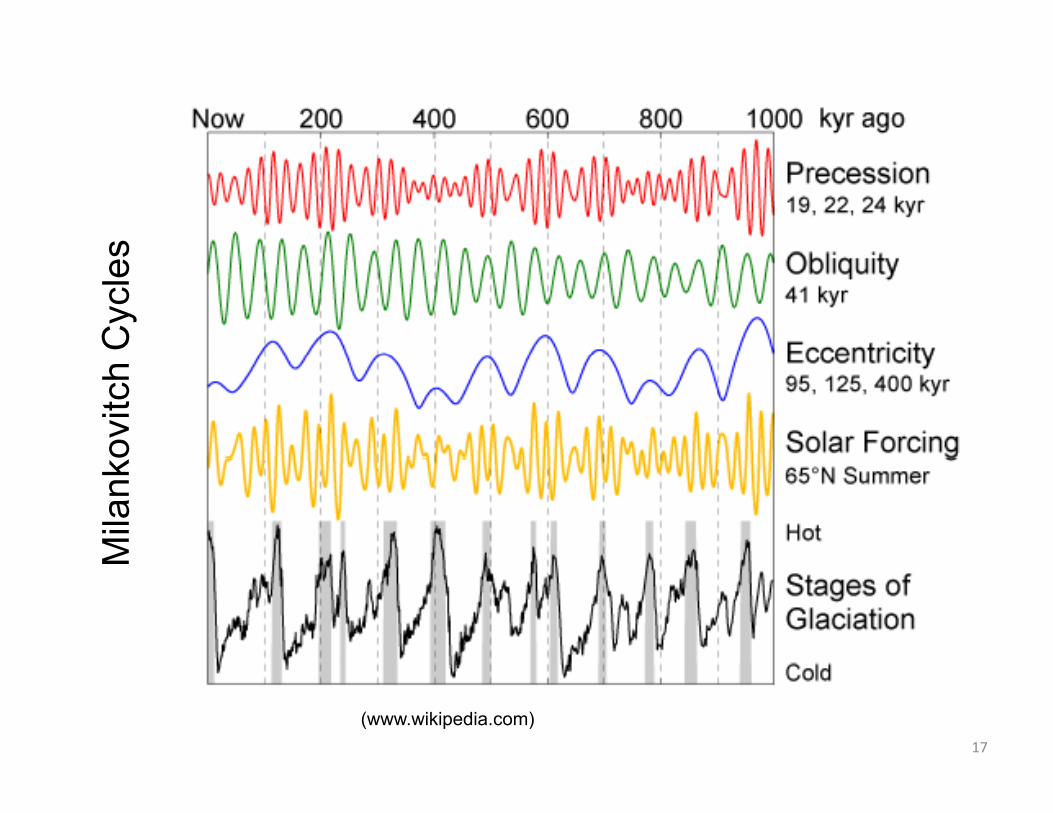
1. Milankovitch Cycles: ∆s in amount of solar rad. received by earth, drives glaciation
13
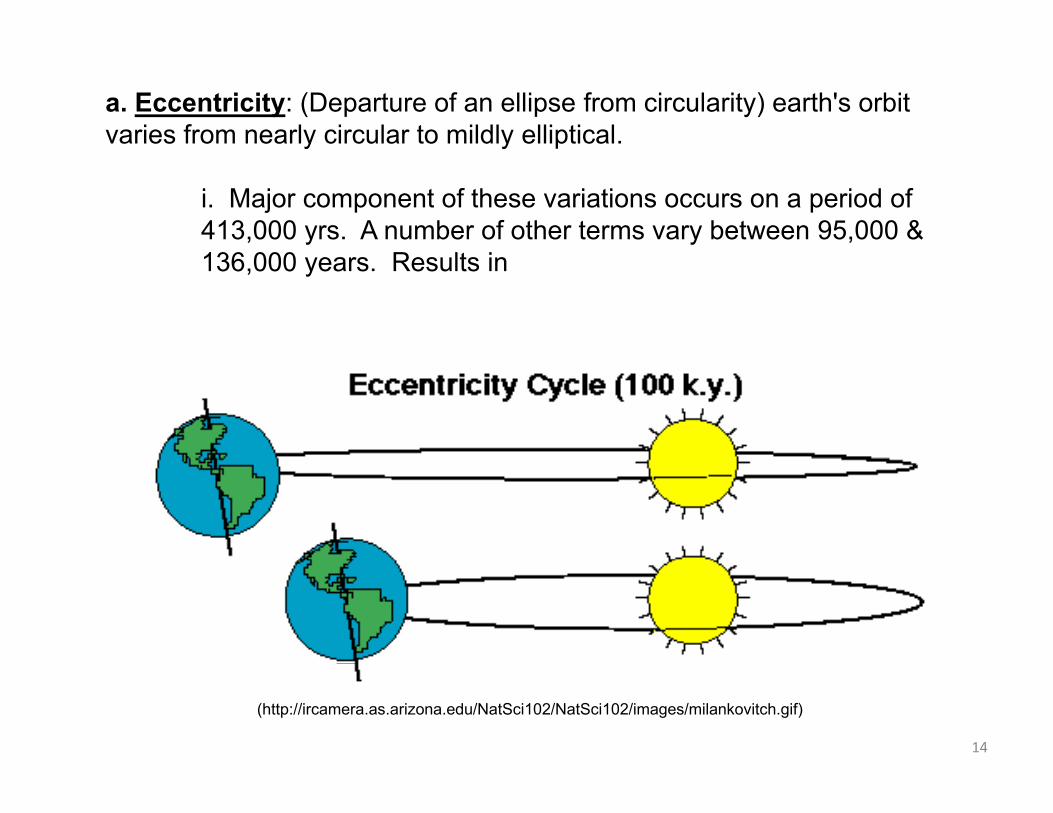
a. Eccentricity: (Departure of an ellipse from circularity) earth's orbit varies from nearly circular to mildly elliptical.
i. Major component of these variations occurs on a period of 413,000 yrs. A number of other terms vary between 95,000 & 136 000 R lt i136,000 years. Results in
14
(http://ircamera.as.arizona.edu/NatSci102/NatSci102/images/milankovitch.gif)
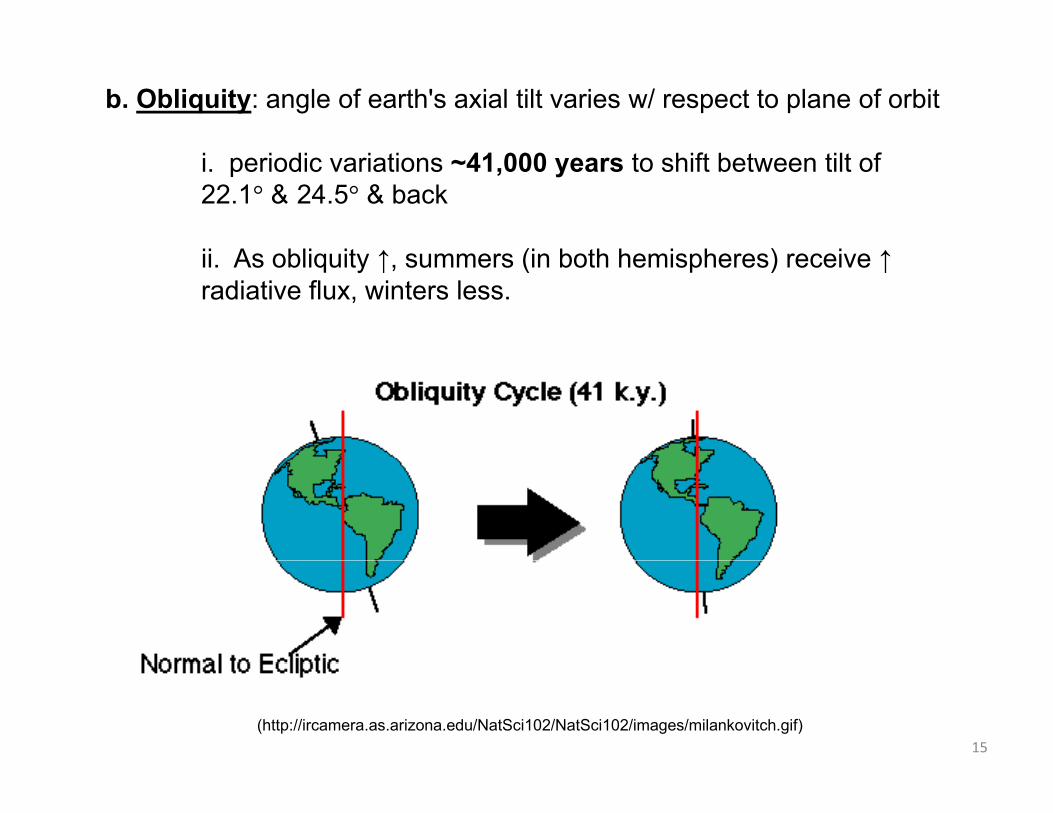
b. Obliquity: angle of earth's axial tilt varies w/ respect to plane of orbit
i. periodic variations ~41,000 years to shift between tilt of 22.1° & 24.5° & back
ii A bli it ↑ (i b th h i h ) i ↑ii. As obliquity ↑, summers (in both hemispheres) receive ↑ radiative flux, winters less.
15(http://ircamera.as.arizona.edu/NatSci102/NatSci102/images/milankovitch.gif)
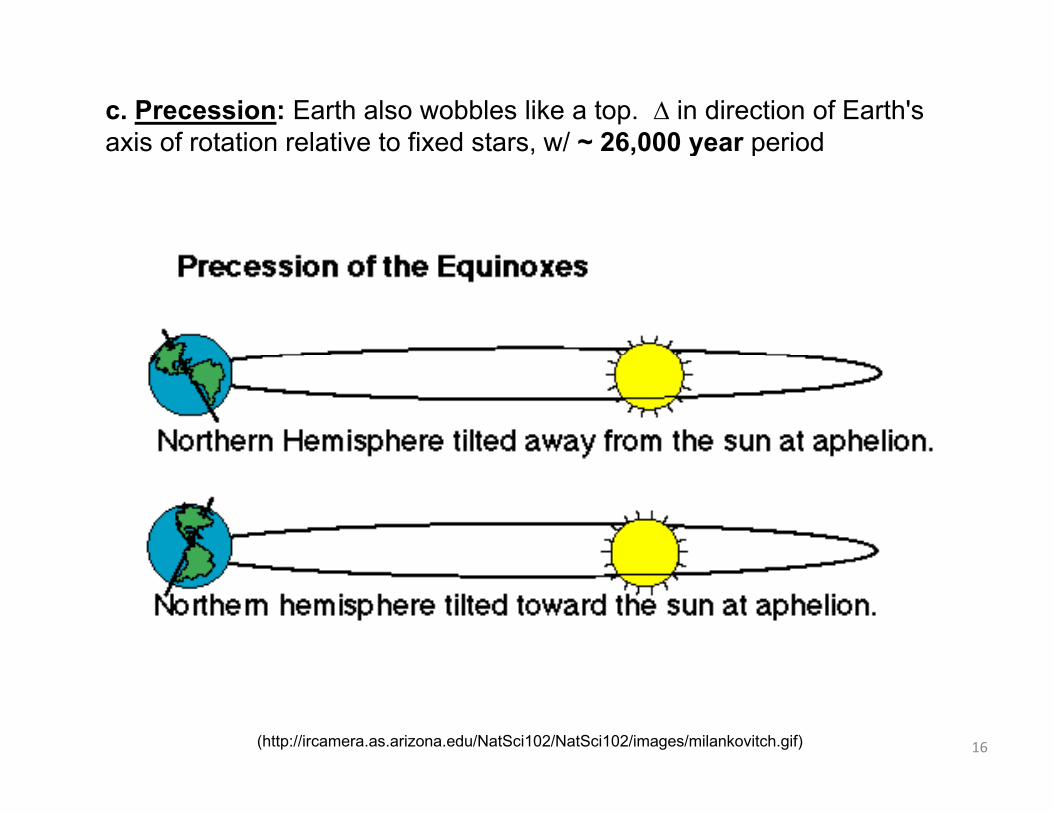
c. Precession: Earth also wobbles like a top. ∆ in direction of Earth's axis of rotation relative to fixed stars, w/ ~ 26,000 year periodaxis of rotation relative to fixed stars, w/ 26,000 year period
16(http://ircamera.as.arizona.edu/NatSci102/NatSci102/images/milankovitch.gif)
sC
ycle
sov
itch
Mila
nkM
17
(www.wikipedia.com)
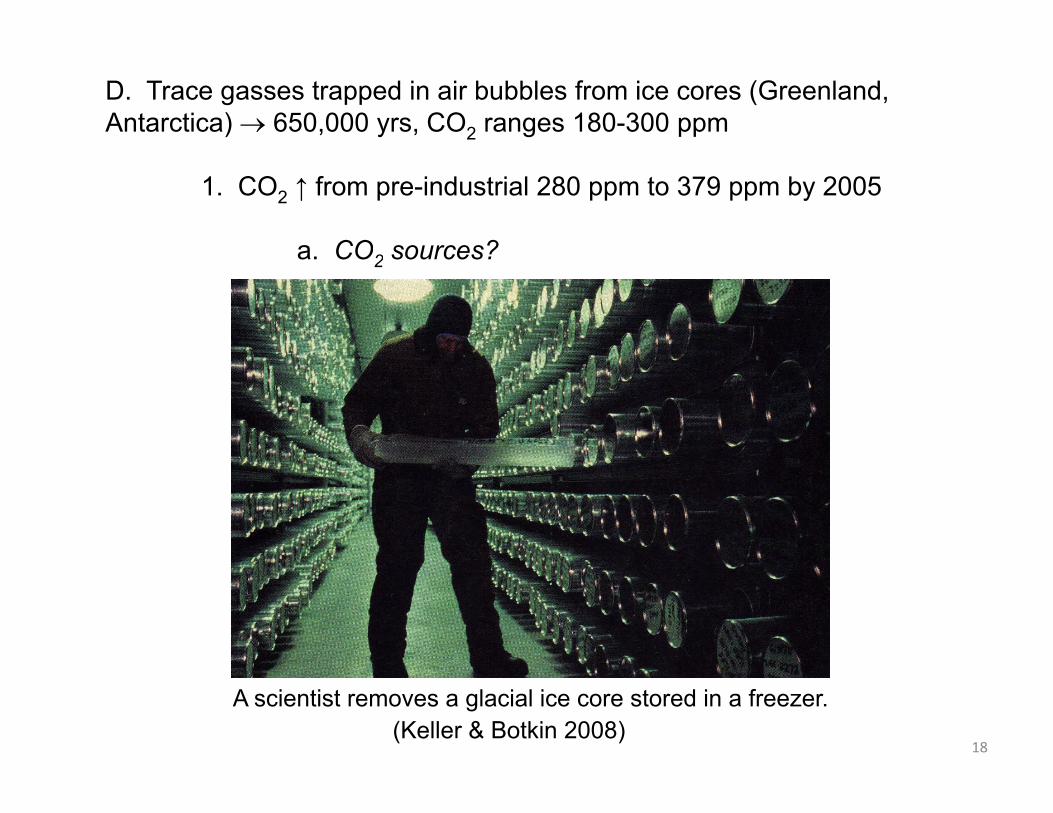
D. Trace gasses trapped in air bubbles from ice cores (Greenland, Antarctica) 650,000 yrs, CO2 ranges 180-300 ppm
1. CO2 ↑ from pre-industrial 280 ppm to 379 ppm by 2005
a CO sources?a. CO2 sources?
18(Keller & Botkin 2008)
A scientist removes a glacial ice core stored in a freezer.
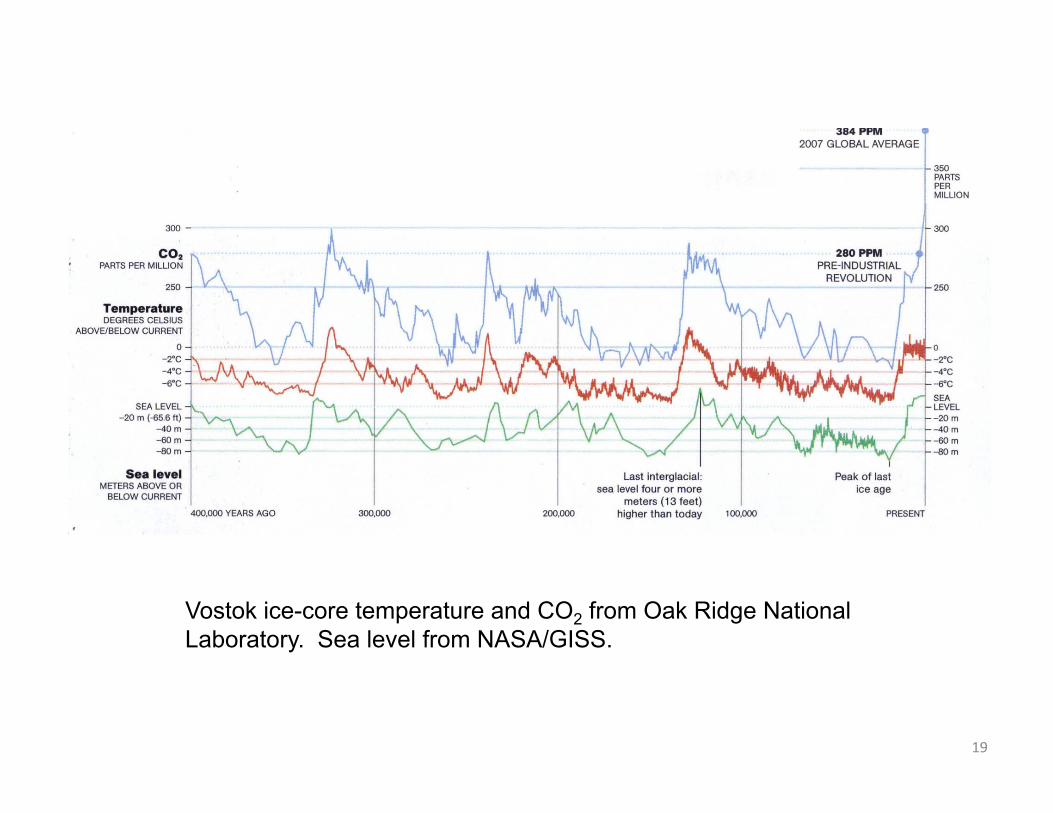
Vostok ice-core temperature and CO2 from Oak Ridge National Laboratory. Sea level from NASA/GISS.
19
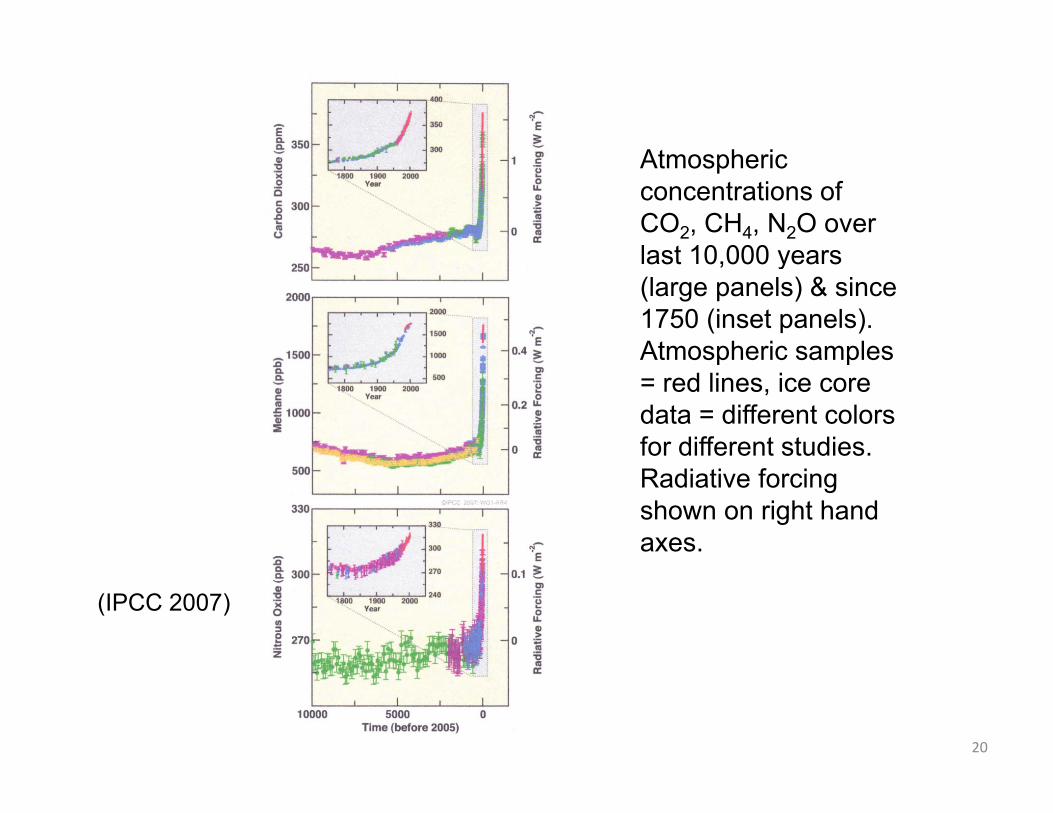
At h iAtmospheric concentrations of CO2, CH4, N2O over last 10 000 yearslast 10,000 years (large panels) & since 1750 (inset panels). Atmospheric samplesAtmospheric samples = red lines, ice core data = different colors for different studies. Radiative forcing shown on right hand axes.
(IPCC 2007)
20
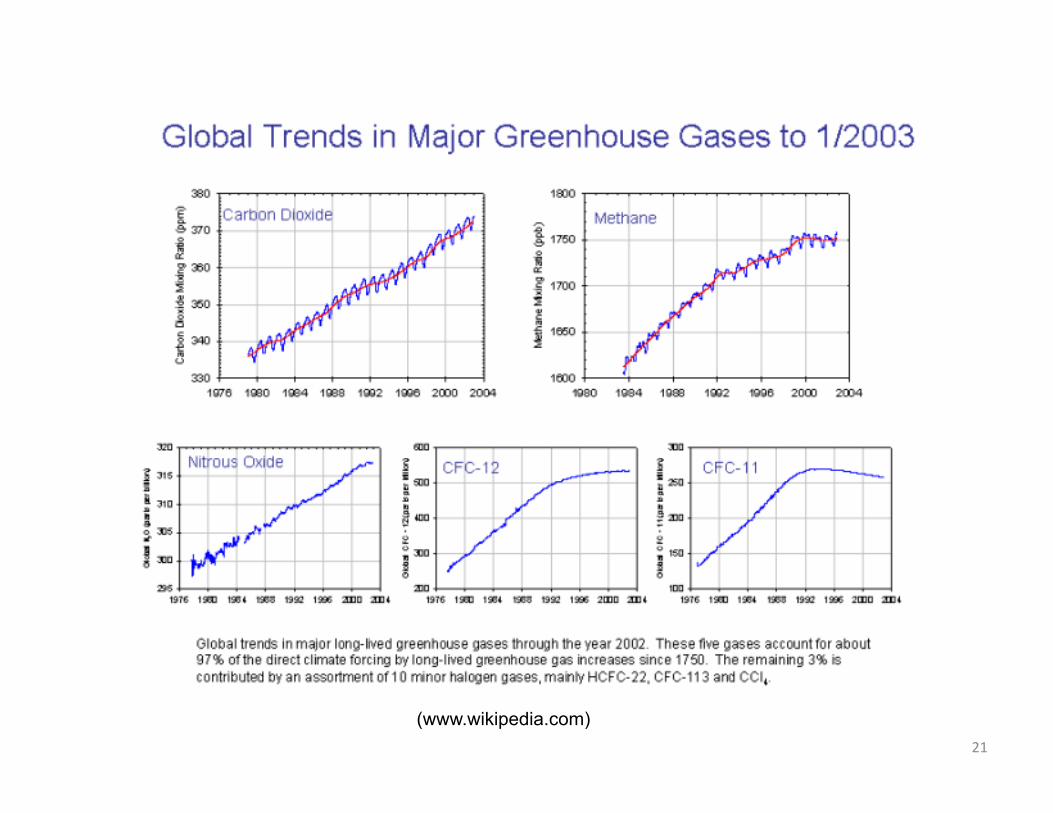
21
(www.wikipedia.com)
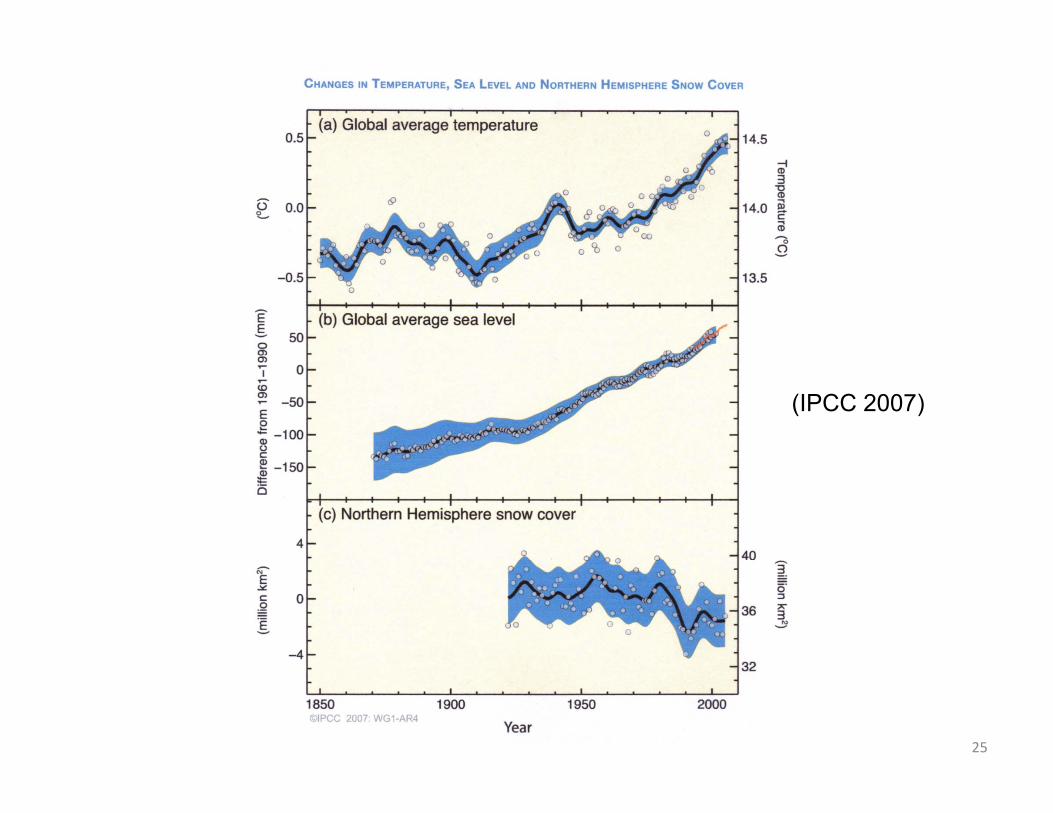
3. Earth surface temps ↑
4. Many glaciers retreating to smallest area in historic record
5 P l i h i ki5. Polar ice caps shrinking
E. Varied evidence suggests unprecedented climate ∆
22
F. Climate ∆ & Degr (IPCC 2007)
a Warming expected to be greatest over land & high N latitude
1. Global climatic ∆s:
a. Warming expected to be greatest over land & high N latitude
b. Very likely (90%) that heat waves, heavy precip events y y ( ) y p pbecome more frequent
c. Likely (60%) that tropical cyclones become more intense
d. Retreating ice sheets, glaciers; earlier spring snowmelt; larger f fimore freq fires
23
C 2
007)
(IPC
C
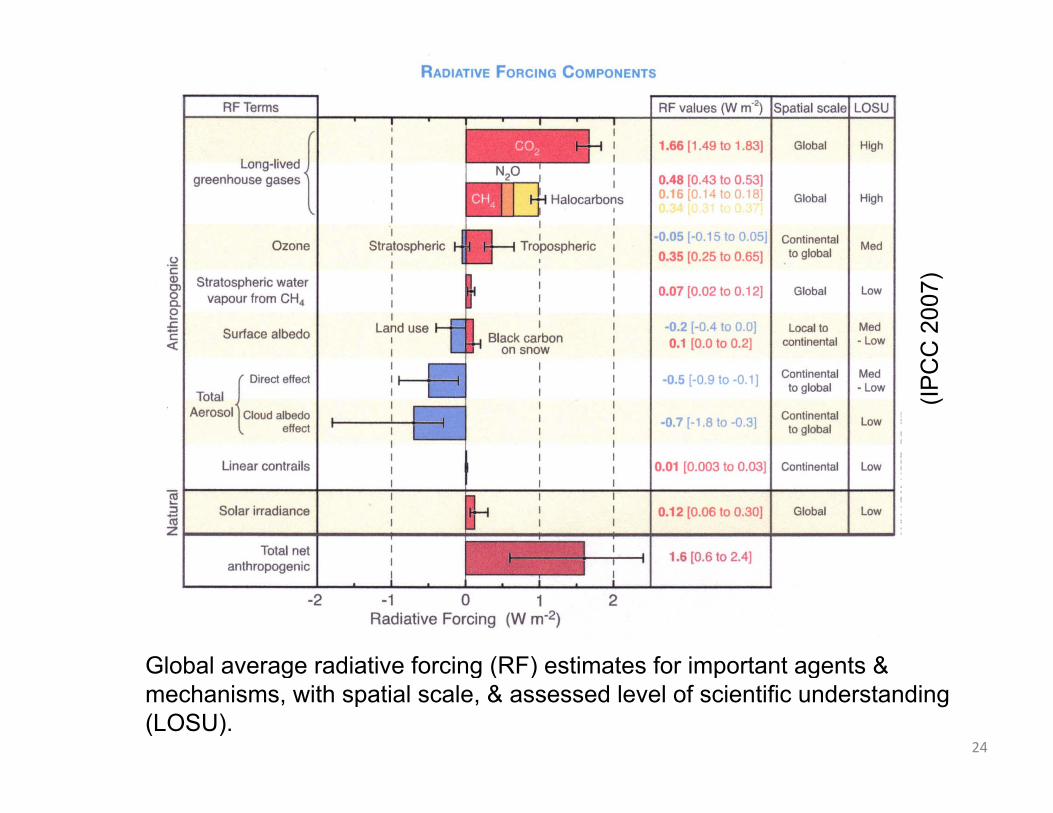
Global average radiative forcing (RF) estimates for important agents &
24
Global average radiative forcing (RF) estimates for important agents & mechanisms, with spatial scale, & assessed level of scientific understanding (LOSU).
(IPCC 2007)
25
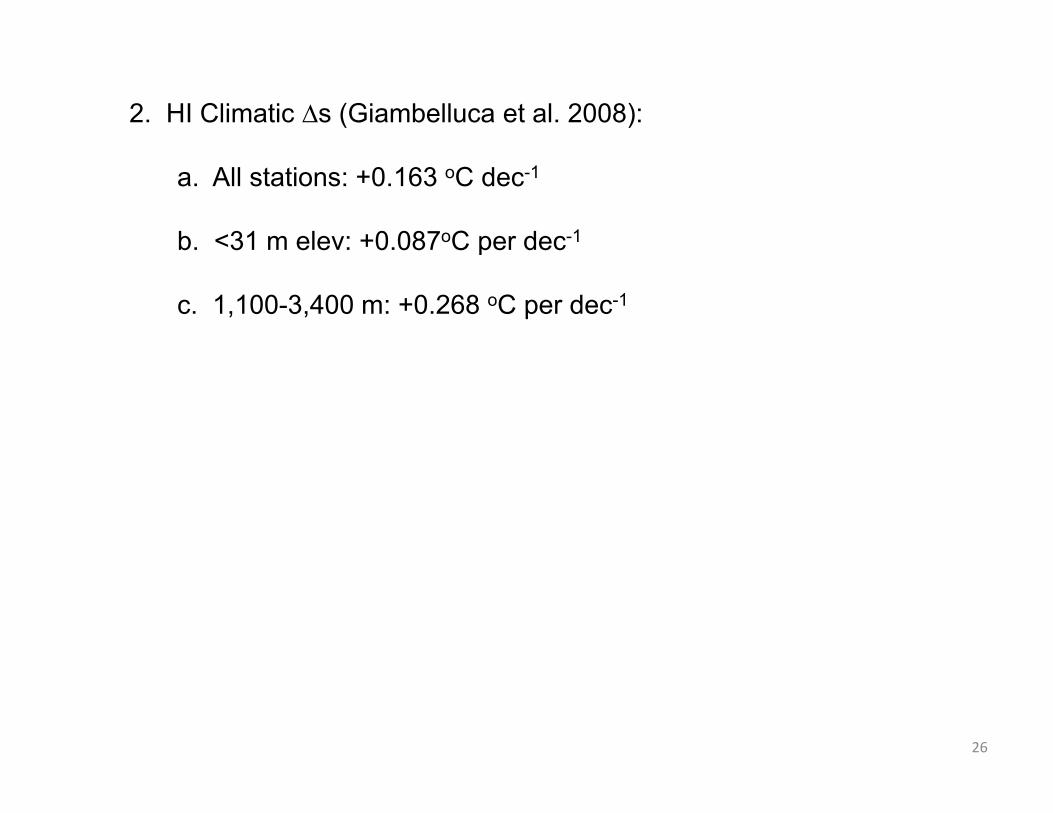
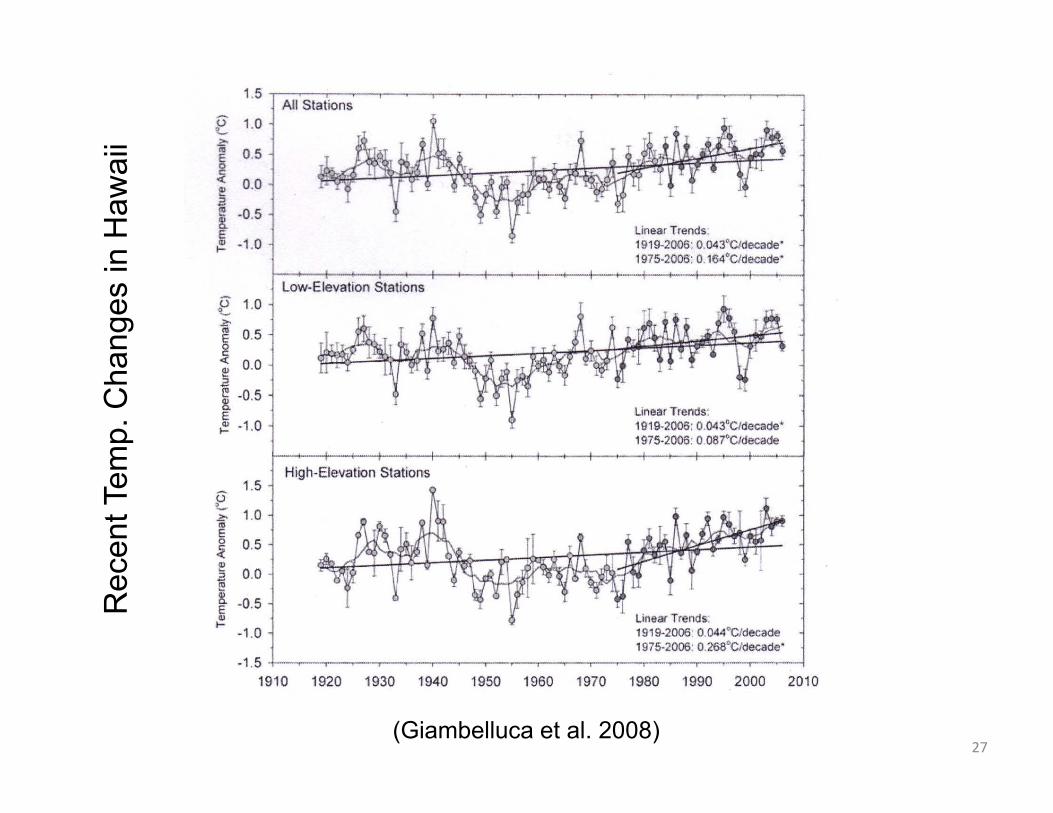
2. HI Climatic ∆s (Giambelluca et al. 2008):
a. All stations: +0.163 oC dec-1
b. <31 m elev: +0.087oC per dec-1p
c. 1,100-3,400 m: +0.268 oC per dec-1
26
in
Haw
aian
ges
inm
p. C
hace
nt T
emR
ec
27(Giambelluca et al. 2008)
3. Impacts on Oceans
a. Sea level (SL) rise
i. Global avg. SLrose 1.8 mm yr-1 from 1961-03 (IPCC 2007)g y ( )
ii. Predicted rise: 0.18-0.59 m by 2099
iii. Effects:
b. SL rise trouble areas?
28
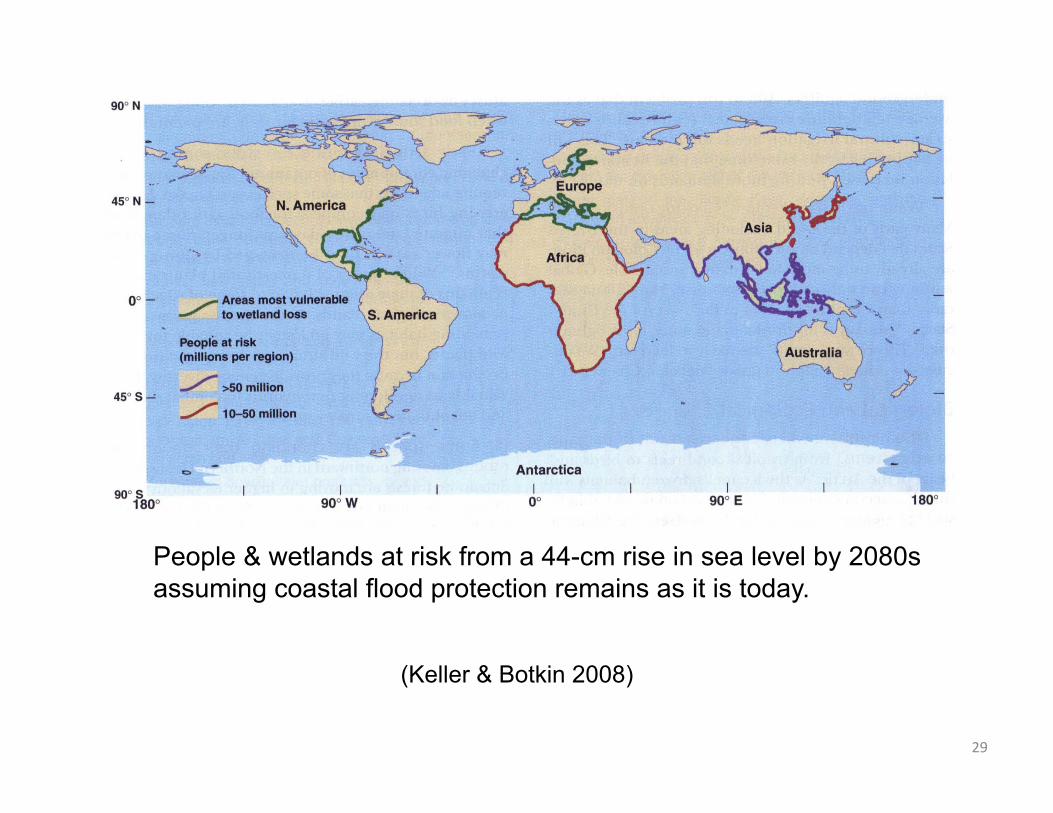
People & wetlands at risk from a 44-cm rise in sea level by 2080sPeople & wetlands at risk from a 44 cm rise in sea level by 2080s assuming coastal flood protection remains as it is today.
29
(Keller & Botkin 2008)
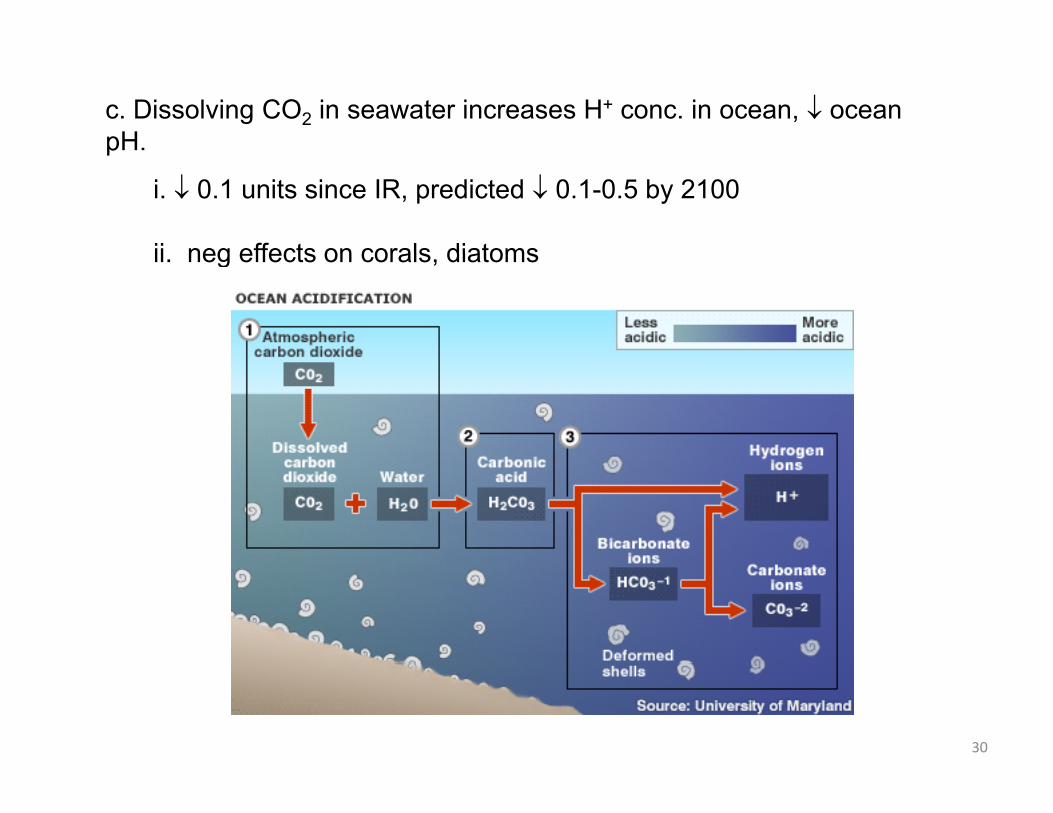
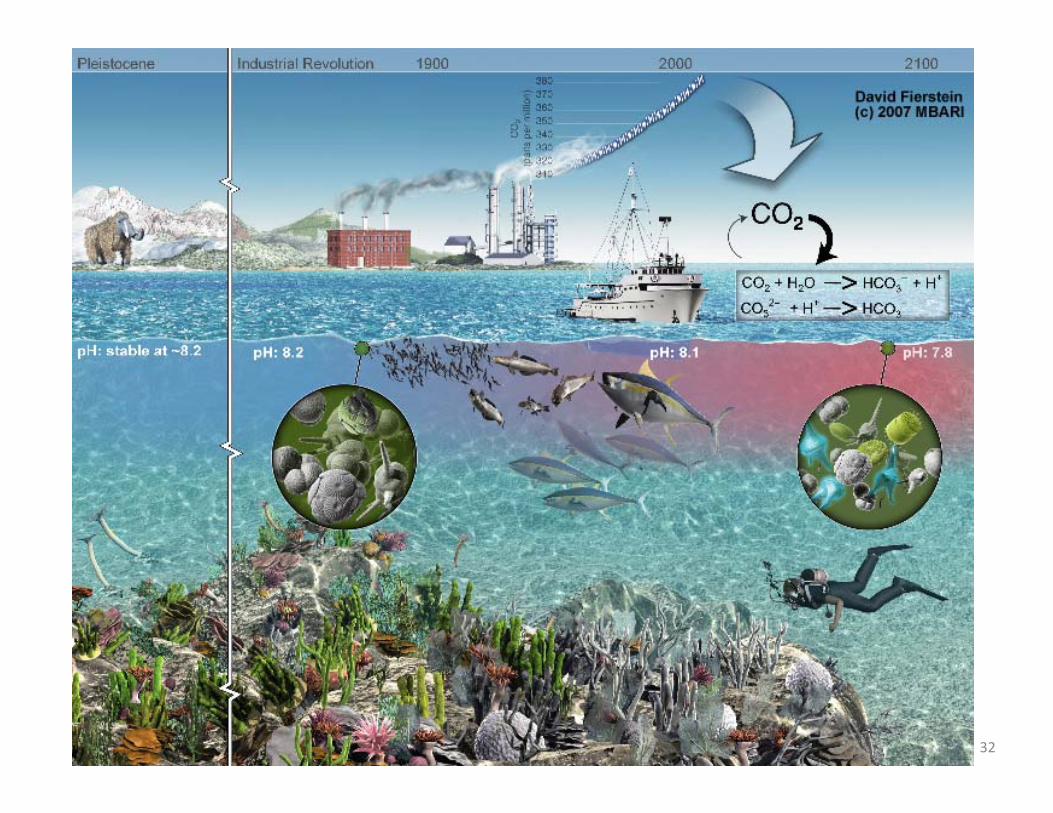
c. Dissolving CO2 in seawater increases H+ conc. in ocean, ocean pH.p
i. 0.1 units since IR, predicted 0.1-0.5 by 2100
ii neg effects on corals diatomsii. neg effects on corals, diatoms
30
32
4. Impacts on plants
a. N latitudes: ↑ temp & grow season, modest CO2 fertilizer effect
i. C3 favored
b Trops/Subtrops: hurt by ↑ temp & drought
ii. Ag. land shifts from Midwest to < fertile Canad. Shield
b. Trops/Subtrops: hurt by ↑ temp & drought
i. globally about 20% of ag. land would be lost (Bush 2003)
c. ↑ Temp & drought may favor invasives
ii.
c. ↑ Temp & drought may favor invasives
33
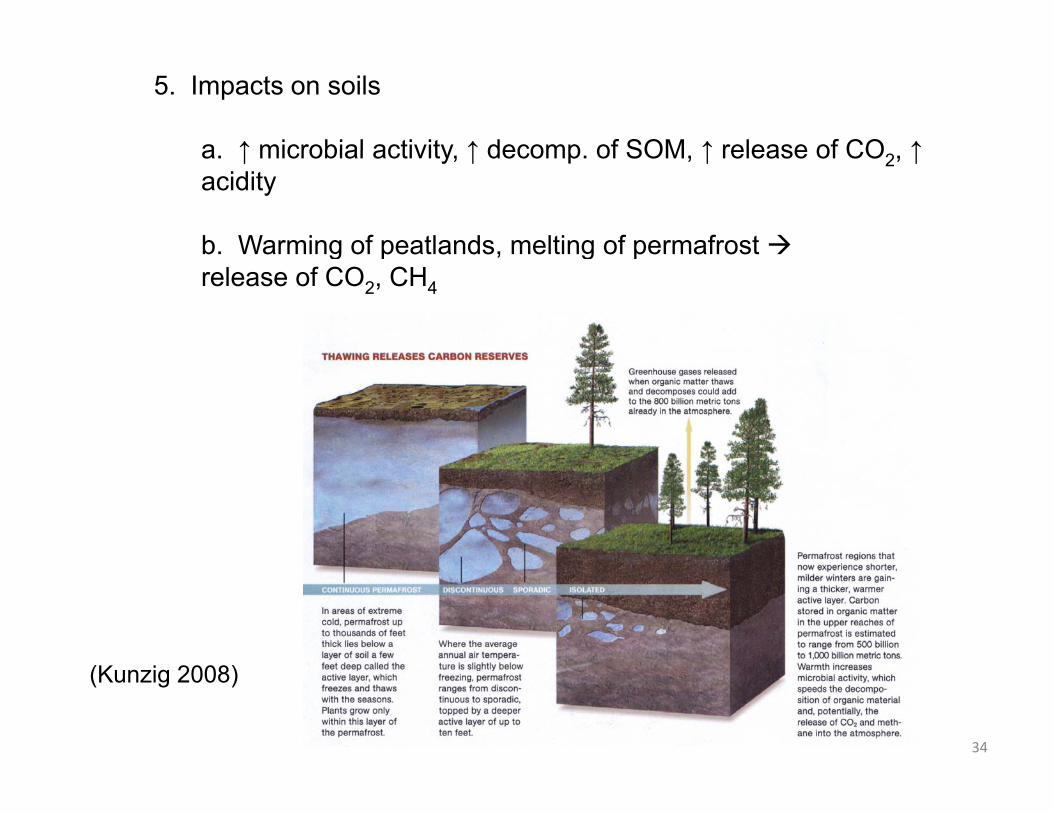
5. Impacts on soils
a ↑ microbial activity ↑ decomp of SOM ↑ release of CO ↑a. ↑ microbial activity, ↑ decomp. of SOM, ↑ release of CO2, ↑ acidity
b. Warming of peatlands, melting of permafrostb. Warming of peatlands, melting of permafrost release of CO2, CH4
34
(Kunzig 2008)
6. Impacts on animals
a. species ∆ geographic ranges
i. general movement ?
b. ∆s in migratory & breeding cycles
i. general movement ?
E. Other chem. degr. problems
1. NO3-N induced hypoxia:
2 P enrichment:2. P enrichment:
35