Embed Size (px)
Citation preview
ELSEVIER P | I : S 0 9 6 0 - 8 5 2 4 ( 9 6 ) O 0 0 5 5 - 7
Bioresource Technology 57 (1996) 99-104 Copyright © 1996 Elsevier Science Limited Printed in Great Britain. All rights reserved
0960-8524/96 $15.00
Short Communication
Chemical Constituents in Different Particle Size Fractions of Deep-stacked Broiler Litter*
Abstract The distribution of chemical constituents relating to feeding value for ruminants in different panicle size fractions (sieve apertures of 4.75, 2.36, 1.18, 0.6, 0.3, 0.15, 0.075 and 0 ram) using four different sources of deep-stacked broiler litter typical of northwestern Arkansas was determined. Mean panicle size of dry matter varied considerably among broiler litter sources. Differences among litter sources in panicle sizes at which larger and smaller size fractions each contained 50% of crude protein and neutral detergent fiber did not coincide well with mean particle size of dry matter. Only in dry matter retained on sieves with smallest apertures (i.e. less than 0.15 ram) did concentrations of chemical constituents differ considerably from con- centrations in unsieved litter. However, only minimal dry matter was retained on sieves with the smallest apertures, suggesting little potential to enhance feeding value of broiler litter for ruminants by a simple separa- tion into one small and one large fraction if constituting a similar proportion of total dry matter. Copyright © 1996 Elsevier Science Ltd.
Key words: Broiler litter, chemical composition, par- ticle size.
INTRODUCTION
Broiler litter is abundant in many parts of the world and typically inexpensive relative to other available ruminant feedstuffs. Broiler litter is used most effi- ciently when employed as a dietary nitrogen supplement and consumed in relatively small quanti- ties (Fontenot & Jurubescu, 1980). This is because of the relatively high concentration of nitrogenous compounds, most of which are generally highly soluble in ruminal fluid and rapidly give rise to ammonia and a low concentration of fermentable carbohydrate available to ruminal microbes relative to the quantitiy of ammonia liberated in the rumen
* Published with the approval of the Director of the Arkansas Agricultural Experiment Station, Manuscript Number 95054.
99
(Park et al., 1995). Thus, increasing ruminally avail- able energy concentration would be of interest to poultry and livestock producers and feed industries if a simple, inexpensive process yielding appreciable change in feeding value was available. Likewise, for use as a nitrogen supplement, such a process would enhance value if nitrogen concentration was increased.
Most fiber in broiler litter in northwestern Arkan- sas arises from bedding materials, typically rice hulls, pine shavings, or a mixture of these. Visually, bed- ding particles appear of largest size in broiler litter. Therefore, separation of broiler litter into fractions of two sizes might yield one low in fiber and high in available energy and the opposite in another. Litter obtained after different numbers of broiler batches in a house with particles less than 1 mm in size averaged 6.3 percentage units and 29% greater in crude protein concentration than large particles, without a consistent effect due to the number of growing periods (Phillips et al., 1993). However, these litter samples were obtained fresh from broiler production units and differences in concentrations of total ash and fiber were unknown. Deep-stacking may alter concentrations of chemical constituents in various particle size fractions because of ammonia liberation during deep-stacking with ammonia adherence (Orskov, 1987) and binding, primarily to cell walls (Barnes, 1988), and/or because of nonuni- form microbial activity (Merkel, 1981). Therefore, the objectives of this experiment were to determine the distribution of dry matter, ash, organic matter, crude protein, and neutral detergent fiber in dif- ferent particle size fractions of broiler litter typically produced in northwestern Arkansas.
METHODS
Four sources (A, B, C, and D) of broiler litter were utilized in this study. Harvests were at times of nor- mal broiler house cleaning by following the standard procedures of each facility. Source A was from a University production unit in which five batches of broilers had been raised. Growing periods were 9 weeks (one batch), 8 weeks (two batches) and 6
100 Short communication
weeks (two batches). Pine shavings were used as bedding, with most applied before the first batch. Packed litter was removed after each batch, except the last, and small quantities of bedding were added before each growing period. Source B was harvested from a commercial production unit after nearly 2 years of production of cornish broilers, with 14 growing periods, each of 30 days. Rice hulls were applied as bedding only before the first growing period and packed litter was removed after each growing period except the last. Source C was obtained from a commercial production unit after nearly 1 year of production and six 6-week growing periods. Litter was obtained from the brood area, where all broilers resided for the first week of the growing period. Bedding (rice hulls-pine shavings mixture) was applied only before the first growing period and packed litter was broken up and mixed with other litter between growing periods. Source D was collected from a commercial production unit after 1 year of production and seven 6-week growing periods. Bedding was a rice hulls-pine shavings mix- ture, with most applied before the first growing period and a small amount added after each subse- quent period. Packed litter was removed after each growing period except the last.
Broiler litter sources were deep-stacked in sepa- rate bays approximately 1.5 m high and 1.5 m wide. Length of bays varied with the quantity of litter. Litter was deep-stacked for 147, 124, 95, and 142 days before sampling for sources A, B, C and D, respectively. The temperature at the center of the deep-stack at sampling had stabilized, previously peaking between 55 and 65°C. Two samples of litter were obtained from different locations from the cen- ter of each deep-stack. Duplicate 200-g (fresh) aliquots of each sample were placed on a nest of pre-weighed sieves with apertures of 4.75, 2.36, 1.18, 0.6, 0.15, 0.075 and 0 (pan)mm. Sieves were vigor- ously shaken for 2 min, followed by removal of the top sieve, and shaking of the remaining sieves for 1 min. The process was repeated for each sieve. Sieve plus residue weight was determined, and residues were pooled within sieve and litter source samples (two samples of each fraction per litter source).
Litter retained on sieves with 2.36- and 4.75-mm apertures was ground to pass a screen with a 1-mm aperture. The eight different particle size fractions were analyzed for dry matter (DM; 100°C), ash (550°C), Kjeldahl nitrogen (N; AOAC, 1984), and neutral detergent fiber (Goering & Van Soest, 1970; without sodium sulfite, decalin or ethoxyethanol). Concentrations and recoveries of DM, ash, organic matter (OM), and neutral detergent fiber (NDF) were comPUted for each particle size fraction.
Mean particle size for DM was calculated by pro- bit analysis (Jaster & Murphy, 1983; Kerley et al., 1985). In addition, this analysis was conducted for other chemical constituents to identify the particle size at which 50% of the initial quantity was in par-
ticles of smaller size and 50% was in larger particles. Lastly, DM distribution on different sieves and con- centrations of chemical constituents was used to calculate composition of whole or unsieved litter.
Composition and recovery data were analyzed by General Linear Models procedures of SAS (1990), first with a full model containing variation sources litter source, sieve apertures and their interaction. Analyses were then conducted separately for each litter source and/or sieve aperture when the inter- action was significant (P<0.05). The model for mean particle size and unsieved litter concentration of chemical constituents included litter source. Dif- ferences among means were determined by least significance differences procedures when the treat- ment F test was significant (P<0.05). Regressions were conducted by the GLM procedure of SAS (1990).
RESULTS AND DISCUSSION
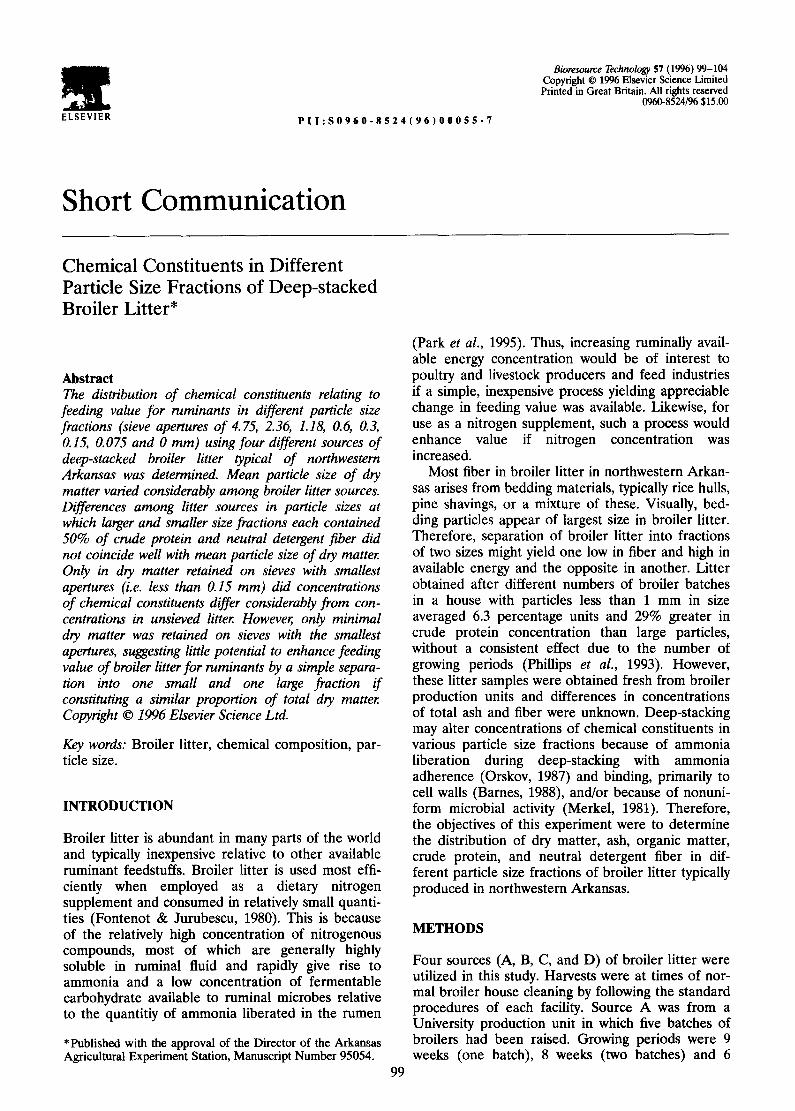
Concentration of nutrients Differences in DM concentration among sieve apertures were of relatively small magnitude (Table 1). Concentrations of all other chemical constituents were affected (P<0.05) by the inter- action between litter source and sieve aperture. Concentration of ash in unsieved litter was 20.4, 25.9, 24.8 and 17.7% (SE 0.69) for litter source A, B, C and D, respectively. Differences among sieve apertures in ash concentration were smallest for source D. For litter sources B, C and D, ash concen- tration changed quadratically as sieve aperture increased, with concentration decreasing then increasing. A prediction equation for percentage ash wasl .94- (5.46 x SA)+ (0.94 x SA 2) + (1.12 x UASH) (R2=0.63; Syx=0.454), with SA=sieve aperture (mm) and UASH = percentage ash in unsieved lit- ter. Figure 1 depicts this relationship with UASH of 18, 22 and 26%. Interactions between UASH and linear and quadratic effects of sieve aperture were nonsignificant (P > 0.05).
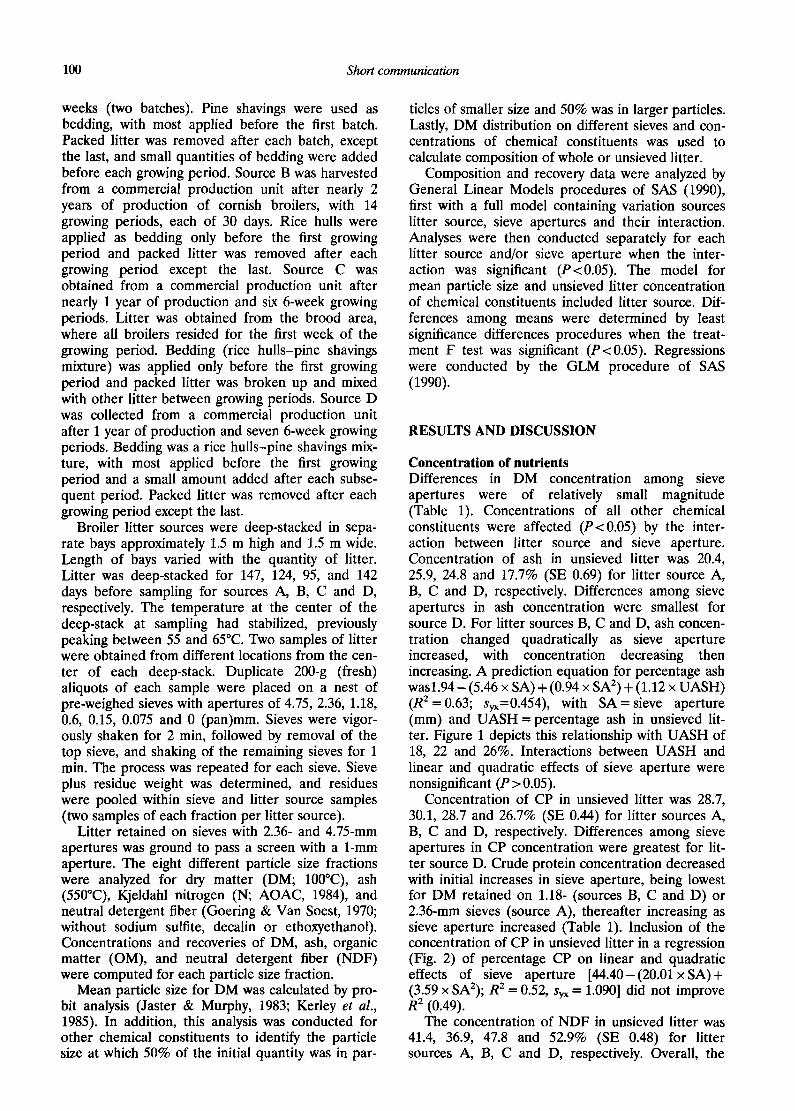
Concentration of CP in unsieved litter was 28.7, 30.1, 28.7 and 26.7% (SE 0.44) for litter sources A, B, C and D, respectively. Differences among sieve apertures in CP concentration were greatest for lit- ter source D. Crude protein concentration decreased with initial increases in sieve aperture, being lowest for DM retained on 1.18- (sources B, C and D) or 2.36-mm sieves (source A), thereafter increasing as sieve aperture increased (Table 1). Inclusion of the concentration of CP in unsieved litter in a regression (Fig. 2) of percentage CP on linear and quadratic effects of sieve aperture [44.40- (20.01 x SA) + (3.59 x SA2); R 2 = 0 . 5 2 , Syx = 1.090] did not improve R 2 (0.49).
The concentration of NDF in unsieved litter was 41.4, 36.9, 47.8 and 52.9% (SE 0.48) for litter sources A, B, C and D, respectively. Overall, the
Short communication 101
Table 1. Concentrations of dry matter, ash, crude protein and neutral detergent fiber in different particle size fractions of four broiler litter sources
Item a Broiler Sieve aperture, mm litter
source
0 b 0.075 0.15 0.3 0.6 1.18 2.36 4.75 SE c
DM, % Mean 84.8c 84.6c 83.9c 82.3ab 81.6a 83.6bc 81.8a 81.0a 0.56 Ash, %DM A 26.9cx 27 .8cy 24.9cyz 25.8cz 20.4bz 17.5aby 16.6abx 15.9a 1.32
B 35.1cy 30.7bcz 27.9abz 24.1at 23.1at 25.2abz 28 .6abz 26.8ab 2.00 C 40.0dz 31 .5cz 2 8 . 0 b z 23.9az 22.7az 22 .8az 24.6ayz 24.1a 0.61 D 21.5cw 20.7cx 20.4bey 17.3aby 15.7a 1 6 . 6 a y 18.6abcxy 18.7abe 1.09 SE c 0.82 0.28 1.41 1.02 0.86 1.23 2.09 2.05
CP, %DM A 58.3fy 4 5 . 3 e y 3 9 . 2 d y 30.5cz 26.3bz 23.1ayz 21.9ax 25.3bw 0.47 B 48.5fx 4 4 . 5 e y 38 .2dx 29.6bcz 26 .4az 25 .3az 28.4bz 31.6cz 0.63 C 49.8fx 4 4 . 7 e y 35 .9dw 29.0cy 25.4bz 22.lay 27.8bcz 29.4cy 0.80 D 71.9ez 55 .1dz 4 1 . 8 c y 28.7by 20.4ay 20.8at 24.1by 27.8bx 1.48 SE 2.19 0.57 0.14 0.30 0.95 0.64 0.44 0.42
NDF, %DM A 17.lax 25 .2bx 2 8 . 7 c y 3 5 . 1 d x 4 2 . 9 e x 51 .1hy 47.7gz 45.8fz 0.57 B 21.8ay 24 .3ax 32 .7by 38.0bcdx 41.6dx 39.6cdx 33.5bcy 36.5bcdy 2.08 C 29.6az 32 .4ay 41 .9bz 49 .0cdy 53 .0ey 51.3dey 46.3cz 46.5cz 1.11 D 27.7az 39 .4bz 4 8 . 5 c z 57.3dz 61.let 57 .0dz 49.1cz 47.7cz 1.01 SE 0.69 1.29 2.18 1.75 1.24 0.76 1.04 0.76
"DM=dry matter, OM=organic matter, CP=crude protein, NDF=neutral detergent fiber. b0=pan; DM passing through the sieve with a 0.075-mm aperture. Cpooled standard error for the analysis within broiler litter source. dpooled standard error for the analysis within sieve-aperture. Means in a row without a common superscript (a-g) differ (P<0.05). Means in a column without a common superscript (x-z) differ (P<0.05).
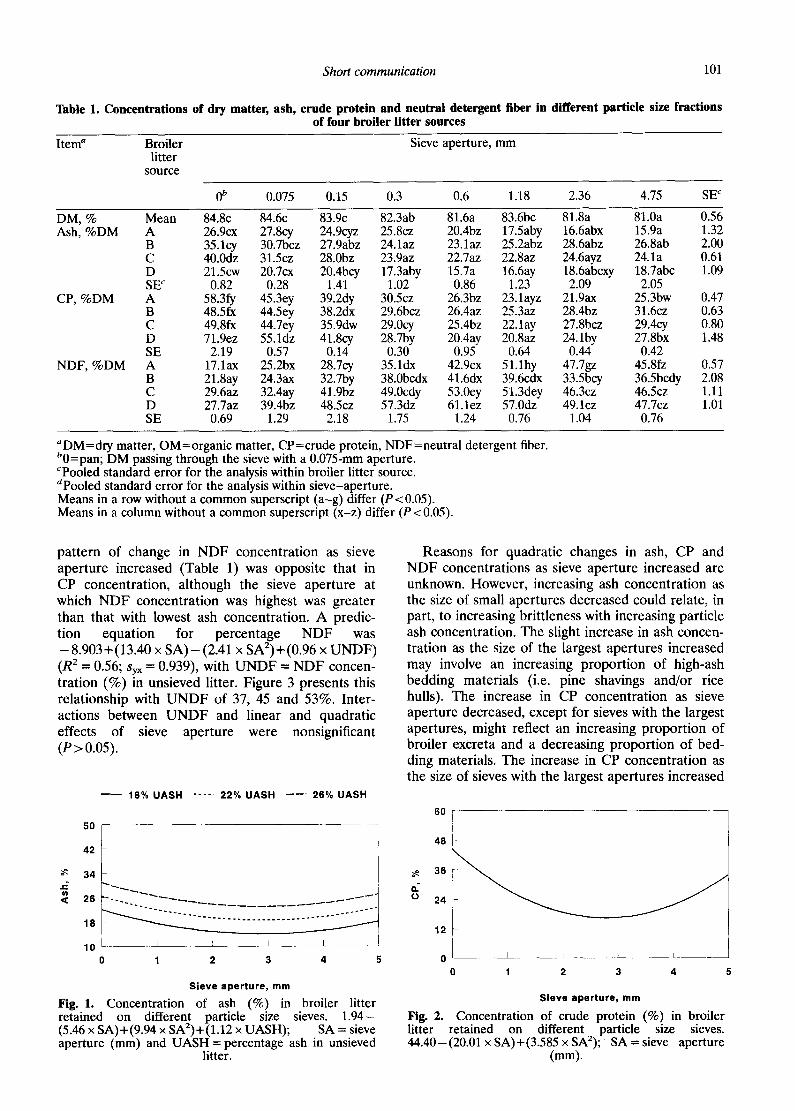
pattern of change in NDF concentration as sieve aperture increased (Table 1) was opposite that in CP concentration, although the sieve aperture at which NDF concentration was highest was greater than that with lowest ash concentration. A predic- tion equation for percentage NDF was - 8.903 + (13.40 x SA) - (2.41 × SA 2) + (0.96 x UNDF) (R 2 = 0.56; Sy~ = 0.939), with UNDF = NDF concen- tration (%) in unsieved litter. Figure 3 presents this relationship with UNDF of 37, 45 and 53%. Inter- actions between UNDF and linear and quadratic effects of sieve aperture were nonsignificant (P>O.O5).
50
18% U A S H . . . . . 22% U A S H - - - -" 26% U A S H
OI ,<
42
34
26
18
10 -
0
. . . . . I _ _ I I I _ _
1 2 3 4 5
Sieve a p e r t u r e , m m
Fig. 1. Concentration of ash (%.) in broiler litter retained on different particle size sieves. 1.94- (5.46 x SA)+(9.94 x SA2)+(1.12 × UASH); SA = sieve aperture (mm) and UASH = percentage ash in unsieved
litter.
Reasons for quadratic changes in ash, CP and NDF concentrations as sieve aperture increased are unknown. However, increasing ash concentration as the size of small apertures decreased could relate, in part, to increasing brittleness with increasing particle ash concentration. The slight increase in ash concen- tration as the size of the largest apertures increased may involve an increasing proportion of high-ash bedding materials (i.e. pine shavings and/or rice hulls). The increase in CP concentration as sieve aperture decreased, except for sieves with the largest apertures, might reflect an increasing proportion of broiler excreta and a decreasing proportion of bed- ding materials. The increase in CP concentration as the size of sieves with the largest apertures increased
60
48
o." o
36 --
24
12
0 _ _ l
0
r L _ ~ _ . _ _
1 2 3 4 5
Sieve aper tu re , m m
Fig. 2. Concentration of crude protein (%! in broiler litter retained on different particle s ize sieves. 44.40-(20.01 x SA)+(3.585 x SA2); SA = sieve aperture
(mm).
102 Short communication
may have been due to less volatilization of ammonia bound or adhered to fiber because of the lower sur- face area:mass ratio. In addition, this change and decreasing NDF concentration as the size of the largest apertures increased could encompass an increasing contribution of packed litter, probably arising primarily from water/feed areas in produc-
37*/, UNDF . . . . . 45% UNDF - - - - " 53*/0 UNDF
u." a z
65
55
45
35
2 5
15 I I I I
0 1 2 3 4
S i e v e a p e r t u r e , m m
Fig. 3. Concentration of neutral detergent fiber (%) in broiler litter retained on different particle size sieves. -8.90+ (13.40 x SA)- (2.44 x SA2)+(0.96 x UNDF); SA=sieve aperture (mm) and UNDF=percentage
neutral detergent fiber in unsieved litter.
tion units. In support, litter obtained directly from broiler houses near water/feed areas was consider- ably higher in CP concentration than litter originating from wall or middle areas of production units (26.3 vs 21.8% of DM; Phillips et al., 1993). Although packed litter was removed between grow- ing periods in three of the four production units from which litter was obtained in our experiment, such litter was not removed after the batch immediately preceding harvest.
Retention Relatively little litter DM passed through all sieves or was retained on the sieve with a 0.075-mm aper- ture ( < 10%; Table 2). For litter sources A, B and C, retention of DM increased as sieve aperture increased up to 0.6 mm, then declined with further increases in sieve aperture. For litter source D, retention increased slowly up to the 1.18-ram screen. Dry matter retention on sieves with 0.075-, 0.15-, 0.3- and 0.6-mm apertures was lower for litter source D than for litter sources A, B and C but was greater on sieves with apertures of 1.18, 2.36 and 4.75 mm. Broiler production conditions responsible for these differences are not apparent.
Table 2. Recovery of dry matter, ash, organic matter, crude protein and neutral detergent fiber for four broiler litter sources in different particle size fractions
Item a Broiler Sieve aperture, mm (%) litter
source
0 b 0.075 0.15 0.3 0.6 1.18 2.36 4.75 SE c
DM A 3.4a 4.9ay 9.5bz 14.0cdy 21.3ey 19.8e 14.8dy 12.4c 0.58 B 3.2a 5.9abz 9.0bz 16.3cy 26.5ez 21.7d 10.3bx 7.lab 1.43 C 3.5a 5.0aby 10.1dz 19.8ez 26.8fz 18.8e 9.0cdx 7.0bc 0.77 D 2.9a 2.4ax 5.1by 10.4cx 18.9ey 23.0g 20.8fz 16.5d 0.22 SE c 0.38 0.22 0.53 0.71 0.64 0.87 0.38 1.93 A 4.4c 6.7cz ll.5bz 17.7cyz 2 1 . 2 d z 17 .0cy 12.0by 9.7b 0.75 B 4.4a 7.0abz 9 . 7 a b c z 15.1cy 23.7dz 2 1 . 1 d z ll.3bcxy 7.7ab 1.85 C 5.6a 6.4az ll.4cz 19.1dz 24.6ez 17.2dy 8.9bx 6.7a 0.66 D 3.6ab 2.8ay 5.9by 10.2cx 16.8dy 2 1 . 5 e z 21.8ez 17.5d 0.83 SE 0.54 0.28 0.57 0.87 1.01 0.95 0.73 2.52 A 3.1a 4.5ay 9.0bz 13.1cx 21.3ey 20.6e 15.5dy 13.1cyz 0.67 B 2.8a 5.5abz 8.7bcz 16.7dy 27.5fz 22.0e 9.9cx 6.8abcy 1.33 C 2.8a 4.6aby 9.6cz 20.0dz 27.6ez 19.3d 9.0cx 7.0bcy 0.83 D 2.8a 2.3ax 4.9y 10.4x 19.4y 23.4g 20.6fz 16.3dz 0.28 SE 0.35 0.21 0.57 0.79 0.60 1.05 0.49 1.77 A 6.8a 7 .7ay 1 2 . 9 b c z 14 .8cdy 19.5ey 16.0d ll.3by 10.9b 0.66 B 5.2a 8.7abz ll.4bcz 16 .0cdy 23.3ez 18.3d 9.7abx 7.4ab 1.44 C 6.0a 7.8aby 12.5cz 19.9dz 23.6ez 14.5c 8.7bx 7.lab 0.75 D 7.9b 4.9ax 8.0by ll.lcx 14.4dx 1 7 . 9 e f 18.7fz 17.1e 0.46 SE 0.70 0.24 0.64 0.61 0.63 0.81 0.38 2.01 A 1.4a 3.0ay 6.6bx ll.9cy 22.0fy 2 4 . 4 g z 17.0ey 13.7d 0.52 B 1.9a 3.9abz 7.9bey 16 .9dyz 2 9 . 9 f z 23.3ez 9.3cx 6.9abc 1.60 C 2.2a 3.4ayz 8.8bz 20.3cz 29.7dz 20.1cy 8.7bx 6.8b 0.66 D 1.5a 1.8ax 4.7bw ll.2cy 21.8fy 2 4 . 8 g z 19.3ez 14.9d 0.26 SE 0.18 0.18 0.24 1.50 0.41 0.70 0.51 1.83
Ash
OM
CP
NDF
aDM = dry matter, OM = organic matter, CP = crude protein, NDF = neutral detergent fiber. b0=pan; DM passing through the sieve with a 0.075-mm aperture. CPooled standard error for the analysis within broiler litter source. dpooled standard error for the analysis within sieve-aperture. Means in a row without a common superscript (a-g) differ (P < 0.05). Means in a column without a common superscript (x-z) differ (P < 0.05).
Short communication 103
As expected based on concentrations, retention of ash and CP was relatively greater than that of DM for sieves with 0-, 0.075- and 0.15-mm apertures, and that of OM and NDF was relatively lower (Table 2). However, retention of ash, OM, CP and NDF was similar to that of DM on other sieves. Crude protein retention on sieves with 0.6- and 1.18-mm apertures was somewhat less than that of DM, and that of NDF was slightly greater.
Mean particle size As reflected by the distribution of DM on different sieves, mean particle size of DM (Table 3) was greatest (P < 0.05) for litter source D and greater for source A than for source B (P=0.08) and C (P<0.05). Mean particle size of ash and OM was similar to that of DM except for lower ash and greater OM values for source A. Thus, separating litter source A into particles smaller and larger than 1.05 mm would yield greater ash and lower OM concentrations in the small-size fraction compared with the large fraction. Conversely, concentrations of ash and OM would be little affected by similar separation of other litter sources. Mean particle size of CP was lower than that of DM, particularly for litter sources with highest mean particle size of DM (A and D). Based on probit analysis, the fraction of particles smaller than the mean particle size of DM contained 58.5 and 55.5% of total CP and was 33.6 and 29.6% CP for sources A and D, respectively. Mean particle size of NDF was greater than that of DM for litter source A but similar for sources B, C and D. The fraction of particles smaller in size than the mean particle size of DM for litter source A contained 42.1% of total NDF and was 34.9% NDF.
General discussion Effects of physical characteristics such as particle size distribution of broiler litter on feeding value for ruminants are unclear. In some instances, digesta passage rate with dietary broiler litter inclusion has been slow relative to diets without broiler litter (Patil et al., 1993; 1995a), and particulate passage rate for broiler litter has been lower than that of dietary forage (Patil et al., 1995a; 1995b). Such find- ings imply that physical characteristics of broiler litter could cause slow passage of digesta from the
reticulorumen because of little stimulation of saliva flow and ruminal motility per unit of litter mass when included in ruminant diets and, thus, limit feed intake (Patil et al., 1993). In this regard, Rossi et al. (1996) fed growing steers diets comprised primarily of broiler litter with different quantities of long- stemmed bermudagrass hay (0.3, 0.6 and 0.9% of body weight) in order to vary ruminal motility and saliva production. Passage rate of broiler litter was not affected by level of hay intake, and passage rate of broiler litter from the reticulorumen was, in fact, greater than that of hay. However, litter source D, with a very large particle size relative to other sources of litter in our study, was used in that experiment. Therefore, effects of differences among broiler litter sources in physical characteristics on movement of digesta through the gastrointestinal tract deserve further research attention.
CONCLUSIONS
Mean particle size of DM varied considerably among broiler litter sources from different sources, and differences among litter sources in mean par- ticle size of CP and NDF did not coincide well with those for DM. Marked differences in concentrations of chemical constituents occurred only between very small (i.e. less than 0.15 mm) and larger particles. However, very small particles contributed relatively little to total litter dry matter ( < 10%). Quadratic changes in concentrations of chemical constituents occurred as particle size increased. Feeding value of deep-stacked broiler litter for ruminants may not be appreciably altered by a simple separation into one small and one large particle size fraction based on quantities of various particle size fractions and con- centrations of these chemical constituents. Nonetheless, effects of differences in physical characteristics between such fractions of broiler lit- ter on digestive function when comprising large portions of ruminant diets are unknown and deserve further research, particularly because of relatively small differences in concentrations of chemical con- stituents in particle size fractions comprising most of the deep-stacked broiler litter.
Table 3. Mean particle size for dry matter, ash, organic matter, crude protein, and neutral detergent fiber of four broiler litter sources
Item Broiler litter source
A B C D SE
Dry matter 1.05b 0.85ab 0.79a 1.53c 0.060 Ash 0.81a 0.83a 0.70a 1.55b 0.078 Organic matter 1.18b 0.86a 0.82a 1.52c 0.054 Crude protein 0.75a 0.72a 0.65a 1.19b 0.052 Neutral detergent fiber 1.33b 0.92a 0.86a 1.49b 0.062
Means in a row without a common letter (a,b,c) differ (P<0.05).
104 Short communication
stituents in particle size fractions comprising most of the deep-stacked broiler litter.
ACKNOWLEDGEMENTS
Appreciation is expressed to the NRI Competitive Grants Program/USDA (Award Number 93-37500-9152).
REFERENCES
AOAC (1984). Official Methods of Analysis, 14th edn, pp. 152-157. Association of Official Analytical Chemists, Washington, DC.
Barnes, R. J. (1988). Near infra-red spectra of ammonia- treated straw and of isolated cell walls. J. Anim. Sci, 21, 209-218.
Fontenot, J. P. & Jurubescu, V. (1980). Processing of animal waste by feeding to ruminants. In Digestive Physi- ology and Metabolism in Ruminants, ed. Y. Ruckebusch & P. Thivend, pp. 641-662. AVI, Westport, CT.
Goering, H. K. & Van Soest, P. J. (1970). Forage Fiber Analyses. Apparatus, Reagents, Procedures and Some Applications, pp. 1-20. Agricultural Handbook No. 379. Agricultural Research Service, U.S. Dept Agric., Wash- ington, DC.
Jaster, E. H. & Murphy, M. R. (1983). Effects of varying particle size of forage on digestion and chewing behav- ior of dairy heifers. J. Dairy Sci, 66, 802-810.
Kerley, M. S., Firkins, J. L., Fahey Jr, G. C. & Berger, L. L. (1985). Roughage content and particle size: their effects on size reduction and fiber composition of par- ticles passing through the gastrointestinal tract of sheep fed corncob-concentrate diets. J. Dairy Sci., 68, 1363-1375.
Merkel, J. A. (1981). Composting. In Managing Livestock Wastes, pp. 306-324. AVI, Westport, CT.
Orskov, E. R. (1987). Treated straw for ruminants. Res. Devel. Agric., 4, 65-69.
Park, K. K., Goetsch, A. L., Patil, A. R., Kouakou, B., Forster Jr, L. A., Galloway Sr, D. L. & Johnson, Z. B.
(1995). Effects of xylose and soybean meal additions to deep-stacked broiler litter on nutritive characteristics for ruminants. 2J. Appl. AnOn. Res., 7, 1-26.
Patil, A. R., Goetsch, A. L., Galloway Sr, D. L. & Forster Jr, L. A. (1993). Intake and digestion by Holstein steer calves consuming grass hay supplemented with broiler litter. Anim. Feed Sci. Technol., 44, 251-263.
Patil, A. R., Goetsch, A. L., Kouakou, B., Galloway Sr, D.L., Forster Jr, L. A. & Park, K. K. (1995). Effects of corn vs corn plus wheat in forage-based diets containing broiler litter on feed intake, ruminal digesta character- istics and digestion in cattle. Anim. Feed Sci. Technol., 55, 87-103.
Patil, A. R., Goetsch, A. L., Kouakou, B., Park, K. K., Galloway Sr, D. L. & Johnson, Z. B. (1995). Deep- stacked or composted broiler litter in growing cattle diets. Prof. Anim. Sci., 11, 100-105.
Phillips, J. M., Simpson, R. B., Baker, W. H. & Busby, F. E. (1993). Macronutrient concentrations of poultry litter as affected by flock management regimes. In Proc. Amer. Soc. Agron. Natl Meeting, Cincinnati, OH, p. 45.
Rossi, J. E., Goetsch, A. L., Patil, A. R., Kouakou, B., Park, K. K., Wang, Z. S., Galloway Sr, D. L. & Johnson, Z. B. (1995). Effects of forage level in broiler litter- based diets on feed intake, digestibility and particulate passage rate in Holstein steers at different live weights. Anim. Feed Sci. Technol. (in press).
SAS (1990). SAS/STAT User's Guide, Version 6, 4th edn. Statistical Analysis System, Cary, NC.
D. J. Crutchfield, ~ A. L. Goetsch b* & Z. B. Johnson a aDepartment of Animal Science, University of Arkansas, Fayetteville, AR 72701, USA bSouth Central Family Farm Research Center, Agricultural Research Service, USDA, Boonville, AR 72927-9214, USA
(Received 4 November 1995; revised version received 1 April 1996; accepted 8 April 1996)
*Author to whom correspondence should be addressed.

![The Calcium Silicate Powder Application On Broiler Litter To … · SNI 19-7030-2004 tentang Spesifikasi kompos dari sampah organisk domestik, 2004. [2] B. David, C. Mejdell, V. Michel,](https://img.pdfslide.us/doc/110x75/60ea6476a219f630130aa689/the-calcium-silicate-powder-application-on-broiler-litter-to-sni-19-7030-2004-tentang.jpg)