Embed Size (px)
Citation preview
Physicochem. Probl. Miner. Process. 48(1), 2012, 303315 Physicochemical Problems
of Mineral Processing
w w w . m i n p r o c . p w r . w r o c . p l / j o u r n a l / ISSN 1643-1049 (print)
Received May 12, 2011; reviewed; accepted August 19, 2011
CHEMICAL CHARACTERIZATION OF PATNOS SCORIA
(AĞRI, TURKEY) AND ITS USABILITY FOR PRODUCTION
OF BLENDED CEMENT
Tolga DEPCI *, Tugba EFE **, Mucip TAPAN ***, Ali OZVAN **,
Mustafa ACLAN **, Tijen UNER **
* Yuzuncu Yil University, Faculty of Engineering and Architecture, Department of Mining Engineering,
6580, Van, Turkey, Tel.: +90 432 225 10 24 ; fax: +90 432 225 17 32, [email protected]
** Yuzuncu Yil University, Faculty of Engineering and Architecture, Department of Geological
Engineering, 6580, Van, Turkey
*** Yuzuncu Yil University, Faculty of Engineering and Architecture, Department of Civil Engineering,
6580, Van, Turkey
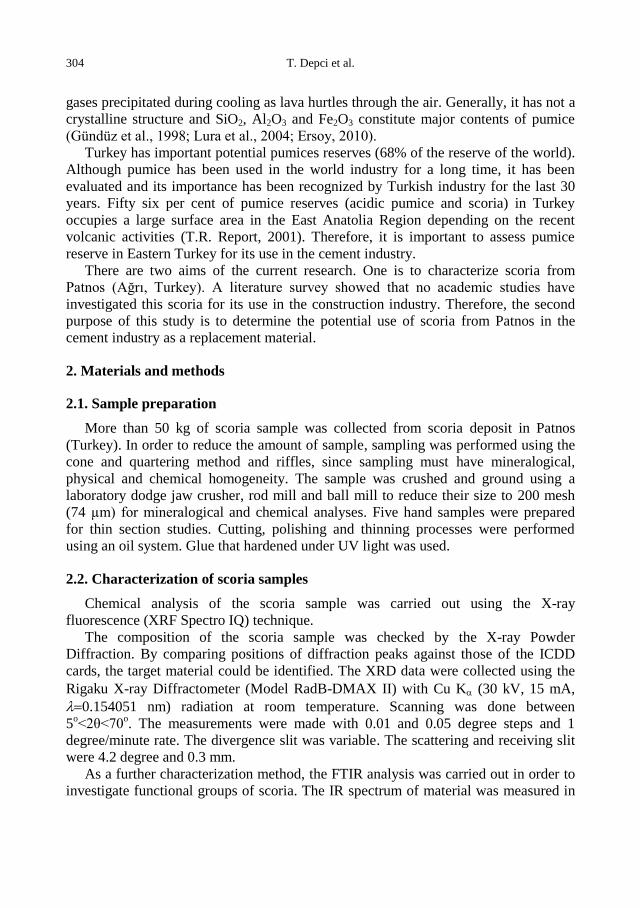
Abstract. This paper reports results of investigations on suitability of scoria (PTS), collected
from Patnos (Ağrı) in Turkey, for blended cement production. Scoria (basic pumice) was
chosen as cement replacement materials due to its availability and cost in Ağrı in Turkey. The
portland cement was replaced by scoria within the range of 0, 5, 10, 20, 30, 40 and 50%.
Characterization of scoria was subjected by the X-ray fluorescence (XRF), X-ray diffraction
(XRD), Fourier Transform Infrared (FTIR) spectroscopy, Scanning Electron Microscopy
(SEM), BET surface area and porosity, zeta potential (ζ) and thin sections. The standard tests
were conducted for the obtained fresh and hardened states of scoria blended cement paste.
Furthermore, the obtained cements were characterized by the XRF. According to experimental
results, scoria up to 20% ratio could be added into clinker and it has a good potential of
manufacturing blended scoria cement.
keywords: scoria, blended cement, Patnos
1. Introduction
Cement industry utilizes natural pozzolans as substitutes for portland cement due to
environmental (CO2 emission reduction), economical (cost reduction) and chemical
(reduction of alkali aggregate reaction and increased chemical resistance)
advantageous (Fu et al., 2003; Sersale 1987; Saraswathy et al., 2003;Vuk et al., 2002;
Binici and Aksoğan 2006; Yilmaz, 2009).
Pumice is one of the natural pozzolan and is a volcanic origin rock formed during
explosive eruptions. It has a highly porous structure which is formed by dissolved
304 T. Depci et al.
gases precipitated during cooling as lava hurtles through the air. Generally, it has not a
crystalline structure and SiO2, Al2O3 and Fe2O3 constitute major contents of pumice
(Gündüz et al., 1998; Lura et al., 2004; Ersoy, 2010).
Turkey has important potential pumices reserves (68% of the reserve of the world).
Although pumice has been used in the world industry for a long time, it has been
evaluated and its importance has been recognized by Turkish industry for the last 30
years. Fifty six per cent of pumice reserves (acidic pumice and scoria) in Turkey
occupies a large surface area in the East Anatolia Region depending on the recent
volcanic activities (T.R. Report, 2001). Therefore, it is important to assess pumice
reserve in Eastern Turkey for its use in the cement industry.
There are two aims of the current research. One is to characterize scoria from
Patnos (Ağrı, Turkey). A literature survey showed that no academic studies have
investigated this scoria for its use in the construction industry. Therefore, the second
purpose of this study is to determine the potential use of scoria from Patnos in the
cement industry as a replacement material.
2. Materials and methods
2.1. Sample preparation
More than 50 kg of scoria sample was collected from scoria deposit in Patnos
(Turkey). In order to reduce the amount of sample, sampling was performed using the
cone and quartering method and riffles, since sampling must have mineralogical,
physical and chemical homogeneity. The sample was crushed and ground using a
laboratory dodge jaw crusher, rod mill and ball mill to reduce their size to 200 mesh
(74 µm) for mineralogical and chemical analyses. Five hand samples were prepared
for thin section studies. Cutting, polishing and thinning processes were performed
using an oil system. Glue that hardened under UV light was used.
2.2. Characterization of scoria samples
Chemical analysis of the scoria sample was carried out using the X-ray
fluorescence (XRF Spectro IQ) technique.
The composition of the scoria sample was checked by the X-ray Powder
Diffraction. By comparing positions of diffraction peaks against those of the ICDD
cards, the target material could be identified. The XRD data were collected using the
Rigaku X-ray Diffractometer (Model RadB-DMAX II) with Cu K (30 kV, 15 mA,
0.154051 nm) radiation at room temperature. Scanning was done between
5o<2θ<70
o. The measurements were made with 0.01 and 0.05 degree steps and 1
degree/minute rate. The divergence slit was variable. The scattering and receiving slit
were 4.2 degree and 0.3 mm.
As a further characterization method, the FTIR analysis was carried out in order to
investigate functional groups of scoria. The IR spectrum of material was measured in
Chemical characterization of PatnosSscoria (Ağri, Turkey) and its usability for production of cement 305
the range of 400 to 4000 cm−1
by the KBr pellet method using the Perkin Elmer
Spectrum One device. IR pellet was prepared using spectroscopic grade KBr with a
sample (KBr-to-sample ratio of 100 mg : 3 mg). KBr was dried at 180C for 12 hours
before the preparation of pellet.
Surface area and porosity values of the scoria sample were determined using a Tri
Star 3000 (Micromeritics Instrument Co. USA) surface analyzer which was used to
measure nitrogen adsorption isotherm at 77 K in the range of relative pressures from
10-6
to 1. Before measurement, the sample was degassed at 400ºC for 2 h.
The zeta potential of the scoria sample was measured by a Zeta Meter 3.0 (Malvern
Instruments Ltd.) equipped with a microprocessor unit. The zeta potential was
calculated automatically using the Smoluchowski equation and as a function of pH of
the solution according to the electrophoresis method with high sensitivity. A sample of
0.5 g was taken from each pumice sample and then transferred into a glass beaker and
100 cm3 of aqueous solution was added. The mixture was stirred using a magnetic
shaker and the pH of the test solution was adjusted to the desired value by drop-wise
addition of diluted NaOH (0.5%) or HCl (0.1 N). After stirring the solution, the
suspension was stored to let larger particles to settle.
In order to investigate the morphology of the pumice sample, the Leo EVO 40
scanning electron microscope, which does not need palletizing, was used. SEM
images were obtained from the scoria samples in powder form.
To investigate petrographical characteristics of the scoria sample, thin sections of 5
rock samples were prepared and determined using the LEICA Polorizan Microscope.
In order to measure the true densities of the scoria sample and cement, pycnometer
was used.
2.3 Preparation of test specimens
A reference cement (ordinary portland cement, OPC) was produced by mixing
portland cement clinker, 96% in weight, and gypsum, 4% in weight. This mixture was
then ground for 40 minutes in a laboratory-type ball mill. Scoria blended cement
samples (PBC) were obtained using 5%, 10%, 20%, 30%, 40% and 50% (by weight of
clinker) pumice replacement by mixing and inter-grinding. The gypsum content was
kept constant in all cements as 4%. Before grinding operation, portland cement
clinker, scoria and gypsum were crushed, and sieved through a 9.5 mm sieve. The
purpose of sieving was to keep the uniformity between each specimen through using
the same feed sizes. Gypsum was dried at 40°C prior to crushing whereas the natural
pozzolans were dried at 110°C.
2.4. Tests conducted on the scoria blended cements
The chemical compositions of the control specimen and scoria blended cements
were performed by the X-ray spectrometer (XRF). Physical analyses were performed
in accordance with TS EN 196-6. Fineness of the scoria blended cement samples was
306 T. Depci et al.
determined by measuring the Blaine fineness and amount of material retained on 45,
90, and 200 μm sieves after vacuum sieving.
Following tests were carried out on the scoria blended and control cements:
fineness, specific surface area by Blaine instrument, normal consistency, setting time,
soundness by the Le Chatelier method and compressive strength. The amount of water
necessary for the cements to have normal consistency was determined according to TS
EN 196-3. Then, the pastes having normal consistency was used to determine the
setting time and soundness through conducting tests as described in this standard.
Compressive strength and flow values of the mortars were determined according to TS
EN 196-1. Preparation of cement mortar mixtures was completed according to TS EN
196-1. In these tests, 450 ±2 g of cement and 1350 ±5 g of standard sand were used.
PBC mortars were prepared with 225 cm3 of water whereas the water content of the
blended cement mortars were adjusted to have a w/c ratio of 0.5 as stated in the
standard. The prepared mortars were poured into rectangular-prism-shaped three-part
mortar molds 40x40x160 mm and compressive strength tests were performed by an
automated strength testing instrument in accordance with TS EN 196-1. The
compressive strength of the mortars was determined after 1, 2, 7 and 28 days. Three
cube specimens were tested for each day.
3. Results and discussion
3.1. Mineralogical and chemical characterization of scoria
3.1.1. X-ray fluorescence (XRF) and geochemistry
The result of chemical analysis of the scoria sample is given in Table 1. Chemical
analysis indicates that SiO2, Al2O3, Fe2O3 and CaO constitute major contents of the
pumice samples. As it is known, pumice is an amorphous porous volcanic rock, which
is composed mainly of SiO2. Pumices show acidic and basic properties and are named
acidic pumice and scoria (basic pumice), depending on the SiO2 content. According to
the XRF results, the pumice sample used in the present study can be classified as
scoria (basic pumice) due to the relatively low SiO2 and high Fe2O3 contents (Gündüz
et al., 1998).
According to TS 25, natural pozzolans should have specific chemical properties to
be used in the cement industry. These requirements and comparison with scoria (PTS)
are given in Table 2. The results in Table 2 indicate that the scoria samples collected
from Ağrı (Turkey) satisfies the TS 25 requirements and therefore can be used in
cement industry as a cement additive.
Chemical characterization of PatnosSscoria (Ağri, Turkey) and its usability for production of cement 307
Table 1. Chemical composition of scoria sample
PTS
SiO2 54.92
TiO2 2.55
Al2O3 16.92
Fe2O3 10.31
MgO 2.01
CaO 6.47
Na2O 2.17
K2O 1.87
P2O5 0.39
SO3 0.29
LOI 0.86
Reactive silica 31.52
Puzzolonic activity (kg/cm2) 100
Table 2. Comparative study of chemical properties according to TS 25 standard
Chemical Properties
TS 25 Standard
PTS
wt. % wt. %
SiO2 + Al2O3 + Fe2O3 > 70.0 81.73
MgO < 5.0 2.12
SO3 < 3.0 0.29
Reactive silica > 25 31.52
Cl < 0.1 0.009
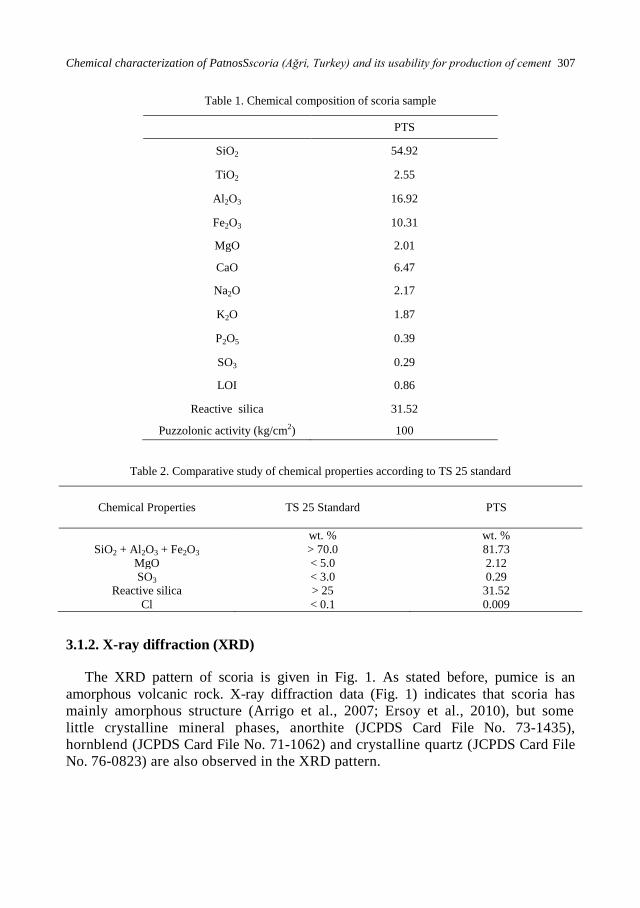
3.1.2. X-ray diffraction (XRD)
The XRD pattern of scoria is given in Fig. 1. As stated before, pumice is an
amorphous volcanic rock. X-ray diffraction data (Fig. 1) indicates that scoria has
mainly amorphous structure (Arrigo et al., 2007; Ersoy et al., 2010), but some
little crystalline mineral phases, anorthite (JCPDS Card File No. 73-1435),
hornblend (JCPDS Card File No. 71-1062) and crystalline quartz (JCPDS Card File
No. 76-0823) are also observed in the XRD pattern.
308 T. Depci et al.
0
10
20
30
40
50
60
70
80
90
100
5 15 25 35 45 55 65
2-Theta (q)
Inte
nsi
ty (
a.u
.)
HA
Q
Q
Q: Quartz
A: Anorthite
H:Hornblend
H
A
Fig. 1. XRD patterns of scoria
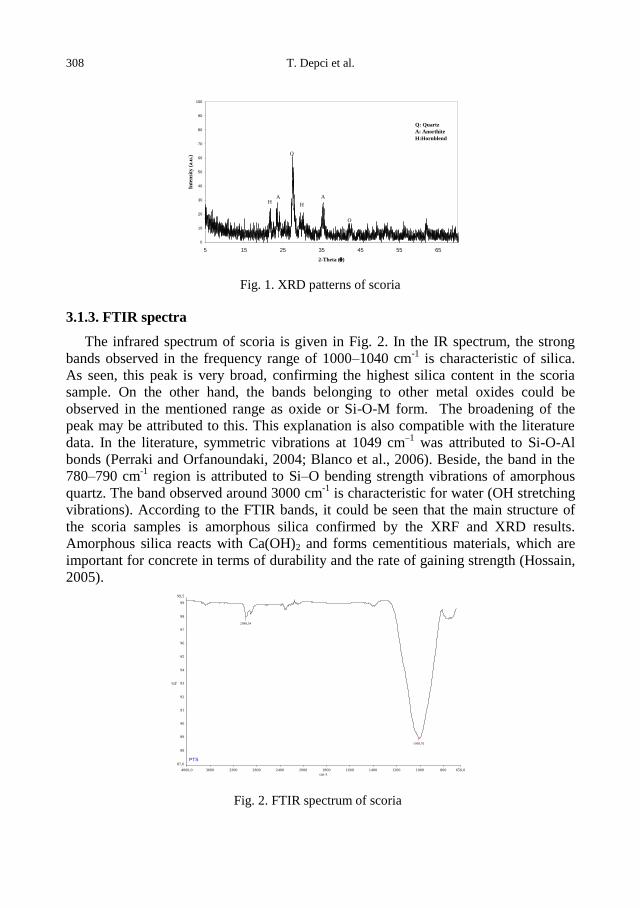
3.1.3. FTIR spectra
The infrared spectrum of scoria is given in Fig. 2. In the IR spectrum, the strong
bands observed in the frequency range of 1000–1040 cm-1
is characteristic of silica.
As seen, this peak is very broad, confirming the highest silica content in the scoria
sample. On the other hand, the bands belonging to other metal oxides could be
observed in the mentioned range as oxide or Si-O-M form. The broadening of the
peak may be attributed to this. This explanation is also compatible with the literature
data. In the literature, symmetric vibrations at 1049 cm–1
was attributed to Si-O-Al
bonds (Perraki and Orfanoundaki, 2004; Blanco et al., 2006). Beside, the band in the
780–790 cm-1
region is attributed to Si–O bending strength vibrations of amorphous
quartz. The band observed around 3000 cm-1
is characteristic for water (OH stretching
vibrations). According to the FTIR bands, it could be seen that the main structure of
the scoria samples is amorphous silica confirmed by the XRF and XRD results.
Amorphous silica reacts with Ca(OH)2 and forms cementitious materials, which are
important for concrete in terms of durability and the rate of gaining strength (Hossain,
2005).
4000,0 3600 3200 2800 2400 2000 1800 1600 1400 1200 1000 800 650,0
87,0
88
89
90
91
92
93
94
95
96
97
98
99
99,5
cm-1
%T
PTS
2988,54
1008,76
Fig. 2. FTIR spectrum of scoria
Chemical characterization of PatnosSscoria (Ağri, Turkey) and its usability for production of cement 309
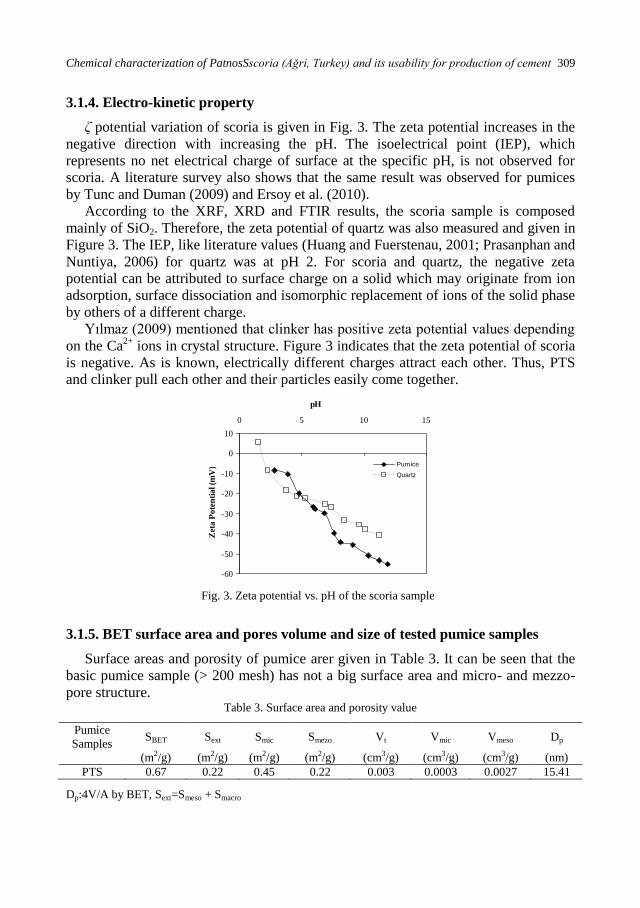
3.1.4. Electro-kinetic property
ζ potential variation of scoria is given in Fig. 3. The zeta potential increases in the
negative direction with increasing the pH. The isoelectrical point (IEP), which
represents no net electrical charge of surface at the specific pH, is not observed for
scoria. A literature survey also shows that the same result was observed for pumices
by Tunc and Duman (2009) and Ersoy et al. (2010).
According to the XRF, XRD and FTIR results, the scoria sample is composed
mainly of SiO2. Therefore, the zeta potential of quartz was also measured and given in
Figure 3. The IEP, like literature values (Huang and Fuerstenau, 2001; Prasanphan and
Nuntiya, 2006) for quartz was at pH 2. For scoria and quartz, the negative zeta
potential can be attributed to surface charge on a solid which may originate from ion
adsorption, surface dissociation and isomorphic replacement of ions of the solid phase
by others of a different charge.
Yılmaz (2009) mentioned that clinker has positive zeta potential values depending
on the Ca2+
ions in crystal structure. Figure 3 indicates that the zeta potential of scoria
is negative. As is known, electrically different charges attract each other. Thus, PTS
and clinker pull each other and their particles easily come together.
-60
-50
-40
-30
-20
-10
0
10
0 5 10 15
pH
Zet
a P
ote
nti
al
(mV
) Pumice
Quartz
Fig. 3. Zeta potential vs. pH of the scoria sample
3.1.5. BET surface area and pores volume and size of tested pumice samples
Surface areas and porosity of pumice arer given in Table 3. It can be seen that the
basic pumice sample (> 200 mesh) has not a big surface area and micro- and mezzo-
pore structure. Table 3. Surface area and porosity value
Pumice
Samples SBET Sext Smic Smezo Vt Vmic Vmeso Dp
(m2/g) (m2/g) (m2/g) (m2/g) (cm3/g) (cm3/g) (cm3/g) (nm)
PTS 0.67 0.22 0.45 0.22 0.003 0.0003 0.0027 15.41
Dp:4V/A by BET, Sext=Smeso + Smacro
310 T. Depci et al.
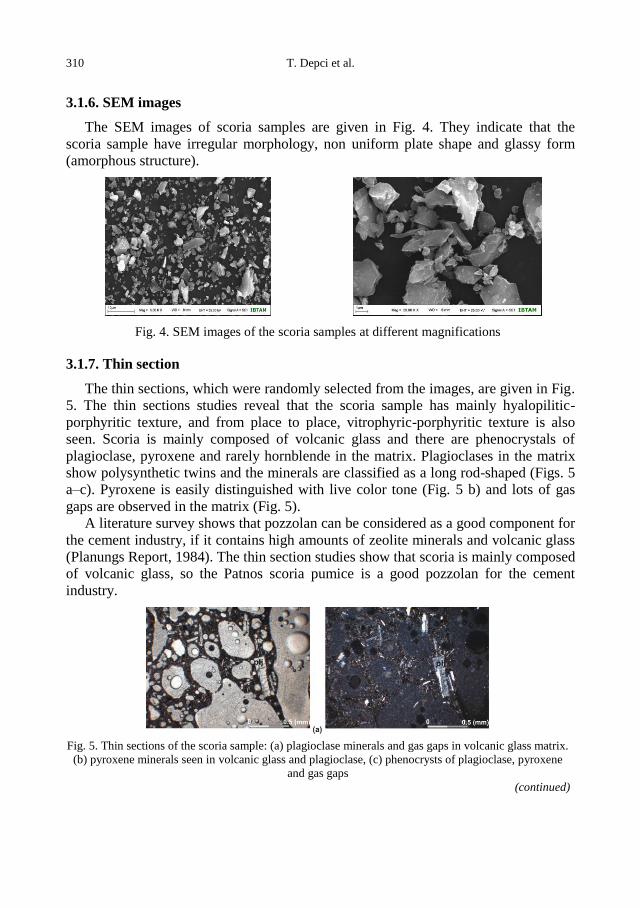
3.1.6. SEM images
The SEM images of scoria samples are given in Fig. 4. They indicate that the
scoria sample have irregular morphology, non uniform plate shape and glassy form
(amorphous structure).
Fig. 4. SEM images of the scoria samples at different magnifications
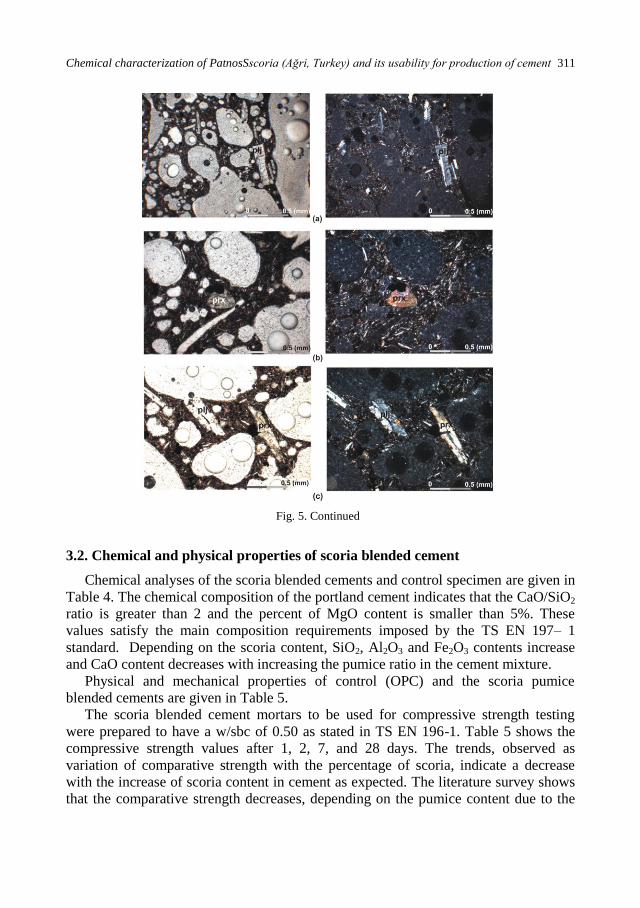
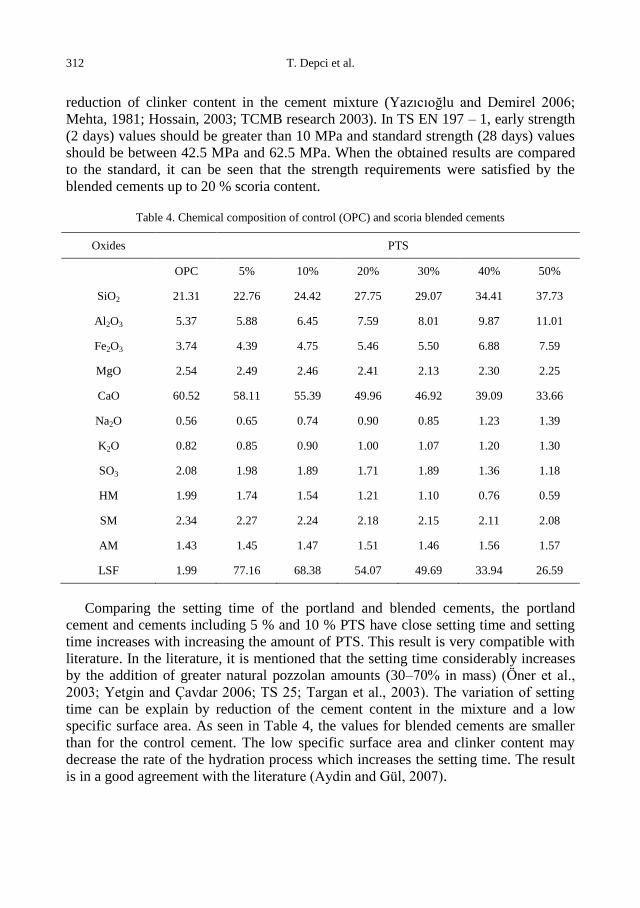
3.1.7. Thin section
The thin sections, which were randomly selected from the images, are given in Fig.
5. The thin sections studies reveal that the scoria sample has mainly hyalopilitic-
porphyritic texture, and from place to place, vitrophyric-porphyritic texture is also
seen. Scoria is mainly composed of volcanic glass and there are phenocrystals of
plagioclase, pyroxene and rarely hornblende in the matrix. Plagioclases in the matrix
show polysynthetic twins and the minerals are classified as a long rod-shaped (Figs. 5
a–c). Pyroxene is easily distinguished with live color tone (Fig. 5 b) and lots of gas
gaps are observed in the matrix (Fig. 5).
A literature survey shows that pozzolan can be considered as a good component for
the cement industry, if it contains high amounts of zeolite minerals and volcanic glass
(Planungs Report, 1984). The thin section studies show that scoria is mainly composed
of volcanic glass, so the Patnos scoria pumice is a good pozzolan for the cement
industry.
Fig. 5. Thin sections of the scoria sample: (a) plagioclase minerals and gas gaps in volcanic glass matrix.
(b) pyroxene minerals seen in volcanic glass and plagioclase, (c) phenocrysts of plagioclase, pyroxene
and gas gaps (continued)
Chemical characterization of PatnosSscoria (Ağri, Turkey) and its usability for production of cement 311
Fig. 5. Continued
3.2. Chemical and physical properties of scoria blended cement
Chemical analyses of the scoria blended cements and control specimen are given in
Table 4. The chemical composition of the portland cement indicates that the CaO/SiO2
ratio is greater than 2 and the percent of MgO content is smaller than 5%. These
values satisfy the main composition requirements imposed by the TS EN 197– 1
standard. Depending on the scoria content, SiO2, Al2O3 and Fe2O3 contents increase
and CaO content decreases with increasing the pumice ratio in the cement mixture.
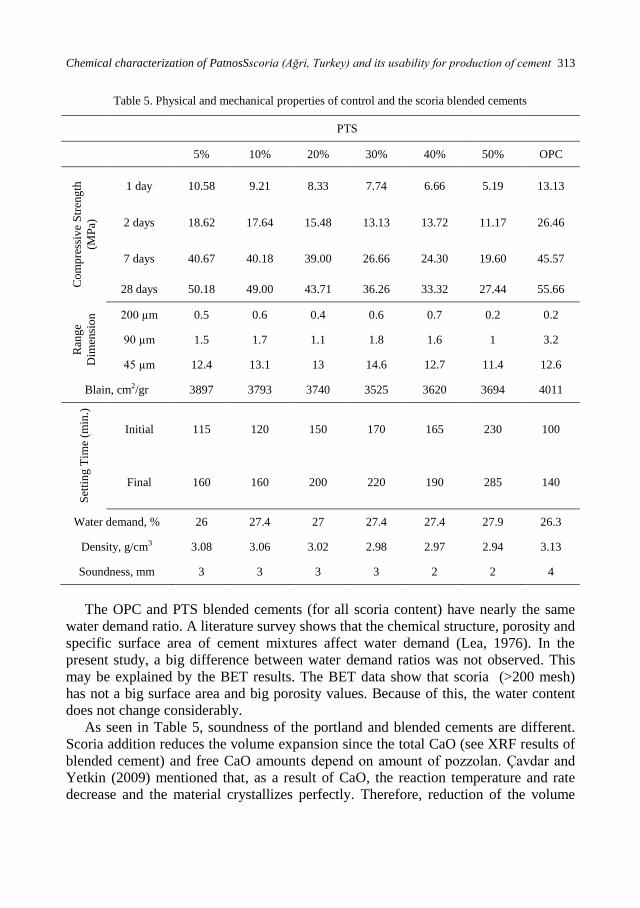
Physical and mechanical properties of control (OPC) and the scoria pumice
blended cements are given in Table 5.
The scoria blended cement mortars to be used for compressive strength testing
were prepared to have a w/sbc of 0.50 as stated in TS EN 196-1. Table 5 shows the
compressive strength values after 1, 2, 7, and 28 days. The trends, observed as
variation of comparative strength with the percentage of scoria, indicate a decrease
with the increase of scoria content in cement as expected. The literature survey shows
that the comparative strength decreases, depending on the pumice content due to the
312 T. Depci et al.
reduction of clinker content in the cement mixture (Yazıcıoğlu and Demirel 2006;
Mehta, 1981; Hossain, 2003; TCMB research 2003). In TS EN 197 – 1, early strength
(2 days) values should be greater than 10 MPa and standard strength (28 days) values
should be between 42.5 MPa and 62.5 MPa. When the obtained results are compared
to the standard, it can be seen that the strength requirements were satisfied by the
blended cements up to 20 % scoria content.
Table 4. Chemical composition of control (OPC) and scoria blended cements
Oxides PTS
OPC 5% 10% 20% 30% 40% 50%
SiO2 21.31 22.76 24.42 27.75 29.07 34.41 37.73
Al2O3 5.37 5.88 6.45 7.59 8.01 9.87 11.01
Fe2O3 3.74 4.39 4.75 5.46 5.50 6.88 7.59
MgO 2.54 2.49 2.46 2.41 2.13 2.30 2.25
CaO 60.52 58.11 55.39 49.96 46.92 39.09 33.66
Na2O 0.56 0.65 0.74 0.90 0.85 1.23 1.39
K2O 0.82 0.85 0.90 1.00 1.07 1.20 1.30
SO3 2.08 1.98 1.89 1.71 1.89 1.36 1.18
HM 1.99 1.74 1.54 1.21 1.10 0.76 0.59
SM 2.34 2.27 2.24 2.18 2.15 2.11 2.08
AM 1.43 1.45 1.47 1.51 1.46 1.56 1.57
LSF 1.99 77.16 68.38 54.07 49.69 33.94 26.59
Comparing the setting time of the portland and blended cements, the portland
cement and cements including 5 % and 10 % PTS have close setting time and setting
time increases with increasing the amount of PTS. This result is very compatible with
literature. In the literature, it is mentioned that the setting time considerably increases
by the addition of greater natural pozzolan amounts (30–70% in mass) (Öner et al.,
2003; Yetgin and Çavdar 2006; TS 25; Targan et al., 2003). The variation of setting
time can be explain by reduction of the cement content in the mixture and a low
specific surface area. As seen in Table 4, the values for blended cements are smaller
than for the control cement. The low specific surface area and clinker content may
decrease the rate of the hydration process which increases the setting time. The result
is in a good agreement with the literature (Aydin and Gül, 2007).
Chemical characterization of PatnosSscoria (Ağri, Turkey) and its usability for production of cement 313
Table 5. Physical and mechanical properties of control and the scoria blended cements
PTS
5% 10% 20% 30% 40% 50% OPC
Co
mp
ress
ive
Str
eng
th
(MP
a)
1 day 10.58 9.21 8.33 7.74 6.66 5.19 13.13
2 days 18.62 17.64 15.48 13.13 13.72 11.17 26.46
7 days 40.67 40.18 39.00 26.66 24.30 19.60 45.57
28 days 50.18 49.00 43.71 36.26 33.32 27.44 55.66
Ran
ge
Dim
ensi
on 200 µm 0.5 0.6 0.4 0.6 0.7 0.2 0.2
90 µm 1.5 1.7 1.1 1.8 1.6 1 3.2
45 µm 12.4 13.1 13 14.6 12.7 11.4 12.6
Blain, cm2/gr 3897 3793 3740 3525 3620 3694 4011
Set
tin
g T
ime
(min
.)
Initial 115 120 150 170 165 230 100
Final 160 160 200 220 190 285 140
Water demand, % 26 27.4 27 27.4 27.4 27.9 26.3
Density, g/cm3 3.08 3.06 3.02 2.98 2.97 2.94 3.13
Soundness, mm 3 3 3 3 2 2 4
The OPC and PTS blended cements (for all scoria content) have nearly the same
water demand ratio. A literature survey shows that the chemical structure, porosity and
specific surface area of cement mixtures affect water demand (Lea, 1976). In the
present study, a big difference between water demand ratios was not observed. This
may be explained by the BET results. The BET data show that scoria (>200 mesh)
has not a big surface area and big porosity values. Because of this, the water content
does not change considerably.
As seen in Table 5, soundness of the portland and blended cements are different.
Scoria addition reduces the volume expansion since the total CaO (see XRF results of
blended cement) and free CaO amounts depend on amount of pozzolan. Çavdar and
Yetkin (2009) mentioned that, as a result of CaO, the reaction temperature and rate
decrease and the material crystallizes perfectly. Therefore, reduction of the volume
314 T. Depci et al.
expansion of scoria blended cements can be explained by reduction of CaO amount in
the scoria blended cement structure.
4. Conclusion
In the light of the experimental results, the following conclusions were obtained.
1. The scoria sample (PTS) is mainly composed of amorphous silica, Al2O3 and
Fe2O3.
2. PTS has mainly hyalopilitic-porphyritic texture and from place to place,
vitrophyric-porphyritic texture. Scoria is mainly composed of volcanic glass and
there are phenocrysts of plagioclase, pyroxene and rarely hornblende in the matrix.
3. PTS possess sufficient pozzolanic characteristics to be used as an additive during
cement production, since it satisfies the standard requirements.
4. Tests conducted on the scoria blended cements suggest the manufacture of the
blended scoria cement with a maximum replacement of 20%.
5. Finally, it can be said that use of scoria found in Patnos (Ağrı, Turkey) can be
beneficially used for cement production and this will help to reduce clinker
consumption.
Acknowledgment
This research is partially funded by Yuzuncu Yil University (Project Number: 2010- FBE-YL107).
The authors would like to thank the Quality Control Team of Askale Van Cement Factory, for their
contributions in performing standard cement tests.
Reference
ARRIGO I, CATALFAMO P, CAVALLARI L, DI PASQUALE S., 2007, Use of zeolitized pumice
waste as a water softening agent, Journal of Hazardous Materials, 147, 513–517.
AYDIN A.C. AND GÜL R., 2007, Influence of volcanic originated natural materials as additives on the
setting time and some mechanical properties of concrete, Construction and Building Materials 21,
1277–1281
BINICI H and AKSOGAN O., 2006, Sulfate resistance of plain and blended cement, Cement Concrete
Comp., 28:39–46.
BLANCO VARELA M. T., MARTÍNEZ RAMÍREZ S., EREÑA, I., GENER M. AND CARMONA P.,
2006, Characterization and Pozzolanicity of Zeolitic Rocks from Two Cuban Deposits, Applied Clay
Science, V. 33, No. 2, 149–159.
ÇAVDAR A. and YETGĠN ġ., 2007, The Effect of Particle Fineness on Properties of Portland Pozzolan
Cement Mortars, Turkish Journal of Science & Technology, Volume 4, No 1, 17–23
ERSOY B., SARIISIK A., DIKMEN S., SARIISIK G., 2010, Characterization of Acidic Pumice and
Determination of Its Electrokinetic Properties in Water, Powder Technology, 197, 129–135.
FU X, WANG Y, HUANG S, HOU X, HOU W., 2003, The influences of siliceous waste on blended
cement properties, Cement Concrete Res., 33: 851–6.
GÜNDÜZ L, SARIIġIK A, DAVRAZ M, UĞUR Ġ, ÇANKIRAN O., (1998), PomzaTeknolojisi Cilt–1.
SDÜ Yayını, 285s. Isparta (in Turkish)
HOSSAIN K.M.A., 2004, Properties of volcanic pumice based cement and lightweight concrete. Cement
and Concrete Research, 34, 283–291.
HOSSAIN K. M. A., 2005, Volcanic ash and pumice as cement additives: pozzolanic, alkali–silica
reaction and autoclave expansion characteristics, Cement and Concrete Research 35, 1141– 1144
Chemical characterization of PatnosSscoria (Ağri, Turkey) and its usability for production of cement 315
HUANG, P. AND FUERSTENAU, W., 2001, The Effect of the Adsorption of Lead and Cadmium Ions
on the Interfacial Behavior of Quartz and Talc, Colloids and Furface A: Physicochemical and
Engineering Aspects, 177: 147–156.
LEA FM., 1976, The chemistry of cement and concrete, 3rd ed. London: Edward Arnold, Ltd.
LURA, P., BENTZ, D. P., LANGE, D. A., KOVLER, K., AND BENTUR, A., 2004, Pumice aggregates
for internal water curing. Kovler, K., Marchand, J., Mindess, S., and Weiss, J., eds., Proceedings of
International RILEM Symposium on Concrete Science and Engineering: A Tribute to Arnon Bentur,
137–151. Evanston:RILEM Publications S.A.R.L.
MEHTA, P.K., 1981, Studies On Blended Portland Cements Containing Santorin Earth, Cement and
Concrete Research, 4, 507–518.
ÖNER M., ERDOĞDU K., GÜNLÜ A., 2003, Effect of components fineness on strenght of blast furnace
slag cement, Cement and Concrete Research 33, 463–469.
PRASANPHAN S. and NUNTIYA A., 2006, Contributed Paper Electrokinetic Properties of Kaolins,
Sodium Feldspar and Quartz, Chiang Mai J. Sci. 33(2) : 183–190.
PERRAKI T., AND ORFANOUDAKI A., 2004, Mineralogical Study of Zeolites from Pentalofos Area,
Thrace, Greece, Applied Clay Science, V. 25, No. 1–2, 9–16.
PLANUNGS ENGINEERING MANAGEMENT (PEM), 1984, On investigations of Turkish natural
pozzolans as cement admixtures, Planungs Engineering Management Report. Ankara, Düsseldorf.
SARASWATHY V, MURALIDHARAN S, THANGAVEL K, SRINIVASAN S., 2003, Influence of
activated fly ash on corrosion–resistance and strength of concrete, Cement Concrete Res., 25:673–80.
SERSALE G.P., 1987, Portland–zeolite–cement for minimizing alkali–aggregate expansion. Cement
Concrete Res., 17:404–10.
TARGAN S, OLGUN A, ERDOGAN Y, SEVINC V., 2003, Influence of natural pozzolan, colemanite
ore waste, bottom ash and fly ash on the properties of portland cement, Cement and Concrete
Research 33 1175–1182.
TS 25, 2008, Natural pozzolan (Trass) for use in cement and concrete – Definitions, requirements and
conformity criteria. In Turkish Standards
TSE EN 197 – 1, 2002, Cement– Part 1: Compositions and conformity criteria for common cements. In
Turkish Standards
TSE EN 196 – 1, 2002, Methods of testing cement–Part 1: Determination of strength. In Turkish
Standards
TSE EN 196 – 3, 2002, Methods of testing cement–Part 3: Determination of setting time and soundness.
In Turkish Standards
T.R. PRIME MINISTRY, STATE PLANNING ORGANIZATION REPORT, 2001, (in Turkish).
TUNÇ S. and DUMAN O., 2009, Effects of Electrolytes on the Electrokinetic Properties of Pumice
Suspensions, Journal of Dispersion Science and Technology, 30, 548 – 555.
Türkiye Çimento Müstahsilleri Birliği AraĢtırmaların Gözden Geçirilmesi ve Durum Değerlendirmesi
Raporu; Traslar ve Traslı Çimentolar., 2003, TÇMB/AR–GE Enstitüsü, Ankara (in Turkish).
VUK T, GABROVSEK R, KAUCIC V., 2002, The influence of mineral admixtures on sulfate resistance
of limestone cement pastes aged in cold MgSO4 solution. Cem. Conc. Comp., 32:943–8.
YAZICIOĞLU S. and DEMĠREL B., 2006, The Effect of the Pumice of Elazığ Region used as a
Pozzolanic Additive on the Compressive Strength of Concrete in Increasing Cure Ages, Science and
Eng. J of Fırat Univ. 18 (3), 367–374.
YETGIN ġ. and ÇAVDAR A., 2006, Study of Effects of Natural Pozzolan on Properties of Cement
Mortars, Journal of Materials in Civil Engineering, 18/6, 813–816.
YILMAZ B., 2009, Effects of Molecular and Electrokinetic Properties of Pozzolans on Hydration, ACI
Materials Journal 106 (2), 128–137.

316 T. Depci et al.