Embed Size (px)
Citation preview

CHEMICAL CHARACTERIZATION AND PROVENANCE
STUDIES OF ARCHEOLOGICAL SAMPLES
A THESIS
SUBMITTED TO THE DEPARTMENT OF CHEMISTRY
AND THE INSTITUTE OF ENGINEERING AND SCIENCES
OF BILKENT UNIVERSITY
IN PARTIAL FULFILLMENT OF THE REQUIREMENTS
FOR THE DEGREE OF
MASTER OF SCIENCE
By
IŞIK RIZA TÜRKMEN
September 2003

I certify that I have read this thesis and that in my opinion it is fully adequate, in scope
and in quality , as thesis of degree of Master of Science
Prof. Dr. Hasan N. Erten (Principal Advisor)
I certify that I have read this thesis and that in my opinion it is fully adequate, in scope
and in quality , as thesis of degree of Master of Science
Asst. Prof. Dr. Dominique Tezgör-Kassab
I certify that I have read this thesis and that in my opinion it is fully adequate, in scope
and in quality , as thesis of degree of Master of Science
Prof. Dr. Hale Göktürk
Approved for the Institute of Engineering and Sciences
Prof. Dr. Mehmet Baray
Director of Institute of Engineering and Sciences
ii

ABSTRACT
CHEMICAL CHARACTERIZATION AND PROVENANCE
STUDIES OF ARCHEOLOGICAL SAMPLES
IŞIK RIZA TÜRKMEN
M.S. in Chemistry
Supervisor: Prof. Dr. Hasan N. Erten
September 2003
Data that is collected by chemical analyses of the archeological samples can be used to
find out the the raw materials used and the techniques practiced in the ancient pottery
production. In addition, provenance studies of archeological samples that are
commercially important may give an idea on the commercial relationships between the
past civilizations.
This study was conducted to investigate the chemical compositions and provenance of the
amphora samples that are found around Sinop and Heraclea Pontica (Black Sea Coast) in
Turkey, Ibn-Hani (Eastern Mediterranean Coast) in Syria, Tanais and Gorgippia on
Northern Black Sea region of Russia. Some amphorae, which are morphologically similar
to those of Colchian amphorae, but having apparently distinctive clay properties, are
called Pseudo-Colchian, and they were also analyzed during the studies. The mineral
compositions of the samples were found out by powder X-Ray Diffraction analyses, and
the elemental compositions were sought by X-Ray Fluorescence spectroscopy. Principal
component analysis and cluster analysis are applied to the data collected from XRF
measurements for the provenance classification of the samples. The results obtained from
both statistical methods complemented each others and were in good agreement.
iii

According to the results of this study, the pink clay, red clay and white clay amphorae
from Sinop are all found to be composed of the minerals quartz, feldspars, pyroxenes,
calcite and hematite, but varying in amounts with respect to type and color. Considering
the mineralogical compositions, it is proposed that the average baking temperature of the
red clay amphorae is around 800 – 850 oC whereas it is around 950 oC for the white clay
ones. The red color observed for the red clay Sinopean amphorae was attributed to the
presence of hematite minerals. On the other hand white color was attributed to the
formation of mineral phases such as pyroxenes, throughout the chemical reactions that
take place in the clay matrix at higher baking tempertures and low oxidation
environments for the white clay Sinopean amphorae.
In provenance classification of the samples, it was found that the separations between the
samples occur mainly due to variations in the concentration of elements Ca, Fe, Ti, Ni,
Rb and Sr. White clay amphorae from Antioch and Ibn Hani, and the red clay carrot type
amphora from Tanais are found to be the Sinopean production. On the other hand, the
white clay amphorae from Tanais was found to be more similar to the ones from Heraclea
Pontica and different from those of Sinop. The colchian amphorae from Gorgippia and
Pseudo-Colchian amphorae were found to represent typical differences from all other
samples, but also from each others.
Keywords:
Sinop, Heraclea Pontica, Ibn Hani, Tanais, Gorgippia, Colchis, Colchian, Pseudo-Colchian, Amphora, Tile, Tubulure, Workshop, Chemical Composition, Provenance, Powder X-Ray Diffraction, X-Ray Fluorescence Spectroscopy, Principal Component Analysis, Cluster Analysis.
iv

ÖZET
ARKEOLOJİK ESERLERİN KİMYASAL ANALİZLERİ VE KÖKEN TAYİNİ
IŞIK RIZA TÜRKMEN
Kimya Bölümü Yüksek Lisans
Tez Yöneticisi: Prof. Dr. Hasan N. Erten
Eylül 2003
Arkeolojik eserlerin kimyasal analizi sonucu elde edilen veriler, bu eserlerin üretiminde
kullanılan hammaddeler ve eserlerin üretim teknikleri hakkında bilgi edinmemizi sağlar.
Bunun yanında ticari değeri olan örneklerin köken tayinleri tarih öncesi ticari ilişkilerin
anlaşılmasına yardım eder.
Bu çalışmada Türkiye’nin Karadeniz Bölgesinden Sinop ve Ereğli, Suriye’nin Doğu
Akdeniz kıyısından Ibn Hani, ve Rusya’nın Kuzey Karadeniz kesimlerinden Tanais ve
Gorgippia’dan gelen amfora örneklerinin, kimyasal analizleri ve köken tayinleri
yapılmıştır. Analizler sırasında mineral kompozisyonları X-ışını kırınımı yöntemiyle,
elementel kompozisyonlar ise X-ışını floresans spektroskopisi ile bulunmuştur.
Örneklerin kökenlerinin bulunmasında, elementel kompozisyonlar, temel bileşenlerine
ayırma ve kümeleme metotları ile istatistiksel olarak yorumlanmıştır. Her iki istatistiksel
yöntemden elde edilen sonuçların birbirini tamamlayıcı ve birbirleriyle uyum içinde
oldukarı gözlenmiştir.
v

Çalışmalar sonucunda Demirci-Sinop yöresinden gelen pembe, kırmızı ve beyaz hamurlu
amforaların hepsinin kuvartz, feldispar, piroksen, kalsit ve hematit minerallerinden
oluştuğu; ancak bu minerallerin miktarlarinin amfora tipi ve rengine göre değiştiği
görülmüştür. Mineral komposizyonlari ve miktarları göz önüne alınarak pişirme sıcaklığı,
kırmızı hamurlu amforalar için 800-850 oC, beyaz hamurlu amforalar içinse 900-950oC
olarak belirlenmiştir. Diğer yandan kırmızı hamurlu amforalardaki rengi hematit
minerallerinin verdiği kanısına varılmıştır. Kırmızı hamurlu amforalardan daha yüksek
sıcaklıklarda pişen beyaz hamurlu amforalarda ise yüksek pişirme sıcaklığında özellikle
piroksen minerallerinin oluşması beyaz renge sebebiyet vermiştir.
Örneklerin köken tayinlerinde Ca, Fe, Ti, Ni, Rb ve Sr elementlerinin örnekler içindeki
miktarları belirleyici olmuştur. Temel bileşenlerine ayırma ve kümeleme yöntemleri
göstermiştir ki Ibn Hani ve Antakya’dan gelen beyaz hamurlu anforalar ile Tanais’ten
gelen “havuç” tipli kırmızı hamurlu amfora Sinop kökenlidir. Diğer yandan Tanais ve
Ereğli’den gelen beyaz hamurlu amforaların birbirine benzediği fakat Sinop’takilerden
farklı olduğu görülmüştür.
Gorgippia’dan gelen “Colchian” amforalarının ve morfolojik olarak “Colchian”
amforalarına benzeyen fakat kendilerine özgü hamur bileşimleri nedeniyle “Pseudo-
Colchian” olarak anılan amforaların diğer örneklere göre farklılıklar içerdiği görülmüştür.
Aynı zamanda bu amforaların birbirleri içerisinde de bazı farklılıklar taşıdıkları
gözlenmiştir.
Örneklerin mineral yapılarının karşılaştırılması da istatiksel yöntemlerle yapılan köken
tayini sonuçlarını destekleyen sonuçlar ortaya koymuştur.
Anahtar Kelimeler:
Sinop, Ereğli, Ibn Hani, Tanais, Gorgippia, Colchian, Pseudo Colchian, Amfora, Kiremit, Tübülür, Atölye, Kimyasal Analiz, Köken Tayini, Toz X-Işını Kırınımı, X-Işını Floresans Spektroskopisi, Temel Bileşenlerine Ayırma Yöntemi, Kümeleme Yöntemi.
vi

ACKNOWLEDGEMENT
I would like to express my deep gratitudes to Prof. Dr. Hasan N. Erten for his
encouragement and supervision throughout the course of this study.
I would like to thank to Asst. Prof. Dr. Dominique Tezgör-Kassab who has provided me
valuable assistance in archeological concepts and offered fine suggestions during this
study.
I wish also thank to Abdullah Zararsız and Mehmet Kaplan from Nuclear Research and
Training Center of Turkish Atomic Energy Authority, Ankara for providing the XRF
facility and for their valuable guidence in XRF Spectroscopy analyses.
I debt thanks also to Dr. Dilek Güvenç (Dept. of Mathematics, Bilkent University,
Ankara) for her generous help on the computations of Principal Component Analysis and
Cluster Analysis.
I am very gratefull to Prof. Dr. Şefik Süzer, Prof. Dr. Ömer Dağ and to all the other
department members and my friends for their continous moral support during my life in
Bilkent University.
I would like to express my endless thanks to my family for their unceased sacrifices and
support throughout the course of my study.
vii

TABLE OF CONTENTS
1. INTRODUCTION 1
1.1- The Sinopean Pottery in Detail ............................................................................8
1.1.1- The Pink Clay Amphorae .......................................................................10
1.1.2- The Red Clay Amphorae ........................................................................10
1.1.3- The White Clay Amphorae ....................................................................10
1.2- The Other Amphora Production Centers and Circulation of Amphore .............13
2. SCIENTIFIC METHODOLOGY 14
2.1- Identification of Minerals By PXRD Patterns ...................................................14
2.2- Elemental Examination of Pottery Samples By XRF Spectroscopy .................20
2.3- Statistical Interpretation .....................................................................................24
2.3.1- Principal Component Analysis ..............................................................24
2.3.2- Cluster Analysis ....................................................................................25
3. EXPERIMENTAL 26
4. RESULTS AND DISCUSSION 33
4.1- Chemical Characterization of the Raw Materials ..............................................33
4.2- Chemical Characteization of Sinopean Amphorae ............................................38
4.3- Chemical Characterization of Tiles That Are Collected From the Sites of
Demirci-Sinop ....................................................................................................45
4.4- Firing Tests ........................................................................................................47
4.5- Chemical Characterization of the Tubulures .....................................................49
4.6- Chemical Characterization of the White-Clay Amphorae That Were Found
In Antioch and Ibn Hani ....................................................................................51
4.7- Chemical Characterization of the Amphorae That Were Found In Heraclea
Pontica and Tanais .............................................................................................53
4.8- Chemical Characterization Colchian Amphorae from Gorgippia and Pseudo-
Colchian Amphorae ...........................................................................................55
4.9- Provenance Studies By Means Of Multivariate Analysis Techniques .............58
4.8.1- Principal Component Analysis ..............................................................59
4.8.2- Cluster Analysis .....................................................................................66
5. CONCLUSION 73
viii

REFERENCES ………………………………………………………………………. 76 APPENDIX I : XRF Spectroscopy – Raw Data …………………………………… 80 APPENDIX II: Concentration Plots …………………………………………………82
ix

LIST OF FIGURES
1.1 The map showing the Black Sea Area and Eastern Mediterranean Region ……...7
1.2 (a) Central Structure of Demirci Sinop Kilns (b) Aerial view of a kiln showing
the arterial columns ……………………………………………………………….9
1.3 Typology of Sinopean Amphorae ……………………………………………….11
1.4 Some Pictures of Sinopean Amphorae ………………………………………….12
2.1 (a) Diffraction of monochromatic X-Rays from an aggregate of small mineral
fragments. (b) Diffraction Cones Produced By the powder method. …………...15
2.2 Various anergy levels of electrons and their transitions that produce X-Rays in
an atom. ………………………………………………………………………….21
3.1 Schematic Diagram of the PXRD system. ……………………………………....29
3.2 Schematic Diagram of the XRF system. ………………………………………...30
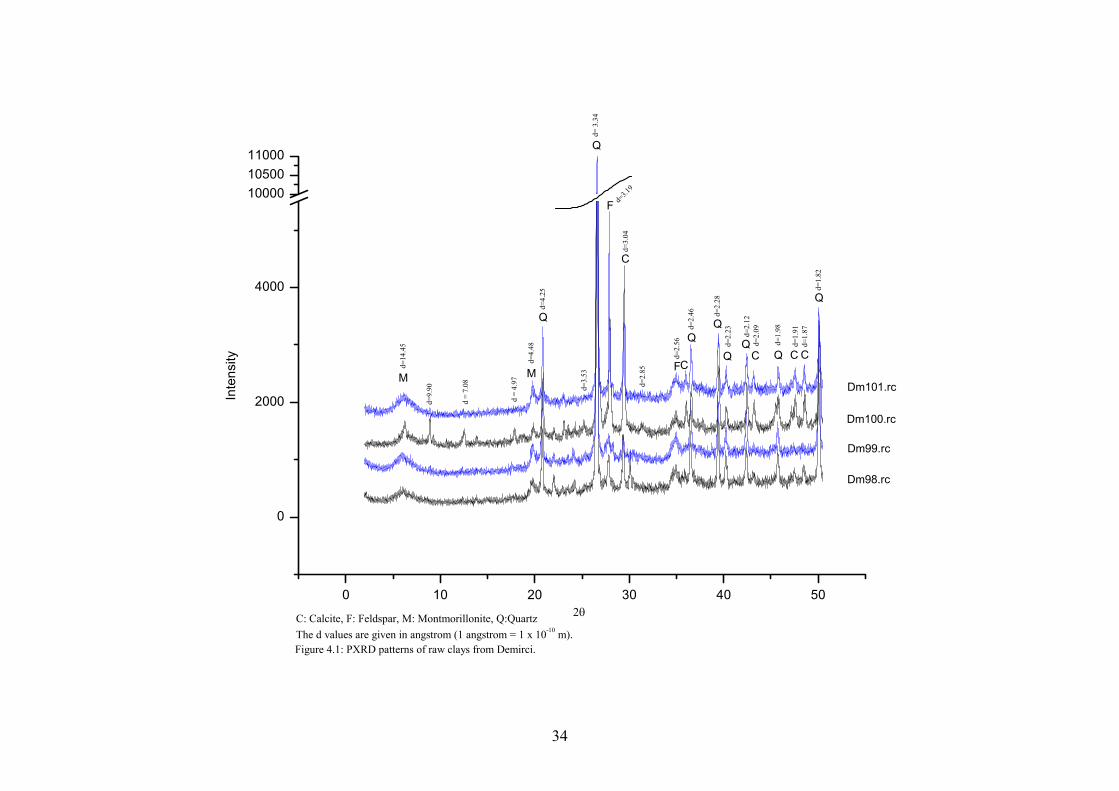
4.1 PXRD patterns of the raw clays from Demirci. …………………………………34
4.2 PXRD patterns of raw clays collected from the sites of Colchis ………………..36
4.3 PXRD patterns of black sands collected from Demirci and Colchis ……………37
4.4 PXRD pattern of the red inclusion. ……………………………………………...37
4.5 PXRD patterns of pink clay, red clay and white clay amphorae from Sinop. …..40
4.6 PXRD patterns of red clay and white clay tiles from Sinop …………………….46
4.7 The pictures of the clay samples which were baked at 850 oC, 950 oC, 1050 oC .48
4.8 PXRD patterns of red and white sides of the tubulures collected from Demirci. .50
4.9 PXRD patterns of the white clay amphorae from Ibn Hani and Antioch
Compared to those of Demirci. ………………………………………………….52
4.10 PXRD patterns of white clay Amphorae from Heraclea Pontica and Tanais
compared to those of Demirci. …………………………………………………..54
4.11 PXRD patterns of red clay carrot type amphorae from Demirci and Tanais. …...54
4.12 PXRD patterns of Colchian amphorae from Gorgippia. ………………………...56
4.13 PXRD patterns of some Pseudo-Colchian Amphorae. ………………………….57
4.14 Scatter plot of second principal component values versus first principal
component values of the pottery samples. ………………………………………62
4.15 Three-dimensional scatter plot of the first three principal component values. …63
4.16 The dendogram obtained from the resuts of cluster analysis. …………………...67
x
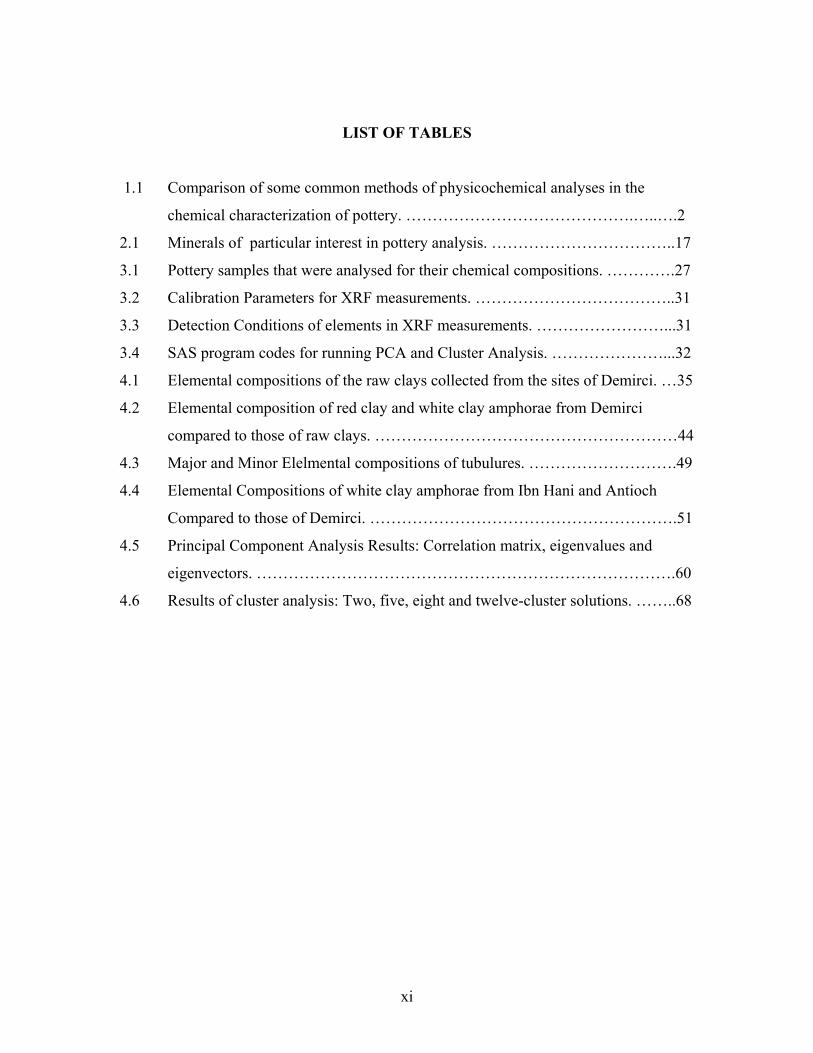
LIST OF TABLES
1.1 Comparison of some common methods of physicochemical analyses in the
chemical characterization of pottery. …………………………………….…..….2
2.1 Minerals of particular interest in pottery analysis. ……………………………..17
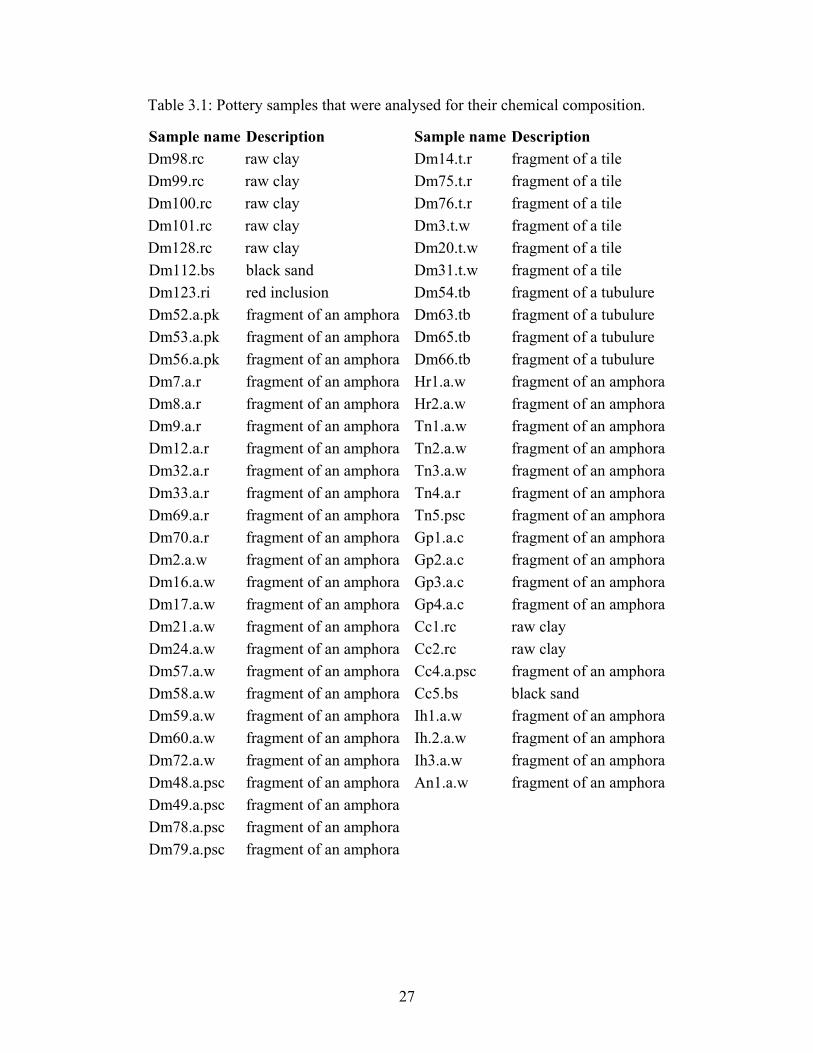
3.1 Pottery samples that were analysed for their chemical compositions. ………….27
3.2 Calibration Parameters for XRF measurements. ………………………………..31
3.3 Detection Conditions of elements in XRF measurements. ……………………...31
3.4 SAS program codes for running PCA and Cluster Analysis. …………………...32
4.1 Elemental compositions of the raw clays collected from the sites of Demirci. …35
4.2 Elemental composition of red clay and white clay amphorae from Demirci
compared to those of raw clays. …………………………………………………44
4.3 Major and Minor Elelmental compositions of tubulures. ……………………….49
4.4 Elemental Compositions of white clay amphorae from Ibn Hani and Antioch
Compared to those of Demirci. ………………………………………………….51
4.5 Principal Component Analysis Results: Correlation matrix, eigenvalues and
eigenvectors. …………………………………………………………………….60
4.6 Results of cluster analysis: Two, five, eight and twelve-cluster solutions. ……..68
xi

1. INTRODUCTION
In archeometric research, it is essential to acquire information on the compositional
characteristics of archeological samples. By this way, the researcher can have an idea about
the raw materials used in making the samples, the production techniques employed, the burial
conditions and even the provenance of the samples. This whole information then can be used
in reconstruction of the environmental context, which resembles the ancient conditions that
the potters were working.
Today many chemical-analysis techniques are applicable to samples of archeological interest
to gather both qualitative and quantitative information on their chemical compositions. X-ray
fluorescence spectroscopy (XRF) [1-6], atomic absorbtion and emission spectroscopy (AAS-
AES) [3, 7], instrumental neutron activation analysis (INAA) [8-10], particle induced X-ray
emission spectroscopy (PIXE) [4,11,12] and inductively coupled plasma-mass spectrometry
(ICP-MS) are the most widely used techniques to obtain information on the elemental
composition of the archeological samples. Among these techniques XRF spectroscopy is a
very practical one, which can collect simultaneous data on a large group of elements, where
low detection limits in the range of ppm levels can easily be reached. In addition the analyses
are done without sample consumption, therefore the samples can be reused in other
experiments. On the other hand powder X-ray diffraction (PXRD) patterns can be used to
obtain information on the minerological compositions [2, 5, 13, 14], again without
consumption of the sample. Other tecniques such as Mössbauer spectroscopy [2, 15, 16], X-
ray photoelectron spectroscopy [17], infrared spectroscopy (IR) and thermal-analysis[7,18]
can be used to investigate the stuctural properties.
Table 1.1 summarizes the techniques for chemical analysis that are applicable to archeological
studies. A researcher may choose one or more of the techniques that are sufficient enough to
meet the considerations given in the frame of a work. Whichever techniques are used, the
main purpose of analysing the chemical compositions of archeological samples is to find
relations between the physically observed properties of
1

Table 1.1: Comparison of some common methods of physicochemical analyses in the chemical characterization of pottery.1
X-Ray Diffraction X-Ray Fluorescence Spectroscopy
Atomic Absorption Spectroscopy
Optical Emission Spectroscopy
Sample size and preparation 2 – 20 mg, powdered 100 mg -3 g powdered,
pressed into a pellet 10 mg – 1g powdered 5 – 100 mg powdered
Destructiveness Sample reusable Sample reusable Sample destroyed Sample destroyed
Target of analysis Bulk composition Bulk composition Bulk composition Bulk composition
Components analyzed Crystalline minerals 80 elements, Z > 12 50 elements, not rare earths and nonmetals
30 – 40 metallic elements
Concentration range Major, minor (>1%) Major, minor, trace 10 ppm – 100 %
Major, minor, trace 10 ppm -10 %
Major, minor, trace to 100 ppm
Accuracy and precision Semi quantitative High (2 % - 5%)
Problems with sample matrix
High (2%) Low to moderate (10%)
Data Interpretation
Photographic recording or computerized
intensity vs. diffraction angle recording.
Rapid calibrations and multielement analyses.
Manual, automatic recording, slow
multielement analysis
Photographic recording, rapid multielement
analysis
Typical Uses and Applications
Clay minerals, inclusions, high
temperature minerals in glazes
Ceramic body, surface coatings (slip, glaze,
paint)
Ceramic body, surface coatings
Ceramic body surface coatings
1 See also Rice 1987, p. 374: [19]
2

Table 1.1 continued.
Neutron Activation Analysis
Particle Induced X-Ray emission Spectroscopy
X-Ray Photoelectron Spectroscopy
Mössbauer Spectroscopy
Sample size and preparation
50 – 100 mg powdered , pressed
into a pellet or whole
Few mg, cut section or
powdered pellet
ca. 1 mg, cut section or powder Whole or powdered
Destructiveness Sample destroyed Slight Slight None
Target of analysis Bulk composition Point analysis or bulk composition Bulk composition Bulk composition
Components analyzed 75 elements Elements with Z > 13
Elements with Z > 10
Elements with Mössbauer effect
(Fe, Ni, Al, Zn, Eu)
Concentration range Major, minor, trace,
ultra trace ppb – 100%
Major, minor, trace Major, minor -
Accuracy and precision 1% - 5% 5 % Semi quantitative Qualitative
Data Interpretation Rapid multielement analysis
Multielement analysis
Rapid multielement analysis Slow detection
Typical Uses and Applications
Ceramic body, raw materials, slip,
glaze
Ceramic body (focused beam point analysis), inclusions, slip,
paint
Bulk composition, can detect carbon
Generally limited to iron (e.g. , the
Fe2O3 / FeO ratio)
3
samples and their production techniques, which are not available through sole archeological
examinations of the profiles of the ceramic material.
Besides chemical analyses, petrographic studies can provide valuable information on the
mineralogical compositions and textures of samples. Based on the images of thin-sections
observed down a polarising optical microscope (POM) or a scanning electron microscope
(SEM), qualitative information on the material composition of the samples could be obtained.
The results are used to figure out the formation of ‘ceramic fabrics’, such as the association of
rock types and minerals, grain sizes, and the differences in ceramic technology [13, 14, 20].
The quantitative information coming from chemical analyses are usually interpreted
statistically to determine the provenance of ancient pottery [1, 3-5, 8-14, 16, 21]. Such
methods include principal component analysis (PCA), cluster analysis and discriminant
analysis. In addition the time period that the sample of interest belongs can be searched upon
comparing the chemical data with those of well known reference samples [3].
In studying with archeological samples, analyzing the chemical contents by chemical
analyses, gathering information on the nature of clasts, the clast grain size distribution and
relative amount of clasts in ceramic matrixes by petrological examination, and finally
comparing them with the geographical information and the fabrics of trusted reference
samples from possible production centres; may be the most effective way of attributing the
provenances.
Within many types of ceramic vessels, amphorae are of particular interest due to economic
implications of this kind of pottery. In ancient Greece and Roman Empire they were
designed specifically for transportation purposes, and were bought and traded for its content.
The transported goods were usually oil, wine, vinegar, olives, and ‘salted products’ such as
fish and capers. [14, 20]
Different shapes and colors observed for the amphorae could be related to their use for
different types of storage. However, the color and shapes of the vessels were found to change
mainly through successive periods of production, also. This observation is common among
the amphorae, which were found in Aegean, Mediterranean and Asian territories[5, 14, 20,
22]. The tendency to change in shape could be due to the improvement of jars in stacking or
4

handling [20]. On the other hand the color depends on the clay, where the clay quality might
be associated with the property of the transported good.
Due to their commercial significance, examination of amphora samples that were found at
different excavation sites can lead to an understanding of commercial relations between early
states. For such an examination, archeological and scientific evidences must be combined to
find out the production centres of transported and imported amphorae. In most cases the
archeological evidences come from the examination of typologies and collecting the stamp
informations on handles of the jars if present. Besides, evidence for the shipping of amphorae
may come from the ruins and shipwrecks that are found in underwater excavations[23].
Although publications related to chemical characterization and provenance determination of
pottery from diverse regions in Mediterranean, Aegean and East Asian territories with
archeological significance are widely increasing parallel to advances in chemical analysis
techniques, there is little amount of work cited for the chemical characterization of Sinopean
pottery [5, 24, 25]. This may be due to the late exploration of the excavation sites located
around Sinop.One of those excavation sites was found in 1993, near Demirci region located at
15 kilometres south of Sinop. As a result of the excavation of Demirci workshops a typology
of the amphorae, which were produced there could be established [26-29].
The main scope of this work was to characterise the chemical composition of pottery, which
were found in the workshops of Demirci Bay. Besides, the diversity of the colour of the clay
among the different types of Sinopean amphorae was attempted to be explained. To figure out
the techniques employed in Sinopean pottery production, the scientific approach aimed to find
out the raw materials used, the temper added, the highest firing temperature reached and the
firing atmosphere achieved in the kiln during the pottery production. Therefore, the chemical
compositions of the Sinopean pottery were compared with those of the clay samples and
possible temper materials obtained from the Demirci region. The analyses for these purposes
consisted of mineralogical examination of pottery and raw material by PXRD patterns, and
collection of elemental data through XRF spectroscopy.
Another aspect of scientific analyses was to confirm the circulation of amphorae produced in
the Black Sea and Eastern Mediterranean Sea regions. Figure 1.1 shows the map of these
regions. Besides Sinop, these sites are Heraclea Pontica (today Ereğli) and Antioche (today
5

Antakya) from Turkey, Ibn Hani from Syria, Tanais and Gorgippia from northern Black Sea
regions of Russia, and finally Colchis. Furthermore, the so-called "Pseudo-Colchian"
amphorae were discovered in some of the regions given above [30]. These amphorae have
morphological elements that are typical of Colchian amphorae, but with different clay
appearance.
Regarding the exportation of amphorae, partly traced commercial roads up to now pointed to
two main axes: one in the direction of the all Black Sea region, the other one in the direction
of the Eastern Mediterranean Sea [5]. It is believed by the archeological expertise that the
Sinopean amphorae were being exported all in these directions. Particularly Antioche and Ibn
Hani in the Eastern Mediterranean coast were foresighted to import Sinopean amphorae.
In order to explore the commercial net in these directions, provenance studies of the collected
amphorae samples were done. For the attribution of the samples to likely production centres,
the elemental data collected by XRF spectroscopy are used in multivariate statistics such as
PCA and cluster analysis.
6

Colchis
Figure 1.1: The map showing the Black Sea area and Eastern Mediterranean region.
7

1.1 The Sinopean Pottery in Detail
The workshop in Demirci Bay was found first in 1994 excavations, following the survey in
1993. Since then a total of nine kilns have been found in the region, and various types of
pottery were detected to spread in a wide area around the kilns.
Among the pottery found in Demirci Bay are tiles and tubulures used in the walls and external
covers of the kilns; the common wares such as cooking pots and vases, fine ceramics known
as “terra-sigillata”, and amphora samples of various shapes and colors. Some overfired
samples of amphora were found in the remains near the kilns. Besides, raw clay samples
and possible temper materials were obtained in the region near the workshop.
Figure 1.2 shows the structure of the kilns found in Demirci workshop in a general scheme.
In addition the aerial views of a kiln from the excavation site is shown in the figure. The kiln
is composed of two separated parts: The heating room buried under the ground and the baking
room that lies on the heating room. The roof of the baking room is made of the tubulures,
which were attached to each other by some sort of supporting material such as clay-mud.
Surprisingly, the tubulures were found to have two sides with red and white colors in the same
vessel while the white sides of the tubulures are most probably facing inside the kiln. These
kilns are mostly used in the production of amphorae and tiles.
The amphorae and the tiles found in Sinop show diversity of colours and shapes. The colours
observed for the amphorae relate to different periods, which succeed each other, and
correspond to specific shapes [5].
8

a.Central structure of the Demirci-Sinop kilns. 1: External covering which is built 6: Supporting chords. up from the tubulures. 7: Arterial columns. 2: Baking room. 8: Heating room. 3: Wall built from broken tiles. 9: Earth filling. 4: Stone layer at the ground. 10: Entrance 5: Grill separating the baking and heating rooms.
b. Aerial view of a kiln showing the arterial columns.
Figure 1.2: Central structure of the Demirci-Sinop kilns. 1
9
1 See also Kassab Tezgör & Tatlıcan 1999, p. 319 [23].

1.1.1 The Pink Clay Amphorae The pink clay amphorae have been produced in Demirci during the 3rd c. AD, and represent
the oldest shape that is known to be produced in Demirci workshops. In outer appearance the
clay is pinkish and the wall inside has often a purple tint.
1.1.2 The Red Clay Amphorae
The production of red clay amphorae was intensively continued between the second half of
the 4th c. AD and 5th c. Ad. Among the various shapes and sizes observed for the red clay
amphorae, the so-called ‘carrots’ because of their thin and elongated shapes were the most
frequently produced ones.
1.1.3 The White Clay Amphorae
The production of white clay amphorae in Sinop started at the beginning of 6th c. AD. The
clay of this kind of amphorae may have light brown or yellow colors, and sometimes it turns
to greenish yellow. Different shapes and sizes are associated with white clay amphorae.
Despite the differing colors observed for Sinopean amphorae, the tempers as can be seen by
naked eye appear to be the same. The black sand is the most characteristic feature of the
temper. It was found to be composed of pyroxene minerals in the previous studies devoted to
Sinopean amphorae [24, 25]. The other temper material is the red inclusion, often observed as
small fragments in amphora and tile samples. These fragments are hard in physical stance and
thought to be composed of mainly iron-containing minerals.
Figures 1.3 and 1.4 shows some examples for the typology of Sinopean amphorae and some
pictures of pink clay, red clay and white clay amphorae from Sinop.
10

Figure 1.3: Typology of Sinopean amphorae.
11

Figure 1.4: Some pictures of Sinopean amphorae.
12
1.2 The Other Amphora Production Centers and the Circulation of Amphorae
It is known that the Sinopean, Colchian and Pseudo-Colchian amphorae have been
exported all around the Black Sea [31]. Although the information regarding the
circulation of amphorae in Eastern Mediterranean Sea is incomplete, the studies in
progress show that the distribution of amphorae from Black Sea region to Eastern
Mediterranean Sea was also one of the important trade routes [5].
Within the Black Sea countries, the Northern cities of Tanais and of Gorgippia have been
determined to receive importation of amphorae. Particularly the white-clay amphorae
found in Tanais were thought to originated from Heraclea Pontica [32]. On the other hand
the red clay amphorae, particularly the carrots might have Sinopean origin. Regarding the
amphorae discovered in Gorgippia, some of them were ascertained to have Colchian
origin [29].
Referring to the circulation of amphorae in the Eastern Mediterranean Sea, the red clay
carrot type amphorae were found to exported in largest numbers. On the other hand, the
archeological investigations carried in Eastern Mediterranean regions led to the discovery
of white clay amphorae of Sinop origin in Seleucia of Pieria and Ibn Hani. White clay
amphorae were collected from Antioche and Ibn Hani for the scientific analyses, which
were thought to be Sinopean production.
13

2. SCIENTIFIC METHODOLOGY
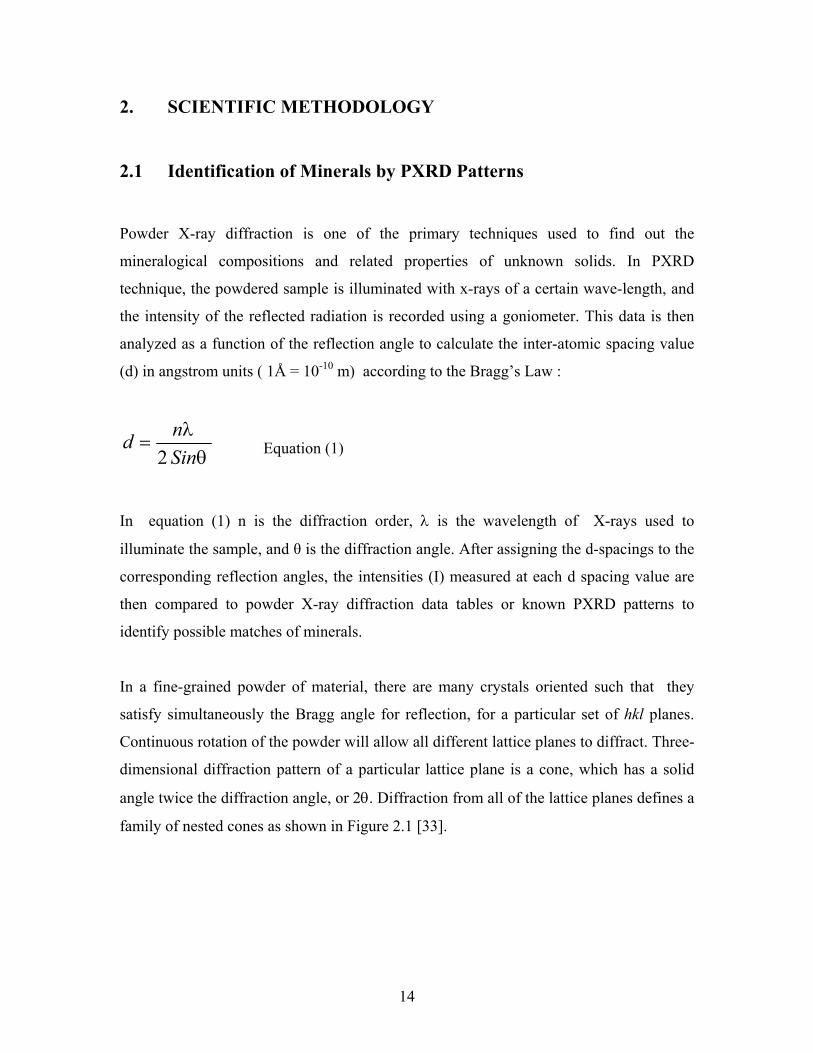
2.1 Identification of Minerals by PXRD Patterns
Powder X-ray diffraction is one of the primary techniques used to find out the
mineralogical compositions and related properties of unknown solids. In PXRD
technique, the powdered sample is illuminated with x-rays of a certain wave-length, and
the intensity of the reflected radiation is recorded using a goniometer. This data is then
analyzed as a function of the reflection angle to calculate the inter-atomic spacing value
(d) in angstrom units ( 1Å = 10-10 m) according to the Bragg’s Law :
θλSinnd
2= Equation (1)
In equation (1) n is the diffraction order, λ is the wavelength of X-rays used to
illuminate the sample, and θ is the diffraction angle. After assigning the d-spacings to the
corresponding reflection angles, the intensities (I) measured at each d spacing value are
then compared to powder X-ray diffraction data tables or known PXRD patterns to
identify possible matches of minerals.
In a fine-grained powder of material, there are many crystals oriented such that they
satisfy simultaneously the Bragg angle for reflection, for a particular set of hkl planes.
Continuous rotation of the powder will allow all different lattice planes to diffract. Three-
dimensional diffraction pattern of a particular lattice plane is a cone, which has a solid
angle twice the diffraction angle, or 2θ. Diffraction from all of the lattice planes defines a
family of nested cones as shown in Figure 2.1 [33].
14

Figure 2.1: a) Difraction of monochromatic X-Rays from an aggregate of small mineral fragments.
b) Diffraction cones produced by the powder method.
The powder X-Ray diffraction method is very useful in qualitative phase analysis since
every crystalline material shows a characteristic powder pattern. The d-spacings of the
diffraction lines and their intensities are two important parameters used in the
identification of the powder patterns. The d-spacings do not vary for a particular mineral
unless the material is in some stressed, disordered or metastable condition [34]. On the
other hand the intensities may vary from sample to sample, especialy when the sample
consists of more than one crystalline material having a common diffraction peak with
same d-spacing, but differing intensities. Some materials may have preffered crystal
orientation at specific conditions, and this may also lead to variation of intensities of the
d-spacings from the tabulated values [34].
In PXRD measurements, when the sample is composed of more than one or two minerals,
the identification of the minerals could be difficult. This usually happens when the most
intense peaks of a particular mineral are shadowed by the other minerals having more
intense peaks at similar d-spacings. Although the ratio of the intensity of diffraction
peaks depends on crystal properties, the strength of each peak depends on the amount of
the mineral. In some cases, the shape of peaks may also yield valuable information. The
broadening of the diffraction peaks and the shifts in the d-spacings can be used to extract
information on particle size and crystal lattice distortions due to physical and chemical
effects [34].
15

In the study of the mineral compositions of pottery; quartz, feldspars, carbonates and clay
minerals are the commonly observed species [2, 7, 13, 14]. The presence of such kinds of
minerals usually reflect the natural content of raw material, which infact is the clay taken
near the production centers. Therefore the composition of the minerals given above may
show variations upon the change of the geology of the production centers. On the other
hand, more specific minerals might be searched to determine the nature of tempering
materials and inclusions. Moreover, identification of some minerals, which occur as a
result of chemical reactions at high temperatures can give an idea about the firing
conditions of the pottery. Presence of some minerals could also be used to explain the
diversity of the colors observed among pottery samples.
Table 2.1 shows the minerals of particular interest in pottery analysis and their
properties. Most of the times, the identification of techniques employed in manufacture of
the pottery is achieved by determination of one or more of the key minerals listed in table
2.1.
16

Table 2.1: Minerals of particular interest in pottery analysis. 1 Mineral family Mineral’s name Formula Crystalline
form Color PXRD data (d-spacings and corresponding intensities.)
Chlorite (Mg, Al, Fe)12 (Si,Al)8O20(OH)16
monocl. grn., wh., yel., pink, br., red 14.08 – 7.05 – 3.52
Illite K1-1.5Al4Si7-6.5O20(OH)4 monocl. wh. 2.60 (100) - 3.35 (100) – 1.99 (100) – 10.00 (80)
Kaolinite Al2Si2O5(OH)4 tricl. wh., redsh.-wh., grnsh.-wh.
7.17 (100) – 1.49 (90) -3.58 (80) – 4.37 (60)
Clay minerals
Montmorillonite Hydrated Na-Ca-Mg-Al silicate monocl. wh., yel., grn. 13.6 (100) – 4.47 (18) – 3.34 (10)
– 3.23 (10)
Quartz SiO2 rhbdr.col., wh., blk., purp., grn., bl., rose
3.34 (100) - 4.26 (19) – 1.82 (11) – 1.54 (8) Silica
Minerals Cristobalite SiO2 tetr. col., wh., yel. 4.05 (100) – 2.48(20) – 2.84 (13) –
3.14 (12)
Albite NaAlSi3O8 tricl.col., wh., somet. yel., pink, grn.
Low: 3.19 (100) – 4.03 (61) - 3.21 (58) – 3.66 (34) High: 3.20 (100) – 3.18 (88) – 3.75 (61) – 3.64 (28)
Andesine (Na, Ca)(Si,Al)4O8 tricl. wh., gray, grn. 3.21 (100) – 3.18 (90) – 4.04 (80)
Anorthite CaAl2Si2O8 tricl. wh., yel., grn., blk.
3.20 (100) – 3.18 (100) – 3.21 (58) – 3.26 (53) - 4.04 (52)
Labradorite (Ca, Na)(Si,Al)4O8 tricl. col., gray, wh. 3.18 (100) – 3.21 (70) – 3.76 (70)
Feldspars -plagioclase
Oligoclase ([NaSi]0.9 – 0.7[CaAl]0.1-
0.3AlSi2O8 tricl. col., wh., gray,
grnsh., pink 3.20 (100) – 3.74 (80) – 4.02 (80)
1 See also [35] and [36].
17

Table 2.1: Continued. Mineral family Mineral’s name Formula Crystalline
form Color PXRD data
Microcline KAlSi3O8 tricl. col., wh., pink, red, yel., grn.
Low: 3.25 (100) – 3.29 (48) – 4.21 (51) – 3.37 (41) – 3.83 (30)
Orthoclase KAlSi3O8 monocl. col., wh., pink, red, yel., grn. 3.18 (100) – 4.02 (90) – 3.8 (80) K – f eldspars
Sanidine (K, Na)(Si,Al)4O8 monocl. col., wh. 3.26 (100) – 3.22 (90) – 3.27 (75)
Ankerite Ca (Fe2+,Mg,Mn) (CO3)2
rhbdr. br. yelsh. br., grnsh. br., pink
2.90 (100) – 1.81 (6) – 2.19 (6)
Aragonite CaCO3 rhomb. col., wh. 3.40 (100) – 1.98(65) – 3.27 (52) – 2.70 (46)
Calcite CaCO3 rhbdr. col., wh., somet. gray, yel., pink
3.04 (100) – 2.29(18) – 2.10 (18) – 1.91(17)
Dolomite CaMg(CO3)2 rhbdr. wh., oft. yel. or br., col.
2.886 (100) – 2.192 (30) – 1.786 (30) – 1.781 (30)
Kutnohorite Ca (Mn, Mg, Fe2)(CO3)2 rhbdr. 2.94 (100) – 1.814 (30) – 1.837 (25)
Magnesite MgCO3 rhbdr. wh., col., somet yel., br.
2.742 (100) – 2.102 (45) – 1.700 (35) – 2.503 (18)
Carbonates
Siderite FeCO3 rhbdr. yelsh. br., br., dk. br.
2.79 (100) – 1.734 (80) – 3.59 (60)
18
Table 2.1: Continued. Mineral family Mineral’s name Formula Crystalline
form Color PXRD data
Goethite FeO(OH) rhomb.blksh. br., yelsh or redsh br., yel.
4.18 (100) – 2.69 (30) – 2.45 (25) – 2.19 (20)
Hematite alpha Fe2O3 rhbdr. dull red to bright red
2.69 (100) – 2.514 (75) – 1.692 (45) - 1.838 (30)
Iron oxides
Maghemite gamma Fe2O32.514 (100) – 1.474 (40) – 2.95 (30)
Augite (Ca, Fe, Mg)SiO3 monocl. pa. br, br, grn, blk.
2.994 (100) – 3.234 (75) – 2.949 (65) – 2.516 (65) – 2.566 (55)
Diopside CaMg(SiO3)2 monocl. wh., pa. grn, dk. Grn
2.991 (100) – 2.528 (40) – 2.893 (30) – 2.518 (30)
Enstatite MgSiO3 rhommb. col, gray, grn, yel, br 3.167 (100) – 2.87 (85) – 2.48 (50)
Pyroxenes
Hedenbergite CaFeSi2O6 monocl. brnsh grn, dk. grn, blk 2.97 (100) – 2.53 (50) –2.56 (30)
19

2.2 Elemental Examination of Pottery Samples By XRF
Spectroscopy
The X-rays generated in an X-ray tube or coming from a radioactive source can either be
absorbed by the atom or scattered through the material when it strikes a sample. If an X-
ray has sufficient energy then it can eject an electron from the innermost shells of an
atom upon absorption. A vacancy is created by this way in the inner shells of the atom.
This is an unstable condition, and the atom returns to a stable position by electron transfer
from outer shells to the inner shells. During this process characteristic X-ray is emitted
whose energy is the difference between the two binding energies of the electrons in the
corresponding shells. Every element has its characteristic spectral lines, which make it
possible to find the elemental composition of a sample from the detection of X-rays
emitted.
The process of using X-rays as a source of radiation to excite other elements is called X-
ray fluorescence (XRF) spectroscopy. XRF spectroscopy is a non-destructive way of
measuring the elemental composition of a sample. In addition, simultaneous
determination of several trace elements is possible, even at very low concentrations.
The electrons in an atom fill distinct energy levels known as shells, K, L, M, etc. The
wavelength of the most intense characteristic emission line occurs for the transition of an
electron from the higher energy levels to 1s orbital in the K shell. This line is known as
the “K” line. Similarly if the transition occurs from higher energy levels to the second
energy level in the L-shell, the line is called as “L” line. Figure 2.2 shows various energy
levels of electrons and their transitions that produce X-rays in an atom.
20

Figure 2.2: Various energy levels of electrons and their transitions that produce X-rays in
an atom.1
The transitions in fact occur in doublets. For example for the element copper, the Kα
transition is a doublet, having wavelengths of Kα1 = 1.54051 Å and Kα2 = 1.5433 Å. The
slight difference in the energies of the Kα1 and Kα2 is due to two possible spin states of
the electron which makes the transition relative to the spin of the vacant 1s orbital.
The X-ray lines of differing wavelengths can be expressed in kiloelectronvolts (keV),
whereas the X-ray intensity is commonly reported in counts per seconds (cps). The
relation between the energy and wavelength of X-ray is:
1 See also Zoltai & Stout [33] for the figure.
21

ο
λλ
)(/4.12)( Α==hckeVE Equation (2)
As the atomic number of the elements increases, the wavelength of the X-rays emitted
decrease. For this reason the elements are categorized according to their atomic numbers
in XRF spectroscopy. The elements with low atomic numbers (Z < 20) are called light
elements, and high atomic number elements are called heavy elements. The radiations
coming from the light elements can be absorbed by the sample matrix and air. Thus the
detection of light elements with X-ray spectroscopy requires an extra effort, taking into
account the mass attenuation coefficients of the sample matrixes and the experimental
environment [6]. Consequently measurement at different experimental conditions may be
required to obtain acceptable counting statistics in pottery analysis since the samples are
usually composed of a large set of elements.
The elemental comparisons in pottery analysis is a common method applied in attributing
the provenance of the samples. In most cases, the discrimination of pottery in provenance
analysis is achieved by evaluation of elemental data with one of the multivariate
statistical analysis tecniques. The underlying assumption of provenance studies is that the
differences between distinct sources of materials can be tracked from analytical data.
Upon comparison of analytical data, the distinguishing features of materials from
different origins can be recognised.
In provenance studies, often the compositions of unknown species are compared with the
species having precisely known origins. The reference materials may be the clay taken
from the geological regions where the pottery of interest are discovered. Additionaly
stamped vessels can be used for the same purpose. In certain cases, the data obtained by
analyzing samples of clays might not be reliable in attributing the provenances due to
variations in clay beds in time, or alteration of the clay sample by the potter in making a
pot. Another possibility is the mixing of different clays.
22

Both elemental and mineralogical investigations can be used in provenace studies, but the
analyses frequently focus on detection of the minor and trace elements. Particularly the
trace elements, which occur in the range of 1 -1000 ppm are considered as accidental
inclusions in clays that do not contribute to general physical properties of the sample
[20]. However comparison of the concentrations of these elements may reveal
information on the provenances, since the trace element concentration is dependent on
the nature and origins of the geological material. On the other hand minor elements
having concentrations between c. 0.1 – 10 % might be due to the replacement of elements
such as Al, through their entrapment in the lattice of clay minerals or addition of
inclusions. Thus the examination of minor element concentrations may give clues about
the additive materials, which may change from one production center to other. Hence
selection of the elements is the most critical issue in discriminating the sources of
different origins.
The elements that are chosen to represent variability in archeological samples should be
good discriminators, have good analytical precision, and be reliable in terms of the
contamination in the post depositional environment [19]. Thus the most useful elements
are the ones that offer variation consitently between the pottery made of different
resources, while showing little variation within same types.
In certain cases, the discrimination between the groups can be achieved by using two-
element or three - element plots. Nevertheless larger number of elements should be used
as variables to get more intimate results. When more than three elements are used as
variables, it becomes difficult to visualize the correlation of data in three dimensions.
Thus methods capable of presenting data with many variables in two or three dimensions
are used in such cases.
23

2.3 Statistical Interpretation
As previously discussed, the reason of using multivariate statistics in the interpretation of
chemical data is the difficulty of determining correlations between some elements within
a large group of samples. By employing multivariate statistical analysis methods the
discrimination in the whole data can be presented in two or three dimensions. In other
words the data is reduced without the loss of information.
2.3.1 Principal Component Analysis
Principal component analysis (PCA) is a multivariate statistical analysis technique for
examining the relationships among several quantitative variables. Its main purpose is to
reduce data by maintaining the variability of the system unchanged, and to reveal
relationships within the observations that were not previously suspected from the original
variables. In addition the principal components may serve as an intermediate step, and
can be inputs to further statistical analyses. PCA is widely used in provenance
determination of archeological samples[1, 5, 8, 14, 21] or in geological research [37].
As a method of data interpretation, PCA is concerned with explaining the varience
covarience structure of the data through a few linear combinations of the original
variables. The new variables are referred as principal components.
In provenance determination studies the first few principal components are often
sufficient enough to reveal a significant result. The relationship among the samples and
their provenances are determined by looking at the separations and overlaps of the groups
formed on the scatter plot of principal components. Samples from the same provenance
aggregate on one part of the scatter plot which is then easy to comment on the origin of a
sample. Often the scatter plot of principal component 1 vs principal component 2 gives
enough information. In certain cases the three dimensional scatter plots can be used to
increase the integrity of the results [14].
24

2.3.2 Cluster Analysis
The purpose of cluster analysis is to place objects into groups or clusters suggested by the
data. In this way objects in a given cluster tend to be similar, and objects in different
clusters tend to be dissimilar on the basis of similarity measures chosen. Usually
dendograms are used to show the hierarchy of the clustering.
25
3. EXPERIMENTAL
The analyses of the samples included mainly the amphora pieces coming from various
sites of Black Sea and Mediterranean coasts: Demirci-Sinop and Heraclea Pontica (Ereğli
today) on the southern Black Sea coast, Tanais and Gorgippia on the northern Black Sea
coast, Colchis at the eastern side of Black Sea, and Ibn Hani on the Eastern
Mediteranean coast. There was also a piece of amphora sample coming from Antioch.
The amphora samples to be analysed were chosen carefully to resemble various types
having different shapes, sizes and colors. Besides, the tiles, the common wares, the
tubulures, the raw clays and the inclusions from Sinop were also analysed. Table 3.1
shows the samples that were analyzed.
The samples were analyzed for their mineral contents by powder X-ray diffraction
(PXRD) and for their elemental contents by energy dispersive X-Ray fluorescence (XRF)
spectroscopy. For the PXRD and XRF analyses, samples except raw clays were first
washed with distilled water in order to get rid of the impurities present on the surface.
The surfaces of the samples were also scrapped with a spatula to minimize the errors that
might arise as a result of contamination in burial environments. After drying completely,
the samples were grounded in a mortar with a pestle. Three-gram powder samples were
prepared without any particle size fractionation, subject to bulk analyses. Without
washing, the same procedure was applied to the raw clays.
PXRD analyses were carried out using a Rigaku Miniflex model instrument, at Bilkent
University, Chemistry Department. Figure 3.1 shows the schematic diagram of the
experimental setup for the PXRD analyses. The X-ray source consisted of unfiltered Cu
K-alpha radiation (λ = 1.5418 Å), generated in a tube operating at 30 kV and 15 mA.
Spectra were recorded with 2 theta (2θ) values ranging from 5 to 50 (70 in some samples)
degrees in steps of 0.01 degree. A NaI (T1) scintillator detector was used for the counting
process and Rigaku Miniflex (version 3.0) software for Windows was used for data
handling. Smoothing and K-beta corrections were done on the spectra before examining
26

Table 3.1: Pottery samples that were analysed for their chemical composition.
Sample name Description Sample name Description Dm98.rc raw clay Dm14.t.r fragment of a tile Dm99.rc raw clay Dm75.t.r fragment of a tile Dm100.rc raw clay Dm76.t.r fragment of a tile Dm101.rc raw clay Dm3.t.w fragment of a tile Dm128.rc raw clay Dm20.t.w fragment of a tile Dm112.bs black sand Dm31.t.w fragment of a tile Dm123.ri red inclusion Dm54.tb fragment of a tubulure Dm52.a.pk fragment of an amphora Dm63.tb fragment of a tubulure Dm53.a.pk fragment of an amphora Dm65.tb fragment of a tubulure Dm56.a.pk fragment of an amphora Dm66.tb fragment of a tubulure Dm7.a.r fragment of an amphora Hr1.a.w fragment of an amphora Dm8.a.r fragment of an amphora Hr2.a.w fragment of an amphora Dm9.a.r fragment of an amphora Tn1.a.w fragment of an amphora Dm12.a.r fragment of an amphora Tn2.a.w fragment of an amphora Dm32.a.r fragment of an amphora Tn3.a.w fragment of an amphora Dm33.a.r fragment of an amphora Tn4.a.r fragment of an amphora Dm69.a.r fragment of an amphora Tn5.psc fragment of an amphora Dm70.a.r fragment of an amphora Gp1.a.c fragment of an amphora Dm2.a.w fragment of an amphora Gp2.a.c fragment of an amphora Dm16.a.w fragment of an amphora Gp3.a.c fragment of an amphora Dm17.a.w fragment of an amphora Gp4.a.c fragment of an amphora Dm21.a.w fragment of an amphora Cc1.rc raw clay Dm24.a.w fragment of an amphora Cc2.rc raw clay Dm57.a.w fragment of an amphora Cc4.a.psc fragment of an amphora Dm58.a.w fragment of an amphora Cc5.bs black sand Dm59.a.w fragment of an amphora Ih1.a.w fragment of an amphora Dm60.a.w fragment of an amphora Ih.2.a.w fragment of an amphora Dm72.a.w fragment of an amphora Ih3.a.w fragment of an amphora Dm48.a.psc fragment of an amphora An1.a.w fragment of an amphora Dm49.a.psc fragment of an amphora Dm78.a.psc fragment of an amphora Dm79.a.psc fragment of an amphora
27

Table 3.1 (continued). ANNEX:
The first two letters of the sample name denote sample’s finding spot:
Dm: Demirci (Sinop) Cc: Colchis
Hr: Heraclea Pontica Ih: Ibn Hani
Tn: Tanais An: Antioch
Gp: Gorgippia
The numbers that come next are the sample-numbers.
The letters that come after the sample-number denote the type and color of the
sample:
a: amphora t: tile
bs: black sand. tb: tubulure
rc: raw clay r: red
ri: red inclusion. w: white
c: colchian pk: pink
psc: pseudo-colchian p: purple
Eg:
Dm52.a.pk
Finding spot : Demirci
Sample number :52
Tpye: amphorae
Color: pink (pink clay)
Eg:
Tn5.a.psc
Finding spot: Tanais
Sample number: 5
Type: amphorae, Pseudo-colchian
28

the patterns and the mineral compositions of the samples were qualitatively determined
following a search-match procedure.
Figure 3.1: Schematic diagram of the PXRD system1.
The XRF analysis of the samples were done with a high performance Oxford ED-2000
energy dispersive XRF system located at the Nuclear Research and Training Center of
the Turkish Atomic Energy Authority, Ankara. 19 elements Mg, Al, Si, P, K, Ca, Ti, V,
Fe, Ni, Cu, Zn, As, Rb, Sr, Zr, Ba, La, Sm were sought throughout the analyses. The raw
data of XRF spectroscopy measurements are given in Appendix I.
Figure 3.2 shows the schematic diagram of the epxerimental setup for the XRF
measurements. XRF pellets were positioned in front of a Si (Li) detector and irradiated
with X-rays originating from a Rh target. The tube power was 50 W and the maximum
current was 1000 µA. Measurements of the elemental concentartions are done upon the
calibration of the system with different sediment and soil standards. Five different
detection conditions were chosen for the measurements depending on the atomic weights
of the elements analyzed, and only the most effective Auger lines were chosen for each
element in the calculations. The spectra were acquired and analysed using Oxford Xpert
1 Taken from the Rigaku Miniflex’s “Installation Guide and User Manual” book.
29
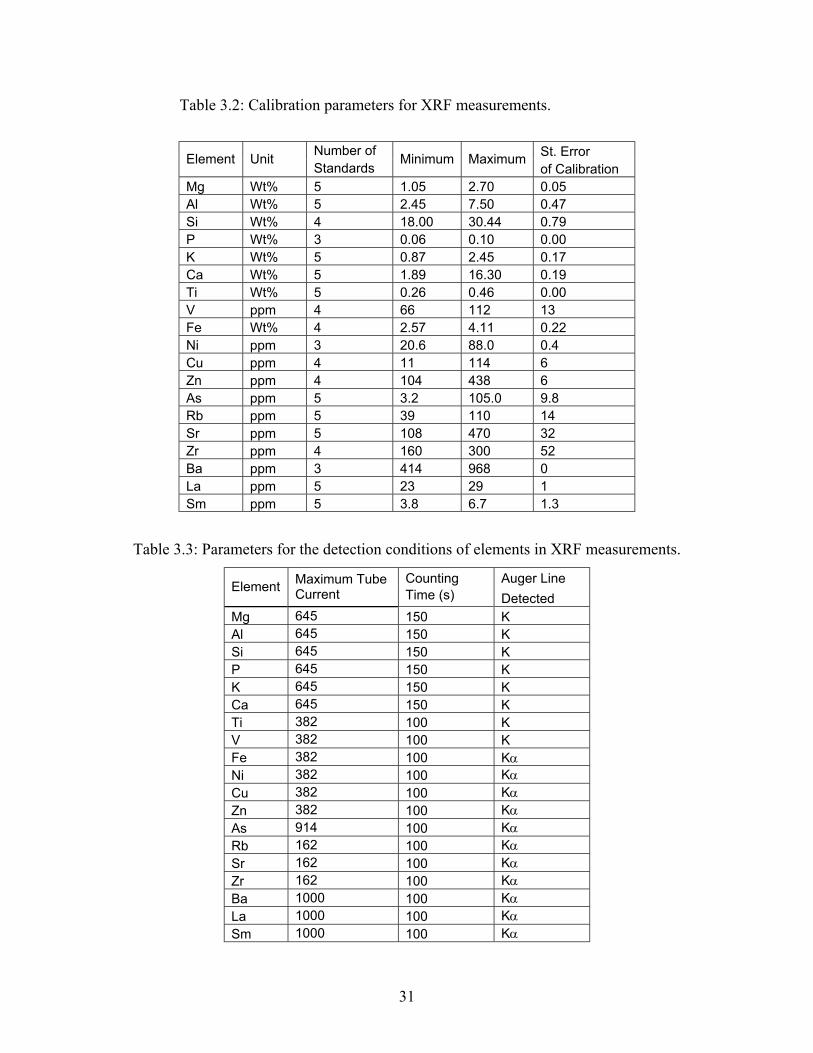
Ease software. Table 3.2 and 3.3 gives information on the calibration parameters and
detection conditions.
Figure 3.2: Schematic diagram of the XRF system. Besides PXRD and XRF analyses, some raw clay samples were baked at high
temperatures to follow the change of color with the firing temperature. For this purpose
Thermolyne type 48000 furnace was used, which is located at Bilkent University,
Chemistry Department. The sample Dm100.rc and the mixture of Dm100.rc and
Dm128.rc in equal weights were baked at 850 oC, 950 oC, 1050 oC for 5 hours. The
furncae was not hermetically closed, and the passage of air inside the kiln was allowed
during baking the samples.
For the provenance classification of the samples, principal component analysis (PCA)
and cluster analysis have been applied to the data collected from XRF measurements.
Statistical Analysis Software (SAS) installed on Bilkent University`s Unix system was
used in the calculations of principal components and cluster analysis. In PCA,
standardised relative mass fractions of the elements were employed as variables. The
elements were choosen such that they had been determined with small standard errors,
and they could be the representatives of regional variation among the samples.
Clustering of the samples are done by the avaerage linkage method in cluster analysis.
The distance between the two clusters is defined as the average distance between pairs of
observations, one in each cluster. The SAS program codes for running the PCA and
cluster analysis are given in Table 3.4.
30

Table 3.2: Calibration parameters for XRF measurements.
Number of St. Error Element Unit Standards
Minimum Maximum of Calibration
Mg Wt% 5 1.05 2.70 0.05 Al Wt% 5 2.45 7.50 0.47 Si Wt% 4 18.00 30.44 0.79 P Wt% 3 0.06 0.10 0.00 K Wt% 5 0.87 2.45 0.17 Ca Wt% 5 1.89 16.30 0.19 Ti Wt% 5 0.26 0.46 0.00 V ppm 4 66 112 13 Fe Wt% 4 2.57 4.11 0.22 Ni ppm 3 20.6 88.0 0.4 Cu ppm 4 11 114 6 Zn ppm 4 104 438 6 As ppm 5 3.2 105.0 9.8 Rb ppm 5 39 110 14 Sr ppm 5 108 470 32 Zr ppm 4 160 300 52 Ba ppm 3 414 968 0 La ppm 5 23 29 1 Sm ppm 5 3.8 6.7 1.3
Table 3.3: Parameters for the detection conditions of elements in XRF measurements.
Counting Auger Line Element Maximum Tube Current Time (s) Detected
Mg 645 150 K Al 645 150 K Si 645 150 K P 645 150 K K 645 150 K Ca 645 150 K Ti 382 100 K V 382 100 K Fe 382 100 Kα Ni 382 100 Kα Cu 382 100 Kα Zn 382 100 Kα As 914 100 Kα Rb 162 100 Kα Sr 162 100 Kα Zr 162 100 Kα Ba 1000 100 Kα La 1000 100 Kα Sm 1000 100 Kα
31

Table 3.4: SAS programme codes fur running PCA and cluster analysis.
filename dat 'pcadat.txt'; data pottery; infile dat; input sample $ 1-8 Ca Fe Ti Ni Rb Sr; proc princomp out=results; proc print; id sample; var prin1 prin2 prin3 prin4 prin5 prin6; run;
filename dat 'cldat.txt'; data pottery; infile dat; input sample $ 1-8 Ca Fe Ti Ni Rb Sr; proc cluster method=average outtree=tree; id sample; proc tree noprint data=tree ncl=2 out=new; id sample; proc sort; by cluster; proc print; title "Two-Cluster Solution"; by cluster; id sample; run; proc tree noprint data=tree ncl=5 out=new; id sample; proc sort; by cluster; proc print; title "Five-Cluster Solution"; by cluster; id sample; run; proc tree noprint data=tree ncl=8 out=new; ID sample; proc sort; by cluster;
proc print; title "Eight-Cluster Solution"; by cluster; ID sample; run; proc tree leafchar=" " treechar=" " joinchar="." data=tree ncl=12 out=new; d sample; proc sort; by cluster; proc print; title "12-Cluster Solution"; by cluster; id sample; run;
32
4. RESULTS and DISCUSSION
4.1 Chemical Characterization of the Raw Materials
The results of the experiments are interpreted together with the observations on the samples;
their hardness, thickness, the color of the layers (if a sample consists of different layers), and
the inclusions particularly on the surfaces.
Analyses began with the examination of clay samples, the red inclusion and the black sand
taken from Demirci region. A white additive found on one of the kilns, which is named as the
white clay was also analysed. The clay samples were observed to have two main colors:
Samples Dm98.rc and Dm99.rc were yellowish brown (Munsell color: 10 YR 5/6) and
samples Dm100.rc and Dm101.rc were pale olive (Munsell color: 5Y 6.5/4).
Figure 4.1 shows the PXRD patterns of the clay samples taken from Demirci region. These
patterns imply the presence of montmorillonite as a clay mineral. In addition to
montmorillonite, chlorite, muscovite and illlite might also be present particularly in the
sample Dm 100.rc. Besides clay minerals, large amounts of quartz and varying amounts of
feldspars and calcite have been determined in all the clay samples. The amount of feldspars
and calcite seem to be higher in samples Dm100.rc and Dm101.rc than in Dm98.rc and
Dm99.rc.
Sample Dm128.rc which is called as white clay is determined to be mainly composed of
mineral calcite and some quartz. This sample could be a tempering material used to enrich the
raw clays by calcite.
33
0 10 20 30 40 50
0
2000
4000
100001050011000
d=2.
85
d=3.
53
d =
4.97
d =
7.08
d=9.
90
d=1.
82
d=1.
87d=
1.91
d=1.
98
d=2.
09d=2.
12
d=2.
23d=
2.28
d=2.
46
d=2.
56
d=3.
04
d=3.1
9
d= 3
.34
d=4.
25d=
4.48
d=14
.45
C: Calcite, F: Feldspar, M: Montmorillonite, Q:QuartzThe d values are given in angstrom (1 angstrom = 1 x 10⁻¹⁰ m).
F
F
Q
Q
Q
Q
CC C C
C
MMDm101.rc
Dm100.rc
Dm99.rc
Dm98.rc
Inte
nsity
2θ
Figure 4.1: PXRD patterns of raw clays from Demirci.
34

Table 4.1: Elemental compositions of raw clays collected from the sites of Demirci. Major Elements (w %) Minor Elements (w %) Al Si Ca Fe Mg P K Ti Dm98.rc 6.06 32.54 3.97 3.56 1.02 0.08 0.88 0.44 Dm99.rc 6.72 29.66 2.19 3.98 0.95 0.07 1.14 0.49 Dm100.rc 4.78 32.29 7.18 2.95 1.08 0.09 0.93 0.33 Dm101.rc 6.94 24.95 3.07 4.20 0.85 0.06 1.03 0.50 Dm102.rc 5.00 33.12 6.01 3.28 0.96 0.10 1.02 0.37 Dm128.rc 0.79 - 33.63 1.37 0.79 0.70 - 0.10
+/- error 0.04 0.04 0.01 004 0.14 0.04 0.01 - Trace Elements (ppm) V Ni Cu Zn As Rb Sr Zr Ba La Sm Dm98.rc 108 74.8 23 33 0.1 92 133 216 552 24 6.0 Dm99.rc 112 90.6 21 56 21.9 110 121 210 256 25 6.8 Dm100.rc 84 26.2 12 62 - 61 336 175 679 27 4.0 Dm101.rc 124 71.8 31 49 11.0 115 157 179 950 23 6.9 Dm102.rc 84 65.8 24 23 15.5 79 256 183 487 20 3.8 Dm128.rc 9 - - - - 12 518 54 190 16 4.5
+/- error 9 11.9 3 7 8.5 2 3 3 26 12 3
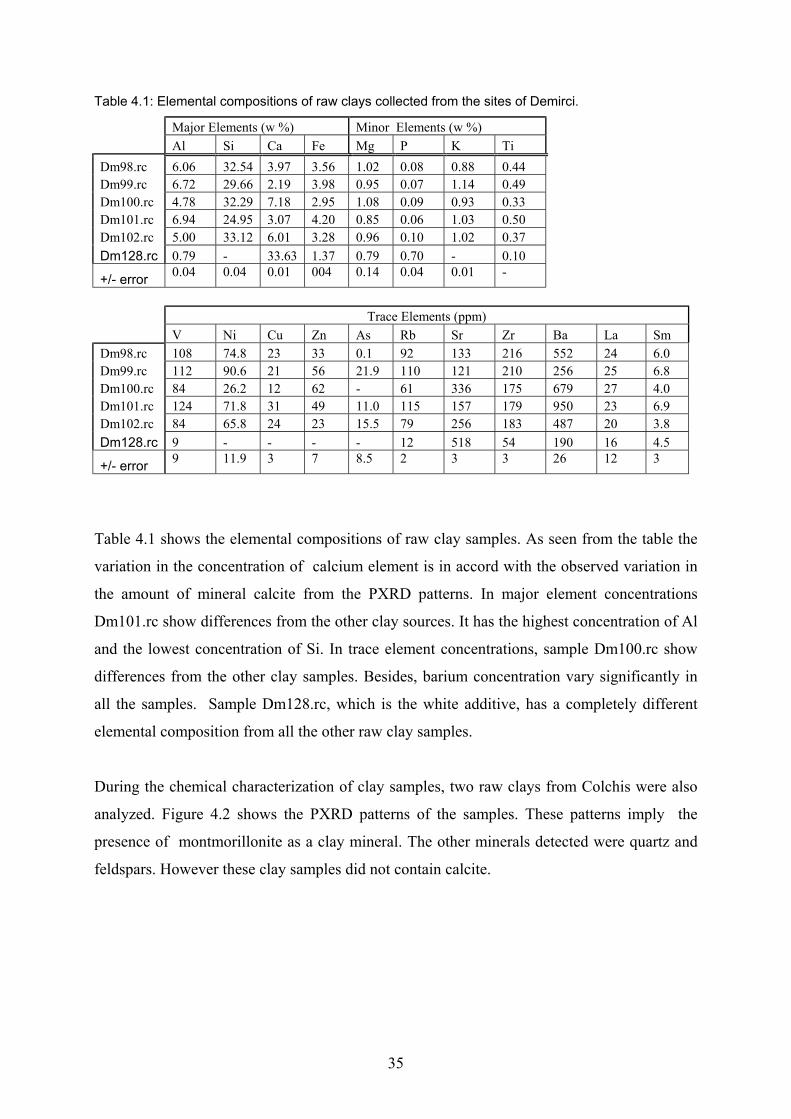
Table 4.1 shows the elemental compositions of raw clay samples. As seen from the table the
variation in the concentration of calcium element is in accord with the observed variation in
the amount of mineral calcite from the PXRD patterns. In major element concentrations
Dm101.rc show differences from the other clay sources. It has the highest concentration of Al
and the lowest concentration of Si. In trace element concentrations, sample Dm100.rc show
differences from the other clay samples. Besides, barium concentration vary significantly in
all the samples. Sample Dm128.rc, which is the white additive, has a completely different
elemental composition from all the other raw clay samples.
During the chemical characterization of clay samples, two raw clays from Colchis were also
analyzed. Figure 4.2 shows the PXRD patterns of the samples. These patterns imply the
presence of montmorillonite as a clay mineral. The other minerals detected were quartz and
feldspars. However these clay samples did not contain calcite.
35
0 10 20 30 40 50
0
1000
2000
50006000
d= 1
.82
d= 1
.98
d= 2
.13
d= 2
.17
d= 2
.28
d= 2
.46
d= 2
.53
d= 3
.35
d= 3
.19
d= 3
.25
d= 4
.27
d= 4
.47
d= 1
4.60
Q
Cc2.rc
Cc1.rc
FF
FFF
F
Q
Q
Q
Q
Q
M
M
Inte
nsity
2θ
F: Feldspars, M: Montmorillonite, Q: Quartz Figure 4.2: PXRD patterns of raw clay samples collected from the sites of Colchis. Another concern about the raw materials used in manufacture of the amphorae was the
identification of the tempers, such as the black sand and the red inclusion. The composition of
the black sand collected on the site of workshop in Demirci was investigated as well as the red
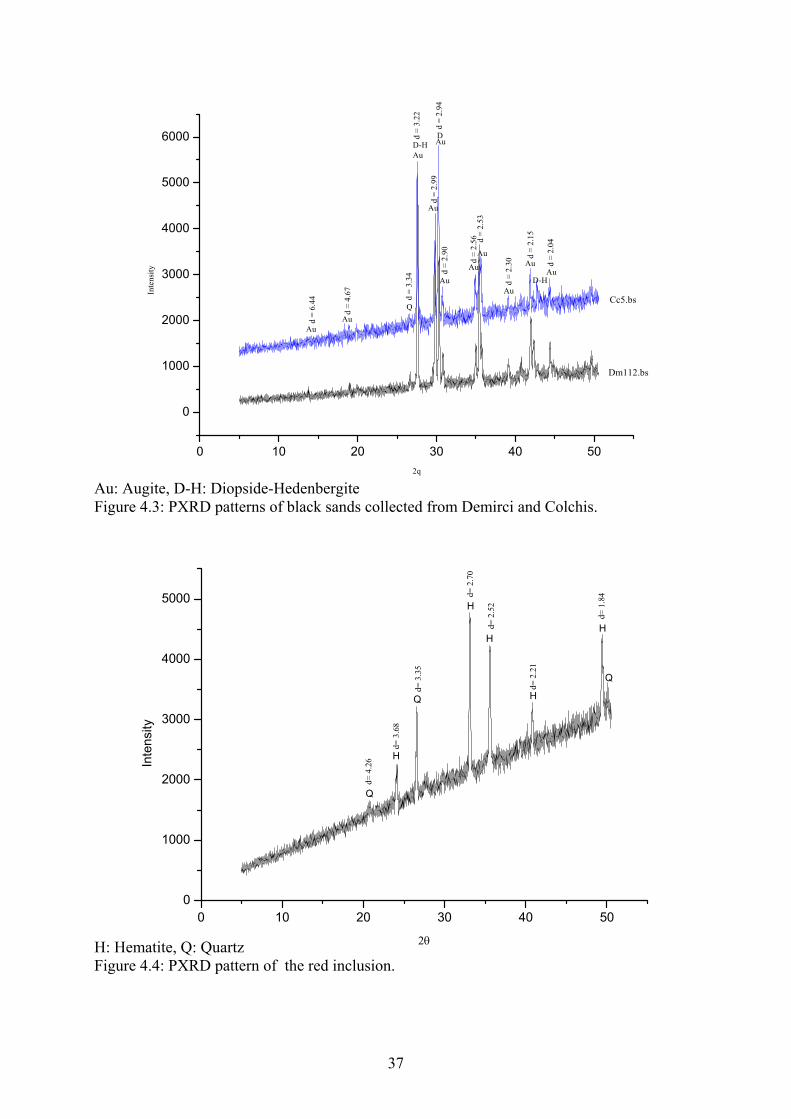
inclusions taken from amphorae and tiles. Figures 4.3 and 4.4 shows the PXRD patterns of
the black sand and the red inclusion. As it is clear from the patterns shown in the figures, the
black sand consists of pyroxene type of minerals and the red inclusion consists of hematite
and quartz.
The black sand was also found in some regions of Colchis and it was previously satated to be
determined in Colchian amphorae [22]. The analysis of the black sand sample collected on the
sites of Colchis showed that the composition of the Colchian black sand was similar to black
sand from Demirci region with little differences observed in the PXRD patterns. The
differences are due to the varied stochiometry of the elements in pyroxene type minerals at
two different regions [40].
36

0 10 20 30 40 50
0
1000
2000
3000
4000
5000
6000
d =
2.04
d =
2.15
d =
2.30
d =
2.53
d =
2.56
d =
2.90
d =
2.94
d =
2.99
d =
3.22
d =
3.34
d =
4.67
d =
6.44
AuAu
AuAu
D-HAuAu
DAuD-H
Au
AuQ
Au
Au
Cc5.bs
Dm112.bs
Inte
nsity
2q
Au: Augite, D-H: Diopside-Hedenbergite Figure 4.3: PXRD patterns of black sands collected from Demirci and Colchis. H: Hematite, Q: Quartz
0 10 20 30 40 500
1000
2000
3000
4000
5000
d= 2
.21
d= 1
.84
d= 2
.52
d= 2
.70
d= 3
.35
d= 3
.68
d= 4
.26
H
Q
HH
H
Q
Q
H
Inte
nsity
2θ
Figure 4.4: PXRD pattern of the red inclusion.
37

4.2 Chemical Characterization of Sinopean Amphorae
As previously stated, the variations in the color of Sinopean amphorae are associated with
different periods of production and shapes. The earliest types of amphorae appear pinkish
(Munsell color: 5YR 7/4 – 7.5YR 8/2). These are classified as pink clay amphorae. They are
also characterized by their bilayered structure. The boundaries of the layers are obvious and
can be detected by naked eye. The inner parts of pink clay amphorae usually have violet hue
and the outside color varies from white (5Y 8/2) to very pale brown (10YR 7.5/3). Black sand
particles in large amounts were observed on both surfaces of pink clay amphorae.
The red clay amphorae historically come after the pink clay amphorae, and their color can be
described as red having yellowish hue in some cases. (2.5YR 5.5 /8, 6.5YR 6/8). Generally
they have soft surfaces in comparison to white clay amphorae, and this can be sensed by
rubbing a finger. The black sand and red inclusion is observed in the red clay amphorae, the
black sand mainly present on the necks and the handles.
The white clay amphorae appear to be white (5Y 8/2, 2.5Y 8/2), pale yellow (5Y 8/3.5, 5Y
7/3.5, 5Y 7.5/3, 5Y 8/3), reddish yellow (5YR 7/6) and very pale brown (10YR 8/4) in color
and they also contain red inclusions and black sand particles. The density pattern of the black
sand particles, as seen by naked eye, are similar to those of the red clay amphorae. In rare
cases two distinct layers are observed for the white clay amphorae, where the inside layer
often turns to red hues.
White clay amphorae have harder surfaces than the red clay ones, probably owing to higher
baking temperatures. This observation was enhanced during grounding the samples: The
white clay samples were more difficult to ground than the red clay ones. It was also
determined that the red clay amphorae could easily be grounded to “very fine powder” owing
to its softness.
In examining the mineralogical composition of Sinopen amphore, the main concern was to
find out the possible sources of the colors observed for red and white clay samples. A few
38

samples of pink clay amphorae were also investigated for their mineral contents to see if the
mineralogical composition changes significantly within different types of Sinopean
production.
Figure 4.5 shows the PXRD patterns of pink clay, red clay and white clay amphorae. It can
be asserted from the patterns that the Sinopean amphorae contain in general the minerals
quartz, feldspars, calcite, hematite and pyroxenes. This mineral composition is very similar to
the results of a previous study on the Sinopean amphorae [13]. The quantities of minerals
hematite and pyroxenes may be distinctive within different colors and types of amphorae.
In PXRD patterns of the red clay amphorae, the peaks owing to calcite are absent, and the
peaks owing to pyroxene type of minerals are observed to be weaker than the white clay
amphorae.
The most obvious difference in the PXRD patterns of the red clay and white clay amphorae is
in the intensities of peaks originating from pyroxene type of minerals. The patterns in Figure
4.5 suggest that the white clay amphorae contain larger amount of pyroxenes. On the other
hand, the hematite peaks are more prominent for the red clay amphorae. Calcite seem to be
present in some white clay amphorae, but the amounts are not so significant and could be
attributed to contamination in the burial environment.
The mineralogical compositions of pink clay amphorae are not very different from those of
red clay and white clay amphorae. As Figure 4.5 shows, the outer and inner layers of these
types of amphorae have also similar mineralogical compositions.
The mineral composition of amphorae exhibits significant differences, when compared with
the mineral composition of raw clay samples. At first glance it is determined that the peaks
owing to clay minerals disappears in amphorae samples, and the amount of
39

40
0 10 20 30 40 50
0
2000
4000
6000
8000
10000
12000
14000
16000
d =
1.82
d =
1.98
d =
2.02d
= 2.
13
d =
2.23d =
2.28
d =
2.46d
= 2.
51d
= 2.
55
d =
2.69
d =
2.90
d =
2.95
d =
2.99
d =
3.20
d =
3.66
d =
3.78
d =
4.05
d =
3.34
d =
4.26
d =
4.45
d =
4.69
d =
6.45
Q
C: Calcite, F: Feldspars, H: Hematite, P: Pyroxenes, Q: Quartz Figure 4.5: PXRD patterns of pink clay, red clay and white clay amphorae from Demirci-Sinop.
Dm60.a.w (type CI)Dm58.a.w (type C)Dm57.a.w (type B)Dm24.a.w (type B)Dm17.a.w (type CI)Dm2.a.w (type CI)Dm70.a.r (carrot)Dm69.a.r (carrot)Dm12.a.r (carrot)Dm8.a.r (type I)Dm7.a.r (carrot)Dm56.a.pDm56.a.pk
Dm52.a.pDm52.a.pk
PFF
PFHPPP QH
FF CFQ
CQ
H PPQQ
PQ
PPPP
PF
Inte
nsity
2θ

quartz and calcite is greatly reduced. On the other hand raw clays do not contain the
minerals hematite and pyroxenes, whereas the amphorae contain.
It is known that clay minerals structurally collapse at high temperatures, and may give
rise to the formation of new minerals as a result of chemical reactions [40].
Montmorillonite shows structural changes with increase in temperature, and starts to lose
its crystallinity above 700 oC [40,41]. After this temperature irreversible changes occur in
the structure of the clay mineral. Between 950 oC – 1000 oC the mineral is involved in
chemical reactions.
The source of hematite and the pyroxenes observed in amphorae samples could be the
black sand and the red inclusion. However hematite, which is more prominent for the red
clay amphorae, and pyroxenes, which are more prominent for the white clay amphorae,
may also form during the firing process in addition to those coming from tempering
material.
Iron bearing compounds are known to be the most common coloring agents in ceramics,
and they may exhibit different coloring affects with different coordinations as well as
different mineral phases[2, 15, 40, 42, 43, 45]. The mineral hematite which is the α-
Fe2O3 is usually the origin of the red color observed in ceramics and glazes. Hematite is
observed to appear around 850 oC particularly in Ca-poor clay [44]. Oxidizing
atmosphere is also required to form hematite minerals. On the other hand, stronger
heating at higher temperatures may favor the formation of other iron containing minerals.
Iron can be included in the structures of pyroxene minerals forming particularly in Ca
rich clays that are fired at temperatures typical of 950 oC. Besides, approximately above
1000 oC calcium ferrosilicates may form, by the reaction of lime with iron, which will
lead to the suppressing of red color, and contribute to a yellow or olive-greenish tone
[19].
Calcite (CaCO3), which was determined to be present in large quantities in the raw clay
sample Dm128.rc could be an additive used to modify the color of the ceramics.
Although calcite by itself does not contribute to the color of the ceramic or decrease the
41

red hue of the pastes, the reactions occurring at high temperatures between the clay
minerals and the calcite may be responsible for the formation of pale yellow or white
colors. CaCO3 (calcite) starts to decompose at 800 o C [19, 44, 46] and turn into CaO
(lime). This process is known as calcination.
CaCO3 CaO + CO2(g)
The minerals gehlenite, wollastonite, anorthitic plagioclases, and pyroxenes were cited to
be formed by the high temperature reactions of calcium rich clays. Particularly formation
of pyroxenes at temperatures around 900- 950 oC, can be responsible for the creamy color
obtained for the ceramics [2]. Thus, it appears meaningful to obtain higher amount of
pyroxenes in white clay amphorae, which are thought to be baked at higher temperatures
than the red clay ones.
The following scenario could be proposed to establish a scheme of the “pottery firing” by
the Sinopean potters:
According to this scenario the red clay amphorae were fired at temperatures above 800 oC
that lead to decomposition of calcite. By the time formation of iron oxides are started
around 850 oC, which give the red color to the ceramic. However starvation of oxygen
might be prominent inside the kiln if firing process continues for longer times, since the
kiln is hermetically closed. Additionally the use of wood as a fuel source can create
carbon monoxide, which is a very unstable gas that steals oxygen from metal oxides in
the ceramic surfaces and bodies [43].
At this point the potter may gain control in the use of reduction or may increase the kiln
temperature to achieve chemical reactions. The color may change into grayish, whitish,
yellowish or creamy appearance due to the reduction of iron oxides or formation of new
minerals such as pyroxenes, and calcium ferrosilicates [2,19,43].
Depending on this scenario, the average baking temperature of the red clay amphorae
may be around 800 – 850 oC, but white clay amphorae should be baked at higher
42

temperatures and maybe longer times than the red clay ones. The firing temperature of
the white clay amphorae could be around 950 oC, at which the pyroxene type of minerals
can be formed.
When the elemental concentrations of the amphorae and the raw clays are examined
together in Table 4.2 it appears that the elemental compositions are similar within the
amphora samples and the raw clays except for the elements Ca, Sr and Ba. Strontium and
barium were determined to be enriched in both red clay and white clay amphorae,
whereas the quantity of calcium appears to be higher in white clay amphorae than the red
clay ones and even the raw clay samples. This divergence may be owing to addition of
calcite to the clay in manufacturing the white clay amphorae. Another possibility is the
use of different clays collected from different beds for red clay and white clay amphorae,
which contain different amount of calcium. Higher calcium content found in white clay
amphorae seems to be reasonable since calcium rich clays have higher reactivity to form
pyroxene types of minerals.
The silicon contents of the amphorae are lower in amount compared to those of raw clays
in Table 4.2. This is in good agreement with the observation that the amphora samples
contain lower amount of mineral quartz, than the raw clay samples.
43

Al Si Ca Fe Mg P K Ti V Ni Cu Zn As Rb Sr Zr Ba La SmDm98.rc 6,06 32,54 3,97 3,56 1,02 0,08 0,88 0,44 108 74,8 23 33 0,1 92 133 216 552 24 6,0Dm99.rc 6,72 29,66 2,19 3,98 0,95 0,07 1,14 0,49 112 90,6 21 56 21,9 110 121 210 256 25 6,8Dm100.rc 4,78 32,29 7,18 2,95 1,08 0,09 0,93 0,33 84 26,2 12 62 - 61 336 175 679 27 4,0Dm101.rc 6,94 24,95 3,07 4,2 0,85 0,06 1,03 0,5 124 71,8 31 49 11,0 115 157 179 950 23 6,9Dm102.rc 5 33,12 6,01 3,28 0,96 0,1 1,02 0,37 84 65,8 24 23 15,5 79 256 183 487 21 3,8Dm7.a.r 6,82 23,19 6,49 3,85 1,39 0,11 1,3 0,43 98 88,8 36 93 - 87 344 163 3870 27 5,2Dm8.a.r 6,37 26,77 4,78 3,757 1,01 0,08 1,52 0,43 94 71,6 35 56 - 105 277 167 16014 26 5,5Dm12.a.r 6,68 28,1 2,69 4,013 0,9 0,06 1,73 0,45 114 90,0 41 177 19,8 120 216 184 6019 26 5,6Dm69.a.r 6,11 29,8 5,53 3,63 1,22 0,07 1,33 0,39 91 69,0 30 180 10,4 97 314 176 3074 22 4,7Dm70.a.r 6,49 25,01 5,7 3,635 1,18 0,12 1,18 0,4 101 62,5 37 50 7,8 102 283 165 7192 25 5,0Dm2.a.w 6,22 27,81 7,34 3,467 1,3 0,13 0,95 0,4 102 64,0 36 53 - 97 497 158 34206 26 4,2Dm17.a.w 6,41 24,25 8,62 3,34 1,57 0,08 1,1 0,39 100 100,7 24 144 - 84 442 149 - 17 4,9Dm57.a.w 5,68 26,7 7,68 3,417 1,16 0,1 1,09 0,37 102 77,9 17 202 - 81 358 151 4435 27 4,4Dm60.a.w 6,33 25,84 7,61 3,577 1,44 0,11 1,01 0,39 105 82,3 30 99 - 88 485 158 15701 28 4,1Dm72.a.w 5,71 23,18 8,21 3,425 1,49 0,12 1,11 0,39 92 65,5 29 96 14,0 84 523 151 15948 24 5,2
44
Major Elements (w %) Minor Elements (w %) Trace Elements (ppm)Table 4.2: Elemental compasitions of white clay and red clay amphorae from Demirci compared to those of raw clays.

4.3 Chemical Characterization of Tiles that are Collected From the
Sites of Demirci-Sinop
Besides the amphorae, some red clay and white clay tiles from Demirci were also
investigated in terms of their mineral compositions. Figure 4.6 shows the PXRD patterns
of tiles of both colors.
Red clay tiles contain quartz, feldspars and significant amounts of calcite while lacking
pyroxene types of minerals and hematite. On the other hand quartz, feldspars and large
amounts of pyroxenes characterize white clay tiles. There is also indication of presence of
small amounts of hematite in the white clay tiles.
According to above observations, we can say that the white clay tiles were used inside the
kiln and they were fired many times. Sometimes they were subject to high firing
temperatures, particularly in the firing of white clay amphorae. As a result the calcite in
the white clay tiles was completely decomposed upon repeated firing cycles and
undergone chemical reactions with the ceramic neighborhood to produce pyroxenes,
which led to the appearance of whitish and greenish colors for the tile.
Red clay tiles were used outside the kilns. The presence of calcite indicates that the firing
temperatures of red clay tiles are below 800 oC. Although mineral hematite is not
observed in red clay tiles, there is the expectancy of iron oxides probably in amorphous
forms, which could be the reason of red color.
45
46
0 10 20 30 40 50
0
1000
2000
3000
4000
5000
6000
7000
8000
d =
1.81
d =
1.87
d =
1.91
d =
2.02
d =
2.13
d =
2.28
d =
2.46
d =
2.51
d =
2.55
d =
2.70
d =
2.90d
= 2.
95d
= 2.
99d
= 3.
04
d =
3.20
d =
3.34
d =
3.77
d =
4.04
d =
4.26
Figure 4.6: PXRD patterns of red clay and white clay tiles from Demirci-Sinop.C: Calcite, F: Feldspars, H: Hematite, P: Pyroxenes, Q: Quartz
PQ
CCCC
PQ
Q
CQQ
PH
P
H
P
P
PF
F
Q
FQ F
Dm20.t.w
Dm3.t.w
Dm76.t.r
Dm75.t.r
Dm14.t.r
Inte
nsity
2θ

4.4 Firing Tests
The raw clay Dm100.rc and the mixture of Dm100.rc and Dm128.rc in equal weights
were baked at different firing temperatures in an electrically heated furnace to follow the
change of color by the firing temperature. The furnace was not hermetically closed, that
is, it was open to passage of air, so there was no control of the firing atmosphere inside
the kiln.
Figure 4.7 shows the colors of the clays that were obtained at the end of baking processes
at temperatures 850 oC, 950 oC and 1050 oC. As seen from the figure, red color is
obtained for the raw clay Dm100.rc that is heated at 850 oC for 5 hours, and it did not
change so much when it was heated at 950 oC or even at 1050 oC. However, the color of
the mixture of Dm100.rc and Dm128.rc changed at different firing temperatures, which
was red at 850 oC, but turned into dark green at 1050 oC.
Although the conditions were very different for the Sinopean pottery production, where
the kilns were hermetically closed, and probably the potter had gained the control of
redox environment inside the kiln during the baking process, the firing tests can give an
idea on the factors that can affect the change of color at high firing temperatures. As the
firing tests showed, not only the firing temperature but also the composition of the raw
material determines the final color of the ceramic. It is evident from Figure 4.7 that colors
other than red can form particularly in calcium-rich clays fired at temperatures above
1000 oC, since Dm128.rc contain high amounts of calcium that comes from the mineral
calcite.
47

Dm100.rc – 850 oC Dm100.rc + Dm128.rc – 950 oC
Dm100.rc – 950 oC Dm100.rc + Dm128.rc – 950 oC
Dm100.rc – 1050 oC Dm100.rc + Dm128.rc – 1050 oC Figure 4.7: The pictures of the clay samples, which were baked at 850 oC, 950 oC and
1050 oC.
48
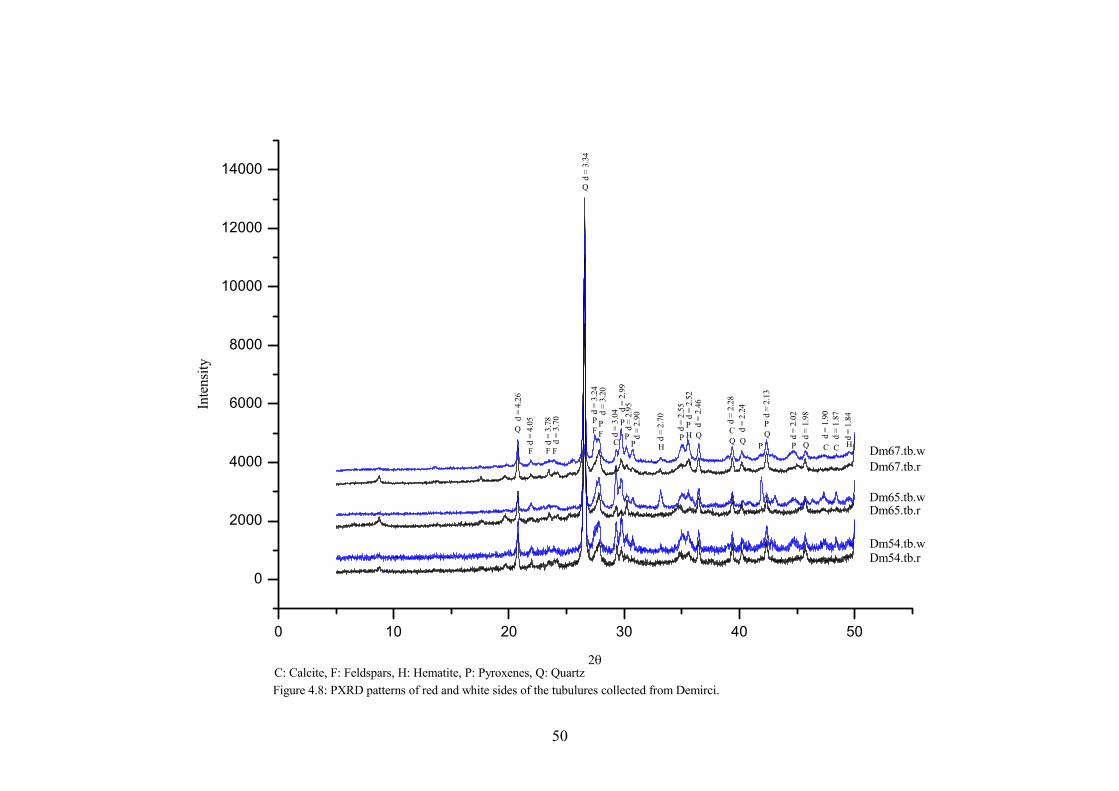
4.5 Chemical Characterization of the Tubulures
The tubulure samples are the most challenging pieces to characterize owing to their
manufacturing and chemical compositions. They are used in covering the roofs of the
kilns, and they contain both the white and the red sides in the same fragment.
Figure 4.8 shows the PXRD patterns of white and red sides of the tubulures. The
tubulures contain muscovite-illite type clay minerals, quartz, feldspars, pyroxenes and
hematite. Augite, which is the calcium-iron-magnesium silicate, is the most commonly
observed pyroxene mineral.
The difficulty in the characterization of chemical compositions of the tubulures arises
from the fact that the amount of pyroxenes, calcite and feldspars were higher in the white
sides than the red sides. Besides the elemental compositions in Table 4.3 shows that the
element calcium is also higher in the white sides compared to red sides.
Table 4.3: Major and minor element compositions of tubulures.
Major Elements (w %) Minor Elements (w %) Al Si Ca Fe Mg P K Ti Dm63.tb.r 6.10 24.83 5.98 3.59 1.42 0.13 1.27 0.39 Dm63.tb.w 5.72 26.12 8.28 3.37 1.26 0.11 1.09 0.36 Dm65.tb.r 6.20 23.74 4.46 3.99 1.39 0.15 0.82 0.43 Dm65.tb.w 4.64 24.08 11.72 3.04 1.27 0.13 0.68 0.33 Dm66.tb.r 5.90 24.33 4.70 3.82 1.33 0.12 1.25 0.41 Dm66.tb.w 4.77 24.92 11.25 3.14 1.43 0.13 0.98 0.34
The raw material used in the production of these samples can not be different in the red
and white sides. However it mustn’t be forgotten that one side of the tubulures were
facing the inside of the kiln and the other sides were facing outside. Due to a temperature
gradient and difference in the redox environments, the mineral specimens of the white
and red side can be different.
49

50
0 10 20 30 40 50
0
2000
4000
6000
8000
10000
12000
14000
d =
1.84
d =
1.87
d =
1.90
d =
1.98
d =
2.02
d =
2.24
d =
2.28
d =
2.13
d =
2.46
d =
2.52
d =
2.55
d =
2.70
d =
2.90
d =
2.95d
= 2.
99d
= 3.
04d =
3.20
d =
3.24
d =
3.34
d =
3.70
d =
3.78
d =
4.05d
= 4.
26
Q
Figure 4.8: PXRD patterns of red and white sides of the tubulures collected from Demirci.C: Calcite, F: Feldspars, H: Hematite, P: Pyroxenes, Q: Quartz
PF
FF Dm67.tb.wDm67.tb.r
Dm65.tb.wDm65.tb.r
Dm54.tb.wDm54.tb.r
PP
PF
P
PP
PH
PQ
PQCQC H HC CF
Q
Inte
nsity
2θ

It is thought that the white sides were facing the inside of the kilns and subject to higher
firing temperatures. In this respect, the reason of higher calcium content of the white
sides compared to the red sides could be the presence of pyroxene minerals determined in
larger amounts in the white sides. Pyroxene minerals, which are the high temperature
firing products, can more firmly held the calcium ions in their structures in the burial
environment then the low temperature firing products of the red sides. As a result the
element calcium can reside in the crystal structure of pyroxene minerals in the white
sides, without dissolving in groundwater during the burial environment.
4.6 Chemical Characterization of the White Clay Amphorae That
were Found in Antioch and Ibn Hani
Figure 4.9 shows the PXRD patterns of white clay amphorae from Antioch and Ibn Hani
together with those of type B and type C1 white clay amphorae from Demirci region. The
figure demonstrates that the samples of white clay amphorae from Sinope, and the ones
from Antioch and Ibn Hani have very similar mineral compositions. The samples also
display the similarity for the quantities of elements as given in Table 4.4. The PXRD
patterns together with the XRF data imply that the samples from Antioch and Ibn Hani
are from the same production and come from Sinope, as proposed by the archeological
expertise.
Table 4.4: Elemetal compositions of white clay amphorae from Demirci, Ibn Hani and Antioch.
Major Elements (w %) Minor Elements (w %) Al Si Ca Fe Mg P K Ti Dm17.a.w 6.41 24.25 8.62 3.34 1.57 0.08 1.10 0.39 Dm57.a.w 5.68 26.70 7.68 3.42 1.16 0.10 1.09 0.37 Dm59.a.w 6.38 23.75 7.93 3.46 1.44 0.27 - 0.38 Dm60.a.w 6.33 25.84 7.61 3.58 1.44 0.11 1.01 0.39 Dm72.a.w 5.71 23.18 8.21 3.43 1.49 0.12 1.11 0.39 An1.a.w 6.22 23.87 8.09 3.51 1.34 0.16 0.56 0.40 Ih1.a.w 6.04 23.75 7.92 3.31 1.68 0.20 0.44 0.37 Ih2.a.w 5.96 24.73 8.09 3.51 1.46 0.17 0.75 0.39 Ih3.a.w 6.12 23.35 7.77 3.58 1.33 0.16 0.87 0.39
51

52
0 10 20 30 40 50
0
1000
2000
3000
4000
5000
6000
7000
8000
Figure 4.9: PXRD patterns of white clay amphorae from Antioch and Ibn Hani compared to those of Demirci.
Ih3.a.w
Ih2.a.w
Ih1.a.w
An1.a.w
Dm60.a.w (type CI)
Dm57.a.w (type B)
Inte
nsity
2θ
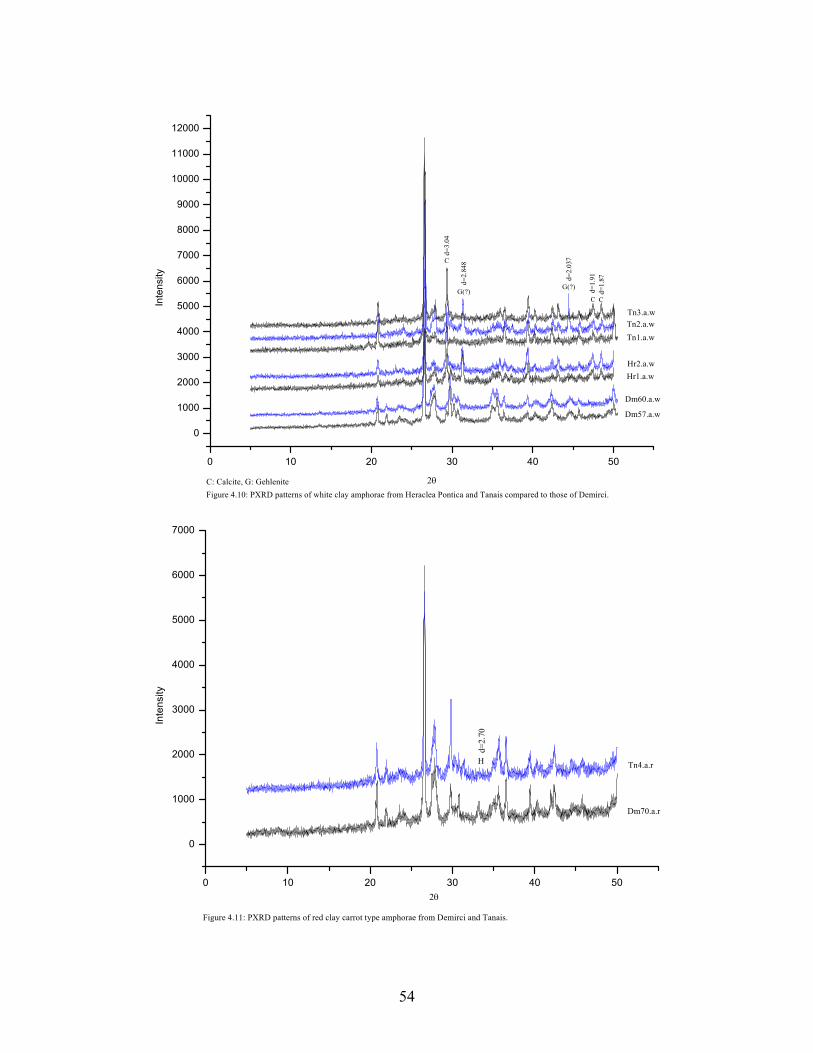
4.7 Chemical Characterization of the Amphorae That were Found in
Heraclea Pontica and Tanais
Figure 4.10 shows the PXRD patterns of white clay amphorae from Heraclea Pontica and
Tanais. For comparison PXRD patterns of two white clay amphorae from Demirci are
also shown in the figure.
As the patterns show the mineral compositions of white clay amphorae from Heraclea
Pontica and Tanais significantly differes from those of Demirci. The differences arise
mainly due to the presence of high amounts of calcite, and the absence of pyroxenes in
the amphore of Heraclea Pontica and Tanais. In addition samples Hr1.a.w, Hr2.a.w and
Tn2.a.w have peaks at d=2.848 Å and d=2.037 Å in their PXRD patterns which could be
attributed to mineral gehlenite. These peaks are absent in the PXRD patterns of the
samples from Demirci. These observations imply that the production practices in
manufacture of the amphorae from Heraclea Pontica and Tanais were different from that
of Sinopean amphorae.
The samples of Heraclea Pontica and sample Tn2.a.w of Tanais display similarities.
However the other two white clay amphorae from Tanais do not show this resemblance.
The red clay amphora of carrot type from Tanais is compared with that from Demirci in
Figure 4.10. If the hematite peak is overlooked, the patterns look similar.
53
0 10 20 30 40 50
0
1000
2000
3000
4000
5000
6000
7000
8000
9000
10000
11000
12000
d=1.
87d=
1.91
d=3.
04
G(?)G(?)
Figure 4.10: PXRD patterns of white clay amphorae from Heraclea Pontica and Tanais compared to those of Demirci.C: Calcite, G: Gehlenite
Tn3.a.wTn2.a.wTn1.a.w
Hr2.a.wHr1.a.w
Dm60.a.w
Dm57.a.w
d=2.
037
d=2.
848
C C
C
Inte
nsity
2θ
7000
0 10 20 30 40 50
0
1000
2000
3000
4000
5000
6000
d=2.
70
Figure 4.11: PXRD patterns of red clay carrot type amphorae from Demirci and Tanais.
H Tn4.a.r
Dm70.a.r
Inte
nsity
2θ
54

4.8 Chemical Characterization of Colchian Amphorae from
Gorgippia and Pseudo-Colchian Amphorae.
Figure 4.12 shows the PXRD patterns of amphorae from Gorgippia, which are believed
to be Colchian production. They display very different PXRD patterns in comparison to
amphorae from other production centers. There are also some differences from the
brown-clay Colchian amphorae which have been analyzed in other studies in terms of
mineral compositions [22]. The most significant difference is the absence of epidote
peaks in samples from Gorgippia, which was observed in all Colchian brown-clay
samples. In addition the patterns of four samples of Gorgippia do not even match each
others. The peaks appearing at d = 2.463 Å for Gp1.a and d =3.224 Å for Gp3.a are
peculiar to those samples.
Some Pseudo-Colchian samples were also analysed throughout this work. These samples
were taken from Tanais, Sinope and Colchis. Figure 4.12 shows the PXRD patterns of
Pseudo-Colchian amphorae from Sinop and Tanais.
Particularly the Pseudo-Colchian amphora from Tanais has very dfifferent PXRD pattern,
where there exist a very intense peak at d = 3.229 Å. Besides, the samples Dm78.psc and
Dm 79.psc resemble some similarities with the sample Gp2.a from Gorgippia.
55

56
0 10 20 30 40 50
02000400060008000
d=1.
98
d=2.
13
d=2.
24
d=2.
28
d=2.
46
Q
d=3.
34
d=4.
26
Q
Inte
nsity
2θ
Gp1.a.c
0 10 20 30 40 500
20004000
6000
8000
d=2.
24d=
2.28
d=2.
13
d=1.
98
QQQQQH
d=2.
46
H
d=2.
51
d=2.
70
d=3.
198
d=3.
27d=
3.34
d=4.
26
Q
Q
Gp2.a.c
0 10 20 30 40 50
01000200030004000
d=1.
98
QQd=
2.51 d=
2.46
d=2.
959
d=3.
225
d=4.
48 d=2.
13
d=3.
34
Q
Q
Q
d=4.
26
Gp3.a.c
0 10 20 30 40 50
01000200030004000
d=2.
13
Qd=2.
154
Q
d=1.
98
d=2.
51 d=2.
28
d=2.
46
d=2.
90
d=3.
239
d=3.
34
d=4.
26
Figure 4.12: PXRD patterns of Colchian amphorae from Gorgippia.
Gp4.a.cQ
Q

57
0 10 20 30 40 50
0
2000
4000
6000
8000
10000
d=1.
98
Q
d=2.
13
Q
d=2.
28
Q
d=2.
46
Q
d=3.
26d=
3.34
Qd=
4.26
Q
Figure 4.13: PXRD patterns of some Pseudo-Colchian amphorae.2θ
Dm78.a.psc
0 10 20 30 40 50
01000200030004000500060007000
Q
d=1.
98
d=2.
13
d=2.
28
d=2.
46
Q
d=3.
23d=
3.34
Q
d=4.
26
Q
d=4.
50Inte
nsity
Dm79.a.psc
0 10 20 30 40 500
500010000150002000025000300003500040000
d=2.
129
d=2.
657
d=3.
185
d=3.
229
Q
d=3.
34
d=4.
05d=4.
26
Q Tn5.a.psc

4.9 Provenance Studies By Means Of Multivariate Analysis
Techniques
As a complementary method to mineralogical examinations, the elemental compositions
of pottery and raw clays from different areas were compared, in the determination of the
provenances. Careful examination of the data collected on the nineteen elements was
done for the samples from different areas by looking at the concentration plots of each
element in Appendix II. Elements that represent significant variability within different
provenances were determined, and used as the variables in principal component analysis
(PCA) and cluster analysis.
The major structural elements silicon and aluminum did not differ significantly within
different areas except for the two raw clay samples from Colchis. These samples were
found to have significantly higher amounts of aluminum and lower amounts of silicon.
Besides, the silicon concentration was found to vary within the Pseudo-Colchian
amphorae that were collected at different sites.
Calcium and iron concentrations in all types of Demirci samples were found to be
significantly different from the concentrations in the samples of Heraclea Pontica,
Gorgippia, Colchis, and Pseudo-Colchian amphorae. The concentration of calcium was
found to be the highest in white clay amphorae from Heraclea Pontica. Besides, iron
concentrations in the Colchian amphorae from Gorgippia were found to be high, whereas
the concentration of calcium is very low in these samples.
The minor elements magnesium, phosphorous and potassium do not show any
meaningful variation with respect to the area except for the lower amounts of magnesium
in the Pseudo-Colchian amphorae.
Titanium had higher values in the Colchian amphorae from Gorgippia, and in the Pseudo-
Colchian amphorae compared to the pottery samples from other areas.
58
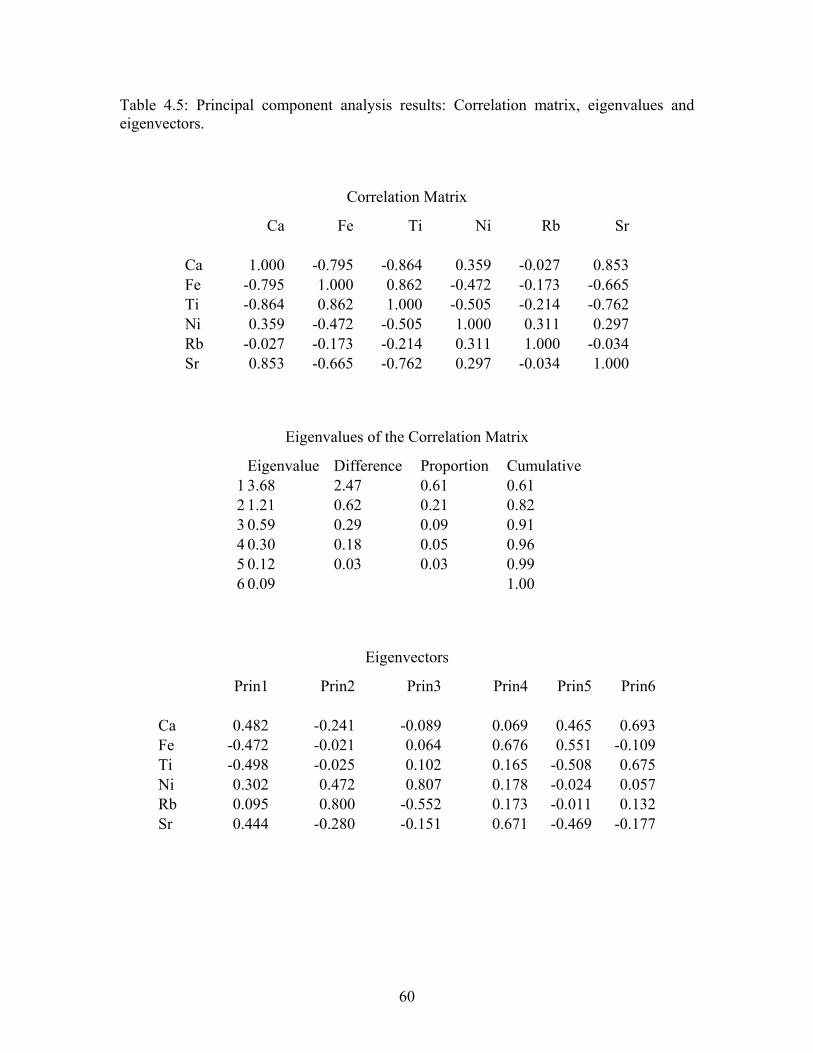
Nickel, rubidium, strontium and samarium showed the most significant variation in the
pottery samples from different areas as trace elements. In addition, the values of barium
were found to be very high for the red clay and white clay amphorae of Demirci region.
However, these values were also so much higher than the barium content of the
calibration standards used in the XRF measurements, thus they might not be
experimentally significant.
Astatine was not observed in a large number of samples, and it was not used for any
comparison purposes.
4.9.1 Principal Component Analysis
PCA has two important contributions in the interpretation of the chemical data: First the
covariance structure of elemental data can be obtained and used in determining the
correlations between particular elements. Second the principal components, which are
the new variables derived from original variables, can be used to separate the samples
according to their provenances on the two-dimensional or three-dimensional scatter plots.
The comparisons of the elemental compositions of pottery and raw clay samples showed
that the elements that best represent the variability according to different areas were
calcium, iron, titanium, nickel, rubidium, strontium and samarium. The average
experimental error in the determination of samarium was so high that, it was not chosen
as a variable in the principal component analysis. The remaining elements calcium, iron,
titanium, nickel, rubidium and strontium were chosen as the variables for the PCA.
Table 4.5 summarizes the results of principal component analysis. As the results show,
the first two principal components account for 82 % of the variation in the data. In
addition the first three principal components are enough to account for 91 % of the
variation. Therefore the scatter plot of first and second principal components, or three
dimensional scatter plot of the first three principal components are enough to separate the
59

Table 4.5: Principal component analysis results: Correlation matrix, eigenvalues and eigenvectors.
Correlation Matrix
Ca Fe Ti Ni Rb Sr Ca 1.000 -0.795 -0.864 0.359 -0.027 0.853 Fe -0.795 1.000 0.862 -0.472 -0.173 -0.665 Ti -0.864 0.862 1.000 -0.505 -0.214 -0.762 Ni 0.359 -0.472 -0.505 1.000 0.311 0.297 Rb -0.027 -0.173 -0.214 0.311 1.000 -0.034 Sr 0.853 -0.665 -0.762 0.297 -0.034 1.000
Eigenvalues of the Correlation Matrix
Eigenvalue Difference Proportion Cumulative 1 3.68 2.47 0.61 0.61 2 1.21 0.62 0.21 0.82 3 0.59 0.29 0.09 0.91 4 0.30 0.18 0.05 0.96 5 0.12 0.03 0.03 0.99 6 0.09 1.00
Eigenvectors
Prin1 Prin2 Prin3 Prin4 Prin5 Prin6 Ca 0.482 -0.241 -0.089 0.069 0.465 0.693 Fe -0.472 -0.021 0.064 0.676 0.551 -0.109 Ti -0.498 -0.025 0.102 0.165 -0.508 0.675 Ni 0.302 0.472 0.807 0.178 -0.024 0.057 Rb 0.095 0.800 -0.552 0.173 -0.011 0.132 Sr 0.444 -0.280 -0.151 0.671 -0.469 -0.177
60

samples on the basis of differences in the concentrations of the elements calcium, iron,
titanium, nickel, rubidium and strontium.
Figure 4.14 shows the scatter plot of the second principal component values versus the
first principal component values. According to the figure, the raw clays, the red clay and
the white clay amphorae from Demirci form three separate subgroups in the Demirci
provenance. Two samples from Demirci appear to be outliers. They are the white sides of
the tubulures: Dm65.tb.w and Dm 66.tb.w. The Colchian amphorae from Gorgippia, the
Pseudo-Colchian amphorae and two raw clays from Colchis are well separated from the
Demirci provenance. There is a tendency for the Pseudo-Colchian amphorae and the raw
clay samples from Colchis to lie near the Gorgippian samples, but there is no significant
overlap between these groups. Two white-clay amphorae from Heraclea Pontica lie
nearer to Demirci site, but not in the Demirci provenance. For the two amphorae samples
from Tanais, the red clay carrot type amphorae lies in the Demirci provenance near to the
red clay amphorae. The white clay amphora on the other hand is not within the Demirci
provenance, and it lies between the white clay amphorae from Demirci and Heraclea
Pontica. The amphorae from Ibn Hani lie in the Demirci provenance and near the white
clay samples.
Figure 4.15 shows the scatter plot of the first three principal component values in three
dimensions. It is seen in Figure 4.15 that the subgroups of the Demirci provenance,
which are the raw clays, red clay and the white clay amphorae come closer, nearly
merging, and form an aggregate. However, in the figure pink clay amphorae separate
from the Demirci provenance by their third principal component values. The samples
Dm65.tb.w and Dm 66.tb.w still lie as the outliers of Demirci provenance.
The association of white clay amphorae from Ibn Hani and red clay carrot type amphora
from Tanais to the Demirci provenance is clearly seen in Figure 4.15 as it is also derived
from Figure 4.14. This strengthens the hypothesis that they are Sinopean production. The
white clay amphorae from Heraclea Pontica and that of Tanais are again not related with
the Demirci provenance in Figure 4.15.
61
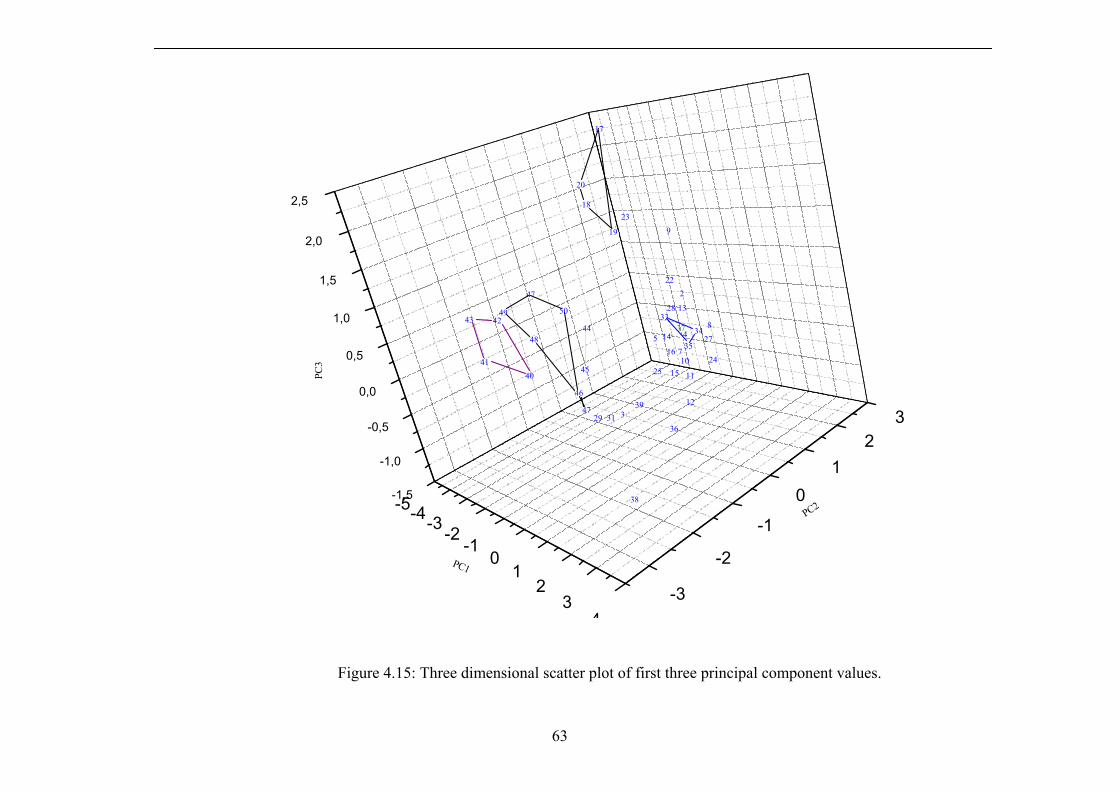
62
-5 -4 -3 -2 -1 0 1 2 3
-3
-2
-1
0
1
2
3
1
2
3
4
5
6
7
8
9
1011
12 1314
15
1617
18
19
20
21 22
23
24
25
2627
28
29
30
31
32
33
3435
36
37
38
39
40
4142
43
44
45
46
4748
49
50
51
Figure 4.14: Scatter plot of second principal componet values versus first principal component values of the pottery samples.
1 Dm98.rc 8 Dm12.a.r 15 Dm59.a.w 22 Dm75.t.r 29 Dm65.tb.w 36 Tn2.a.w 43 Gp4.a.c 50 Dm78.a.psc2 Dm99.rc 9 Dm32.a.r 16 Dm60.a.w 23 Dm76.t.r 30 Dm66.tb.r 37 Tn4.a.r 44 Cc1.rc 51 Dm79.a.psc3 Dm100.rc 10 Dm69.a.r 17 Dm52a.pk 24 Dm3.t.w 31 Dm66.tb.w 38 Hr1.a.w 45 Cc2.rc4 Dm101.rc 11 Dm70.a.r 18 Dm52.a.p 25 Dm20.t.w 32 An1.a.w 39 Hr2.a.w 46 Cc4a.psc5 Dm102.rc 12 Dm2.a.w 19 Dm56.a.pk 26 Dm63.tb.r 33 Ih1.a.w 40 Gp1.a.c 47 Tn5.a.psc6 Dm7.a.r 13 Dm17.a.w 20 Dm56.a.p 27 Dm63.tb.w 34 Ih2.a.w 41 Gp2.a.c 48 Dm48.a.psc7 Dm8.a.r 14 Dm57.a.w 21 Dm14.t.r 28 Dm65.tb.r 35 Ih3.a.w 42 Gp3.a.c 49 Dm49.a.psc
PC 2
PC 1

-5-4-3 -2 -10
12
34
-1,5
-1,0
-0,5
0,0
0,5
1,0
1,5
2,0
2,5
-3
-2
-1
01
23
414
16 7
28
5
10
49
48
50
47
4443 42
4140
45
46
35
343733
24
278
11
13
222
1525
4729 31 3
39
919
2318
20
12
17
36
38
PC2
PC3
PC1
Figure 4.15: Three dimensional scatter plot of first three principal component values.
63

Information derived from Figure 4.15 for the Colchian amphorae from Gorgippia, the
Pseudo-Colchian amphorae and the two raw clays from Colchis are very similar to those
derived from Figure 4.14: They are distinctly different from Sinopean production and
much closer to each other than all the other provenances.
To better understand the results of PCA, the loadings of the elements, which are the
eigenvectors given in Table 4.5 should be closely examined. In Table 4.5, it is seen that
the contribution of elements Ca, Ni, Rb, Sr to first principal components are positive
whereas the contribution of Fe and Ti are negative. The loadings show that Ca and Sr,
and Fe and Ti are correlated with each other. In addition the negative loadings of Fe and
Ti indicates that their concentration increase in the samples as the Ca and Sr
concentrations decrease, and vice versa.
The first principal component reflects the variation of the amount of minor elements Ca
and Fe in the samples, which might be owing to the variation in certain mineral phases.
Ca and Sr may substitute each others in calcite and feldspars. On the other hand Fe and Ti
may substitute each others in minerals like feldspars, hematite, ilmenite, rutile and
anatase. [40]
In the second principal component the elements Ca, Fe, Ti and Sr have all negative
loadings whereas the contributions of Fe and Ti are very little. Ni and Rb have positive
and high loadings, and significant contributions to the second principal component
values.
In the third principal component, no particular association with the loadings of the
elements is detected, where only providence is that it reflects the negative covariance
structure of the elements Ni and Rb.
Association of particular elements with certain mineral phases could be a reason of
differentiation with respect to elemental compositions within the pottery samples.
Besides, alteration of the source material by the geological circumstances and the
64
addition of temper; the production practices of the pottery manufacturers, and the
alteration of the original compositions of pottery by the burial environment could be the
other factors that lead to the differentiation.
In considering the alteration of the source material by the geological environment, the
trace elements which occur in the range of 1 – 1000 ppm are thought to be accidental
inclusions that come with the impurities or as a result of substitutions. The substitutions
take place in the clay minerals, and in feldspars, calcite and iron oxides.
Elements such as Ba, Ti, Fe, Mg , Sr and more rarely Mn might be present in limited
amounts in feldspars as result of substitutions. In some cases feldspar may be barium
rich, where Ba is mostly considered to substitute for K. Substitutions in calcite
commonly include Mg and Sr. Besides, titanium, ferrous and ferric iron may be
associated with each other in minerals such as hematite, ilmentite, rutile and anatase.
Another way of alteration of the raw material can be through addition of temper to
improve the plasticity of the clay and to modify the physical appearance of pottery. Sand,
limestone, marl and straw added to clays as tempering material may lead to the
enrichment or dilution of particular elemental concentrations. Limestone or marls added
to clays contribute to the concentrations of alkaline earth metals such as Ca, Sr and Ba
whereas diluting the concentrations of other elements. Addition of felsic rocks as temper
may contribute to the alkali metals (Na, K, Rb, Cs, and Li) and high-field strength
elements (eg. Hf, Nb, Ta, U, Th). The elements like Fe, Co, Ni, Cr and Sr can be
associated with the addition of mafic rock materials [47].
The composition of the pottery may also change with respect to the period of production
in a particular region. Such compositional change may arise because of the change in the
source elemental compositions in successive periods by the change of climate or
geological environment [3, 47] or due to the change in the production behaviors of
pottery producers[19].
65

The burial environments should also be considered when comparing the chemical
composition of the pottery. It should be kept in mind that the geochemical data for once-
buried samples might be different from the primary compositions. Variable solubility of
particular minerals and ions at differing environmental conditions as a result of differing
burial sites may result in compositional differences for the samples originated from the
same provenance. It is given as an acknowledgement that the confidence is greatest for
elements with moderate ionic potentials (= moderate ionic charge/ionic radius, e.g. Ti, Zr,
Hf, Nb, Ta, Y and REE) in comparing the geochemical data. The confidence diminishes
for those with extremely high (e.g. P, S and B) and low ionic potentials (e.g. Li, Rb, Cs,
sr, Ba, Mo, and Pb) due to their variable solubility in groundwater [47].
4.9.2 Cluster Analysis
The elements that were chosen as the variables for the PCA, were also used as variables
in cluster analysis. The purpose of cluster analysis was check for the results obtained
from PCA, and to make the provenance classification clearer. Figure 4.16 shows the
dendogram obtained from the results of cluster analysis based on average-linkage
method. In addition Table 4.6 lists the members of clusters at twelve, nine, six and two
cluster solutions, which could make it easier to follow the dendogram.
The samples Dm65.tb.w and Dm66.tb.w, are recognized as outliers according to the
results of cluster analysis, confirming the results of PCA. Besides, Colchian amphorae
from Gorgippia, the raw clays from Colchis, and the Pseudo-Colchian amphorae form a
distinct group and separate from other clusters. The separation is obvious for six, nine
and twelve cluster solutions in Table 4.6. This means that these samples have no
particular relationships with the samples from Sinop, Heraclea Pontica , Tanais and Ibn
Hani. However, it is not clear if the Colchian amphorae from Gorgippia and the Pseudo-
Colchian amphorae are from the same origin or not, since their PXRD patterns in Figures
4.12 and 4.13show differences.
66

67
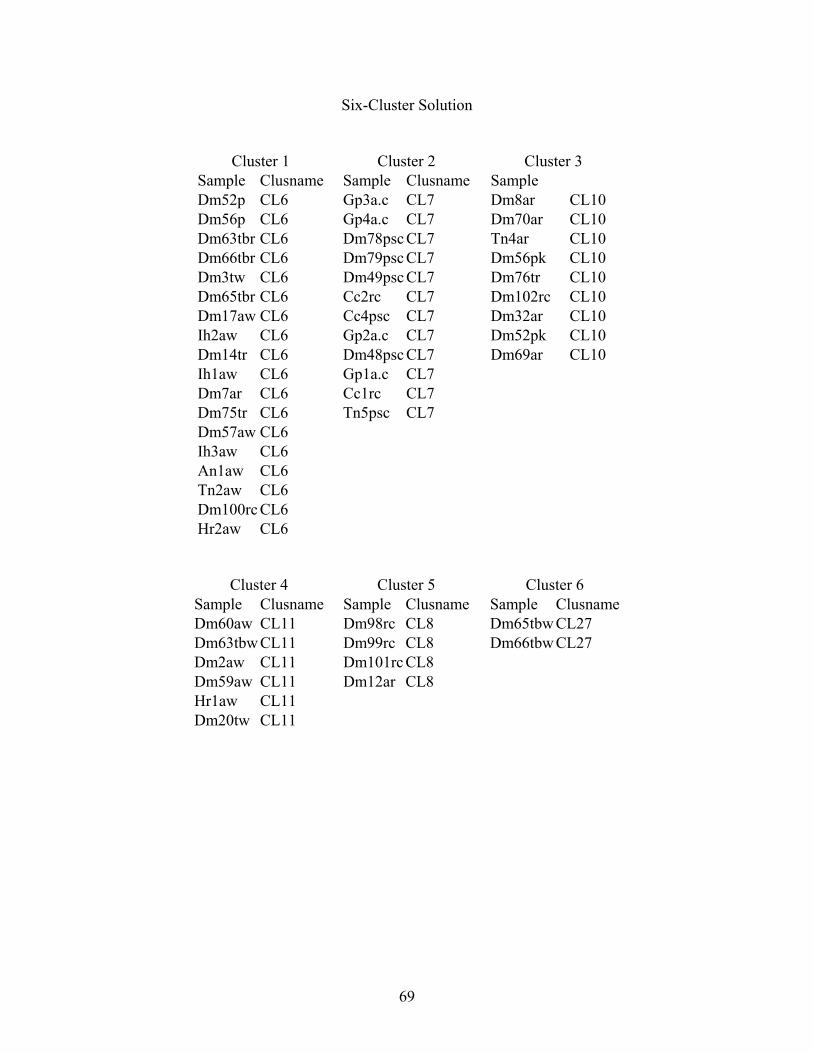
Table 4.6: Results of cluster analysis: Two, six, nine and twelve-cluster solutions.
Two – Cluster Solution
Cluster 1
Sample Clus Name Sample Clus Name Dm52p CL2 Cc4psc CL2 Dm56p CL2 Tn4ar CL2 Gp3ac CL2 Dm57aw CL2 Gp4ac CL2 Ih3aw CL2 Dm63tbr CL2 Dm98rc CL2 Dm66tbr CL2 Dm99rc CL2 Dm3tw CL2 Dm56pk CL2 Dm65tbr CL2 Dm76tr CL2 Dm8ar CL2 Gp2ac CL2 Dm70ar CL2 Dm48psc CL2 Dm17aw CL2 Gp1ac CL2 Ih2aw CL2 Dm102rc CL2 Dm78psc CL2 An1aw CL2 Dm79psc CL2 Tn2aw CL2 Dm60aw CL2 Cc1rc CL2 Dm63tbw CL2 Dm101rc CL2 Dm2aw CL2 Dm32ar CL2 Dm59aw CL2 Dm52pk CL2 Dm14tr CL2 Hr1aw CL2 Ih1aw CL2 Tn5psc CL2 Dm7ar CL2 Dm69ar CL2 Dm75tr CL2 Dm100rc CL2 Dm49psc CL2 Hr2aw CL2 Cc2rc CL2 Dm20tw CL2 Dm12ar CL2
Cluster 2
Sample Clus Name Dm65tbw CL27 Dm66tbw CL27
68

Six-Cluster Solution
Cluster 1 Cluster 2 Cluster 3 Sample Clusname Sample Clusname Sample Dm52p CL6 Gp3a.c CL7 Dm8ar CL10 Dm56p CL6 Gp4a.c CL7 Dm70ar CL10 Dm63tbr CL6 Dm78psc CL7 Tn4ar CL10 Dm66tbr CL6 Dm79psc CL7 Dm56pk CL10 Dm3tw CL6 Dm49psc CL7 Dm76tr CL10 Dm65tbr CL6 Cc2rc CL7 Dm102rc CL10 Dm17aw CL6 Cc4psc CL7 Dm32ar CL10 Ih2aw CL6 Gp2a.c CL7 Dm52pk CL10 Dm14tr CL6 Dm48psc CL7 Dm69ar CL10 Ih1aw CL6 Gp1a.c CL7 Dm7ar CL6 Cc1rc CL7 Dm75tr CL6 Tn5psc CL7 Dm57aw CL6 Ih3aw CL6 An1aw CL6 Tn2aw CL6 Dm100rc CL6 Hr2aw CL6
Cluster 4 Cluster 5 Cluster 6 Sample Clusname Sample Clusname Sample Clusname Dm60aw CL11 Dm98rc CL8 Dm65tbw CL27 Dm63tbw CL11 Dm99rc CL8 Dm66tbw CL27 Dm2aw CL11 Dm101rc CL8 Dm59aw CL11 Dm12ar CL8 Hr1aw CL11 Dm20tw CL11
69

Nine-Cluster Solution
Cluster 1 Cluster 2 Cluster 3 Sample Clusname Sample Clusname Sample Clusname Dm52p CL9 Gp3a.c CL12 Dm8ar CL10 Dm56p CL9 Gp4a.c CL12 Dm70ar CL10 Dm63tbr CL9 Dm78psc CL12 Tn4ar CL10 Dm66tbr CL9 Dm79psc CL12 Dm56pk CL10 Dm3tw CL9 Dm49psc CL12 Dm76tr CL10 Dm65tbr CL9 Cc2rc CL12 Dm102rc CL10 Dm17aw CL9 Cc4psc CL12 Dm32ar CL10 Ih2aw CL9 Gp1a.c CL12 Dm52pk CL10 Dm14tr CL9 Cc1rc CL12 Dm69ar CL10 Ih1aw CL9 Dm7ar CL9 Dm75tr CL9 Dm57aw CL9 Ih3aw CL9 An1aw CL9 Tn2aw CL9
Cluster 4 Cluster 5 Cluster 6 Sample Clusname Sample Clusname Sample Clusname Dm60aw CL11 Dm2aw CL11 Gp2a.c CL18 Dm63tbw CL11 Dm59aw CL11 Dm48psc CL18 Hr1aw CL11 Tn5psc CL18 Dm20tw CL11
Cluster 7 Cluster 8 Cluster 9 Sample Clusname Sample Clusname Sample Clusname Dm65tbw CL27 Dm100rc CL13 Dm12ar Dm12ar Dm66tbw CL27 Hr2aw CL13
70

Twelve-Cluster Solution
Cluster 1 Cluster 2 Cluster 3 Sample Clusname Sample Clusname Sample Clusname Dm52p CL15 Gp3a.c CL12 Dm63tbr CL14 Dm56p CL15 Gp4a.c CL12 Dm66tbr CL14 Dm7ar CL15 Dm78psc CL12 Dm3tw CL14 Dm75tr CL15 Dm79psc CL12 Dm65tbr CL14 Dm57aw CL15 Dm49psc CL12 Dm17aw CL14 Ih3aw CL15 Cc2rc CL12 Ih2aw CL14 Cc4psc CL12 Dm14tr CL14 Gp1a.c CL12 Ih1aw CL14 Cc1rc CL12 An1aw CL14 Tn2aw CL14
Cluster 4 Cluster 5 Cluster 6 Sample Clusname Sample Clusname Sample Clusname Dm8ar CL16 Dm60aw CL20 Dm98rc CL22 Dm70ar CL16 Dm63tbw CL20 Dm99rc CL22 Tn4aw CL16 Dm2aw CL20 Dm101rc CL22 Dm102rc CL16 Dm59aw CL20 Dm69ar CL16 Hr1aw CL20
Cluster 7 Cluster 8 Cluster 9 Sample Clusname Sample Clusname Sample Clusname Dm56pk CL17 Gp2a.c CL18 Dm65tbw CL27 Dm76tr CL17 Dm48psc CL18 Dm66tbw CL27 Dm32ar CL17 Tn5psc CL18 Dm52pk CL17
Cluster 10 Cluster 11 Cluster 12 Sample Clusname Sample Clusname Sample Clusname Dm100rc CL13 Dm20tw Dm20tw Dm12ar Dm12ar Hr2aw CL13
71

The results of cluster analysis support the results of PCA, also for the samples of Ibn
Hani, Antioch and the red clay carrot type of amphorae of Tanais. These samples are
again found to be in the Demirci provenance. However this time, white clay amphorae
from Heraclea Pontica and Tanais are also included in Demirci provenance, and there is
no clear separation for the samples even at the level of twelve-cluster solution.
For the samples from Sinop; the pink, red and white clay amphorae, the tiles and the
tubulures cluster altogether without any clear separation, but the raw clays Dm98.rc,
Dm99.rc, and Dm101.rc cluster separately. This scheme of clustering indicates that the
elemental compositions of raw clays were altered by the addition of tempers during the
pottery production.
72

5. CONCLUSION
Regarding the pottery characterization and provenance studies, following conclusions can
be drawn:
The raw clays that are collected from Sinop are composed of varying amounts of clay
minerals possibly of montmorillonite type, the minerals quartz, feldspars and calcite.
The pink clay, red clay and white clay amphorae from Sinop are composed of the
minerals quartz, feldspars, pyroxenes, and hematite. Little amount of calcite was also
determined in some samples, but it could be of secondary origin due to the deposition in
the burial environment. The amount of pyroxenes are higher in the white clay amphorae.
Elemental compositions of the amphorae show some differences, particularly in the
amount of calcium. Calcium is found in larger amounts in the white clay amphorae. This
could be due to the use of clays collected from different beds for the red clay and white
clay amphorae, or addition of calcite as a temper to the white clay amphorae.
The source of the pyroxenes and hematite observed in the Sinopean amphorae could be
the black sand and red inclusion that are added into the clay as a tempering material, but
also the formation of such minerals as a result of chemical reactions at high baking
temperatures.
The baking temperature, firing atmosphere and the raw materials used are the factors that
affect ceramic’s color formation. Considering the mineralogical and elemental
compositions of red clay and white clay amphorae, it is proposed that the average baking
temperature of the red clay amphorae is around 800 – 850 oC whereas it is around 950 oC
for the white clay ones.
The mineral hematite, which is the α-Fe2O3 could be the reason of the red color
observed in the red clay amphorae. On the other hand formation of new mineral phases
73

such as pyroxenes, throughout the chemical reactions that take place in the clay matrix at
high tempertures, could be the reason of creamy-white colors observed for the white-
clay amphorae.
The colors of the red clay and white clay tiles from Sinop depend on the the same reasons
that are explained for the red clay and white clay amphorae. The mineral compositions
show that the white clay tiles were used inside the kilns, and subject to high firing
temperatures, whereas the red clay tiles were used outside of the kilns, and subject to low
firing temperatures.
The tubulures, which were used on top of the kilns are observed to contain both red and
white sides in one piece. PXRD analyses show that the white sides of the tubulures
contain higher amounts of calcite and pyroxenes. In addition the XRF analyses show that
the element calcium is very high in the white sides in comparison to the red sides. In
explaining these diferences the possibility of using two different types of source material
is disregarded since both red and white sides are observed in a single object. It is
supposed that the the sides of the tubulures facing inside and outside of the kiln result in
different mineralogical compositions and colors due to the temperature gradient and
different redox environments.
Comparison of the PXRD patterns of the amphorae from other finding spots and the
provenance studies by means of multivariate statistical analyses showed that the white
clay amphorae from Antioch and Ibn Hani, and the red clay carrot type amphora from
Tanais are the Sinopean production. On the other hand, the white clay amphora from
Tanais was found to be more similar to the ones from Heraclea Pontica and different
from those of Sinop. However more samples from Tanais and Heraclea Pontica are
needed to conclude on their provenances.
The Colchian amphorae from Gorgippia and the Pseudo-Colchian amphorae have typical
differences from all other samples, but also from each others.
74
By interpreting the results of chemical analyses, valuable information on the circulation
of amphorae in Black Sea and Eastern Mediterranean Sea can be obtained. The results of
this study confirmed the trade between Sinop, Ibn Hani and Antioche, in which Ibn Hani
and Antioche was importing the amphorae produced in Sinop, as proposed by the
archeological expertise.
Heraclea Pontica could also proposed to be another center of production according to the
results of chemical analyses, but there is the necessity of a larger program with more
geological sampling and archeological survey to obtain strong arguments.
The results of this study also support the arguments that Colchis is another center of
production, since the Colchian amphorae from Gorgippia do not show any similarity to
the amphorae from any other production centers.
75

REFERENCES
[1] LaBrecque, J.J., Vaz, J. E., Cruxent, J.M. & Rosales, P.A. 1998
A Simple Radioisotope X-Ray Fluorescence Method for Provenance Studies of
Archaeological Ceramics Employing Principal Component Analysis, Spectrochim.
Acta B, 53, 95-100.
[2] Molera, J., Pradell, T., Vendrell-Saz, M., 1998
The colors of Ca-rich ceramic pastes: origin and characterization, Appl. Clay Sci.13, 187-
202
[3] Calliari I., Canal E., Cavazzoni, S., Lazzarini, L., 2001
Roman bricks from the Lagoon of Venice: a chemical characterization with methods
of multivariate analysis, J. Cult. Herit. 2, 23-29
[4] Constantinescu, B., Bugoi, R., Sziki, C., 2002.
Obsidian provenance studies of Transylvania's Neolithic tools using PIXE, micro-PIXE
and XRF. Nucl. Instrum. Meth. B., 189: 373-377
[5] Erten, H. N., Kassab Tezgör, D., Türkmen I. R., Zararsız, A., in press.
Typology and trade of the amphorae of Sinope – Archeological study and scientific
Analyses. PDIA.
[6] Milazzo, M., in press.
Radiation Applications in art and archeometry X-ray fluorescence applications to
archeometry. Possibility of obtaining non-destructive quantitative analyses. Nucl.
Instrum. Meth. B.
[7] Paama, L., Pitkanen, I., Peramaki, P., 2000
Analysis of Archeological Samples and Local Clays Using ICP-AES, TG-DTG and FTIR
Techniques, Talanta 51, 349-357.
[8] Birgül, O., Diksic, M., Yaffe, L., 1977.
Activation analysis of Turkish and Canadian clays and Turkish pottery. Journal
of Radioanalytical Chemistry, 39: 45-62
[9] King, R. H. 1987
Provenance of Clay Material Used in the Manufacture of Archeological Pottery
from Cyprus, Appl. Clay Sci. 2, 199-213.
76

[10] Bishop, R. L., Blackman M. J., 2002.
Instrumental neutron activation analysis of archeological ceramics: Scale and
interpretation. Acc. Chem. Res.,35: 603-610.
[11] Ryan, S. R., Fishbeck, H. J., Chesnut, K., 1985.
Correlation of archeological ceramics and clays using an external beam PIXE analysis of
the major elemental constituents. Nucl. Instrum. Meth. B.,11: 645-649.
[12] Kieft, I. E., Jamieson, D.N., Rout, B., Szymanski, R., Jamieson, A. S., 2002.
PIXE cluster analysis of ancient ceramics from North Syria. Nucl. Instrum. Meth.
B.,190: 492-496.
[13] Demirci, Ş. & Akyol, A. 1995
Sinop Amfora Atölyelerinde Ele geçen Örneklerle Bir Çalışma, XI. Arkeometri
Sonuçları Toplantısı, 53 – 62.
[14] Bagnasco, M. B., Casoli, A., Chiari, G., Compagnoni, R., Davit, P., Mitri, P., 2001
Mineralogical and chemical composition of the transport amphorae excavated at Locri
Epizephiri (southern Italy) J. Cult. Herit. 2, 229-239.
[15] Colagero, S., Bertelle, M., Antonelli, F. & Lazzarini, L. 2000
A Mösbauer Study of Some Coloured Marbles (cipollino mandolato, rosso antico, and
fior di pesco): Implications on the Nature of Their Colour, J. Cult. Herit. 1, 429-444.
[16] Scorzelli, R. B., Petrick, S., Rossi, A. M., Poupeu, G., Bigazzi, G., 2001.
Obsidian archeological artefacts provenance studies in the Western Meditterranean basin:
an approach by Mössbauer spectroscopy and electron paramagnetic resonance. Earth
and Planetary Sciences, 332: 769-776.
[17] Lambert, J. B., McLaughlin, C. D., Shawl, C.E., Xue, L. 1999.
X-Ray Photoelectron Spectroscopy and Archeology. Anal Chem, 71 :614 -620
[18] Moropoulou, A., Bakolas A., Bisbikou, K., 1995.
Thermal analysis as a method of characterizing ancient ceramic technologies.
Thermochimica Acta, 2570: 743-753.
[19] Rice, P. M., 1987
Pottery Analysis – A Source Book. London
[20] Whitbread I. K., 1995.
Greek Transport Amphorae – A Petrological and Archeological Study. Great Britain
[21] Yap, C.-T. & Hua Y.-N., 1995
Chinese Greenware Raw Materials: Principal Component Analysis of Major and Minor
Chemical Constituents, Appl. Spectrosc. 49, 7, 981- 986.
77

[22] Tsetskhladze, G.R. & Vnukov, S.Y., 1992
Colchian amphorae: typology, chronology and aspects of production, BSA 87, 357-386
[23] Kassab Tezgor, D., Tatlıcan İ., 1999
Sinop-Demirci Malzemesi 1998 Yılı Araştırma Dönemi. 21. Kazı Sonuçları Toplantısı –
Ankara, 315-322.
[24] Vnukov, S. Yu., 1995.
Pottery petrology and problems of amphora production in Black Sea area. Fourth Euro
Ceramics, 14: 185-193.
[25] Brashinsky, 1973.
The progress of Greek Epigraphyin the USSR. Eirene,11 :111-114.
[26] Kassab Tezgör, D. 1996
Fouilles des ateliers d'amphores à Demirci près de Sinope en 1994 et 1995, AnatAnt IV,
335-354.
[27] Kassab Tezgör, D. & Tatlıcan, İ. 1998
Fouilles des ateliers d'amphores à Demirci près de Sinope en 1996 et 1997, AnatAnt VI, 423-
442.
[28] Kassab Tezgör, D. & Dereli, F. 2001
Fouilles des ateliers d'amphores à Demirci près de Sinope en 2000, AnatAnt IX, 215-225.
[29] Kassab Tezgör, D. & Touma, M. 2001
Amphores exportées de mer Noire en Syrie du Nord, AnatAnt IX, 105-115.
[30] Kassab Tezgör, D. & Akkaya, M. 2000
Les amphores à pâte brune du Musée de Samsun, AnatAnt VIII, 126-142.
[31] Kassab Tezgör, D. in press
Le réseau commercial des amphores sinopéennes aux premiers siècles de notre ère, in:
Second International Congress on Black Sea Antiquities, University of Bilkent, Ankara, 2th –
9th of September 2001.
[32] Ars'eneva, T., Kassab Tezgör, D. & Naumenko, S. 1997
Un dépotoir d'atelier d'amphores à pâte claire. Commerce entre Héraclée du Pont et Tanais à
l'époque romaine, AnatAnt V, 187-198.
[33] Zoltai T., Stout, J. H., 1984
Mineralogy: Concepts and principals. New York.
[34] West, A. R., 1984
Solid State Chemistry and Its Applications. New York.
78
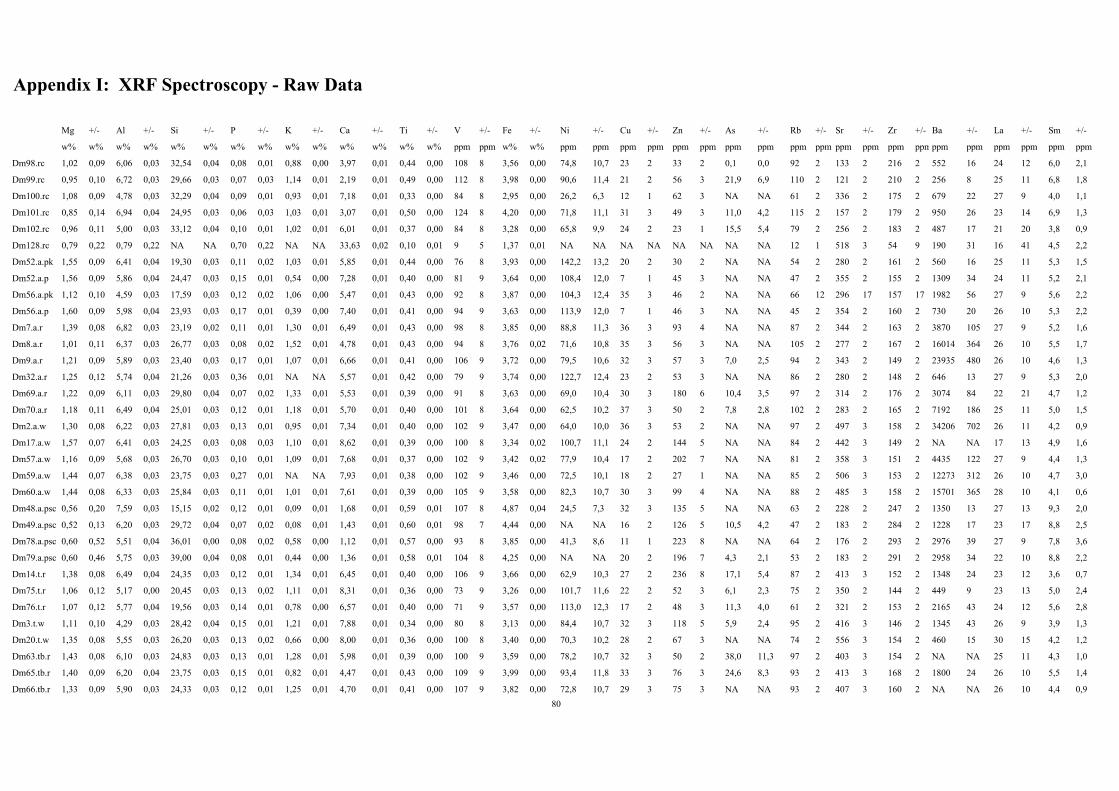
[35] West, R. C., 1974
Handbook of Chemistry and Physics. Ohio.
[36] Barthemly, D. 2003
Mineralogy Database [Online]. Available:http://webmineral.com/X-Ray.shtml
[Accessed: 22 August 2003]
[37] Tokalıoğlu, Ş. & Kartal, Ş. 2002
Atomic Absorption Spectrometric Determination of Heavy Metal Contents of Soils
Around Different Highways in Turkey and Statistical Interpretation of the Data, J. Trace
Microprobe T. 20, 127 – 140.
[38] Johnson, R. A., Wichern D. W., 1992
Applied Multivariate Statistical Analysis. New Jersey.
[39] SAS User’s Guide [40] Deer, W. A., Zussman, J., 1992
An Introduction to Rock Forming Minerals. Hong Kong.
[41] Zhu, H. Y., Vansat, E. F., XIA, J. A. & Lu, G. Q, 1997
Porosity and Thermal Stability of Montmorillonite Pillared with Mixed Oxides of
Lanthanum, Calcium and Aliminium, J. Porous Mat. 4, 17-26.
[42] Bondioli, F., Ferrari A. M., Leonelli C. & Manfredini T. 1998
Syntheses of Fe2O3/Silica Red Inorganic Inclusion Pigments for Ceramic Applications,
Mater. Res. Bull. 33, 723-729.
[43] Uda, M., Sassa, S., Yoshimura, S., Kondo, J., Nakamura, M., Ban, Y. & Adachi, H. 2000
Yellow, Red and Blue Pigments from Ancient Egyptian Palace Painted Walls, Nucl.
Instrum. Meth. B, 161-163, 758-761.
[44] Ricardi, M. P., Messiga, B., Duminuco P., Manfredini T. 1999
An Aproach to dynamics of Clay Firing Appl Clay Sci, 15, 393 -409.
[45] Reduction and Ceramic Color Change. Near Eastern Archeology, 64:134 (2001).
[46] Jordan, M., Sanfeliu, T., & Fuente, C. 2001
Firing Transformations in Tertiary Clays Used in the Manufacturing of Ceramic Tile
Bodies, Appl. Clay Sci. 20, 87-95.
[47] Mallory-Greenough, L. M., Greenough, J. D., 1998
New Data for Old Pots: Trace-Element Characterization of Anciet Egyptian
Pottery Using ICP-MS. Journal of Archeological Science, 25: 85-97.
79
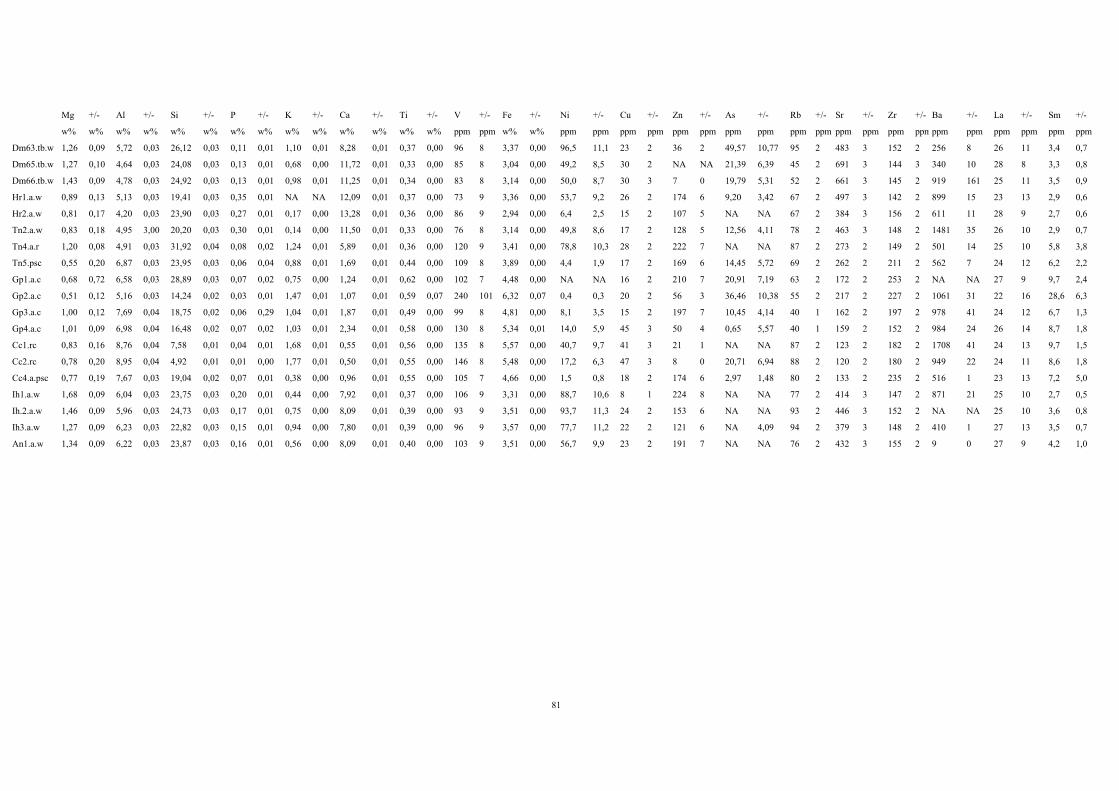
Appendix I: XRF Spectroscopy - Raw Data
Mg +/- Al +/- Si +/- P +/- K +/- Ca +/- Ti +/- V +/- Fe +/- Ni +/- Cu +/- Zn +/- As +/- Rb +/- Sr +/- Zr +/- Ba +/- La +/- Sm +/-
w% w% w% w% w% w% w% w% w% w% w% w% w% w% ppm ppm w% w% ppm ppm ppm ppm ppm ppm ppm ppm ppm ppm ppm ppm ppm ppmppm ppm ppm ppm ppm ppm
Dm98.rc 1,02 0,09 6,06 0,03 32,54 0,04 0,08 0,01 0,88 0,00 3,97 0,01 0,44 0,00 108 8 3,56 0,00 74,8 10,7 23 2 33 2 0,1 0,0 92 2 133 2 216 2 552 16 24 12 6,0 2,1
Dm99.rc 0,95 0,10 6,72 0,03 29,66 0,03 0,07 0,03 1,14 0,01 2,19 0,01 0,49 0,00 112 8 3,98 0,00 90,6 11,4 21 2 56 3 21,9 6,9 110 2 121 2 210 2 256 8 25 11 6,8 1,8
Dm100.rc 1,08 0,09 4,78 0,03 32,29 0,04 0,09 0,01 0,93 0,01 7,18 0,01 0,33 0,00 84 8 2,95 0,00 26,2 6,3 12 1 62 3 NA NA 61 2 336 2 175 2 679 22 27 9 4,0 1,1
Dm101.rc 0,85 0,14 6,94 0,04 24,95 0,03 0,06 0,03 1,03 0,01 3,07 0,01 0,50 0,00 124 8 4,20 0,00 71,8 11,1 31 3 49 3 11,0 4,2 115 2 157 2 179 2 950 26 23 14 6,9 1,3
Dm102.rc 0,96 0,11 5,00 0,03 33,12 0,04 0,10 0,01 1,02 0,01 6,01 0,01 0,37 0,00 84 8 3,28 0,00 65,8 9,9 24 2 23 1 15,5 5,4 79 2 256 2 183 2 487 17 21 20 3,8 0,9
Dm128.rc 0,79 0,22 0,79 0,22 NA NA 0,70 0,22 NA NA 33,63 0,02 0,10 0,01 9 5 1,37 0,01 NA NA NA NA NA NA NA NA 12 1 518 3 54 9 190 31 16 41 4,5 2,2
Dm52.a.pk 1,55 0,09 6,41 0,04 19,30 0,03 0,11 0,02 1,03 0,01 5,85 0,01 0,44 0,00 76 8 3,93 0,00 142,2 13,2 20 2 30 2 NA NA 54 2 280 2 161 2 560 16 25 11 5,3 1,5
Dm52.a.p 1,56 0,09 5,86 0,04 24,47 0,03 0,15 0,01 0,54 0,00 7,28 0,01 0,40 0,00 81 9 3,64 0,00 108,4 12,0 7 1 45 3 NA NA 47 2 355 2 155 2 1309 34 24 11 5,2 2,1
Dm56.a.pk 1,12 0,10 4,59 0,03 17,59 0,03 0,12 0,02 1,06 0,00 5,47 0,01 0,43 0,00 92 8 3,87 0,00 104,3 12,4 35 3 46 2 NA NA 66 12 296 17 157 17 1982 56 27 9 5,6 2,2
Dm56.a.p 1,60 0,09 5,98 0,04 23,93 0,03 0,17 0,01 0,39 0,00 7,40 0,01 0,41 0,00 94 9 3,63 0,00 113,9 12,0 7 1 46 3 NA NA 45 2 354 2 160 2 730 20 26 10 5,3 2,2
Dm7.a.r 1,39 0,08 6,82 0,03 23,19 0,02 0,11 0,01 1,30 0,01 6,49 0,01 0,43 0,00 98 8 3,85 0,00 88,8 11,3 36 3 93 4 NA NA 87 2 344 2 163 2 3870 105 27 9 5,2 1,6
Dm8.a.r 1,01 0,11 6,37 0,03 26,77 0,03 0,08 0,02 1,52 0,01 4,78 0,01 0,43 0,00 94 8 3,76 0,02 71,6 10,8 35 3 56 3 NA NA 105 2 277 2 167 2 16014 364 26 10 5,5 1,7
Dm9.a.r 1,21 0,09 5,89 0,03 23,40 0,03 0,17 0,01 1,07 0,01 6,66 0,01 0,41 0,00 106 9 3,72 0,00 79,5 10,6 32 3 57 3 7,0 2,5 94 2 343 2 149 2 23935 480 26 10 4,6 1,3
Dm32.a.r 1,25 0,12 5,74 0,04 21,26 0,03 0,36 0,01 NA NA 5,57 0,01 0,42 0,00 79 9 3,74 0,00 122,7 12,4 23 2 53 3 NA NA 86 2 280 2 148 2 646 13 27 9 5,3 2,0
Dm69.a.r 1,22 0,09 6,11 0,03 29,80 0,04 0,07 0,02 1,33 0,01 5,53 0,01 0,39 0,00 91 8 3,63 0,00 69,0 10,4 30 3 180 6 10,4 3,5 97 2 314 2 176 2 3074 84 22 21 4,7 1,2
Dm70.a.r 1,18 0,11 6,49 0,04 25,01 0,03 0,12 0,01 1,18 0,01 5,70 0,01 0,40 0,00 101 8 3,64 0,00 62,5 10,2 37 3 50 2 7,8 2,8 102 2 283 2 165 2 7192 186 25 11 5,0 1,5
Dm2.a.w 1,30 0,08 6,22 0,03 27,81 0,03 0,13 0,01 0,95 0,01 7,34 0,01 0,40 0,00 102 9 3,47 0,00 64,0 10,0 36 3 53 2 NA NA 97 2 497 3 158 2 34206 702 26 11 4,2 0,9
Dm17.a.w 1,57 0,07 6,41 0,03 24,25 0,03 0,08 0,03 1,10 0,01 8,62 0,01 0,39 0,00 100 8 3,34 0,02 100,7 11,1 24 2 144 5 NA NA 84 2 442 3 149 2 NA NA 17 13 4,9 1,6
Dm57.a.w 1,16 0,09 5,68 0,03 26,70 0,03 0,10 0,01 1,09 0,01 7,68 0,01 0,37 0,00 102 9 3,42 0,02 77,9 10,4 17 2 202 7 NA NA 81 2 358 3 151 2 4435 122 27 9 4,4 1,3
Dm59.a.w 1,44 0,07 6,38 0,03 23,75 0,03 0,27 0,01 NA NA 7,93 0,01 0,38 0,00 102 9 3,46 0,00 72,5 10,1 18 2 27 1 NA NA 85 2 506 3 153 2 12273 312 26 10 4,7 3,0
Dm60.a.w 1,44 0,08 6,33 0,03 25,84 0,03 0,11 0,01 1,01 0,01 7,61 0,01 0,39 0,00 105 9 3,58 0,00 82,3 10,7 30 3 99 4 NA NA 88 2 485 3 158 2 15701 365 28 10 4,1 0,6
Dm48.a.psc 0,56 0,20 7,59 0,03 15,15 0,02 0,12 0,01 0,09 0,01 1,68 0,01 0,59 0,01 107 8 4,87 0,04 24,5 7,3 32 3 135 5 NA NA 63 2 228 2 247 2 1350 13 27 13 9,3 2,0
Dm49.a.psc 0,52 0,13 6,20 0,03 29,72 0,04 0,07 0,02 0,08 0,01 1,43 0,01 0,60 0,01 98 7 4,44 0,00 NA NA 16 2 126 5 10,5 4,2 47 2 183 2 284 2 1228 17 23 17 8,8 2,5
Dm78.a.psc 0,60 0,52 5,51 0,04 36,01 0,00 0,08 0,02 0,58 0,00 1,12 0,01 0,57 0,00 93 8 3,85 0,00 41,3 8,6 11 1 223 8 NA NA 64 2 176 2 293 2 2976 39 27 9 7,8 3,6
Dm79.a.psc 0,60 0,46 5,75 0,03 39,00 0,04 0,08 0,01 0,44 0,00 1,36 0,01 0,58 0,01 104 8 4,25 0,00 NA NA 20 2 196 7 4,3 2,1 53 2 183 2 291 2 2958 34 22 10 8,8 2,2
Dm14.t.r 1,38 0,08 6,49 0,04 24,35 0,03 0,12 0,01 1,34 0,01 6,45 0,01 0,40 0,00 106 9 3,66 0,00 62,9 10,3 27 2 236 8 17,1 5,4 87 2 413 3 152 2 1348 24 23 12 3,6 0,7
Dm75.t.r 1,06 0,12 5,17 0,00 20,45 0,03 0,13 0,02 1,11 0,01 8,31 0,01 0,36 0,00 73 9 3,26 0,00 101,7 11,6 22 2 52 3 6,1 2,3 75 2 350 2 144 2 449 9 23 13 5,0 2,4
Dm76.t.r 1,07 0,12 5,77 0,04 19,56 0,03 0,14 0,01 0,78 0,00 6,57 0,01 0,40 0,00 71 9 3,57 0,00 113,0 12,3 17 2 48 3 11,3 4,0 61 2 321 2 153 2 2165 43 24 12 5,6 2,8
Dm3.t.w 1,11 0,10 4,29 0,03 28,42 0,04 0,15 0,01 1,21 0,01 7,88 0,01 0,34 0,00 80 8 3,13 0,00 84,4 10,7 32 3 118 5 5,9 2,4 95 2 416 3 146 2 1345 43 26 9 3,9 1,3
Dm20.t.w 1,35 0,08 5,55 0,03 26,20 0,03 0,13 0,02 0,66 0,00 8,00 0,01 0,36 0,00 100 8 3,40 0,00 70,3 10,2 28 2 67 3 NA NA 74 2 556 3 154 2 460 15 30 15 4,2 1,2
Dm63.tb.r 1,43 0,08 6,10 0,03 24,83 0,03 0,13 0,01 1,28 0,01 5,98 0,01 0,39 0,00 100 9 3,59 0,00 78,2 10,7 32 3 50 2 38,0 11,3 97 2 403 3 154 2 NA NA 25 11 4,3 1,0
Dm65.tb.r 1,40 0,09 6,20 0,04 23,75 0,03 0,15 0,01 0,82 0,01 4,47 0,01 0,43 0,00 109 9 3,99 0,00 93,4 11,8 33 3 76 3 24,6 8,3 93 2 413 3 168 2 1800 24 26 10 5,5 1,4
Dm66.tb.r 1,33 0,09 5,90 0,03 24,33 0,03 0,12 0,01 1,25 0,01 4,70 0,01 0,41 0,00 107 9 3,82 0,00 72,8 10,7 29 3 75 3 NA NA 93 2 407 3 160 2 NA NA 26 10 4,4 0,980
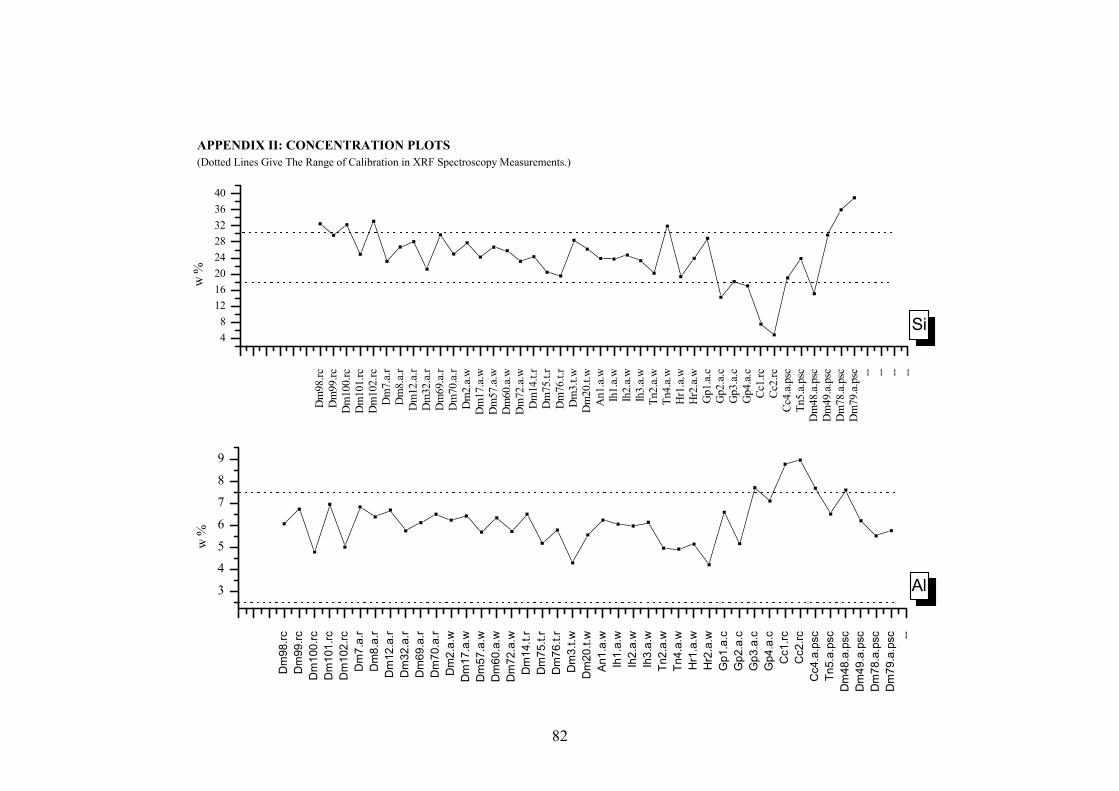
Mg +/- Al +/- Si +/- P +/- K +/- Ca +/- Ti +/- V +/- Fe +/- Ni +/- Cu +/- Zn +/- As +/- Rb +/- Sr +/- Zr +/- Ba +/- La +/- Sm +/-
w% w% w% w% w% w% w% w% w% w% w% w% w% w% ppm ppm w% w% ppm ppm ppm ppm ppm ppm ppm ppm ppm ppm ppm ppm ppm ppmppm ppm ppm ppm ppm ppm
Dm63.tb.w 1,26 0,09 5,72 0,03 26,12 0,03 0,11 0,01 1,10 0,01 8,28 0,01 0,37 0,00 96 8 3,37 0,00 96,5 11,1 23 2 36 2 49,57 10,77 95 2 483 3 152 2 256 8 26 11 3,4 0,7
Dm65.tb.w 1,27 0,10 4,64 0,03 24,08 0,03 0,13 0,01 0,68 0,00 11,72 0,01 0,33 0,00 85 8 3,04 0,00 49,2 8,5 30 2 NA NA 21,39 6,39 45 2 691 3 144 3 340 10 28 8 3,3 0,8
Dm66.tb.w 1,43 0,09 4,78 0,03 24,92 0,03 0,13 0,01 0,98 0,01 11,25 0,01 0,34 0,00 83 8 3,14 0,00 50,0 8,7 30 3 7 0 19,79 5,31 52 2 661 3 145 2 919 161 25 11 3,5 0,9
Hr1.a.w 0,89 0,13 5,13 0,03 19,41 0,03 0,35 0,01 NA NA 12,09 0,01 0,37 0,00 73 9 3,36 0,00 53,7 9,2 26 2 174 6 9,20 3,42 67 2 497 3 142 2 899 15 23 13 2,9 0,6
Hr2.a.w 0,81 0,17 4,20 0,03 23,90 0,03 0,27 0,01 0,17 0,00 13,28 0,01 0,36 0,00 86 9 2,94 0,00 6,4 2,5 15 2 107 5 NA NA 67 2 384 3 156 2 611 11 28 9 2,7 0,6
Tn2.a.w 0,83 0,18 4,95 3,00 20,20 0,03 0,30 0,01 0,14 0,00 11,50 0,01 0,33 0,00 76 8 3,14 0,00 49,8 8,6 17 2 128 5 12,56 4,11 78 2 463 3 148 2 1481 35 26 10 2,9 0,7
Tn4.a.r 1,20 0,08 4,91 0,03 31,92 0,04 0,08 0,02 1,24 0,01 5,89 0,01 0,36 0,00 120 9 3,41 0,00 78,8 10,3 28 2 222 7 NA NA 87 2 273 2 149 2 501 14 25 10 5,8 3,8
Tn5.psc 0,55 0,20 6,87 0,03 23,95 0,03 0,06 0,04 0,88 0,01 1,69 0,01 0,44 0,00 109 8 3,89 0,00 4,4 1,9 17 2 169 6 14,45 5,72 69 2 262 2 211 2 562 7 24 12 6,2 2,2
Gp1.a.c 0,68 0,72 6,58 0,03 28,89 0,03 0,07 0,02 0,75 0,00 1,24 0,01 0,62 0,00 102 7 4,48 0,00 NA NA 16 2 210 7 20,91 7,19 63 2 172 2 253 2 NA NA 27 9 9,7 2,4
Gp2.a.c 0,51 0,12 5,16 0,03 14,24 0,02 0,03 0,01 1,47 0,01 1,07 0,01 0,59 0,07 240 101 6,32 0,07 0,4 0,3 20 2 56 3 36,46 10,38 55 2 217 2 227 2 1061 31 22 16 28,6 6,3
Gp3.a.c 1,00 0,12 7,69 0,04 18,75 0,02 0,06 0,29 1,04 0,01 1,87 0,01 0,49 0,00 99 8 4,81 0,00 8,1 3,5 15 2 197 7 10,45 4,14 40 1 162 2 197 2 978 41 24 12 6,7 1,3
Gp4.a.c 1,01 0,09 6,98 0,04 16,48 0,02 0,07 0,02 1,03 0,01 2,34 0,01 0,58 0,00 130 8 5,34 0,01 14,0 5,9 45 3 50 4 0,65 5,57 40 1 159 2 152 2 984 24 26 14 8,7 1,8
Cc1.rc 0,83 0,16 8,76 0,04 7,58 0,01 0,04 0,01 1,68 0,01 0,55 0,01 0,56 0,00 135 8 5,57 0,00 40,7 9,7 41 3 21 1 NA NA 87 2 123 2 182 2 1708 41 24 13 9,7 1,5
Cc2.rc 0,78 0,20 8,95 0,04 4,92 0,01 0,01 0,00 1,77 0,01 0,50 0,01 0,55 0,00 146 8 5,48 0,00 17,2 6,3 47 3 8 0 20,71 6,94 88 2 120 2 180 2 949 22 24 11 8,6 1,8
Cc4.a.psc 0,77 0,19 7,67 0,03 19,04 0,02 0,07 0,01 0,38 0,00 0,96 0,01 0,55 0,00 105 7 4,66 0,00 1,5 0,8 18 2 174 6 2,97 1,48 80 2 133 2 235 2 516 1 23 13 7,2 5,0
Ih1.a.w 1,68 0,09 6,04 0,03 23,75 0,03 0,20 0,01 0,44 0,00 7,92 0,01 0,37 0,00 106 9 3,31 0,00 88,7 10,6 8 1 224 8 NA NA 77 2 414 3 147 2 871 21 25 10 2,7 0,5
Ih.2.a.w 1,46 0,09 5,96 0,03 24,73 0,03 0,17 0,01 0,75 0,00 8,09 0,01 0,39 0,00 93 9 3,51 0,00 93,7 11,3 24 2 153 6 NA NA 93 2 446 3 152 2 NA NA 25 10 3,6 0,8
Ih3.a.w 1,27 0,09 6,23 0,03 22,82 0,03 0,15 0,01 0,94 0,00 7,80 0,01 0,39 0,00 96 9 3,57 0,00 77,7 11,2 22 2 121 6 NA 4,09 94 2 379 3 148 2 410 1 27 13 3,5 0,7
An1.a.w 1,34 0,09 6,22 0,03 23,87 0,03 0,16 0,01 0,56 0,00 8,09 0,01 0,40 0,00 103 9 3,51 0,00 56,7 9,9 23 2 191 7 NA NA 76 2 432 3 155 2 9 0 27 9 4,2 1,0
81

82
Dm
98.r
cD
m99
.rc
Dm
100.
rcD
m10
1.rc
Dm
102.
rcD
m7.
a.r
Dm
8.a.
rD
m12
.a.r
Dm
32.a
.rD
m69
.a.r
Dm
70.a
.rD
m2.
a.w
Dm
17.a
.wD
m57
.a.w
Dm
60.a
.wD
m72
.a.w
Dm
14.
t.r
Dm
75.
t.r
Dm
76.
t.r
Dm
3.t
.wD
m2
0.t.
wA
n1.a
.wIh
1.a
.wIh
2.a
.wIh
3.a
.wT
n2.a
.wT
n4.a
.wH
r1.a
.wH
r2.a
.wG
p1
.a.c
Gp
2.a
.cG
p3
.a.c
Gp
4.a
.cC
c1.r
cC
c2.r
cC
c4.a
.psc
Tn5
.a.p
scD
m48
.a.p
scD
m49
.a.p
scD
m78
.a.p
scD
m79
.a.p
sc --
3
4
5
6
7
8
9
(Dotted Lines Give The Range of Calibration in XRF Spectroscopy Measurements.)APPENDIX II: CONCENTRATION PLOTS
Al
w %
Dm
98.rc
Dm
99.rc
Dm
100.
rcD
m10
1.rc
Dm
102.
rcD
m7.
a.r
Dm
8.a.
rD
m12
.a.r
Dm
32.a
.rD
m69
.a.r
Dm
70.a
.rD
m2.
a.w
Dm
17.a
.wD
m57
.a.w
Dm
60.a
.wD
m72
.a.w
Dm
14.t.
rD
m75
.t.r
Dm
76.t.
rD
m3.
t.wD
m20
.t.w
An1
.a.w
Ih1.
a.w
Ih2.
a.w
Ih3.
a.w
Tn2.
a.w
Tn4.
a.w
Hr1
.a.w
Hr2
.a.w
Gp1
.a.c
Gp2
.a.c
Gp3
.a.c
Gp4
.a.c
Cc1.
rcCc
2.rc
Cc4.
a.ps
cTn
5.a.
psc
Dm
48.a
.psc
Dm
49.a
.psc
Dm
78.a
.psc
Dm
79.a
.psc -- -- -- --
48
1216202428323640
Si
w %
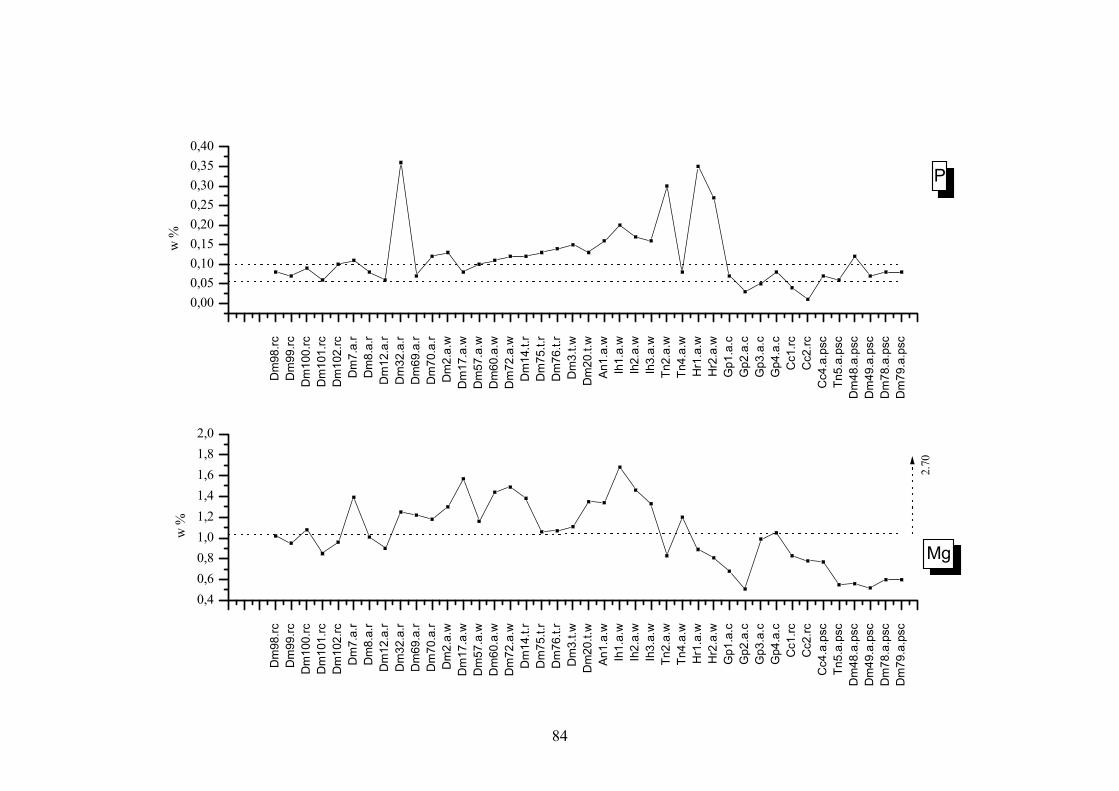
83
Dm
98.rc
Dm
99.rc
Dm
100.
rcD
m10
1.rc
Dm
102.
rcD
m7.
a.r
Dm
8.a.
rD
m12
.a.r
Dm
32.a
.rD
m69
.a.r
Dm
70.a
.rD
m2.
a.w
Dm
17.a
.wD
m57
.a.w
Dm
60.a
.wD
m72
.a.w
Dm
14.t.
rD
m75
.t.r
Dm
76.t.
rD
m3.
t.wD
m20
.t.w
An1
.a.w
Ih1.
a.w
Ih2.
a.w
Ih3.
a.w
Tn2.
a.w
Tn4.
a.w
Hr1
.a.w
Hr2
.a.w
Gp1
.a.c
Gp2
.a.c
Gp3
.a.c
Gp4
.a.c
Cc1.
rcCc
2.rc
Cc4.
a.ps
cTn
5.a.
psc
Dm
48.a
.psc
Dm
49.a
.psc
Dm
78.a
.psc
Dm
79.a
.psc
0
2
4
6
8
10
12
14
Ca
w %
Dm
98.
rcD
m9
9.rc
Dm
100
.rc
Dm
101
.rc
Dm
102
.rc
Dm
7.a
.rD
m8
.a.r
Dm
12.
a.r
Dm
32.
a.r
Dm
69.
a.r
Dm
70.
a.r
Dm
2.a
.wD
m1
7.a.
wD
m5
7.a.
wD
m6
0.a.
wD
m7
2.a.
wD
m1
4.t.r
Dm
75.
t.rD
m7
6.t.r
Dm
3.t.
wD
m2
0.t.w
An1
.a.w
Ih1.
a.w
Ih2.
a.w
Ih3.
a.w
Tn2
.a.w
Tn4
.a.w
Hr1
.a.w
Hr2
.a.w
Gp1
.a.c
Gp2
.a.c
Gp3
.a.c
Gp4
.a.c
Cc1
.rc
Cc2
.rc
Cc4
.a.p
scT
n5.a
.psc
Dm
48.
a.ps
cD
m4
9.a.
psc
Dm
78.
a.ps
cD
m7
9.a.
psc
2
4
6 Fe
w %
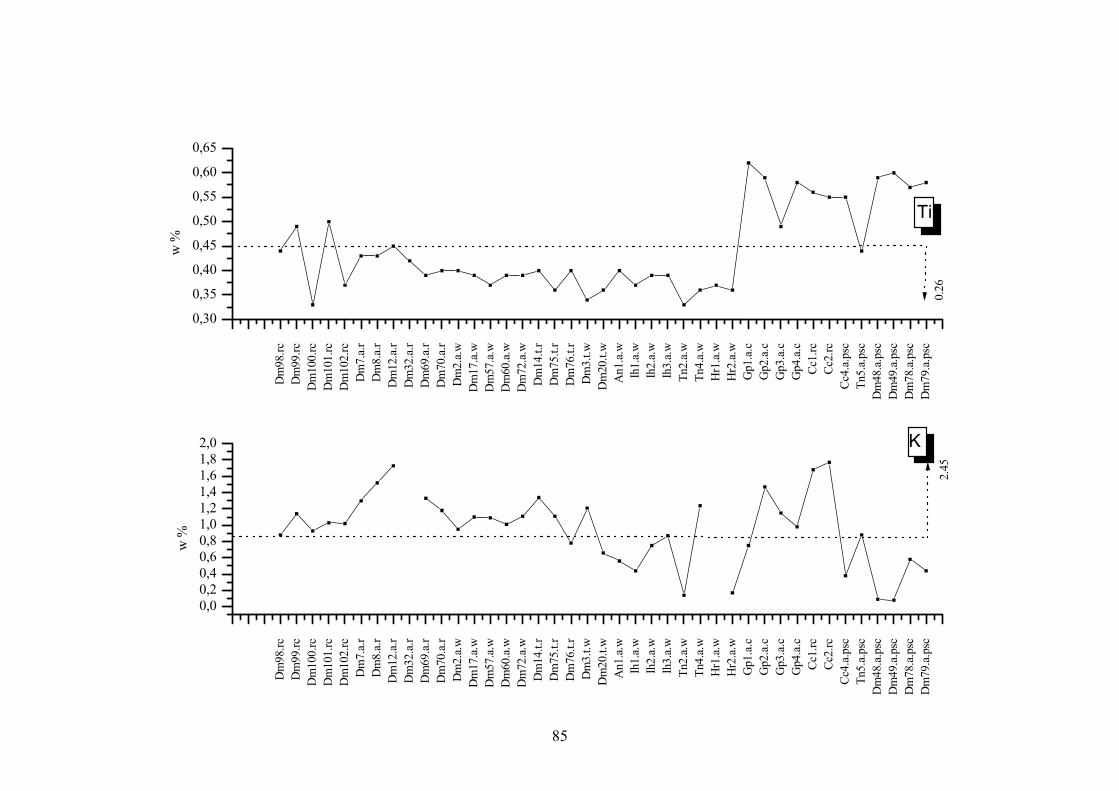
84
Dm
98.r
cD
m99
.rc
Dm
100.
rcD
m10
1.rc
Dm
102.
rcD
m7.
a.r
Dm
8.a.
rD
m12
.a.r
Dm
32.a
.rD
m69
.a.r
Dm
70.a
.rD
m2.
a.w
Dm
17.a
.wD
m57
.a.w
Dm
60.a
.wD
m72
.a.w
Dm
14.t
.rD
m75
.t.r
Dm
76.t
.rD
m3.
t.w
Dm
20.t
.wA
n1.a
.wIh
1.a.
wIh
2.a.
wIh
3.a.
wT
n2.a
.wT
n4.a
.wH
r1.a
.wH
r2.a
.wG
p1.a
.cG
p2.a
.cG
p3.a
.cG
p4.a
.cC
c1.r
cC
c2.r
cC
c4.a
.psc
Tn5
.a.p
scD
m48
.a.p
scD
m49
.a.p
scD
m78
.a.p
scD
m79
.a.p
sc
0,40,60,81,01,21,41,61,82,0
Mg
2.70
w %
Dm
98.r
cD
m99
.rc
Dm
100.
rcD
m10
1.rc
Dm
102.
rcD
m7.
a.r
Dm
8.a.
rD
m12
.a.r
Dm
32.a
.rD
m69
.a.r
Dm
70.a
.rD
m2.
a.w
Dm
17.a
.wD
m57
.a.w
Dm
60.a
.wD
m72
.a.w
Dm
14.t
.rD
m75
.t.r
Dm
76.t
.rD
m3.
t.w
Dm
20.t
.wA
n1.a
.wIh
1.a.
wIh
2.a.
wIh
3.a.
wT
n2.a
.wT
n4.a
.wH
r1.a
.wH
r2.a
.wG
p1.a
.cG
p2.a
.cG
p3.a
.cG
p4.a
.cC
c1.r
cC
c2.r
cC
c4.a
.psc
Tn5
.a.p
scD
m48
.a.p
scD
m49
.a.p
scD
m78
.a.p
scD
m79
.a.p
sc
0,000,050,100,150,200,250,300,350,40
Pw
%
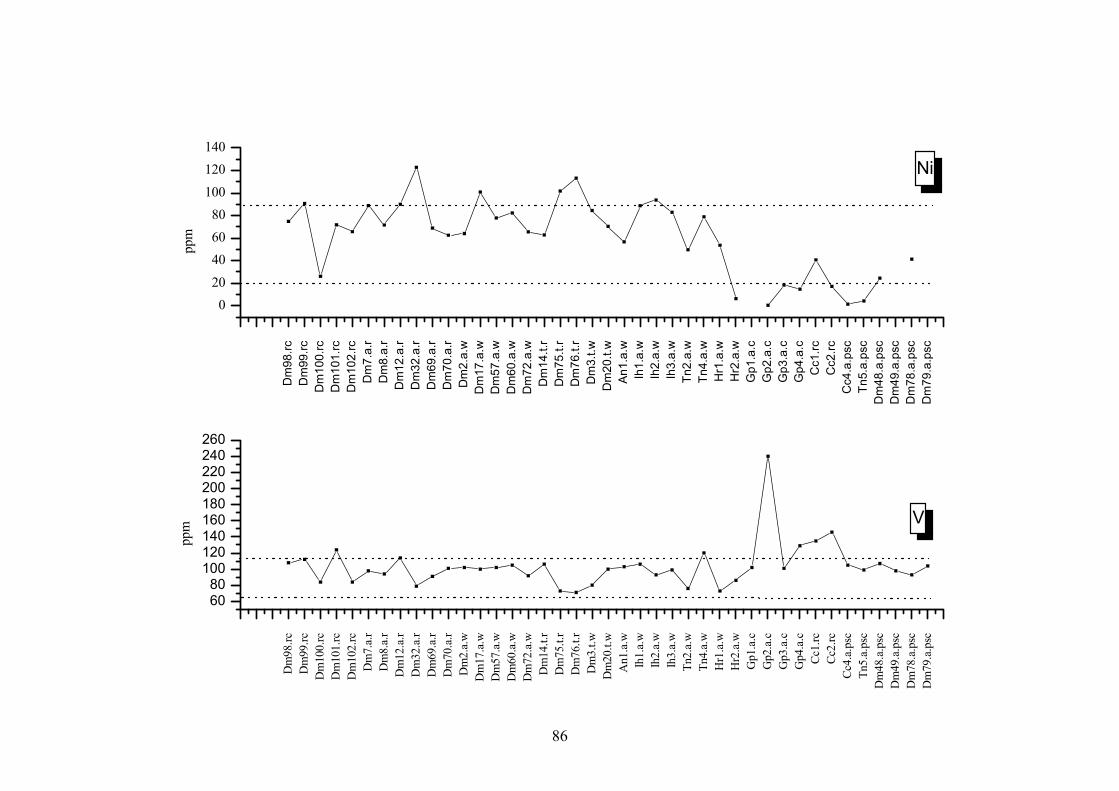
85
Dm
98.rc
Dm
99.rc
Dm
100.
rcD
m10
1.rc
Dm
102.
rcD
m7.
a.r
Dm
8.a.
rD
m12
.a.r
Dm
32.a
.rD
m69
.a.r
Dm
70.a
.rD
m2.
a.w
Dm
17.a
.wD
m57
.a.w
Dm
60.a
.wD
m72
.a.w
Dm
14.t.
rD
m75
.t.r
Dm
76.t.
rD
m3.
t.wD
m20
.t.w
An1
.a.w
Ih1.
a.w
Ih2.
a.w
Ih3.
a.w
Tn2.
a.w
Tn4.
a.w
Hr1
.a.w
Hr2
.a.w
Gp1
.a.c
Gp2
.a.c
Gp3
.a.c
Gp4
.a.c
Cc1.
rcCc
2.rc
Cc4.
a.ps
cTn
5.a.
psc
Dm
48.a
.psc
Dm
49.a
.psc
Dm
78.a
.psc
Dm
79.a
.psc
0,00,20,40,60,81,01,21,41,61,82,0
K
2.45
w %
Dm
98.rc
Dm
99.rc
Dm
100.
rcD
m10
1.rc
Dm
102.
rcD
m7.
a.r
Dm
8.a.
rD
m12
.a.r
Dm
32.a
.rD
m69
.a.r
Dm
70.a
.rD
m2.
a.w
Dm
17.a
.wD
m57
.a.w
Dm
60.a
.wD
m72
.a.w
Dm
14.t.
rD
m75
.t.r
Dm
76.t.
rD
m3.
t.wD
m20
.t.w
An1
.a.w
Ih1.
a.w
Ih2.
a.w
Ih3.
a.w
Tn2.
a.w
Tn4.
a.w
Hr1
.a.w
Hr2
.a.w
Gp1
.a.c
Gp2
.a.c
Gp3
.a.c
Gp4
.a.c
Cc1.
rcCc
2.rc
Cc4.
a.ps
cTn
5.a.
psc
Dm
48.a
.psc
Dm
49.a
.psc
Dm
78.a
.psc
Dm
79.a
.psc
0,30
0,35
0,40
0,45
0,50
0,55
0,60
0,65
Ti
0.26
w %

86
Dm
98.rc
Dm
99.rc
Dm
100.
rcD
m10
1.rc
Dm
102.
rcD
m7.
a.r
Dm
8.a.
rD
m12
.a.r
Dm
32.a
.rD
m69
.a.r
Dm
70.a
.rD
m2.
a.w
Dm
17.a
.wD
m57
.a.w
Dm
60.a
.wD
m72
.a.w
Dm
14.t.
rD
m75
.t.r
Dm
76.t.
rD
m3.
t.wD
m20
.t.w
An1
.a.w
Ih1.
a.w
Ih2.
a.w
Ih3.
a.w
Tn2.
a.w
Tn4.
a.w
Hr1
.a.w
Hr2
.a.w
Gp1
.a.c
Gp2
.a.c
Gp3
.a.c
Gp4
.a.c
Cc1.
rcCc
2.rc
Cc4.
a.ps
cTn
5.a.
psc
Dm
48.a
.psc
Dm
49.a
.psc
Dm
78.a
.psc
Dm
79.a
.psc
6080
100120140160180200220240260
Ni
V
ppm
Dm
98.r
cD
m99
.rc
Dm
100.
rcD
m10
1.rc
Dm
102.
rcD
m7.
a.r
Dm
8.a.
rD
m12
.a.r
Dm
32.a
.rD
m69
.a.r
Dm
70.a
.rD
m2.
a.w
Dm
17.a
.wD
m57
.a.w
Dm
60.a
.wD
m72
.a.w
Dm
14
.t.r
Dm
75
.t.r
Dm
76
.t.r
Dm
3.t
.wD
m2
0.t
.wA
n1.a
.wIh
1.a.
wIh
2.a.
wIh
3.a.
wT
n2.a
.wT
n4.a
.wH
r1.a
.wH
r2.a
.wG
p1.a
.cG
p2.a
.cG
p3.a
.cG
p4.a
.cC
c1.r
cC
c2.r
cC
c4.a
.psc
Tn5
.a.p
scD
m48
.a.p
scD
m49
.a.p
scD
m78
.a.p
scD
m79
.a.p
sc
020406080
100120140
ppm
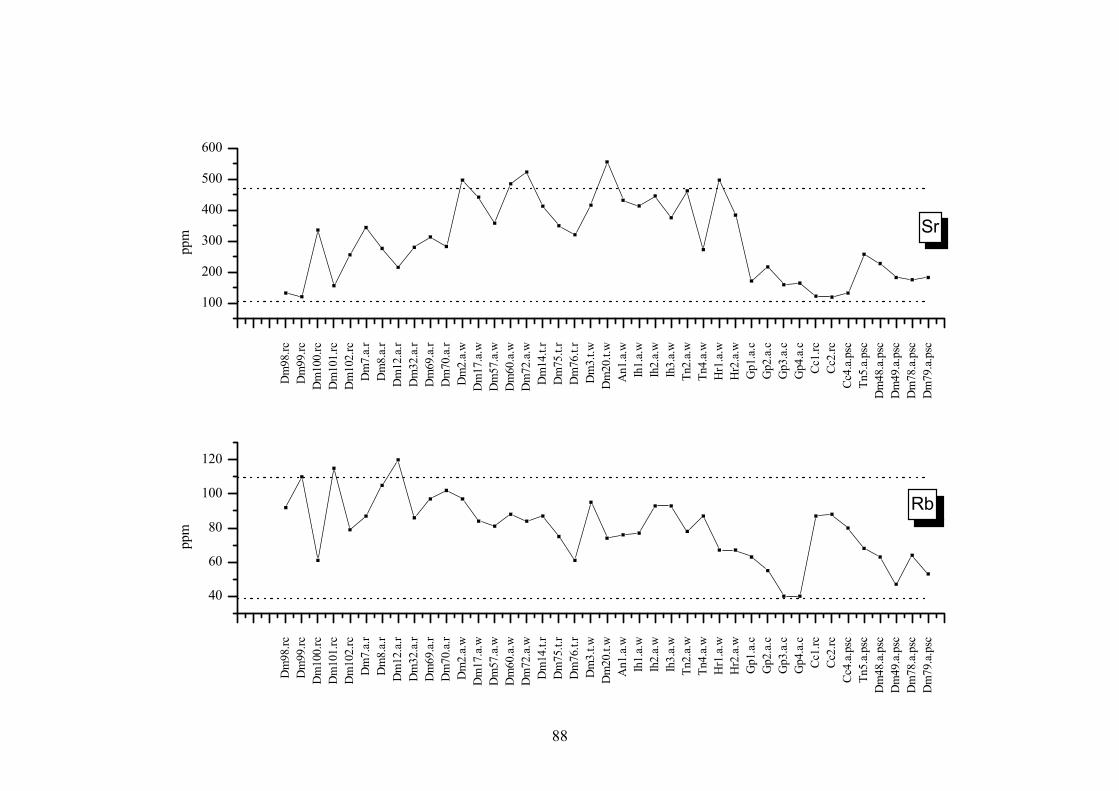
87
Dm
98.rc
Dm
99.rc
Dm
100.
rcD
m10
1.rc
Dm
102.
rcD
m7.
a.r
Dm
8.a.
rD
m12
.a.r
Dm
32.a
.rD
m69
.a.r
Dm
70.a
.rD
m2.
a.w
Dm
17.a
.wD
m57
.a.w
Dm
60.a
.wD
m72
.a.w
Dm
14.t.
rD
m75
.t.r
Dm
76.t.
rD
m3.
t.wD
m20
.t.w
An1
.a.w
Ih1.
a.w
Ih2.
a.w
Ih3.
a.w
Tn2.
a.w
Tn4.
a.w
Hr1
.a.w
Hr2
.a.w
Gp1
.a.c
Gp2
.a.c
Gp3
.a.c
Gp4
.a.c
Cc1.
rcCc
2.rc
Cc4.
a.ps
cTn
5.a.
psc
Dm
48.a
.psc
Dm
49.a
.psc
Dm
78.a
.psc
Dm
79.a
.psc
0
10
20
30
40
50
Cu
114
ppm
Dm
98.rc
Dm
99.rc
Dm
100.
rcD
m10
1.rc
Dm
102.
rcD
m7.
a.r
Dm
8.a.
rD
m12
.a.r
Dm
32.a
.rD
m69
.a.r
Dm
70.a
.rD
m2.
a.w
Dm
17.a
.wD
m57
.a.w
Dm
60.a
.wD
m72
.a.w
Dm
14.t.
rD
m75
.t.r
Dm
76.t.
rD
m3.
t.wD
m20
.t.w
An1
.a.w
Ih1.
a.w
Ih2.
a.w
Ih3.
a.w
Tn2.
a.w
Tn4.
a.w
Hr1
.a.w
Hr2
.a.w
Gp1
.a.c
Gp2
.a.c
Gp3
.a.c
Gp4
.a.c
Cc1.
rcCc
2.rc
Cc4.
a.ps
cTn
5.a.
psc
Dm
48.a
.psc
Dm
49.a
.psc
Dm
78.a
.psc
Dm
79.a
.psc
0
50
100
150
200
250
Zn
438
ppm
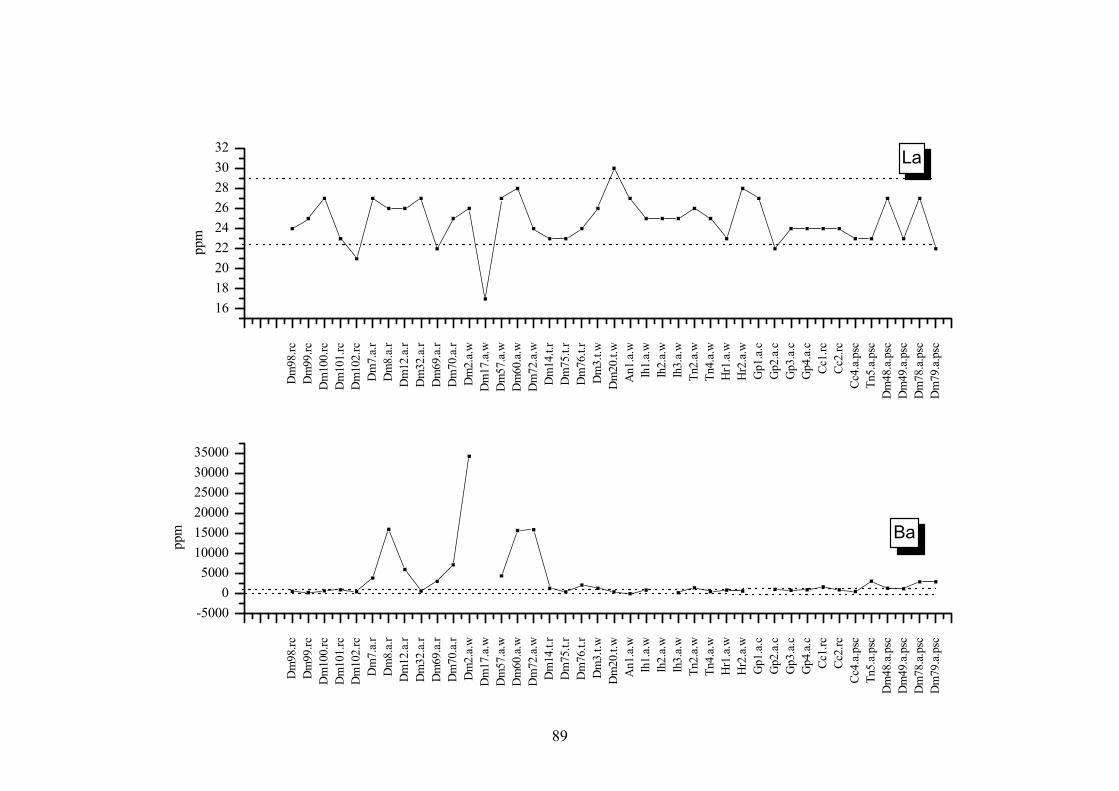
88
Dm
98.rc
Dm
99.rc
Dm
100.
rcD
m10
1.rc
Dm
102.
rcD
m7.
a.r
Dm
8.a.
rD
m12
.a.r
Dm
32.a
.rD
m69
.a.r
Dm
70.a
.rD
m2.
a.w
Dm
17.a
.wD
m57
.a.w
Dm
60.a
.wD
m72
.a.w
Dm
14.t.
rD
m75
.t.r
Dm
76.t.
rD
m3.
t.wD
m20
.t.w
An1
.a.w
Ih1.
a.w
Ih2.
a.w
Ih3.
a.w
Tn2.
a.w
Tn4.
a.w
Hr1
.a.w
Hr2
.a.w
Gp1
.a.c
Gp2
.a.c
Gp3
.a.c
Gp4
.a.c
Cc1.
rcCc
2.rc
Cc4.
a.ps
cTn
5.a.
psc
Dm
48.a
.psc
Dm
49.a
.psc
Dm
78.a
.psc
Dm
79.a
.psc
40
60
80
100
120
Rb
ppm
Dm
98.rc
Dm
99.rc
Dm
100.
rcD
m10
1.rc
Dm
102.
rcD
m7.
a.r
Dm
8.a.
rD
m12
.a.r
Dm
32.a
.rD
m69
.a.r
Dm
70.a
.rD
m2.
a.w
Dm
17.a
.wD
m57
.a.w
Dm
60.a
.wD
m72
.a.w
Dm
14.t.
rD
m75
.t.r
Dm
76.t.
rD
m3.
t.wD
m20
.t.w
An1
.a.w
Ih1.
a.w
Ih2.
a.w
Ih3.
a.w
Tn2.
a.w
Tn4.
a.w
Hr1
.a.w
Hr2
.a.w
Gp1
.a.c
Gp2
.a.c
Gp3
.a.c
Gp4
.a.c
Cc1.
rcCc
2.rc
Cc4.
a.ps
cTn
5.a.
psc
Dm
48.a
.psc
Dm
49.a
.psc
Dm
78.a
.psc
Dm
79.a
.psc
100
200
300
400
500
600
Sr
ppm

89
Dm
98.rc
Dm
99.rc
Dm
100.
rcD
m10
1.rc
Dm
102.
rcD
m7.
a.r
Dm
8.a.
rD
m12
.a.r
Dm
32.a
.rD
m69
.a.r
Dm
70.a
.rD
m2.
a.w
Dm
17.a
.wD
m57
.a.w
Dm
60.a
.wD
m72
.a.w
Dm
14.t.
rD
m75
.t.r
Dm
76.t.
rD
m3.
t.wD
m20
.t.w
An1
.a.w
Ih1.
a.w
Ih2.
a.w
Ih3.
a.w
Tn2.
a.w
Tn4.
a.w
Hr1
.a.w
Hr2
.a.w
Gp1
.a.c
Gp2
.a.c
Gp3
.a.c
Gp4
.a.c
Cc1.
rcCc
2.rc
Cc4.
a.ps
cTn
5.a.
psc
Dm
48.a
.psc
Dm
49.a
.psc
Dm
78.a
.psc
Dm
79.a
.psc
-50000
5000100001500020000250003000035000
Ba
ppm
Dm
98.rc
Dm
99.rc
Dm
100.
rcD
m10
1.rc
Dm
102.
rcD
m7.
a.r
Dm
8.a.
rD
m12
.a.r
Dm
32.a
.rD
m69
.a.r
Dm
70.a
.rD
m2.
a.w
Dm
17.a
.wD
m57
.a.w
Dm
60.a
.wD
m72
.a.w
Dm
14.t.
rD
m75
.t.r
Dm
76.t.
rD
m3.
t.wD
m20
.t.w
An1
.a.w
Ih1.
a.w
Ih2.
a.w
Ih3.
a.w
Tn2.
a.w
Tn4.
a.w
Hr1
.a.w
Hr2
.a.w
Gp1
.a.c
Gp2
.a.c
Gp3
.a.c
Gp4
.a.c
Cc1.
rcCc
2.rc
Cc4.
a.ps
cTn
5.a.
psc
Dm
48.a
.psc
Dm
49.a
.psc
Dm
78.a
.psc
Dm
79.a
.psc
161820222426283032
La
ppm

Dm
98.rc
Dm
99.rc
Dm
100.
rcD
m10
1.rc
Dm
102.
rcD
m7.
a.r
Dm
8.a.
rD
m12
.a.r
Dm
32.a
.rD
m69
.a.r
Dm
70.a
.rD
m2.
a.w
Dm
17.a
.wD
m57
.a.w
Dm
60.a
.wD
m72
.a.w
Dm
14.t.
rD
m75
.t.r
Dm
76.t.
rD
m3.
t.wD
m20
.t.w
An1
.a.w
Ih1.
a.w
Ih2.
a.w
Ih3.
a.w
Tn2.
a.w
Tn4.
a.w
Hr1
.a.w
Hr2
.a.w
Gp1
.a.c
Gp2
.a.c
Gp3
.a.c
Gp4
.a.c
Cc1.
rcCc
2.rc
Cc4.
a.ps
cTn
5.a.
psc
Dm
48.a
.psc
Dm
49.a
.psc
Dm
78.a
.psc
Dm
79.a
.psc
0
5
10
15
20
25
30
Sm
ppm
90