Embed Size (px)
Citation preview

CARLOS ALBERTO PINHEIRO BAPTISTA
Chemical Approaches to
Ubiquitous Computing
Dissertação apresentada para obtenção do
Grau de Doutor em Química,
perfil de Química-Física,
pela Universidade Nova de Lisboa,
Faculdade de Ciências e Tecnologia.
LISBOA
2010

ii

iii
CARLOS ALBERTO PINHEIRO BAPTISTA
Chemical Approaches to
Ubiquitous Computing
Supervisor: Prof. António Jorge Parola
Co-supervisor: Prof. Fernando Jorge Pina
Co-supervisor (YDreams): Ivan Franco

iv

v
Resumo
Nos capítulos 2 e 3 descreve-se o estudo de sistemas cromogénicos em solução, sensíveis
a diferentes estímulos. A rede de equilíbrios químicos do 6-hidroxiflavílio foi caracterizada
pela formação de uma forma quinoidal da chalcona. A trans-6-hidroxichalcona é
relativamente estável em soluções ácidas e exibe um processo electroquímico quase-
reversível, o que permite introduzir pela primeira vez um estímulo eléctrico nos flavílios.
Fotocromismo e electrocromismo permite transitar de um estado incolor a amarelo de
soluções de flavílio (capítulo 2). Um sistema supramolecular foi desenvolvido com base em
três componentes: Fe(III)/Fe(II), Cristal Violeta Lactona (CVL) e um spiropirano (SPI); este
sistema apresenta quatro estados ópticos: incolor, azul, magenta e amarelo. Estes estados
estão interconectados e controlados por luz e electricidade. O sistema goza da fina
selectividade do complexo Fe(III)/Fe(II) com o CVL e o SPI. A electricidade controla a
formação dos complexos corados entre os iões Fe(III)/Fe(II) com o CVL (ionocromismo) e o
SPI. A luz opera o processo fotocrómico do composto SPI (Capítulo 3).
Nos capítulos 4, 5 e 6 sistemas cromogénicos electrocrómicos em meio líquido e no estado
sólido são descritos. A cor dos filmes electro-polimerizados sobre eléctrodos flexíveis de
Azul da Prússia (PB) e de polímeros de complexos de Cu(II), Ni(II) e Pd(II) com ligando
salen foi caracterizada por colorimetria. A nova família de materiais electrocrómicos com
base nos complexos de salen apresentou transições de cor entre o verde/amarelo (Pd, Ni) e
roxo/amarelo (Cu), e um coeficiente de coloração na ordem de grandeza (150-200cm2/C)
dos valores obtidos com polímeros orgânicos como o PEDOT (Capítulo 4). A performance
relativa dos dispositivos electrocrómicos (ECD) em função do meio electrólito foi estudada.
Um electrólito polimérico sólido (SPE) e um gel electrólito (GE) foram usados para
comparação. Os ECD baseados em SPE mostraram-se inadequados para aplicações como
ecrãs, dado o seu longo tempo de transição (na ordem dos minutos). O contrário acontece
com ECD baseados em GE, tempos de transição abaixo do segundo foram registados. As
diferenças obtidas estão relacionadas com as diferentes condutividades iónicas dos
electrólitos testados; SPE (10-5–10-6 S/cm) e GE (10-2 S/cm) (Capítulo 5).
No âmbito de I&D aplicado em colaboração com a indústria, sistemas electrocrómicos foram
explorados para aumentar a funcionalidade do papel, têxtil e quadros brancos. Provas de
conceito dos ECD foram produzidos e caracterizados. O maior problema que foi encontrado
é a integração invisível de ECD com os substratos (Capítulo 6). Finalmente, um estudo de
viabilidade da utilização da impressão por jacto de tinta para construir ECD foi realizada.
Tintas electrocrómicas e electrólito curável por UV foram formuladas para a técnica de jacto
de tinta. ECD funcionais impressos por jacto de tinta são apresentados (Capítulo 7).

vi

vii
Abstract
In chapters 2 and 3 dual-mode liquid state chromogenic systems are reported. The complex
network of chemical reactions of the compound 6-hydroxyflavylium is characterized by the
formation of the p-quinoidal chalcone. The trans-chalcone is metastable in very acidic
solutions and exhibits reversible redox reactions, allowing to introduce for the first time in the
flavylium network an electrochemical input. Photochromism and electrochromism
phenomena operates the system optical states between colourless and yellow (Chapter 2).
The supramolecular system obtained by the combination of Fe(III)/Fe(II), Crystal Violet
Lactone (CVL) and a spiropyran (SPI) leads to a four optical states system: colourless, blue,
magenta and yellow; each independently addressable by light and electrical input. The
system profits from fine speciation Fe(III)/Fe(II) complexes with CVL and SPI. Electrical
stimulus controls the formation of the coloured adducts between iron ions with CVL
(ionochromism) and the merocyanine form of SPI, while light stimulus operates the SPI
compound (photochromism) (Chapter 3).
The chapters 4, 5 and 6 are devoted to the study of electrochromic systems and devices in
the liquid and solid state. A colorimetric study of electrogenerated Prussian Blue (PB) and
electrogenerated polymers based on salen-type complexes of Cu(II), Ni(II) and Pd(II)
deposited over transparent and flexible electrodes was carried out using the CIELAB colour
system. The new family of electrochromic films showed colour transitions between green-
yellow (Pd, Ni) and purple-yellow (Cu), with a coloration efficiency in the range of the values
reported for the efficient electrochromic organic polymer like PEDOT. PB films showed high
optical contrast between colourless and blue colour (Chapter 4). The relative performance of
ECD based on solid polymer electrolyte (SPE) and gel electrolyte (GE) was investigated. The
ECD based on SPE showed to be inappropriate for displays application due to its long
switching times (minutes). In opposite to ECD based SPE, switching times lower than one
second was recorded with ECD based on GE. The main differences are attributed to the
different ionic conductivity of the electrolytes; SPE (10-5–10-6 S/cm), GE (10-2 S/cm) (Chapter
5).
In the framework of applied R&D projects in collaboration with Industry, ECD were explored
to add functionalities to paper, textile and white boards. Proofs of concept of ECD were
produced and characterized. The major difficulty found was to design a seamless ECD and
to build electrodes over the different substrates. (Chapter 6). Finally, the feasibility study of
the application of ink-jet printing technology as an industrial method to build ECD is reported.
Electrochromic ink-jet and UV curable electrolyte ink-jet inks, were formulated. Functional
ink-jet printed functional ECD are presented (Chapter 7).

viii

ix
Abbreviature List
A Absorbance
Aλum Absorbance at λnm wavelength
Aλnm,n Absorbance at λnm wavelength after n write-erase cycles
α Electron transfer coefficient
Epa Anodic peak potential
K^a Apparent equilibrium constant between AH+ and A, Cc and B
K’ Apparent equilibrium constant between AH+ and CB
CRT Cathode ray tube
Epc Cathodic peak potential
CIELAB CIE-L*a*b*
x, y CELAB chromaticity coordinates
∆E*ab CIELAB colour difference
L* CIELAB coordinate relative to the luminance of the colour
a* CIELAB coordinate relative to the redness-greenness of the colour
b* CIELAB coordinate relative to the yellow-blueness of the colour
MERO-c Cis-form of the merocyanine form
Cc Cis-chalcone
CE Coloration efficiency
φ(λ) Colour stimulus function
φ(λ) Colour stimulus function
x(λ), y(λ), z(λ) Colour-matching functions
CIE Comission international de l'éclairage
CB Conjugated bases (A, B, Cc and Ct)
CR Contrast ratio
CP Coordination polymers
CVL Crystal violet lactone
I Current
CMYT Cyan, magenta and yellow, as well as a transparent state
DPGDA Dipropyleneglycol diacrylate
λd Dominant wavelength
λc,d Dominant wavelength of the complementary colour
DoD Drop-on-demand
DSSC Dye sensitized solar cells
ECD-T Ecd can be operated in the transmittance
Q Electrical charge

x
C Electrical conductance
E Electrical potential
ρ Electrical resistivity
ECD Electrochromic device
e- Electron
e Elementary charge
Ka Equilibrium constant for the deprotonation of AH+
KCt(1) Equilibrium constant for the deprotonation of Ct
KCt(2) Equilibrium constant for the deprotonation of Ct-
Kh Equilibrium constant for the hydration of AH+
Ki Equilibrium constant for the isomerization of Cc
Kt Equilibrium constant for the tautomerization of the B
Λ Equivalent conductivity
pc Excitation purity
AH+ Flavylium cation
FTO Fluorine-doped tin oxide
Tg Glass transition temperature
B Hemiketal
IP Impact printing techniques
IJ Ink-jet printing
IVCT Inter valence charge transfer
ui Ionic mobility of the specie i
Ct- Ionized trans-chalcone
ka Kinetic constant for the direct deprotonation reaction (formation of A)
kh Kinetic constant for the direct hydration reaction
k-a Kinetic constant for the inverse deprotonation reaction (protonation of A)
k-h Kinetic constant for the inverse hydration reaction (the dehydration of B)
CIELAB L*a*b* tristimulus cie colour space
LSE Liquid state electrolyte
PEO-2 Low molecular weight peo-ppo
MERO Merocyanine form of the spiropyran
[M(salen)] Metal complex, m with salen ligand
poly[M(salen)] Metal complex, m with salen ligand polymer
M+ Metal ion
MV Methyl viologen
M Molar

xi
ε Molar absorption coefficient
χX Molar fraction of the specie X
NCD Nanochromic display
NIR Near infrared region radiation
V- Negative voltage
z Net charge
NIP Non-impact printing techniques
NMR Nuclear magnetic resonance spectroscopy
N Number of charge carriers
kobs Observed kinetic constant
OTE Optically transparent electrodes
OLED Organic light emitting diodes
MERO-oQ Ortho-quinoidal form of the merocyanine
PANI poly(acrylonitrile)
FOT group Photochemistry and supramolecular group
P-ECD Photoelectrochromic device
PMMA Poly(methyl methacrylate)
PEDT:PSS Poly(3,4-ethylenedioxythiophene)-poly(styrenesulfonate)
PEDOT Poly(ethylene dioxythiophene)
PEO-PPO Poly(ethylene oxide) and poly(propylene oxide) copolymer
p(TMC) Poly(trimethylene carbonate)
PVdF Poly(vinyliden fluoride)
PEO Polyethylene oxide polymer
PET Polyethylene terephthalate
PET-ITO Polyethylene terephthalate films coated with indium tin oxide
ADI Portuguese innovation agency
V+ Positive voltage
PB Prussian blue
PX Prussian brown
PW Prussian white
PY Prussian yellow
PVC Poly(vinyl chloride)
PVdF Poly(vinylidene fluoride)
Φi Quantum yield for a given process i
A Quinoidal base
R0 Intensity of reflected light from a non-shiny white card

xii
RGB Red, green and blue additive colour system
Rλnm Reflectance at λnm wavelength
Rλnm,n Reflectance at λnm wavelength after n write-erase cycles
S(λ) Relative spectral power distribution of the illuminant
τ Response time
Voff Resting voltage
Rx Intensity of light reflected diffusely by the coloured state of the ECD
SCE Saturated calomel electrode
v Scan rate
Ag/AgCl Silver/silver chloride reference
SPE Solid polymer electrolyte
Kps Solubility constant
κ Specific electrical conductance or electrical conductivity
R(λ) Spectral reflectance factor
T(λ) Spectral transmittance factor
SEC Spectroelectrochemistry
BIPS Spiroindolinobenzopyran
SPI Spiropyran
T Temperature
MERO Merocyanine form
IJ Ink-jet printing
ECD-R Reflectance
ITO Tin-doped indium oxide
TiO2-DPGDA TiO2 dispersion in dipropyleneglycol diacrylate
TiO2-W TiO2 dispersion in water
CX Total concentration of specie X
Ct Trans-chalcone
Tλnm Transmittance at lnm wavelength
Tλnm,n Transmittance at lnm wavelength after n write-erase cycles
TCO Transparent conductive oxide
TPM Triphenylmethane
x(λ), y(λ), z(λ) Tristimulus colour-matching functions
UC Ubiquitous computing
UV Ultra-violet radiation
UV-Vis Ultraviolet-visible spectroscopy
∆ Variation

xiii
vs. Versus
η
V
Viscosity
Voltage
λ Wavelength
λmax Wavelength of maximum emission or absorption

xiv

xv
Table of Contents
Chapter 1 .............................................................................................................................. 1
General Introduction
1.1 Motivation ..................................................................................................................... 2
1.2 Chromogenic Systems and Applications (Background)................................................. 3
1.2.1 Electricity ...................................................................................................................... 5
1.2.2 Light............................................................................................................................ 13
1.2.3 Ions............................................................................................................................. 15
1.2.4 Electricity and light or ions and light ............................................................................ 16
1.2.5 Temperature, polarity, mechanical pressure and mechanical friction .......................... 19
1.3 Industrial Printing Techniques..................................................................................... 19
1.4 Outline ........................................................................................................................ 21
1.5 Bibliography................................................................................................................ 23
Chapter 2 ............................................................................................................................ 29
The chemistry of 6-hydroxyflavylium
2.1 Introduction................................................................................................................. 30
2.1.1 Flavylium compounds ................................................................................................. 30
2.2 Experimental details ................................................................................................... 38
2.3 Results and Discussion............................................................................................... 41
2.4 Conclusions ................................................................................................................ 53
2.5 Bibliography................................................................................................................ 55
Chapter 3 ............................................................................................................................ 59
Multiresponsive chromogenic systems operated by light and electrical inputs
3.1 Introduction................................................................................................................. 60
3.1.1 Leuco Dyes................................................................................................................. 60
3.2 Experimental details ................................................................................................... 64
3.3 Results and Discussion............................................................................................... 66

xvi
3.3.1 Interaction between CVL and iron ions........................................................................66
3.3.2 Adding light stimulus: multi-responsive system ...........................................................75
3.3.3 Two external inputs, Three species, Four Colours ......................................................79
3.4 Conclusions ................................................................................................................81
3.5 Bibliography................................................................................................................83
Chapter 4 ............................................................................................................................87
Electrocolorimetry of electrochromic materials on flexible ITO electrodes
4.1 Introduction.................................................................................................................88
4.1.1 Electrochromic Coordination Polymers .......................................................................88
4.1.2 Colorimetry .................................................................................................................94
4.2 Experimental details.................................................................................................. 100
4.3 Results and Discussion............................................................................................. 102
4.3.1 Prussian blue............................................................................................................ 102
4.3.2 Salen-type complexes of Cu(II), Ni(II) and Pd(II)....................................................... 106
4.4 Conclusion................................................................................................................ 115
4.5 Bibliography.............................................................................................................. 117
Chapter 5 .......................................................................................................................... 123
Non-liquid Electrolytes for Electrochromic Devices
5.1 Introduction............................................................................................................... 124
5.1.1 Electrolyte systems and application .......................................................................... 124
5.2 Gel Electrolytes for ECD applications ....................................................................... 130
5.2.1 Experimental Details ................................................................................................. 130
5.2.2 Results and Discussion............................................................................................. 132
5.3 A Solid Polymer Electrolyte for ECD ......................................................................... 145
5.3.1 Experimental Details ................................................................................................. 145
5.3.2 Results and Discussion............................................................................................. 149
5.4 General Conclusions................................................................................................. 158
5.5 Bibliography.............................................................................................................. 161

xvii
Chapter 6 .......................................................................................................................... 165
Paper, textile and white board ECD
6.1 Motivation ................................................................................................................. 166
6.2 Strategy and project execution organization ............................................................. 169
6.3 Results and Discussion............................................................................................. 172
6.3.1 Electrochromic layer ................................................................................................. 172
6.3.2 ECD Assembly with paper-, textile- and white board electrodes ............................... 176
6.3.3 ECD characterization................................................................................................ 180
6.4 Conclusions .............................................................................................................. 184
6.5 Bibliography.............................................................................................................. 187
Chapter 7 .......................................................................................................................... 189
Feasibility study for an electrochromic display built by ink-jet
7.1 Introduction............................................................................................................... 190
7.1.1 Ink-jet technique ....................................................................................................... 191
7.2 Strategy and project execution organization ............................................................. 196
7.3 Results and Discussion............................................................................................. 197
7.3.1 Printing the Electrochromic Layer ............................................................................. 197
7.3.2 Printing the Electrolyte Layer .................................................................................... 198
7.3.3 Demonstration of the ink-jet printed electrochromic cells .......................................... 201
7.4 Conclusion................................................................................................................ 203
7.5 Bibliography.............................................................................................................. 205
Chapter 8…………………………….…………………………………………………………….209
List of Publications
8.1 List of Publications………………………….……………………………………………..210

xviii

xix
Index of Figures
Figure 1.1 – Light interaction with matter; reflectance, scattering, absorption and transmittance .................. 4
Figure 1.2 – Example of an electrochromic device with the “sandwich” like architecture. ............................... 6
Figure 1.3 – ECD in transmittance mode (A), and in reflectance mode (B)........................................................ 8
Figure 1.4 – Schematic view of the ECD from Acreo EC technology with a "side-by-side" architecture. ..........12
Figure 1.5 – ECD architecture employed by NTera where the primary electrode is composed by a
chemisorbed viologen derivative on the surface of TiO2 nanoparticles (coated PET-ITO) (1), a dispersion of
light scattering TiO2 nanoparticles is incorporated in the electrolyte layer (2). ...............................................13
Figure 1.6 – T-type photochromic compounds, spiropyrans (A), spirooxazines (B) and chromenes (C) ...........14
Figure 1.7 – P-type photochromic compounds, fulgides (A) and diarylethenes (B)..........................................14
Figure 1.8 – Acidochromism mechanism of the Methyl Red, the base form is colourless and at a pH = 4.4 the
azonium for is red...........................................................................................................................................15
Figure 1.9 – Dual-mode photochromism and electrochromism of the 1,2-bis(2-methyl-5,2’-dithiophen-3-
yl)perfluorocyclopentene, the pale yellow ring-open form (A) is converted both by an electrical potential and
by UV light to the coloured ring-closed form (B) .............................................................................................17
Figure 1.10 – The spiropyrans bearing a monoaza-crown shows dual-mode photochromic and ionochromic
properties. ......................................................................................................................................................17
Figure 1.11 – Example of the operation of a P-ECD by light. Electrons are ejected from the photovoltaic layer
(1) and reduction of the electrochromic WO3 layer will cause the darkening of the device............................18
Figure 1.12 – Graphic printing techniques classified by the method ink is transferred to the printing substrate,
adapted from ref.50
.........................................................................................................................................20
Figure 1.13 – Schematic draws of the physical printing plates for Letterpress (A), lithography (B), gravure (C)
and screen-printing (D). ..................................................................................................................................20
Figure 2.1 - 2-phenyl-1-benzopyrylium (Flavylium) structure..........................................................................30
Figure 2.2 – Chemical network of 6-Hydroxiflavylium .....................................................................................31
Figure 2. 3 – Dual-type photochromic system proposed by Pina et al.11
..........................................................34
Figure 2.4 – Oxidation mechanism for different polyphenols (Kuromanin19
, Kaempferol19
and Catechin20
). ...36
Figure 2.5 – Proposed two electrons, two protons oxidation mechanism of the 3,5-dimethyl-4-
hydroxychalcone by Nicole Cotelle et al.21
......................................................................................................37
Figure 2.6 - Spectral variations of 6-hydroxyflavylium perchlorate, 3.5x10⁻⁵
M, as a function of pH (acidic
region) at the thermal equilibrium. In order to decrease the reaction time, the solutions were kept at 40 °C
for 7 hours and left to equilibrate for a day at room temperature..................................................................41
Figure 2.7 - Spectral variations of 6-hydroxyflavylium perchlorate, 3.5x10⁻⁵
M, as a function of pH, resulting
from a pH jump from 1, measured after 30 seconds. ......................................................................................42
Figure 2.8 - Spectral variations of 6-hydroxyflavylium perchlorate obtained by stopped-flow after 10 ms of a
pH jump from 1 to the final pH. ......................................................................................................................43

xx
Figure 2.9 - Decay trace of a direct pH jump from 1 to 9.65 (left); decay trace of a reverse pH jump from 6.1 to
2.33 (right). The initial solution at pH=6.1 was prepared from a stock solution at pH=1.0, and used
immediately, before formation of significant amounts of Ct (pseudo-equilibrium state). The decay of the A
form is observed during the direct pH jump, while the formation of the AH+ form is observed during the
reverse pH jump. ............................................................................................................................................44
Figure 2.10 - Kinetics of the zwitterionic base decay followed by stopped flow..............................................44
Figure 2.11 – Proposed kinetic mechanism for the conversion between the form AH+, A and B, previously
described in the literature ..............................................................................................................................45
Figure 2.12 - Observed rate constants upon direct (pH=1 →→→→ pH>1, ) and reverse (pH=6.1 →→→→ pH<6.1, ) pH
jumps. ............................................................................................................................................................47
Figure 2.13 – The cis-trans isomerization of 6-hydroxyflavylium perchlorate at pH=6.5 (left) and the Arrhenius
plot for the same reaction (right). ..................................................................................................................48
Figure 2.14 - Rate constant of the cis-trans isomerization as a function of pH. ...............................................48
Figure 2.15 - Irradiation at 313nm of a freshly prepared solution of 6-hydroxyflavylium perchlorate at pH=6.4.
Inset: absorbance changes at 380 nm.............................................................................................................49
Figure 2.16 - Spectral variations occurring upon a titration of the trans-2,5-dihydroxychalcone under argon
atmosphere, at 25 °C. .....................................................................................................................................50
Figure 2.17 – Cyclic voltammograms of 2.9××××10-4
M trans-2,5-dihydroxychalcone at pH 1, at different scan
rates at 21°C (left). The working electrode was a glassy carbon electrode, the reference electrode was a
Ag/AgCl electrode and as counter-electrode a platinum wire. The experiments were carried out in
hydrochloric acid aqueous solution about pH1.3, containing 1MKCl as supporting electrolyte. Inset: plot of
the anodic peak current vs. square root of scan rate (v), a correlation of 0,99 was found. Comparison of
experimental (full line) and simulated (dots line) cyclic voltammograms of 2,9x10⁻⁴
M 2,5-dihydroxychalcone
at pH 1, run at 0,1Vs-1
(right). Simulation was made using “GPES4.9 commercial voltammetric simulation
package from EcoChemie V.B.” with the following parameters: formal potential, E0 = 0,438V (vs. Ag/AgCl)
and electron transfer coefficient, αααα = 0,48......................................................................................................51
Figure 2.18 - Spectral variations that follow the oxidation (left), and reduction (right) of trans-2,5-
dihydroxychalcone in a mixture of ethanol (60%) and aqueous 0.2 M HCl (40%). The working electrode was a
platinum net electrode, the reference electrode was an Ag/AgCl electrode and as counter-electrode a
platinum wire. The supporting electrolyte was 1MKCl. ..................................................................................52
Figure 2.19 – Electrochemical redox mechanism proposed for the trans-chalcone form of the 6-
hydroxyflavylium............................................................................................................................................52
Figure 2.20 - Molecular orbital potential energy minima, calculated by semi-empirical method for the 4’-
hydroxyflavylium............................................................................................................................................53
Figure 2.21 – Thermodynamics of the 6-hydroxyflavylium chemical network.................................................53
Figure 3.1 – Ring opening of Crystal Violet Lactone. Left: closed ring Crystal Violet Lactone (CVL); Right: open
ring Crystal Violet Lactone (CVOL) ..................................................................................................................61

xxi
Figure 3.2 - (6-NO2,1’N-CH2CH2OH)-BIPS (SPIRO) and ring open merocyanine (MERO) and respective isomers
(MERO-c, MERO-t and MERO-oQ). ..................................................................................................................62
Figure 3.3 - Merocyanine-metal chelate..........................................................................................................63
Figure 3.4 – Chelate formation and decolouration chemical equilibrium adapted from ref.20. ......................63
Figure 3.5 - Absorption spectra of 0.5 mM CVL in the presence of 1 mM Fe(II) (solid line) and 1 mM Fe(III)
(dashed line). On the contrary to Fe(II), the oxidized form Fe(III) opens the lactone ring of CVL.....................66
Figure 3.8 - Spectroelectrochemical data of 300 μM of CVL in the presence of 1 mM of FeCl3:
Chronoabsorptometry followed at the maximum absorbance (631nm) of CVOL (A); Chronoamperometry data
(B); Square wave potential program (C); Picture shows the optical transitions of a mixture of 300μM of CVL
and 1 mM of FeCl3 between anodic electrolysis (blue colour) and cathodic electrolysis (colourless). .............75
Figure 3.10 - Irradiation of the SPI (0.1 mM) in methanol solution and 0.1 M TBAP (left). The same in the
presence of Fe(III) in 2-fold excess (0.2 mM) (right). .......................................................................................77
Figure 3.11 - Cyclic voltammograms of Fe(III) (full line) and SPI (dashed line) in ethanol. Electrochemical
potential required to operate the Fe(III)/Fe(II) redox process does not affect the SPI species. .......................78
Figure 3.12 - Operation of the CMYT colour model based on the three component system: SPI (1 mM), CVL
(35 µµµµM) and Fe(III) (35 µµµµM); methanol, 0.1 M TBAP. Transition between 1 and 2 is controlled by electricity,
transitions between states 2 and 3 and states 3 and 4 are controlled by light. Pictures of the solutions
corresponding to the states 1, 2, 3 and 4 from the left to the rigt...................................................................80
Figure 3.13 - Molar absorption spectra of the coloured species involved in the photoelectrochromic system in
methanol. MERO (full line); MERO-Fe(III) (dotted line); CVOL-Fe(III) (dashed line). ........................................80
Figure 4.1 - 3D geometry of “soluble” Prussian Blue crystal; full circle: Fe(III), open circle: Fe(II) ....................90
Figure 4.2 – General strucuture of salen-type complexes................................................................................92
Figure 4.3 – Proposed polymer strucuture of poly[M(salen)]31
.......................................................................92
Figure 4.4 – Schematic band structure of a dopped semi-conductor. λλλλ1: band-gap; dashed lines: charge
carriers (polarons) ..........................................................................................................................................94
Figure 4.5 – Visual illusion due to different contrast between the object and the surrounding. At the left side
of the image the green strips are actually of the same colour than the blue strips on the right......................95
Figure 4.6 - The CIE 1931 colour-matching functions (ploted with the data from ref.36).................................96
Figure 4.7 – Chromaticity diagram and colorimetric information that can be extracted from it.40
..................99
Figure 4.8 - In situ cronocoulometry/cronoabsorptometry data for PB film deposited on PET/ITO in 0.2 M KCl
aqueous solution as supporting electrolyte. Left: chronoabsorptometry recorded at 690nm (dashed line), CE
(full line). Right: chronoamperometry (full line+full circle), square-wave switching between −0.2 and 0.6V (vs.
Ag/AgCl), step duration of 40s (full line). ......................................................................................................102
Figure 4.9 - CE (dots) calculated from in situ chronocoulometry/chronoabsorptometry (see Fig.4.6).
Chronoabsorptometry cycles recorded at 690nm (full line). .........................................................................103

xxii
Figure 4.10 - Chromaticity coordinates xy obtained by in situ chronocoulomery/chronoabsorptometry for PB
films deposited over PET/ITO. Films with 300s (open square), 600s (open circles) and 150s (open triangles)
deposition time. Note: all the potentials were measured using Ag/AgCl reference. .....................................105
Figure 4.11 - Salen-type complexes of Cu(II), Ni(II) and Pd(II): (A) [M(3-MeOsaltMe)], M=Ni or Cu and (B) [X(3-
Mesalen)], X=Pd. ..........................................................................................................................................106
Figure 4.13 - In situ cronocoulometry/cronoabsorptometry data for Pd film deposited on PET/ITO in
acetonitrile 0.1 M TBAP as supporting electrolyte. Left: Left: chronoabsorptometry recorded at 765nm (full
line), CE (dots). Right: chronoamperometry (full line+full circle), square-wave switching between −0.2 and
0,6V (vs. Ag/AgCl), step duration of 50s (full line).........................................................................................108
Figure 4. 14 - In situ cronocoulometry/cronoabsorptometry data for Cu film deposited on PET/ITO in
acetonitrile 0.1 M TBAP as supporting electrolyte. Left: chronoabsorptometry recorded at 620nm (full line),
CE (dots). Right: chronoamperometry (full line+full circle), square-wave switching between −0.15 and 1.4V
(vs. Ag/AgCl), step duration of 60s (full line).................................................................................................109
Figure 4. 15 – In situ cronocoulometry/cronoabsorptometry data for Ni film deposited on PET/ITO in
acetonitrile 0.1 M TBAP as supporting electrolyte. Left: chronoabsorptometry recorded at 576nm (full line),
CE (dots). Right: chronoamperometry (full line+full circle), square-wave switching between 0 and 1.3V (vs.
Ag/AgCl), step duration of 65s (full line).......................................................................................................109
Figure 5.1 – Cation (sphere) transport mechanism in a polymer based electrolyte. Motion coupled to that of
the polymer chain (up) and transfer of a cation between chains (bottom). ..................................................127
Figure 5.2 – Ionic conductivity (left) and equivalent ionic conductivity (right) of the gel electrolyte at different
salt content in M (the chemical concentration was calculated considering stoichiometric chemical quantity of
LiClO4 and the volume of acetonitrile in the respective mixture; mol LiClO4 divided by the volume of
acetonitrile) at 21ºC. ....................................................................................................................................134
Figure 5.3 – Ionic conductivity (κκκκ) of the clear gel electrolyte as a function of temperature. ........................135
Figure 5.4 - Electrochemical window for gel polymer electrolyte determined by cyclic voltammetry. A two
electrode electrochemical cell was used with the electrolyte film sandwiched in between. The working
electrode was a PET-ITO and the counter electrode and reference electrode was used as a one electrode also
from PET-ITO; clear gel electrolyte (left) and opaque yellow gel electrolyte (right). .....................................136
Figure 5.5 – ECD-R in a symetric “sandwich-like” architecture......................................................................137
Figure 5.6 – Reflectance spectra of ECD-2 at different percentages of doped PEDOT as a function of the
applied electrical potential. Potentials are measure vs. PEDOT/ITO electrode. ............................................138
Figure 5.7 – Left: spectroelectrochemical data for the first cycle operated on the ECD-1 (open circle) and the
ECD-2 (open square) during the coloration process (+0.4V vs. PEDOT/ITO); Right: spectroelectrochemical data
for the first cycle operated on ECD-1 (open circle) and ECD-2 (open square) during the bleaching process (-
1.5V vs. PEDOT/ITO). The insets show a zoom-in for the respective plot, detail on the optical variation during
the first second after the electric trigger is shown........................................................................................139

xxiii
Figure 5.8 – The write-erase cycling stability test data from ECD-1. Left: variation of the reflectance of the
device during write-erase cycling tests, first cycles (full line) and after 1200 cycles (open circle + full line).
Right: square-wave electrical potential used to operate the stability cycling tests of the device (dashed line),
and chronoamperometry data during the stability cycles (full line) ..............................................................140
Figure 5.9 – The write-erase cycling stability test data from ECD-2. Left: variation of the reflectance of the
device during write-erase cycling tests, first cycles (full line) and after 1200 cycles (dots). Right: square-wave
electrical potential used to operate the stability cycling tests of the device (dashed line), and
chronoamperometry data during the initial cycles (full line).........................................................................141
Figure 5.10 – Variation of the reflectance vs. the charge consumed by the ECD-1 (left) and ECD-2 (right). ...143
Figure 5.11 - Spectroelectrochemical data of the complementar PET/ITO/PB/SPE4/PEDOT/ITO/PET ECD in the
coloured state (+1 V vs. PEDOT, dashed line) and bleached state (−1.5 V vs. PEDOT, continuous line). Inset:
Absorbance data at 630nm for the PB/SPE4/PEDOT electrochromic cell as a function of the potential applied.
.....................................................................................................................................................................151
Figure 5.12 - Cyclic voltammogram of the ITO/PB/SPE1/PEDOT/ITO electrochromic cell. The reported cell
voltage is that of PB with respect to PEDOT (vs. PEDOT)...............................................................................152
Figure 5.13 - In situ chronocoulometry/ chronoabsorptometry data for PET/ITO/PB/SPE1/PEDOT/ITO/PET
electrochromic cell during short cycling tests; chronoabsorptometry recorded at 630nm (left),
chronoamperometry (right)..........................................................................................................................153
Figure 5.14 - Full switch in absorbance of the electrochromic cells before (black) and after (grey) 2500 short
cycles (write-erase cycling, conditions presented in Table 5.9); the figure in each column accounts for the
relative variation of full switch of absorbance at 630nm after 2500 short cycles = (ΔA2500 × 100/ΔAinitial) − 100,
see section 1.2.1 ECD parameters. The absorbance at 630nm for the coloured and bleached states for each
cell is the values of the top and at the bottom of each column, respectively. ...............................................155
Figure 5.16 – The total ∆∆∆∆A at 630nm during the write-erase cycling test of the
PET/ITO/PB/SPE5/PEDOT/ITO/PET...............................................................................................................157
Figure 6.1 – Schematic plan of the pipeline of the applied R&D work executed during the IDEIA projects,
YInvisible-Papel, YInvisible-Textil and YInvisible-Quadros. ...........................................................................169
Figure 6.2 – Schematic view of the ECD model for the IDEIA projects. ..........................................................171
Figure 6.3 – Substrate-electrode preparation with an electrical contact. Cupper electrical wires were
connected to the TCO layer through conductive silver glue (left, textile-electrode sample). After the silver
glue is dried epoxy glue is used to seal and give structure to the contact between electrical wire and the
substrate-electrode (right, white board-electrode sample). .........................................................................172
Figure 6.4 – Prussian Blue film electrochemically deposited over a TCO coated white board (white board
electrode). The PB films are highly heterogeneous in all the electrode-substrates tested. ...........................173
Figure 6.5 – Picture of the three electrodes electrochemical cell. Working electrode is the PB modified
FORMICA-electrode, counter-electrode is a platinum wire and reference electrode is a SCE electrode. .......173

xxiv
Figure 6.6 –PEDOT:PSS deposited over paper-electrode (left, by spin-coating), textile-electrode (middle, with
a brush) and board-electrode (right, by spin-coating)...................................................................................174
Figure 6.7 – Images of the optical transition of PEDOT:PSS layer deposited over the paper-electrode by
electrochemical oxidation (left) and electrochemical reduction(right). See experimental details in Table 6.4.
.....................................................................................................................................................................175
Figure 6.8 – Images of the optical transition of PEDOT:PSS layer deposited over the textile-electrode by
electrochemical oxidation (left) and electrochemical reduction (right). See experimental details in Table 6.4.
.....................................................................................................................................................................176
Figure 6.9 – Images of the optical transition of PEDOT:PSS layer deposited over the board-electrode by
electrochemical oxidation (left) and electrochemical reduction (right). See experimental details in Table 6.4.
.....................................................................................................................................................................176
Figure 6.10 – Pictures of the bleached (left) and coloured (right) optical transition of an ECD based on
PEDOT:PSS modified paper-electrode. Electrochromic device architecture: Paper-electrode/PEDOT:PSS/white
opaque electrolyte/PEDOT:PSS/ITO-PET, where the primary electrode is the PET-ITO.................................178
Figure 6. 11 - Pictures of the bleached (left) and coloured (right) optical transition of an ECD based on
PEDOT:PSS modified paper-electrode. Electrochromic device architecture: Paper-electrode/PEDOT:PSS/white
opaque electrolyte/PEDOT:PSS/ITO-PET, where the primary electrode is the paper-electrode....................178
Figure 6.12 - Pictures of the bleached (left) and coloured (right) optical transition of an ECD based on
PEDOT:PSS modified textile silicon coated-electrode. Electrochromic device architecture: Textile silicon
coated-electrode/PEDOT:PSS/yellow opaque electrolyte/PEDOT:PSS/ITO-PET where the primary electrode is
the PET-ITO...................................................................................................................................................179
Figure 6.13 - Pictures of the bleached (left) and coloured (right) optical transition of an ECD based on
PEDOT:PSS coated Flectron N conductive textile. Electrochromic device architecture: Conductive textile-
electrode/PEDOT:PSS/white opaque electrolyte/PEDOT:PSS/ITO-PET, where the primary electrode is the
PET-ITO.........................................................................................................................................................179
Figure 6.14 – Pictures of the bleached (left) and coloured (right) optical transition of an ECD based on
PEDOT:PSS modified white board-electrode. Electrochromic device architecture: White board-
electrode/PEDOT:PSS/opaque electrolyte (white)/PEDOT:PSS/ITO-PET.......................................................180
Figure 6.15 – Variation of the total optical contrast of a paper-ECD during write-erase cycling test. ............182
Figure 6.16 – Pictures of the proof-of-concept paper-ECD. This device shows an electrochromic map of the
Lisbon downtown. The buttons on the bottom of the map will highlight a specific area of interest. The colour
contrast is obtained by the electrochemical control of the coloured and bleached states of the PEDOT layer
deposited over PET-ITO. The counter electrode is PEDOT coated paper-electrode. The opaque gels
electrolytes used were pink (Alfama) and yellow (Bairro Alto). To power the device small flat batteries were
integrated in the map...................................................................................................................................185

xxv
Figure 7. 1 – ECD with a non-patterned electrochromic layer (up) and a patterned electrochromic layer as the
primary electrode. Pictures show the bleached and coloured states for both devices at the left and right side,
respectively. .................................................................................................................................................190
Figure 7.2 – Schematic view of different ink-jet print-head technologies. Continuous mode technology (A),
the drops are deflected by the electric field created between the two plate electrodes at the exit of the
nozzle. The deflection of the drops allows to control the position where the ink land. The deflected drops
(open circle) are collected back to the ink chamber. The non-deflected drops (full circle) land over the
printing substrate. DoD ink-jet technology (B and C). Thermal print-head (B) ejects drops by the rapid
vaporization of the ink at the surface of an electrode inside the ink chamber. Piezoelectric print-head in
bend-mode (C) expulses a jet of ink by the application of pressure in the ink chamber by the stimulus of the
piezoelectric ceramic plate. ..........................................................................................................................192
Figure 7. 3 – Piezoelectric print-head waveform ...........................................................................................194
Figure 7.4 – ECD proposed to assemble with the ink-jet printing technique .................................................196
Figure 7.5 - Representative OpticaTM images captured during PEDOT reliability studies .............................198
Figure 7.6 – Electrolyte consisting in three stacked layers. Clear layer contains polymer, solvent and salt and
the white opaque layer contains solvent, salt and TiO2 nanoparticles. Polymer and TiO2 suspended particles
are not present in the same ink to avoid particle sedimentation (see text). .................................................199
Figure 7.7 – Schematic view of the process to assemble an ECD using ink-jet and lamination techniques. ...202
Figure 7.8 - Ink-jet printed ECD (7 x 7 cm) showing the coloured state (left) and bleached state (right)........202
Figure 7.9 – Schematic representation of the influence of the polymer weight on the ink drop formation.
From the left to the right the weight of the polymer dissolved in the ink-jet ink increases. For low molecular
weight polymers the drop are easily detached from the ink stream and small drops (satellites) are formed.
When the polymer weight is high the drops do not succeed to detach from the ink stream and a “bead-on-a-
string” is observed. The drawings are na adaption from the pictures published in ref.10. ............................203

xxvi

xxvii
Index of Tables
Table 1.1 – Colour perceived as a function of the wavelength of radiation ...................................................... 5
Table 1.2 – Chromogenic systems and related characteristics.........................................................................19
Table 4.1 - Collected data from in situ choronocoulometry/chronoabsorptometry experiments of the PB films
deposited on PET/ITO in 0.2 M KCl aqueous solution ...................................................................................104
Table 4.2 – Colorimetric coordinates collected for PB and PW films deposited over.....................................105
Table 4.3 - Collected data from choronocoulometry/chronoabsorptometry experiments for metal salen-type
films, after one cycle.....................................................................................................................................110
Table 4.4 - In situ cronocoulometry/cronoabsorptometry of the salen-type metal.......................................111
Table 4.5 - Dominant wavelength (λλλλd) for the electrochromic inorganic polymers........................................113
Table 5.1 – Ionic conductivity and equivalent conductivity for gel electrolytes with different percentage of
LiClO4 salt......................................................................................................................................................133
Table 5.2 – Ionic conductivity of the clear and opaque gel electrolytes ........................................................136
Table 5.3 – Ionic conductivity of the electrolyte layer in ECD*-1 and ECD*-2 ................................................137
Table 5.4 – Collected data from spectroelectrochemical experiments for ECD-1, measured before the write-
eras cycling test ............................................................................................................................................142
Table 5.5 – Collected data from spectroelectrochemical experiments for ECD-2, measured before the write-
eras cycling test ............................................................................................................................................142
Table 5.6 – Performance output of the ECD-1 and ECD-2 ..............................................................................144
Table 5.7 - p(TMC)/PEO(X/Y)nLiClO4 electrolytes for application on prototype solid-state electrochromic
devices..........................................................................................................................................................150
Table 5.8 - Spectroelectrochemical data for the different electrochromic cells PB/SPE#/PEDOT. .................153
Table 5.9 - Short cycling conditions...............................................................................................................154
Table 5. 10 - Coloration efficiency parameters for PB/SPE5/PEDOT before and after cycling test stabilities.156
Table 6.1 – Raw materials used in each industry, RENOVA, Filobranca and Bi-Silque....................................169
Table 6.2 – Electrode substrates used during the IDEIA projects...................................................................171
Table 6.3 – Prussian Blue electrodeposition experimental conditions ..........................................................172
Table 6.4 – Electrochromism test of the PB layers by cyclic voltammetry, experimental details ...................174
Table 6.5 - Electrochromism test of the PEDOT:PSS layers by cyclic voltammetry, experimental details.......175
Table 6.6 - Electrochromism test of the PEDOT:PSS layers by chronoamperometry, experimental details ...175
Table 6.7 – Performance of the ECD based on Paper, textile and white board..............................................180
Table 6.8 – Write-erase cycling test results for the ECD based on paper, textile and white board. ...............181
Table 6.9 - Collected data from spectroelectrochemical experiments for paper-ECD, befor the write-erase
cycles ............................................................................................................................................................182

xxviii
Table 7.1 – General ink-jet ink parameters ...................................................................................................195
Table 7.2 - Formulation of PEDOT-F and respective characteristics..............................................................197
Table 7.3 – PEDOT-F jetting reliability monitored for 100 printing nozzles...................................................198
Table 7.4- Formulation of the clear and opaque electrolyte ink....................................................................200
Table 7. 5- Formulation of UV-curing electrolyte layer .................................................................................201

xxix

xxx

xxxi
Preface
The Ph.D. dissertation “Chemical Approaches to Ubiquitous Computing” results from the
collaborative work I developed in the last four years as a joint Ph.D. student between the
Photochemistry and Supramolecular Chemistry research group (FOT, from FCT-UNL) and
YLabs (YDreams Research Division). This Ph.D. work was co-funded by YDreams and
Fundação para a Ciência e a Tecnologia through a BDE scholarship (Bolsa de
Doutoramento em Empresa). All the scientific work was carried out in the facilities of the FOT
Group.
An undefined borderline between fundamental and applied research was the best strategy I
could find to meet the challenges proposed by my supervisors A. Jorge Parola and J.
Fernando Pina (from academia) and Ivan Franco (from YDreams). As a Ph.D. student, my
main objective was to build a knowledge base that would lead to the creation and
development of innovative technologies and projects for YDreams.
Back in 2004, YDreams approached the FOT Group with the intent of exploring chemistry-
based solutions in the area of invisible tags. The successful collaboration from this first
project originated the motivations for my Ph.D. plan. Since that time, chromogenic systems
based on photochromic, thermochromic, ionochromic and electrochromic materials have
been studied and integrated into real devices. The results pointed out that electrochromism is
the most appropriate chemical phenomenon to develop interactive products.
In addition to the results presented in this dissertation, the work developed since that time
created scientific knowledge, intellectual property, new ideas and challenges and, most
importantly, the motivation to grow and continue. All the know-how created in the field of
chromogenic systems and devices is now materialized in the most recent YDreams spin-off –
YDreams Interactive Surfaces.
Today, the R&D team in the laboratory from YDreams Interactive Surfaces is working on its
first generation of chromogenic products to bring them into the market.
The future of YDreams Interactive Surfaces could not be better described than Prof. António
Câmara’s (YDreams CEO) visionary inspiration and thoughts. The text of a futuristic press
release written by Prof. António Câmara is partially transcribed below. With this vision, a new
R&D and Innovation cluster including some of the most important Portuguese industrial
groups have been created – The Invisible Network.

xxxii
“Invisible Computing makes a splash at CES”
Associated Press, Las Vegas, February 18th, 2013
The booth of Invisible Network (IN), a consortium of leading Portuguese companies and
research teams, made a splash at the Consumer Electronics Show in Las Vegas with a new
generation of interactive products based on traditional substrates used as screens (cork,
paper, plastic, textile, wood, glass, concrete, leather and ceramics) and electrochromic inks
(that change color with the use of an electrical current triggered by user interaction).
YDreams Interactive Surfaces, IN leader, used the term “invisible computing” to define the
processes of activating and de-activating pre-programmed information layers, displaying
animations and performing simple computation operations using electrochromic inks. These
inks are deposited onto the different target substrates using ink-jet printing, along with
conductive oxides, energy sources, and other electronic, chemical or biological sensors and
processors. “Invisible computing” requires less energy, provides imagery with higher
resolution and contrast and is faster than conventional computing for trivial visualization
processes.
Examples of more than thirty “invisible computing” surfaces and objects displayed at the IN
booth included an interactive floor flashing way-finding information, a special edition of Time
magazine with interactive graphics, ceramic white boards where calendars and calculators
could be activated and de-activated, plastic bottles that incorporate information displays,
interactive jeans, tables with interactive games, bottles of wine that offered interactive
information and color-changing concrete panels.” by Prof. António Câmara, private
communication.
I wish to thank my scientific supervisors A. Jorge Parola, J. Fernando Pina and the entire
FOT Group not only for the facilities but also for the scientific support during the last four
years that still continues. Prof. António Câmara for the opportunity to take part on the
development of his visionary concepts. YDreams team in special to Edmundo Nobre and my
co-supervisor Ivan Franco for the trust deposited in my work.
Finally, I want to express my debt to the Portuguese State and YDreams for the financial
support.

xxxiii

xxxiv

1
Chapter 1
General Introduction

2
1.1 Motivation
“The technology required for ubiquitous computing comes in three parts: cheap and low-
power computers that include equally convenient displays, a network that ties them all
together, and software systems implementing ubiquitous applications.” in “The Computer for
the 21st Century” by Mark Weiser.1
Mark Weiser’s vision of computing and society predicts the so-called third wave of computing
- ubiquitous computing (UC). Mark Weiser resumes the relationship between computers and
society in three main eras related with technology development and usability. In the first era,
one computer was shared by several people – mainframe era. In the second era, one
computer belongs to one person – personal computer era.2 Finally, the upcoming era will be
the UC era, where computers will spread all around us and the computer to person ratio will
be much larger than ever before.
Presently we are living in the personal computing era, however, the decline in laptop prices,
the proliferation of small and mobile devices equipped with strong processors and the
dissemination of the internet are preparing our society towards UC. In a not so futuristic
scenario, customized computers will integrate our surrounding embedded in the objects of
our daily life. Functionalities will be added to common objects, they will turn more interactive
and smart. Information will be available without any conscious input from the user; computers
will integrate symbiotically our environment and costumes in such a way that they become
invisible.
Convenient, cheap and low-power consumption displays are some of the challenges
predicted by Mark Weiser to the development of UC. The information can be processed in a
completely different physical place from the end-user, the computer can be off-site (for
example, weather forecast); however, communication of the results must happen in loco.
Processing information without an effective communication is useless.
Visual communication is one of the most primitive ways humankind uses to communicate
and record information. The oldest evidences of visual communication are from ca. 40000
years ago3 in the form of paintings in caves and still have an enormous presence in our
society. Pictograms are still the best way to produce effective communication; a good
example is traffic signs. On the other hand, colours by themselves are also able to transmit
information or feelings.
UC is strongly dependent on the development of ubiquitous displays. Such displays should
harmoniously integrate our surroundings, should be embedded in almost all daily life objects,
for example in a cup of coffee, in a pillow, in a sheet of paper, in a chair, in a wall, in a t-shirt.
Such applications require flexible, low power consuming, thin and miniaturized devices.
State-of-the-art displays are unsuitable for ubiquitous applications; cathode ray tube (CRT)

3
are bulky size, high weight and energy demanding, plasma technology is also a power
consuming technology ant not liable to miniaturization.4 Companies like Siemens, Fujitsu,
Xerox, DuPont, Sony, Siemens and Phillips are investing significant resources in the
development of transparent, flexible and energy efficient displays using alternative
technologies. The most recent examples are based on the organic light emitting diodes
(OLED), electrophoretic suspended particles displays, electro-wetting displays and
electrochromic displays.4 The strategy adopted by such companies is always based on the
highly technology demanding matrix of pixels to reach video and image on demand
capabilities. However, we believe that this is neither the only nor the most successful way to
reach information ubiquity.
At the same time as computers will spread around us, their complexity and multi-function
capacity should inversely decrease. It is a waste of resources and energy to use powerful
processors to run simple tasks for specific situations. Ubiquitous computing should be
shaped for minimal architecture to process customized information. For sure, we do not want
our cup of coffee to perform mathematical calculus! The same holds for the displays
technology. António Câmara (CEO of YDreams Company) identified a technological gap
between static information displays, like an advertisement poster, and state-of-the art
displays.
“Chemical Approaches to Ubiquitous Computing” is a Ph.D. project that aims to study and
develop low information content displays based on chemical solutions. A brief exposure of
the chemical and technology background involved in this work is presented in this chapter; at
the end, an outline of the work is presented.
1.2 Chromogenic Systems and Applications (Background)
For a long time chromogenic compounds and materials have been studied and explored in
different scientific fields like, analytical chemistry (e.g. acid-base titration, complexometric
titration), physical chemistry5, smart materials6 and even in art.7 As a general definition
chromogenic systems are those which produce (-gen, from Latin genus = produce) colour
(chromo-, from Greek khrōma = colour). IUPAC does not define the term chromogenic and
different interpretations can be found in the literature. Nevertheless, in this work the
chromogenic term is defined as a compound, material or system that undergoes reversible
colour transition between two or more states, triggered by an external stimulus. The optical
transition should be in the visible range between two or more differentiable coloured states or
between a colourless and a coloured state.

4
Since Isaac Newton’s experiments about optics, colours are known as the elementary
components of light. In 1704 Newton’s conclusions about light and colour abolished the basic
fundamentals that ruled colour knowledge since Aristotle and set a new age for colour
science and optics.8 Light interaction with bulk matter can result in reflection, scattering,
absorption and transmission of light (see Fig.1.1). Depending on the light and the nature of
the object, several of these phenomena can happen at the same time.
Light
Reflectance
Transmittance
Reflectance
Absorption
Scattering
Scattering
Object
Figure 1.1 – Light interaction with matter; reflectance, scattering, absorption and transmittance
Colour genesis is explained by physical and chemical mechanisms. Kurt Nassau9 gives a
more detailed classification of colour generation based on these two mechanisms: i) vibration
and simple excitations of electrons; ii) electronic transitions involving ligand field effects; iii)
transitions between molecular orbital; iv) transitions involving energy bands; v) geometrical
and physical optics. Physical optics are responsible for the blue sky, rainbows, red sunset,
iridescent colours in fauna and for the spectral decomposition of white light by a prism.
Geometrical and physical optics deal whit the different interactions between light and bulk
material - refraction, scattering and interference.
Chemical colour results from the perfect match in energy between the visible electromagnetic
radiation (380 - 780nm) with electrons and their electronic energy levels in chemical species.
Electromagnetic wavelengths lower than ultra-violet radiation (UV, <200nm) are too energetic
and molecular structures are usually irreversibly destroyed or altered. On the other hand,
electromagnetic radiation with wavelengths higher than 780nm up to the near infrared region
radiation (NIR) can still interact with several kinds of compounds (strongly conjugated
organic molecules, some metal complexes with d-d or f-f transitions); however, we humans
are not able to see this interactions.
The colour of the majority of the chromogenic systems arises from the partial absorption of
the visible electromagnetic radiation, resulting from the interactions between light (380nm-
780nm) and electrons. In Table 1.1, an approximation of the colour perceived based on
wavelength of the radiation absorbed by the system is shown.

5
Table 1.1 – Colour perceived as a function of the wavelength of radiation
Absorbed Wavelength (nm) Colour of the absorbed light Observed object colour
400 Violet Green-yellowish
425 Indigo blue Yellow
450 Blue Orange
490 Green-bluish Red
510 Green Purple
530 Green-yellowish Violet
550 Yellow Indigo blue
590 Orange Blue
640 Purple Green bluish
730 Red Green
The next sections are organized in function of the extend stimulus that leads to colour
change and describe the most relevant chromogenic application for each area.
1.2.1 Electricity
Electrochromic materials have the ability to change reversibly its colour properties
(coloration/bleaching) when submitted to a determined electric potential. Electrochromism
can occur either by an electron-transfer process (redox electrochromism) or as a response to
strong enough electric potential (non-redox electrochromism).
Originally, the term electrochromism was attributed to the shift of the UV-Vis bands due to
the presence of a strong electric field - Stark effect.10 The Stark effect is a non-redox
electrochromic phenomenon.11 Nevertheless, the majority of the reported electrochromic
systems are redox electrochromism (see Eq.1.1). In the following text, the term
electrochromism is always related to the redox electrochromism.
Oxidized form (colour A) + electron(s), e- → Reduced form (colour B) Eq. 1.1
A great number of chemical systems are reported in the literature using either inorganic
compounds such as transition metal oxides and metal hexacyanometallates, organic
compounds such as viologens, conducting polymers, metallopolymers and metal
phthalocyanines.12 A particular class of materials show activity only in the NIR region and do
not present colour variation upon reduction or oxidation, however, they are still considered as
electrochromic materials. Despite the large number of electrochromic materials reported so
far, few are those that show relative good performance for applications. The “big player”

6
electrochromes are: methyl viologen (MV)13, tungsten oxide (WO3)14, Prussian Blue (PB)15
and the semiconductor polythiophene derivative PEDOT (poly(ethylene dioxythiophene).16
Electrochromic Devices
An electrochromic device (ECD) can be regarded as an electrochemical cell where colour
changes occur upon electrochemical reactions of two or more redox active electrochromic
materials electrically connected by an external circuit and physically separated by an ionic
conducting layer (electrolyte layer), see Fig.1.2. The electrochromic material must be in
contact with the electrode and with the electrolyte layer to exchange both electrons and ions,
respectively. ECD performance is greatly influenced by both the electron exchange and ions
exchange kinetics and ultimately controlled by the slowest process. The colouration and
bleaching processes are controlled by the amount of the overvoltage and polarity applied at
the electrode terminals.
Conductive layer Electroactive material
Electrode substrate
Electrolyte layer
External electric circuitand Power supply
Figure 1.2 – Example of an electrochromic device with the “sandwich” like architecture.
An ECD requires two electroactive materials and at least one of them must be
electrochromic. The electrochemical reduction in one of the electrodes is balanced
electrically by the electrochemical oxidation at the second electrode. In a second
implementation, both electroactive materials can be electrochromic, resulting in either a
complementary configuration or a symmetrical configuration.
Complementary ECD shows a synchronised colouration and bleaching response from both
electrodes. It is worth to note that bleaching process should not be restricted to the transition
from a coloured state to a colourless state, but also a transition to a second coloured state;
for example, poly(3-hexylthiophene) presents a transition colour between blue and red. This
ECD configuration requires that one of the electrodes present a cathodically colouring
process, while the second has an anodically colouring process.

7
On the other hand, symmetrical configuration results when the same electrochromic material
is used at both electrodes. An opaque layer is within the electrolyte layer to mask the
colouration process occurring at the second electrode. The symmetric cell presents a non-
synchronised colouration and bleaching response from the two electrodes, while one is
coloured the other is bleached and vice-versa.
To observe successfully the colour transition of ECD at least one of the electrodes substrate
must be optically transparent. The most common electrodes substrates are glass (non-
flexible applications) or a plastic film (the most common are the polyethylene terephthalate,
PET and polyethylene naphthalate, PEN used for flexible applications) coated with a thin film
of a transparent conductive oxide (TCO); tin-doped indium oxide (ITO) or the fluorine-doped
tin oxide (FTO). Several substrate-TCO alternatives are commercially available whereas
glass-ITO, PET-ITO and FTO-ITO are the most reported in the literature. As defined by
Rosseinsky et al11 the electrode where the colour transition is observed should be called the
primary electrode and the second the counter-electrode. In this case, the primary electrode
must always be optically transparent while the counter-electrode can be either completely
transparent or reflective.
The electrolyte layer ensures the electroneutrality of the device cancelling charge
accumulation at the surface of the electrodes during the redox process. Different systems
can be used from simple salt dissolved in a liquid solvent to inorganic super ionic
conductors.17,18,19,20

8
ECD can be operated in the transmittance (ECD-T) or in the reflectance (ECD-R) mode (see
Fig.1.3).
Incident light
Incident light
Emergent light(Transmittance)
Emergent light(Reflectance)
A
B
Incident light
Incident light
Emergent light(Transmittance)
Emergent light(Reflectance)
A
B
Figure 1.3 – ECD in transmittance mode (A), and in reflectance mode (B)
The ECD-T requires that both the primary and the counter-electrodes are optically
transparent. On the other hand, the ECD-R only requires one optically transparent electrode;
the other electrode can be made of a thin metallic reflective film, like graphite, gold or
platinum alloys. The incorporation of a light scattering layer over the counter-electrode or
within the electrolyte layer improves the reflectance characteristics of the ECD-R (see
Fig.1.5). A large variety of ECD combinations can be explored depending on the specific
application. As an example, ECD-R the reflective layer can take different colour appearance
and create new colour combinations with the colours of the electrochromic materials.
Through the text, the nomenclature adopted to describe a specific ECD will be as follows:
Electrode-1/Electrochrome-1/Electrolyte/Electrochrome-2/Electrode-2; similar to the one
used to define a two-compartment electrochemical cell.

9
ECD Parameters
The full characterization of an ECD includes determination of parameters such as: contrast
ratio (CR), response time (τ), write-erase efficiency, stability towards cycling tests, power
consumption and coloration efficiency (CE).11
CR is a measure to denote the intensity of colour formed, as seen by eye (see Eq.1.2).
xR
R0=CR Eq. 1.2
Where Rx is the intensity of light reflected diffusely by the coloured state of the device, and
R0 is the intensity of reflected light from a non-shiny white card.11
The write-erase efficiency corresponds to the fraction of the originally formed coloration that
can be subsequently electro-bleached. For complete reversible electrochromes, the value
should be 100%. The write-erase efficiency is however related with the time during which
electric potential is applied, slower systems will require longer time to recover completely the
initial state. Considering the application requirement the systems may or may not be able to
recover completely the original state. Great variability of experimental conditions have been
reported to calculate the write-erase efficiency of electrochromic systems, the results
reported are not directly comparable.
Power consumption can be calculated for both coloration and bleaching process by Eq.1.3.
∫∆=ft
tdttIE
0
)(V Eq. 1.3
Where ∆V is the amount of electrical potential applied to the ECD and I(t) is the current spent
during the cycle.
The stability of the ECD to the number of electrochemical cycles (write-erase cycles or
cycling) represents the number of cycles that can be performed before significant extent of
degradation has occurred. The maximum colour variation of a specific ECD-R and the ECD-
T (Full switch), between the bleached and the coloured states, is measured at the beginning
of the cycling experiment at a specified wavelength (λnm): ∆%Rλnm,0, ∆%Tλnm,0, respectively. A
double potential step voltage function is applied to ECD in order to operate a full cycle (i.e. a
Full switch): write-erase (colouration-bleaching) and vice versa. The comparison of the
maximum colour variation (100% of Full switch) after the operation of n cycles, ∆%Rλnm,n or
∆%Tλnm,n with ∆%Rx,λnm,0, ∆%Tλnm,0, values allows to calculate the loss of colour variation
(see Eq. 1.4 for ECD-R, when working in transmittance ∆%R is substituted by ∆%T).

10
0,
,
%
100%100
nm
nnm
R
Rvariation colour of loss %
λ
λ
∆
×∆−= Eq. 1. 4
The CE of the electrochromic system is defined by Reynolds et al.21 as follows in Eq.1.5 and
1.6, for ECD-T and ECD-R respectively:
'
,,
Q
ACE
nnmx
∆
∆=
λ Eq. 1.5
'
% ,,
Q
RCE
nnmx
∆
∆=
λ Eq. 1.6
where ∆%Rx,λnm,n and ∆%Tx,λnm,n is the x percentage of full swithc. i.e. the fraction of ∆%Rλnm,n
and ∆%Tλnm,n respectively, and Q’ is the amount of charge per unit of active electrochromic
area passed during the respective period of time.
Spectroelectrochemistry
Spectroelectrochemistry (SEC) is the most useful characterization procedure for
electrochromic materials and devices. SEC combines electrochemistry and spectroscopy
techniques. In a specially designed electrochemical cell, a redox active compound is oxidised
or reduced. The products of the redox transformation are monitored in situ by spectroscopic
techniques. In the particular case of chromogenic systems, the UV-Vis spectroscopy is used.
In the case of electrochromic films deposited over PET-ITO electrodes, the three electrodes
electrochemical cell is mounted in the UV-Vis spectrophotometer cuvette. On the other hand,
ECD are directly inserted in the spectrophotometer sample compartment in a perpendicular
geometry with the beam of light. The diffuse reflection of the ECD-R is recorded by an
integrating sphere.
The electrochromic systems can be controlled both by potentiostatic and potentiodinamic
techniques; at the same time, the UV-Vis data is recorded either in absorbance or in
reflectance mode. The typical outcome of the SEC experiments is the absorbance
(chronoabsorptometry, ∆A or ∆%T) or reflectance (∆%R) evolution of the system. On the
other hand, the current evolution of the system gives the chronoamperometry or
chronocoulometry data.

11
Commercial applications
Electrochromic materials have been attracting considerable attention due to their potential
applications as controlled optical filter and visual displays. Product applications are self-
darkening rear-view mirrors, smart windows, electronic paper and smart labels. Despite the
first patent describing the application of an electrochromic effect dates from 192922, the
number of successful commercial applications of ECD is reduced. Actually, the only known
profitable ECD application is the best-selling electrochromic rear-view mirror from Gentex.
Self-darkening rear-view mirror and windows
The auto-dimming rear-view mirrors reduce the inconvenient and sometimes dangerous
headlight glare from the vehicles travelling behind, disturbing the driver. Gentex is the
company leading the auto-dimming automotive market.23 The scientist responsible for the
invention of the electrochromic rear-view mirror is the chemist Dr. Harlan Byker. Today Dr.
Harlan Byker is president and owner of the Pleotint Company (developing thermochromic
windows).
The rear-view mirrors from Gentex incorporate a light sensor that detects when headlight
glare occurs and triggers the electrical potential of the ECD built in the rear-view. The ECD
architecture is based on the reflective mode (ECD-R) and the redox active material are
dissolved in the liquid electrolyte layer. The electrical potential promotes the electrochemical
colouration of the primary electrode and the colouration of the counter-electrode using a
complementary colouring electrochromic material. When the electrical potential is removed,
both electroactive materials will diffuse away from the electrodes. The recombination of the
oxidised and reduced species will promote the bleaching process chemically. The bleaching
time will be controlled by the diffusion of the electrochromic species, however, the process
can also be accelerated if an opposite electrical potential (compared to the one used to
trigger colouration) is imposed between the electrodes for a short period of time.
A second application of self-coloured ECD has been applied for “smart-windows”.24 Smart
windows were applied in special architectural projects like the switchable glazing applied in
the Stadtsparkasse Dresden am Altmarkt in Dresden and also for first class airplane
passenger windows in the “Dreamliner” Boeing aircraft.25 At present, SAGE Electrochromics,
Inc. is the only manufacturer selling electrochromic insulating glass units.26
Displays
Another interesting application of ECD is in the field of visual displays. The ECD-R is the
preferred configuration for display application, because it presents higher CR when
compared with ECD-T. As opposed to emissive traditional displays, ECD is a colour
subtractive display. The advantages to be a colour subtractive technology are the wide
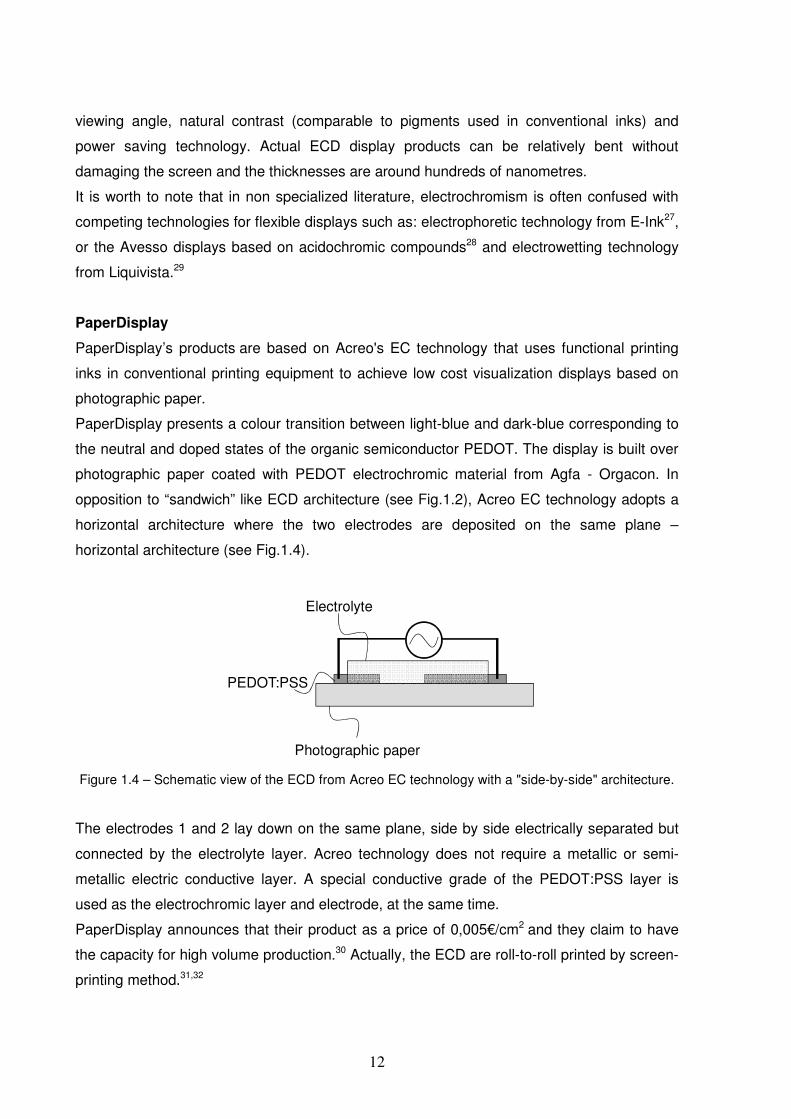
12
viewing angle, natural contrast (comparable to pigments used in conventional inks) and
power saving technology. Actual ECD display products can be relatively bent without
damaging the screen and the thicknesses are around hundreds of nanometres.
It is worth to note that in non specialized literature, electrochromism is often confused with
competing technologies for flexible displays such as: electrophoretic technology from E-Ink27,
or the Avesso displays based on acidochromic compounds28 and electrowetting technology
from Liquivista.29
PaperDisplay
PaperDisplay’s products are based on Acreo's EC technology that uses functional printing
inks in conventional printing equipment to achieve low cost visualization displays based on
photographic paper.
PaperDisplay presents a colour transition between light-blue and dark-blue corresponding to
the neutral and doped states of the organic semiconductor PEDOT. The display is built over
photographic paper coated with PEDOT electrochromic material from Agfa - Orgacon. In
opposition to “sandwich” like ECD architecture (see Fig.1.2), Acreo EC technology adopts a
horizontal architecture where the two electrodes are deposited on the same plane –
horizontal architecture (see Fig.1.4).
Electrolyte
PEDOT:PSS
Photographic paper Figure 1.4 – Schematic view of the ECD from Acreo EC technology with a "side-by-side" architecture.
The electrodes 1 and 2 lay down on the same plane, side by side electrically separated but
connected by the electrolyte layer. Acreo technology does not require a metallic or semi-
metallic electric conductive layer. A special conductive grade of the PEDOT:PSS layer is
used as the electrochromic layer and electrode, at the same time.
PaperDisplay announces that their product as a price of 0,005€/cm2 and they claim to have
the capacity for high volume production.30 Actually, the ECD are roll-to-roll printed by screen-
printing method.31,32

13
NTera
NTera developed electrochromic displays with the trademark NanoChromic Display (NCD).
The ECD architecture used is based on the “sandwich” like architecture working in a
reflective mode (see Fig.1.5).
1 2 Figure 1.5 – ECD architecture employed by NTera where the primary electrode is composed by a
chemisorbed viologen derivative on the surface of TiO2 nanoparticles (coated PET-ITO) (1), a
dispersion of light scattering TiO2 nanoparticles is incorporated in the electrolyte layer (2).
The electrochromic layer (see Fig. 1.5, 1) is made with a phosphonated viologen derivative
that is adsorbed to titanium dioxide (TiO2) nanoparticles. This strategy is similar to the one
proposed in dye sensitized solar cells (DSSC) by Grätzel.33 This strategy has the advantages
of, i) increase the concentration of electrochromic molecules pre electrode area and ii) avoids
diffusion of the electrochrome away from the electrode. The NCD is based on transparent
plastic and the semi-metal conductive layer is fluorine-doped tin oxide.11 The reflective mode
was used to improve the CR. The light scattering layer is also composed by TiO2
nanoparticles within the electrolyte layer.
NCD are also built by printing techniques such as screen-printing, flexography and ink-jet.
The NTera company is the only known fabricant commercializing screen-printable inks that
allow to build an ECD based on the NanoChromic technology.34
1.2.2 Light
Reversible transformation of a molecular system between two forms, A and B, having
different absorption spectra, induced in one or both directions by absorption of
electromagnetic radiation is the definition of photochromism. The spectral change produced
is typically, but not necessarily, of visible colour and is accompanied by differences in other
physical properties.35

14
Eq. 1.7
Eq. 1.8
Accordingly to the photochemical backward reaction, systems can be classified in T-type, P-
type or both at the same time. Considering a photochemical reactive species, A which is
photochemically converted to B, the backward reaction can be controlled either thermally (T-
type system, Eq. 1.7) or by light excitation (P-type system, Eq. 1.8) and depending on the
activation energy for the backwards reaction (B to A) and on the operation temperature both
processes can take place.
Spiropyrans, spirooxazines and chromenes are examples of T-type photochromic systems
(see Fig.1.6), while fulgides and diarylethenes are characterized to be P-type photochromic
(see Fig.1.7).36
N O N O
N
O
A B
C Figure 1.6 – T-type photochromic compounds, spiropyrans (A), spirooxazines (B) and chromenes (C)
Figure 1.7 – P-type photochromic compounds, fulgides (A) and diarylethenes (B)
hν
A (colourless) B (coloured)
∆
hν
A (colourless) B (coloured)
hν'

15
Commercial Products
One of the most cited photochromic product is the silver halide photochromic ophthalmic
lenses. Launched in 1966 by Corning Inc (Photogray lens).37 Inorganic based systems have
been successfully used in glass lenses. The introduction of plastic in the manufacture of
ophthalmic lenses determined the progressive substitution of the silver halide system by
spirooxazines and chromene photochromic organic compounds. Organic photochromic
lenses were introduced in the market with the commercial name Transitions by PPG
Industries and Essilor International.38
Commercial photochromic products are also found in printed photochromic logos on T-shirts
or other pieces of textile for clothing. Other similar applications have been used on children’s
toys.6
Photochromic dyes under the trade name of Reversacol are available in twenty different
colours from Vivimed Labs Europe Ltd.39 These inks are based on organic photochromic
compounds and can be used as a organic dye in inks, paints and incorporated in plastics
such as PE, PP, PVC. Photochromic ink formulations are available for printing by gravure,
offset, flexographic, pad printing, lithography and screen printing techniques.40
1.2.3 Ions
The presence of ionic species such as protons or metal ions can trigger the colour transition
of a system; a phenomenon called ionochromism. Ionochromism also includes acidochromic
compounds, which show colour transition depending specifically on the presence of H+ ions.
Some authors consider the previous phenomena as distinct; nevertheless, it is acceptable to
merge all this phenomena in the ionochromism term.
Classical examples of acidochromic systems are all the pH indicators such as the methyl red
(see Fig. 1.8).
Figure 1.8 – Acidochromism mechanism of the Methyl Red, the base form is colourless and at a pH =
4.4 the azonium for is red.
A large number of ionochromic compounds belong to the family of the leuco dyes. The term
leuco, meaning white, comes from the Greek Leukos and is used to characterize the
uncoloured state of the (reversibly) reduced state of any kind of dye. Although initially the

16
term leuco was applied to the reduced form of a dye, the term leuco dye has been used also
to describe the colourless form of a dye that may be produced by a non-reductive process,
as for example, in the case of intramolecular cyclization, reactions induced by pH change,
heat, or light.
Commercial Application
The ionochromism phenomena have been used in analytical chemistry, carbonless copy
paper and thermal recording paper. Analytical chemistry techniques explore the colour
transition of ionochromic compounds to detect and quantify the presence of hydrogen ions
(pH indicators or acid-base titrations) and metal ions in complexometric titrations.37
The carbonless copy paper is a handwritten or mechanically typed duplicating process
developed to substitute the carbon paper. The simplest carbonless copy paper is composed
by two sheets of paper overlaying on top of each other. The top page is undercoated with
microencapsulated ionochromic dye known as the colour former, e.g. Crystal Violet Lactone,
in a non-volatile solvent. The pressure of the pen causes the microcapsules to break,
exposing the dye precursor to a developer that is coated on the top of the lower sheet;
usually an acidic material, which can be selected from acidic clays, zinc salicylate and
phenolic resins are used as the coating layer. For multiple copies, intermediate sheets are
coated on both top (reagent to react with the dye precursor on the sheet above) and bottom
(microcapsules of dye precursor to react with the reagent on the sheet below).41,42
1.2.4 Electricity and light or ions and light
A higher level of complexity is presented by the chromogenic systems that respond to two
different external stimuli. Dual-mode chromogenic systems have been described to be
responsive both to electricity (electrochromism) and light (photochromism) and to light and
ions (ionochromism). In such a case, electrochromism, photochromism and ionochromism
are observed within the same system.
Branda et al. reported the dual-mode photochromism and electrochromism of a 1,2-
bis(dithienyl)cyclopentene derivative (see Fig. 1.9). The colourless (pale yellow) ring-open
form can be converted to the deep-blue coloured ring-closed form, both by UV radiation and
oxidative electrochemical reaction.

17
Figure 1.9 – Dual-mode photochromism and electrochromism of the 1,2-bis(2-methyl-5,2’-dithiophen-
3-yl)perfluorocyclopentene, the pale yellow ring-open form (A) is converted both by an electrical
potential and by UV light to the coloured ring-closed form (B)
The system shows good thermal stability of the coloured form, however, a slight
electrochemical degradation during the anodically colouring step is observed. The systems
may be reversibly converted to the bleached state by the stimulus of visible light.43,44 The
coloured ring-closed form is thermally stable, however, it may suffer from degradation if
overoxidation occurs. The oxometalate compounds (e.g. WO3) are another class of dual-
mode chromogenic systems responsive to both electricity and light.45
Dual-mode systems, responsive to light and ions, were also reported (see Fig.1.10). The ring
opening of the crown ether-link spirobenzopyran is triggered by metal ions and UV light. The
system changes from the colourless closed-ring state to the pink open-ring state. The back-
reaction to the bleached state (closed-ring) is operated with visible light irradiation.
Figure 1.10 – The spiropyrans bearing a monoaza-crown shows dual-mode photochromic and
ionochromic properties.
In opposition to the former systems where only one molecule is responsive to two external
stimuli, other dual-mode systems can be obtained by the combination of two or more
molecules. A photochromic and electrochromic device has been proposed to operate as a
photoelectrochromic device (P-ECD).46,47
The P-ECD can be assembled using at the primary electrode a layer of electrochromic WO3
film and at the counter-electrode a layer of the photovoltaic dye doped TiO2 film. This device

18
requires that both electrodes are optically transparent to maximise the light absorption from
the photoactive dye doped TiO2 layer. The P-ECD can be envisaged as a DSSC proposed by
Gratzel33, however, the I2/I3- redox relay is substituted by a redox active chromogenic layer.
When the device is exposed to sunlight, the photovoltaic layer will produce a sufficient
voltage to reduce the WO3 film to the coloured state. The photoinduced transfer of electrons
from the semiconducting TiO2 layer powers the darkening of the electrochromic layer (see
Fig. 1.11). The process is only reverted if light is removed and both electrodes are short-
circuited or if an opposite electrical potential is applied to the system to revert the process.
Independently the P-ECD can be powered as a normal ECD by an external source of
electrical power. The advantages of such dual-mode device is the low-power requirement of
the system when sunlight is supplied, the P-ECD darkening can be automatically triggered by
light and it can also be operated on demand with electricity.
1 2
Electrons flow
Light
Figure 1.11 – Example of the operation of a P-ECD by light. Electrons are ejected from the
photovoltaic layer (1) and reduction of the electrochromic WO3 layer will cause the darkening of the
device.
Commercial Applications
Dual-mode chromogenic systems based on a single molecule or on a combination of two or
more molecules have shown great interest from academia, as seen above. They show an
increase in complexity when compared with the classical chromogenic systems that allow to
reach a multistimulus operated system. Despite the interesting characteristics of dual-mode
systems, no commercial application is known as far as we know. The only dual-mode system
able to reach the market soon should be the P-ECD.

19
1.2.5 Temperature, polarity, mechanical pressure and mechanical friction
The chromogenic systems stimulated by electricity, light, ions and combinations thereof
described in the previous paragraphs are only a part of the chromogenic systems known.
Other systems, like the thermochromism, are of great importance both for academia and for
industry. Despite the relevance of the remaining systems, they fall out of the scope of this
thesis. In Table 1.2, general information of ot\her chromogenic systems is listed.
Table 1.2 – Chromogenic systems and related characteristics
Phenomena Stimulus Commercial applications
Thermochromism Temperature Printed thermometers, textile for clothing interactive logos
Solvatochromism Polarity Humidity sensors
Piezochromism Mechanical Pressure -
Tribocromism Mechanical friction -
1.3 Industrial Printing Techniques
At the basis of every application of a chromogenic compound, there is the need for
deposition techniques. The laboratory scale technology is useless when it is required to
produce one million of devices for a client. High-volume manufacturing requires adequate
industrial processes and the scale-up study of the technology is essential. Production of
high-tech products, such as flexible displays, are adopting cheaper conventional graphics
printing techniques instead of costly microfabrication processes.48
The microfabrication techniques are widely used in microelectronics; microchips, thin film
transistors, microelectromechanical systems are produced by a subtractive approach were
patterning is accomplished with photolithography and etching processes. In opposition to
microfabrication, the graphic printing techniques are additive processes and widely available
both at the pilot and industrial scale. It has been reported that the cost for printing a square
centimetre is 0.00001$ with offset and 3$ with high resolution photolithography.49
Graphic printing techniques are divided into impact printing techniques (IP) and non-impact
printing techniques (NIP). The image-carrying medium in IP consists on a physical printing
plate, while NIP is digitally controlled and the image-carrying medium is bits of information.

20
Graphic Printing Techniques
Impact Printing(IP)
Letterpress
Lithography
Gravure
Screen-printing
Non-impact printing(NIP)
Photography
Electrophotography
Ink-jet
…
Figure 1.12 – Graphic printing techniques classified by the method ink is transferred to the printing
substrate, adapted from ref.50
In IP, the ink is transferred by contact to the printing substrate accordingly to the print image
information. Numerous printing techniques and combinations of printing techniques are
available. The most representative IP techniques are screen-printing, letterpress, lithography
and gravure. In Fig.1.13, the four main IP technologies are compared regarding the image
carrier or printing plate.
A B
DC
Ink
Image carrier
Figure 1.13 – Schematic draws of the physical printing plates for Letterpress (A), lithography (B),
gravure (C) and screen-printing (D).

21
NIP is based on digital image information that allows to produce successive pages with
different printed images. The most important techniques in this class is the ink-jet printing
(IJ). IJ has completely invaded our life both at work and at home. The technology allows to
print high quality photo with a relative low cost. The IJ techniques rely on the controlled
ejection of droplets of ink by waves of pressure created in a chamber where the ink is stored
(cartridge). The IJ technique has been proposed as a potential technique for printed
electronics. Ink-jet technology presents several advantages for the production of high-tech
products such as high resolution, low temperature, scalable, customization, low power and
low cost. The main disadvantage found in IJ technology is the printing speed (1200 A3 pages
per hour) compared to high output printing techniques like offset (15000 A3 pages per
hour)50; however, the main IJ technology developers like HP and Xaar are working to
increase the printing speed.
1.4 Outline
The objective of the present work is to explore new chromogenic system for low information
content visual displays. In chapter 2 a derivative of the organic flavylium salt 6-
hydroxyflavylium, is explored as a dual-mode electrochromic and photochromic chromogenic
system. A more complex chromogenic system was developed in chapter 3. The
multicomponent and multistimulus system is composed by the leuco dye Crystal Violet
Lactone, a derivative of the spirobenzopyran family and Fe(II)/Fe(III) ions. The system shows
a four colour state system controlled by the sequential action of electricity and light. All the
work reported in chapters 2 and 3 were done in the liquid phase.
In chapter 4, colorimetric studies were performed to several electrochromic films based on
inorganic polymers using spectroelectrochemical techniques. The electrochromes reported
are the Prussian Blue and a new class of electrochromic films based on the
electropolymerized salen based metal complexes. The Prussian Blue polymer is an example
of a colourless to coloured state transition while the salen based metal complexes polymers
present a transition between two coloured states.
In chapter 5, several non-liquid electrolytes were developed to apply in ECD. The results of
the optimization of a gel electrolyte medium are presented. A comparative study on the effect
of the ionic conductivity of the electrolyte layer and the ECD performances is reported.
The final part of the thesis, chapters 6 and 7, reports on the results obtained from the R&D
projects involving several academic and industrial partners. The objective of these projects
was to add new functionalities to the conventional products, copy paper (YInvisible-Papel
project), textile (YInvisible-Textil project) and white-boards (YInvisible-Quadros project). The
strategy adopted was to investigate the development of build-in ECD over non-conventional

22
substrates. Chapter 6 describes the results obtained by the consortium to obtain ECD based
on paper, textile and white-board. The chapter 7 reports on the viability study to build
electrochromic devices using pilot scale IJ printing. Finally the chapter 8 the list of
publications that are a direct or an indirect result from the present thesis is given.
In each chapter there is an introduction section with detailed introduction about the
chromogenic chemical compounds, therefore this information was not included in the
General Introduction section.
23
1.5 Bibliography
1. Weiser, M., The computer for the 21st-century. Scientific American 1991, 265 (3), 94-
104.
2. Weiser, M.; Brown, J. S. 1996. The coming age of calm technology [Online].
Available: http://www.ubiq.com/hypertext/weiser/acmfuture2endnote.htm [Accessed
July, 2010 2010].
3. Ayiter, E. The history of visual communication [Online]. Available:
http://www.citrinitas.com/history_of_viscom/rockandcaves.html [Accessed July 2010
2010].
4. Hilsum, C., Flat-panel electronic displays: a triumph of physics, chemistry and
engineering. Philosophical Transactions of the Royal Society a-Mathematical Physical
and Engineering Sciences 2010, 368 (1914), 1027-1082.
5. Christian, R., Solvents and Solvent Effects in Organic Chemistry. second ed.; VCH:
New York, 1990.
6. Ritter, A., Smart materials: in architecture, interior and design. Birkhäuser: Berlin,
2007.
7. Pakhchyan, S., Fashioning technology. O'Reilly: Milan, 2008.
8. Kuehni, R. G., Color: an introduction to practice and principles. 2nd ed.; Wiley-
Interscience: New Jersey, 2005.
9. Nassau, K., The physics and chemistry of color. Wiley Interscience: New York, 1983.
10. Platt, J. R., Electrochromism, a possible change of color producible in dyes by an
electric field. Journal of Chemical Physics 1961, 34 (3), 862-863.
11. Monk, P. M. S.; Mortimer, R. J.; Rosseinsky, D. R., Electrochromism and
electrochromic devices. Cambridge University Press: Cambridge, 2007.
12. Mortimer, R. J., Electrochromic materials. Chemical Society Reviews 1997, 26 (3),
147-156.
13. Monk, P. M. S., The viologens: physicochemical properties, synthesis and
applications of the salts of 4,4'-bipyridine. John Wiley and Sons: Chichester, 1998; pp
239-256
14. Granqvist, C. G., Electrochromic tungsten oxide films: review of progress 1993-1998.
Solar Energy Materials and Solar Cells 2000, 60 (3), 201-262.
15. Monk, P. M. S.; Mortimer, R. J.; Rosseinsky, D. R., Electrochromism and
electrochromic devices. Cambridge University Press: Cambridge, 2007; pp 282-296
24
16. Kirchmeyer, S.; Reuter, K., Scientific importance, properties and growing applications
of poly(3,4-ethylenedioxythiophene). Journal of Materials Chemistry 2005, 15 (21),
2077-2088.
17. Wang, Y. M., Recent research progress on polymer electrolytes for dye-sensitized
solar cells. Solar Energy Materials and Solar Cells 2009, 93 (8), 1167-1175;
Thangadurai, V.; Weppner, W., Recent progress in solid oxide and lithium ion
conducting electrolytes research. Ionics 2006, 12 (1), 81-92.
18. Song, J. Y.; Wang, Y. Y.; Wan, C. C., Review of gel-type polymer electrolytes for
lithium-ion batteries. Journal of Power Sources 1999, 77 (2), 183-197; Wright, M. R.,
An Introduction to Aqueous Electrolyte Solutions. Wiley: Chichester, 2007.
19. Wang, P.; Dai, Q.; Zakeeruddin, S. M.; Forsyth, M.; MacFarlane, D. R.; Gratzel, M.,
Ambient temperature plastic crystal electrolyte for efficient, all-solid-state dye-
sensitized solar CeN. Journal of the American Chemical Society 2004, 126 (42),
13590-13591.
20. Sekhon, S. S., Conductivity behaviour of polymer gel electrolytes: role of polymer.
Bulletin of Materials Science 2003, 26 (3), 321-328.
21. Gaupp, C. L.; Welsh, D. M.; Rauh, R. D.; Reynolds, J. R., Composite coloration
efficiency measurements of electrochromic polymers based on 3,4-
alkylenedioxythiophenes. Chemistry of Materials 2002, 14 (9), 3964-3970.
22. Smith, F. H. 1929. United Kingdom patent application UK328,017.
23. Gentex rear camera display mirror featured on new ford taurus [Online]. Available:
http://www.marketwire.com/press-release/Gentex-Rear-Camera-Display-Mirror-
Featured-on-New-Ford-Taurus-NASDAQ-GNTX-1276904.htm [Accessed July 2010
2010].
24. Niklasson, G. A.; Granqvist, C. G., Electrochromics for smart windows: thin films of
tungsten oxide and nickel oxide, and devices based on these. Journal of Materials
Chemistry 2007, 17 (2), 127-156.
25. Lampert, C. M., Chromogenic smart materials. Materials today 2004, p 7.
26. Lee, E. S.; Selkowitz, S. E.; Clear, R. D.; DiBartolomeo, D. L.; Klems, J. H.;
Fernandes, L. L.; Ward, G. J.; Inkarojrit, V.; Yazdanian, M., A design guide for early-
market electrochromic windows. California Energy Commission, PIER. 500-01-023.
LBNL-59950.: 2006.
27. Chen, Y.; Au, J.; Kazlas, P.; Ritenour, A.; Gates, H.; McCreary, M., Flexible active-
matrix electronic ink display. Nature 2003, 423 (6936), 136-136.
28. Vincent, J. B.; Flick, D. W. 2006. Electrochromic display device. United States of
America patent application US7054050.

25
29. Shamai, R.; Andelman, D.; Berge, B.; Hayes, R., Water, electricity, and between ...
On electrowetting and its applications. Soft Matter 2008, 4 (1), 38-45.
30. PaperDisplay [Online]. Available: http://www.paperdisplay.se/ [Accessed July 2010].
31. Hennerdal, L.; Lögdlung, M., Electronic printing paper house. Aperturen 2005, 2.
32. AB, A. Printing Laboratory [Online]. Available:
http://www.acreo.se/templates/Page____773.aspx [Accessed July 2010].
33. Hagfeldt, A.; Didriksson, B.; Palmqvist, T.; Lindstrom, H.; Sodergren, S.; Rensmo, H.;
Lindquist, S. E., Verification of high efficiencies for the gratzel-cell - a 7-percent
efficient solar-cell based on dye-sensitized colloidal TiO2 films. Solar Energy Materials
and Solar Cells 1994, 31 (4), 481-488.
34. NTERA [Online]. Available : http://www.ntera.com/technology/printing_processes.php
[Accessed July 2010].
35. Nic, M.; Jirat, J.; Kosata, B.; Jenkins, A. 2006. IUPAC [Online]. Available:
http://goldbook.iupac.org [Accessed July 2010].
36. Dürr, H.; Bouas-Laurent, H., Photochromism: molecules and systems. Elsevier:
Cornwall, 2003.
37. Bamfield, P., Chromic phenomena - the technological applications of colour
chemistry. The Royal Society of Chemistry: Cambridge, 2001.
38. Van Gemert, B., The commercialization of plastic photochromic lenses: a tribute to
John Crano. Molecular Crystals and Liquid Crystals 2000, 344, 57-62.
39. Vivimed Labs Europe Ltd: Reversacol photochromic dyes [Online]. Available:
http://www.photochromics.co.uk/index.htm [Accessed July 2010].
40. Solar Active International: photochromic inks [Online]. Available:
http://www.solaractiveintl.com/index.php [Accessed July 2010].
41. White, M. A., The chemistry behind carbonless copy paper. Journal of Chemical
Education 1998, 75 (9), 1119-1120.
42. Appleton Papers Inc.: carbonless paper [Online]. Available:
http://www.encapsys.com/carbon.aspx [Accessed July 2010].
43. Peters, A.; Branda, N., Electrochemically induced ring-closing of photochromic 1,2-
dithienylcyclopentenes. Chemical Communications 2003, 954-955.
44. Peters, A.; Branda, N. R., Electrochromism in photochromic dithienylcyclopentenes.
Journal of the American Chemical Society 2003, 125 (12), 3404-3405.
45. Yamase, T., Photo- and electrochromism of polyoxometalates and related materials.
Chemical Reviews 1998, 98 (1), 307-325.
46. Deb, S. K.; Lee, S. H.; Tracy, C. E.; Pitts, J. R.; Gregg, B. A.; Branz, H. M., Stand-
alone photovoltaic-powered electrochromic smart window. Electrochimica Acta 2001,
46 (13-14), 2125-2130.

26
47. Krasovec, U.; Georg, A.; Wittwer, V.; Luther, J.; Topic, M., Performance of a solid-
state photoelectrochromic device. Solar Energy Materials and Solar Cells 2004, 369-
380.
48. Microfabrication [Online]. Wikipedia. Available:
http://en.wikipedia.org/wiki/Microfabrication#Microfabrication_processes [Accessed
July 2010].
49. Arias, A. C.; MacKenzie, J. D.; McCulloch, I.; Rivnay, J.; Salleo, A., Materials and
applications for large area electronics: solution-based approaches. Chemical Reviews
2010, 110 (1), 3-24.
50. Kipphan, H., Handbook of print media: technologies and production methods.
Springer: Heidelberg, 2001.

27

28

29
Chapter 2
The chemistry of 6-hydroxyflavylium:
A Multiswitchable System operated by Proton,
Electron and Photon inputs

30
2.1 Introduction
The investigation of molecules that can exist in two or more forms (multistate),
interconvertible by an external input1-2 is of fundamental importance. In particular, systems
capable of responding to a given combination of multiple stimuli can be envisaged to process
multiple information. Multistimuli and multistate systems match the predictions of the UC (see
section 1.1).3 Besides the chromogenic molecules other systems can show multiple states,
for example the flavylium molecules. Flavylium compounds are a paradigmatic example of
multistate and multistimulus systems, and in particular cases, it shows photochromism as
well.
In this chapter, the 6-hydroxyflavylium is studied towards its possible application as a
chromogenic system. The entire chemical network was elucidated by spectroscopic
techniques in different time scales. Another particular characteristic of the introduction of the
hydroxyl group in the position 6 is the possibility to operate electrochemically the p-
quinone/p-hydroquinone chalcone.
2.1.1 Flavylium compounds
Anthocyanins and anthocyanidins are ubiquitous natural pigments of flowers and fruits
responsible for the colours ranging from blue to red. Both classes of molecules have the
same chemical skeleton described in Fig. 2.1 constituted by the 2-phenyl-1-benzopyrylium
ring system, the so-called flavylium. The intense study devoted to anthocyanins and
anthocyanidins is due to their practical application as colorants not only in the antiquity4, but
also for industrial modern applications.5
In 1902 Bülow and Wagner reported for the first time the synthesis of a flavylium salt.6 State-
of-the-art flavylium syntheses have developed along different approaches, leading to
synthetic flavylium salts containing a variety of substitutes in the aromatic ring, e.g., hydroxyl,
alkoxy, amino, N-alkyl and N, N – dialkylamino, carboxy, halogens, nitro and cyano.
Figure 2.1 - 2-phenyl-1-benzopyrylium (Flavylium) structure.

31
Chemical network
Flavylium compounds are paradigms of multistate compounds.7,8,9,10 The main species
arising in aqueous solution from the common 2-phenyl- 1-benzopyrylium core are shown in
Fig. 2.2 for the particular case of 6-hydroxyflavylium.
O
HO
O
HO
O
–O
O
OH
HO
O
O–
HO
O
O–
–O
OH
A
B
C
87
65 4
3
2'
6'5'
4'3'
HO
OH O
Ka
Kh
Kt
Ki
KCt1
hydration
tautomerization
isomerization
AH+
A
BCc
Ct
Ct–
Ct2–
pHlight
KCt2
Figure 2.2 – Chemical network of 6-Hydroxiflavylium.
In acidic and neutral solutions, 6-hydroxyflavylium presents five states, interconvertible by pH
modifications and light: the flavylium cation, AH+; the hemiketal species, B, obtained by
hydration in position 2 of the AH+; the cis-2-hydroxychalcone, Cc, formed from the hemiketal
B through a tautomeric process (ring opening) and the trans-2-hydroxychalcone, Ct, obtained
from Cc via a cis–trans isomerization reaction.

32
Flavylium Thermodynamics
The network of chemical equilibria in acid medium reported in Fig. 2.2 can be accounted for
by the following set of equilibriums:
Eq. 2.1
Eq. 2.2
Eq. 2.3
Eq. 2.4
Eq. 2.1–2.4 can be substituted by single acid–base equilibrium, as shown by Eq. 2.5:
Eq. 2.5
Where
[ ] [ ] [ ] [ ] [ ]CtCcBACB +++= Eq. 2.6
iththhaa KKKKKKKK' +++= Eq. 2.7
In the cases where an activation barrier exists for the interconversion of cis- to trans-
chalcone, a pseudo-equilibrium can also be defined:
Eq. 2.8
where
thhaa KKKKK^ ++= Eq. 2.9

33
In both, equilibrium and pseudo-equilibrium, the stable species at more acidic pH values is
the AH+ form; with increasing pH, AH+ is substituted by the “neutral forms”, A + B + Cc + Ct
and A + B + Cc respectively.
It is worth mentioning that not only Ka, but also the relative concentration of the “neutral
species” is dramatically dependent on the functional groups present in the 2-phenyl-1-
benzopyrylium core. In particular, our group has reported11 that a hydroxyl group in position
4’ or 7, respectively, increases or decreases the cis–trans isomerisation barrier. The effect of
the substituent is also observed in the kinetics of the network depicted in Fig. 2.2. The rate of
the hydration reaction is strongly pH dependent and typically occurs in the second or sub-
second timescale. The hemiketal ring can open, leading to the cis-chalcone, Cc; this reaction
occurs also in the subsecond timescale and is slightly dependent on the pH. Finally, the
trans-chalcone, Ct, is obtained from its cis-isomer, in a timescale that ranges from several
minutes to days.11 If the cis–trans process is slow enough, a pseudo-equilibrium state
involving the AH+, B and Cc species can be defined. With time, the pseudo-equilibrium, K^a
will evolve to the final thermodynamic equilibrium, K’a. At alkaline pH values, when phenolic
groups are present, all species can deprotonate. Fig. 2.2, the base A results from
deprotonation of the flavylium cation and the trans-chalcone deprotonates to give Ct− and
Ct2−. The hemiketal B and the cis-chalcone Cc can also deprotonate. While hydroxyl groups
in positions 5, 7, 2’ or 4’ of the AH+ give rise to the formation of quinoidal bases A by simple
deprotonation; the hydroxyl groups in positions 6, 8 or 3’ originate a zwitterion that cannot
delocalize to a quinoidal system (see Fig. 2.2, A form).
Flavylium Salt Photochromism
Within the chemical network found in flavylium salts the cis-trans chalcone isomerisation is
generally photo-reactive. The colourless Ct species can be converted into Cc by a
photoisomerization reaction. As described by the thermodynamic of the flavylium chemical
network12 the pH of the solution will influence the photo-isomerisation product. In acidic
media the thermodynamically more stable specie is AH+, thus Ct is mainly converted to
flavylium cation, defining a photochromic system. At more neutral pH the predominant
species will be Cc and B, and a photostationary state is reached, depending on the light
absorbed by each species and on the quantum yields.
Photochemical quantum yield can be simply defined as the ratio between the number of
molecules undergoing a particular photochemical reaction and the number of photons
absorbed by photoreactive system (Eq. 2.10):
reagent theby absorbed photon of number
formed product of molecules of numberΦ = Eq. 2.10

34
Depending on the flavylium derivative, different quantum yields can be found and more
important to define the system is the ratio found for the quantum yield for the Cc to Ct
reaction and the backward process. It has been reported a quantum yield ratio between
direct and backward reactions lower than 1. Explanation has been rationalized based on the
energy potential of the excited state.13
Optical memories and molecular logic system
In 1956, Yehuda Hirshberg introduced the idea that photochromic systems could be used as
models for optic memories. The method described follows the bottom-up approach to
improve memory density thus increasing the data storage capacity per unit of area. The
advantage to use chemistry to build such operating units is based on the advantages of
molecular level miniaturization capacity.
To build an optical memory it is essential to have two photochemically interconvertible and
stables species. In addition, the speed of this conversion must be as fast as possible. As
proposed by several authors photochromic systems are the preferred chemical system to
meet the described requirements.
As it is essential to reach bistability to obtain useful optical memories the T- and P-type
photochromic systems (see section 1.2.2) are not suitable. In the T-type system one of the
memory states will revert thermally loosing the state definition (and consequently the stored
information). In the P-type system the light used to read the memory state would cause the
conversion of the photochromic state thus loosing also state definition.
Pina et al has proposed dual-type system based on the flavylium chemical network to avoid
the destructive reading or thermal destruction of the defined optical memory. The strategy
requires a system that responds to two stimuli: (i) one used to write the information (Y) and
(ii) another to lock the written state (Z, see Fig. 2.3). The Z state corresponds to a more
stable written state that is thermally and photochemically stable. This state is used to read
the memory content (Z). A reverse stimulus is applied to unlock the written state and the
system can be erased to the original state (X).
Figure 2.3 – Dual-type photochromic system proposed by Pina et al.
11

35
Exploring further the concept of molecular computing units, Pina and co-workers have
explored the multistate properties of the chemical flavylium network to design molecular
logical operators. Based on the photochromic bistables Ct and Cc species, more complex
input-output relationship systems have been used to perform AND, OR logic operations.14
Electrochemical behaviour of flavylium systems
Natural flavylium salts constitute an interesting class of compounds due to their organoleptic
properties, such as colour (anthocyanins or curcumin, for example), astringency (tannins),
bitterness (flavanols) or taste15, and more recently their benefits to human health were
recognised as they can reduce the risk of chronic disease and, in general, they have a
positive effect on health.16 They have been reported to help the prevention against severe
diseases like cancer.17 Many of these probiotic properties have been attributed to the
antioxidant power of natural compunds.18
Antioxidant activity has been related to their redox potentials found by electrochemical
techniques. Although synthetic flavylium have been used as models for their natural
counterparts for chemical network reactions, only few electrochemical data has been
published.
Polyphenols electrochemistry
The antioxidant properties of natural polyphenol compounds are attributed to the oxidation of
hydroxyl groups. The general redox mechanism proposed for polyphenols bearing reactive
structural groups such as chatechol, pyrogallol or para diol is a two-electron, two-proton
reversible process (see Fig. 2.4) coupled to an homogeneous chemical reaction.

36
Figure 2.4 – Oxidation mechanism for different polyphenols (Kuromanin19, Kaempferol19 and
Catechin20).
The homogeneous chemical reaction is attributed to the radical dimerization of the phenoxyl
radicals formed with the first electron extraction.
It has been reported almost none or weak effects on the ionisation of OH groups from ring A
or B when the opposite ring groups are or are not ionised20, the same has been reported for
the chalcones species.21 Hence, ionisations of OH groups of ring A are independent and
distinguishable from those of ring B.20 Although hydroxyl groups can occur in both rings A
and B, the redox mechanism in anthocyanins is correlated with hydroxyls in ring B.22

37
Chalcones species can be obtained either by the flavylium network reactions or by direct
organic synthesis. A serie of synthetic hydroxychalcones have been studied towards their
electrochemical activity in dimethyl sulfoxide by Nicole Cotelle et all.21 Also, a comparative
study has been done with smaller polyphenols like caffeic acid, coumaric acid and ferulic
acid which present the same basic chemical structure but different hydroxyl substituents.23
It was found that chalcone without any OH group (1,3-diphenyl-propenone) has no
electrochemical reactivity. In the other case hydroxychalcones bearing one hydroxyl group in
ring A and none in ring B is oxidised to the phenoxyl radical (see Fig. 2.5 - A and -B), which
goes through a second oxidation to the phenoxonium cation (see Fig. 2.5 - C). Then the
phenoxonium cation can be reduced again.
Figure 2.5 – Proposed two electrons, two protons oxidation mechanism of the 3,5-dimethyl-4-
hydroxychalcone by Nicole Cotelle et al.21
The species with one hydroxyl group in ring B and none in ring A shows a two electron in one
wave oxidation at more anodic potentials than hydroxychalcones bearing OH group in ring A.
Finally, hydroxychalcones bearing OH groups in both rings show a voltammogram that is the
sum of the individual voltammograms of the cases one and two. Small influence is detected
between OH groups between ring A and ring B.

38
2.2 Experimental details
Synthesis
All reagents and solvents used were of analytical grade. 1H NMR spectra were run on a
Bruker AMX400 operating at 400 MHz; field desorption MS spectra were run on a Micromass
GCT; elemental analysis were obtained on a Thermofinnigan Flash EA 1112 Series.
6-hydroxyflavylium perchlorate was prepared from condensation of acetophenone (1.16 ml,
10 mmol) and 2,5-dihydroxybenzaldehyde (1.38 g, 10 mmol), on the basis of a method
originally described by Robinson24 and later explored by Michaelis and Wizinger.25 The
reagents were dissolved in acetic acid (8 ml) and dried gaseous hydrogen chloride produced
in situ was bubbled for 3 h. Addition of 20 ml of 20 % perchloric acid led to the precipitation of
a yellow-brown solid that was filtered, washed with cold glacial acetic acid, ether and vacuum
dried; 1.72 g (48 %). The solid may be recrystallized from acetic acid and perchloric acid.
Elemental analysis: exp. (calc. for C15H11ClO6.2H2O) %C 49.95 (50.22), %H 3.77 (4.21). FD-
MS: m/z 223.08 (100%, [M–ClO4–]+, M=C15H11ClO6, calc. 223.08). 1H NMR (400 MHz,
D2O/DCl, pD<1,26 300 K, flavylium cation, AH+): δ 7.50 (s, 1H, H5), 7.68 (dd, 2H, H3’+H5’, 3JH3’H5’-H4’=
3JH3’H5’-H2’H6’=7.7 Hz), 7.79-7.83 (m, 2H, H4’+H7), 8.18 (d, 1H, H8, 3JH8-H7=9.3 Hz),
8.40 (d, 2H, H2’+H6’, 3JH2’H6’-H3’H5’=7.7 Hz), 8.58 (d, 1H, H3, 3JH3-H4=8.9 Hz), 9.22 (d, 1H, H4, 3JH4-H3=8.9 Hz); (400 MHz, D2O/NaOD, pD>12, 300 K, di-ionized trans-chalcone, Ct2–): δ
7.50-7.65 (m, 2H, H7+H8), 7.15 (s, 1H, H5), 7.53 (dd, 2H, H3’+H5’, 3JH3’H5’-H4’=3JH3’H5’-
H2’H6’=7.9 Hz), 7.61 (d, 1H, H3, 3JH3-H4=15.4 Hz), 7.65 (t, 1H, H4’, 3JH4’-H3’H5’=7.9 Hz), 7.93 (d,
1H, H4, 3JH4-H3=15.4 Hz), 7.96 (d, 2H, H2’+H6’, 3JH2’H6’-H3’H5’=7.7 Hz).
Trans-2,5-dihydroxychalcone was prepared according with the method described by
Robinson et al.27 Potassium hydroxide (1.5 g, 6.7 mmol) dissolved in the minimal amount of
water was added to a solution of 2,5-dihydroxybenzaldehyde (0.69g, 5 mmol) and
acetophenone (0.58ml, 5 mmol) in ethanol (5 ml). The mixture became red-brown. After
stirring overnight, the mixture was neutralized with acetic acid (1.8 ml) to obtain the neutral
trans-chalcone, leading to the precipitation of brown oil. After decantation, the oil was
dissolved in dichloromethane and acetone, dried over MgSO4, filtered, concentrated and
purified by flash chromatography (silica-gel 230-400 mesh), eluting with
dichloromethane:acetone 90:10. Pure trans-chalcone was obtained as a dark yellow powder
(yield < 20 %). FD-MS: m/z 240.05 (100%, M+, M=C15H12O3; calc. 240.08). 1H NMR (400
MHz, CD3CN, 300 K, trans-chalcone, Ct): δ 6.73-6.81 (m, 2H, H7+H8), 7.14 (s, 1H, H5), 7.53
(dd, 2H, H3’+H5’, 3JH3’H5’-H4’=3JH3’H5’-H2’H6’=7.7 Hz), 7.61 (t, 1H, H4’, 3JH4’-H3’H5’=7.7 Hz), 7.65 (d,
1H, H3, 3JH3-H4=15.8 Hz), 7.95 (d, 1H, H4, 3JH4-H3=15.8 Hz), 8.02 (d, 2H, H2’+H6’, 3JH2’H6’-
H3’H5’=7.7 Hz).

39
General
All chemicals were of analytical grade. All experiments were carried out in aqueous solutions.
The pH was adjusted by addition of HCl and NaOH to buffered solutions, and was measured
in a Radiometer-Copenhagen PHM240 MeterLab potentiometer.
pH Jumps
pH Jumps were done by adding a certain volume of a stock solution of the flavylium salt in
0.1 M HCl to a 10 cm3 flask containing an equivalent amount of NaOH to neutralize the HCl,
and 1 cm3 of 0.1 M universal buffer of Theorell and Stenhagen28 at the desired final pH,
followed by addition of water to the final volume. Reverse pH jumps involved a second pH
jump to a lower pH value, by addition of HCl.
Optical spectroscopic measurements
UV-Vis absorption spectra were recorded using a Shimadzu UV2501-PC spectrophotometer.
Spectrophotometric pH titration data were fitted using the Solver facility of Microsoft Excel.
Determined pKa values have a mean error of ±0.1. Light excitation was carried out using a
medium-pressure mercury arc lamp, and the excitation bands were isolated with interference
filters (Oriel). The flash photolysis experiments were performed as previously described.29
The stopped-flow experiments were collected in a SFM-300 spectrophotometer, controlled by
a MPS-60 unit (Bio- Logic) and the data were collected using a TIDAS diode array (J & M),
with wavelength range between 300 and 1100nm, all connected to a computer. The standard
cuvette has an observation path length of 1 cm. For these experiments the dead time of each
shot was previously determined to be 5.6 ms with a flow rate of 8 mL.s−1.
Electrochemical experiments
Linear cyclic voltammetry measurements were conducted in a conventional three-electrode
cell under argon atmosphere at 21ºC performed using a computer controlled potentiostat
AUTOLAB (Eco-Chemie). The working electrode was a glassy carbon disk (BAS) polished
with 0.05 µm alumina (Metkron) before each run. The auxiliary electrode was a platinum
wire. The reference electrode was an Ag/AgCl (BAS). The experiments were carried out in
hydrochloric acid aqueous solution about pH 1.3, containing 1M KCl as supporting
electrolyte. Solutions were initially deaerated with an argon stream for 20min.
Spectroelectrochemistry
Electrolysis was performed using a platinum net as a working electrode, a reference
electrode (saturated calomel electrode, ref. 921 from Radiometer Analytical) and a platinum
wire counter-electrode was immersed in the electrolyte solution. Absorbance spectra of bulk

40
electrolysed solution were accomplished taking samples from the electrolysis cell. The
solution was looped between the electrolysis cell and the spectrophotometric cell. All
solutions were deaereted under an argon stream - initially for 20 minutes and during the
whole electrolysis.
Semi-empirical calculations
Ground and first singlet excited heats of formation were obtained from single point
calculations (AM1-RHF-CI, 99 single excited configurations) on geometries.

41
2.3 Results and Discussion
6-Hydroxyflavylium perchlorate
The spectral variations occurring in aqueous solutions of the compound 6-hydroxyflavylium
as a function of pH, at the thermal equilibrium, are reported in Fig. 2.6.
1 2 3 4 5 60.2
0.4
0.6
0.8
200 300 400 500 6000.0
0.2
0.4
0.6
0.8
1.0
A38
0nm
pH
pK'a = 2.8
A
Wavelength (nm)
Figure 2.6 - Spectral variations of 6-hydroxyflavylium perchlorate, 3.5x10⁻⁵M, as a function of pH
(acidic region) at the thermal equilibrium. In order to decrease the reaction time, the solutions were
kept at 40 °C for 7 hours and left to equilibrate for a day at room temperature.
At very acidic pH values the yellow flavylium cation is the stable species. Increasing pH
gives rise to the disappearance of this species with concomitant formation of the “neutral
species” absorption bands. The identification of the trans-chalcone Ct as the “neutral
species” was made by 1H NMR, on the basis of the coupling constant of 15.8 Hz between
proton 3 and 4. This was further confirmed by performing the synthesis of this species
through another method, see experimental details (section 2.2). In both samples, there is a
coincidence between the absorption and the 1H NMR spectra. As shown by Eq. 2.5, 2.6 and
2.7 the system behaves as single acid–base equilibrium, and therefore the respective
apparent constant, K’a, can be calculated by a standard fitting procedure, as shown in the
inset of Fig. 2.6.
-2,8
a 10' =K
In Fig. 2.7, the spectral variations occurring 30s after a pH jump from 1 to the final pH are
shown.

42
200 300 400 500 6000.0
0.2
0.4
0.6
0.8
1.0
1 2 3 4 5 6 7 8
0.0
0.2
0.4
0.6
0.8
A
Wavelength (nm)
A3
80nm
pH
pK^a = 3,8
Figure 2.7 - Spectral variations of 6-hydroxyflavylium perchlorate, 3.5x10⁻⁵M, as a function of pH,
resulting from a pH jump from 1, measured after 30 seconds.
The spectral changes vs. pH reported in Fig. 2.7 describe the system at the pseudo-
equilibrium and are clearly different from those reported in Fig. 2.6. Moreover, when the pH
jump is carried out at pH > 5, an orange-red colour is immediately formed that fades in less
than 1 s (see Fig. 2.8). These results show that the pseudo-equilibrium, characterized by the
presence of B and Cc species, is preceded by a very fast process (formation and
disappearance of base A), and followed by a very slow one that leads to the final equilibrium
characterized by the presence of Ct. According to Eq. 2.8, the data reported in Fig. 2.7 can
be fitted as a single acid–base equilibrium, which allows to calculate the pseudo-equilibrium
apparent constant, K^a, as shown in the inset of the Fig. 2.7.
-3,810a^ =K
Comparison of Fig. 2.7 with Fig. 2.6 shows that in the latter an absorption band around
315nm can be observed (Ct) which is not still formed in the pseudo-equilibrium of Fig. 2.7.
This result indicates that there is a barrier for the cis–trans isomerization, in other words, only
in Fig. 2.6 the trans-chalcone appears. Important to note that the base A can only be
observed as a transient species immediately after pH jumps to neutral and basic pH values;
it remains neither at the equilibrium nor at the pseudo-equilibrium. In order to follow the
disappearance of the zwitterionic base A, stopped-flow experiments were carried out. The
results are reported in Fig. 2.8, where the absorption spectra were taken 10 ms after a pH
jump from 1 to the final represented pH.

43
4 6 8 100.0
0.1
0.2
400 500 600 7000.0
0.1
0.2
0.3
0.4
A5
32nm
pH
pKa = 6.2
A
Wavelength (nm)
Figure 2.8 - Spectral variations of 6-hydroxyflavylium perchlorate obtained by stopped-flow after 10 ms
of a pH jump from 1 to the final pH.
The formation of the base can be clearly observed, and the pKa of the flavylium cation, Eq.
2.1, can be obtained by fitting the data (see inset of Fig. 2.8).
-6,2a 10=K
The decay of the base A is reported in Fig. 2.9-left, and the respective changes in absorption
spectra are also presented in Fig. 2.10. This trace was obtained upon a pH jump from
solutions equilibrated at pH = 1 to pH = 9.65. The decay follows a first order kinetic process
with a rate constant equal to 1.3 s−1. A series of similar pH jumps starting from pH = 1 to
higher pH values was carried out, and the respective rate constant represented as a function
of pH, see Fig. 2.12 (open squares).

44
0 2 40.0
0.1
0.2
A5
30nm
Time (s)
kobs
= 1.3s-1
0.0 0.1 0.20.0
0.2
0.4
0.6
0.8
1.0
A4
30nm
Time (s)
kobs
= 100s-1
Figure 2.9 - Decay trace of a direct pH jump from 1 to 9.65 (left); decay trace of a reverse pH jump
from 6.1 to 2.33 (right). The initial solution at pH=6.1 was prepared from a stock solution at pH=1.0,
and used immediately, before formation of significant amounts of Ct (pseudo-equilibrium state). The
decay of the A form is observed during the direct pH jump, while the formation of the AH+ form is
observed during the reverse pH jump.
400 500 600 7000.00
0.05
0.10
0.15
0.20
0.25
A
Wavelength (nm)
Figure 2.10 - Kinetics of the zwitterionic base decay followed by stopped flow
The stopped-flow data show that the lifetime of the zwitterionic base is extremely short
compared with other flavylium compounds bearing hydroxyl substituents capable of forming
quinoidal bases; for example, in the case of the compound 7,4’ - dihydroxyflavylium, the
quinoidal base at pH ca. 7–8 is stable for hours.30 In such compounds, the (quinoidal) base
exhibits a relatively long lifetime at pH values near the neutrality because it constitutes a

45
kinetic product. In the case of anthocyanins in moderately acidic media, Dubois and
Brouillard have shown in a seminal paper9 that mechanism III in Fig. 2.11 is the operating
one.
AH+ A B + H3O+
AH+ B + H3O+
A
AH+AB + H3O
+
ka
k-a [H+] k'-h
k'h
k'h
k'-hka
k-a [H+] k'-h
k'h
ka
k-a [H+]
k'h
k'-h
fast slow
Mechanism I
Mechanism II
Mechanism III
Figure 2.11 – Proposed kinetic mechanism for the conversion between the form AH+, A and B,
previously described in the literature.
This model was also proved to account for the chemical behaviour of many synthetic
flavylium networks.8,9,10,11,12,31,32,33 One immediate consequence of mechanism III is the
possibility of formation of base A as a kinetic product. Once A is formed, the system can go
forward to B (and Cc) only through the hydration reaction of AH+. However, the rate of the
hydration process is proportional to the concentration of AH+ (see Eq. 2.11):
[ ] [ ] [ ] [ ]B OHAHt
AH3hh ×−=
− +−
++
'' kkd
d Eq. 2.11
If the pH is higher than the pKa of the system, the pseudo-equilibrium is shifted to the species
A, and the kinetic process becomes slower. On the other hand, the base A can be directly
attacked by OH−,34 but near the neutrality, A reacts slowly since OH− is present in very low
concentrations. The quinoidal base starts to react faster only at more basic pH values, where
OH− is available at higher concentrations for nucleophilic attack. On the contrary, the

46
zwitterionic base of the present compound is very reactive even at neutral and moderately
basic solutions, essentially because the nucleophilic attack by water is facilitated by the
maintenance of the positive charge in the zwitterionic form, relatively to the neutral quinoidal
base. In order to get more insight on this network, solutions at pH 6 were freshly prepared
from the stock at pH = 1.0, and reverse pH jumps back to acid were immediately carried out,
Fig. 2.9-right and Fig. 2.12 (black squares). This procedure allows the formation of the
pseudo-equilibrium at this pH value (essentially B and Cc are present), and permits the study
of the kinetics of flavylium formation from these species. The traces are also compatible with
a fast first order kinetic process. This procedure was extended to different final pH values;
see black squares in Fig. 2.12. The observed rate constants, obtained by the direct and
reverse pH jumps, are plotted together in Fig. 2.12. The fitting of the experimental points can
be done considering that the rate determining step of the kinetics followed by stopped-flow is
the hydration reaction. Eq. 2.12 can account for the process and fitting with kh = 0.09 s−1 and
k−h = 900 M−1 s−1 can be obtained, allowing to calculate Kh (see Eq. 2.13):
[ ] [ ]++− +=+= HHobs 90009,0hh kkk Eq. 2.12
14
h
hh M10 −−
−
==k
kK Eq. 2.13
It is interesting to note that up to pH ca.5 the species A is not formed at a large extent (pKa =
6.2), and by consequence the forward process should take place through the flavylium
hydration to give B. On the other hand, for pH values higher than ca. 6, the base A is formed
but does not give rise to a kinetic product, as reported for other synthetic flavylium salts and
anthocyanins.11 The zwitterionic base A reacts in less than 3 s in a large pH range, from pH 6
to 10. Moreover, up to pH = 10, the reaction of the base A with OH− (hydroxylation),
observed in other flavylium salts bearing hydroxyl substituents,34 is negligible, because
water is very efficient on the hydration process of this zwitterionic base and, being the
solvent, it is in large excess relatively to hydroxide concentration at moderately basic pH
values. On the other hand, the hydration reaction seems to be also the rate determining step
of the reverse pH jumps. In fact, after the dead time of the stopped- flow apparatus, the
absorption of the flavylium cation at 430nm increases according to a single first order kinetic
process. The fitting of both sets of data obtained by direct and reverse pH jumps according to
Eq. 2.12 indicates that hydration is in fact the rate determining step whenever the Ct form is
not involved. The cis–trans isomerization is a very slow process that is only completed in a
time scale of several hours. In conclusion, the chemical behaviour of the present flavylium

47
compound suggests a mechanistic change from mechanism III at more acidic pH values to
mechanism I in Fig. 2.11 at moderately basic pH values. For example, when a pH jump from
1 to pH = 9.65 takes place, A is “immediately” formed, Fig. 2.8. According to Eq. 2.12, the
hydration of AH+ would occur with a rate constant of 0.09 × 3.5 × 10−4 = 3.2 × 10⁻⁵ s−1, where
the last term is the mole fraction of the flavylium cation. This value is much slower than the
real disappearance rate of A (1,3s-1, see Fig. 2.9-left) showing that at this pH value the
hydration reaction is negligible. Moreover, in this pH range, the hydration should take place
by water attack, because the alternative attack by OH− would lead to pH dependence in the
basic region which is not observed in Fig. 2.12.
0 1 2 3 4 5 6 7 8 9
0
50
100
150
200
250
300
350
400
kob
s (s-1
)
pH
Figure 2.12 - Observed rate constants upon direct (pH=1 → pH>1, ) and reverse (pH=6.1 → pH<6.1,
) pH jumps.
In Fig. 2.7, the absorption spectra at the end of the stopped-flow measurements are
presented. The observed spectra correspond to the absorption of the species occurring at
the pseudo-equilibrium, B and Cc. The final spectra, corresponding to the Ct species, are
obtained through a slow process that takes several days at room temperature (see Fig. 2.6).
The kinetics of conversion from the pseudo to the final equilibrium, i.e., the kinetics of the
cis–trans isomerization, follows a first order kinetic process, as shown in Fig. 2.13-left. The
activation energy of the cis–trans isomerization was obtained from the dependence of the
rate constant with the temperature through an Arrhenius plot, Fig. 2.13-right. At room
temperature, the cis–trans isomerization is not dependent on pH, as shown in Fig. 2.14.

48
Using the data from the pseudo and final equilibrium, respectively Fig. 2.7 and 2.6, as well as
the data from the stopped flow measurements, the four equilibrium rate constants can be
calculated by means of the four independent equations above obtained, Eq. 2.7, Eq. 2.9, Eq.
2.12 and Ka:
Ka = 10−6.2
Kh = 10−4 M−1
Kt = .57
Ki = 25
-20 0 20 40 60 80 100 120 140 1600.00
0.05
0.10
0.15
0.20
0.25
0.30
0.35
0.40
-20 0 20 40 60 80 100 120 140 160
-6
-5
-4
-3
-2
-1
Time (min.)
ln (Af - A
)
A38
0nm
35ºCk
obs = 5.1x10⁻⁴ s-1
2.9 3.0 3.1 3.2 3.3 3.4-9
-8
-7
-6
-5
-4
E
a = 91,3 kJmol-1
pH = 6,5
1000/T(K-1)
lnk(s
-1)
Figure 2.13 – The cis-trans isomerization of 6-hydroxyflavylium perchlorate at pH=6.5 (left) and the
Arrhenius plot for the same reaction (right).
3 4 5 6 7 8 9 100.000
0.002
0.004
0.006
0.008
0.010
kob
s(min
-1)
pH
Figure 2.14 - Rate constant of the cis-trans isomerization as a function of pH.

49
As previously reported8,11,12 the knowledge of the equilibrium constants permits the
calculation of the mole fraction distribution of the several species as a function of pH, both at
the equilibrium as well as at the pseudo-equilibrium. For example, at pH=6, 65% of B and
35% of Cc are present at the pseudo-equilibrium, evolving to a mixture containing 90% of Ct,
6% of B and 4% of Cc at the final equilibrium.
Photochemistry
The Ct species does not exhibit any significant photochemistry, and the respective solutions
decompose slowly after prolonged irradiation. In contrast with the Ct photochemical
behaviour, the Cc species that is present at the pseudo-equilibrium leads, by irradiation at
313nm, to the Ct with a high quantum yield of Φ=0.52, Fig.2.15.
0 1500 3000 45000.0
0.2
0.4
200 300 400 500 6000.0
0.2
0.4
0.6
0.8
1.0
λirr = 313nm
Φ = 0,52 0,05A3
80nm
Time (s)
+-
A
Wavelength (nm)
Figure 2.15 - Irradiation at 313nm of a freshly prepared solution of 6-hydroxyflavylium perchlorate at
pH=6.4. Inset: absorbance changes at 380nm.
Trans-2,5-dihydroxychalcone
In order to check the nature of the Ct species obtained in neutral or moderately basic solution
upon equilibration, the synthesis of the trans-2,5-hydroxychalcone was carried out. As
mentioned above, the absorption spectrum of the Ct species obtained by direct synthesis is
the same of that recorded in samples of Ct formed by the network of the flavylium salt. Due
to the existence of a cis–trans kinetic barrier, the Ct can be obtained in a metastable state at
very acidic pH values. As reported for other p-hydroquinones35,36 this chalcone is hardly
stable at highly basic pH values, even after argon bubbling, leading to fast formation of
decomposition products. The nature of these products was not investigated, but they do not
give back Ct (or AH+) upon acidification to pH = 1.0. In spite of its reactivity in basic media,

50
determination of the first acidity constant of the Ct species could be carried out, Eq. 2.14, Fig.
2.16.
200 300 400 500 600 7000.0
0.2
0.4
0.6
0.8
1.0
1.2
1.4
1.6
1.8
2.0
4 5 6 7 8 9
0.0
0.2
0.4
0.6
A
Wavelength (nm)
A36
0nm
pH
pKct1
= 9,1
Figure 2.16 - Spectral variations occurring upon a titration of the trans-2,5-dihydroxychalcone under
argon atmosphere, at 25 °C.
Eq. 2.14
Kct1 = 10-9,1
Spectroelectrochemistry of the quinoidal chalcone
Synthetic flavylium salts, as well as anthocyanins, can be involved in several electrochemical
processes, but usually no reversible electrochemistry is observed on flavylium species37 nor
on chalcones.38 In 2009 M.M.C. dos Santos et al reported for the first time the reversible
two-electron two-proton process coupled to a irreversible chemical step of the 4-methyl-7,8-
dihydroxyflavylium salt.22
In the case of the 6-hydroxyflavylium, the quinone/hydroquinone character of the respective
chalcones shows a quasi-reversible voltammogram, as reported in Fig. 2.17-left. Cyclic
voltammograms of Ct at pH = 1 were recorded at different potential scan rates, showing a
quasi-reversible system with a separation between the positive and the negative peaks (∆Ep)
of 0.11V (vs. Ag/AgCl). Linear variation of the peak current with the square root of the scan
rate shows that process is diffusion control rather than charge transfer kinetics.39 The cyclic
voltammogram of Ct at pH = 1 run at 0.1Vs−1 was simulated by employing a quasi-reversible
redox reaction as mechanistic model. The simulation was reasonable, yielding an electron
transfer coefficient (α) of 0.48 (see Fig.2.17-right).

51
0.0 0.2 0.4 0.6 0.8 1.0
-20
-10
0
10
20
30
40
50
0.00 0.05 0.10
5
10
15
20
I (µA
)
E (V vs Ag/AgCl)
100 mVs-1
80 mVs-1
60 mVs-1
40 mVs-1
20 mVs-1
10 mVs-1
v(mV/s)1/2I p
(µA
)
0.2 0.3 0.4 0.5 0.6 0.7 0.8
-20
-10
0
10
20
30
I (µA
)
E (V vs Ag/AgCl)
Figure 2.17 – Cyclic voltammograms of 2.9×10⁻⁴ M trans-2,5-dihydroxychalcone at pH 1, at different
scan rates at 21°C (left). The working electrode was a glassy carbon electrode, the reference
electrode was a Ag/AgCl electrode and as counter-electrode a platinum wire. The experiments were
carried out in hydrochloric acid aqueous solution about pH1.3, containing 1MKCl as supporting
electrolyte. Inset: plot of the anodic peak current vs. square root of scan rate (v), a correlation of 0,99
was found. Comparison of experimental (full line) and simulated (dots line) cyclic voltammograms of
2,9x10⁻⁴M 2,5-dihydroxychalcone at pH 1, run at 0,1Vs-1 (right). Simulation was made using “GPES4.9
commercial voltammetric simulation package from EcoChemie V.B.” with the following parameters:
formal potential, E0 = 0,438V (vs. Ag/AgCl) and electron transfer coefficient, α = 0,48.
Cyclic voltammograms were also obtained at other pH values. In basic media (pH = 11.3),
the voltammograms obtained on freshly prepared solutions show a voltammetric wave
shifted to lower potentials, whose intensity rapidly disappears. These results can be
interpreted considering that after the pH jump, the ionized chalcone species is formed and
reacts chemically, leading to decomposition products (not investigated) and losing its p-
quinone/p-hydroquinone character.
Electrolysis of the Ct species in aqueous solutions at pH=1 was monitored by UV-Vis
spectrophotometry. Due to the adsorption of the oxidation product to the glassy carbon (or
platinum) electrode when water is used as solvent, the experiments were repeated in
ethanol–water mixtures, see Fig. 2.18.
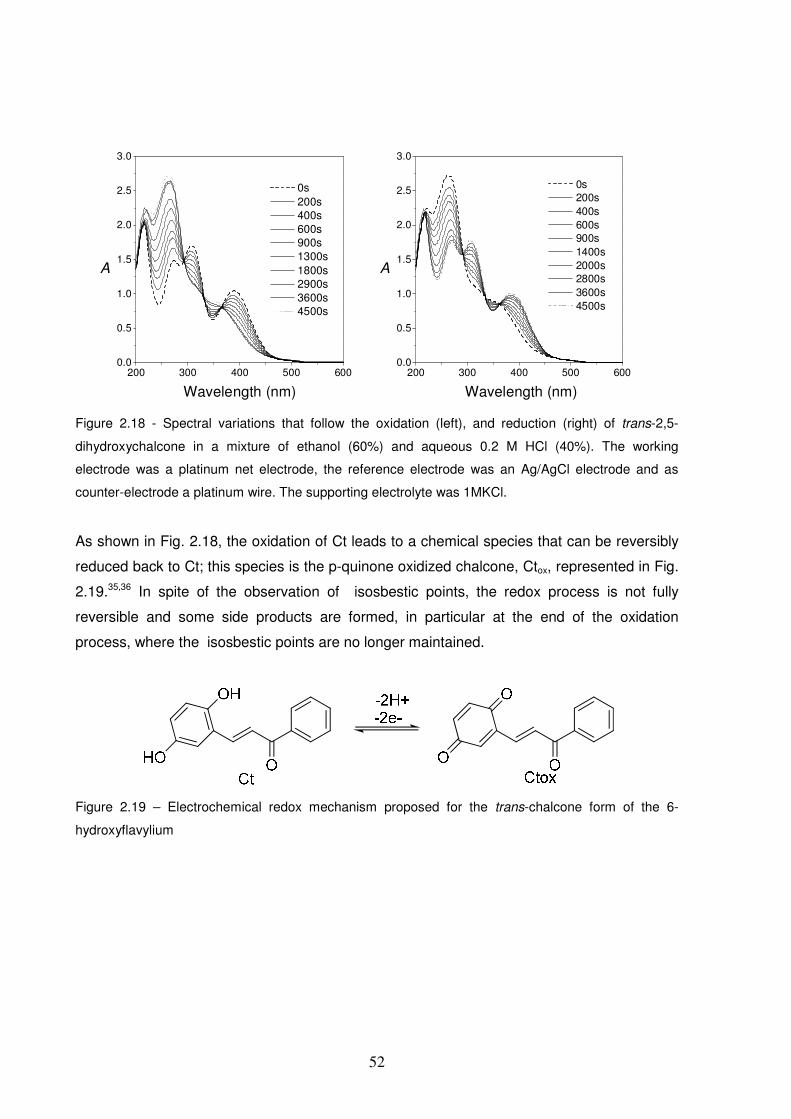
52
200 300 400 500 6000.0
0.5
1.0
1.5
2.0
2.5
3.0
0s 200s 400s 600s 900s 1300s 1800s 2900s 3600s 4500s
A
Wavelength (nm)200 300 400 500 600
0.0
0.5
1.0
1.5
2.0
2.5
3.0
0s 200s 400s 600s 900s 1400s 2000s 2800s 3600s 4500s
A
Wavelength (nm)
Figure 2.18 - Spectral variations that follow the oxidation (left), and reduction (right) of trans-2,5-
dihydroxychalcone in a mixture of ethanol (60%) and aqueous 0.2 M HCl (40%). The working
electrode was a platinum net electrode, the reference electrode was an Ag/AgCl electrode and as
counter-electrode a platinum wire. The supporting electrolyte was 1MKCl.
As shown in Fig. 2.18, the oxidation of Ct leads to a chemical species that can be reversibly
reduced back to Ct; this species is the p-quinone oxidized chalcone, Ctox, represented in Fig.
2.19.35,36 In spite of the observation of isosbestic points, the redox process is not fully
reversible and some side products are formed, in particular at the end of the oxidation
process, where the isosbestic points are no longer maintained.
Figure 2.19 – Electrochemical redox mechanism proposed for the trans-chalcone form of the 6-
hydroxyflavylium

53
2.4 Conclusions
The substitution of the flavylium compound in position 6 by a hydroxyl group can be
compared with the same substitution in positions 4’ and 7; like 4’-hydroxyflavylium and unlike
7-hydroxyflavylium, there is a kinetic barrier for the cis–trans isomerization. Molecular orbital
calculations using semi-empirical methods predict that the potential energy minima of the
excited states of 2,5-dihydroxychalcones follow the same trend of the ground states,
explaining why the photochemical reaction occurs from the cis to the trans and not vice
versa, see Fig. 2.20.
Figure 2.20 - Molecular orbital potential energy minima, calculated by semi-empirical method for the
4’-hydroxyflavylium
Following a procedure previously reported11, it is possible to draw an energy level diagram
of the different species constituting the network, see Fig. 2.21.
2nd step
pH=6.2
AH+pH=0
35.4
kJm
ol-1AH+
pH=4.0
A
BCc
22.8
kJm
ol-1
23.6
kJm
ol-1
13.4
kJm
ol-1
Ct
2nd step
3th step
4thstep
1st step
hνννν
AH+
Ctox
E0 = 0.44V (vs. Ag/AgCl)
2nd step
pH=6.2
AH+pH=0
35.4
kJm
ol-1AH+
pH=4.0
A
BCc
22.8
kJm
ol-1
23.6
kJm
ol-1
13.4
kJm
ol-1
Ct
2nd step
3th step
4thstep
1st step
hνννν
AH+
Ctox
E0 = 0.44V (vs. Ag/AgCl)
Figure 2.21 – Thermodynamics of the 6-hydroxyflavylium chemical network.

54
At very acidic pH values, the AH+ species is the dominant form; raising the pH up to 4–5
leads directly to B and Cc, because the pH is not high enough to form the base A. Only when
the pH is higher than 5 can the base be formed, but it reacts immediately towards B and Cc,
due to its zwitterionic nature. The cis–trans isomerization process is the slowest one,
allowing the establishment of pseudo-equilibrium. In spite of its not complete
electrochemical reversibility, the 6-hydroxyflavylium compound serves to illustrate the
possibility of using electrochemistry as a new input to reach a state of the network.
System presented in this chapter is not suitable as an optical memory due to its
photochemical properties. Optical memories based on the dual-type photochromic system
should be able to operate efficiently the cis-trans isomerization in both directions (cis→trans
and trans→cis) photochemically.
The spectroscopic studies of the several species of the flavylium salt controlled by light and
electricity did not show interesting colour transition. The cis-trans photoisomerization of the
chalcone form present a colour variation between the colourless (cis-chalcone) and light
yellow (trans-chalcone). On the other hand the p-quinone/p-hydroquinone chalcone system
lead also to a poor colour transition between colourless and light yellow. The colour
characteristics of the stable species of the chemical network of the 6-hydroxyflvaylium are
not adequate for chromogenic purposes.

55
2.5 Bibliography
1. Niemz, A.; Rotello, V. M., From enzyme to molecular device. Exploring the
interdependence of redox and molecular recognition. Accounts of Chemical Research
1999, 32 (1), 44-52.
2. Lederman, H.; Macdonald, J.; Stefanovic, D.; Stojanovic, M. N., Deoxyribozyme-
based three-input logic gates and construction of a molecular full adder. Biochemistry
2006, 45 (4), 1194-1199.
3. Weiser, M., The computer for the 21st-century. Scientific American 1991, 265 (3), 94-
104.
4. Bechtold, T.; Mussak, R., Handbook of Natural Colorants. John Wiley & Sons:
Wiltshire, 2009.
5. Jiang, L. H.; Shoji, T.; Kanda, T.; Morimitsu, Y.; Kubota, K. Novel anthocyanin
compound used as colorant in foodstuffs, beverages and pharmaceuticals.
WO2007055105-A1; JP2007544090-X, WO2007055105-A1 18 May 2007 C09B-
061/00 200745, 2007.
6. Hill, D. W., The synthesis and structure of benzopyrylium (chromylium) salts.
Chemical Reviews 1936, 19 (1), 27-54.
7. Feringa, B. L., Molecular Switches. Wiley-VCH: Weinheim, 2001.
8. Figueiredo, P.; Lima, J. C.; Santos, H.; Wigand, M. C.; Brouillard, R.; Macanita, A. L.;
Pina, F., Photochromism of the synthetic 4',7-dihydroxyflavylium chloride. Journal of
the American Chemical Society 1994, 116 (4), 1249-1254.
9. Brouillard, R.; Dubois, J. E., Mechanism of structural transformations of anthocyanins
in acidic media. Journal of the American Chemical Society 1977, 99 (5), 1359-1364.
10. McClelland, R. A.; Gedge, S., Hydration of the flavylium ion. Journal of the American
Chemical Society 1980, 102 (18), 5838-5848.
11. Maestri, M.; Pina, F.; Balzani, V., Multistate/multifunctional molecular-level systems-
photochromic flavylium compunds. In Molecular switches, Feringa, L. B., Ed. Wiley-
VCH: Weinheim, 2001; pp 309-334.
12. Pina, F.; Maestri, M.; Balzani, V., Photochromic flavylium compounds as
multistate/multifunction molecular-level systems. Chemical Communications 1999,
(2), 107-114.
13. Roque, A.; Lima, J. C.; Parola, A. J.; Pina, F., Substitution and solvent effects in the
chalcones isomerization barrier of flavylium photochromic systems. Photochemical &
Photobiological Sciences 2007, 6 (4), 381-385.

56
14. Pina, F.; Roque, A.; Melo, M. J.; Maestri, I.; Belladelli, L.; Balzani, V.,
Multislate/multifunctional molecular-level systems: light and pH switching between the
various forms of a synthetic flavylium salt. Chemistry-a European Journal 1998, 4 (7),
1184-1191.
15. Valls, J.; Millan, S.; Marti, M. P.; Borras, E.; Arola, L., Advanced separation methods
of food anthocyanins, isoflavones and flavanols. Journal of Chromatography A 2009,
1216 (43), 7143-7172.
16. Scalbert, A.; Manach, C.; Morand, C.; Remesy, C.; Jimenez, L., Dietary polyphenols
and the prevention of diseases. Critical Reviews in Food Science and Nutrition 2005,
45 (4), 287-306.
17. Nichenametla, S. N.; Taruscio, T. G.; Barney, D. L.; Exon, J. H., A review of the
effects and mechanisms of polyphenolics in cancer. Critical Reviews in Food Science
and Nutrition 2006, 46 (2), 161-183.
18. Dudonne, S.; Vitrac, X.; Coutiere, P.; Woillez, M.; Merillon, J. M., Comparative study
of antioxidant properties and total phenolic content of 30 plant extracts of industrial
interest using DPPH, ABTS, FRAP, SOD, and ORAC assays. Journal of Agricultural
and Food Chemistry 2009, 57 (5), 1768-1774.
19. Jorgensen, L. V.; Cornett, C.; Justesen, U.; Skibsted, L. H.; Dragsted, L. O., Two-
electron electrochemical oxidation of quercetin and kaempferol changes only the
flavonoid C-ring. Free Radical Research 1998, 29 (4), 339-350.
20. Janeiro, P.; Brett, A. M. O., Catechin electrochemical oxidation mechanisms.
Analytica Chimica Acta 2004, 518 (1-2), 109-115.
21. Cotelle, N.; Hapiot, P.; Pinson, J.; Rolando, C.; Vezin, H., Polyphenols deriving from
chalcones: investigations of redox activities. Journal of Physical Chemistry B 2005,
109 (49), 23720-23729.
22. Moncada, M. C.; de Mesquita, M. F.; dos Santos, M. M. C., Electrochemical oxidation
of the synthetic anthocyanin analogue 4-methyl-7,8-dihydroxyflavylium salt. Journal of
Electroanalytical Chemistry 2009, 636 (1-2), 60-67.
23. Hapiot, P.; Neudeck, A.; Pinson, J.; Fulcrand, H.; Neta, P.; Rolando, C., Oxidation of
caffeic acid and related hydroxycinnamic acids. Journal of Electroanalytical Chemistry
1996, 405 (1-2), 169-176.
24. Pratt, D. D.; Robinson, R., A synthesis of pyrylium salts of anthocyanidin type. Journal
of the Chemical Society 1922, 121, 1577-1585.
25. Michaelidis, C.; Wizinger, R., Beitrag zur kenntnis der 2-aryl-benzopyryliumsalze.
Helvetica Chimica Acta 1951, 34 (6), 1761-1770.
26. Glasoe, P. K.; Long, F. A., Use of glass electrodes to measure acidities in deuterium
oxide. Journal of Physical Chemistry 1960, 64 (1), 188-190.

57
27. Robinson, R.; Crabtrfe, H. G.; Das, C. K.; Lawson, W.; Lunt, R. W.; Roberts, B. H.;
Williams, P. N., Some derivatives of benzopyrylium. Journal of the Chemical Society
1924, 125, 207-214.
28. Küster, F. W.; Thiel, A., Tabelle per le analisi chimiche e chimico-fisiche. 12th ed.;
Hoepli: Milano, 1982.
29. Maestri, M.; Ballardini, R.; Pina, F.; Melo, M. J., An easy and inexpensive flash
spectroscopy experiment. Journal of Chemical Education 1997, 74 (11), 1314-1316.
30. Pina, F.; Melo, M. J.; Parola, A. J.; Maestri, M.; Balzani, V., pH-controlled
photochromism of hydroxyflavylium ions. Chemistry-a European Journal 1998, 4 (10),
2001-2007.
31. McClelland, R. A.; McGall, G. H., Hydration of the flavylium ion .2. the 4'-
hydroxyflavylium ion. Journal of Organic Chemistry 1982, 47 (19), 3730-3736.
32. Brouillard, R., Flavonoids and the flower colour. In The flavonoids, advances in
research, Harborne, J. B., Ed. Chapman and Hall: London, 1988; pp 525-538.
33. Brouillard, R., Chemical structure of anthocyanins. In Anthocyanins as food colors,
Markakis, P., Ed. Academic Press: New York, 1982; pp 1-40.
34. Moncada, M. C.; Parola, A. J.; Lodeiro, C.; Pina, F.; Maestri, M.; Balzani, V.,
Multistate/multifunctional behaviour of 4'-hydroxy-6-nitroflavylium: a write-
lock/read/unlock/enable-erase/erase cycle driven by light and pH stimulation.
Chemistry-a European Journal 2004, 10 (6), 1519-1526.
35. Bishop, C. A.; Tong, L. K. J., Equilibria of substituted semiquinones at high pH.
Journal of the American Chemical Society 1965, 87 (3), 501-505.
36. Patai, S., The chemistry of the quinoid compounds. John Wiley & Sons: London,
1974; p 942.
37. Hicks, L. D.; Fry, A. J.; Kurzweil, V. C., Ab initio computation of electron affinities of
substituted benzalacetophenones (chalcones): a new approach to substituent effects
in organic electrochemistry. Electrochimica Acta 2004, 50 (4), 1039-1047.
38. da Silva, P. F.; Lima, J. C.; Quina, F. H.; Macanita, A. L., Excited-state electron
transfer in anthocyanins and related flavylium salts. Journal of Physical Chemistry A
2004, 108 (46), 10133-10140.
39. Bard, A. J.; Faulkner, L. R., Electrochemical methods - fundamentals and
applications. 2nd ed.; Wiley: New York, 2001.

58

59
Chapter 3
Multiresponsive chromogenic systems
operated by light and electrical inputs

60
3.1 Introduction
The chromogenic systems are usually based on one stimulus - one output or in the case of
dual-mode systems several stimulus – one output (see section 1.2). Many practical
applications, however, require systems with different output responses. As an example,
image production requires chromogenic systems with multiple outputs able to compose
several colours. A system possessing three coloured states, cyan, magenta and yellow, as
well as a transparent state (CMYT), all of them independently addressable, might be useful
for image production. However, this is not an easy task to achieve, since multiresponsive
systems usually require a high degree of complexity.
Recent investigation made in our group with crystal violet lactone found that the two iron
cations Fe(III) and Fe(II) display very different affinities towards CVL ring opening; (i) Fe(III)
leads to a ring opening, and therefore development of blue colour in solvents like methanol,
and (ii) Fe(II) possessing a much lower affinity towards CVL ring opening allows thermal
conversion of the CVOL (blue coloured state) to CVL (colourless state). Addition to the
system of a photochromic molecule introduces two more optical states (yellow and magenta)
to the system.
We show that the conjugate action of electrons and light input in a three-component system,
crystal violet lactone (CVL), spiropyran (SPI) and a developer Fe(III)/Fe(II), leads to the
selective appearance of colourless, blue, yellow and magenta that can be composed to
obtain the four components of the CMYT colour model.
3.1.1 Leuco Dyes
Leuco dyes belongs a class of molecules that are able to switch between a coloured state
and a leuco state, by the mean of an external action (see section 1.2.3). Leuco dyes are of
great importance for many commercial applications. The most relevant one is in the textile
industry – vat dyes, but other applications have been explored such as carbonless copy
paper, thermosensitive recording paper and thermochromic materials.
Crystal Violet Lactone – Ionochromism
Crystal Violet Lactone (3,3-bis-(4-dimethylaminophenyl)-6-dimethylaminophthalide; CVL; see
Fig. 3.1)1,2,3 is the lactone form of the crystal violet dye. CVL has been used for a long time in
carbonless copy paper4, irreversible thermal printing5, and as a thermochromic system in
several applications.6
In 1945 The National Cash Register Company applied for a patent published in 1947,
describing the synthesis of CVL.7 They claimed that CVL has the unique characteristic of

61
being colourless under normal conditions, while it changes to an intense blue colour upon
being placed in adsorption contact with highly polar substances such as clay, silicon dioxide
and magnesium carbonate. Its use for carbonless paper was patented.
In fact CVL presents with a closed-ring lactone form in low-polarity and non-acidic media. In
the presence of a so-called developer, however, the lactone ring opens and a coloured state
develop. In its leuco state (ring-closed form, see Fig. 3.1) the dye is colourless and presents
a π–π* transition with λmax at 280nm.5
In the presence of weak acids or electron acceptors CVL is converted to the
triphenylmethane (TPM) form (open-ring form, see Fig. 3.1), with increased conjugation and
lower energy π–π* transition, λmax at 620nm (depending on the solvent media) giving rise to
strongly coloured state.
Figure 3.1 – Ring opening of Crystal Violet Lactone. Left: closed ring Crystal Violet Lactone (CVL);
Right: open ring Crystal Violet Lactone (CVOL)
The ring opening can also be triggered by the presence of some metals halides such as
Ca2+, Mg2+,7 Ni2+,8 forming the CVOL coloured state. The ability of CVL to complex such
metals allows building an ionochromic system, i.e., a system that change colour upon the
presence of ions.
Spiropyran – Photochromism
Spiropyrans are a widely studied class of compounds which exhibit photochromism (see
section 1.2.2).9 They consist structurally of a pyran derivative linked by a common spiro
carbon atom with another heterocyclic ring. The most well known spiropyran is the
spiroindolinobenzopyran (BIPS).1 In Fig. 3.2 the different species of the (6-NO2,1’N-
CH2CH2OH)-BIPS derivative is represented.
Photochemistry of spiropyrans, especially of 6-NO2-substituted, is well
documented.1,9,10,11,12,13,14,15 Upon UV irradiation of the spiro form the photochemical

62
heterolytic cleavage of the carbon–oxygen bond yields the ring-opened coloured forms, often
called the ‘merocyanine’ form (MERO), which can be either cis-(MERO-c) or trans-(MERO-t),
or the ortho-quinoidal form represented by (MERO-oQ)9,14 (see Fig. 3.2). The cis-
merocyanine isomer is formed as a short-lived intermediate as described by H. Gorner.14
Figure 3.2 - (6-NO2,1’N-CH2CH2OH)-BIPS (SPIRO) and ring open merocyanine (MERO) and
respective isomers (MERO-c, MERO-t and MERO-oQ).
The general behaviour of spiropyrans is the enhancement of colouration upon UV irradiation.
After removal of light, the colour of the spiropyran returns to its original value within a time
which depends essentially on temperature.10
Although spiropyrans are efficient photochromic molecules they show a low fatigue
resistance.8,11 In the attempt to increase the stability of the photochromic system ions were
add to the spiropyran solutions.
Complexes of the merocyanine form of spiropyrans possessing a co-ordinating group16 (like
the 6-NO-8-OMe-BIPSs) with certain d- and f-elements (see Fig. 3.3) was reported in
solution.17,18 It has been also reported merocyanine chelates with several metal ions like
Cu(II)17,16,19,20 Fe(II)17, Ca(II)16, Pb(II)16, Ni(II)16,20, Zn(II)19,20, Nd(III), Mg(II), Mn(II), Co(II),
Cd(II), Pb(II), Y(III), Pr(III), Eu(III), Tb(III), La(III).18
Merocyanine-metal chelates show a spectral blue shift (towards higher energies) compared
to the original spectra of the merocyanine form (c.a. of 100nm blue shift have been
reported).19

63
Figure 3.3 - Merocyanine-metal chelate
Kinetic studies of the chelation between 6-NO2-8-Ome-1’N-CH3-BIPS and Cu(II) shows a two
coupled reactions: (i) formation of the merocyanine form and (ii) substitution of the solvent
coordinated at the metal ion by the ligand. Thermally activated ring opening (i) is the slowest
process, but when the ring opening is induced photochemically the rate limiting process is
the thermal ligand substitution (ii).18, 19
The decolouration process (closed-ring form) may occur via the chelate or via the
uncomplexated merocyanine form. In the first case the chelate dissociates (release of the
metal ion) and this is followed by the formation of the spiropyran (see Fig. 3.4, process K3).
In the second case, the free form of the merocyanine thermally recovers to spiropyran form
(see Fig. 3.4, process K1) pushing the complex equilibria towards dissociation.20
Figure 3.4 – Chelate formation and decolouration chemical equilibrium adapted from ref.20.

64
3.2 Experimental details
Synthesis
N-(2-Hydroxyethyl)-3’,3’-dimethyl-6-nitro-spiro[2H-1-benzopyran-2,2’-indoline] (SPI) was
synthesized as described elsewhere.21 Crystal violet lactone (Aldrich, 97%), iron(III) chloride
hexahydrate (Aldrich), iron(II) sulphate heptahydrate (Merck, 99.5%), anhydrous iron(III)
chloride (Riedel, 98%) and tetrabutylammonium perchlorate (TBAP, Fluka) were certified
analytical grade and used without further purification. Absolute ethanol (Panreac, 99.5%),
methanol (Aldrich, 99.9%) and all other solvents were purchased from Sigma-Aldrich, were
of HPLC grade and used without further purification.
Optical spectroscopic measurements
Absorption spectra were recorded on a Shimadzu UV-2501-PC spectrometer. A standard
cuvette holder and cuvettes with an optical path length of 1 cm were used.
Electrochemical measurements
Cyclic voltammetry was performed in a conventional three-electrode cell under an argon
atmosphere at 21°C using a potentiostat–galvanostat Model 20 Autolab from Eco Chemie BV
(Utrecht, The Netherlands). The collection of data was controlled by GPES version 4.9 Eco
Chemie BV software. The working electrode was a vitreous carbon microelectrode, the
auxiliary electrode was a platinum wire and the reference electrode was Ag/AgCl (RE-5B
from BAS). All solutions were initially saturated with argon (during 20 min.) and kept under
argon atmosphere.
Spectroelectrochemistry
Electrolysis was performed using a two electrochemical half-cell configuration. The first half-
cell was composed of the chromogenic solution, with a platinum net as a working electrode
and a reference electrode (saturated calomel electrode, ref. 921 from Radiometer Analytical).
In the second half-cell, a counter-electrode was immersed in the electrolyte solution. Both
cells were ionically connected by a liquid electrolyte diaphragm using Vycor® glass rods to
avoid solution migration between the half-cells. Absorbance spectra of bulk electrolysed
solution were accomplished using a spectrophotometric flow-through absorbance cell
(175.050-QS from Hellma). Chromogenic solution was pumped from the electrolysis cell
through the flow-through absorbance cell using a peristaltic pump. The solution was looped
between the electrolysis cell and the spectrophotometric cell under an argon atmosphere
during cathodic and anodic electrolysis. All solutions were initially saturated with argon
(during 20 min.) and kept under argon atmosphere.

65
Photochemistry
Photochemical reactions were performed using monochromatic radiation. An irradiation
setup built from a Spex Lamp Housing containing a 450W Xenon lamp was focused in a
monochromator (Jobin Yvon Horiba, model H10 UV) with 5nm slits. Sample volumes of 3 to
8 ml were used. All solutions were initially deaerated for 20 minutes under an argon stream
(Concerning the photochemistry of CVL alone, no spectral changes were observed upon
irradiation. However, in the presence of Fe(III), a slow degradation of CVL under UV light
takes place, but the reaction is strongly minimized in the absence of oxygen).
Mass spectrometry
MALDI-TOF-MS analyses were performed with the positive reflector mode. The apparatus
used is a Voyager-DE™ PRO Biospectrometry Workstation model (Applied Biosytems) and
data were analysed with Voyager V5.1 software.

66
3.3 Results and Discussion
3.3.1 Interaction between CVL and iron ions
Spectroscopic Studies
First experiments were carried out using FeCl3.(H2O)6 and FeSO4·(H2O)7 as possible colour
developers of CVL in ethanol. It turned out that blue colour appears in CVL solutions as soon
as Fe(III) is present in solution, but addition of Fe(II) does not lead to any colour change (see
Fig. 3.5). The presence of Fe(III) gives rise to an absorption spectrum similar to those
obtained for the parent molecule crystal violet in glycerol.22 This behaviour was not only
observed in ethanol, but also in the n-alcohol series from methanol to 1-decanol and also in
polar solvents such as propylene carbonate and even in ionic liquids such as 1-Butyl-3-
methylimidazolium hexafluorophosphate.
400 500 600 7000
1
2
3
Fe(II)
A
Wavelength (nm)
Fe(III)
Figure 3.5 - Absorption spectra of 0.5 mM CVL in the presence of 1 mM Fe(II) (solid line) and 1 mM
Fe(III) (dashed line). On the contrary to Fe(II), the oxidized form Fe(III) opens the lactone ring of CVL.
Anhydrous FeCl3 was used afterwards in order to avoid possible ferric hydroxide precipitates
and a titration in methanol was performed. Fig.3.6 shows the absorption spectra at different
composition fractions of both CVL and FeCl3. As expected, the absorption spectra of the CVL
opened species (CVOL) increase its intensity when the concentration of both solutes is
comparable.

67
300 400 500 600 7000.0
0.2
0.4
0.6
0.8
1.0
A
Wavelength (nm)
0
χFe(III) = 0.40.30.20.1
A
300 400 500 600 700
0.0
0.2
0.4
0.6
0.8
1.0
Wavelength (nm)
A1
χFe(III) = 0.50.60.70.80.9
B
0.0 0.2 0.4 0.6 0.8 1.0
0.0
0.2
0.4
0.6
0.8
1.0
A6
01n
m
χ Fe(III)
C
Job’s plot analysis of the complex between CVL and Fe(III) is presented in Fig. 3.6-C. Result
is not conclusive about possible stoichiometries of the complexes. The association constants
are not high, since there is not a sharp plot as usually observed when a strong complex is
formed. Also, taking into account the CVL concentrations used ([CVL] = 150µM) and the
crystal violet extinction coefficient, even when the absorption spectrum reaches its maximum
value at 601nm, only about 5% of CVL is converted into CVOL (A601nm = 0,9, [CVOL] =
7,5µM). High extinction coefficients are normal for chromogenic dyes. It has been assigned
to CVOL in acidified acetonitrile an extinction coefficient of 1,1x10⁵ mol-1cm-1 at 586nm.5 We
determined almost the same value 1,2x10⁵ mol-1cm-1 at 601nm using the Job’s Plot data.
MALDI-TOF-MS experiments of CVL in methanol in a concentration of 1 mg/ml and no matrix
added (see Mass Spectra 3.1 in pg.64) show the presence of several species. A strong peak
at 415.2 m/z (peak 1 in Mass Spectra 3.1) is found, which is attributed to CVL+ .
Figure 3.6 – Absorption spectra of
CVL/FeCl3 mixtures in methanol
changing the Fe(III) molar fraction
(χFe(III); plot A and B), and
absorption at 601nm (absorption
peak of CVOL) as a function of the
molar fraction (C, line represents
fitting with equilibrium model
described in text).

68
Fragmentation peaks are also found at 371.2 (peak 2 in Mass Spectra 3.1) and 327.2 m/z
(peak 3 in Mass Spectra 3.1), attributed to the loss of dimethylamine groups by CVL.
Solutions with stoichiometry of 1:1 of CVL/FeCl3 (see Mass Spectra 3.2, in pg.65) showed the
same peaks, but showed also additional peaks, namely at 541.1 m/z attributed to CVOL-
FeCl2+ (peak 1 in Mass Spectra 3.2), 506.1 m/z attributed to CVOL-FeCl+ (peak 2 in Mass
Spectra 3.2), and 829.4 m/z attributed to a photogenerated dimer CVL2+ (peak 3 in Mass
Spectra 3.2), among others.
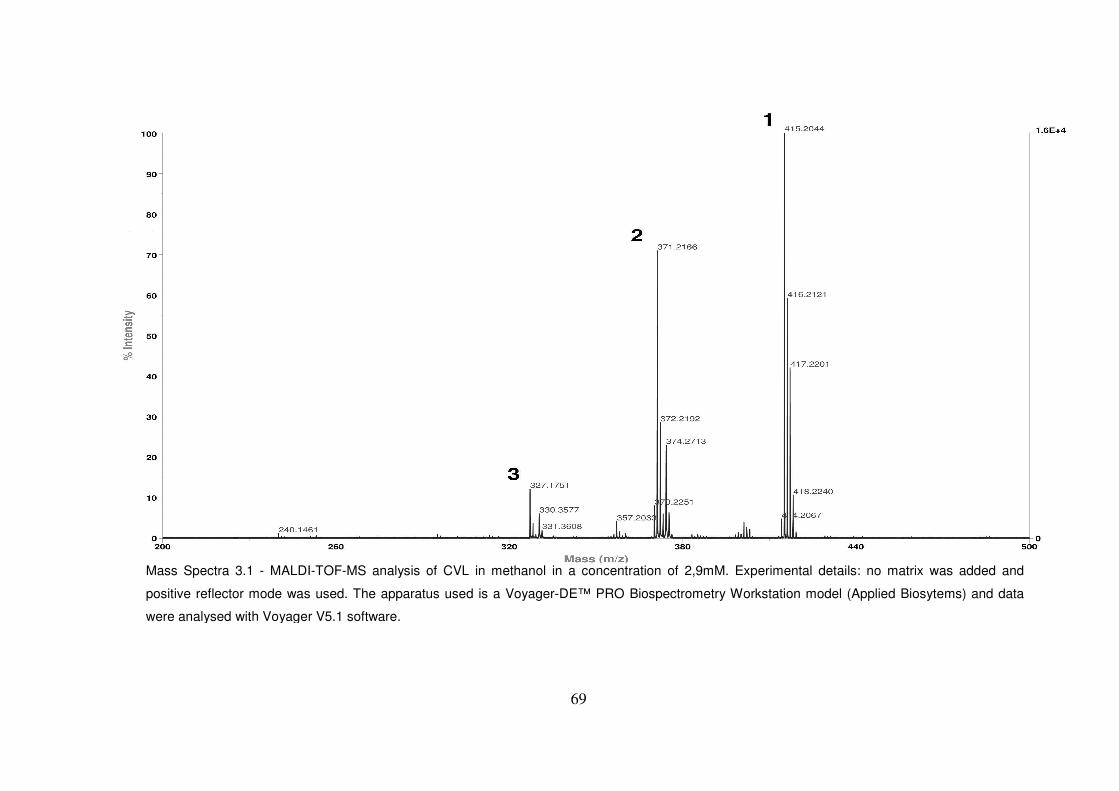
69
Mass Spectra 3.1 - MALDI-TOF-MS analysis of CVL in methanol in a concentration of 2,9mM. Experimental details: no matrix was added and
positive reflector mode was used. The apparatus used is a Voyager-DE™ PRO Biospectrometry Workstation model (Applied Biosytems) and data
were analysed with Voyager V5.1 software.

70
Mass Spectra 3.2 – MALDI-TOF-MS analysis of a mixture of equimolar concentration (2,45mM) of CVL and Fe(III) in methanol. Experimental details: no matrix
was added and positive reflector mode was used. The apparatus used is a Voyager-DE™ PRO Biospectrometry Workstation model (Applied Biosytems) and
data were analysed with Voyager V5.1 software.

71
These experiments show that the coloured species appear probably due to an exchange
between Cl− and CVL in the coordination sphere of Fe(III). Therefore one can write the
following equilibria to describe approximately the system, neglecting the possible presence of
CVOL-FeCl+ species:
Eq.3.1
Eq.3.2
Eq.3.3
From a mass balance, the following equations may be written:
[ ] [ ]
[ ]
++=
−Cl
FeClCVL 3
CVL disscompL KKKC 1 Eq. 3.4
[ ][ ]
[ ]
[ ]
++=
− -Cl
CVL
ClFeCl3FeCl3 disscomp
diss KKK
C 1 Eq.3.5
[ ] [ ] [ ][ ]33 FeClCVLFeClCl disscompdiss KKK +=− Eq. 3.6
[ ] [ ] [ ] [ ][ ]
[ ]−
++=−+
Cl
FeClCVLCVLFeClCVOLCVOL 3
2 disscompL KKK Eq. 3.7
Where CCVL and CFeCl3 are the total concentrations of CVL and FeCl3, respectively. Eq.3.4,
3.5 and 3.6 cannot be solved analytically in an explicit way. Therefore a numerical analysis
was performed in order to fit the observed change in the absorption at 601nm (the peak of
the coloured species CVOL and CVOL-FeCl2+) with two adjustable variables (Kdiss and Kcomp),
since the extinction coefficient of all species and KL are known or could be obtained
independently. Fitting the model into the experimental data, allowed the following solutions to
be obtained:
Kdiss = 1×10⁻⁴ M
Kcomp = 2.2×10³ M−1

72
Fig. 3.6-C shows the fitting to the experimental data. Slight deviations from experimental
results are observed, nevertheless, accordance with MALDI-TOF-MS results is achieved:
only 1:1 stoichiometries for the complexes are observed.
Other ions were studied, but no other metal was found to present the same reversible
ionochromic effect controllable by an electrical stimulus, as shown by the redox pair
Fe(III)/Fe(II).
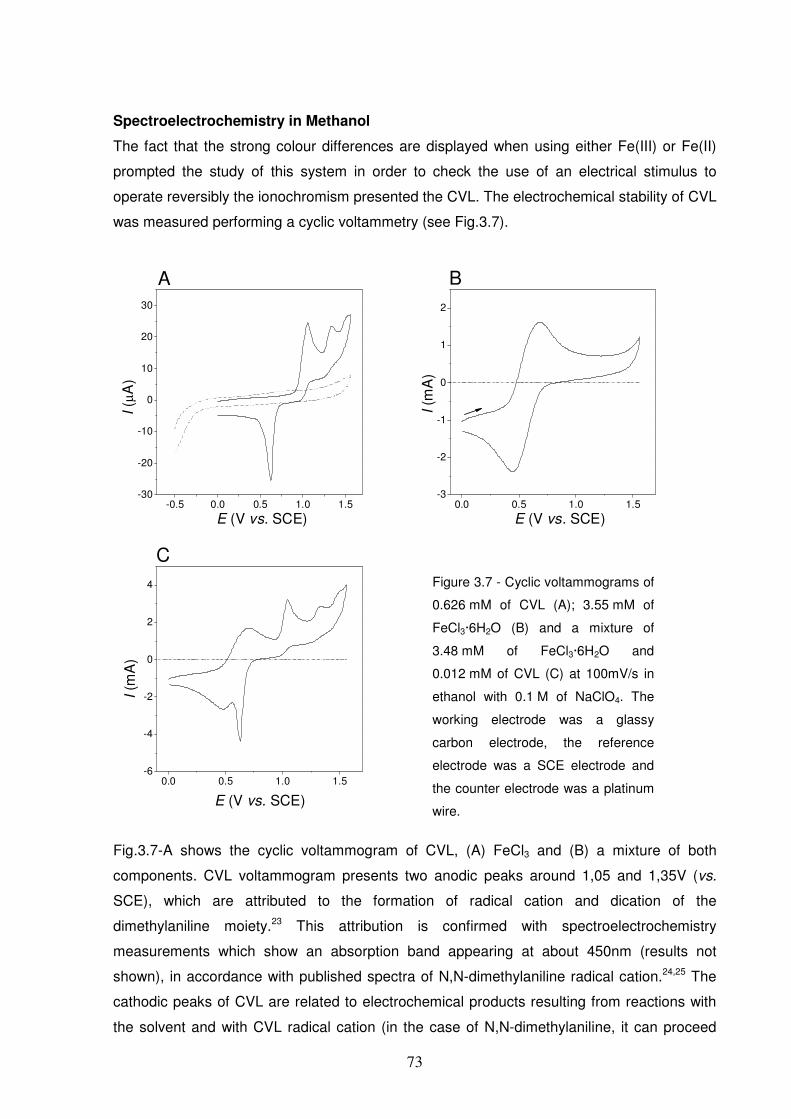
73
Spectroelectrochemistry in Methanol
The fact that the strong colour differences are displayed when using either Fe(III) or Fe(II)
prompted the study of this system in order to check the use of an electrical stimulus to
operate reversibly the ionochromism presented the CVL. The electrochemical stability of CVL
was measured performing a cyclic voltammetry (see Fig.3.7).
-0.5 0.0 0.5 1.0 1.5-30
-20
-10
0
10
20
30
I (µA
)
E (V vs. SCE)
A
0.0 0.5 1.0 1.5-3
-2
-1
0
1
2
B
I (m
A)
E (V vs. SCE)
0.0 0.5 1.0 1.5-6
-4
-2
0
2
4
C
I (m
A)
E (V vs. SCE)
Fig.3.7-A shows the cyclic voltammogram of CVL, (A) FeCl3 and (B) a mixture of both
components. CVL voltammogram presents two anodic peaks around 1,05 and 1,35V (vs.
SCE), which are attributed to the formation of radical cation and dication of the
dimethylaniline moiety.23 This attribution is confirmed with spectroelectrochemistry
measurements which show an absorption band appearing at about 450nm (results not
shown), in accordance with published spectra of N,N-dimethylaniline radical cation.24,25 The
cathodic peaks of CVL are related to electrochemical products resulting from reactions with
the solvent and with CVL radical cation (in the case of N,N-dimethylaniline, it can proceed
Figure 3.7 - Cyclic voltammograms of
0.626 mM of CVL (A); 3.55 mM of
FeCl3·6H2O (B) and a mixture of
3.48 mM of FeCl3·6H2O and
0.012 mM of CVL (C) at 100mV/s in
ethanol with 0.1 M of NaClO4. The
working electrode was a glassy
carbon electrode, the reference
electrode was a SCE electrode and
the counter electrode was a platinum
wire.

74
into a polymerization reaction).23 The Fe(III)/Fe(II) couple in the absence of CVL was also
studied in methanol. In this case, as expected, an anodic peak appears at 0.6 V (vs. SCE)
that we assign to the well known oxidation of Fe(II) to Fe(III), the most stable species in
solution at moderate pH. The cathodic peak occurs at 0.4V (vs. SCE) were reduction of
Fe(III) occurs. Voltammograms obtained shows a quasi-reversible electrochemical
behaviour. The ∆Ep is 244mV, far from the 59mV26 obtained for completely reversible redox
(one electron process) voltammogram, as discussed previously in the literature.27,28 On the
other hand cyclic voltammetry, of a solution of Fe(III), performed at different scan rate
showed a direct correlation between current peak and the square root of the scan rate,
indicating that the system is controlled by diffusion. Finally, the voltammograms of the CVL
and Fe(III) obtained for the mixture (see Fig.3.7-C) are almost the same (no significant shift
of the peak potentials were observed) as the ones obtained for the pure compounds (se
Fig.3.7 – A and B). Therefore it follows that one can selectively perform electrochemical
reactions on the Fe(III)/Fe(II) without affecting CVL by judicious selection of electric
potentials.
The most interesting feature is observed when a complete electrochemical reduction of
Fe(III) to Fe(II) in the presence of CVL is performed. The cathodic electrolysis leads to a
complete conversion to Fe(II) without reducing CVL (Fig.3.8-A), and the blue colour
disappears completely. Afterwards a 0.55 V (vs. SCE) potential can be applied in order to re-
oxidize Fe(II) back to Fe(III), and indeed the blue colour could be recovered. The cycle was
repeated 10 times without showing any significant degradation of the sample, and therefore
this system reveals to be indirectly electrochromic as well.

75
0 500 1000 1500 2000 25000.0
0.5
1.0
1.5
2.0
2.5
CVL (colourless)
CVOL (blue)
A63
1nm
Time (s)
A
0 500 1000 1500 2000 2500-300
-200
-100
0
100
200
300
Cathodic electrolysis
I (µ
A)
Anodic electrolysis
Time (s)
B
0 500 1000 1500 2000 2500
-0.4
-0.2
0.0
0.2
0.4
0.6
293s
Write
Time (s)
E (
V v
s. S
CE
)
Erase
271s
C
Figure 3.8 - Spectroelectrochemical data of 300 µM of CVL in the presence of 1 mM of FeCl3:
Chronoabsorptometry followed at the maximum absorbance (631nm) of CVOL (A);
Chronoamperometry data (B); Square wave potential program (C); Picture shows the optical
transitions of a mixture of 300µM of CVL and 1 mM of FeCl3 between anodic electrolysis (blue colour)
and cathodic electrolysis (colourless).
The process described here is not exclusive of CVL. In fact preliminary results with the
Malachite Green Lactone also showed up the same phenomenon, giving different colours,
promising the possibility of a fine-tuning of the desirable colour.
3.3.2 Adding light stimulus: multi-responsive system
CVL and iron ions interact as shown in Eq. 3.3. CVL solubilised in methanol is converted into
the open form (CVLO) upon adding Fe(III), giving rise to an absorption spectrum (blue
colour) similar to the one obtained for the parent molecule crystal violet. On the contrary,

76
Fe(II) is unable to open the lactone of CVL (see Fig.3.5). Taking profit from this behaviour,
the mixture can be switch reversibly from blue to colourless by the action of an electrical
input. The addition of a photochromic element (SPI) allows the increase from two possible
optical states (colourless ↔ blue) to four (colourless ↔ blue ↔ yellow ↔ magenta, see Fig.
3.12), i.e., a multistimulus system operated with electricity and light.
Interaction between SPI and iron ions
At thermal equilibrium in methanol, the SPI and the MERO are the major and minor species,
respectively (Fig. 3.2 and Fig.3.9-A for χFe(III) = 0).
300 400 500 600 7000.0
0.5
1.0
1.5
MERO
SPI
MERO-Fe(III)
χFe(III): 0,5 0,4 0,3 0,2 0,1 0
A
Wavelength (nm)
A
300 400 500 600 7000.0
0.5
1.0
1.5
B
Fe(III)
χFe(III): 0,5 0,6 0,7 0,8 0,9 1
A
Wavelength (nm)
0.0 0.2 0.4 0.6 0.8 1.00.0
0.5
1.0
1.5
C
A42
0nm
χFe(III)
The spiropyran compound used in this work exhibits the usual photochromic properties of its
family, switching between colourless (SPI) and pink (MERO) by the action of UV light (Fig.
3.2, mechanism A; Eq. 3.8, Fig.3.10-left).
Figure 3.9 - Absorption spectra of
SPI/FeCl3 mixtures in methanol
changing the Fe(III) molar fraction
(χFe(III), plots A and B), and
absorption at 420nm (absorption
peak of MERO-Fe(III)) as a function
of χFe(III) (C, line represents fitting
with equilibrium model described in
text)

77
200 300 400 500 600 7000
1
2
hν266nm
hν530nm
A
Wavelength (nm)200 300 400 500 600 7000
1
2
hν266nm
hν420nmA
Wavelength (nm)
Figure 3.10 - Irradiation of the SPI (0.1 mM) in methanol solution and 0.1 M TBAP (left). The same in
the presence of Fe(III) in 2-fold excess (0.2 mM) (right).
One interesting feature of this compound is its interaction with Fe(III) ions (Eq. 3.9).29 The
addition of Fe(III) to an equilibrated solution of the compound shifts the equilibrium towards a
MERO-Fe(III) complex form, giving rise to a yellow adduct (420nm, see Fig.3.10-B). The
adduct is also photoactive, and it can be converted to the SPI form upon irradiation at 420nm
with the concomitant releasing of the metal ion (Eq. 3.9 and Fig. 3.10-right).
An analogous behaviour is also observed for the interaction of Fe(II) with the MERO species.
In this case, a smaller shift to 496nm appears, but this state was not used in the present
cycle because it is not fully.
MALDI-TOF-MS experiments were not conclusive about the possible complexes formed
between iron ions and MERO. However, the interactions between SPI and Fe(III) were fairly
described with the set of three equilibria: Eq.3.8, Eq.3.9 and Eq.3.10.
Eq. 3.8
Eq. 3.9
Eq. 3.10

78
From a mass balance, the following equations may be written:
[ ] [ ][ ] [ ][ ]MEROFe2Fe(III)MERO FeMERO2FeMEROFeMEROSPIMERO −−− +++= KKKKC 1 Eq.3.11
[ ] [ ][ ] [ ][ ]21 MEROFe2Fe(III)MERO FeMERO2FeMEROFeMEROSPIFe −−− +++= KKKKC Eq.3.12
Fitting this set of equations into the experimental data (results shown in Fig.3.9-C), the
following solutions were obtained:
KSPI = 42.6
KMERO-Fe = 5.9×10⁵ M−1
KMERO2-Fe = 1.52×10⁶ M-1
The SPI alone exhibits redox properties30, but none of the SPI and MERO species are
oxidized in the range of potentials used in this work to operate the Fe(III)/Fe(II) developer:
[-0,2V; 0,8V] (vs. SCE).
-0.2 0.0 0.2 0.4 0.6 0.8 1.0-8
-6
-4
-2
0
2
4
6
8
10
12
I (µA
)
E (V vs. SCE)
Fe(III)Fe(II)
Fe(II)Fe(III)
spiro
Figure 3.11 - Cyclic voltammograms of Fe(III) (full line) and SPI (dashed line) in ethanol.
Electrochemical potential required to operate the Fe(III)/Fe(II) redox process does not affect the SPI
species.
In Fig.3.11 the cyclic voltammetry of iron ions and SPI shows that their redox potentials are
different. The reduction of both species (SPI and MERO) is possible, but at a lower potential
than the one used to operate the developer. On this basis, the electrochemistry of the
mixture of SPI and iron ions can be operated by changing the oxidation state of the metal
79
without significantly interfering with the electrochemistry of the SPI/MERO component,
similar to what happens with the system iron ions and CVL.
3.3.3 Two external inputs, Three species, Four Colours
When equimolar concentrations of CVL and Fe(II) (0.035 mM) and a 25-fold excess of SPI
are mixed (in a total volume of 10 ml) under visible light and electric stimulus (cathodic,
−0.1V vs. SCE), the solution is colourless (Fig. 3.12, state 1). Under these conditions, no
coloured complexes are formed, the predominant species being the leuco CVL form, Fe(II)
and SPI. Blue colour (Fig.3.12, state 2) is reached by re-oxidation of the metal at +0.7V for
20min. The formation of Fe(III) opens the CVL form to yield the CVOL–Fe(III) complex, as
shown previously in Fig. 3.5. Yellow (Fig.3.12, state 3) is obtained upon controlled irradiation
of state 2 with UV light for about 2 min. The SPI form opens to give the MERO coloured
species, which competes more efficiently than CVLO for the Fe(III) ion (note that: log KMERO–
Fe(III) = 5.8, log KMERO2–Fe = 6.2; log KCVLO–Fe(III) = 3.0 at 21°C in MeOH), decreasing
substantially the blue colour and forming the yellow MERO–Fe(III) complex. When all the
Fe(III) has been sequestered by the MERO species (SPI is in excess), further irradiation for
about 15 min converts the remaining SPI form into the red MERO species, giving rise to state
4.(Fig.3.12, state 4). It is worth noting that the system can reverse back from state 4 to state
3 by selective irradiation at 530nm (3 min.) of the MERO species (Eq. 3.8). In the same way,
irradiation of the MERO–Fe(III) complex at 420nm (2 min) permits a change back from state
3 to state 2. In this case, the released Fe(III) (Eq. 3.9 and Eq.3.10) becomes available to
open the CVL to give back the blue colour state 2 (Eq. 3.1). Finally, the system can return to
state 1 by cathodic electrolysis (9 min) of Fe(III) ions to Fe(II) ions. From this point onwards,
the cycle can be repeated.

80
CVLO-Fe(III)
SPIRO
hνννν (420 nm)
CVLSPIRO
+ e-
Fe(II)- e-
CVL
MERO
CVL
MERO-Fe(III)
hνννν (U.V.)
hνννν (530 nm)hνννν (U.V.)
MERO -Fe(III)
SPIRO
2 1
3
4
+-Redox stimulus
Light stimulus
Color Monitoring
Pump
CVLO-Fe(III)
SPIRO
hνννν (420 nm)
CVLSPIRO
+ e-
Fe(II)- e-
CVL
MERO
CVL
MERO-Fe(III)
hνννν (U.V.)
hνννν (530 nm)hνννν (U.V.)
MERO -Fe(III)
SPIRO
2 1
3
4
+-Redox stimulus
Light stimulus
Color Monitoring
Pump
Figure 3.12 - Operation of the CMYT colour model based on the three component system: SPI (1
mM), CVL (35 µM) and Fe(III) (35 µM); methanol, 0.1 M TBAP. Transition between 1 and 2 is
controlled by electricity, transitions between states 2 and 3 and states 3 and 4 are controlled by light.
Pictures of the solutions corresponding to the states 1, 2, 3 and 4 from the left to the rigt.
In Fig.3.13 the spectra of the three coloured species are depicted (molar absorptivities
obtained by fitting Job’s Plot experiments).
0
2x10⁴
4x10⁴
6x10⁴
8x10⁴
1x10⁵
1x10⁵
300 400 500 600 7000
5x10³
1x10⁴
2x10⁴
2x10⁴
3x10⁴
3x10⁴
4x10⁴
ε (M
-1cm
-1) ε (M
-1cm-1)
Wavelength (nm) Figure 3.13 - Molar absorption spectra of the coloured species involved in the photoelectrochromic
system in methanol. MERO (full line); MERO-Fe(III) (dotted line); CVOL-Fe(III) (dashed line).

81
3.4 Conclusions
The spectroelectrochemistry results show that the present ionochromic system is operated
by electricity due to the different affinities between the CVL and the Fe(III)/Fe(II) ions. The
system can be regarded as an indirect electrochromism. If the oxidation is carried out at a
slightly higher potential, however, radical CVL species can appear. Indeed, anodic
electrolysis carried out with 0.60V leaded to the appearance of a band with a peak at 450nm
that compromised the stability of the electrochromic system. While this system does not
depend strongly of the reduction potential, a fine tuning of the oxidation potential was
necessary in order to ensure the electrochemical stability of CVL. Profit is also taken from the
complexes of Fe(III)/Fe(II) with CVL and SPI. Redox stimuli operate the metal ion, leading to
different coloured complexes with CVL (blue) and the coloured MERO (yellow) species
(electro-ionochromism), while light stimuli operate the SPI component (pink). Finally a
colourless state (T state) is reached when we have the following species combination: Fe(II),
CVL and SPI. The present system arises within the framework of supramolecular chemistry,
where the assembly of different molecules can result in properties not present in the
individual components.
Although, no useful and immediate application of the present system can be envisaged (due
to the operation in the liquid state), the chemical equilibria described and optical outputs
obtained will set the fundamentals to develop CMYT systems into the solid state.

82

83
3.5 Bibliography
1. Muthyala, R., Chemistry and applications of leuco dyes. Plenum Press: New York,
1997.
2. Noack, A.; Schroder, A.; Hartmann, H., Synthesis and spectral characterization of a
new class of heterocyclic analogues of Crystal Violet dyes. Angewandte Chemie-
International Edition 2001, 40 (16), 3008-3011.
3. Nair, V.; Thomas, S.; Mathew, S. C.; Abhilash, K. G., Recent advances in the
chemistry of triaryl- and triheteroarylmethanes. Tetrahedron 2006, 62 (29), 6731-
6747.
4. White, M. A., The chemistry behind carbonless copy paper. Journal of Chemical
Education 1998, 75 (9), 1119-1120.
5. MacLaren, D. C.; White, M. A., Dye-developer interactions in the crystal violet
lactone-lauryl gallate binary system: implications for thermochromism. Journal of
Materials Chemistry 2003, 13 (7), 1695-1700.
6. Crystal violet lactone [Online]. Available:
http://en.wikipedia.org/wiki/Crystal_violet_lactone [Accessed April 2010].
7. Clyde, S. A. 1947. 3,3-bis-(4-dimethylamino phenyl)-6-dimethylamino phthalide.
United States of America patent application US2417897.
8. Zhu, C. F.; Wu, A. B., Studies on the synthesis and thermochromic properties of
crystal violet lactone and its reversible thermochromic complexes. Thermochimica
Acta 2005, 425 (1-2), 7-12.
9. Bamfield, P., Chromic phenomena - the technological applications of colour
chemistry. The Royal Society of Chemistry: Cambridge, 2001.
10. Flannery, J. B., Photo- and thermochromic transients from substituted 1',3',3'-
trimethylindolinobenzospiropyrans. Journal of the American Chemical Society 1968,
90 (21), 5660-5671.
11. Sakuragi, M.; Aoki, K.; Tamaki, T.; Ichimura, K., The role of triplet-state of
nitrospiropyran in their photochromic reaction. Bulletin of the Chemical Society of
Japan 1990, 63 (1), 74-79.
12. Pimienta, V.; Lavabre, D.; Levy, G.; Samat, A.; Guglielmetti, R.; Micheau, J. C.,
Kinetic analysis of photochromic systems under continuous irradiation. Application to
spiropyrans. Journal of Physical Chemistry 1996, 100 (11), 4485-4490.
13. Chibisov, A. K.; Gorner, H., Photoprocesses in spiropyran-derived merocyanines.
Journal of Physical Chemistry A 1997, 101 (24), 4305-4312.

84
14. Gorner, H., Photochemical ring opening in nitrospiropyrans: triplet pathway and the
role of singlet molecular oxygen. Chemical Physics Letters 1998, 282 (5-6), 381-390.
15. Zhu, L. Y.; Zhu, M. Q.; Hurst, J. K.; Li, A. D. Q., Light-controlled molecular switches
modulate nanocrystal fluorescence. Journal of the American Chemical Society 2005,
127 (25), 8968-8970.
16. Tamaki, T.; Ichimura, K., Photochromic chelating spironaphthoxazines. Journal of the
Chemical Society-Chemical Communications 1989, (19), 1477-1479.
17. Phillips, J. P.; Mueller, A.; Przystal, F., Photochromic chelating agents. Journal of the
American Chemical Society 1965, 87 (17), 4020.
18. Chibisov, A. K.; Gorner, H., Complexes of spiropyran-derived merocyanines with
metal ions: relaxation kinetics, photochemistry and solvent effects. Chemical Physics
1998, 237 (3), 425-442.
19. Zhou, J. W.; Li, Y. T.; Tang, Y. W.; Song, X. Q., UV-Vis spectroscopic study of the
solvatochromism and chelating reaction of a benzothiazoline merocyanine in mixed-
solvents. Journal of Solution Chemistry 1995, 24 (9), 925-933.
20. Zhou, J. W.; Li, Y. T.; Song, X. Q., Investigation of the chelation of a photochromic
spiropyran with Cu(II). Journal of Photochemistry and Photobiology a-Chemistry
1995, 87 (1), 37-42.
21. Raymo, F. M.; Giordani, S., Signal processing at the molecular level. Journal of the
American Chemical Society 2001, 123 (19), 4651-4652.
22. Du, H.; Fuh, R. C. A.; Li, J. Z.; Corkan, L. A.; Lindsey, J. S., PhotochemCAD: A
computer-aided design and research tool in photochemistry. Photochemistry and
Photobiology 1998, 68 (2), 141-142.
23. Ocon, P.; Herrasti, P., Electrosynthesis and properties of N,N-dimethylaniline. Journal
of Materials Science 1991, 26 (23), 6487-6490.
24. Malinauskas, A.; Holze, R., An in situ UV-Vis spectroelectrochemical investigation of
the initial stages in the electrooxidation of selected ring- and nitrogen-alkylsubstituted
anilines. Electrochimica Acta 1999, 44 (15), 2613-2623.
25. Karpiuk, J., Dual fluorescence from two polar excited states in one molecule.
Structurally additive photophysics of crystal violet lactone. Journal of Physical
Chemistry A 2004, 108 (51), 11183-11195.
26. Bard, A. J.; Faulkner, L. R., Electrochemical methods - fundamentals and
applications. 2nd ed.; Wiley: New York, 2001.
27. Ugo, P.; Moretto, L. M.; Rudello, D.; Birriel, E.; Chevalet, J., Trace iron determination
by cyclic and multiple square-wave voltammetry at nafion coated electrodes.
Application to pore-water analysis. Electroanalysis 2001, 13 (8-9), 661-668.

85
28. Torres, L. M.; Gil, A. F.; Galicia, L.; Gonzalez, I., Understanding the difference
between inner- and outer-sphere mechanisms - An electrochemical experiment.
Journal of Chemical Education 1996, 73 (8), 808-810.
29. Wojtyk, J. T. C.; Kazmaier, P. M.; Buncel, E., Effects of metal ion complexation on the
spiropyran-merocyanine interconversion: development of a thermally stable photo-
switch. Chemical Communications 1998, (16), 1703-1704.
30. Zhi, J. F.; Baba, R.; Hashimoto, K.; Fujishima, A., Photoelectrochromic properties of a
spirobenzopyran derivative. Journal of Photochemistry and Photobiology a-Chemistry
1995, 92 (1-2), 91-97.

86

87
Chapter 4
Electrocolorimetry of electrochromic materials
on flexible ITO electrodes
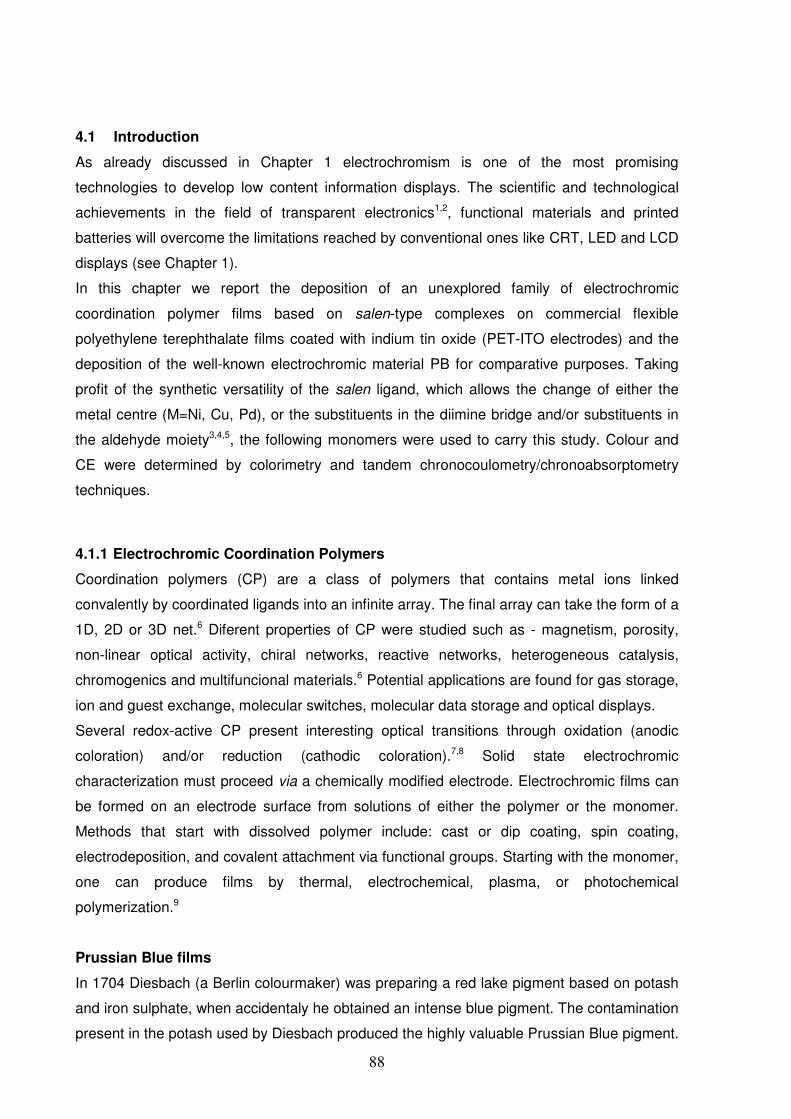
88
4.1 Introduction
As already discussed in Chapter 1 electrochromism is one of the most promising
technologies to develop low content information displays. The scientific and technological
achievements in the field of transparent electronics1,2, functional materials and printed
batteries will overcome the limitations reached by conventional ones like CRT, LED and LCD
displays (see Chapter 1).
In this chapter we report the deposition of an unexplored family of electrochromic
coordination polymer films based on salen-type complexes on commercial flexible
polyethylene terephthalate films coated with indium tin oxide (PET-ITO electrodes) and the
deposition of the well-known electrochromic material PB for comparative purposes. Taking
profit of the synthetic versatility of the salen ligand, which allows the change of either the
metal centre (M=Ni, Cu, Pd), or the substituents in the diimine bridge and/or substituents in
the aldehyde moiety3,4,5, the following monomers were used to carry this study. Colour and
CE were determined by colorimetry and tandem chronocoulometry/chronoabsorptometry
techniques.
4.1.1 Electrochromic Coordination Polymers
Coordination polymers (CP) are a class of polymers that contains metal ions linked
convalently by coordinated ligands into an infinite array. The final array can take the form of a
1D, 2D or 3D net.6 Diferent properties of CP were studied such as - magnetism, porosity,
non-linear optical activity, chiral networks, reactive networks, heterogeneous catalysis,
chromogenics and multifuncional materials.6 Potential applications are found for gas storage,
ion and guest exchange, molecular switches, molecular data storage and optical displays.
Several redox-active CP present interesting optical transitions through oxidation (anodic
coloration) and/or reduction (cathodic coloration).7,8 Solid state electrochromic
characterization must proceed via a chemically modified electrode. Electrochromic films can
be formed on an electrode surface from solutions of either the polymer or the monomer.
Methods that start with dissolved polymer include: cast or dip coating, spin coating,
electrodeposition, and covalent attachment via functional groups. Starting with the monomer,
one can produce films by thermal, electrochemical, plasma, or photochemical
polymerization.9
Prussian Blue films
In 1704 Diesbach (a Berlin colourmaker) was preparing a red lake pigment based on potash
and iron sulphate, when accidentaly he obtained an intense blue pigment. The contamination
present in the potash used by Diesbach produced the highly valuable Prussian Blue pigment.

89
The three main blue pigments used in this time were the Ultramarine produced from the very
expensive lapis lazuli mineral; smalt, a cobalt blue glass which presents a weak covering
power; and indigo extracted from a native Indian plant very susceptible to fading.10 Prussian
Blue arrived as a winner substitute due to its great coloring power and good stability towards
colour fading and soon became commercially available. Diesbach obtained with this failed
synthesis not only a valuable blue pigment, which had several social and historical
consequences, but he became also the first man to synthetise a coordination polymer.6
Prussian Blue (PB) is a polynuclear transition-metal hexacyanometallates able to form
coordinating polymer. The general formula of transition-metal hexacyanometallates is
M’m[M’’(CN)6]n where M’ and M’’ are transition metals with different oxidation numbers and m
and n are integral numbers.
Chemical synthesis of PB is performed by the mixture of [FeIII(CN)6]3- or [FeII(CN)6]
2- and
Fe(II) or Fe(III), respectively. When a solution of [FeIII(CN)6]3- is poured into a flask containing
Fe(II) solution an espectacular blue pigment is instantaneously precipitated. Addition of an
excess of [FeIII(CN)6]3- will capp PB nanoparticles and make them dispersible in water
(100mg/ml).11
PB films can also be obtained by reductive electrochemical polymerization
(electropolymerization) of the brown/red adduct obtained from an equimolar solution of ferric
ferricyanide and Fe(III) ions (see Eq. 4.1). Potentiodinamic12 or potentiostatic13 techniques
can be used.
Eq. 4.1
The exact composition of PB solid is extremely preparation-sensitive. Two different crystal
composition were identified; “insoluble” PB, see Eq. 4.2 and and “soluble” PB, Eq. 4.3.
Although, their designation are “insoluble” and “soluble”, both forms are highly insoluble in
water (Kps=10-40).14
Eq. 4. 2
Eq. 4. 3
The net charge of the PB complex is neutralized by positive counter-ions: a) Fe(III) in
“insoluble” PB and K+ in “soluble” PB. X-Ray powder diffraction for “soluble” PB indicates a
face-centered cubic lattice, where Fe(II) coordinates octahedrally with the carbon atom of the
cyanide ligands and Fe(III) coordinates octahedrally with the nitrogen atoms of the cyanide

90
ligands (see Fig.4.1).15 On the other hand, “insoluble” PB presents a primitive cubic lattice
where one quarter of the Fe(II) sites are vacant, and there are no interstitial ions. Both
crystals, “insoluble” and “soluble” PB, are pure crystaline forms and the most probable
situation is to obtain a polycrystaline compound due to the rapid growth of the crystals during
synthesis, just like in electrochemical polymerization.14
Figure 4.1 - 3D geometry of “soluble” Prussian Blue crystal; full circle: Fe(III), open circle: Fe(II)
The cathodic electropolymerization of PB results at the surface of inert electrodes results in a
uniform blue film – PB modified electrode. It is still not clear which PB crystal form
(“insoluble” or “soluble”) predominates in the films. Mortimer et al. observed variation of the
cyclic voltammograms of the PB films between the first scan and the subsequent scans. It is
also observed a variation of the electronic spectra between the as prepared PB film and after
some voltammetric cycles.16 Based on this observations it is claimed that PB is
electropolymerized as “insoluble” PB and when submitted to cyclic voltammetry it is fully or
partially converted to “soluble” PB.14 Other authors believe that electropolymerized PB films
are in any circunstance “insoluble” PB form.17 Through the text we will consider that the
electrochemical response of PB modified electrodes is mainly due to “soluble” PB crystals.
Electrochemistry of PB films deposited over a platinum electrode was first studied in 1978 by
Neff.18 Neff observed two redox processes of the PB modified electrode, one on the anodic
side of the voltammogram and a second on the cathodic side. He also reports optical
transitions of the deposited PB film. PB film is bright blue at 0.6V (vs. SCE), whereas on the
cathodic side (0.0 V vs. SCE) it was colourless. At a potential of ca. 1V (vs. SCE), the film
became green. He also stated that these colours can be switched back and forth rapidly by
changing the potential.

91
Eq. 4.4
Eq. 4.5
The electronic spectra of the PY films shows a maximum of absorbance at 425nm that
corresponds to the maximum of absorbance of the complex [FeIII(CN)6]3- in solution.14
Reversible electrochemical switching between the different PB redox states (PB, PY and
PW) allows to display three different optical states: blue, yellow and uncoloured (see Eq. 4.4
and 4.5).
Efficient electrochromism found in PB films has lead its application for electrochromic
devices (ECD). In 1982 a seven segmented electrochromic display was reported using PB.19
A Nafion membrane was used as the electrolyte and the PB film support, layered between
two glass transparent electrodes. A more exoctic architecture was reported by Carpenter et
al. They assemble an ECD using PB has the electrochromic layer and the electrolyte.20 This
was based on the fact that the highly porous PB films conduct efficiently K+ ions. Here again
a film of PB was layered between two transparent glass electrodes. More conventional
structures have been studied using a complementar electrochromic material relative to PB –
tungsten trioxide (WO3).21 Since WO3 and PB are cathodically and anodically coloured
respectively, they can be used to build complementar ECD. PB and WO3 films are deposited
over optically transparent electrodes (OTE’s) and separated by an electrolyte layer. In such
devices the colours of both electrochromic materials are summed, since while one is reduced
the other is oxidized. Other complementar materials have been used as counter-electrode for
PB layer, one of the well known is the poly(ethylenedioxitiophene) (PEDOT). PEDOT
presents also a cathodic colouration that allows using it in a single device with PB.22 Other
aproaches have combined PB with conducting polymers.23 Poly(aniline) was used as a co-
electrochromic layer with PB enhancing the colour density of devices using WO3 as
complementar electrochromic layer.24
Other hexacyanometallates have been synthetised using different metals such as Ni, Co;
however, their electrochromic properties are far from those found for the PB.14
KFe(III)[Fe(II)(CN)6] + K+ + e- K2Fe(II)[Fe(II)(CN)6]
Blue Colourless
Fe(III)[Fe(III)(CN)6]
Blue Yellow
KFe(III)[Fe(II)(CN)6] - K+ - e-

92
Polymer films based on salen-type complexes
Late transition metal complexes (M=Ni, Cu, Pd and Pt) with salen-type ligands -[M(salen)] -
can form CP by oxidative polymerization at the electrode surfaces. General structure of the
salen-type ligand is a bis(salicylaldimine) which complexes with metal through O and N
coordinating atoms (see Fig. 4.2)
Figure 4.2 – General strucuture of salen-type complexes.
Electrochemistry of [M(salen)] compounds is strongly influenced by the donor strenght of the
solvent. It has been experimentally observed that [Ni(salen)] is reversibly oxidized in strong
donor solvents25, however, in the presence of acetonitrile the oxidation of the Ni complex
results in a polymerization reaction.
In weak or moderatly donor solvents like acetone, methylene chloride and propylene
carbonate oxidation of [M(salen)] leds to its polymerization forming a film over the electrode
surface.25, 26 Two different mechanisms concerning the electropolymerization are proposed in
the literature25,26,27: metal-based26 and ligand-based.27 During the last ten years experimental
data from coulometry, FTIR and EPR of [M(salen)] polymers indicates that the most probable
polymerization mechanism is ligand-based.3,4,28,29
Despite the controversy related to the oxidation center responsible for the polymerization of
[M(salen)], it is concensual that the polymer is formed by phenyl-phenyl linkage of the ligand
(see Fig. 4.3); based on the carbon-carbon coupling mechanism of phenols either in ortho or
para position.3,4,28,29
Figure 4.3 – Proposed polymer strucuture of poly[M(salen)]31

93
Monomer solutions of [M(salen)] are potentiodinamically cycled within an electrochemical
window where oxidative polymerization of the monomer occurs. During the first voltammetric
cycles, film thickness increases linearly until it reaches a maximum. The maximum thickness
is accompanied by a maximum of the peak current obtained on the cyclic voltammetry and
afterwards it starts to decrease. Maximum film thickness is limited by the density of the
resultant film packing over the surface of the electrode and redox-active sites accessibility.
Electrochemical behaviour resulting from such films ranges from a thin-film with a charge
transfer regime to a diffusional controled regime. Both situations can be obtained and are
related with the number of electropolymerization cycles performed.3
Cyclic voltammetry of several poly[M(salen)] films have shown a one electron reversible
reduction of the metal complex in the polymer Ni(II)/Ni(I)27 and a second pocess at higher
potencials associated with ligand based oxidation.4 It has been found that the nature of the
metal complex influences the potential at which the ligand based redox process occurs.
Polymers based on Pd(II) show lower potentials for oxidation than the homologous polymers
based on metals of the first transition serie, Ni(II) and Cu(II).4
Poly[M(salen)] modified electrodes were shown to exhibit polyphenylene-like properties
(ligand based electrochemical responses), with the transition metal cations acting as a bridge
between the phenyl rings. The proposed electronic structure of the poly[M(salen)] is
analogous to that of a p-type semi-conducting organic polymer.3, 4, 28, 29, 30, 32, 33
Spectroelectrochemical studies on poly[M(salen)], M=Ni(II)33 Cu(II)3 and Pd(II)4 show
interesting electrochromic behaviour at the surface of the electrode. Electronic spectra of the
poly[M(salen)] show significant changes from the reduced (undoped) to the oxidized (doped)
state. General UV-Vis spectra of the poly[M(salen)] present several bands that are also
present in the respective monomer UV-Vis spectra: d-d transition, intraligand transition and
charge transfer. Polymer bands can suffer significant shift within the UV-Vis spectra
compared to their monomer counterpart, due to high monomer condensation. New bands are
also found within the polymer spectra when it is fully oxidized. The new electronic transition
found in the polymer lay within the visible range (380-780nm). Electronic transition
dependence with redox states of the poly[M(salen)] have been interpreted based on the
polaronic model, see Fig. 4.4.

94
λ1
λ2 λ3
λ2 - λ3
Conduction Band
Valence Band
Figure 4.4 – Schematic band structure of a dopped semi-conductor. λ1: band-gap; dashed lines:
charge carriers (polarons)
The oxidized state of the poly[M(salen)] presents a larger absorption through the visible
region of the spectrum when compared to the absorption spectra of the reduced state. The
dopping of the poly[M(salen)] with charge carriers (p-type semiconductor) allows three new
electronic transitions (λ2, λ3 and λ2-λ3, see Fig.4.4) to occur, enhancing the absorption bands
within the visible range of the spectrum. Reversible dopping/undopping state of the
poly[M(salen)] allows to operate successfully the film as an electrochromic material.
4.1.2 Colorimetry
Colour is a very subjective and environment-dependent property, influenced by object, light
source spectral properties, level of illumination, background lightness and
psychological/physiological factors.34 Colour sense results from the mental interpretation of
the signals send by the optical nerves when stimulated by reflected, transmitted or emitted
light from an object. The eye captures the light similarly to a photographic camera, an
ingenious lens is composed by the cornea, iris, lens, aqueous and vitreous Humor and the
photoreceptors (cones and rods) act as the light sensor.
The light excites the photoreceptors cells situated in the retina. A cis-trans
photoisomerization of retinal molecule (present in the photoreceptors) triggers a cascade of
electrical stimulus through a complex network of neuronal cells until the signal reaches the
optical nerve. Finally, the cortex receives the information which is translated to our
consciousness of colour.
Besides the biological factors, colour we perceive is also influenced by ambience factors.
The most relevant ones are: the light source of illumination (illuminant), the background
colour, the size of the object, the angle between the source of light and the object, and the
angle between the observer and the object.
The spectral light of the illuminant will vary depending on the source; e.g. the sun,
incandescent lamp, fluorescent lamp, etc…; each kind of lamp has a unique spectrum of
emitted electromagnetic radiation. Background and ambience surrounding the object

95
influence how we perceive its colour. In Fig.4.5 the perceived blue coloured strips observed
on the right of the figure and the apparently green strips on the left were printed with the
same ink composition. This phenomenon reflects the influence of the colour background and
the perceived colour stimulus of the object.
Figure 4.5 – Visual illusion due to different contrast between the object and the surrounding. At the left
side of the image the green strips are actually of the same colour than the blue strips on the right.
Several authors have reported human capacity to distinguish from one hundred thousand to
ten million different colours.35 The large palette of colours we can distinguish surpass our
capacity to create an objective and simple nomenclature. Since Newton studies on optics,
geometric colour order systems have been proposed.36
With the development and accessibility of spectrophotometric techniques within the
academia and industry, colour scientists were seeking to develop electronic colour
measurements able to predict the human colour perception – colorimetry.
Colorimetry can be defined as a science devoted to the colour
measurement/characterization, trying to obtain the most reliable colours coordinates.
Starting in 1931, much of this work has been done under the direction of the “Commission
Internationale de l'Éclairage” (CIE), an international clearinghouse for colour research at
universities and research laboratories – CIE colorimetry.37
All the models derived from CIE colorimetry are based on the CIE-XYZ colour-matching
system. X, Y and Z are a set of virtual primary colours (related to real set of primary colours -
RGB)38 defined by the CIE 1931 colour-matching functions - x(λ), y(λ) and z(λ) respectively
(see Fig.4.6).
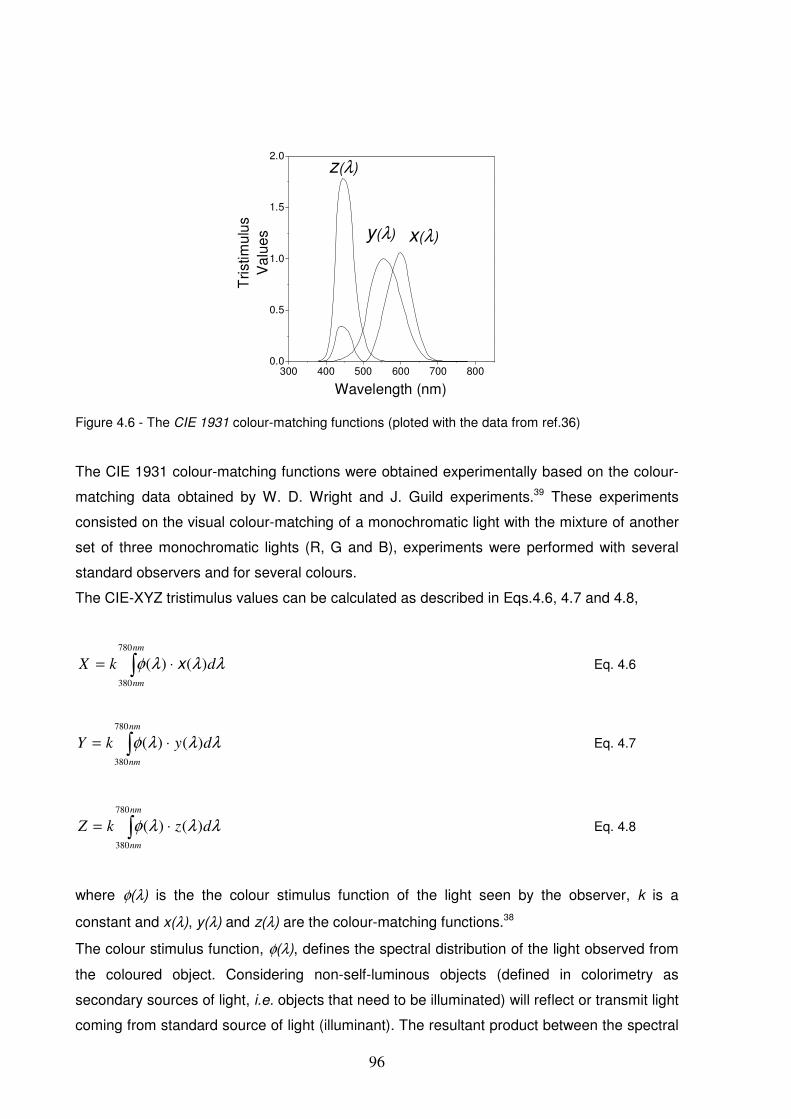
96
300 400 500 600 700 8000.0
0.5
1.0
1.5
2.0
Wavelength (nm)
x(λ)y(λ)
z(λ)
Tris
timul
usV
alue
s
Figure 4.6 - The CIE 1931 colour-matching functions (ploted with the data from ref.36)
The CIE 1931 colour-matching functions were obtained experimentally based on the colour-
matching data obtained by W. D. Wright and J. Guild experiments.39 These experiments
consisted on the visual colour-matching of a monochromatic light with the mixture of another
set of three monochromatic lights (R, G and B), experiments were performed with several
standard observers and for several colours.
The CIE-XYZ tristimulus values can be calculated as described in Eqs.4.6, 4.7 and 4.8,
∫ ⋅=nm
nm
dkX
780
380
)()( λλλφ x Eq. 4.6
∫ ⋅=nm
nm
dykY
780
380
)()( λλλφ Eq. 4.7
∫ ⋅=nm
nm
dzkZ
780
380
)()( λλλφ Eq. 4.8
where φ(λ) is the the colour stimulus function of the light seen by the observer, k is a
constant and x(λ), y(λ) and z(λ) are the colour-matching functions.38
The colour stimulus function, φ(λ), defines the spectral distribution of the light observed from
the coloured object. Considering non-self-luminous objects (defined in colorimetry as
secondary sources of light, i.e. objects that need to be illuminated) will reflect or transmit light
coming from standard source of light (illuminant). The resultant product between the spectral

97
reflectance factor, R(λ), or the spectral transmitance factor, T(λ) with the relative spectral
power distribution of the illuminat S(λ) defines φ(λ), Eqs. 4.9 and 4.10.
)()()( λλλφ SRR = Eq. 4.9
)()()( λλλφ STT = Eq. 4.10
The k value is an experimental calibrating factor (see Eq.4.11).38
∫ ⋅
=nm
nm
dyS
k780
380
)()(
100
λλλ
Eq. 4.11
The colour-matching functions x(λ), y(λ) and z(λ) derived from W. D. Wright and J. Guild data
defined the standard CIE 1931 colorimetric observer. Later in 1964 CIE defined a new
standard observer to improve colorimetric calculations when larger colour stimulus is used. A
new set of colour-matching functions - x10(λ), y10(λ), z10(λ) - where calculated based on new
studies on colour-match functions using a 10º angle observer. The CIE 1931 standard
colorimetric observer was based on experiments where a 2º angle observer was used. The
angle of vision of the observer will determine the colour perception of the object.38
To reproduce conveniently the colour perception, the S(λ) is a critical factor as we can see in
Eq. 4.9 and 4.10. To be able to reproduce a colour stimulus we need to use standard
sources of irradiation with a determined spectral power distribution – illuminant. For this
reason in 1931 the CIE defined three standard illuminants: A, B and C.
The A illuminant was designed in a manner to resemble to an average incandescent light,
illuminant B is similar to direct sunlight and the illuminant C emulates an average daylight.
Later in 1964 the CIE defined a new illuminant, the D65; in contrast to the precedent
illuminants the power spectra of this illuminant is also defined in the UV region and is equal
to a specific period of the day which was considered as the most representative spectral
distribution of sunlight.38
Any colour stimulus can be fully described with the tristimulus values. But, for several
reasons it is not necessary to have absolute information of the tristimulus values, and so a
chromaticity x, y, z system can be derived from the tristimulus values X, Y and Z, see Eqs.
4.9, 4.10 and 4.11.38

98
ZYX
Xx
++= Eq. 4.12
ZYX
Yy
++= Eq. 4.13
ZYX
Zz
++= Eq. 4.14
From these values a chromaticity diagram can be plotted based on x, y coordinates (see
Fig.4.7). These values allow us to compare two colours and determine if they match. A
chromaticity diagram was found to be useful in industry to control colour reproductions and to
obtain useful information in a simple and direct manner.
Within the chromaticity diagram (see Fig.4.7), we can define the coordinates of the visible
monochromatic light (horseshoe-shaped line) called the spectral locus. The non-spectral
(purples) is within the line that connects the point of 380nm and 780nm.40 The region
enclosed by the horseshoe-shaped line and the non-spectral colour line lays the colour locus
which contains all the colours. The point W within this locus is known as the white point, and
its location is dependent on the light source used in either reflection or transmission
experiments. The location of an object coulour on the xy diagram allows to determine the
dominant wavelenght of the colour λd. The λd of a colour gives the closest hue found in
monochromatic light wich best describes the sample colour. Consider a colour stimulus P,
the hue of that sample (see Fig.4.7) is determined by drawing a straight line through the W
point and the P point to the spectral locus.The intercection of the drawn line and the spectral
locus give the λd for the colour stimulus P. For points lying along the purple line (see point S
in Fig. 4.7), a straight line containing the point and the W point, and the purple line is
reflected back through the white point to the spectral locus, yielding the dominant wavelength
of the complementary color (λc,d).40
Chromaticity diagram is not suitable to determine wether two xy coordinates colours are or
are not distinguishable to a standard observer. It means that the same geometric distance
between two colours in the chromaticity diagram will not represent the same apparent colour
variation in all the colour locus area.38

99
0.0 0.3 0.6
0.0
0.3
0.6
0.9
P
λd
Spectral colours
780nm
685nm
585nm555nm
500nm
455nm
380nm
Non-spectral colours
y
x
W
S
λc,d
Figure 4.7 – Chromaticity diagram and colorimetric information that can be extracted from it.40
In order to obtain a uniform colour space, the CIE stablished in 1976 the CIE-L*a*b*
(CIELAB) colour system. The CIELAB coordinates are based on the tri-stimulus colour
matching defined by the CIE-XYZ. A non-linear transform of the X, Y and Z values follows,
resulting in opponent-type coordinates (mathematical equations can be consulted in refs.
38,41) L*, a* and b*.
The parameter L* is correlated with the luminance of the stimulus which can be understood
as the lightness (larger values of L* means lighter colour). The parameter a* is correlated
with the redness-greenness of the colour (positive a* values points in the direction of red
colour and negative values in the direction of green colour). Finally b* parameter is correlated
with yellow-blueness of the colour (positive b* values points in the direction of yellow and
negative in the direction of blue colour).34,38
Euclidean distances in CIELAB color space can be used to represent approximately the
perceived magnitude of color differences between object color stimuli of the same size and
shape, viewed in identical conditions. In Eq. 4.15 CIELAB color difference is
calculated, ∆E*ab. The minimum value of ∆E*ab which represents two distinguishable colours
is a matter of controversy. If the system were perfect than one unit of , ∆E*ab should
represent two distinguishable colours, however, this is not true. We will consider through our
text that , ∆E*ab > 6 will be perceived as different colour.
( ) ( ) ( )[ ]222**** baLE ab ∆+∆+∆=∆ Eq. 4.15

100
4.2 Experimental details
General
Iron(III) chloride hexahydrate (FeCl3·6H2O, Merck), potassium hexacyanoferrate (III)
(K3[Fe(CN)6], Fluka), potassium chloride (KCl, Pronalab) and tetrabutylammonium
perchlorate (TBAP, Fluka) were certified p. a. grade and used without further purification.
Acetonitrile (Riedel, p. a. grade) was dried following a procedure reported in literature42: pre-
drying over CaH2 during 2 days, followed by reflux and distillation.
The compounds 2-hydroxy-3-methylbenzaldehyde, ethylenediamine and palladium acetate
were purchased from Aldrich and were used as received, except ethylenediamine, which was
distilled prior to use.
Prussian blue film preparation
PB films were electrogenerated on flexible electrodes of polyethylene terephthalate films
coated with indium tin oxide (PET/ITO, Aldrich with a resistivity of 60Ω/sq and a useful area
between 3 and 4 cm2 (0.9×4 cm2)). The electrochemical polymerizations were performed in a
1 cm path quartz cuvette. A three-electrode holder was constructed to fit in the
electrochemical cell. An aqueous solution of 5 mM K3[Fe(CN)6], 5 mM FeCl3·6H2O and 0.2 M
KCl was used as PB polymerization solution. Electropolymerization was conducted under a
constant applied voltage of 0.55 V (vs. Ag/AgCl), during 300 s. After deposition, the electrode
was gently rinsed with distilled water.
Salen-type complexes of Cu(II), Ni(II) and Pd(II) film preparation
The complexes N,N′-2,3-dimethylbutane-2,3-dyil-bis-(3-methoxysalicylideneiminate)
metal(II), M=Ni or Cu ([Ni(3-MeOsaltMe)] or [Cu(3-MeOsaltMe)]) were prepared as described
elsewhere.32 The complex N,N′-bis(3-methylsalicylideneiminate)Pd(II), [Pd(3-Mesalen)], was
synthesized by refluxing an acetonitrile solution containing stoichiometric amounts of
palladium(II) acetate and the ligand H2(3-Mesalen), prepared previously by standard
procedures43; the complex was recrystalized from dichloromethane.
[M(salen)], M=Ni, Cu and Pd complexes were electropolymerized by potential cycling at a
scan rate 0.02 V/s, using a flexible PET/ITO (Aldrich with a resistivity of 60 Ω/sq and useful
area between 3 and 4 cm2 (0.9×4 cm2)) electrodes as working electrode in a 1 cm path
quartz cuvette. The potential range used in film polymerization depends on the metal
complex: for the nickel complex was 0.0–1.3 V, for the copper complex was −0.15 to 1.4 V
and for the Pd complex was −0.1 to 1.2 V (vs. Ag/AgCl).

101
Electrochemical measurements
Electrochemical polymerization and choronocoulometry/chronoabsorptometry were
performed with a conventional three-electrode cell using a computer-controlled computerized
potentiostat-galvanostat model 20 Autolab, from Eco-Chemie Inc. The collection of data was
controlled by the GPES Version 4.9 Eco Chemie B.V. Software (Utrecht, The Netherlands).
The working electrodes were constructed as described above, auxiliary electrode was a
platinum wire and the reference electrode was an Ag/AgCl (BAS). Electrochemical
measurements of PB films were performed in a 0.2 M KCl aqueous solution and for salen-
type complexes were performed in 0.1 M TBAP salt in freshly dried/distilled acetonitrile.
Spectroscopic/colorimetric measurements
UV/Vis absorbance spectra and chronoabsorptometry were recorded in a Shimadzu
UV2501-PC spectrophotometer at 1nm resolution. Colorimetric “titrations” were performed in
a total transmittance geometry configuration (CIE illuminating/viewing standards)34 using an
integrating sphere installed in the sample compartment of the spectrophotometer. The
illuminant used is the C. Transmittance spectra were recorded after each potential had been
applied for 50–60 s. Colorimetric data were calculated with the UVPC optional colour
analysis software v2.72 version from Shimadzu Scientific Instruments Inc. All spectroscopic
measurements of the electrochromic films were done in situ in a 1 cm path quartz cuvette
with a 1 cm2 square top aperture and a designed adapter to allow potentiostatic.

102
4.3 Results and Discussion
4.3.1 Prussian blue
The spectroelectrochemical and colorimetric study of the PB films deposited over ITO coated
glass were by Mortimer and Reynolds.44 However, spectroelectrochemical studies of PB
deposited on transparent flexible electrodes were never reported. In Fig.4.8 shows the
choronocoulometry/chronoabsorptometry study for the PB/PW transition for films deposited
on flexible PET/ITO electrodes.
0 100 200-2
0
2
4
6
8
10
12
14
16
18
20
∆Q
(m
Ccm
-2)
0 100 2000.0
0.2
0.4
0.6
0.8
1.0
1.2
1.4
1.6
1.8
2.0
A
Wavelength (nm) Α
PW-reduzed state
PB - oxidized state
400 500 600 700 800
0.0
0.2
0.4
0.6
0.8
1.0
Time (s)0 50 100 150 200 250
-0.4
-0.2
0.0
0.2
0.4
0.6
0.8
1.0
0 50 100 150 200 250
-4
-2
0
2
4E
(V
vs. A
g/A
gCl)
I (mA
)
Time (s)
Figure 4.8 - In situ cronocoulometry/cronoabsorptometry data for PB film deposited on PET/ITO in
0.2 M KCl aqueous solution as supporting electrolyte. Left: chronoabsorptometry recorded at 690nm
(dashed line), CE (full line). Right: chronoamperometry (full line+full circle), square-wave switching
between −0.2 and 0.6V (vs. Ag/AgCl), step duration of 40s (full line).
The chronocoulometry/chronoabsorptometry shows for the same sample a larger amount of
charge per unit area (∆Q′) for the reduction (PB→PW) process than for the oxidation
(PW→PB) over time per unit electrode area). Differences in the CE values for the reduction
and the oxidation process are also found (see Fig.4.9).

103
100
0.0
0.2
0.4
0.6
0.8
40 60 80 100 1200
20
40
60
80
100
120
bleaching -0,2V
Time (s)
colouration 0,6V
A690nm
CE
(cm
2C
-1)
Figure 4.9 - CE (dots) calculated from in situ chronocoulometry/chronoabsorptometry (see Fig.4.8).
Chronoabsorptometry cycles recorded at 690nm (full line).
The PB films deposited on flexible PET/ITO electrodes show a relative stability over a range
of at least five write-erase cycles (9 steps of 40 s each one, the last cycle have only one
step, see Table 4.1). The evolution of CE along one step potential, shown in Fig.4.9
increases until its maximum; then reaches a plateau. In Table 4.1, CE values along the in
situ choronocoulometry/chronoabsorptometry experiment at a specific percentage of full
switch (%Full switch, see section 1.2.1 – ECD parameters) are reported.

104
Table 4.1 - Collected data from in situ choronocoulometry/chronoabsorptometry experiments of the PB
films deposited on PET/ITO in 0.2 M KCl aqueous solution
Cycle nº Redox
transition*
% Full
switch** ∆%T ∆A
∆Q′
(mC/cm2)
CE
(cm2/C)
Time
(s)
85 63.76 0.543 5.65 96 9
96 71.8 0.707 6.38 111 11
98 73.38 0.748 6.69 112 12 PW/PB
99 74.19 0.770 6.9 112 13
86 64.16 0.729 6.45 113 11
95 71.19 0.767 7.08 108 13
98 73.47 0.778 7.41 105 17
1
PB/PW
99 74.16 0.781 7.60 103 23
PW/PB 99 74.32 0.780 7.09 110 20 2
PB/PW 98 73.19 0.770 7.45 103 20
PW/PB 99 73.74 0.770 6.99 110 20 3
PB/PW 97 72.59 0.761 7.32 104 20
PW/PB 98 73.13 0.760 6.86 111 20 4
PB/PW 96 71.79 0.751 7.19 104 20
5 PW/PB 96 72.19 0.749 6.71 112 20
*Applied potentials: PW/PB = 0.6 V (vs. Ag/AgCl) and PB/PW = −0.2 V (vs. Ag/AgCl).
**% full switch calculated with Tmax (89.35%) and Tmin (14.49%) obtained during the first step of the first cycle. Tmax
and Tmin were determined with the Amax and Amin values obtained by chronoabsorptometry, respectively.
While the colour efficiency maintains approximately the same value, the calculated
percentage of full switch for both PW/PB and PB/PW at the same time step (20 s) decreases
with the number of cycles. Different CE and switching times are observed for the PB/PW and
PW/PB process, performed during the in situ chronocoulometry/chronoabsorptometry
experiment (see Fig.4.8 and Fig.4.9). Comparing results from Table 4.1 with those described
by Mortimer and Reynolds44, concerning PB deposited on glass/ITO electrodes (non-flexible
electrodes), several differences are found. The CE obtained in flexible electrodes is 25%
inferior and the time expended to obtain the same % of full switching almost doubles when
compared to PB deposited over a glass ITO electrode. Moreover, the ∆%T obtained for the
same % of full switching are 11–13% greater, indicating a large amount of PB deposited.
This could explain the lower rate of colour variation and the lower CE values.
The CIELAB coordinates observed for the PB and PW films deposited over flexible PET/ITO
are comparable with those obtained with PB deposited over glass ITO-coated electrodes,

105
however, the ∆E*ab is greater than 6 for the coloured state and visual differences should be
espected between the two films (see Table 4.2).
Table 4.2 – Colorimetric coordinates collected for PB and PW films deposited over
the same period of time (300s at 0.5V vs. Ag/AgCl) on PET/ITO electrodes (a)
and glass ITO coated electrodes (b).
Film redox state L* a* b* x y ∆E*ab
PB(a) 64 -18 -36 0.203 0.250
PB(b)** 73 -26 -33 0.255 0.340 12***
PW(a) 100 0 6 0.323 0.341
PW(b)** 97 0 1 0.359 0.386 6****
**data from ref.47
***CIELAB value difference between PB(a) and PB(b)
****CIELAB value difference between PW(a) and PW(b)
In Fig. 4.10 the evolution of xy coordinates for the PB/PW optical transition is shown for the
films deposited over PET-ITO electrodes with different deposition time. The PB state is the
most influenced by the film thickness, while the perceived transparency for the PW state is
identical for all the films. In contrast to other electrochromic materials such as PEDOT, where
the film thickness results in a loss of the transparency of the bleached state.
0.18 0.21 0.24 0.27 0.30 0.330.22
0.24
0.26
0.28
0.30
0.32
0.34
0.36-0.2V
y
x
0.5V
Figure 4.10 - Chromaticity coordinates xy obtained by in situ chronocoulomery/chronoabsorptometry
for PB films deposited over PET/ITO. Films with 300s (open square), 600s (open circles) and 150s
(open triangles) deposition time. Note: all the potentials were measured using Ag/AgCl reference.

106
4.3.2 Salen-type complexes of Cu(II), Ni(II) and Pd(II)
Previously, optical variations for the [Ni(3-MeOsaltMe)] and [Cu(3-MeOsaltMe)] at their
different redox states (oxidized state - coloured and reduced state - bleached) were
reported.29 A comparative study with the different metal complexes: [Ni(3-MeOsaltMe)] (Ni),
[Cu(3-MeOsaltMe)] (Cu) and [Pd(3-Mesalen)] (Pd) (see Fig. 4.11) are presented in this
chapter.
Figure 4.11 - Salen-type complexes of Cu(II), Ni(II) and Pd(II): (A) [M(3-MeOsaltMe)], M=Ni or Cu and
(B) [X(3-Mesalen)], X=Pd.
The polymers of the Ni, Cu and Pd complexes were obtained by potential cycling with
increasing number of cycles (2–10). In Fig. 4.12, their full visible absorbance spectra in the
coloured (oxidized, dopped) and bleached (reduced, neutral) states recorded under
potentiostatic control are depicted.

107
Figure 4.12 - Absorbance spectra recorded in situ for
the different salen-based metal electrochromic films
deposited on PET/ITO electrode in acetonitrile
containing 0.1 M TBAP as supporting electrolyte. (A) Ni,
4 deposition cycles; full line: oxidized state 1.3 V;
dashed line: reduced state −0.1 V. (B) Cu, 2 deposition
cycles; full line: oxidized state 1.4 V; dashed line:
reduced state −0.15 V. (C) Pd, 2 deposition cycles; full
line: oxidized state 1.3 V; dashed line: reduced state
0 V. Note: all the potentials were measured using
Ag/AgCl reference electrode.
400 500 600 700 8000.0
0.2
0.4
0.6
0.8
1.0
1.2
A
Wavelength (nm)
A
400 500 600 700 8000.0
0.2
0.4
0.6
0.8
1.0
1.2B
A
Wavelength (nm)
400 500 600 700 8000.0
0.2
0.4
0.6
0.8
1.0
1.2C
A
Wavelength (nm)

108
Coloration efficiency
Using the same methods described for the PB films, the CE values were calculated for the
Ni, Cu and Pd modified electrodes with two electropolymerization cycles. In Figs.4.13, 4.14
and 4.15 spectroelectrochemistry data of the cycling between the oxidized and reduzed
states for Pd, Cu and Ni modified electrode is shown.
0 100 200 300 400
0
50
100
150
200
A765nm
CE
(cm
2C
-1)
0 100 200 300 4000.0
0.1
0.2
0.3
0.4
0.5
0.6
Time (s)0 100 200 300 400
-4
-3
-2
-1
0
1
2
3
0 100 200 300 400-1.0
-0.5
0.0
0.5
1.0
1.5
2.0
Time (s)
I (mA
)
E (
V v
s. S
CE
)
Figure 4.13 - In situ cronocoulometry/cronoabsorptometry data for Pd film deposited on PET/ITO in
acetonitrile 0.1 M TBAP as supporting electrolyte. Left: chronoabsorptometry recorded at 765nm (full
line), CE (dots). Right: chronoamperometry (full line+full circle), square-wave switching between −0.1
and 1.3V (vs. Ag/AgCl), step duration of 50s (full line).

109
0 100 200 300 400 500
0.0
0.2
0.4
0.6
0.8
Time (s)
0 100 200 300 400 50050
100
150
200
250
300
A62
0nm
CE
(cm
2C
-1)
Time (s)0 100 200 300 400 500
-1.0
-0.5
0.0
0.5
1.0
1.5
2.0
2.5
0 100 200 300 400 500
-6
-4
-2
0
2
4
6
I (mA
)
E (
V v
s S
CE
)
Time (s)
Figure 4.14 - In situ cronocoulometry/cronoabsorptometry data for Cu film deposited on PET/ITO in
acetonitrile 0.1 M TBAP as supporting electrolyte. Left: chronoabsorptometry recorded at 620nm (full
line), CE (dots). Right: chronoamperometry (full line+full circle), square-wave switching between −0.15
and 1.4V (vs. Ag/AgCl), step duration of 60s (full line).
0 100 200 300 400 500 600
0
50
100
150
200
250
300
0 100 200 300 400 500 6000.0
0.1
0.2
0.3
0.4
0.5
0.6
0.7
0.8
0.9
CE
(cm
2C
-1)
Time (s)
A
576n
m
0 100 200 300 400 500 600-2
-1
0
1
2
3
I (mA
)
E (
V v
s.
SC
E)
0 100 200 300 400 500 600
-4
-2
0
2
4
Time (s)
Figure 4.15 – In situ cronocoulometry/cronoabsorptometry data for Ni film deposited on PET/ITO in
acetonitrile 0.1 M TBAP as supporting electrolyte. Left: chronoabsorptometry recorded at 576nm (full
line), CE (dots). Right: chronoamperometry (full line+full circle), square-wave switching between -0.1
and 1.3V (vs. Ag/AgCl), step duration of 65s (full line).
In Fig. 4.13-left CE data shows a maximum immediately after the potential pulse and
decreases all along the pulse period for both the oxidation process (anodic coloration) and
the reduction process (cathodic bleaching). The values of CE calculated at half height of the

110
pulse of each step are constant relatively to the values obtained in the first cycle. This
behaviour is followed for all the salen-type complexes tested (See Figs. 4.14 and 4.15).
Table 4.3 summarizes the data obtained from the cronocoulometry/cronoabsorptometry
results for the first cycle of the three coordination polymer tested.
Table 4.3 - Collected data from choronocoulometry/chronoabsorptometry experiments for metal salen-
type films, after one cycle
Complex Redox
transition
% Full
switch ∆%T ∆A
∆Q′
(mC/cm2)
CE
(cm2/C)
Switch time
(s)
66 38.24 0.260 1.46 177 2
93 53.69 0.434 2.59 168 4 Coloration
98 56.64 0.477 2.59 184 6
51 29.25 0.315 1.58 199 2
Pd
Bleaching 99 56.89 0.488 2.64 185 4
92 71.06 0.571 3.63 157 6
96 74.09 0.624 3.88 161 10 Coloration
98 75.75 0.657 4.10 160 18
93 71.74 0.664 3.13 212 4
95 73.46 0.672 3.29 204 6
Cu
Bleaching
98 75.85 0.683 3.58 191 22
90 60.01 0.591 7.21 82 9
94 62.56 0.646 7.77 83 11 Coloration
98 65.09 0.711 9.27 77 19
90 60.16 0.718 4.14 173 6
95 63.09 0.735 6.5 113 52
Ni
Bleaching
96 63.93 0.739 6.55 113 65

111
Colorimetric analysis
Table 4.4 reports the CIELAB coordinates corresponding to tandem
cronocoulometry/cronoabsorptometry experiments for each metal salen-type complex.
Table 4.4 - In situ cronocoulometry/cronoabsorptometry of the salen-type metal
complexes deposited on PET/ITO flexible electrode in acetonitrile 0.1 M TBAP.
E (V vs. Ag/AgCl) Pd Cu Ni
L* a* b* L* a* b* L* a* b*
1.4 – – – 35 10 −18 – – –
1.3 60 -24 16 – – – 50 9 -10
1.2 67 -29 24 51 11 1 51 8 -8
1.15 73 -33 33 52 10 3 52 8 -7
1 75 -33 37 61 7 12 55 6 -5
0.9 78 -33 42 73 0 22 62 -1 7
0.85 79 -33 44 74 -1 22 75 -6 21
0.8 80 -33 45 76 -2 23 84 -9 31
0.75 81 -32 46 77 -3 22 86 -9 34
0.65 83 -30 47 80 -5 22 89 -9 36
0.55 85 -27 48 83 -6 23 91 -9 36
0.45 87 -23 48 85 -6 23 92 -8 35
0.4 89 -21 48 85 -5 23 93 -8 34
0.30 92 -17 48 85 -5 23 93 -7 34
0.25 94 -14 48 – – – – – –
0.20 96 -13 46 86 -5 23 – – –
0.15 98 -12 44 – – – 94 -7 33
0 99 -12 41 86 -5 23 94 -7 33
−0.1 100 -12 41 – – – – – –
−0.15 – – – 87 -4 23 – – –
Films deposited with 5 cycles.

112
Figure 4.16 - Chromaticity coordinates (x, y)
obtained by in situ chronocoulometry/
chronoabsorptometry: (A) Pd, (B) Cu and
(C) Ni. Films with 10 (open circles), 5 (open
triangles) and 2 (open square) cycles
deposition. Crossed open circle represents
the illumination source x, y coordinates. All
potentials are vs. SCE.
Based on the colorimetric data of Table 4.4 a chromaticity diagram for each polymer with
different number of cycles of deposition can be drawn (see Fig.4.16).
0.25 0.30 0.35 0.40
0.30
0.35
0.40
0.45
0.50
1.3Vy
-0.1V
A
x
0.25 0.30 0.35 0.40
0.24
0.28
0.32
0.36
0.40
0.44
y
1.4V
-0.15V
x
B
0.28 0.30 0.32 0.34 0.36 0.38 0.40
0.27
0.30
0.33
0.36
0.39
0.42
x
y
1.3V
0V
C
The evolution of xy coordinates along the potential shows a very peculiar curvature when
compared with those obtained with PB both in PET/ITO (see Fig. 4.10) and glass/ITO
electrodes.44 The colour changes spread over a larger xy region, indicating more saturated
colour on alternating between undoped and doped state. The modified electrodes with 10
deposition cycles have larger xy values than those obtained with 5 and 2 deposition cycles,
showing a more saturated colour approximating the spectral locus coordinates. From the plot
in Fig. 4.16 and the spectrum locus it is possible to calculate the λd that correlates with the
visual aspects of hue and chroma of perceived colour.34 The λd calculated for the electrodes
with 10 deposition cycles are presented in Table 4.5.

113
Table 4.5 - Dominant wavelength (λd) for the electrochromic inorganic polymers
films upon 10 deposition cycles on PET/ITO in 0.1 M TBAP in acetonitrile.
Complex Redox state λd (nm) Colour description
Ox 545 Green Pd
Red 570–575 Yellow
Ox 455–460 Violet Cu
Red 570–575 Yellow
Ox 560a Violet Ni
Red 570–575 Yellow
a Value refers to complementary-dominant wavelength (λc).
The Cu and Ni electrochromic films present the larger variation of λd among the three
samples. The coloured state of the nickel film presents a non-spectral colour closest to the
mauve colour, curiously the first industrial artificial dye (by William Henry Perkin in 1856).
The variation of relative luminance (L*) at electrochemically controlled redox applied potential
is presented in Fig. 4.17. The luminance values show intervals of a great variation over a
narrow potential range corresponding to pseudo potential of reduction of the inorganic
polymer. Working in transmittance, the CIELAB coordinate L* stands for perceived
transparency, indicating greater levels of transparency for the Cu complex films.
The new family of electrochromic inorganic polymers shows good values of CE in
comparission to other inorganic materials like WO3 (40 and 50 cm2/C)45 or IrO2 (15–
18 cm2/C)45 and PB. Compared with organic conducting polymers, which have shown the
highest CE results45, the salen-type metal complexes inorganic polymer films studied here,
lay between the performance of PEDOT and PProDOT.45

114
Figure 4.17 - Relative luminance (L*)
for the electrochromic inorganic
polymers deposited with 5 cycles
deposition on PET/ITO in 0.2 M KCl
aqueous solution, as a function of
applied potential: (A) Pd, (B) Cu and
(C) Ni.
-0.2 0.0 0.2 0.4 0.6 0.8 1.0 1.2 1.430
40
50
60
70
80
90
100
E (V vs. Ag/AgCl)
L*
A
-0.2 0.0 0.2 0.4 0.6 0.8 1.0 1.2 1.430
40
50
60
70
80
90
L*
E (V vs. Ag/AgCl)
B
-0.2 0.0 0.2 0.4 0.6 0.8 1.0 1.2 1.4
50
60
70
80
90
100
L*
E (V vs. Ag/AgCl)
C
115
4.4 Conclusion
PB films were successfully deposited over flexible electrodes. The film stability and the
performance are, however, inferior relatively to those deposited over glass ITO-coated
electrodes.44 Salen-type metal complex polymers were also successfully deposited as films
over flexible PET/ITO electrodes and fully characterized. CE results can be compared with
those for conducting organic polymers. Colorimetry of the electrochromic salen-type
complexes revealed colour states between yellow, green and purple as dominant chroma.
The chronocoulometry/chronoabsorptometry study of electrochromic materials deposited
over flexible electrodes permits the evaluation of their potentialities for special purposes like
flexible displays. To construct a wide electrochromic material database, the information about
colour and CE characteristics conserning the electrochromic materials must be basic and
uniform. Such database could predict colour gamut of combinations of different
electrochromic materials within electrochromic displays.

116

117
4.5 Bibliography
1. Minami, T., Transparent conducting oxide semiconductors for transparent electrodes.
Semiconductor Science and Technology 2005, 20 (4), S35-S44.
2. Fortunato, E.; Barquinha, P.; Pimentel, A.; Goncalves, A.; Marques, A.; Pereira, L.;
Martins, R., Recent advances in ZnO transparent thin film transistors. Thin Solid Films
2005, 487 (1-2), 205-211.
3. Martins, M.; Boas, M. V.; de Castro, B.; Hillman, A. R.; Freire, C.,
Spectroelectrochemical characterisation of copper salen-based polymer-modified
electrodes. Electrochimica Acta 2005, 51 (2), 304-314.
4. Fonseca, J.; Tedim, J.; Biernacki, K.; Magalhães, A. L.; Gurman, S. J.; Freire, C.;
Hillman, A. R., Structural and electrochemical characterisation of [Pd(salen)]-type
conducting polymer films. Electrochim. Acta 2010.
5. Tedim, J.; Goncalves, F.; Pereira, M. F. R.; Figueiredo, J. L.; Moura, C.; Freire, C.;
Hillman, A. R., Preparation and characterization of poly Ni(salen)(crown receptor)
/multi-walled carbon nanotube composite films. Electrochimica Acta 2008, 53 (23),
6722-6731.
6. Batten, S. R.; Neville, S. M.; Turner, D. R., Coordination polymers design, analysis
and application. The Royal Society of Chemistry: Cambridge, 2009.
7. Mortimer, R. J.; Dyer, A. L.; Reynolds, J. R., Electrochromic organic and polymeric
materials for display applications. Displays 2006, 27 (1), 2-18.
8. Higuchi, M.; Akasaka, Y.; Ikeda, T.; Hayashi, A.; Kurth, D. G., Electrochromic Solid-
State Devices Using Organic-Metallic Hybrid Polymers. Journal of Inorganic and
Organometallic Polymers and Materials 2009, 19 (1), 74-78.
9. Bard, A. J.; Faulkner, L. R., Electrochemical methods - fundamentals and
applications. 2nd ed.; Wiley: New York, 2001.
10. Ware, M., Cyanotype. In The history, science and art of photographic printing in
Prussian Blue, Science Museum: London, 1999; pp 21-37.
11. Gotoh, A.; Uchida, H.; Ishizaki, M.; Satoh, T.; Kaga, S.; Okamoto, S.; Ohta, M.;
Sakamoto, M.; Kawamoto, T.; Tanaka, H.; Tokumoto, M.; Hara, S.; Shiozaki, H.;
Yamada, M.; Miyake, M.; Kurihara, M., Simple synthesis of three primary colour
nanoparticle inks of Prussian Blue and its analogues. Nanotechnology 2007, 18 (34),
6.
12. Goncalves, R. M. C.; Kellawi, H.; Rosseinsky, D. R., Electron-transfer processes and
electrodeposition involving the iron hexacyanoferrates studies voltammetrically.
Journal of the Chemical Society-Dalton Transactions 1983, (5), 991-994.

118
13. Garcia-Jareno, J. J.; Benito, D.; Navarro-Laboulais, J.; Vicente, F., Electrochemical
behavior of electrodeposited Prussian Blue films on ITO electrodes - An attractive
laboratory experience. Journal of Chemical Education 1998, 75 (7), 881-884.
14. Monk, P. M. S.; Mortimer, R. J.; Rosseinsky, D. R., Electrochromism and
electrochromic devices. Cambridge University Press: Cambridge, 2007.
15. Itaya, K.; Uchida, I.; Neff, V. D., Electrochemistry of polynuclear transition-metal
cyanides - Prussian Blue and its analogs. Accounts of Chemical Research 1986, 19
(6), 162-168.
16. Mortimer, R. J.; Rosseinsky, D. R., Iron hexacyanoferrate films -
spectroelectrochemical distinction and electrodeposition sequence of soluble (K+-
containing) and insoluble (K+-free) Prussian Blue, and composition changes in
polyelectrochromic switching. Journal of the Chemical Society-Dalton Transactions
1984, (9), 2059-2061.
17. Itaya, K.; Uchida, I., Nature of intervalence charge-transfer bands in Prussian Blues.
Inorganic Chemistry 1986, 25 (3), 389-392.
18. Neff, V. D., Electrochemical oxidation and reduction of thin-films of Prussian Blue.
Journal of the Electrochemical Society 1978, 125 (6), 886-887.
19. Itaya, K.; Shibayama, K.; Akahoshi, H.; Toshima, S., Prussian-Blue-modified
electrodes - an application for a stable electrochromic display device. Journal of
Applied Physics 1982, 53 (1), 804-805.
20. Carpenter, M. K.; Conell, R. S., A single-film electrochromic device. Journal of the
Electrochemical Society 1990, 137 (8), 2464-2467.
21. Chen, L. C.; Ho, K. C., Design equations for complementary electrochromic devices:
application to the tungsten oxide-Prussian Blue system. Electrochimica Acta 2001, 46
(13-14), 2151-2158.
22. Deepa, M.; Awadhia, A.; Bhandari, S.; Agrawal, S. L., Electrochromic performance of
a poly(3,4-ethylenedioxythiophene) - Prussian Blue device encompassing a free
standing proton electrolyte film. Electrochimica Acta 2008, 53 (24), 7266-7275.
23. DeLongchamp, D. M.; Hammond, P. T., Multiple-color electrochromism from layer-by-
layer-assembled polyaniline/Prussian Blue nanocomposite thin films. Chemistry of
Materials 2004, 16 (23), 4799-4805.
24. Jelle, B. P.; Hagen, G., Performance of an electrochromic window based on
polyaniline, Prussian Blue and tungsten oxide. Solar Energy Materials and Solar Cells
1999, 58 (3), 277-286.
25. Goldsby, K. A.; Blaho, J. K.; Hoferkamp, L. A., Oxidation of nickel(II)
bis(salicylaldimine) complexes - solvent control of the ultimate redox site. Polyhedron
1989, 8 (1), 113-115.

119
26. Hoferkamp, L. A.; Goldsby, K. A., Surface-modified electrodes based on nickel(II) and
copper(II) bis(salicylaldimine) complexes. Chemistry of Materials 1989, 1 (3), 348-
352.
27. Dahm, C. E.; Peters, D. G., Catalytic reduction of iodoethane and 2-iodopropane at
carbon electrodes coated with anodically polymerized films of Nickel(II) salen.
Analytical Chemistry 1994, 66 (19), 3117-3123.
28. VilasBoas, M.; Freire, C.; deCastro, B.; Christensen, P. A.; Hillman, A. R., New
insights into the structure and properties of electroactive polymer films derived from
Ni(salen). Inorganic Chemistry 1997, 36 (22), 4919-4929.
29. Vilas-Boas, M.; Santos, I. C.; Henderson, M. J.; Freire, C.; Hillman, A. R.; Vieil, E.,
Electrochemical behavior of a new precursor for the design of poly Ni(salen) -based
modified electrodes. Langmuir 2003, 19 (18), 7460-7468.
30. Jiang, J. A.; Leung, A. C. W.; MacLachlan, M. J., Synthesis and characterization of an
oligomeric conjugated metal-containing poly(p-phenylenevinylene) analogue. Dalton
Transactions 2010, 39 (28), 6503-6508.
31. Abd-El-Aziz, A. S.; Manners, I., Metal-containing p-conjugated polymers. Wiley-
Interscience: New Jersey, 2007.
32. Vilas-Boas, M.; Freire, C.; de Castro, B.; Hillman, A. R., Electrochemical
characterization of a novel salen-type modified electrode. Journal of Physical
Chemistry B 1998, 102 (43), 8533-8540.
33. Vilas-Boas, M.; Freire, C.; de Castro, B.; Christensen, P. A.; Hillman, A. R.,
Spectroelectrochemical characterisation of poly Ni(saltMe)-modified electrodes.
Chemistry-a European Journal 2001, 7 (1), 139-150.
34. Berns, R. S.; Billmeyer; Saltzman's, Principles of color technology. John Wiley & Sons
Inc.: New York, 2000.
35. Leong, J. 2006. Number of colors distinguishable by the human eye [Online].
Available: http://hypertextbook.com/facts/2006/JenniferLeong.shtml [Accessed May
2010].
36. Kuehni, R. G., Color: an introduction to practice and principles. 2nd ed.; Wiley-
Interscience: New Jersey, 2005.
37. MacEvoy, B. 2002. Color models & color wheels [Online]. handprint media. Available:
http://personales.upv.es/gbenet/teoria%20del%20color/water_color/color6.html#muns
ell [Accessed May 2010].
38. Schanda, J., Colorimetry. Wiley-Interscience: New Jersey, 2007; pp 25-76.
39. Broadbent, A. D., A critical review of the development of the CIE1931 RGB color-
matching functions. Color Research and Application 2004, 29 (4), 267-272.

120
40. Thompson, B. C.; Schottland, P.; Zong, K. W.; Reynolds, J. R., In situ colorimetric
analysis of electrochromic polymers and devices. Chemistry of Materials 2000, 12 (6),
1563-1571.
41. Kuehni, R. G., Color: an introduction to practice and principles. 2nd ed.; Wiley-
Interscience: New Jersey, 2005.
42. Perrin, D. D.; Armarego, W. L. F., Purification of laboratory chemicals. Pergamon
Press: New York, 1988.
43. Holm, R. H.; Everett, G. W.; Chakravorty, A., Metal complexes of schiff bases and ß-
ketoamines. Progress in Inorganic Chemistry 1966, 7, 83-204.
44. Mortimer, R. J.; Reynolds, J. R., In situ colorimetric and composite coloration
efficiency measurements for electrochromic Prussian Blue. Journal of Materials
Chemistry 2005, 15 (22), 2226-2233.
45. Gaupp, C. L.; Welsh, D. M.; Rauh, R. D.; Reynolds, J. R., Composite coloration
efficiency measurements of electrochromic polymers based on 3,4-
alkylenedioxythiophenes. Chemistry of Materials 2002, 14 (9), 3964-3970.

121

122

123
Chapter 5
Non-liquid Electrolytes for Electrochromic
Devices

124
5.1 Introduction
Electrolytes are one of the most challenging components in the development of reliable solid-
state electrochemical devices. The electrolyte system serves as an ion storage layer that
exchanges charged species in the electrode–electrolyte interface and through the electrolyte
layer during the redox process. Electrolytes are of extreme importance to the correct function
of electrochemical cells, and in particular for ECD.
The correct operation of an ECD implies the injection of electrons in one electrode and
extraction of equivalent amount of electrons from the second one. The continuous flow of
electrons (current) will charge the electrodes and create a polarization through the cell;
consequently the current flow is blocked otherwise the electroneutrality law would be
infringed. To avoid polarization the charge accumulated over the electrodes surface must be
electrically balanced by the electrolyte medium ions – charge carriers.
The present chapter reports on the spectroelectrochemical studies and write-erase cycling
tests of ECD using two different kinds of polymer electrolyte – solid polymer electrolyte (SPE)
and gel electrolyte. The SPE used is a blend of poly(ethylene oxide) and poly(trimethylene
carbonate) (p(TMC)/PEO). The SPE films were supplied by M. M. Silva from Centro de
Química of Univ. do Minho in the framework of a scientific collaboration. M. M. Silva was
responsible for the film preparations and characterization of the thermal behaviour, ionic
conductivity and electrochemical stability. The gel electrolyte is based on polyethylene oxide
(PEO). Both systems were doped with lithium perchlorate salt.
5.1.1 Electrolyte systems and application
The electrolyte layer must be placed between and in direct contact with the modified
electrodes. The electrolyte system consists of a salt dissolved or contained in a matrix. The
salt is responsible for the introduction of positive and negative charge carriers and the matrix
as the medium where they can move between the polarized electrodes. The movement of
charged particles between the electrodes will reduce electrode polarization by charge
neutralization.
The accumulation of negative charges can be neutralized by an equivalent accumulation of
positive charges within the vicinity of the electrode surface. On the other hand, a negative
charged electrode can be neutralized by the depletion of equivalent charge of negative ions
from its surface. The same holds for positively charged electrodes. Both mechanisms can
happen at the same time.
Ionic conductivity background
125
The ability of a system to support current flow generated by motion of charged particles when
an electric field exists within the system is called the conductivity1, or specific conductance, κ
(Scm-1).2 Conductivity is defined as the inverse of resistivity, ρ (ohm.cm), see Eq.5.1.
ρκ
1= Eq. 5.1
The conductivity is related with the conductance (C) of a specific electrolyte system, and is
dependent on the dimensions of the electrolyte. In Eq. 5.2 the conductance is defined,
l
A×= κC Eq. 5.2
where A is the cross section area of an electrolyte column between two electrodes and l the
length of the column.
Conductance can also be expressed as a function of resistivity; Eq. 5.3 can be obtained from
Eq. 5.2 and Eq. 5.1.
l
A×=
ρ
1C Eq. 5.3
A useful derived function from specific conductivity is the equivalent conductivity,
Λ (S.cm2.equiv.-1), see Eq. 5.4,
eqc
κ1000=Λ Eq. 5.4
where ceq is the concentration of equivalents per dm3 of positive or negative ions of the
respective salt.
The ionic conductivity of an electrolyte system is proportional to the product of the total
quantity of charge carriers (N) available by their ionic mobility (ui), see Eq. 5.5,
zeNui=κ Eq. 5.5
where ze is the charge of each ion. Based on previous equations we can predict that for ideal
situations the bulk conductance of an electrolyte will increase when both N and ui increase

126
too. Electrolytes with larger amount of salt will increase ionic conductivity, considering ideal
conditions. On the other hand the mobility can be tuned with viscosity (η) of the
microenvironment of the charge carriers, see Eq. 5.6.
ηπr
zeui
6= Eq. 5.6
where r is the radius of the mobile ion.
Electrolyte systems
Many different kinds of electrolytes have been developed including liquid, gel, polymer, solid
and hybrid electrolytes. The main trends in the field of electrochromic cells are based on gel
electrolytes3,4 and ionic liquids immobilized in organic polymers.5
In early works on ECD the electrolyte medium was based on liquid state electrolyte (LSE), for
example Deb’s works in 19736 or the best-selling “self-darkening electrochromic rear-view
mirror” developed by the Gentex Corporation.7 Liquid electrolytes present high ionic
conductivities on the order of 10-1 Scm-1 for salt concentration around 1M.8 Electrolytes with
high ionic conductivity allow to develop ECD’s with short switching times. Practical devices
with switching times of less than 1s, were already fabricated in the 70’s.9
In spite of their high ionic conductivities that convey LSE as supporting electrolytes in most
electrochemical applications, they present several drawbacks towards real applications. LSE
are not suitable for large scale applications due to their lack of structural stability for flexible
devices, leakage9,10 and homogeneity problems during the coloration process11; in some
cases liquid electrolyte can even react with the electroactive materials.12
In 1973, P. V. Wright reported on the ionic conductivity from a “solvent-free” poly(ethylene
oxide)-salt system. Later, in 1978, M. B. Armand highlighted the potential applications of
such SPE, specifically for energy storage applications. Since then, both academia and
industry have contributed to polymer electrolyte development.9
In contrast to LSE, SPE’s can be easily formed into thin films and avoid leaking problems.
Moreover SPE’s show several advantages towards ECD applications such as12:
- Improved safety to mechanic attack of the devices (shock, vibration and mechanical
deformation);
- Enhanced endurance to varying electrode volume during redox cycling;
- Polymer layer can act as an electrode spacer;
- Confer structural stability to the entire device;
- Can act as a binder between electrodes;

127
- Polymer films can adopt any geometrical shape.
Elimination of the LSE layer should facilitate the manufacture to highly automated processes,
adapting existing industrial technology for thin film processing. For this reason SPE’s13,14
have been used as components for commercial applications such as rechargeable lithium
batteries15, fuel cells16 and electrochromic devices.17
SPE’s are obtained by the dissolution of a salt in a ion-coordinating macromolecule (polymer
host), free of any low weight solvent or additives.18 Here the polymer host acts as a solid
solvent where the salt is dissociated. Extended salt dissociation is obtained when the
polymer host has good electron donor groups such as ether oxygen like in poly(ethylene
oxide) (PEO).
The ionic conduction mechanism of this class of polymer electrolytes is intimately associated
with the local segmental motions of the polymer (see Fig.5.1).12 The transport of ions through
local relaxation processes in the polymer chain can be compared with those in liquid state.9
Figure 5.1 – Cation (sphere) transport mechanism in a polymer based electrolyte. Motion coupled to
that of the polymer chain (up) and transfer of a cation between chains (bottom).
A low boiling-point temperature solvent may be used to mix the polymer host and the salt,
being slowly evaporated after casting the mixture. In order to obtain a freestanding
membrane, cast films can be further dried using simultaneously temperature and low
pressure conditions.
Representative classes of polymer host studied for SPE’s are: PEO, poly(acrylonitrile) (PAN),
poly(methyl methacrylate) (PMMA), poly(vinyl chloride) (PVC) and poly(vinylidene fluoride)
(PVdF).9 Although the broad range of polymers studied as polymer hosts for SPE’s none
have shown any considerable advantage over PEO, the most widely studied host polymer for

128
SPE applications. PEO continues to be the best choice for “dry”, solvent-free lithium ion
containing SPE’s.
Polyethylene oxide based polymer electrolyte systems
A wide variety of polymer electrolytes based on the ethylene oxide repeating unit have been
synthesized and characterized. The resulting macromolecules include linear and branched
polymers, block co-polymers and plasticized polymers with morphologies that almost cover
the entire range between amorphous and crystalline states. 11,19,20,21
PEO exhibits good coordinating properties towards the salt cation resulting in a high content
salt dissociation. However, PEO is highly crystalline (for high molecular-weight) showing poor
ionic conductivity at room temperature.12 In general, SPE’s show several technological
advantages but present poor ionic conductivity values at room temperature,
10-8 to 10-4Scm-1.12,22,23 Application of this kind of electrolytes is not suitable for applications
such as ECD.
To increase ionic conductivity of SPE’s several strategies were pursued: introduction of a
plasticizer, promoting cross-linking, branched and block copolymers derivatives of PEO and
blends with other polymers.9 All these modifications have the main goal to lower the glass
transition temperature (Tg) of the polymer host and to increase the amorphous phase in
order to improve room temperature ionic conductivity.
Addition of large quantities of plasticizer (e.g. ethylene oxide, propylene oxide) and/or solvent
(e.g. Acetonitrile, alcohols, benzene, chloroform, cyclohexanone, esters, DMF) increases
effectively the ionic conductivity of the polymer based electrolyte. Such strategy leads to the
formation of a gel showing an effective increase of room temperature ionic conductivity,
between 10-3 to 10-2 Scm-1.3,12,23,24,25
Gel electrolytes are a ternary mixture of polymer, salt and a large content of liquid solvent or
plasticizer, around 40 to 60% (w/w).26 The fact that the gel is a solid permeated by a solvent
means that it can be thought of as a combination of a solid and a liquid.27 Gel electrolytes
share properties of SPE and LSE, such as the cohesive forces of polymers and the ionic
conductivity properties similar to liquid electrolytes.
The development and optimization of electrolyte systems for ECD’s requires very specific
conditions. The electrolyte must have a high transparency to maximize chromatic contrast in
the case of see-through displays, an adequate room temperature conductivity (>10-4 Scm-1)3
to permit rapid colour switch, mechanical flexibility to form an appropriate
electrode/electrolyte interface and low thermal expansion or volatile components so that the
device may operate over a relative wide range of temperatures. Although novel electrolyte
systems with improved electrochemical performance continue to be developed, it is worth to
note that since 1987 the International Symposium on Polymer Electrolytes took place every

129
two years. This year the 12th edition will be held in Padova;28 it seems likely that the
preparation of electrolytes for application in any given device will involve optimization of
electrochemical and physical parameters for the specific requirements of the device.

130
5.2 Gel Electrolytes for ECD applications
5.2.1 Experimental Details
General
Poly(3,4-ethylenedioxythiophene)-poly(styrenesulfonate) (PEDOT, 1.3 wt.% dispersion in
H2O, conductive grade—Aldrich) certified p.a. grade and used without further purification.
Lithium perchlorate (Aldrich, 99.99%) was supplied as a pure, dry solid, packed under
nitrogen and was used as received.
Gel electrolyte preparation
Homogeneous solutions of a polyethylene oxide and polypropylene oxide co-polymer (PEO-
PPO) and lithium perchlorate in a polar solvent were prepared by stirring known masses of
polymer components and lithium salt. An homogeneous viscous solution is obtained. Opaque
gel electrolytes were produced by incorporation of pigments. The following pigments were
tested: yellow chrome (PbCrO4), titanium dioxide (TiO2) and Natural Red 9; the yellow and
white pigments and the red dye were first suspended in a polar solvent prior to the addition of
PEO-PPO polymer. Gel electrolyte films were obtained by casting small volumes of the
mixture.
PEDOT films
PEDOT films were spin-coated on the flexible electrodes of polyethylene terephthalate (PET)
films coated with indium tin oxide (PET/ITO, Aldrich with a resistivity of 60 Ω/sq and a useful
area is ca. 4 cm2). Spin conditions were set as follows: 2000 rpm for 30 s. The spin-coated
film was dried at 50 °C during 2 h.
Electrochromic cell assembly
Electrochromic cells were assembled in a sandwich-like structure. Gel electrolyte was casted
over PET/lTO/PEDOT modified electrodes forming a sticky gel film. The second modified
PET/ITO/PEDOT electrode is then placed over the gel film. Finally the edges of the cell were
sealed with normal adhesive tape. Useful area of ECD is ca. 4cm2.

131
Conductivity
Ionic conductivity of gel electrolyte was measured using a Metrohm 644 Conductometer
(ref.1.644.0010) and an Immersion Type Cell (ref. 6.0901.110). The cell constant (0.78cm-1)
was determined using an electrolyte standard solution (KCl, 1 mM). The sample temperature
was controlled.
Electrochemical measurements
Electrochemical measurements were performed using a computer controlled Autolab
potentiostat–galvanostat Model 20 (Eco-Chemie). Evaluation of the electrochemical stability
window of gel electrolyte was carried out using a two-electrode cell configuration:
PET/ITO/Gel Electrolyte Layer/ITO/PET. The cell was assembled as described above (see
5.2.1.4) except that the electrodes were not modified with electrochromic material.
Spectroelectrochemical measurements
UV/Vis reflectance spectra and transient reflectance were recorded in a Shimadzu UV2501-
PC using an integrating sphere installed in the sample compartment of the
spectrophotometer. Spectra were run with 5nm resolution. Transient reflectance spectra
obtained during potentiostatic titration of ECD were recorded after each potential had been
applied for 50–60 s. All spectroscopic measurements of the electrochromic cells were carried
out in situ with the electrochromic cells positioned perpendicular to the light beam of the
spectrophotometer. The cells were connected to the potentiostat apparatus by means of
electrical wires and flat contacts.

132
5.2.2 Results and Discussion
Formulation of the gel electrolyte
In order to obtain gel electrolytes with viscosities adequate for ECD assembly, several
polymer:solvent (w/w) ratios were used to prepare gels. It was found that polymer:solvent
30:70 (w/w) led to viscous solution that was fluid enough to be easily casted over the
electrodes. It was also found that in less than one hour a powerful sticky gel film was formed.
These characteristics facilitated the assembly of the ECD presenting a good adhesion
between the electrodes.
The final viscosity of the fluid obtained was around 400cP at room temperature.
Development of a fast switching and high optical contrast ECD is mainly dependent on the
bulk conductance of the electrolyte layer. It is desirable to have a high ionic mobility and a
high number of charge carriers. Addition of salt on the electrolyte medium will increase the
ionic conductivity. The last statement is true until ion pairing occurs between cations and
anions and the number of effective charge carriers will decrease. The study of the variation
of bulk conductivity for different salt concentrations was performed. In Table 5.1 gel
electrolytes with different salt contents tested are listed.

133
Table 5.1 – Ionic conductivity and equivalent conductivity for gel electrolytes with different
percentage of LiClO4 salt.
%LiClO4
(w/w) [Li] (M)*
κ
(S/cm)
Λ
(Scm-2equiv.)
%LiClO4
(w/w) [Li] (M)
κ
(S/cm)
Λ
(Scm-2equiv.)
0.0012 1.2E-04 2.7E-05 2.2E-01 1.26 0.13 4.0E-03 3.0E-02
0.0037 3.8E-04 3.2E-05 8.3E-02 1.72 0.18 5.7E-03 3.1E-02
0.0099 1.0E-03 6.4E-05 6.2E-02 1.79 0.19 5.5E-03 2.9E-02
0.04 4.2E-03 1.4E-04 3.3E-02 2.39 0.25 9.0E-03 3.5E-02
0.06 6.2E-03 2.4E-04 3.8E-02 2.91 0.31 9.4E-03 3.0E-02
0.09 9.4E-03 2.9E-04 3.1E-02 3.29 0.35 1.1E-02 3.1E-02
0.11 1.1E-02 3.6E-04 3.1E-02 3.54 0.38 1.2E-02 3.1E-02
0.12 1.2E-02 3.9E-04 3.1E-02 3.7 0.4 1.2E-02 3.0E-02
0.36 3.8E-02 1.2E-03 3.1E-02 3.77 0.41 1.3E-02 3.1E-02
0.44 4.6E-02 2.0E-03 4.3E-02 3.76 0.41 1.3E-02 3.1E-02
0.59 6.2E-02 1.8E-03 2.9E-02 3.79 0.41 1.3E-02 3.1E-02
0.79 8.3E-02 3.6E-03 4.4E-02 4.82 0.53 1.3E-02 2.5E-02
1.03 1.1E-01 3.0E-03 2.8E-02 5.39 0.59 1.3E-02 2.3E-02
*the chemical concentration of Li+ was calculated considering stoichiometric chemical quantity of LiClO4 and the
volume of solvent in the respective mixture; mol LiClO4 divided by the volume of solvent
In Fig. 5.2-left the dependence of κ with salt content shows two distinct regimes. For low and
medium range concentrations of salt a linear increase of the ionic conductivity is observed.
Addition of salt will increase N by dissociation of LiClO4. This behaviour is observed until a
concentration of ca. 0,41M salt. This behaviour is predicted in Eq. 5.5, were κ is proportional
to N.
At higher salt concentrations (>0,41M) conductivity reaches a plateau (see ionic conductivity
for 0,53 and 0,59M of LiClO4, Table 5.1 and Fig. 5.2-left) . At high salt concentration ion
pairing may occur between the cation and anion of the salt. The ion pair can present either
zero net charge (if z+ = z-) or a resulting charge (if z+≠z-). In both cases the number of
available charge carriers will be smaller than it would be expected in terms of the salt
stoichiometric concentration and the assumption of complete dissociation. Consequently the
equivalent conductivity will decrease. 30
Another approach to evaluate the effective increase in conductivity with the addition of salt is
to calculate the molar conductivity (Λ, see Eq. 5.4). It is interesting to observe that Λ shows a
maximum for the lower salt concentration measured
(1,2x10⁻⁴M of LiClO4) and decreases abruptly with further addition of salt. At 9,4 x10⁻⁴M of
LiClO4, Λ reaches a plateau. At higher salt concentrations (>0,41M of LiClO4) Λ starts to
decrease again, see Fig.5.2-right.

134
0.0 0.1 0.2 0.3 0.4 0.5 0.6-2
0
2
4
6
8
10
12
14
[LiClO4]
κ (
mS
cm-1)
0.0 0.1 0.2 0.3 0.4 0.5 0.6 0.7 0.810
100
10000.1 0.2 0.3 0.4 0.5 0.6 0.7
log
(Λ)(
S.c
m2.e
quiv
.)
[LiClO4]
[LiClO4]1/2
Figure 5.2 – Ionic conductivity (left) and equivalent ionic conductivity (right) of the gel electrolyte at
different salt content in M (the chemical concentration was calculated considering stoichiometric
chemical quantity of LiClO4 and the volume of solvent in the respective mixture; mol LiClO4 divided by
the volume of solvent) at 21ºC.
Observation of the behaviour of Λ is comparable to that observed for weak electrolytes.2 In
weak electrolytes the salt is not completely dissociated and thus the number of charge
carriers available is not equal to stoichiometric salt concentration. In this case a relationship
between the theoretical molar conductivity ΛT and the observed molar conductivity ΛObs is
expressed as follows in Eq.5.7
TObs Λ=Λ α Eq. 5.7
where α is the degree of dissociation of the salt.
The ion pairing phenomenon and incomplete salt dissociation can explain the decrease of
the molar conductivity observed in the gel electrolyte. Based on the results, it was decided to
use as standard clear gel electrolyte composed by solvent:PEO-PPO:salt equal to 70:26:4
(w/w) ratios.
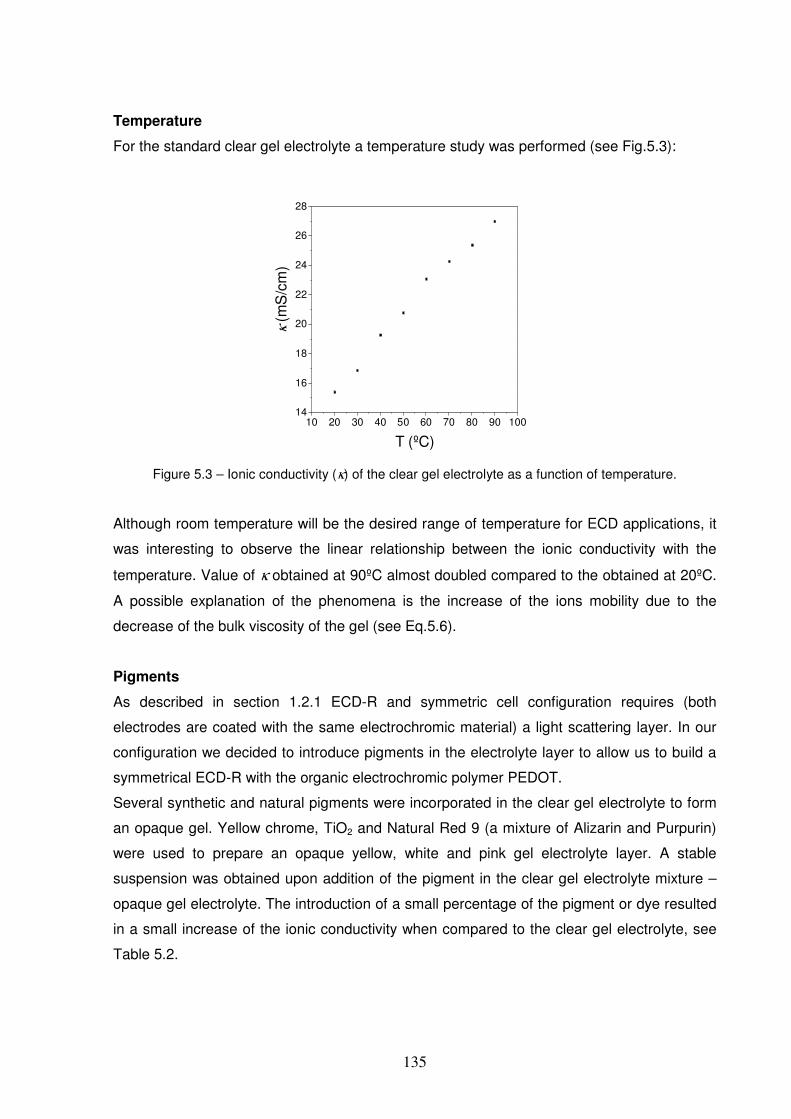
135
Temperature
For the standard clear gel electrolyte a temperature study was performed (see Fig.5.3):
10 20 30 40 50 60 70 80 90 10014
16
18
20
22
24
26
28
κ (m
S/c
m)
T (ºC)
Figure 5.3 – Ionic conductivity (κ) of the clear gel electrolyte as a function of temperature.
Although room temperature will be the desired range of temperature for ECD applications, it
was interesting to observe the linear relationship between the ionic conductivity with the
temperature. Value of κ obtained at 90ºC almost doubled compared to the obtained at 20ºC.
A possible explanation of the phenomena is the increase of the ions mobility due to the
decrease of the bulk viscosity of the gel (see Eq.5.6).
Pigments
As described in section 1.2.1 ECD-R and symmetric cell configuration requires (both
electrodes are coated with the same electrochromic material) a light scattering layer. In our
configuration we decided to introduce pigments in the electrolyte layer to allow us to build a
symmetrical ECD-R with the organic electrochromic polymer PEDOT.
Several synthetic and natural pigments were incorporated in the clear gel electrolyte to form
an opaque gel. Yellow chrome, TiO2 and Natural Red 9 (a mixture of Alizarin and Purpurin)
were used to prepare an opaque yellow, white and pink gel electrolyte layer. A stable
suspension was obtained upon addition of the pigment in the clear gel electrolyte mixture –
opaque gel electrolyte. The introduction of a small percentage of the pigment or dye resulted
in a small increase of the ionic conductivity when compared to the clear gel electrolyte, see
Table 5.2.

136
Table 5.2 – Ionic conductivity of the clear and opaque gel electrolytes
Gel Electrolyte Pigment κ (S.cm-1)
Clear - 1.25x10⁻²
Opaque yellow Yellow Chrome 1.66x10⁻²
Opaque white TiO2 1.73x10⁻²
Opaque pink Natural Red 9 1.93x10⁻²
Electrochemical stability
Electrochemical stability of the clear and opaque gel electrolyte was investigated by cyclic
voltammetry.
-2.0 -1.5 -1.0 -0.5 0.0 0.5 1.0 1.5 2.0-10
-8
-6
-4
-2
0
2
4
6
8
10
12
14
I (µ
A)
E (V vs. ITO)
-2.0 -1.5 -1.0 -0.5 0.0 0.5 1.0 1.5 2.0-10
-8
-6
-4
-2
0
2
4
6
8
10
12
14
I (µ
A)
E (V vs. ITO)
Figure 5.4 - Electrochemical window for gel polymer electrolyte determined by cyclic voltammetry. A
two electrode electrochemical cell was used with the electrolyte film sandwiched in between. The
working electrode was a PET-ITO and the counter electrode and reference electrode was used as a
one electrode also from PET-ITO; clear gel electrolyte (left) and opaque yellow gel electrolyte (right).
In Fig. 5.4-left and –right the cyclic voltammograms show a safe range of electric potential
between -1.5 to 1.5V (vs. ITO) for the clear and opaque gel polymer electrolyte.

137
Gel electrolyte as ionic conductor layer in ECD
Several publications devoted to the development of electrochromic devices are mainly
focused in the individual components: electrochromic layer and electrolyte systems both
SPE, LSE and gel electrolytes. Some authors are only interested on the ECD performances
such as coloration efficiency and electrochromic device stability. However, few works have
focused in the effect of how the ionic conductivity of the electrolyte will influence the ECD
output in terms of optical contrast, switching time and cycling stability.
Here we report on the effect of ECD devices based on a symmetric configuration
PET/ITO/PEDOT/opaque gel electrolyte/PEDOT/ITO/PET, where PEDOT is the
electrochromic layer and the opaque gel electrolyte the ionic conducting layer. Two opaque
gel electrolytes with different ionic conductivities were used to assemble the ECD; ECD-1
and ECD-2. The different ionic conductivities were obtained mixing different quantities of salt
in the gel electrolyte mixture, see Fig. 5.5 and Table 5.3.
Opaque electrolyte
++++
++
++ +
++
++
+++
++
++ +
++
++
+++
++
++ +
++
----
--
---
-
--
--
-
----
--
---
-
--
--
-
----
--
---
-
-
Electrons flow
Figure 5.5 – ECD-R in a symetric “sandwich-like” architecture.
Table 5.3 – Ionic conductivity of the electrolyte layer in ECD*-1 and ECD*-2
ECD designation Eelectrolyte layer
κ (S.cm-1) Salt content %w/w
ECD-1 1.95x10⁻³ 0.43
ECD-2 1.25x10⁻² 3.7
* PET/ITO/PEDOT/opaque gel electrolyte/PEDOT/ITO/PET
In Fig. 5.6, the reflectance spectra of the symmetric ECD-R based on PEDOT is represented
at different applied electrical potentials – potentiostatic titration.

138
400 450 500 550 600 650 700 750
4
8
12
16
20
24
(+0,4V)
%R
Wavelength (nm)
reduced
oxidized
(-1,5V)
Figure 5.6 – Reflectance spectra of ECD-2 at different percentages of doped PEDOT as a function of
the applied electrical potential. Potentials are measure vs. PEDOT/ITO electrode.
ECD-1 shows a maximum variation of reflectance at ca. 630nm, being a typical value for the
PEDOT material. Complete coloration of the ECD is reached at ca. -1,5V (vs. PEDOT) and
full bleaching at +0,4V (vs. PEDOT). These values were used to operate both ECD (ECD-1
and ECD-2) in the following tests.
To evaluate how the ionic conductivity of the electrolyte layer affects the performance of the
ECD write-erase cycles were performed. A square wave potential between
-1.5V and +0.4V (vs. PEDOT) was used to cycle the ECD between the coloured and
bleached optical states, respectively.

139
0 200 400 600 800
0
3
6
9
12
-2 0 2 4 6 8 10 120
5
10
15
20
25
30
35
∆%
R63
0nm
, 0Time (ms)
∆%
R6
30nm
, 0
Time (s)-2 0 2 4 6 8 10 12
0
5
10
15
20
25
30
35
200 400 600 800
0
3
6
9
12
Time (s)
∆%
R63
0nm
, 0
∆%
R63
0nm
, 0
Time (ms)
Figure 5.7 – Left: spectroelectrochemical data for the first cycle operated on the ECD-1 (open circle)
and the ECD-2 (open square) during the coloration process (-1.5V vs. PEDOT/ITO); Right:
spectroelectrochemical data for the first cycle operated on ECD-1 (open circle) and ECD-2 (open
square) during the bleaching process (+0.4V vs. PEDOT/ITO). The insets show a zoom-in for the
respective plot, detail on the optical variation during the first second after the electric trigger is shown.
In Fig. 5.7-left and Fig. 5.7-right the reflectance variation (∆%R630nm) observed for the first
write-erase cycle for the ECD-1 and the ECD-2 is shown.
Spectroscopic data presented in Fig.5.7 show that ECD-1 presents a lower optical variation
for the full switch when compared with the data of ECD-2. This result is a direct consequence
of the different electrolytes used in both ECD’s.
Complete oxidation or reduction of the electrochromic layer will result in the largest possible
optical contrast for a specific ECD. As described in Eq. 5.8, PEDOT:PSS reduction
(colouration, neutral state) and oxidation (bleaching, dopped state) is accompanied by the
movement of ions in the electrolyte/electrochromic film interface.
Eq. 5.8
To perform complete electrolysis of the PEDOT layers a determined amount of electrical
charge must be readily compensated by an equivalent amount of ionic charge (see Eq.5.8).
ECD-1 shows an optical transition 35% lower than that found in ECD-2; however, both ECD’s
were assembled with the same electrochromic area and thickness layer. The optical
transition of ECD-1 seems to be limited by the salt content within the electrolyte layer.
The switch time between both optical states observed for ECD-1 and ECD-2 are identical.
Inset of Fig. 5.7-left and Fig. 5.7-right shows the optical evolution after the electrical voltage
PEDOT:PSS + e- + M+ PEDOT:PSS-M

140
trigger (Time = 0s) and the following 1s. The behaviour observed indicates that the ionic
mobility for both electrolytes used in ECD-1 and ECD-2 were not affected by the electrolyte
salt content.
Further write-erase cycles were performed within the range of electric potential to perform full
colour transition (see Fig. 5.8 and Fig. 5.9).
20 40 60 80 10012
14
16
18
20
22
24
26
initial write-erase cycles after 1200 write-erase cycles
∆%
R6
30nm
, n
Time (s)
-1.2
-1.0
-0.8
-0.6
-0.4
-0.2
0.0
0.2
0.4
0.6
0.8
0 15 30 45 60-3
-2
-1
0
1
2
I (mA
)
E (
V v
s. P
ED
OT
)
Time (s)
18s
12s
Figure 5.8 – The write-erase cycling stability test data from ECD-1. Left: variation of the reflectance of
the device during write-erase cycling tests, first cycles (full line) and after 1200 cycles (open circle +
full line). Right: square-wave electrical potential used to operate the stability cycling tests of the device
(dashed line), and chronoamperometry data during the stability cycles (full line)

141
20 40 60 80 100
2
4
6
8
10
12
14
16
18
20
22
initial write-erase cycles after 1200 write-erase cycles
Time (s)
∆%
R6
30nm
, n
0 20 40 60 80 100-8
-6
-4
-2
0
2
4
6
8
10
0 20 40 60 80 100-2.0
-1.5
-1.0
-0.5
0.0
0.5
1.0
1.5
2.0
2.5
3.0
E (
V v
s. P
ED
OT
)
I (mA
)
Time (s)
15s
15s
Figure 5.9 – The write-erase cycling stability test data from ECD-2. Left: variation of the reflectance of
the device during write-erase cycling tests, first cycles (full line) and after 1200 cycles (dots). Right:
square-wave electrical potential used to operate the stability cycling tests of the device (dashed line),
and chronoamperometry data during the initial cycles (full line).
Fig. 5.8 and Fig. 5.9 show the reflectance data for the first and after 1200 cycles for the ECD-
1 and ECD-2, respectively. The ECD-1 present a decrease of the total reflectance variation
after the 1200 operated cycles, while ECD-2 presents almost the same reflectance variation
after 1200 cycles as for the first cycle. ECD-1 and ECD-2 show also differences for the
chronoamperometric data (Figs.5.8-right and 5.9-right). ECD-2 presents a current peak that
occurs during the first moments of the potential transition that is one order of magnitude
greater than the peak of current obtained with ECD-1. In Table 5.4 and 5.5 data from
spectroelectrochemistry study of both cells is resumed.

142
Table 5.4 – Collected data from spectroelectrochemical experiments for ECD-1, measured before the
write-eras cycling test
Optical transition Time (s) %full
switch %∆R630nm,0
∆Q'
(Ccm-2)
CE
(C-1cm2) %R
0 0 0 0 0 16.4
1 92.3 9.0 1.2E-04 7.6E+04 25.4
1.5 95.7 9.3 1.5E-04 6.4E+04 25.7
4.5 98.9 9.6 1.9E-04 5.0E+04 26.0
7 99.1 9.6 2.0E-04 4.7E+04 26.1
11 99.7 9.7 2.2E-04 4.5E+04 26.1
bleaching
12 100.0 9.7 2.2E-04 4.5E+04 26.1
0 0 0 0 0 26.1
1 80.5 7.8 7.3E-05 1.1E+05 18.4
3 90.1 8.7 1.2E-04 7.1E+04 17.5
7 95.1 9.2 1.6E-04 5.6E+04 17.0
14.5 99.0 9.5 2.1E-04 4.5E+04 16.6
17 99.9 9.6 2.3E-04 4.2E+04 16.5
colouration
17.6 100 9.6 2.3E-04 4.2E+04 16.5
Table 5.5 – Collected data from spectroelectrochemical experiments for ECD-2, measured before the
write-eras cycling test
Optical transition Time (s) %full
switch %∆R
∆Q'
(Ccm-2)
CE
(C-1cm2) %R
0 0 0 0 0 6.1
1 90.1 12.8 7.5E-04 1.7E+04 18.9
6.1 94.9 13.5 9.2E-04 1.5E+04 19.6
12.1 99.0 14.0 9.6E-04 1.5E+04 20.1
14.3 99.9 14.2 9.8E-04 1.5E+04 20.3
bleaching
14.4 100.0 14.2 9.8E-04 1.5E+04 20.3
0 0.0 0.0 0 0 20.9
1 91.0 13.5 8.4E-04 1.6E+04 7.4
1.5 94.9 14.0 9.0E-04 1.6E+04 6.8
5.3 99.0 14.7 1.0E-03 1.4E+04 6.2
14.1 99.9 14.8 1.2E-03 1.3E+04 6.1
colouration
14.2 100.1 14.8 1.2E-03 1.3E+04 6.0

143
The reflectance data analysed for both ECD’s during the first cycle (see, Fig. 5.7) shows that
the ECD-2 has a higher contrast then the observed for the ECD-1. In contrast to colour
contrast, CE values obtained for ECD-1 are in average 70% higher than those found for
ECD-2. It could be hypothesised that ECD-2 current is consumed in parasitic reactions to the
electrochromic switching, and this would be traduced in a lower stability of the colour contrast
during the write-erase cycles. However, ECD-2 shows an improved stability (see Fig. 5.9)
towards write-erase cycling compared to ECD-1 that shows 17% loss after 1200 cycles (see
Fig.5.8); opposed to ECD-2 that shows less than 1% loss.
To understand why ECD-2 requires more charge per unit of colour contrast the reflectance
variation during colouration and bleaching vs. the charge consumed per unit of electrode
area (∆Q’) is plotted in Fig.5.10. Both ECD’s present a linear behaviour for at least 80% of
the full switch. After this point a plateau is reached and the charged consume is not effective
for colour variation, from this point forward the CE value usually decrease. This behaviour
was also observed for other electrochromic systems (see section 4.3.1 and 4.3.2).
0.00 0.05 0.10 0.15 0.20 0.25
0
2
4
6
8
10
0
20
40
60
80
100
erase write
%full sw
itch∆%
R6
30nm
, 0
∆Q'(mCcm-2)
0.0 0.2 0.4 0.6 0.8 1.0 1.2
0
2
4
6
8
10
12
14
16
0
20
40
60
80
100
erase write
%∆
R6
30nm
, 0
∆Q' (mCcm-2)
%full sw
itch
Figure 5.10 – Variation of the reflectance vs. the charge consumed by the ECD-1 (left) and ECD-2
(right).
Inspection of Fig.5.10-right in the first instants after the redox switch (colouration and
bleaching) the reflectance shows a delayed response towards the charge consumed and
after this point the evolution becomes linear until full electrolysis of the electrochromic layer is
reached. For ECD-1 (see Fig.5.10-left) this phenomenon is not observed, within the limitation
of the experimental technique (sampling rate of 100ms for the reflectance and charge data
was used). A possible explanation is that a non-Faradic current is being originated during the
first moments after the ECD is switched. This phenomenon is only observable for ECD-2 that
has the higher salt content in the electrolyte layer. Processes like double layer formation of

144
the ions along the surface of the electrode may be the reason for the lag-phase optical
response. The electrical double-layer is absolutely analogue to an electrical capacitor, which
has a specific charge capacity.
The consumption of charge through innocuous non-faradic processes seems to explain both
the low CE for the ECD-2 and its high stability towards the write-erase cycles. On the other
hand, the pronounced degradation found for ECD-1 could consequently be explained as the
result of deficient charge compensation of the polarized electrodes. The continuous
operation of the device will create electrostatic repulsion between the polarized electrode and
the electrochromic layer, promoting leaching of the electrochromic layer from the electrode.
Based on the data obtained from the spectroelectrochemical experiments with both ECD the
energy required to power the write process (colouration) and the maximum CR were
calculated, see Table 5.6.
Table 5.6 – Performance output of the ECD-1 and ECD-2
Energy consumption
(mJ/cm2) CR
ECD-1 0.4 6.1
ECD-2 1.8 16.7
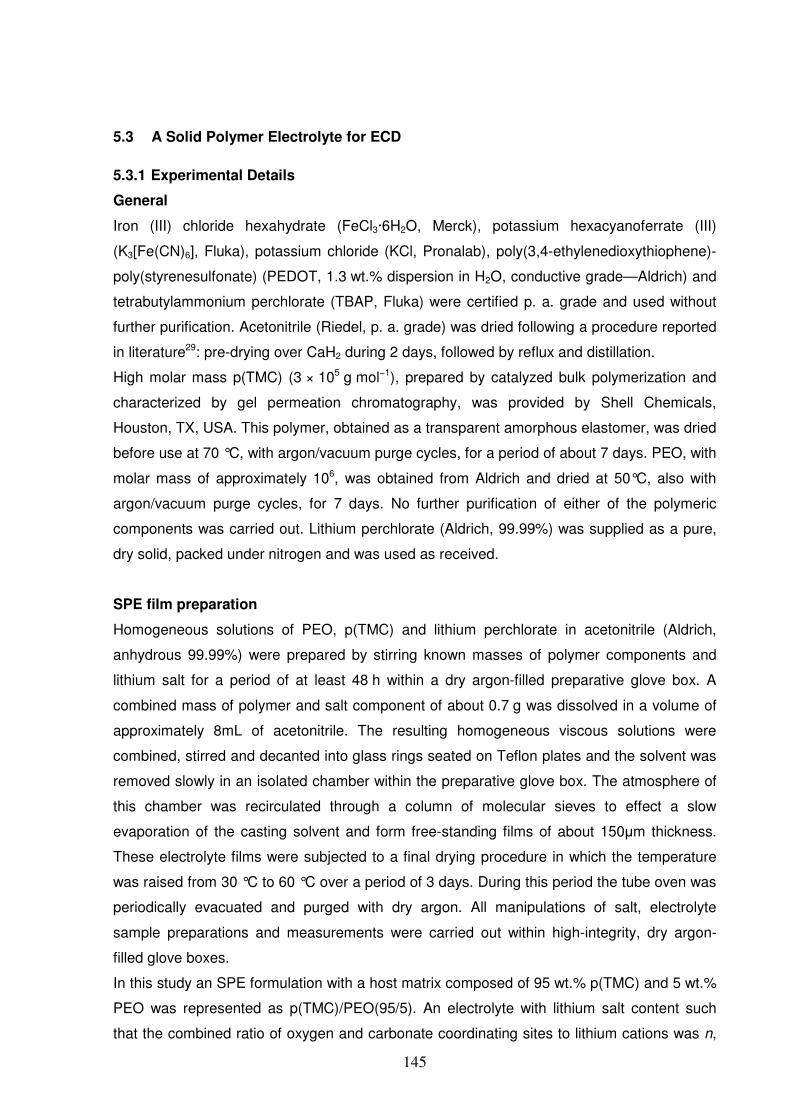
145
5.3 A Solid Polymer Electrolyte for ECD
5.3.1 Experimental Details
General
Iron (III) chloride hexahydrate (FeCl3·6H2O, Merck), potassium hexacyanoferrate (III)
(K3[Fe(CN)6], Fluka), potassium chloride (KCl, Pronalab), poly(3,4-ethylenedioxythiophene)-
poly(styrenesulfonate) (PEDOT, 1.3 wt.% dispersion in H2O, conductive grade—Aldrich) and
tetrabutylammonium perchlorate (TBAP, Fluka) were certified p. a. grade and used without
further purification. Acetonitrile (Riedel, p. a. grade) was dried following a procedure reported
in literature29: pre-drying over CaH2 during 2 days, followed by reflux and distillation.
High molar mass p(TMC) (3 × 10⁵ g mol−1), prepared by catalyzed bulk polymerization and
characterized by gel permeation chromatography, was provided by Shell Chemicals,
Houston, TX, USA. This polymer, obtained as a transparent amorphous elastomer, was dried
before use at 70 °C, with argon/vacuum purge cycles, for a period of about 7 days. PEO, with
molar mass of approximately 106, was obtained from Aldrich and dried at 50°C, also with
argon/vacuum purge cycles, for 7 days. No further purification of either of the polymeric
components was carried out. Lithium perchlorate (Aldrich, 99.99%) was supplied as a pure,
dry solid, packed under nitrogen and was used as received.
SPE film preparation
Homogeneous solutions of PEO, p(TMC) and lithium perchlorate in acetonitrile (Aldrich,
anhydrous 99.99%) were prepared by stirring known masses of polymer components and
lithium salt for a period of at least 48 h within a dry argon-filled preparative glove box. A
combined mass of polymer and salt component of about 0.7 g was dissolved in a volume of
approximately 8mL of acetonitrile. The resulting homogeneous viscous solutions were
combined, stirred and decanted into glass rings seated on Teflon plates and the solvent was
removed slowly in an isolated chamber within the preparative glove box. The atmosphere of
this chamber was recirculated through a column of molecular sieves to effect a slow
evaporation of the casting solvent and form free-standing films of about 150µm thickness.
These electrolyte films were subjected to a final drying procedure in which the temperature
was raised from 30 °C to 60 °C over a period of 3 days. During this period the tube oven was
periodically evacuated and purged with dry argon. All manipulations of salt, electrolyte
sample preparations and measurements were carried out within high-integrity, dry argon-
filled glove boxes.
In this study an SPE formulation with a host matrix composed of 95 wt.% p(TMC) and 5 wt.%
PEO was represented as p(TMC)/PEO(95/5). An electrolyte with lithium salt content such
that the combined ratio of oxygen and carbonate coordinating sites to lithium cations was n,

146
was identified as p(TMC)/PEO(95/5)n LiClO4. This designation follows the conventional use
of the subscript n as an indication of the salt content in polymer electrolytes.
Prussian blue films
PB films were electrogenerated on flexible electrodes of polyethylene terephthalate (PET)
films coated with indium tin oxide (PET/ITO, Aldrich with a resistivity of 60 Ω/sq and a useful
area between 3 and 4 cm2). The electrochemical polymerizations were performed in a
conventional three-electrode electrochemical cell. An aqueous solution of 5 mM K3[Fe(CN)]6,
5 mM FeCl3·6H2O and 0.2 M KCl was used as PB polymerization solution.
Electropolymerization was conducted under a constant applied voltage of 0.55 V (vs.
Ag/AgCl), during ca. 30 s. After deposition, the electrode was gently rinsed with distilled
water.
PEDOT films
PEDOT films were spin-coated on the flexible PET/ITO electrode substrate at 2000 rpm for
30 s. The spin-coated film was dried at 50 °C during 2 h.
Electrochromic cell assembly
Electrochromic cells were assembled in a sandwich-like structure. The SPE film was located
between the PET/ITO/PB and PEDOT/ITO/PET modified electrodes. To improve the contact
between the layers of the assembly pressure was applied to the cell overnight using a spring-
loaded support. After this period the edges of the cell were sealed with normal adhesive
tape. This structure was subsequently referred to the PB/SPE#/PEDOT assembly, where #
represents a serial cardinal number used to identify the different electrolyte compositions
used in the formulation of the SPE.
DSC and TGA measurements
Polymer electrolyte sections were removed from dry films and subjected to thermal analysis
under a flowing argon atmosphere between −60 and 350 °C and at a heating rate of
5 °C min−1 using a Mettler DSC 821e. All samples were presented for analysis in 40 µL
aluminium cans with perforated lids to permit the release and removal of decomposition
products.
Samples for thermogravimetric studies were prepared in a similar manner, transferred to
open platinum crucibles and analyzed using a Rheometric Scientific TG 1000 thermobalance
operating under a flowing argon atmosphere. A heating rate of 10 °C min−1 was used to
analyze all the electrolyte samples.

147
Conductivity
Total ionic conductivities of electrolyte samples were determined using a constant volume
support with gold blocking electrodes, located within a Buchi TO 50 oven. The sample
temperature was evaluated by means of a type K thermocouple placed close to the
electrolyte film and impedance measurements were carried out at frequencies between
65 kHz and 500 mHz with a Solartron 1250 frequency response analyzer and 1286
electrochemical interface, over a temperature range of 20–90 °C. Measurements of
conductivity were effected during heating cycles. The reproducibility of recorded
conductivities was demonstrated by comparing the results obtained for a sample subjected to
two heating–cooling–heating cycles. This procedure confirmed the correct operation of the
support and the mechanical stability of the samples.
Electrochemical measurements
Electrochemical polymerization was performed with a conventional three-electrode cell using
a computer controlled Autolab potentiostat–galvanostat Model 20 (Eco-Chemie). The
modified working electrodes were constructed as described above (see PB and PEDOT film),
the auxiliary electrode was a platinum wire and the reference was an Ag/AgCl electrode
(BAS). Electrochemical measurements of PB films were performed in a 0.2 M KCl aqueous
solution and PEDOT in 0.1 M TBAP in acetonitrile.
The evaluation of the electrochemical stability window of the electrolyte compositions was
carried out under an argon atmosphere using a two-electrode cell configuration. The
preparation of a 25 µm diameter gold microelectrode surface, by polishing with a moist cloth
and 0.05 µm alumina powder (Buehler), was completed outside the drybox. The
microelectrode was then washed with THF (Aldrich, 99.9% inhibitor-free), dried with a hot-air
blower and transferred to the drybox. The cell was assembled by locating a clean lithium disk
counter electrode (cut from Aldrich, 99.9%, 19 mm diameter, 0.75-mm thick) on a stainless
steel current collector and centring a sample of electrolyte on the electrode surface. A small
volume (2 µL) of THF was placed on the microelectrode surface. The microelectrode was
then located on the electrolyte surface and supported firmly by means of a clamp. The use of
THF to soften the electrolyte was necessary to achieve a reproducible
microelectrode/electrolyte interfacial contact. An Autolab PGSTAT-12 (Eco-Chemie) was
used to record voltammograms at a scan rate of 100 mV/s. Measurements were performed
at room temperature, within a Faraday cage.

148
Spectroelectrochemical measurements
UV/Vis absorbance spectra and chronoabsorptometry were recorded in a Shimadzu
UV2501-PC spectrophotometer at 1nm resolution. All spectroscopic measurements of the
electrochromic cells (PB/SPE#/PEDOT) were carried out in situ with the electrochromic cells
positioned perpendicular to the light beam of the spectrophotometer. Cells were connected to
the potentiostat apparatus by means of electrical wires and flat contacts.

149
5.3.2 Results and Discussion
In order to assess the improvement that might be accessible as a result of the substitution of
the liquid electrolyte or gel electrolyte, electrochromic devices were assembled using a solid
polymer electrolyte as the ion-conducting layer. Electrolytes based on interpenetrating
p(TMC)/PEO blends doped with lithium perchlorate were prepared by co-deposition from
acetonitrile. Thermal and ionic conductivity as well as the electrochemical stability data of the
SPE films were supplied by M. M. Silva, however, the results will be resumed in the next
paragraph because it is relevant information for the study.
p(TMC)/PEO blend general properties
In order to obtain PEO-based materials containing a high percentage of stable amorphous
phases, with a low Tg and high ionic conductivity, a pTMC matrix was incorporated into the
PEO structure.
It was observed that the p(TMC)/PEO(X/Y)n LiClO4 electrolyte series is presented as a
completely amorphous material. Any PEO crystals are observable in any of the samples
evaluated, confirming that the samples are entirely amorphous. The introduction of a polymer
matrix, chemically compatible with PEO, has the effect of inhibiting the crystallization and
leads to the formation of amorphous materials.
The incorporation of the pTMC component into the PEO matrix improves the mechanical
performance of the polymer blends. Electrolytes prepared with high pTMC concentration
were very transparent and flexible, well-adapted as functional components in optical devices.
A single Tg was registered in all electrolyte samples, confirming miscibility of the system
components. In the three polymer mixtures (85/15, 90/10 and 95/5) the value of Tg increases
with the guest salt concentration. This observation is consistent with the chain-stiffening
effect i.e. an increase in salt concentration would be expected to cause an increase in the
intensity of salt–polymer segment interaction.
Thermogravimetric studies of these polymer blends confirmed that the onset of the thermal
degradation of samples is lower than that of pure component polymers. Although, thermal
degradation of the electrolyte formulations takes place with a gradual onset it is found a
minimum thermal stability of about 200 ± 10 °C for the three p(TMC)/PEO electrolytes
composition used in this study. This temperature is more than adequate for applications in
electrochromic devices.
In these LiClO4-doped, blend-based systems higher conductivities are generally observed for
compositions with higher wt.% of PEO. This may suggest that lithium ions form more labile
complexes with PEO host segments than with the pTMC component, thus increasing the
ionic conduction in the PEO phase. A marked improvement is seen in the

150
p(TMC)/PEO(X/Y)5LiClO4 compositions, which present higher conductivities than the
reference PEO5LiClO4 composition.
Although electrolytes with greater p(TMC) content do not show as high ionic conductivity they
have better mechanical and optical properties, an aspect of critical importance in the present
application.
The electrochemical stability of the p(TMC)/PEO(95/5)10LiClO4 electrolyte was evaluated by
microelectrode cyclic voltammetry over the potential range from −2.0 to 7.0 V vs. Li/Li+.
The overall stability of the electrolytes is good with no electrochemical oxidation occurring at
potentials less than 5 V vs. Li/Li+. At the anodic potentials it was found electroactive safe at
least until a potential of -2V versus Li/Li+. This result confirms the applicability of this
electrolyte composition in commercial electrochemical devices.
In table 5.7 the major characteristics of the p(TMC)/PEO electrolytes chosen to test as ionic
conductor layer in electrochromic devices in this study are presented.
Table 5.7 - p(TMC)/PEO(X/Y)nLiClO4 electrolytes for application on prototype solid-state
electrochromic devices.
p(TMC)/PEO(X/Y)nLiClO4 (Designation) κ(Scm-1) Tg (ºC)
p(TMC)/PEO(95/5)12LiClO4 (SPE1) 1.6x10⁻⁸ -10
p(TMC)/PEO(95/5)15LiClO4 (SPE2) 7.9x10⁻⁹ -11,5
p(TMC)/PEO(90/10)12LiClO4 (SPE3) 5.6x10⁻⁹ -13
p(TMC)/PEO(90/10)15LiClO4 (SPE4) 1.8x10⁻⁸ -17
p(TMC)/PEO(85/15)12LiClO4 (SPE5) 1.5x10⁻¹⁰ -16
p(TMC)/PEO(85/15)15LiClO4 (SPE6) 2.4x10⁻¹¹ -17
Spectroelectrochemistry data
Complementary electrochromic devices based on PB and PEDOT have been proposed as
display elements capable of long-term cycle stability and high performance.31 In this study,
we use a PB/SPE#/PEDOT electrochromic cell configuration to explore the characteristics of
a batch of SPE samples (Table 5.7). These electrolytes were chosen on the basis of their
high optical transparency and excellent mechanical properties.Electrochromic device
potential limits were chosen to be −1.5 V (vs. PEDOT) and +1 V (vs. PEDOT) in order to
effect the transition between the bleached state (light blue) and the coloured state (deep
blue), respectively. Absorption spectra of the entire PEDOT/SPE#/PB cell show a maximum
wavelength of absorption at ca. 630nm. The PEDOT layer presents a maximum absorption
wavelength at 600nm31, and PB at 700nm32, in the coloured state. Fig.5.11 illustrates the UV-
Vis spectra corresponding to the coloured and bleached states of the electrochromic cell
PEDOT/SPE4/PB and is representative of all the studied cells. Comparing absorption

151
spectra of the entire cell to those published in previous papers31 we can identify the bands
corresponding to both reduced PEDOT (predominant) and oxidized PB at the potential used
(+1 V vs. PEDOT).
400 500 600 700 800
0.6
0.8
1.0
1.2
1.4
-2 -1 0 1 2 3
0.7
0.8
0.9
1.0
-1.5V (vs. PEDOT)
A
Wavelength (nm)
E (V vs. PEDOT)+1V (vs. PEDOT)
A63
0nm
Figure 5.11 - Spectroelectrochemical data of the complementar PET/ITO/PB/SPE4/PEDOT/ITO/PET
ECD in the coloured state (+1 V vs. PEDOT, dashed line) and bleached state (−1.5 V vs. PEDOT, full
line). Inset: Absorbance data at 630nm for the PB/SPE4/PEDOT electrochromic cell as a function of
the potential applied.
The potential limits were determined by a potentiostatic titration (inset Fig.5.11) in which the
absorbance at 630nm was recorded for different potentials applied to the electrochromic cell.
All the cells studied showed colour transitions between light and dark blue. In Fig.5.12 cyclic
voltammetry of the ECD shows a very broad/unresolved signal. Two oxidation peaks and two
reduction peaks should appear in the voltammogram since the cyclic voltammetry results of
the ECD are a simple combination of the voltammogram of PEDOT and PB.33 Although, only
one oxidation peak and two reduction peaks are distinguishable from Fig.5.12.

152
-1.5 -1.0 -0.5 0.0 0.5 1.0
-20
-10
0
10
20
30
I (µA
)
E (V vs. PEDOT)
Figure 5.12 - Cyclic voltammogram of the ITO/PB/SPE1/PEDOT/ITO electrochromic cell. The reported
cell voltage is that of PB with respect to PEDOT (vs. PEDOT).
In situ chronocoulometry/chronoabsorptometry data (Fig.5.13) show the behaviour of the
current flow through the electrochromic cell during the switching steps. A decay of the device
current is observed after switching (Fig.5.13-right). Considering that the exchange of one
electron is followed by the exchange (insertion or extraction) of one ion between the
electrochromic surface and the electrolyte, we can explain this current decay by the
existence of an ion diffusion limit (assuming that the kinetics involving ion transfer are much
slower than those of the corresponding electron transfer) or exhaustion either of labile ions to
be exchanged or of redox centres on the electrochromic surface. The time needed for full
colour switch between coloured–bleached states is rather long in these cells (e.g., a cycle
corresponding to 80% of ∆Amax on a PEDOT/SPE1/PB cell takes ca. 40 min to be
completed), mainly due to the low ionic conductivities of these SPE's.

153
10 15 20 25 30 350.50
0.51
0.52
0.53
0.54
0.55A
630n
m
Time (s)
10 15 20 25 30 35
-0.8
-0.6
-0.4
-0.2
0.0
0.2
0.4
0.6
0.8
erase6s
Time (s)
I (m
A)
write2s
completewrite-erase cycle
8s
Figure 5.13 - In situ chronocoulometry/chronoabsorptometry data for
PET/ITO/PB/SPE1/PEDOT/ITO/PET electrochromic cell during short cycling tests;
chronoabsorptometry recorded at 630nm (left), chronoamperometry (right).
Spectroelectrochemical data (Table 5.8) shows maximum transmittance variations
(∆%T630nm,0) between the bleached to the coloured state over a wide range of values: 8–30%.
A global correlation could not be found between the ∆%T630nm,0 and the SPE's characteristics
(ionic conductivity and the amount of PEO in the blend). However, we can observe the effect
of the amount of lithium salt in the SPE for the same polymer blend. SPE's with the higher
concentrations of Li+ ions show greater %∆T.
Table 5.8 - Spectroelectrochemical data for the different electrochromic cells PB/SPE#/PEDOT.
Cell (#) Ac,630nma Ab,630nm
b ∆A630nm,0c ∆%T630nm,0
d
1 0.75 0.51 0.24 13 2 0.85 0.64 0.21 9
3 0.38 0.23 0.15 17
4 0.93 0.70 0.23 8
5 0.66 0.28 0.38 30
6 0.71 0.38 0.33 22
a Ac – coloured state. b Ab – bleached state. c Maximum absorbance variation – full switch before any cycling test. d Respective transmittance variation of the ∆A630nm,0

154
Cycling stability tests
Cycling tests were performed on all the electrochromic cells. Due to the long time needed for
full colour switch, short times (and correspondingly low ∆A) were chosen to compare the
performance of each SPE in the PET/ITO/PB/SPE#/PEDOT/ITO/PET (PB/SPE#/PEDOT)
electrochromic cells. Each cell was cycled (write-erase) 2500 times, choosing coloration–
bleaching times that correspond to ca. 20% of the full colour switch; these times vary in the
range 8–70 s. Table 5.9 summarizes the short cycling test conditions for each cell. At the end
of the 2500 short cycles, the full switch colour data was again recorded. Fig.5.14 compares
the results for the short time cycling stress induced in each electrochromic cell.
Table 5.9 - Short cycling conditions.
Cell (#)
PB/SPE#/PEDOT ∆A630nm,0 ∆A short cycling
Colouration time
(s)
Bleaching time
(s)
1 0.24 0.04 2 6 2 0.21 0.05 8 15
3 0.15 0.05 18 34
4 0.23 0.03 5 7
5 0.37 0.04 7 20
6 0.32 0.07 53 19

155
0.0
0.1
0.2
0.3
0.4
0.5
0.6
0.7
0.8
0.9
1.0
-81%-49%
0%
-53%SPE6
SPE5
SPE4
SPE3
SPE2
A63
0nm
SPE1
+8%
-29%
Figure 5.14 - Full switch in absorbance of the electrochromic cells before (black) and after (grey) 2500
short cycles (write-erase cycling, conditions presented in Table 5.9); the figure in each column
accounts for the relative variation of full switch of absorbance at 630nm after 2500 short
cycles = (∆A2500 × 100/∆Ainitial) − 100, see section 1.2.1 ECD parameters. The absorbance at 630nm
for the coloured and bleached states for each cell is the values of the top and at the bottom of each
column, respectively.
Reasonable cycle stability was found in devices based on SPE4 and SPE1 films while cells
based on SPE2, SPE3, SPE5 and SPE6 show a large ∆A loss. The most interesting result
was obtained for the device based on SPE1. After completing 2500 cycles, the full switch ∆A
increased by 8% relative to initial values. Ho et al.31 proposed a 4-stage behaviour for the
cycling stability of PB/electrolyte/PEDOT electrochromic cells. The first stage involves film
stabilization; during the second stage the optical variations remain constant throughout the
cycles. A dramatic decrease in the ∆A is observed during the third stage, and finally in the
last stage, the device gradually begins to lose performance at a moderate rate. In the case of
the PB/SPE1/PEDOT assembly, a substantial increase in the total absorbance variation at
630nm was observed after 2500 cycles, corresponding to the first stage of device
stabilization, indicating a very high stability to cycle testing.
The cell PB/SPE5/PEDOT was subjected to a higher stress by cycling with longer step times,
forcing the device to switch between larger values of ∆A (ca. 50% of ∆A630nm,0). Fig. 5.15
shows the cycling conditions and absorbance changes at 630nm for the first cycles; Fig. 5.16
shows the long-term stability of the cell. Under these cycling conditions, Fig. 5.16 clearly
shows an exponential decay of ∆A with cycling that reaches a plateau after ca. 100 cycles
when ∆A has dropped by 65%. This observation is not explained by the 4-stage behaviour
for the cycling stability of PB/electrolyte/PEDOT electrochromic cell proposed by Ho et al.
This data confirms the low stability towards cycling already observed during the short 2500
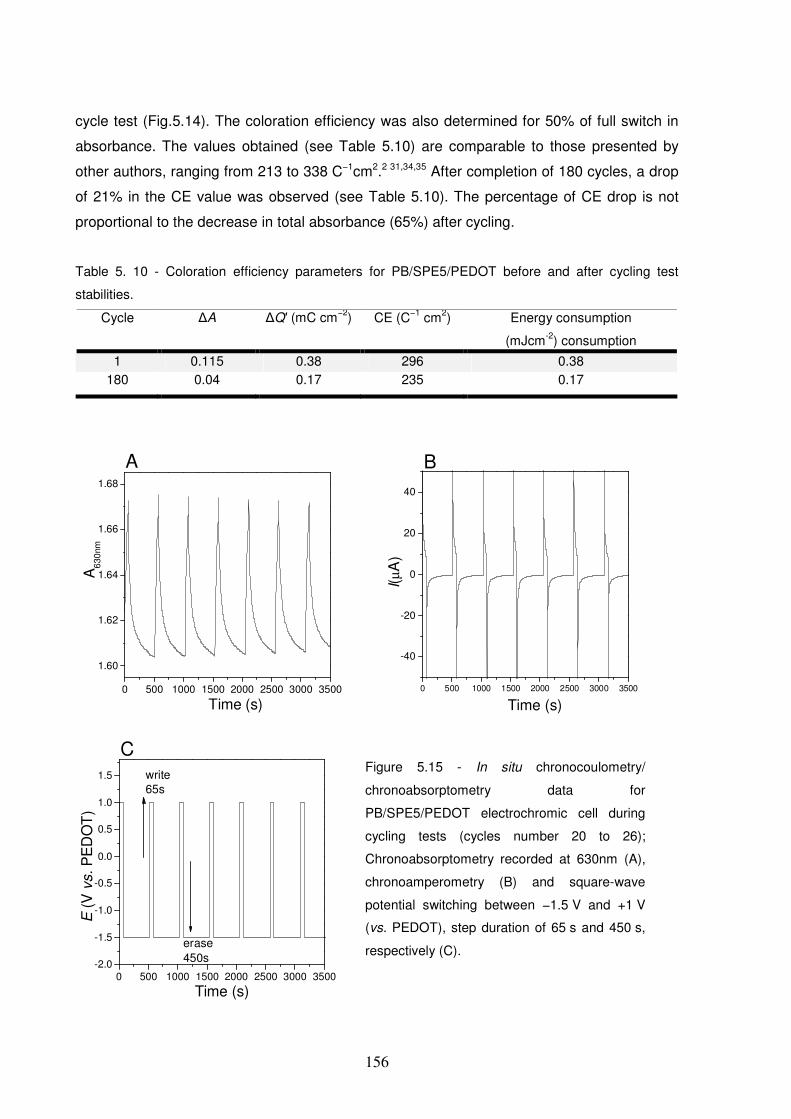
156
cycle test (Fig.5.14). The coloration efficiency was also determined for 50% of full switch in
absorbance. The values obtained (see Table 5.10) are comparable to those presented by
other authors, ranging from 213 to 338 C−1cm2.2 31,34,35 After completion of 180 cycles, a drop
of 21% in the CE value was observed (see Table 5.10). The percentage of CE drop is not
proportional to the decrease in total absorbance (65%) after cycling.
Table 5. 10 - Coloration efficiency parameters for PB/SPE5/PEDOT before and after cycling test
stabilities.
Cycle
∆A
∆Q′ (mC cm−2)
CE (C−1 cm2)
Energy consumption
(mJcm-2) consumption
1 0.115 0.38 296 0.38 180 0.04 0.17 235 0.17
0 500 1000 1500 2000 2500 3000 3500
1.60
1.62
1.64
1.66
1.68
A63
0nm
Time (s)
A
0 500 1000 1500 2000 2500 3000 3500
-40
-20
0
20
40
I(µA
)
B
Time (s)
0 500 1000 1500 2000 2500 3000 3500-2.0
-1.5
-1.0
-0.5
0.0
0.5
1.0
1.5
E (
V v
s. P
ED
OT
)
Time (s)
write65s
erase450s
C
Figure 5.15 - In situ chronocoulometry/
chronoabsorptometry data for
PB/SPE5/PEDOT electrochromic cell during
cycling tests (cycles number 20 to 26);
Chronoabsorptometry recorded at 630nm (A),
chronoamperometry (B) and square-wave
potential switching between −1.5 V and +1 V
(vs. PEDOT), step duration of 65 s and 450 s,
respectively (C).

157
0 20 40 60 80 100 120 140 160 1800.00
0.02
0.04
0.06
0.08
0.10
0.12
∆A
630n
m, n
cycling nº
Figure 5.16 – The total ∆A at 630nm during the write-erase cycling test of the
PET/ITO/PB/SPE5/PEDOT/ITO/PET.

158
5.4 General Conclusions
The clear and opaque gel electrolyte presented fluid characteristics appropriate to assemble
electrochromic devices with coating techniques. The easy film formation properties and high
adhesion to the PET-ITO modified electrodes were found to improve the performance and
appearance of the devices. The fluidity of the gel allows to pour the electrolyte over the
electrodes surface easily and in a short period of time a sticky gel is formed. The electrolyte
film does not flow when the electrode is tilted. It shows also strong adhesion properties which
helped to assemble the electrochromic device. The only drawback found working with the gel
electrolyte is the necessity that edges of the device have to be perfectly sealed. When
pressure is applied over the sticky gel electrolyte film it will deform and leak through
unsealed edges.
The gel electrolyte electrochemical stability was adequate for ECD assembled in this study,
however still far from that presented by SPE. The ionic conductivity of the gel electrolyte
showed a linear increase with the concentration of lithium salt until a maximum is reached at
ca. 4% of salt. After this point, further addition of salt did not result in an increase of the ionic
conductivity and the equivalent conductivity shows a decrease. Optimum mass proportions of
solvent, polymer and salt of 67:27:4 showed an ionic conductivity in the order of 10-2Scm-1.
Design of opaque electrolyte layers allows to use the same electrochromic material at both
electrodes of the ECD – symmetric ECD. The application of identical electrochromic material
and film in both electrodes has shown to improve the ECD performance. Identical electron
and ion transfer kinetics in both ECD electrodes seems to reduce undesirable hysteresis
through the ECD and consequently premature failure.
We devised a simple strategy to assess the influence of different ionic conductivities of the
electrolyte layer on the ECD’s; performed at three different levels: coloration efficiency,
switching times and cycling stability.
Optical contrast and cycling stability was found to be strongly influenced by the ionic
conductivity of the electrolyte layer. ECD assembled with a high conductor electrolyte layer
(ECD-2) showed an improved stability in comparison to ECD assembled with a low
conductor electrolyte layer (ECD-1). In addition, the optical contrast was improved. These
results are related with the different salt content in both electrolytes.
ECD-1 and ECD-2 showed a linear variation of the reflectance values when switch potential
is applied reaching a saturation point. ECD-1 showed approximately the same optical
transition rate during the first moments of the optical transition (ca.200-300ms after the
potential trigger). After this period both devices start to be diffusion dependent and
reflectance value is constant until the end of the colouration step. It was also found ECD-1
does not spend as much charge as the ECD-2 to complete a full optical switch. Coloration

159
efficiency showed to be influenced by the ionic conductivity of the electrolyte. ECD-2 seems
to spend more current in processes that are no contributing to optical variation. Consequently
these devices present lower CE.
The electrochemical stability of solid polymer electrolytes, based on p(TMC)/PEO
interpenetrating networks doped with lithium perchlorate electrolytes prepared from these
blends, is considered adequate for applications in a variety of technological devices.
Prototype electrochromic devices were successfully cycled between the light and dark blue
shades of the bleached and coloured states, respectively, corresponding to the optical
transitions for the Prussian blue and PEDOT electrochromic layers. When subjected to short
cycling times, the devices show rather poor stability, with the exception of those based on
SPE1 and SPE4. Cycling tests performed at larger ∆A variations for the electrochromic cell
based on SPE5 show unexpected behaviour when compared to other studies in the
literature, where only a decay of the ∆A values was observed.
The attempt to reduce the time needed to perform a large number of cycling tests failed. The
stability observed for the SPE5 during the short cycling stability tests were completely
different from the stability cycling test performed at a higher interval of applied potential. The
electrochromic device showed an accelerated decrease of the optical contrast when
subjected to cycling tests with longer intervals.
These results show the importance of carrying out extended cycling tests using in situ
spectroscopic data—spectroelectrochemistry. Further studies should be carried out to
determine the cause of the low cycling stabilities of SPE3, SPE5 and SPE6 and to clarify the
stability behaviour during the full cycle test of cells based on SPE1, SPE2 and SPE4.

160

161
5.5 Bibliography
1. Zoski, C. G., Handbook of electrochemistry. Elsevier: Amsterdam, 2007.
2. Moore, W. J., Physical chemistry. 4th ed.; Longmans: London, 1966.
3. Kobayashi, N.; Miura, S.; Nishimura, M.; Goh, Y., Gel electrolyte-based flexible
electrochromic devices showing subtractive primary colors. Electrochimica Acta 2007,
53 (4), 1643-1647.
4. Meyer, W. H., Polymer electrolytes for lithium-ion batteries. Advanced Materials 1998,
10 (6), 439-448.
5. Vidinha, P.; Lourenco, N. M. T.; Pinheiro, C.; Bras, A. R.; Carvalho, T.; Santos-Silva,
T.; Mukhopadhyay, A.; Romao, M. J.; Parola, J.; Dionisio, M.; Cabral, J. M. S.;
Afonso, C. A. M.; Barreiros, S., Ion jelly: a tailor-made conducting material for smart
electrochemical devices. Chemical Communications 2008, (44), 5842-5844.
6. Monk, P. M. S.; Mortimer, R. J.; Rosseinsky, D. R., Electrochromism and
electrochromic devices. Cambridge University Press: Cambridge, 2007.
7. Monk, P. M. S., The viologens: physicochemical properties, synthesis and
applications of the salts of 4,4'-bipyridine. John Wiley and Sons: Chichester, 1998.
8. Wedler, G., Manual de química física. 4th ed.; Wiley-VCH: Weinheim, 1997.
9. Gray, F. M., Solid polymer electrolytes. Fundamental and technological applications.
Wiley-VCH: Weinheim, 1991.
10. Kuo, T. H.; Hsu, C. Y.; Lee, K. M.; Ho, K. C., All-solid-state electrochromic device
based on poly(butyl viologen), Prussian Blue, and succinonitrile. Solar Energy
Materials and Solar Cells 2009, 93 (10), 1755-1760.
11. Reiche, A.; Steurich, T.; Sandner, B.; Lobitz, P.; Fleischer, G., Ion-transport in gel
electrolytes. Electrochimica Acta 1995, 40 (13-14), 2153-2157.
12. Song, J. Y.; Wang, Y. Y.; Wan, C. C., Review of gel-type polymer electrolytes for
lithium-ion batteries. Journal of Power Sources 1999, 77 (2), 183-197.
13. Croce, F.; Appetecchi, G. B.; Persi, L.; Scrosati, B., Nanocomposite polymer
electrolytes for lithium batteries. Nature 1998, 394 (6692), 456-458.
14. Gadjourova, Z.; Andreev, Y. G.; Tunstall, D. P.; Bruce, P. G., Ionic conductivity in
crystalline polymer electrolytes. Nature 2001, 412 (6846), 520-523.
15. Arico, A. S.; Bruce, P.; Scrosati, B.; Tarascon, J. M.; Van Schalkwijk, W.,
Nanostructured materials for advanced energy conversion and storage devices.
Nature Materials 2005, 4 (5), 366-377.

162
16. Kreuer, K. D.; Paddison, S. J.; Spohr, E.; Schuster, M., Transport in proton
conductors for fuel-cell applications: Simulations, elementary reactions, and
phenomenology. Chemical Reviews 2004, 104 (10), 4637-4678.
17. Wang, P.; Dai, Q.; Zakeeruddin, S. M.; Forsyth, M.; MacFarlane, D. R.; Gratzel, M.,
Ambient temperature plastic crystal electrolyte for efficient, all-solid-state dye-
sensitized solar CeN. Journal of the American Chemical Society 2004, 126 (42),
13590-13591.
18. Bruce, P. G.; Vincent, C. A., Polymer electrolytes. Journal of the Chemical Society-
Faraday Transactions 1993, 89 (17), 3187-3203.
19. Tarascon, J. M.; Armand, M., Issues and challenges facing rechargeable lithium
batteries. Nature 2001, 414 (6861), 359-367.
20. Saunier, J.; Alloin, F.; Sanchez, J. Y., Electrochemical and spectroscopic studies of
polymethacrylonitrile based electrolytes. Electrochimica Acta 2000, 45 (8-9), 1255-
1263.
21. Watanabe, M.; Nagano, S.; Sanui, K.; Ogata, N., Ion conduction mechanism in
network polymers from poly(ethylene oxide) and poly(propylene oxide) containing
lithium perchlorate. Solid State Ionics 1986, 18-9, 338-342.
22. Goodenough, J. B.; Kim, Y., Challenges for rechargeable Li batteries. Chemistry of
Materials 2010, 22 (3), 587-603.
23. Wang, Y. M., Recent research progress on polymer electrolytes for dye-sensitized
solar cells. Solar Energy Materials and Solar Cells 2009, 93 (8), 1167-1175.
24. Sekhon, S. S.; Deepa; Agnihotry, S. A., Solvent effect on gel electrolytes containing
lithium salts. Solid State Ionics 2000, 136, 1189-1192.
25. Sekhon, S. S., Conductivity behaviour of polymer gel electrolytes: role of polymer.
Bulletin of Materials Science 2003, 26 (3), 321-328.
26. Tarascon, J. M.; Gozdz, A. S.; Schmutz, C.; Shokoohi, F.; Warren, P. C.,
Performance of Bellcore's plastic rechargeable Li-ion batteries. Solid State Ionics
1996, 86-8, 49-54.
27. Panyukov, S.; Rabin, Y., Statistical physics of polymer gels. Physics Reports-Review
Section of Physics Letters 1996, 269 (1-2), 1-131.
28. XII International Symposium on Polymer Electrolytes [Online]. Available:
http://www.chimica.unipd.it/ispe12/ [Accessed July 2010].
29. Perrin, D. D.; Armarego, W. L. F., Purification of laboratory chemicals. Pergamon
Press: New York, 1988.
30. Wright, M. R., An introduction to aqueous electrolyte solutions. Wiley: Chichester,
2007.

163
31. Witzke, H.; Schnatterly, S. E. 1974. Symmetrical electrochromic cell. United States of
America patent application 384,052.
32. Lin, T. H.; Ho, K. C., A complementary electrochromic device based on polyaniline
and poly(3,4-ethylenedioxythiophene). Solar Energy Materials and Solar Cells 2006,
90 (4), 506-520.
33. Tung, T. S.; Ho, K. C., Cycling and at-rest stabilities of a complementary
electrochromic device containing poly(3,4-ethylenedioxythiophene) and Prussian
Blue. Solar Energy Materials and Solar Cells 2006, 90 (4), 521-537.
34. Deepa, M.; Awadhia, A.; Bhandari, S.; Agrawal, S. L., Electrochromic performance of
a poly(3,4-ethylenedioxythiophene) - Prussian Blue device encompassing a free
standing proton electrolyte film. Electrochimica Acta 2008, 53 (24), 7266-7275.
35. Sindhu, S.; Rao, K. N.; Gopal, E. S. R., Comparison of performance parameters of
poly(3,4-ethylenedioxythiophene) (PEDOT) based electrochromic device on glass
with and without counter electrode. Bulletin of Materials Science 2008, 31 (1), 15-18.

164
165
Chapter 6
Paper, textile and white board ECD

166
6.1 Motivation
Chromogenic systems are good candidates to develop smart objects. In chapter 1, several
examples of commercially available products based on chromogenic systems are described.
Photochromism and thermochromism present a spontaneous response to light and
temperature, respectively. The development of displays requires chromogenic systems that
are controlled on command and not spontaneously.
Photochromic and thermochromic systems are dependent on ambience conditions.
Considering a thermochromic product designed to interact with the body temperature, such
system should have a threshold in the range of temperature between 30 to 40ºC. Depending
on the ambience temperature, such system could be triggered by the action of a purposeless
stimulus. Similar interferences take place between photochromic systems and light ambience
factors.
Electrochromic devices present a linear behaviour at different operating range of temperature
and light conditions.1 ECD’s are relatively isolated systems and are triggered by a non-
ambience dependent stimulus. Electrochromism shows appropriate characteristics to be
applied on the development of displays.
Commercial or almost in the market electrochromic displays are based on plastic electrodes
(PET-ITO) showing monochromatic optical transitions. A great effort has been done to
develop electrochromic displays with improved lifetime, contrast ratio, switch time, flexibility
and colour gamut. Nevertheless, switch rates are still too low to display video and the colours
presented are limited; as reported in section 1.2.1 (Commercial applications) all the
commercial electrochromic displays show colour transitions between blue and uncoloured
(NTera technology) or light blue (PaperDisplay technology).
Although ECD shows several advantages for programmable interactive systems,
electrochromic materials require a more complex architecture when compared with the
photochromic and thermochromic materials. A photochromic or thermochromic ink can be
easily coated as a unique functional layer over almost any surface. In opposite to
photochromic and thermochromic systems, an electrochromic system requires a minimum of
five active layers to be functional (see section 1.2.1 Electrochromic devices).
Actual electrochromism technology development is focused on plastic electrodes, e.g. PET-
ITO electrodes, and no alternatives are available. YDreams aims to produce ubiquitous
electrochromic displays for mass markets like paper, textile and white boards. The strategy
to reach such objective is the integration of the technology with daily life products such as
paper, textiles and white boards.

167
Paper
The application of paper in our daily life is vast and used in packaging, printing and writable
substrate, and in sanitary products. Paper is a cheap and largely available product showing
interesting physical properties which makes it an attractive product for several industries; and
it is recyclable. Moreover, it is as visual information vehicle that is used over two millennia.
Since its invention paper industry has achieved better physical characteristics and ink
reception capabilities for printing purposes. Recent technologies such as nanotechnology
and bioengineering have been used to obtain paper with a better white appearance and
increased resistance to traction and ink reception capabilities. However, the paper product
concept remains unchanged since its origin.
Paper is actually the best and cheapest display man has ever made, it shows high contrast,
easy viewing, and wide range of angle viewing, very flexible, lightweight, low-power
consumption and relatively stable. Those are the main reasons why paper is so widely used.
Nevertheless, industry and society are always seeking for new functionalities and this is true
for paper products.
Printed paper information is immutable. Information once recorded cannot be reversibly
erased or modified. The challenge is how to create a paper where the printed ink can be
reversibly modified or reversibly erased.
Several Paper-like displays have been developed since more than a decade. Applications
are found for intelligent cards, digital signatures, billboards, electronic labels, clocks,
calculators or mobiles. Actual state-of-the-art of paper-like displays is based on
electrophoretic particles from E-Ink corp. and electrochromism from NTera and ACREO. All
these products, however, are based on plastic substrates (E-Ink and NTera) or plastic coated
paper substrates (ACREO) and not on raw paper.
Textile for clothing
The tendency to integrate data processing systems in items of clothing has been explored
since the early 80’s by Steve Mann.2 The wearable computing concept is explored by
engineers, designers and artists to develop ways to worn your personal computer. A good
example of a wearable computing product is the calculator watch.3 Approaches to develop
wearable computers are based on attached devices like computer processor unit, display
and some other interfaces like sensors on clothes. Real embedded systems have not been
developed and several examples of wearable computers show bulky LCD and LED displays
directly sew into the clothes. Prototypes are not of practical use than for demonstration
purposes. This approach moves itself away from a true concept of fusion between the
computer and the fabric, while the interactive component continues separated of the fabric.
168
White Boards
The white board is an essential instrument for group communication due to its intuitive way to
present or support a message. Visual communication boards are present in any office or
meeting room. Several visual communication board models are available in different colours,
formats and sizes; however, they all show the same basic function.
Introduction of digital technology is used to develop the so called “Smart Boards”. This new
kind of white boards allows the projection of virtual information and to record the information
written on the board in a digital format. Nevertheless, Smart Boards did not successfully
substitute the traditional white boards. The major drawback found was its complexity. The
entire system contains several units - projectors, image trackers and computer - and requires
alignment and correct positioning of the projector and the board. Another kind of
technological solution was explored using embedded LCD displays in the boards. This
solution was also not successful due to the high cost and size limitations.
Industry is seeking for new ways to innovate and re-invent their products. Science and
Technology create new opportunities through the development of smart materials and
systems. Such driving forces create a synergetic effect towards ubiquitous computing
concepts. As already discussed electrochromism phenomena is one of the most promising
ways to add interactivity to objects; however, actual state-of-the-art electrochromic devices
are far from real integration with our daily-life products.
Embedded low information content displays was the main motivation which led YDreams in
collaboration with Univ. Nova de Lisboa and other Portuguese industrial partners to start
three applied research and development projects; “YInvisible-Papel”, “YInvisible-Textil” and
“YInvisible-Quadros”. These projects were executed in the framework of the “IDEIA”
programs coordinated by the Portuguese Innovation Agency (ADI). The objective was to
obtain proofs of concept of electrochromic devices based on paper, textile and white boards.
The following chapter presents an overview of the results obtained in YInvisible-Papel,
YInvisible-Textil and YInvisible-Quadros projects that correspond to the work developed with
paper, textile and visual communication boards, respectively. The Portuguese industrial
partners that participated were RENOVA (Paper industry), Filobranca (Textile industry) and
Bi-Silque (Visual Communication Boards industry). The scientific groups belong to the Fac.
Ciências e Tecnologia of the Univ. Nova de Lisboa, Photochemistry and Supramolecular
Group (FOT group) and CENIMAT. FOT group belongs to the green chemistry network
REQUIMTE associate laboratory and CENIMAT is a research centre from the material
engineering department, belong to I3N associate laboratory. Finally, YDreams was the
consortium leader and responsible for the electronic integration and for the interactivity
concepts.

169
6.2 Strategy and project execution organization
The IDEIA projects YInvisible-Papel, YInvisible-Textil and YInvisible-Quadros were organized
in work packages in which one of the partners was the principal leader and responsible for
execution. In Fig. 6.1, the global work pipeline with the respective responsible partner is
presented.
Industry
CENIMAT
CENIMAT FOT FOT
CENIMAT
YDreams
ECD assembly
and caracterization
Proof-of-concept
Substrates know-how
and supply. Strong
presence in the market.
Substrate
characterization
and TCO deposition
Electrochromic
Layer deposition
Electrolyte layer
development
and deposition
FOT
Figure 6.1 – Schematic plan of the pipeline of the applied R&D work executed during the IDEIA
projects, YInvisible-Papel, YInvisible-Textil and YInvisible-Quadros.
The industrial partners were responsible to supply the rest of the team with sets of samples
of the materials they use to manufacture their products. In Table 6.1, the most representative
materials used during the projects are listed.
Table 6.1 – Raw materials used in each industry, RENOVA, Filobranca and Bi-Silque
Industrial Partner Raw Materials/Products
RENOVA
Copy Paper (with different thicknesses)
Kraft
Tracing Paper
Filobranca Textile (cotton)
Textile coated with a silicon layer
Bi-Silque Resin coated Ceramic over an Aluminium foil
High-Pressure-Laminate (FORMICA)
The industrial partners contributed also with their large expertise on the materials used in the
respective industries, paper, textile and white boards. All the partners are major players in
both the national and the international markets.

170
The first and one of the most challenging problems to solve within the project was to modify
the electrical characteristics of the substrates. All the substrates used have a high electrical
resistance and are known as electrical insulators. CENIMAT group was responsible to
deposit successfully a transparent conductive oxide (TCO) layer over the supplied substrates
– substrate-electrode. Raw industrial materials presented non-ideal surface characteristics
such as: highly porosity, roughness and thermal sensitivity.
The electrical conductive layer was successfully deposited over paper and Bi-Silque white
board substrates. In contrast, the textile electrodes obtained were highly unstable. Initial
electrical conductivity of the prepared electrodes was acceptable, although they lost
conductivity and became resistive over a short period of time. The reason for such behaviour
was not unveiled; although, a straightforward explanation could be that the high flexibility of
the textile structure would easily break the conductive paths of the entire electrode surface.
Other approaches were used to overcome this problem. Textiles coated with a silicon layer,
usually used to print motives over the textile, were used as electrode substrate and
commercially available conductive fabrics as an intrinsic conductive fabric electrode (Flectron
N).
Electrodes based on white board materials from Bi-Silque were obtained based on the same
strategy used with the previous materials. The CENIMAT group deposited TCO layer over
two different kinds of laminated boards: ceramic laminated over an aluminium foil and
FORMICA™. These materials were the less challenging due to its non-porous surface
characteristics. Despite the excellent conductivities obtained with the TCO deposition over
the ceramic/aluminium laminated board oxidation of the aluminium material occurs during
electrochemical tests. The ceramic layer should act as an electrical barrier between the
aluminium foil and the deposited TCO. However, it was found that electrical contact was
established between the two materials due to structural defects created during the TCO
deposition. Electrochemical tests with these electrodes lead to full oxidation and dissolution
of the aluminium foil.
After the development and production of the substrate-electrodes by the CENIMAT group the
following tests were performed by the FOT group: electrochromic layer deposition and
electrochemical characterization, development of a convenient electrolyte and finally
electrochromic device assembly and test.

171
In Table 6.2 the selected substrate-electrodes used in our studies are listed.
Table 6.2 – Electrode substrates used during the IDEIA projects
Industrial Partner Electrode substrate
RENOVA Tracing paper
Filobranca* Textile coated with a silicon layer
Bi-Silque High-Pressure-Laminated board
Additionally to the textile electrodes obtained from Filobranca materials intrinsically
conductive fabric was used for comparative and alternative study.
During the two year project a large amount of knowledge and experience of working with raw
materials was generated within the partners. Scientific and technological knowledge was
successfully transferred to the industrial partners as the industrial knowledge was also
successfully transferred to the scientific partners. The main work developed within the
framework of my Ph.D. thesis was the development of ECD based on paper, textile and
white board electrodes using the architecture shown in Fig. 6.2. As already mentioned the
electrodes were fabricated by our project partner CENIMAT, and my work is downstream to
it. The following subchapter will resume the results obtained concerning only the work
developed in the FOT group.
Conductive layer:TCO deposited byCENIMAT group
Electrochromic material:PEDOT or Prussian Blue
Electrode substrate
Opaque electrolyte layer
Electrode substrate:Paper, textile and white board
ITO
Figure 6.2 – Schematic view of the symmetric ECD model for the IDEIA projects.

172
6.3 Results and Discussion
All the substrate-electrodes received from CENIMAT were prepared with electrical wires to
make the electrical contact with the electrochemical apparatus connectors easier (Fig.6.3).
Figure 6.3 – Substrate-electrode preparation with an electrical contact. Cupper electrical wires were
connected to the TCO layer through conductive silver glue (left, textile-electrode sample). After the
silver glue is dried epoxy glue is used to seal and give structure to the contact between electrical wire
and the substrate-electrode (right, white board-electrode sample).
6.3.1 Electrochromic layer
Two well known electrochromic materials were explored: Prussian Blue (PB) and
PEDOT:PSS (PEDOT). The substrate-electrodes tested during the entire project are listed in
Table 6.2.
Prussian Blue
PB films were electrodeposited by electrochemical potentiostatic technique. In Table 6.3 the
general experimental details are presented.
Table 6.3 – Prussian Blue electrodeposition experimental conditions
Electrochemical deposition method Potentiostatic
Electrodeposition solution FeCl3.6H2O (5mM) and
K3[Fe(CN)6] (5mM).
Deposition time (s) 300 to 600
Voltage (V vs. SCE) 0.55
Reference electrode SCE
Counter electrode Pt
Working electrode Substrate-electrode
Supporting electrolyte KCl (1M) in water

173
In general, the PB deposition obtained over the paper-electrode, textile-electrode and
FORMICA-electrode where highly heterogeneous. The PB modified paper and textile-
electrodes present small areas covered by the electrochromic material, approximately less
than 30% of the electrode area.
The best result was obtained with the PB modified FORMICA-electrodes, see Fig. 6.4.
Figure 6.4 – Prussian Blue film electrochemically deposited over a TCO coated white board (white
board electrode). The PB films are highly heterogeneous in all the electrode-substrates tested.
The electrochromic activity of all the PB modified substrate-electrodes was tested by cyclic
voltammetry (see experimental details in Table 6.4). In Fig.6.5 a picture of the
electrochemical cell with the PB modified FORMICA-electrode is shown.
Figure 6.5 – Picture of the three electrodes electrochemical cell. Working electrode is the PB modified
FORMICA-electrode, counter-electrode is a platinum wire and reference electrode is a SCE electrode.

174
Table 6.4 – Electrochromism test of the PB layers by cyclic voltammetry, experimental details
Electrochemical method Cyclic voltammetry
Scan rate 10mV/s
Potential interval limits [-0.2V; 0.6V] (vs. SCE)
Reference electrode SCE
Counter electrode Pt
Working electrode PB modified substrate-
electrode
Supporting electrolyte KCl (1M) in water
Cyclic voltammograms of all the PB films tested did not present any significant
electrochemical signal; and consequently no electrochromic behaviour could be observed for
the PB modified substrate-electrodes.
PEDOT
Commercially available aqueous formulation of a mixture of poly(ethylenedioxythiophene)
and poly(styrene sulfonate) (PEDOT:PSS) was used as the electrochromic layer. Several
deposition techniques were explored to deposit an uniform layer of PEDOT:PSS over the
paper-, textile- and FORMICA-electrodes: drip coating, blade coating, spin-coating and brush
application. The PEDOT:PSS depositions were not satisfactory in terms of aesthetical
aspects; however, they were used only to evaluate the possible electrochromic activity. In
Fig. 6.6 PEDOT depositions over the substrate-electrodes are shown.
Figure 6.6 –PEDOT:PSS deposited over paper-electrode (left, by spin-coating), textile-electrode
(middle, with a brush) and board-electrode (right, by spin-coating).
The PEDOT:PSS modified paper-, textile and FORMICA-electrodes showed the
characteristic PEDOT:PSS optical transition between the light blue and deep blue state.
Similar to PB modified electrodes electrochromism was screened using cyclic voltammetry
and chronoamperometry, see Table 6.5 and 6.6 for the experimental details.

175
Table 6.5 - Electrochromism test of the PEDOT:PSS layers by cyclic voltammetry, experimental details
Electrochemical method Cyclic voltammetry
Scan rate 10mV/s
Electrochemical window [-1.5V; 1.5V] (vs. SCE)
Reference electrode SCE
Counter electrode Pt
Working electrode PEDOT:PSS modified substrate-electrode
Supporting electrolyte LiClO4 (0.1M) in acetonitrile
Table 6.6 - Electrochromism test of the PEDOT:PSS layers by chronoamperometry, experimental
details
Electrochemical method Chronoamperometry
Number of step potentials 2
Step potential (V vs. SCE) Step 1:-1.5V and Step 2: 1.5V
Step duration (s) 10
Reference electrode SCE
Counter electrode Pt
Working electrode PEDOT:PSS modified substrate-electrode
Supporting electrolyte LiClO4 (0.1M) in acetonitrile
Contrary to the results obtained for Prussian Blue, electrochromic layers PEDOT:PSS
modified substrate-electrodes present interesting electrochromic characteristics. In Fig. 6.7
the doped (oxidized state at +1.5V vs. SCE) and the neutral (reduced state at -1.5V vs. SCE)
optical state of PEDOT:PSS layer deposited over paper-electrode is shown. In Figs. 6.8 and
6.9 the same behaviour is observed for PEDOT:PSS modified textile- and white board-
electrode.
Figure 6.7 – Images of the optical transition of PEDOT:PSS layer deposited over the paper-electrode
by electrochemical oxidation (left) and electrochemical reduction(right). See experimental details in
Table 6.6.

176
Figure 6.8 – Images of the optical transition of PEDOT:PSS layer deposited over the textile-electrode
by electrochemical oxidation (left) and electrochemical reduction (right). See experimental details in
Table 6.6.
Figure 6.9 – Images of the optical transition of PEDOT:PSS layer deposited over the board-electrode
by electrochemical oxidation (left) and electrochemical reduction (right). See experimental details in
Table 6.6.
6.3.2 ECD Assembly with paper-, textile- and white board electrodes
The deposited PB modified substrate-electrodes did not show electrochromism when an
electrical potential was applied by electrochemical methods. In contrast, the organic
semiconductor PEDOT:PSS modified substrate-electrodes presented optical transition
between the dark-blue and light-blue optical state.
The symmetric architecture ECD was used to produce the low information content proof-of-
concept displays based on paper, textile and white board. The electrochromic material used
is the PEDOT:PSS aqueous dispersion and as the electrolyte layer the opaque gel
electrolyte reported in section 5.2. The requirement to have an opaque electrolyte layer to
operate a symmetric ECD is discussed in section 1.2.1 (Electrochromic devices).

177
Paper
ECD requires that at least one of the electrodes is optically transparent. Paper, textile and
white boards are opaque materials. Initially the plan to overcome this issue was to use a
transparent electrode of PET-ITO as the primary electrode and the modified substrate-
electrode as the counter-electrodes. This strategy was used initially to assemble all the ECD;
however, later results obtained with tracing paper-electrodes ECD show that the
transparency of the substrate was high enough to see the optical contrast of the PEDOT
layer.
The deposition of TCO over the tracing paper produced the most stable substrate-electrodes,
and exhibits a relative transparency to the visible light. Tracing paper is used to take tracing
from drawings and for this reason it is chemically modified to obtain a translucent paper.
These properties allow to assemble an ECD where the information is printed over the paper-
electrode (primary electrode) and the PET-ITO modified electrode is used as counter-
electrode. The transparency of the tracing paper was enough to see the deposited
PEDOT:PSS optical transition through it.
The electrochromic cells were assembled depositing a non patterned layer of PEDOT:PSS
over the counter-electrode and a patterned layer of PEDOT:PSS over the primary electrode.
The electrolyte layer was drip-coated over one of the PEDOT:PSS modified electrodes and
finally both electrodes were laminated (cell assembly is similar to the one reported in section
5.2.1.4).
Deposition of a patterned PEDOT:PSS layer over the PET-ITO electrodes was printed using
the photolithography process with the facilities and know-how of CENIMAT team. A
combination of spin-coating deposition and patterning with the photolithography process was
used. In the particular case of paper based devices the paper-electrode was used as the
primary electrode, the patterned PEDOT:PSS layer was printed by ink-jet. Details on the
development of ink-jet printing to build ECD are given in chapter 7.
Electrochromic cells were successfully assembled using the PEDOT:PSS modified paper-
electrodes as the counter-electrode (see Fig.6.10) and as the primary electrode (see
Fig.6.11). The applied potentials used to operate all the devices were -1.5V and +1.5V (vs.
the PEDOT:PSS modified substrate-electrode).

178
Figure 6.10 – Pictures of the bleached (left) and coloured (right) optical transition of an ECD based on
PEDOT:PSS modified paper-electrode. Electrochromic device architecture: Paper-
electrode/PEDOT:PSS/white opaque electrolyte/PEDOT:PSS/ITO-PET, where the primary electrode is
the PET-ITO.
Figure 6. 11 - Pictures of the bleached (left) and coloured (right) optical transition of an ECD based on
PEDOT:PSS modified paper-electrode. Electrochromic device architecture: Paper-
electrode/PEDOT:PSS/yellow opaque electrolyte/PEDOT:PSS/ITO-PET, where the primary electrode
is the paper-electrode.
Textile
As discussed above the textile substrate was the most challenging to obtain a electrical
conductive surface by the deposition of a TCO layer. Nevertheless ECD with a textile coated
with a layer of silicon were assembled. To achieve the goals of the project an alternative
conductive textile was acquired to the Less EMF company. The trade name of the intrinsic
conductive textile is Flectron N. The devices were assembled as described for ECD based
on paper-electrodes. Electrochromic cells were successfully assembled using the
PEDOT:PSS modified textile-electrodes as the counter-electrode with a silicon layer coated
over the textile (see Figs.6.12) and with Flectron N textile (see Fig. 6.13). The applied
potentials used to operate all the devices were -1.5V and +1.5V (vs. the PEDOT:PSS
modified substrate-electrode).

179
Figure 6.12 - Pictures of the bleached (left) and coloured (right) optical transition of an ECD based on
PEDOT:PSS modified textile silicon coated-electrode. Electrochromic device architecture: Textile
silicon coated-electrode/PEDOT:PSS/yellow opaque electrolyte/PEDOT:PSS/ITO-PET where the
primary electrode is the PET-ITO.
Figure 6.13 - Pictures of the bleached (left) and coloured (right) optical transition of an ECD based on
PEDOT:PSS coated Flectron N conductive textile. Electrochromic device architecture: Conductive
textile-electrode/PEDOT:PSS/white opaque electrolyte/PEDOT:PSS/ITO-PET, where the primary
electrode is the PET-ITO.
The high electrical conductivity of the Flectron N textile improved significantly the speed of
write-erase transition when compared with all the others devices (paper, textile (cotton) and
white board).
White Board
The FORMICA™ based electrodes were preferred to build the white boards ECD instead of
the ceramic laminated over an aluminium foil. The physical defects created during TCO
deposition over the ceramic layer creates short-circuit between the TCO layer and the
aluminium foil (see section 6.3.1). All the white board ECD were assembled using the
PEDOT:PSS modified

180
white board (FORMICA)-electrodes as the counter-electrode (see Fig.6.14). The applied
potentials used to operate all the devices were -1.5V and +1.5V (vs. the PEDOT:PSS
modified substrate-electrode).
Figure 6.14 – Pictures of the bleached (left) and coloured (right) optical transition of an ECD based on
PEDOT:PSS modified white board-electrode. Electrochromic device architecture: White board-
electrode/PEDOT:PSS/white opaque electrolyte/PEDOT:PSS/ITO-PET.
6.3.3 ECD characterization
The ECD based on paper-, textile- as well as white board-electrodes were characterized by
spectroelectrochemistry. Stability of the devices was studied by cycling tests between the
coloured and bleached state (write-erase). During this characterization the paper based ECD
were assembled using the paper-electrode as the primary electrode (see an example in Fig.
6.11).
A square-wave potential function was applied to the ECD between -1.5V and +1.5V
(potentials are reported versus the PEDOT:PSS modified substrate-electrodes). The time
required to complete a write-erase process for each ECD is different being the faster the
ECD using Flectron N and all the other devices present the same switch time. In Table 6.7
the experimental details of the cycling tests and the total reflectance variation (∆%R630nm,0) for
each device are shown.
Table 6.7 – Performance of the ECD based on Paper, textile and white board
ECD Coloration Time
(s)
Bleaching
Time (s) ∆%R630nm,0
Flectron N 3 3 66
Textile silicon coated 10 10 70
White board 10 10 30
Paper 10 10 16

181
The optical contrast found across all the devices was satisfactory, the highest value being
found for the textile-ECD and the smallest for paper-ECD (see Table 6.7). The high optical
contrast obtained with the textile based devices can be explained by the capacity of the
porous textile substrate to absorb larger quantities of electrochromic material. In this case,
the primary electrode will not be limited by the counter-electrode electroactive material. On
the other hand, the low ∆%R630nm,0 found for paper-ECD is related with the low transmittance
of the tracing paper and dispersion of light by diffuse reflectance. Despite the relative
transparency of the paper-electrode, it is not comparable with the transparent PET-ITO.
The stability towards cycling was found to be substrate dependent. The less stable systems
are those based in textile and the most stable one was the electrochromic device based on
paper (see Table 6.8).
The textile coated with a silicon layer was used to overcome the instability of the TCO layer
deposited over raw fabric; however the resulting textile-electrodes were not so robust than
those based on paper and FORMICA. The lower stability of the textile ECD was already
predicted considering the textile-electrode electrical behaviour. The electrochromic devices
assembled with the white board-electrodes show a moderate degradation after one thousand
cycles. In contrast cycling results of the electrochromic devices based on paper-electrodes
did not show any degradation after five thousand cycles. The devices showed an increase of
the total reflectance of 38% when compared with the initial values.
Table 6.8 – Write-erase cycling test results for the ECD based on paper, textile and white board.
ECD ∆%R630nm,0 ∆%R630nm,n n Colouration loss
(see Eq.1.4)
Flectron N 66 37 2000 -44%
Textile silicon coated 70 55 825 -21
White board 30 29 1000 -3%
Paper 16 22 5000 +38%
Since the ECD based on paper-electrodes showed a surprising stability towards cycling,
deepest analysis of the results were carried on. In Fig. 6.15 the evolution of the optical
transition between coloured and bleached states (in percentage of reflectance) along the
cycling test is plotted. The initial reflectance variation increases during the first one thousand
cycles until it reaches a value of approximately 23%. During the next 3500 cycles the device
seems to stabilize and then degradation starts to occur; a variation of -1.5% compared with
the maximum value obtained during the first 1000 cycles is observed.

182
0 1x10³ 2x10³ 3x10³ 4x10³ 5x10³ 6x10315
16
17
18
19
20
21
22
23
24
25
∆%
R63
0nm
, n
-1.5%+7.2%
nº of cycles
Figure 6.15 – Variation of the total optical contrast of a paper-ECD during write-erase cycling test.
Complete analysis of spectroelectrochemical data for first cycle of the paper-ECD is
presented in Table 6.9.
Table 6.9 - Collected data from spectroelectrochemical experiments for paper-ECD, befor the write-
erase cycles
Optical transition Time (s)
%full
switch
∆%R630nm,0
∆Q'
(Ccm-2)
CE
(C-1cm2) CR %R
0 0 0 0 0 - 39.7
4 90.0 13.6 1.5E-04 9.1E+04 - 53.3
6 95.2 14.4 1.8E-04 8.1E+04 - 54.1
8.4 99.2 15.0 2.0E-04 7.4E+04 - 54.7
Bleaching
8.8 100.1 15.1 2.1E-04 7.3E+04 - 54.8
0 0 0 0 0 1.9 54.0
7.6 90.3 12.9 2.2E-04 5.9E+04 2.4 41.1
8.8 95.2 13.6 2.4E-04 5.8E+04 2.5 40.4
9.6 98.7 14.1 2.5E-04 5.7E+04 2.5 39.9
Colouration
10 100.0 14.3 2.5E-04 5.7E+04 2.5 39.7
The CE obtained for both colouration and bleaching process is comparable with results
obtained for the symmetric electrochromic device based exclusively on PEDOT:PSS
modified PET-ITO electrodes (ECD-1 and ECD-2) reported in section 5.2.2, Tables 5.4 and
5.4. As already explained the contrast ratio of the paper ECD is smaller than the devices

183
using PET-ITO as the primary electrode. The switch time for 90% of full switch is also longer
when compared with ECD using PEDOT:PSS modified PET-ITO electrodes.

184
6.4 Conclusions
Low information content displays were successfully obtained using electrochromic devices
based on paper-, textile- and white board-electrodes. The most challenging substrate was
the raw fabric where the deposited TCO layers were highly unstable. An alternative silicon
coated fabric was used as a surface treatment of the raw fabric and commercially available
conductive fabrics were studied as well. The silicon coated textile improved the TCO layer
stability, however, the resulting ECD demonstrated low cycling stability.
The lifetime of the ECD products will be dependent on their stability towards the number of
optical cycles (write-erase). The cycling stability found for all the devices are satisfactory
considering they are only proof of concept; however a real application for interactive white
boards must be largely improved.
The performance obtained with the paper and textile ECD met the requirements of
application in disposable products. Possible applications can be envisaged for
advertisement, e.g. an interactive t-shirt for an event that only needs to last one day or a
post-it with a blinking advertisement.
The switch time determined for all the substrate-electrode based ECD was longer than that
observed for other ECD reported in the literature and also in chapter 5. This behaviour was
expected due to the nature of the electrodes substrates and consequently the electrical
properties of the conductive layer. All the ECD’s reported in literature are based on non-
porous electrodes, which present a more adequate surface to deposit a TCO layer. The
intrinsically conductive fabric ECD present the shortest switching times. The Flectron N fabric
is composed by threads covered by metallic particles showing electrical properties similar to
a metallic electrode.
The transparency of the tracing paper-electrode was found to be suitable to use it as the
viewing electrode in the ECD. The final architecture adopted is an inversion of the original
one, proposed at the beginning of the projects (see Fig. 6.2). The tracing paper presents
enough transparency to transmit the optical switch of the electrochromic PEDOT:PSS layer
deposited on the opposite face. The paper-electrode structure seems to contribute to the
improved cycling stability of the ECD, attained a relative degradation of 1.5% of the total
reflectance optical transition.
The incorporation of a plastic layer to assemble the ECD does not meet real integration of
technology and the object like: sheet of paper, a piece of clothing and white board. However,
each product was differently affected by the integration of a plastic electrode as one of the
constituent layer. The textile ECD is the most affected by the introduction of a plastic layer of
ca. 125µm. Although the PET used is flexible it does not emulate the tactile and flexibility of
the common fabric. For the paper ECD the application of the tracing paper allows to

185
assemble an electrochromic visualization unit underneath the piece of paper. However the
primary electrode is the paper, the counter electrode is made of plastic. The white boards are
usually coated with a plastic layer that gives the shiny aspect and allows to use the dry
erasable ink; the ECD assembled with the transparent plastic electrode did not modify the
visual aspect or the general surface properties of the final white board.
In Fig. 6.16 pictures of the paper-ECD proof-of-concept presented as one of the results
achieved for the IDEIA project Yinvisible-Papel. The pictures show a map of Lisbon
downtown. When the tourist touches the adequate flat button, the streets of the most popular
neighbourhoods of Lisbon will be highlighted from the rest of the map information.
Figure 6.16 – Pictures of the proof-of-concept paper-ECD. This device shows an electrochromic map
of the Lisbon downtown. The buttons on the bottom of the map will highlight a specific area of interest.
The colour contrast is obtained by the electrochemical control of the coloured and bleached states of
the PEDOT layer deposited over PET-ITO. The counter electrode is PEDOT coated paper-electrode.
The opaque gels electrolytes used were pink (Alfama) and yellow (Bairro Alto). To power the device
small flat batteries were integrated in the map.

186

187
6.5 Bibliography
1. Kobayashi, N.; Nishimura, M., Electrochromic imaging with polymer electrolyte having
high-temperature-dependent conductivity. Solar Energy Materials and Solar Cells
2006, 90 (4), 538-545.
2. Mann, S., Wearable computing: A first step toward personal imaging. Computer 1997,
30 (2), 25-31.
3. Modern living: going digital [Online]. New York: Time, Inc. 1975 Available:
http://www.time.com/time/magazine/article/0,9171,879586,00.html [Accessed July
2010].

188

189
Chapter 7
Feasibility study for an electrochromic display
built by ink-jet

190
7.1 Introduction
In the framework of applied research, it is not enough to produce laboratory scale
technology. The processes involved to produce the entire device must be adapted to an
industrial scale. In chapter 6 three proofs of concept electrochromic devices were described
using laboratory scale techniques. During the development of the electrochromic devices one
of the major challenges found was how to pattern the electrochromic layer. Patterning is of
fundamental importance, it allows to transform a display with a simple blinking square in text
or pictogram information. In Fig. 7.1, an example of a non-patterned and patterned ECD is
presented.
Figure 7.1 – ECD with a non-patterned electrochromic layer (up) and a patterned electrochromic layer
as the primary electrode. Pictures show the bleached and coloured states for both devices at the left
and right side, respectively.
In the previous chapter, the photolithography process was used to pattern the PEDOT:PSS
layer over the electrodes. Photolithography is used in a wide range of applications such as
screen-printing and microelectronics fabrication. The pattern can be printed with a precision
of hundred of nanometres1, however, the technique is time consuming and expensive. A low
information content display does not require such a higher printing resolution. On the other
hand, we are interested to print over a wide range of substrates like paper and textile where
the photolithography process has no application. The photolithography process requires the
deposition of uniform layers of polymer liquid solutions, porous substrates such as paper,
textile will absorb most of the fluid, and the process will not result in a continuous film.

191
The ink-jet deposition technique was identified as an adequate process to build
electrochromic devices. Ink-jet allows to deposit controlled amounts of a liquid solution (ink)
as a coating or as a pattern over almost any kind of substrates with any kind of shapes.
Recently ink-jet was also applied to print three-dimensional objects. In the present chapter,
an overview of the results reached in a one-week workshop carried in collaboration with the
ink-jet technology integrator Xennia Technology Ltd. is presented. The objective of the
project was to demonstrate the feasibility of using the ink-jet technology for the
industrial production of symmetric PEDOT:PSS based electrochromic displays.
7.1.1 Ink-jet technique
Ink-jet printing is a non-contact technique where the ink is jetted as small drops with volumes
in the range of the picoliter. The ink-jet printing offers particular advantages over other
deposition methods: precise patterning capability; reduction in waste products; high speed
and low cost fabrication; room temperature deposition; and printing onto large areas and
flexible substrates.
An ink-jet prints material by expelling small droplets of liquid ink from an orifice (nozzle) as it
is moved in the two (2D) or three (3D) dimensions of the substrate. The pattern of droplets
left behind on the substrate constitutes the printed output.2 As illustrated in Fig. 7.2 ink-jet
technologies can be classified as continuous ink jet and “Drop-on-Demand” (DoD) ink-jet,
regarding how the landing position of the droplets is controlled and how the droplets are
formed.

192
A
B
C
Figure 7.2 – Schematic view of different ink-jet print-head technologies. Continuous mode technology
(A), the drops are deflected by the electric field created between the two plate electrodes at the exit of
the nozzle. The deflection of the drops allows to control the position where the ink land. The deflected
drops (open circle) are collected back to the ink chamber. The non-deflected drops (full circle) land
over the printing substrate. DoD ink-jet technology (B and C). Thermal print-head (B) ejects drops by
the rapid vaporization of the ink at the surface of an electrode inside the ink chamber. Piezoelectric
print-head in bend-mode (C) expulses a jet of ink by the application of pressure in the ink chamber by
the stimulus of the piezoelectric ceramic plate.
The continuous ink jet technology generates a constant stream of small ink droplets which
are charged according to the image and controlled electronically. The charged droplets are
deflected by a subsequent electric field, while the uncharged ones flow onto the paper. With
continuous ink-jet only a small part of the ink jetted is deposited over the substrate in
accordance with the print information. The large part is fed back into the system.3 A primary
advantage of continuous systems is the high number of drops per unit time available per
nozzle.
The drop formation in continuous ink-jet printers is based on the instability of liquid jets
described by Lord Rayleigh in 1878.4 The drop formation from a jet stream is a very complex
mechanism and almost impossible to obtain a reliable prediction of the phenomenon. A
uniform size and spacing drop formation is obtained applying a periodic perturbation at an
appropriate frequency, typically by means of a vibrating piezoelectric transducer attached to
the chamber.5 Depending on the technology, the continuous flow of the drops can reach the
frequency of 1’000’000 per second (1MHz). This type of system is generally referred as
"continuous" because drops are continuously produced and their trajectories are varied by
the amount of charge applied.6

193
In contrast to continuous ink-jet systems the so called DoD ink-jet technology, only jets ink
where the digital images require, accordingly to the image pattern. Ink is ejected from the
nozzle by applying a pulse of pressure to the fluid ink inside the chamber in the supply tube,
upstream of that nozzle.7 Two main technologies are used to create the pulse pressure
thermal ink-jet and piezoelectric ink-jet printing.
Thermal ink-jet generates the drops by heating and localizes vaporization of the ink solvent
in a jet chamber. With piezoelectric ink-jet the ink drop is formed and catapulted out of the
nozzle by mechanically deforming the jet chamber, an action resulting from an electronic
signal and the piezoelectric properties of the chamber wall.3
The thermal ink-jet technology uses a resistive metallic layer in the walls of the ink channel
leading to each nozzle. When a pulse of electrical current is applied to the resistive metallic
layer, temperature raises until the ink near the metallic layer will boil. The current flows for a
short period of approximately one microsecond and its amplitude is so that a thin layer of ink
explosively boils.7 This creates a four stage drop formation; bubble nucleation, drop ejection,
bubble collapsing and nozzle refill.8 The nucleation occurs when the temperature of the
resistive layer rises up to ca. 300ºC and the ink starts to evaporate at the surface of the
electrode. The ink forms a vapour bubble and expands about one thousand times in volume.
A pressure pulse is created inside the chamber and a drop of ink is ejected through the
nozzle towards the substrate. After several microseconds, the temperature drops and the
vapour bubble collapses. Finally, the nozzle is refilled by the action of the capillary forces of
the ink meniscus. At this point the cycle can be repeated for more than 5’000 times per
second (5kHz).3,7
In DoD systems, each droplet takes ballistic trajectory to the substrate on command by a
pressure impulse, accordingly to the digital image information. Another physical phenomenon
used in ink-jet to create a pressure impulse within the ink chamber is the piezoelectric effect.
When an electrical voltage is applied across a piezoelectric material, it suffers a mechanical
stress, resulting in a deformation of the material. Two configurations are commonly used:
piezoelectric rods which elongate under applied fields (push-mode) or bimorphs which bend
(bend-mode). In a push-mode design, the piezoelectric actuator is on the rear wall of the
nozzle in the form of rods, as the rods expand it pushes against the ink to eject the droplets.
In a typical bend-mode design, a flat plate of piezo-ceramic material forms one wall of the ink
chamber forming an array of laminar electromechanical transducers used to eject the ink
droplets.4,5 In theory, piezodrivers can directly contact and push against the ink. However, in
practical implementation, a thin diaphragm between the piezodrivers and the ink is
incorporated to prevent undesirable interactions.
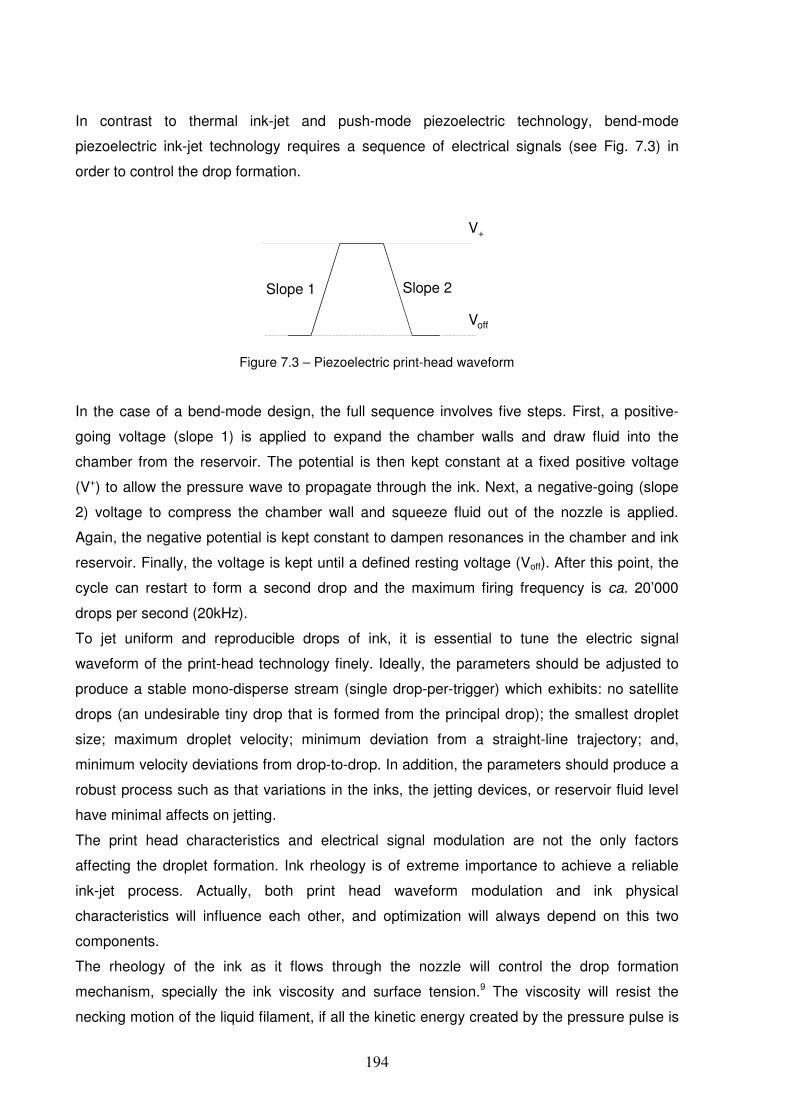
194
In contrast to thermal ink-jet and push-mode piezoelectric technology, bend-mode
piezoelectric ink-jet technology requires a sequence of electrical signals (see Fig. 7.3) in
order to control the drop formation.
Voff
V+
Slope 1 Slope 2
Figure 7.3 – Piezoelectric print-head waveform
In the case of a bend-mode design, the full sequence involves five steps. First, a positive-
going voltage (slope 1) is applied to expand the chamber walls and draw fluid into the
chamber from the reservoir. The potential is then kept constant at a fixed positive voltage
(V+) to allow the pressure wave to propagate through the ink. Next, a negative-going (slope
2) voltage to compress the chamber wall and squeeze fluid out of the nozzle is applied.
Again, the negative potential is kept constant to dampen resonances in the chamber and ink
reservoir. Finally, the voltage is kept until a defined resting voltage (Voff). After this point, the
cycle can restart to form a second drop and the maximum firing frequency is ca. 20’000
drops per second (20kHz).
To jet uniform and reproducible drops of ink, it is essential to tune the electric signal
waveform of the print-head technology finely. Ideally, the parameters should be adjusted to
produce a stable mono-disperse stream (single drop-per-trigger) which exhibits: no satellite
drops (an undesirable tiny drop that is formed from the principal drop); the smallest droplet
size; maximum droplet velocity; minimum deviation from a straight-line trajectory; and,
minimum velocity deviations from drop-to-drop. In addition, the parameters should produce a
robust process such as that variations in the inks, the jetting devices, or reservoir fluid level
have minimal affects on jetting.
The print head characteristics and electrical signal modulation are not the only factors
affecting the droplet formation. Ink rheology is of extreme importance to achieve a reliable
ink-jet process. Actually, both print head waveform modulation and ink physical
characteristics will influence each other, and optimization will always depend on this two
components.
The rheology of the ink as it flows through the nozzle will control the drop formation
mechanism, specially the ink viscosity and surface tension.9 The viscosity will resist the
necking motion of the liquid filament, if all the kinetic energy created by the pressure pulse is

195
viscously dissipated, no droplet is ejected. For a given pressure wave at the nozzle, the
lower the viscosity the greater is the velocity and the amount of fluid propelled forwards,
contributing to the long tail formation behind the drop.10 The surface tension is responsible for
the spherical shape of the liquid drop emerging the nozzle. The wetting behaviour of the ink
formulation with the nozzle material is another parameter that must be addressed. An
undesired spray is formed when too much ink is wetting the nozzle outlet face, during the
jetting process.11
Recommended values for the different rheological ink parameters are given in Table 7.1.
These values can be useful to predict the printability of a fluid, however, due to the large
number of variables usually the final tune of the print-head waveform and ink parameters are
found by trial-and-error.
Table 7.1 – General ink-jet ink parameters
Ink Properties Recommended
values
Viscosity (cP) 8 – 12
Surface Tension (dyn/cm) >32
Max. Size (µm) 1
Conductivity (µS) No
Salt Level Chlorides
(ppm) <100
YDreams interest in ink-jet technology to manufacture low information content displays for
low cost applications is based on several advantages presented by the technique. Ink-jet
printing technology shows good print quality (state of the art ink-jet print heads will allow
minimum feature sizes lower than 20nm2 and cost ratios when compared with processes
such as photolithography. In particular, DoD piezoelectric technology presents a wide range
of ink materials application and several advantages such as additive process (reducing
waste and processing steps), wide range of substrate composition and morphology. It has
also a more controlled drop production than thermal one, higher drop production rates and
long head life.
Besides the several potentialities presented by ink-jet technology that contributed to
YDreams decision to invest on such technology, another relevant characteristic is the data
driven capability. In contrast to the major printing techniques like screen printing,
flexography, offset and gravure, the ink-jet printing process does not require a physical
image carrying medium (see section 1.3 Industrial Printing Techniques). The printing pattern
can be modified at any time without interruption of the printing process. Such capability
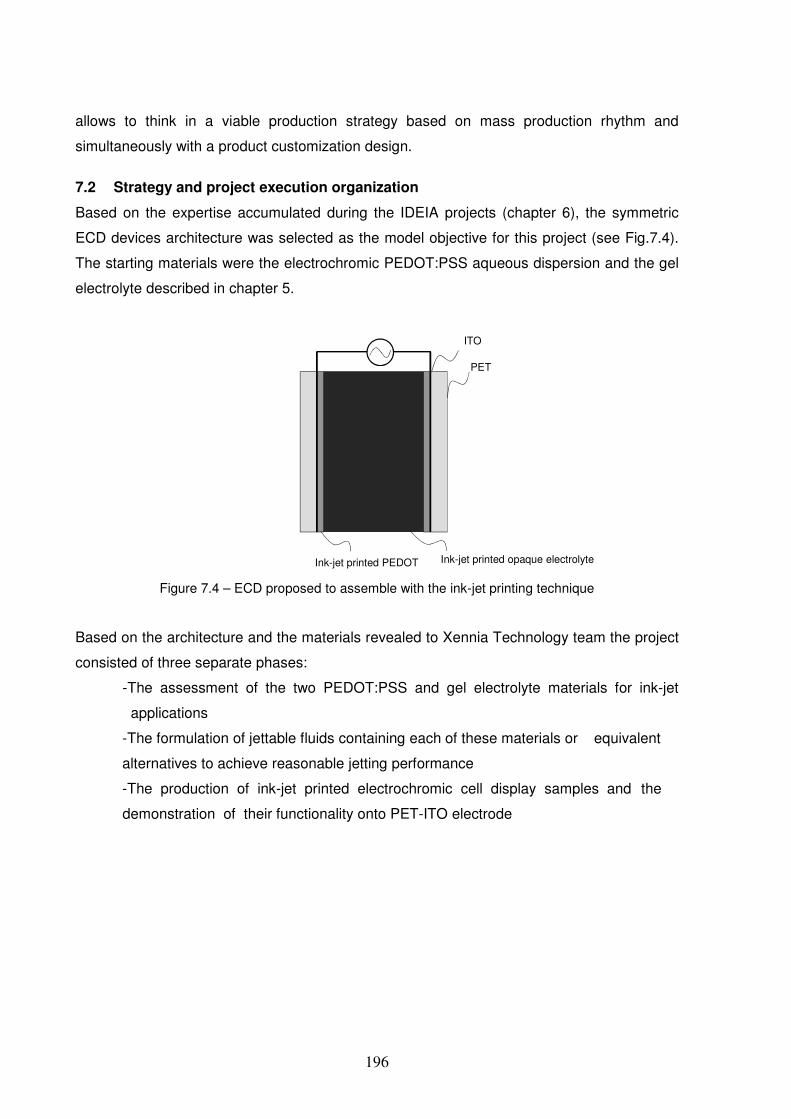
196
allows to think in a viable production strategy based on mass production rhythm and
simultaneously with a product customization design.
7.2 Strategy and project execution organization
Based on the expertise accumulated during the IDEIA projects (chapter 6), the symmetric
ECD devices architecture was selected as the model objective for this project (see Fig.7.4).
The starting materials were the electrochromic PEDOT:PSS aqueous dispersion and the gel
electrolyte described in chapter 5.
ITO
PET
Ink-jet printed PEDOT Ink-jet printed opaque electrolyte
Figure 7.4 – ECD proposed to assemble with the ink-jet printing technique
Based on the architecture and the materials revealed to Xennia Technology team the project
consisted of three separate phases:
-The assessment of the two PEDOT:PSS and gel electrolyte materials for ink-jet
applications
-The formulation of jettable fluids containing each of these materials or equivalent
alternatives to achieve reasonable jetting performance
-The production of ink-jet printed electrochromic cell display samples and the
demonstration of their functionality onto PET-ITO electrode
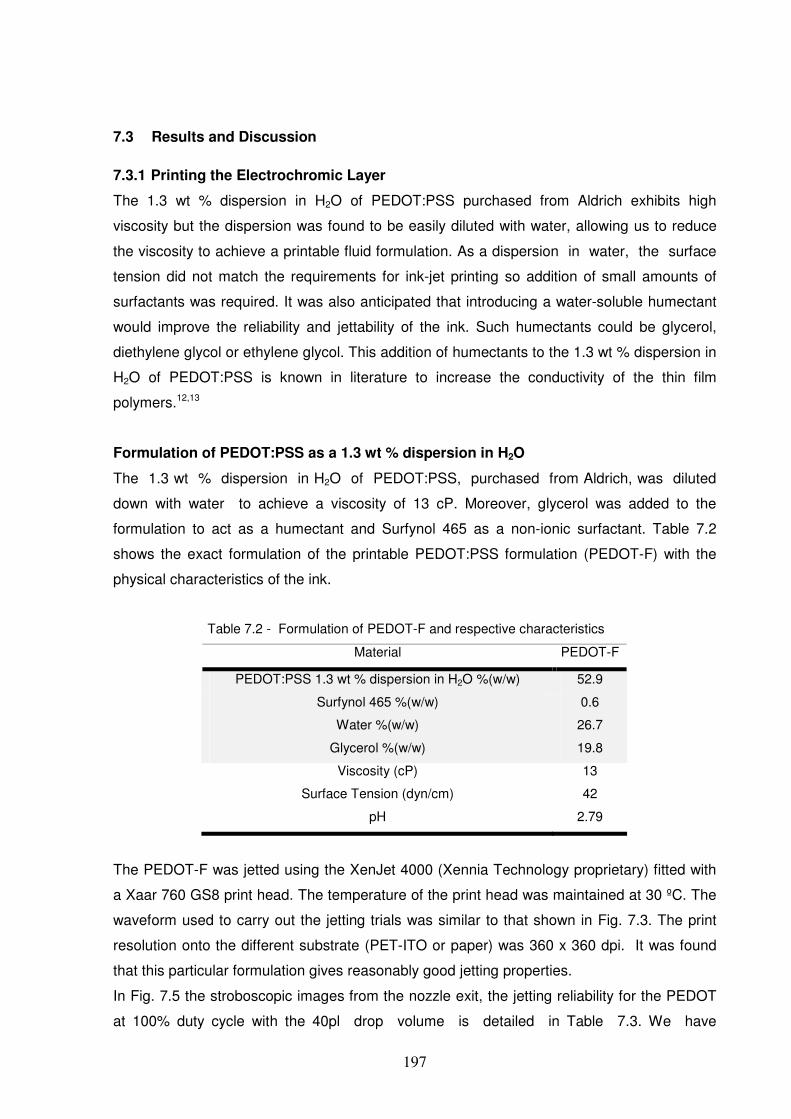
197
7.3 Results and Discussion
7.3.1 Printing the Electrochromic Layer
The 1.3 wt % dispersion in H2O of PEDOT:PSS purchased from Aldrich exhibits high
viscosity but the dispersion was found to be easily diluted with water, allowing us to reduce
the viscosity to achieve a printable fluid formulation. As a dispersion in water, the surface
tension did not match the requirements for ink-jet printing so addition of small amounts of
surfactants was required. It was also anticipated that introducing a water-soluble humectant
would improve the reliability and jettability of the ink. Such humectants could be glycerol,
diethylene glycol or ethylene glycol. This addition of humectants to the 1.3 wt % dispersion in
H2O of PEDOT:PSS is known in literature to increase the conductivity of the thin film
polymers.12,13
Formulation of PEDOT:PSS as a 1.3 wt % dispersion in H2O
The 1.3 wt % dispersion in H2O of PEDOT:PSS, purchased from Aldrich, was diluted
down with water to achieve a viscosity of 13 cP. Moreover, glycerol was added to the
formulation to act as a humectant and Surfynol 465 as a non-ionic surfactant. Table 7.2
shows the exact formulation of the printable PEDOT:PSS formulation (PEDOT-F) with the
physical characteristics of the ink.
Table 7.2 - Formulation of PEDOT-F and respective characteristics
Material PEDOT-F
PEDOT:PSS 1.3 wt % dispersion in H2O %(w/w) 52.9
Surfynol 465 %(w/w) 0.6
Water %(w/w) 26.7
Glycerol %(w/w) 19.8
Viscosity (cP) 13
Surface Tension (dyn/cm) 42
pH 2.79
The PEDOT-F was jetted using the XenJet 4000 (Xennia Technology proprietary) fitted with
a Xaar 760 GS8 print head. The temperature of the print head was maintained at 30 ºC. The
waveform used to carry out the jetting trials was similar to that shown in Fig. 7.3. The print
resolution onto the different substrate (PET-ITO or paper) was 360 x 360 dpi. It was found
that this particular formulation gives reasonably good jetting properties.
In Fig. 7.5 the stroboscopic images from the nozzle exit, the jetting reliability for the PEDOT
at 100% duty cycle with the 40pl drop volume is detailed in Table 7.3. We have
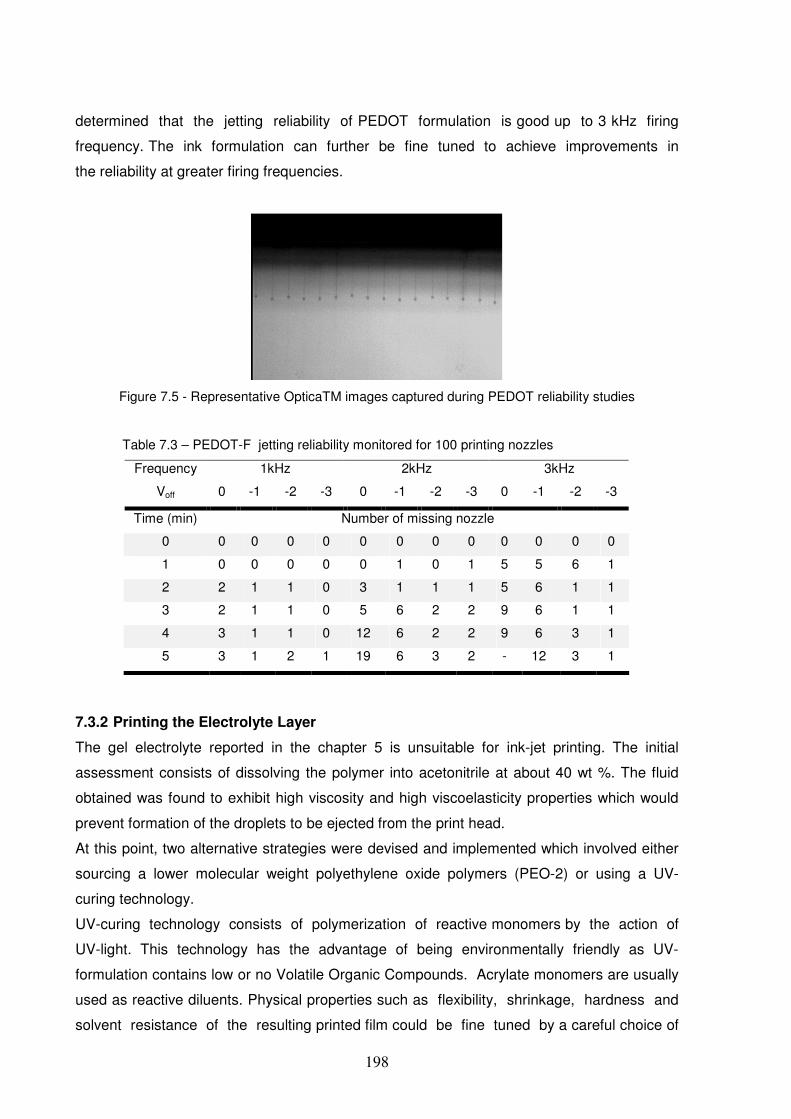
198
determined that the jetting reliability of PEDOT formulation is good up to 3 kHz firing
frequency. The ink formulation can further be fine tuned to achieve improvements in
the reliability at greater firing frequencies.
Figure 7.5 - Representative OpticaTM images captured during PEDOT reliability studies
Table 7.3 – PEDOT-F jetting reliability monitored for 100 printing nozzles
Frequency 1kHz 2kHz 3kHz
Voff 0 -1 -2 -3 0 -1 -2 -3 0 -1 -2 -3
Time (min) Number of missing nozzle
0 0 0 0 0 0 0 0 0 0 0 0 0
1 0 0 0 0 0 1 0 1 5 5 6 1
2 2 1 1 0 3 1 1 1 5 6 1 1
3 2 1 1 0 5 6 2 2 9 6 1 1
4 3 1 1 0 12 6 2 2 9 6 3 1
5 3 1 2 1 19 6 3 2 - 12 3 1
7.3.2 Printing the Electrolyte Layer
The gel electrolyte reported in the chapter 5 is unsuitable for ink-jet printing. The initial
assessment consists of dissolving the polymer into acetonitrile at about 40 wt %. The fluid
obtained was found to exhibit high viscosity and high viscoelasticity properties which would
prevent formation of the droplets to be ejected from the print head.
At this point, two alternative strategies were devised and implemented which involved either
sourcing a lower molecular weight polyethylene oxide polymers (PEO-2) or using a UV-
curing technology.
UV-curing technology consists of polymerization of reactive monomers by the action of
UV-light. This technology has the advantage of being environmentally friendly as UV-
formulation contains low or no Volatile Organic Compounds. Acrylate monomers are usually
used as reactive diluents. Physical properties such as flexibility, shrinkage, hardness and
solvent resistance of the resulting printed film could be fine tuned by a careful choice of

199
those monomers to the end applications. UV-formulations will also contain photoinitiators,
additives such as surfactants/dispersants and pigments particles. The idea of using the UV-
technology is to be able to jet a reliably fluid containing acrylate monomers and to obtain
after the exposition to UV-light a polymer with relatively high molecular weight that will have a
similar structure as the polymer in the PEO-2 gel electrolyte.
In order to operate a symmetric electrochromic device the electrolyte the light scattering
titanium dioxide (TiO2) nanoparticles were incorporated in the electrolyte ink. For ink-jet
printing applications, chemically stable suspension with evenly nanoparticles distributed
throughout the ink is critical. Two different dispersions of TiO2 were used in this project, the
first in water (TiO2-W) and the other one in dipropyleneglycol diacrylate (TiO2-DPGDA).
Formulation of the electrolyte layer derived from the Poly(ethylene glycol)-block-
poly(propylene glycol) (PEO-2)
Formulations were attempted using the two different grades of PEO-2 purchased from
Aldrich. A solution of 20% of the 5,800 Da PEO-2 reaches a viscosity of 2.1cP while a
solution of 20% of the 14,600 Da PEO-2 polymer reaches a viscosity of 5.32cP. The two
grades of PEO-2 were easily dissolved in acetonitrile as well as the LiClO4 salt.
A few starting formulations were prepared by mixing the three different materials,
PEO-2 polymer, TiO2-W and LiClO4 salt in a solvent composed of acetonitrile/ethyl lactate
(1:1, v/v). It was found that it was not possible to obtain a TiO2-W stable suspension
when the three materials were present in a single formulation. Formulation trials were
carried out using different quantities of each of the components, using some other
polymers such as polyvinylacetate or polyvinylpyrrolidinone and using different solvents but
this did not lead to a successful solution. Since all the three materials did not lead to a stable
suspension it was decided to separate them and create two electrolyte layers consisting in
two separate ink formulations prepared in acetonitrile/ethyl lactate (1:1, v/v). One layer
contains the LiClO4 salt and the PEO-2 polymer (clear layer) the other one contains the
TiO2-W and salt (opaque layer). It was thought that this idea was best implemented if the
TiO2 layer was sandwiched between the two clear layers electrolyte, as described in Fig. 7.6.
clear layer - 1
opaque layer
clear layer - 2 Figure 7.6 – Electrolyte consisting in three stacked layers. Clear layer contains polymer, solvent and
salt and the white opaque layer contains solvent, salt and TiO2 nanoparticles. Polymer and TiO2
suspended particles are not present in the same ink to avoid particle sedimentation (see text).

200
As this idea involved some alterations of the original architecture, electrochromic cell
samples were first created by using a pipette to deposit the different layers to demonstrate
the functionality of this new layout. It was found that the drying time of each of the layers was
important to have a correctly sealed cell, but even so the two transparent conducting
layers were able to slide from each other. The gel electrolyte used in previous chapters
act as a sealant; however, the fluid created with low molecular weight PEO-2 polymers did
not present this effect.
To overcome this lack of strong adhesion forces between the two transparent conducting
layers, experiments were carried on with the incorporation of small quantities of UV-
monomers and photoinitiators. The printed electrolyte layers obtained after UV curing did not
present the desired sealant effect. The ECD assembled with the two layer electrolyte did not
present the desired structural characteristics.
Table 7.4- Formulation of the clear and opaque electrolyte ink
Material Clear electrolyte %(w/w) Opaque electrolyte %(w/w)
Ethyl lactate 22
PEO-PPO
Mw5600 5
PEO-PPO
Mw14600 5
LiClO4 3.5 4
Tego Glide
432 0.5
Acetonitrile 33
DPGDA 26
Irgacure 819 5
TiO2-W 48
Surfynol 465 0.6
Water 15.4
Glycerol 36
The components were carefully chosen for material compatibility issues in the formulation
(Table 7.4). The surfactant used was polyether siloxane copolymer especially designed for
UV-curing formulations and exhibits excellent substrate wetting. The opaque electrolyte layer
contains a dispersion of TiO2-W with glycerol acting as humectants and thickeners and a
water-soluble surfactant, the same used in the PEDOT-F.
The formulations obtained were jetted using the XenJet 4000 fitted with a Xaar 760 GS8 print
head. The temperature of the print head was maintained at 35ºC. The waveform used to

201
carry out the jetting trials was similar to the presented in Fig. 7.3. It was found that both
formulations give reasonably good jetting properties, however, these formulations were not
used to build printed ECD.
Formulation of the UV-curing electrolyte ink
The key element in the development of the electrolyte layer derived from UV-curing
technology was the screening phase for compatible solvents that could dissolve the LiClO4
salt and maintain the stability of the TiO2-DPGDA. Ethyl Acetate was found to meet that
requirement. In addition 2-methyl-1,4-pentanediol was incorporated to act as a humectant.
Table 7.5 exemplifies the formulation of the UV-curable electrolyte layer and shows its
physical properties.
Table 7. 5- Formulation of UV-curing electrolyte layer
Material UV-curing electrolyte
ink
Ethyl acetate %(w/w) 27.5
TiO2-DPGDA %(w/w) 25
Tego Glide 432 %(w/w) 0.5
Irgacure 819 %(w/w) 5
2-methyl-1,4-pentanediol %(w/w) 10
DPGDA %(w/w) 25
LiClO4 %(w/w) 7
Viscosity 9
Surface Tension 27
Filtration (1µm) yes
7.3.3 Demonstration of the ink-jet printed electrochromic cells
At the end of the project two strategies were available to create an ink-jet printed electrolyte
layer, the one constituted by three layers (see Fig. 7.6) and the UV-curing electrolyte. Both
resulted to work as ion conductor and devices were able to present reasonable
electrochromism. However, the ECD assembled with the clear and opaque electrolytes
layers did not present enough structural stability and the prototypes created were not useful
even for demonstration purposes. In the following section only the results of the printed ECD
using UV-curing electrolyte ink are presented.

202
ECD based on UV-curable electrolyte
The electrochromic cell was printed according to the original architecture as shown in Figure
7.4, using piezoelectric ink-jet technology. The formulation PEDOT-F was, first, ink-jet printed
at 360x360 dpi using the 8pl drop onto both PET-ITO electrodes (primary and counter-
electrode). In the primary electrode a patterned layer of PEDOT was created, while in the
counter electrode a plain square covering all the active area was printed. Several passes
were carried out to deposit more PEDOT for a larger optical contrast between the bleached
and coloured states. The UV-curing electrolyte formulation was then ink-jet printed onto the
primary electrode deposited at 360x180 dpi using the 40pl. Finally, the assembly of the ECD
is obtained by lamination of both electrodes (see Fig. 7.7).
PET-ITO
PEDOT
Patterned PEDOT
UV-cured electrolyte
Lamination& UV
Figure 7.7 – Schematic view of the process to assemble an ECD using ink-jet and lamination
techniques.
In Fig. 7.8 pictures one example of the ink-jet printed ECD at Xennia are shown.
Figure 7.8 - Ink-jet printed ECD (7 x 7 cm) showing the coloured state (left) and bleached state (right)

203
7.4 Conclusion
This feasibility project demonstrates the viability of using ink-jet technology for the industrial
production of the electrochromic displays according to the ECD architecture proposed. Ink-jet
formulation of PEDOT:PSS as a 1.3 wt % dispersion in H2O (PEDOT:PSS) was created and
proved to achieve a good printing performance.
The physical characteristics of the gel electrolyte previously developed in IDEIA projects
showed to be inappropriate for the ink-jet technique. Two alternatives were explored to
obtain a printable electrolyte formulation. The first approach was based on a diluted solution
of low weight PEO-PPO copolymer; although the resulting formulation was ink-jettable, the
resulting printed layers did not succeed to seal the electrodes. The UV-curing electrolyte
formulation was explored as a second alternative, and was crucial to the success of the
project.
Studies that relate ink-jet printability of polymer-containing inks to their physical properties
are rare.10 Polymer printed with the ink-jet technique was used to build organic electronics
components and circuits, including the PEDOT:PSS dispersions.14 One of the most
interesting applications of polymer ink-jet printing is the manufacture of polymer light-emitting
diodes displays.15 Shubert Ulrich et al reviewed the most relevant published studies on the
rheological characteristics of polymer ink formulation and the ink-jet printability.10 They
observe that a small amount of the polymer influences the drop formation from the jet stream
created in ink-jet. The increase of the polymer weight printed shifts the drop formation
mechanism from single isolated drops, with dome satellites formation, to a “bead-on-a-string”
structure (see Fig.7.9).
Figure 7.9 – Schematic representation of the influence of the polymer weight on the ink drop
formation. From the left to the right the weight of the polymer dissolved in the ink-jet ink increases. For
low molecular weight polymers the drop are easily detached from the ink stream and small drops
(satellites) are formed. When the polymer weight is high the drops do not succeed to detach from the
ink stream and a “bead-on-a-string” is observed. The drawings are inspired from the pictures
published in ref.10.

204
UV-curable ink-jet formulation is a clever method to avoid polymer printing issues. The UV-
curable ink is a molecular based solution with a Newtonian behaviour that allows the perfect
control of the drop formation mechanism and at the same time the printed layer can be UV
polymerized. The alternative UV-curable ink-jet formulation electrolyte allows to generate the
electrolyte in situ. The electrolyte ink resulted in relatively good printing performance. A
similar polymer network was thus created compared with the PEO-PPO gel electrolyte. This
formulation allowed the production of ECD samples. Their functionality was proved and
matched the requirements for electrochromic display applications.

205
7.5 Bibliography
1. The application of photographic technology [Online]. Available:
http://www.nikon.com/products/precision/society/story0203/index.htm [Accessed July
2010 2010].
2. Fuller, S.; Wilhelm, E.; Jacobson, J., Ink-jet printed nanoparticle
microelectromechanical systems. Journal of Microelectromechanical Systems 2002,
54-60.
3. Kipphan, H., Handbook of print media: technologies and production methods.
Springer: Heidelberg, 2001.
4. Le, H., Progress and trends in ink-jet printing technology. Journal of Imaging Science
and Technology 1998, 49-62.
5. Computer peripherals - ink-jet printers [Online]. Lintech organisation. Available:
http://www.lintech.org/comp-per/15INK.pdf [Accessed July 2010].
6. Microfab. Continuous mode ink-Jet technology - 1 [Online]. Available:
http://www.microfab.com/equipment/technotes/technote99-01/id2.htm [Accessed July
2010].
7. Hanson, E. How an ink jet printer works [Online]. The Society for Imaging Science
and Technology. Available:
http://www.imaging.org/ist/resources/tutorials/inkjet_printer.cfm [Accessed July 2010].
8. Willis, Ink-jet Academy. In Theory of ink-jet technology, IMI Europe: Lisbon, 2008.
9. Tuladhar, T.; Mackley, M., Filament stretching rheometry and break-up behaviour of
low viscosity polymer solutions and inkjet fluids. Journal of Non-Newtonian Fluid
Mechanics 2008, 97-108.
10. de Gans, B.; Duineveld, P.; Schubert, U., Inkjet printing of polymers: State of the art
and future developments. Advanced Materials 2004, 203-213.
11. de Gans, B.; Kazancioglu, E.; Meyer, W.; Schubert, U., Ink-jet printing polymers and
polymer libraries using micropipettes. Macromolecular Rapid Communications 2004,
292-296.
12. Lee, M. W.; Lee, M. Y.; Choi, J. C.; Park, J. S.; Song, C. K., Fine patterning of
glycerol-doped PEDOT:PSS on hydrophobic PVP dielectric with ink jet for source and
drain electrode of OTFTs. Organic Electronics 2010, 11 (5), 854-859.
13. Ouyang, B.; Chi, C.; Chen, F.; Xi, Q.; Yang, Y., High-conductivity poly (3,4-
ethylenedioxythiophene): poly(styrene sulfonate) film and its application in polymer
optoelectronic devices. Advanced Functional Materials 2005, 203-208.

206
14. Nilsson, D.; Kugler, T.; Svensson, P. O.; Berggren, M., An all-organic sensor-
transistor based on a novel electrochemical transducer concept printed
electrochemical sensors on paper. Sensors and Actuators B-Chemical 2002, 86 (2-3),
193-197.
15. van der Vaart, N. C.; Lifka, H.; Budzelaar, F. P. M.; Rubingh, J.; Hoppenbrouwers, J.
J. L.; Dijksman, J. F.; Verbeek, R.; van Woudenberg, R.; Vossen, F. J.; Hiddink, M. G.
H.; Rosink, J.; Bernards, T. N. M.; Giraldo, A.; Young, N. D.; Fish, D. A.; Childs, M. J.;
Steer, W. A.; Lee, D.; George, D. S., Towards large-area full-color active-matrix
printed polymer OLED television. Journal of the Society for Information Display 2005,
13 (1), 9-16.

207

208

209
Chapter 8
List of Publications

210
8.1 List of publications
The results detailed in the present thesis have been published in several international
scientific journals. In addition to the papers that resulted directly from the present work,
during my Ph.D. the experience acquired with the chromogenic systems gave me the
opportunity to contribute scientifically in the publication of other papers and patents. The list
of publications and patents is organized chronologically and the correspondence with the
respective chapter is given.
1. Branco, A.; Pinheiro, C.; Fonseca, J.; Tedim, J.; Carneiro, A.; Parola, A. J.; Freire, C.;
Pina, F., Solid-state electrochromic cells based on [M(salen)]-derived electroactive
polymer films. Electrochemica land Solid-State Letters 2010, 13 (9), J114-J118.
(Indirect contribution of the present thesis).
2. Barbosa, P. C.; Rodrigues, L. C.; Silva, M. M.; Smith, M. J.; Parola, A. J.; Pina, F.;
Pinheiro, C., Solid-state electrochromic devices using pTMC/PEO blends as polymer
electrolytes. Electrochimica Acta 2010, 55 (4), 1495-1502. (Chapter 5).
3. Pinheiro, C.; Parola, A.; Pina, F.; Laia, C., Electrochromism of Crystal Violet Lactone
in the presence of Fe(III)/Fe(II) redox pair. Electrochimica Acta 2009, 5593-5597.
(Chapter 3).
4. Pinheiro, C.; Parola, A.; Laia, C.; Camara, A.; Pina, F., Multiresponsive chromogenic
systems operated by light and electrical inputs. New Journal of Chemistry 2009,
2144-2147. (Chapter 3).
5. Co-inventor in Portuguese Utility Patent 103852 “MÉTODO DE CROMISMO”
<METHOD OF CHROMISM>.
6. Co-inventor in Portuguese Utility Patent 105152 “MÉTODO DE CROMISMO”
<METHOD OF CHROMISM>.
7. Co-inventor in the Provisory Portuguese Utility Patent 104696 “VISUALIZADOR
TÁCTIL ELETROCRÓMICO” <TOUCH-SCREEN ELECTROCHROMIC DEVICES>.
8. Pinheiro, C.; Parola, A.; Pina, F.; Fonseca, J.; Freire, C., Electrocolorimetry of
electrochromic materials on flexible ITO electrodes. Solar Energy Materials and Solar
Cells 2008, 980-985. (Chapter 4).
9. Vidinha, P.; Lourenco, N. M. T.; Pinheiro, C.; Bras, A. R.; Carvalho, T.; Santos-Silva,
T.; Mukhopadhyay, A.; Romao, M. J.; Parola, J.; Dionisio, M.; Cabral, J. M. S.;
Afonso, C. A. M.; Barreiros, S., Ion jelly: a tailor-made conducting material for smart
electrochemical devices. Chemical Communications 2008, (44), 5842-5844. (Indirect
contribution of the present thesis).

211
10. Jimenez, A.; Pinheiro, C.; Parola, A.; Maestri, M.; Pina, F., The chemistry of 6-
hydroxyflavylium: zwitterionic base and p-quinoidal chalcones. A multiswitchable
system operated by proton, electron and photon inputs. Photochemical &
Photobiological Sciences 2007, 372-380. (Chapter 2)