Embed Size (px)
Citation preview

PII S0016-7037(02)00909-2
Chemical and isotopic constraints on the generation and transport of magma beneath theEast Pacific Rise
K. W. W. SIMS,1,2 S. J. GOLDSTEIN,2,* J. BLICHERT-TOFT,3 M. R. PERFIT,4 P. KELEMEN,1 D. J. FORNARI,1 P. MICHAEL,5
M. T. MURRELL,2 S. R. HART,1 D. J. DEPAOLO,6 G. LAYNE,1 L. BALL M. JULL1 and J. BENDER
7
1Department of Geology and Geophysics, Woods Hole Oceanographic Institution, Woods Hole, MA 02543, USA2Los Alamos National Laboratory, Los Alamos, NM 87545, USA
3Ecole Normale Superiour, Lyon, France4Department of Geological Sciences, University of Florida, Gainesville, FL 32611-2120, USA
5Department of Geosciences, University of Tulsa, Tulsa, OK 74104, USA6Berkeley Center for Isotope Geochemistry, University of California, Berkeley, Berkeley, CA 94720, USA7Department of Geography and Earth Sciences, University of North Carolina, Charlotte, NC 28223, USA
(Received April 26, 2001;accepted in revised form March 22, 2002)
Abstract—Interpretation of U-series disequilibria in midocean ridge basalts is highly dependent on the bulkpartition coefficients for U and Th and therefore the mineralogy of the mantle source. Distinguishing betweenthe effect of melting processes and variable source compositions on measured disequilibria (238U-230Th-226Raand 235U-231Pa) requires measurement of the radiogenic isotopes Hf, Nd, Sr, and Pb. Here, we reportmeasurements of238U-230Th-226Ra and235U-231Pa disequilibria; Hf, Nd, Sr, and Pb isotopic; and major andtrace element compositions for a suite of 20 young midocean ridge basalts from the East Pacific Rise axisbetween 9°28' and 9°52'N. All of the samples were collected within the axial summit trough using thesubmersible Alvin. The geological setting and observational data collected during sampling operationsindicate that all the rocks are likely to have been erupted from 1991 to 1992 or within a few decades of thattime. In these samples,230Th excesses and226Ra excesses are variable and inversely correlated. Because theeruption ages of the samples are much less than the half-life of226Ra, this inverse correlation between230Thand226Ra excesses can be considered a primary feature of these lavas. For the lava suite analyzed in this study,226Ra and230Th excesses also vary with lava composition:226Ra excesses are negatively correlated with Na8
and La/Yb and positively correlated with Mg#. Conversely,230Th excesses are positively correlated with Na8
and La/Yb and negatively correlated with Mg#. Th/U,230Th/232Th, and230Th excesses are also variable andcorrelated to one another.231Pa excesses are large but relatively constant and independent of Mg#, La/Yb,Th/U, and Na8. The isotope ratios143Nd/144Nd, 176Hf/177Hf, 87Sr/86Sr, and208Pb/206Pb are constant withinanalytical uncertainty, indicating that they were derived from a common source. The source is homogeneouswith respect to parent/daughter ratios Lu/Hf, Sm/Nd, Rb/Sr, and Th/U; therefore, the measured variations ofTh/U, 230Th, and226Ra excesses and major and trace element compositions in these samples are best explainedby polybaric melting of a homogeneous source, not by mixing of compositionally distinctsources. Copyright © 2002 Elsevier Science Ltd
1. INTRODUCTION
Measurement of U-series disequilibria in young midoceanridge basalts (MORBs) should, in principle, provide uniqueconstraints on the mechanisms and time scales of melt gener-ation and transport. U-series isotopes have now been measuredin several MORB suites by mass spectrometric methods (Gold-stein et al., 1989, 1992, 1993, 1994; Volpe and Goldstein,1993; Lundstrom et al., 1995, 1998, 1999; Sims et al., 1995;Bourdon et al., 1996), and a number of models relating U-seriesdisequilibria to melting process have been proposed (e.g.,McKenzie, 1985; Williams and Gill, 1989; Qin, 1992; Iwamori,l993, 1994; Spiegelman and Elliott, 1993; Richardson andMcKenzie, 1994).
However, interpretation of the MORB U-series data in termsof melting processes has been limited by uncertainties in erup-tion age, magma storage times, and mantle source composition.Until now, most MORB suites measured for U-series disequi-
libria were collected by dredging, resulting in large uncertain-ties in inferred sample eruption age. As a result, it is uncertainwhether the226Ra excesses in these suites are primary or havebeen modified by decay, given that the half-life of226Ra is1600 yr. Therefore, the presence of226Ra excesses has beenused simply as an indication that samples are less than a fewthousand years old. This has been useful in interpreting data on230Th and231Pa excesses, which have much longer half-lives(75,380 and 32,760 yr, respectively).
Furthermore, very few MORB samples measured for U-series have also been analyzed for radiogenic isotopes of long-lived parents. In the few cases in which both types of data areavailable, Nd and Sr isotope data indicate that the sample suitesmeasured for U-series isotopes are derived from heterogeneoussources (Ben Othman and Allegre, 1990; Rubin and MacDou-gall, 1992; Sims et al., 1995). Creation of U-series disequilibriain basalts during melting is dependent on the bulk partitioncoefficients for U and Th and, therefore, the mineralogy of themantle source. As a result, uncertainties or variability in thesource composition make it difficult to determine the extent towhich variations in U-series excesses reflect variations in melt-
* Author to whom correspondence should be addressed ([email protected]).
Pergamon
Geochimica et Cosmochimica Acta, Vol. 66, No. 19, pp. 3481–3504, 2002Copyright © 2002 Elsevier Science LtdPrinted in the USA. All rights reserved
0016-7037/02 $22.00� .00
3481

ing processes vs. variations in the source lithology (e.g., garnetpyroxenite, garnet peridotite, spinel peridotite).
Application of U-Th-Ra and U-Pa radioactive disequilibriameasurements to the study of MORB petrogenesis requiresconstraints on source composition and estimates of eruptionage and magma storage time, relative to the half-lives of 230Th,231Pa, and 226Ra. Here, we report U-series disequilibria, radio-genic isotopic compositions (Nd, Sr, Hf, and Pb), and majorand trace element compositions in a suite of 20 axial MORBsamples from 9°28' to 9°52'N along the East Pacific Rise(EPR). These samples were collected by submersible (Haymonet al., 1993; Perfit et al., 1994; Fornari et al., 1998), andtherefore, their geology, locations, and young ages are rela-tively well established. Furthermore, the ages of several ofthese samples have been determined using Po-Pb disequilibria(Rubin et al., 1994). Knowledge of the eruption ages for theaxial samples eliminates a large uncertainty in the interpreta-tion of the U-series measurements in this area. Constraints onmantle source composition from the Sr, Nd, Hf, and Pb isotopedata enable us to distinguish between the effects of sourcevariability and melting processes. Using the major and traceelement compositions of these samples, we evaluate the timescales of magmatic differentiation and the influences of crustalresidence on the U-series measurements (this is particularlycritical for 226Ra, which has a half-life of 1600 yr). We then usethe compositions of these samples to evaluate melt generationand transport processes beneath the EPR.
In addition, we have measured the Nd, Sr, Hf, and Pbisotopic compositions of four samples from the SiqueirosTransform, 8°20'N along the EPR, adjacent to the segment at 9to 10° N. These samples have previously been measured formajor and trace elements (Perfit et al., 1992) and U-Th-Ra andU-Pa disequilibria (Lundstrom et al., 1999). The SiqueirosMORB samples range from trace element depleted to traceelement enriched and cover almost the entire range of U-Th-Radisequilibria observed in MORBs. Determining the isotopiccompositions of these samples is critical for interpretation oftheir U-series disequilibria. Comparison of these samples withthe axial samples at 9 to 10°N enables us to evaluate therelative influence of variable source composition vs. variabilityin melt generation and transport processes beneath the EPRover a much larger range of U-Th-Ra disequilibria.
2. SAMPLE LOCATIONS, AGES, AND GEOLOGICALSETTING
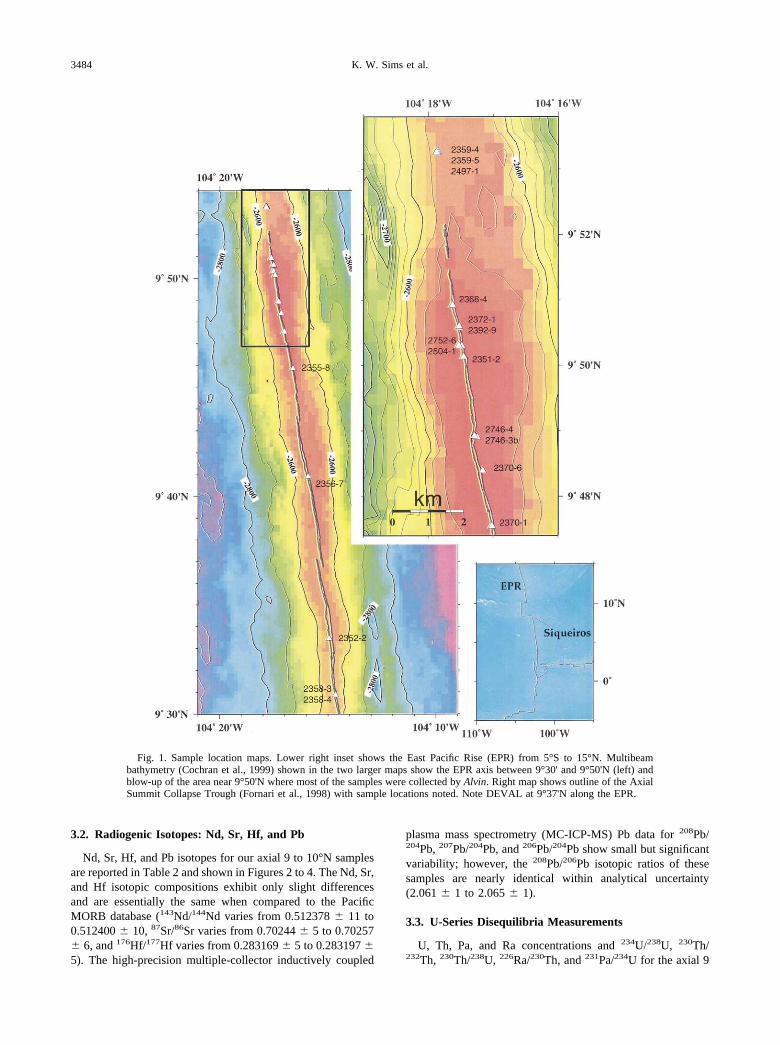
Sample locations and inferred ages are given in Table 1. Allsamples were collected within the Axial Summit CollapseTrough (ASCT) (Fornari et al., 1998) between 9°28' and9°52'N along the EPR (Fig. 1) using the submersible Alvinduring multiple cruises between 1991 and 1994. Ages (1991 to1992) for some samples were established by Po-Pb dating(Rubin et al., 1994), while for others, there is extensive obser-vational and geological evidence that suggests that lava agesare demonstrably younger (�200 yr) than the half-life of 226Ra(Haymon et al., 1993; Perfit et al., 1994; Fornari et al., 1998).
The region of the EPR between 9°28' and 9°52'N is afast-spreading ridge with a full spreading rate of 110 mm/yr(Fig. 1). Magnetic data indicate that the average spreading ratein this area has been constant over the past 2 Ma (Carbotte and
Macdonald, 1992). The continuity of the EPR axis is inter-rupted by a DEVAL at 9°37'N (Langmuir et al., 1986), whichhas been shown to be a small overlapping spreading center(OSC) that acts as a hydrothermal and volcanological dividebetween the northern and southern ridge segments (Smith et al.,2001).
The axis north and south of this DEVAL has distinct mor-phologies that can be attributed to differences in tectonic andvolcanic processes during the evolutionary history of eachsegment (Scheirer and Macdonald, 1993; Fornari et al., 1998).Bathymetry of the northern area near 9°50'N shows it to be nearthe shallowest portion of the segment. It is characterized by abroad, smooth, and convex profile indicative of a more mag-matically robust ridge segment (Scheirer and Macdonald,1993). This area has a volcanically dominated, narrow axialtrough usually � 100 m wide and � 15 m deep with sinuouswalls created by collapse of the young lobate and sheet lavaterrain. The EPR axis in the southern area near 9°30'N is deeperand more triangular in profile, suggestive of a less robustmagma supply. The axial trough near 9°30'N is nearly 300 mwide and �20 to 30 m deep with more linear walls and a nestedinner trough. Observational data suggest that the recent mag-matic input to the ridge segment north of 9°37'N is represen-tative of a longer term episode of enhanced magmatic activityon that section of ridge, relative to the region south of the OSC.Perfit and Chadwick (1998) and Fornari et al. (1998) suggestthe older-looking, more evolved lavas and more tectonizedmorphology of the ASCT area around 9°28' to 9°34'N indicatethat the axial segment south of the OSC at 9°37'N has been, onaverage, less magmatic in recent times than the segment northof the OSC.
3. RESULTS
3.1. Major and Trace Elements
Major and trace element concentrations are reported in Ap-pendix 1 together with details on analytical methods. All axial9 to 10°N samples are tholeiitic, incompatible trace elementdepleted, “normal MORB” (N-MORB). Major element com-positions range from relatively primitive to evolved (molarMg# ranges from 64 to 55), with the more evolved sampleshaving higher concentrations of incompatible trace elements.The samples show limited variability in Mg-normalized Nacontent (Na8 varies from 2.4 to 2.8) and incompatible traceelement ratios, such as La/Yb, Sm/Nd, and U/Th. Trace ele-ment fractionations (e.g., Th/U and Sm/Nd) also vary withMg#. Trace element ratios (e.g., U/Th and Sm/Nd) also varywith Mg#, especially for abundance data measured by isotopedilution mass spectrometry.
Samples from 9°40' to 9°52'N (henceforth distinguished asthe 9°50'N area) cover the entire range of major and traceelement compositions seen in this area, with Mg# varying from58 to 66. The samples from 9°28' to 9°37'N (henceforth dis-tinguished as the 9°30'N area) are more evolved, as indicatedby lower Mg# values (range 58 to 60) and higher concentrationsof incompatible trace elements. They may also have beenderived from smaller degrees of partial melting, as indicated byhigher Na8 values and more fractionated incompatible traceelement ratios.
3482 K. W. Sims et al.

Table 1. Sample locations, descriptions, and ages .
Sample Long, west Lat. northDepth(m) Description Estimated age
9–10°N EPR2359-4 104°17.868' 9°53.274' 2558 Fresh lobate collapse, could be N end of 1991 flow 1991 flow or �10 yr2497-1 104°17.848' 9°53.264' 2555 Young lobate lava in new rift that may have
opened in late ’91 or early ’92Late 1991 to 1992 flow, possibly unrelated to
the 1991 flow to the south, Po-Pb dated2359-5 104°17.874' 9°53.256' 2557 Older pillow in same area as 2359-4, slight Mn
and sediment coating10 to �200 yr
2368-4 104°17.624' 9°50.927' 2522 Fresh ropy sheet flow from center of ASCT 1991 flow2372-1 104°17.522' 9°50.601' 2521 East wall of ASCT, fresh young sheet flow
(possible BBQ flow), basalt associated ventanimals, and diffuse flow
1991 flow, Po-Pb dated
2392-9 104°17.520' 9°50.580' 2524 Ropy to hackley flow N of BBQ site, believed tobe 1991 BBQ flow
1991 flow, Po-Pb dated
2752-6 104°17.478' 9°50.304' 2516 Fresh lobate-hackly flow on W side of ASCT,minor sediment and no Mn-coating on lavasurface
1991 flow
2504-1 104°17.481' 9°50.303' 2515 Glassy flow on floor of ASCT Late 1991 to 1992 flow, Po-Pb dated2351-2 104°17.453' 9°50.139' 2514 Fresh glassy sheet flow near hydrothermal vent in
ASCT1991 flow
2746-4 104°17.293' 9°48.921' 2515 Young drained-out lobe near edge of ASCT, couldbe younger than 2746-3b or same as 1991 flow
Possible 1991 flow or �20 yr
2746-3b 104°17.244' 9°48.905' 2514 Young, glassy lobate lava with a thin dusting ofsediment and Mn coating.
�20 yr
2370-6 104°17.160' 9°48.396' 2523 Top of E ASCT wall, serpulid worm attached, maybe slightly older than 2370-1
�10 yr
2370-1 104°17.021' 9°47.546' 2523 Fresh glassy lobate flow from top of ASCT wall atedge of breakout, associated with bacterial mat
Possible 1991 flow
2355-8 104°16.620' 9°45.852' 2536 Fresh ropy flow on floor of ASCT, near bacterialfloc site and diffuse hydrothermal venting
1991 flow
2356-7 104°15.925' 9°40.896' 2554 Fresh basalt, ropy to flat sheet from center ofASCT near shimmering water and bacteria
1991 flow
2361-6 104°15.628' 9°39.123' 2559 Lobate crust from top of east ASCT wall inslightly older looking area, with light sedimentcover
�100 yr
2352-2 104°14.958' 9°33.444' 2565 Massive sheet to ropy flow from floor of ASCT,likely part of ODP flow
10 to 100 yr
2358-3 104°14.652' 9°30.876' 2574 Top of lobate flow at south margin of ODP flow,slightly stained/altered surface
10 to 100 yr
2358-4 104°14.652' 9°30.876' 2578 Massive ponded ODP flow, top is flat sheet flowsurface
10 to 100 yr
2365-3 104°13.086' 9°16.794' 2584 Youngest flow in 9°17' area, curtain folded incollapse area (near F vent of Von Damm et al.,1996)
�10 yr
Siqueiros Transform2390-5 104°02.27' 8°18.36' Mn-coated pillow basalt from the western RTI
within the Siqueiros transform, area is olderlooking with moderate sediment cover
�8000 yr; 43,632 to 44,481 yr
D20-2 103°39.90' 8°22.21' Young-looking pillow basalt fragment, very glassyand olivine rich with light coating of Fe-oxide,from same general area as dive 2384
�100 yr
2384-3 103°39.73' 8°22.25' Glassy pillow lava from young-looking flows inrelay zone between intratransform spreadingcenters A and B, sample is olivine rich withslight oxidized coating
�100 yr
2384-6 103°40.10' 8°22.26' Glassy pillow lava from young-looking flows inrelay zone between intratransform spreadingcenters A and B, sample is olivine rich withslight yellow/orange weathered surface
�100 yr
Sample ages estimated based on observational data collected using Alvin (Haymon et al., 1993; Perfit et al., 1994, 1996; Fornari et al., 1998). Agesascribed to 1991 flow on the basis of Po-Pb dating (Rubin et al., 1994) and observations made in 1991 during or just following the eruption on thebasis of pristine surface textures and patina of volcanic glass and location of samples within the axial trough. 1991 to 1992 flow age based onobservation of lava issuing from fissures north of the BBQ site (Haymon et al., 1993). Other age estimates based on nearly a decade of observationsat the 9°50'N East Pacific Rise area and comparisons made using video data and still photographs of lava surfaces proximal to fixed seafloor markers.Most locations are based on transponder navigation in Alvin. Navigation was not operative during dive 2361, so locations are based on Alvin positionsdetermined from the surface ship using of global positioning system (GPS). Siqueiros sample locations are based on short-baseline trackpointnavigation of Alvin dives or, in the case of D20, estimates of dredge position based on the ships GPS location, wire out and wire angle. Age estimatesfor 2390-5 come from observational constraints (�8000 yr) and from model ages based upon U-Th (43,632 yr) and U-Pa disequilibria (44,481 yr)(see Lundstrom et al., 1999).
3483Melt generation and transport beneath the East Pacific Rise
3.2. Radiogenic Isotopes: Nd, Sr, Hf, and Pb
Nd, Sr, Hf, and Pb isotopes for our axial 9 to 10°N samplesare reported in Table 2 and shown in Figures 2 to 4. The Nd, Sr,and Hf isotopic compositions exhibit only slight differencesand are essentially the same when compared to the PacificMORB database (143Nd/144Nd varies from 0.512378 � 11 to0.512400 � 10, 87Sr/86Sr varies from 0.70244 � 5 to 0.70257� 6, and 176Hf/177Hf varies from 0.283169 � 5 to 0.283197 �5). The high-precision multiple-collector inductively coupled
plasma mass spectrometry (MC-ICP-MS) Pb data for 208Pb/204Pb, 207Pb/204Pb, and 206Pb/204Pb show small but significantvariability; however, the 208Pb/206Pb isotopic ratios of thesesamples are nearly identical within analytical uncertainty(2.061 � 1 to 2.065 � 1).
3.3. U-Series Disequilibria Measurements
U, Th, Pa, and Ra concentrations and 234U/238U, 230Th/232Th, 230Th/238U, 226Ra/230Th, and 231Pa/234U for the axial 9
Fig. 1. Sample location maps. Lower right inset shows the East Pacific Rise (EPR) from 5°S to 15°N. Multibeambathymetry (Cochran et al., 1999) shown in the two larger maps show the EPR axis between 9°30' and 9°50'N (left) andblow-up of the area near 9°50'N where most of the samples were collected by Alvin. Right map shows outline of the AxialSummit Collapse Trough (Fornari et al., 1998) with sample locations noted. Note DEVAL at 9°37'N along the EPR.
3484 K. W. Sims et al.
to 10°N samples are reported in Table 3 and shown in Figures5 to 7. The 238U/232Th, 230Th/238U, 231Pa/235U, and 226Ra/230Th measurements for samples 2392-9 and 2497-1b are con-sistent (within analytical uncertainties) with other thermal ion-ization mass spectrometry measurements (Lundstrom et al.,1999).
3.3.1. 238U-234U
All of the samples used in this study were fresh, hand-pickedglasses and have 234U/238U activity ratios � 1 (�3‰), indi-cating minimal posteruption alteration. For submarine basalts,234U/238U activity ratios are a sensitive indicator of alteration,as seawater is significantly enriched in 234U relative to 238U(for seawater, 234U/238U � 1.14 � 0.03) (Thurber, 1967; Ku etal., 1977).
3.3.2. 238U-230Th-226Ra
In all of the axial 9 to 10°N samples examined in this study,230Th/238U is � 1 (Fig. 5), indicating that daughter 230Th hasbeen enriched relative to its parent 238U (hereafter, 230Th/238U� 1 is referred to as 230Th excess). There is a correlationbetween Mg# and the extent of 230Th/238U disequilibrium: Themore primitive samples show the smallest 230Th excesses, andthe more evolved samples show progressively larger 230Thexcesses (Fig. 8). 230Th excesses also increase with Mg-nor-malized Na contents and incompatible element fractionationssuch as La/Yb and Sm/Nd (Fig. 9).
226Ra/230Th is � 1 in all of the axial 9 to 10°N samples (Fig.6), indicating that daughter 226Ra is enriched relative to parent230Th (hereafter, 226Ra/230Th � 1 is referred to as 226Raexcess). There is an inverse correlation between Th excess and226Ra excess: The samples with the lowest Th excess have thehighest Ra excess and vice versa (Fig. 6A). 226Ra excesses
Table 2. Sr, Nd, Hf, and Pb isotopic compositions for the 9°N East Pacific Rise (EPR) and Siqueiros Transform samples.
Sample 87Sr/86Sra 143Nd/144Ndb �Nd176Hf/177Hfc �Hf
208Pb/204Pbd 207Pb/204Pbd 206Pb/204Pbd 208Pb/206Pbd
9 to 10°N EPR2359-4 0.70249 � 5 0.512391 � 8 10.9 0.283192 � 5 14.9 37.651 15.459 18.250 2.0632497-1(1) 0.70245 � 4 0.512386 � 9 10.8 0.283171 � 7 14.1 37.656 15.472 18.248 2.0642497-1(2) 0.283169 � 5 14.02359-5 0.70251 � 4 0.512396 � 8 11.0 0.283186 � 5 14.6 37.655 15.454 18.260 2.0622368-4 0.70246 � 4 0.512400 � 10 11.0 0.283189 � 5 14.8 37.657 15.471 18.246 2.0642372-1 0.70248 � 4 0.512396 � 6 11.0 0.283187 � 6 14.7 37.661 15.470 18.247 2.0642392-9 0.70253 � 3 0.512395 � 5 10.9 0.283195 � 5 15.0 37.612 15.450 18.235 2.0632752-6 0.70244 � 5 0.512390 � 8 10.8 0.283196 � 5 15.0 37.743 15.494 18.313 2.0612504-1 0.70245 � 4 0.512386 � 8 10.7 0.283197 � 5 15.0 37.640 15.465 18.245 2.0632351-2 0.70246 � 4 0.512402 � 5 11.1 0.283189 � 5 14.8 37.673 15.472 18.260 2.0632746-4 0.70244 � 5 0.512400 � 12 11.0 0.283190 � 5 14.8 37.646 15.461 18.250 2.0632746-3b 0.70249 � 4 0.512378 � 11 10.6 0.283184 � 3 14.6 37.729 15.479 18.304 2.0612370-6 0.70257 � 6 0.512390 � 7 10.8 0.283190 � 4 14.8 37.732 15.489 18.299 2.0622370-1 0.70250 � 4 0.512396 � 17 11.0 0.283186 � 5 14.6 37.654 15.467 18.252 2.0632355-8 0.70247 � 4 0.512386 � 10 10.7 0.283188 � 4 14.7 37.679 15.480 18.258 2.0642356-7 0.70249 � 4 0.512392 � 8 10.9 0.283193 � 5 14.9 37.678 15.466 18.255 2.0642361-6 0.70248 � 5 0.512395 � 6 10.9 0.283176 � 5 14.3 37.750 15.487 18.284 2.0652352-2 0.70249 � 4 0.512404 � 4 11.1 0.283189 � 5 14.8 37.717 15.476 18.291 2.0622358-3 0.70247 � 5 0.512406 � 5 11.1 0.283187 � 5 14.7 37.743 15.488 18.299 2.0632358-4 0.70247 � 4 0.512407 � 8 11.2 0.283177 � 5 14.3 37.691 15.469 18.275 2.0622365-3 0.70251 � 4 0.512384 � 7 10.7 0.283179 � 5 14.4 37.693 15.470 18.271 2.063
Siqueiros2390-5 0.70294 � 6 0.512241 � 5 7.9 0.283035 � 5 9.3 38.073 15.540 18.645 2.042D20-2 0.70250 � 4 0.512384 � 5 10.7 0.283179 � 7 14.4 37.861 15.498 18.355 2.0632384-3 0.70255 � 6 0.512387 � 5 10.8 0.283194 � 7 14.9 37.861 15.499 18.353 2.0632384-6 0.70253 � 6 0.512387 � 7 10.8 0.283185 � 6 14.6 37.814 15.487 18.316 2.065
a Sr isotopes measured at Wood’s Hate Oceanographic Institution by thermal ionization mass spectrometry (TIMS) using the VG 354. Uncertaintiesin measured Sr isotope ratios represent analytical errors (2�/�n, where n is the number of measured ratios) reported in the last decimal place.Measured ratios are corrected to NBS 987 � 0.710240, measured every fifth sample. External reproducibility is 20 to 30 ppm based or replicate runsof NBS 987.
b Nd isotopes measured at the University of California, Berkeley, by TIMS using the VG 354. Uncertainties in measured Nd isotope ratios areanalytical errors (2�/�n, where n is the number of measured ratios) reported in the last decimal place. Measured ratios are normalized to 146Nd/142Nd� 0.636151. Replicate measurement (n � 71) of 143Nd/144Nd in BCR-1 (between 10/02/92 and 4/04/01) gives a value of 0.511843 � 5. �Nd valuescalculated using (143Nd/144Nd)Chur(0) � 0.511836.
c Hf isotopes measured at ENS Lyon by multiple collector inductively coupled plasma mass spectrometry (MC-ICP-MS) using the VG Plasma 54(Blichert-Toft et al., 1997). Uncertainties in measured Hf isotope ratios are analytical errors (2�/�n, where n is the number of measured ratios)reported in the last decimal place. Measured ratios are normalized for mass fractionation to 179Hf/177Hf � 0.7325. Measurement of 174Hf/177Hf in theJMC-475 Hf isotopic standard � 0.28216 � 1. �Hf values calculated with (176Hf/177Hf)Chur(0) � 0.28 2772.
d Pb isotopes measured at ENS Lyon by MC-ICP-MS using the VG Plasma 54. Measured ratios are normalized to both an internal TI standard andthen to NBS 981 using the values of Todt et al. (1996). For these measurements every two samples are interspersed with an analyses of NBS 960for the mass bias correction (see White et al., 2000). Errors for 208Pb/204Pb, 207Pb/204Pb, and 206Pb/204Pb are 300 to 400 ppm (2�) and for 208Pb/206Pbare 200 to 300ppm (2�) and are calculated by propagating [� (se2 � se2)] both the analytical error and the variance of the NBS 960 standards fromthe instrument fractionation trend observed during the sum of these analyses.
3485Melt generation and transport beneath the East Pacific Rise

increase with increasing Mg# (Fig. 8) and decrease with in-creasing Na8, La/Yb, and Sm/Nd fractionation (Fig. 9).
3.3.1. 235U-231Pa
231Pa/235U is � 1 in all of the axial 9 to 10°N samples (Fig.7) (hereafter, 231Pa/235U � 1 is referred to as 231Pa excess).The relative values of these disequilibrium ratios give an orderof partition coefficient incompatibility of DRa � DPa � DTh �DU. Unlike 230Th/238U and 226Ra/230Th, 231Pa/235U is essen-tially constant for all of these samples.
4. INTERPRETATION OF U-SERIES DATA FROM THENORTHERN EPR
4.1. Background
MORB petrogenesis can be described in terms of severalrate-dependent parameters, including the velocity of the up-welling mantle, the rate of melting, the melt velocity associatedwith melt extraction, and the delay time, or crustal storage time,of magma before eruption (e.g., Stolper et al., 1981; Turcotte,
Fig. 2. �Nd vs. 87Sr/86Sr for axial 9 to 10°N and Siqueiros Transformsamples measured in this study. Analytical uncertainties are similar tosymbol size. EPR � East Pacific Rise.
Fig. 3. �Nd vs. �Hf for axial 9 to 10°N and Siqueiros Transformsamples measured in this study. Analytical uncertainties are similar tosymbol size.
Fig. 4. (A) 208Pb/204Pb vs. 206Pb/204Pb, (B) 207Pb/204Pb vs. 206Pb/204Pb, and (C) 208Pb/204Pb vs. 207Pb/204Pb for axial 9 to 10°N andSiqueiros Transform samples. Analytical uncertainties (�400 ppm; 2�)are similar to symbol size. EPR � East Pacific Rise.
3486 K. W. Sims et al.
Table 3. (230Th/232Th); (230Th/238U); (226Ra/230Th); (231Pa/235U); (234U/238U); and U, Th, Pa and Ra concentrations measured by thermal ionizationmass spectrometry (TIMS), (SIMS) and inductively coupled plasma mass spectrometry (ICPMS).
Sample [Th] (ug/g) [U] (ug/g) Th/U 238U/232Th 230Th/232Th 230Th/238U 231Pa (fg/g) 231Pa/235U [226Ra] (fg/g) 226Ra/230Th 234U/238U
2359-4 0.1384a 0.0542a 2.552 1.189 1.376b 1.157 46.23 2.62 49.23 2.04 1.002b
2497-1b 0.1394a 0.0560a 2.489 1.219 1.425b 1.169 n.d. n.d. 51.67 2.34 1.003b
2359-5 0.1575a 0.0617a 2.553 1.189 1.378b 1.159 52.98 2.64 n.d. n.d. 1.005b
2368-4 (1) 0.1118a 0.0456a 2.449 1.239 1.411a 1.139 37.36 2.52 47.34 2.70 1.002a
2368-4 (2) 0.1116a 0.0456a 2.447 1.240 1.405a 1.133 49.04 2.802368-4 (avg)1 0.1117 0.0456 2.448 1.239 1.408 1.136 48.19 2.752372-1 0.1176a 0.0476a 2.469 1.229 1.376b 1.123 42.00 2.71 52.03 2.89 1.002b
2392-9 (1) 0.1180a 0.0479a 2.466 1.230 1.390a 1.130 38.97 2.50 48.83 2.67 1.001a
2392-9 (2) 0.1174a 0.0476a 2.467 1.230 1.395a 1.135 48.24 2.652392-9(3) 0.1176b 0.0478b 2.460 1.233 1.394b 1.131 1.03b
2392-9 (avg)1 0.1177 0.0478 2.464 1.231 1.393 1.131 48.54 2.66 1.0022752-6 (1) 0.1318a 0.0518a 2.546 1.192 1.362a 1.143 40.99 2.43 1.002a
2752-6 (2) 0.1315a 0.0510a 2.582 1.175 1.362a 1.159 52.58 2.632752-6 (avg)1 0.1317 0.0514 2.564 1.184 1.362 1.1512504-1 0.1183a 0.0482a 2.451 1.238 1.380a 1.115 39.81 2.54 49.94 2.75 1.003a
2351-2 0.1152a 0.0460a 2.505 1.211 1.368b 1.129 n.d. n.d. 50.37 2.86 1.001b
2746-4 (1) 0.1236a 0.0499a 2.477 1.225 1.393a 1.137 40.80 2.52 50.89 2.65 1.003a
2746-4 (2) 0.122a 0.0493a 2.480 1.223 1.386a 1.1332746-4 (avg)1 0.1229 0.0496 2.479 1.224 1.390 1.1352746-3b (1) 0.1130a 0.0461a 2.451 1.238 1.397a 1.128 38.48 2.56 49.83 2.83 1.002a
2746-3b (2) 0.1123a 0.0456a 2.463 1.232 1.423a 1.154 48.85 2.752746-3b (avg)1 0.1127 0.0459 2.457 1.235 1.410 1.142 49.34 2.792370-6 0.1225a 0.0493a 2.482 1.223 1.360a 1.112 40.31 2.51 49.65 2.68 1.003a
2370-1 (1) 0.1534a 0.0592a 2.592 1.170 1.385a 1.183 48.35 2.51 1.002a
2370-1 (2) 0.1608a 0.0617a 2.609 1.163 1.390a 1.195 49.79 2.01 1.001a
2370-1 (avg)1 0.1571 0.0604 2.601 1.167 1.388 1.190 1.0022355-8(1) 0.1469a 0.0579a 2.537 1.196 1.386a 1.159 48.98 2.60 47.88 2.112355-8(2) 0.1477b 0.0581b 2.542 1.192 1.376b 1.153 1.001b
2355-8(avg) 0.1473 0.0580 2.540 1.194 1.381 1.1562356-7(1) 0.1440a 0.0568a 2.537 1.196 1.386a 1.159 49.50 2.68 48.99 2.212356-7(2) 0.1432b 0.0564b 2.540 1.194 1.379b 1.154 1.004b
2356-7(avg) 0.1437 0.0566 2.538 1.195 1.380 1.1562361-6 0.1049 0.0420 2.495 1.216 1.388b 1.142 n.d. n.d. 40.14 2.48 1.002b
2352-2(1) 0.1528a 0.0601a 2.542 1.194 1.382a 1.158 51.25 2.62 52.96 2.252352-2(2) 0.1512b 0.0593b 2.550 1.190 1.383b 1.163 1.004b
2352-2(avg) 0.1520 0.0597 2.546 1.192 1.383 1.1602358-3 0.1690a 0.0658a 2.568 1.181 1.376b 1.165 55.02 2.57 n.d. n.d. 1.005b
2358-4 0.1688a 0.0680a 2.482 1.222 1.430b 1.170 56.19 2.54 59.62 2.22 1.003b
2365-3 0.1690a 0.0664a 2.546 1.192 1.381b 1.159 56.15 2.60 57.00 2.20 1.003b
TML 1LANL 30.26a 10.80a 2.801 1.083 1.086a 1.003 3,623 0.991 1.004a
TML- 2LANL 30.49a 10.87a 2.804 1.082 1.072a 0.991 3,635 0.999TML 1WHOI 29.45b 10.543b 2.793 1.086 1.084b 0.997 1.004b
TML 2WHOI 29.44b 10.517b 2.799 1.084 1.084b 0.999 1.002b
TML 3WHOI 30.17b 10.695b 2.821 1.076 1.082b 1.006 1.005b
1 Duplicate measurements represent separate glass splits; glass samples were leached on the ship in 6 N HCl for 15 min, hand picked under amicroscope in the lab, then ultrasonically leached in sequential treatments of 1 N HCl plus 2% H2O2 (15 min), DI water (twice, each time for 15 min),0.1 N oxalic acid plus 2% H2O2a, DI water (twice, each time for 15 min), acetone (15 min). Samples were then hand picked by microscope for a secondtime. Sample splits (�1 g) were then dissolved, aliquoted, spiked, and then U-Th-Pa and Ra were separated using chemical techniques outlined inGoldstein et al., (1989), Volpe et al., (1993), Pickett et al., (1996) and Layne and Sims (2000).
2 [U], [Th], measured by both (a) ID-TIMS at LANL and (b) ID-ICP-MS at WHOI; measurement errors for [U], [Th] �0.8% (2�) for ID-TIMSand �1.0% for ID-ICP-MS
3 ( ) denotes activity �238 � 1.551 � 10–10 yr–1; �232 � 4.948 � 10–11 yr–1 errors (2�) range from 0.4 to 1.0% and do not include uncertaintiesin �238 (0.07%) or �32 (0.5%).
4 232Th/210Th measured by (a) HAS-TIMS at LANL (Goldstein et al., 1989) and (b) SIMS at WHOI (Layne and Sims, 2000); activity ratioscalculated using �230 � 9.195 � 106 yr–1 and �232 � 4.948 � 10–11 yr–1; errors (2�) range from 0.6 to 1.2% for both techniques and do not includeuncertainties in �230 (0.4%) or �232 (0.5%).
5 [226Ra] measured by ID-TIMS at LANL (Volpe et al., 1991; �226 � 4.331 � 10–4 yr–1; errors (2�) range from 1.2 to 3.6% and do not includeuncertainties in �226 (0.4%) or �230.
6 [231Pa] measured by ID-TIMS at LANL (Pickett et al., 1996); �231 � 2.115 � 10–5 yr–1; errors (2�) range from 1.0 to 3.0% and do not includeuncertainties in �2 31 (0.4%) or �235 (0.07%).
7 234U/238U measured by (a) TIMS at LANL and (b) ICP-MS at WHOI; �234 � 2.823 � 10–6 yr–1; errors (2�) �1.0%; for these samples 234U/238U� 1 within error using an equilibrium 234U/238U of 54.95 ppm. For ICP-MS NBS 960 was run between each sample to determine mass bias.
8 TML was used to calibrate 233Pa spike, but measured as an unknown for U-Th-Ra disequilibria.
3487Melt generation and transport beneath the East Pacific Rise

1982; McKenzie, 1984, 1985; Richter and McKenzie, 1984;Ribe, 1985, 1987, DePaolo, 1996). While the velocity of solidupwelling mantle can be estimated from the midocean ridgespreading rate or other geophysical measurements, (e.g., McK-enzie and Bickle, 1988; Watson and McKenzie, 1991; Forsyth,1992), there are few constraints on the other parameters thatcontrol the time scales of melt generation and transport in themantle. For this reason, it is desirable to pursue other ap-proaches to constrain the rate-dependent parameters of MORBpetrogenesis. U-decay series nuclides have half-lives that are
comparable to the time scales of melt generation and transport.Because of their appropriate half-lives and because radioactivesteady-state requirements constrain the abundances and activ-ities of decay series before chemical fractionation (Bateman,1910), measurement of disequilibria among the isotopes of theU and Th decay series can provide unique and direct constraintson the timing and extent of chemical fractionation occurringduring magma genesis (e.g., McKenzie, 1984; Condomines etal., 1988; Spiegelmen and Elliott, 1993).
In almost all young MORB, 230Th/238U, 231Pa/235U, and/or226Ra/230Th are � 1, indicating that 230Th has been signifi-cantly enriched in the melt relative to 238U (230Th excessesrange from 1.0 to 1.35), 226Ra has been enriched relative to230Th (226Ra excesses range from 1.0 to 4.0), and 231Pa hasbeen enriched relative to 235U (231Pa excesses range from 2.3to 2.8). On the basis of measurements of mineral-melt partitioncoefficients, the observed 230Th excesses measured in MORBhave been interpreted as requiring melt extraction to begindeep, at pressures � 1.5 GPa, either in the presence of garnetor near-solidus pyroxene (LaTourrette and Burnett, 1992; Be-attie, 1993a, 1993b; LaTourrette et al., 1993; Wood et al., 1999;Landwehr et al., 2001). Because the parent elements, U and Th,are thought to be highly incompatible, the large 230Th, 231Pa,and 226Ra excesses suggest that either (a) melting is nearfractional and the melting rate is low compared to the half-livesof 230Th, 231Pa, and 226Ra; or (b) melt extraction processesinvolve porous flow at very small intergranular porosities. Inboth scenarios, the absolute value of the melt fractions and/orintergranular porosities that are required depends strongly onthe mineral-melt partitioning values for U and Th.
Determining the rate-dependent parameters of MORB petro-genesis from U-series measurements requires knowledge of thenature of melt extraction and the degree of chemical equilib-rium between melt and solid during melt transport. Constraintsfrom the chemistry of erupted magmas (Klein and Langmuir,1987; Langmuir et al., 1992), exposed ophiolites (Nicolas,1986; Kelemen et al., 1995), abyssal peridotites (Dick et al.,1984; Johnson et al., 1990; Johnson and Dick, 1992; Niu,1997), and physical models have led to two end-member the-ories of melt generation and transport. One, “dynamic melting,”considers melting a near fractional process in which melt ischemically isolated from the solid matrix and transported to thesurface as soon as a critical threshold porosity is attained(Langmuir et al., 1977; McKenzie, 1984). The other, “ reactiveporous flow,” considers melting and melt transport a reactiveprocess in which melt percolates through a porous matrix,undergoing chemical exchange (Navon and Stolper, 1987;Spiegelmen and Elliott, 1993). Because these two end-membermodels attribute 226Ra/230Th and 230Th/238U to different pro-cesses, the relationship between these two disequilibria is oneof the key pieces of evidence that can be used to choosebetween these different models.
In dynamic melting, 226Ra and 230Th excesses are bothgenerated at the bottom of the melt column, near the peridotitesolidus, and decrease with increasing degrees of melting anddecompression. 226Ra and 230Th excesses are therefore ex-pected to be positively correlated in primary magmas. Fast melttransport through conduits or channels is required to maintainthe observed disequilibria before the excess daughter elementscan decay back to equilibrium. Because of the short half-life of
Fig. 5. (A) U/Th vs. 230Th/232Th for axial 9 to 10°N samples. Errorellipse represents maximum analytical uncertainty. (B) U/Th vs. 230Th/232Th for axial 9 to 10°N samples and Siqueiros Transform samples(Lundstrom et al., 1998) for which Nd, Sr, Hf, and Pb isotopes havebeen measured. Note that the age of Siqueiros E-type sample (2390-1)is thought to be significant relative to the half-life of 230Th (Lundstromet al., 1999). The age correction for this sample comes from Lundstromet al. (1999) and is based upon the method of Goldstein et al (1992,1993). This correction assumes that the Siqueiros sample (2391) andthe near axis 9°37 E-MORB (midocean ridge basalt) (R54-2), fromVolpe and Goldstein (1993), erupted with the same 230Th/232Th. EPR� East Pacific Rise.
3488 K. W. Sims et al.
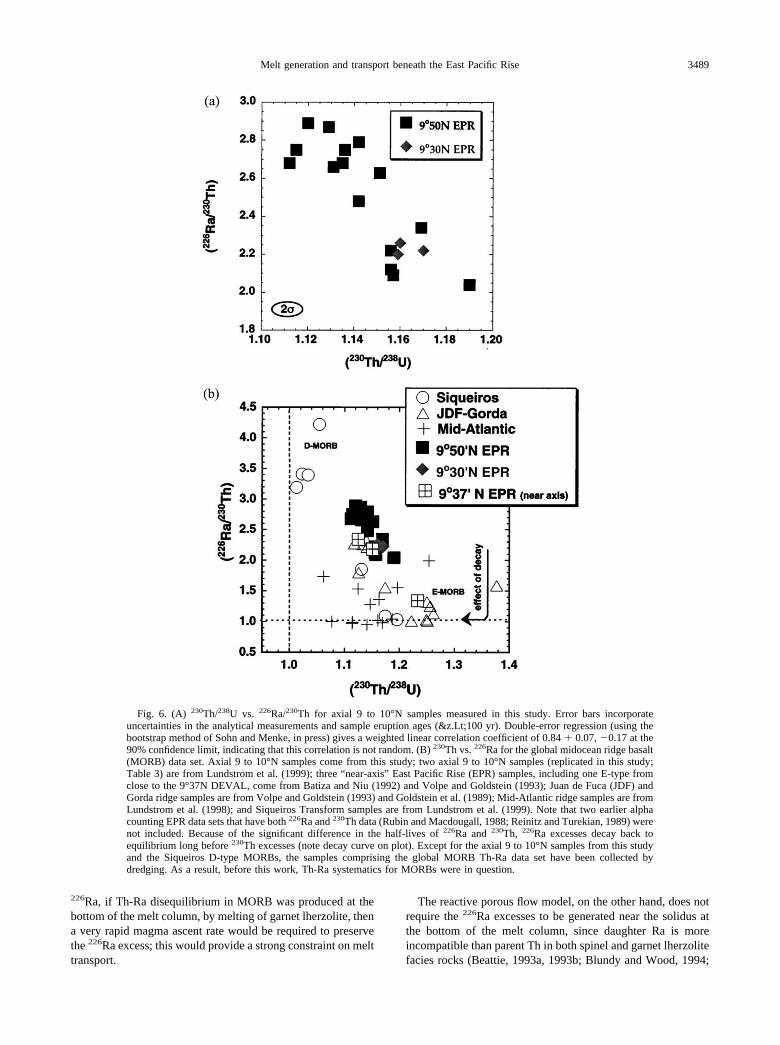
226Ra, if Th-Ra disequilibrium in MORB was produced at thebottom of the melt column, by melting of garnet lherzolite, thena very rapid magma ascent rate would be required to preservethe 226Ra excess; this would provide a strong constraint on melttransport.
The reactive porous flow model, on the other hand, does notrequire the 226Ra excesses to be generated near the solidus atthe bottom of the melt column, since daughter Ra is moreincompatible than parent Th in both spinel and garnet lherzolitefacies rocks (Beattie, 1993a, 1993b; Blundy and Wood, 1994;
Fig. 6. (A) 230Th/238U vs. 226Ra/230Th for axial 9 to 10°N samples measured in this study. Error bars incorporateuncertainties in the analytical measurements and sample eruption ages (&z.Lt;100 yr). Double-error regression (using thebootstrap method of Sohn and Menke, in press) gives a weighted linear correlation coefficient of 0.84 � 0.07, 0.17 at the90% confidence limit, indicating that this correlation is not random. (B) 230Th vs. 226Ra for the global midocean ridge basalt(MORB) data set. Axial 9 to 10°N samples come from this study; two axial 9 to 10°N samples (replicated in this study;Table 3) are from Lundstrom et al. (1999); three “near-axis” East Pacific Rise (EPR) samples, including one E-type fromclose to the 9°37N DEVAL, come from Batiza and Niu (1992) and Volpe and Goldstein (1993); Juan de Fuca (JDF) andGorda ridge samples are from Volpe and Goldstein (1993) and Goldstein et al. (1989); Mid-Atlantic ridge samples are fromLundstrom et al. (1998); and Siqueiros Transform samples are from Lundstrom et al. (1999). Note that two earlier alphacounting EPR data sets that have both 226Ra and 230Th data (Rubin and Macdougall, 1988; Reinitz and Turekian, 1989) werenot included. Because of the significant difference in the half-lives of 226Ra and 230Th, 226Ra excesses decay back toequilibrium long before 230Th excesses (note decay curve on plot). Except for the axial 9 to 10°N samples from this studyand the Siqueiros D-type MORBs, the samples comprising the global MORB Th-Ra data set have been collected bydredging. As a result, before this work, Th-Ra systematics for MORBs were in question.
3489Melt generation and transport beneath the East Pacific Rise

Sims et al., 1999; Cooper et al., 2000). Slower melt migrationthrough the porous matrix and chromatographic exchange withthe residual solid maintains the 226Ra excess to shallow levelswithin the melt column (e.g., see Spiegelmen and Elliott, 1993).With this model, melt transport is not constrained to be fast andcan be calculated explicitly from the U-series measurements.Because experimental data on U-Th partitioning suggest thatthe large 230Th excesses measured in MORB require deep meltextraction (Landwehr et al., 2001), all MORB melt cannot havereequilibrated to shallow levels. Therefore, because of the largeTh excesses observed in most MORB, reactive porous flowcannot be the only mechanism of melt transport.
Before this work, there had been four axial MORB suites
measured for both 230Th and 226Ra (Fig. 6) by mass spectro-metric methods: (a) a suite of dredge samples from the Juan deFuca and Gorda ridges (Volpe and Goldstein, 1993), (b) a suiteof dredge samples from the Mid-Atlantic Ridge (Lundstrom etal., 1998), (c) a limited suite of three near-axial dredge samplesfrom 9°37'N along the EPR (Volpe and Goldstein, 1993), and(d) a suite of Alvin and dredge samples from the SiqueirosTransform (Lundstrom et al., 1999). No clear systematicsemerge for the Atlantic Th-Ra data, probably because of thehighly variable age of dredged samples from this slow-spread-ing ridge. In MORB from the Juan de Fuca Ridge and theSiqueiros Transform and nothern EPR, Th and Ra excesses arenegatively correlated (Volpe and Goldstein, 1993; Kelemen etal., 1997; Lundstrom et al., 1995, 1999). This is unlike oceanisland basalts, such as those in Hawaii, which show positivecorrelations between Th, Pa, and Ra excesses and the degree ofpartial melting (Sims et al., 1999).
To account for the negative correlation between 230Th and226Ra excesses, it has been proposed that melt with a 230Thexcess forms near the base of the melting region and thenascends rapidly in chemically isolated conduits, while slow,reactive transport forms 226Ra excess at shallow levels in themantle (Kelemen et al., 1997; Sims et al., 1998; Lundstrom etal., 1999). A similar “ two-porosity” system was previouslyproposed by Iwamori (1993), 1994) to account for trace ele-ment systematics in MORB and abyssal peridotites.
This hypothesis relies on the assumptions that 230Th-226Radisequilibria measured in the MORB is primary and that bothsample ages and crustal residence times are negligible relativeto the half-life of 226Ra. However, the observed negative cor-relation between 226Ra and 230Th was based primarily ondredge samples (e.g., the Juan de Fuca and Gorda ridge sam-ples), and because end-member samples with the highest 230Thexcesses and smallest 226Ra excesses (e.g., the Siqueiros E-typelavas) may be old, relative to the half-life of 226Ra (andprobably even 231Pa), the extent to which this correlation is aprimary feature of melting is uncertain. Furthermore, becauselimited measurements of Nd and Sr isotopes in these sampleshave shown that they were derived from relatively heteroge-neous sources (Natland, 1989; Rubin and MacDougall, 1992;Sims et al., 1995), it has been difficult to determine the extentto which U-series variations in these suites reflect variations inmelting processes vs. variations in source lithology (e.g., garnetpyroxenite, garnet peridotite, spinel peridotite) (e.g., see Lund-strom et al., 1995, 1999, 2000; Condomines and Sigmarsson,2000). In this work, we are certain that the samples analyzedhave erupted exclusively within the axial summit trough, andtheir ages are demonstrably young, if not known absolutely(e.g., 1991 to 1992 eruption; Haymon et al., 1993; Rubin et al.,1994). Furthermore, measurements of Sr, Nd, Pb, and Hf iso-topes (Table 2) indicate that they were derived from long-termdepleted sources that are nearly identical or only slightly het-erogeneous in terms of their incompatible element abundances.
4.2. Constraints on Long-Term Sources of Axial 9 to10°N Axial Lavas
230Th excesses in basalts are highly dependent on bulkpartition coefficients for U and Th and therefore the mineralogyof mantle sources. While several models relating U-series dis-
Fig. 7. (A) 230Th/238U vs. 231Pa/235U for axial 9 to 10°N samples(study). Error ellipse represents maximum analytical uncertainties. (B)230Th/238U vs. 231Pa/235U for the axial 9 to 10°N and Siqueiros sam-ples. Age correction for the Siqueiros E-type sample (2390-1) comesfrom Lundstrom et al. (1999) and is based upon the method of Gold-stein et al. (1989). Replicate values for 231Pa/235U of Siqueiros sample2384-1 are as reported in Lundstrom et al. (1999). EPR � East PacificRise.
3490 K. W. Sims et al.

equilibria to melting of a homogeneous peridotite have beenproposed (e.g., McKenzie, 1985; Spiegelman and Elliott,1993), it has also been suggested that variations observed in theU-Th disequilibria can be explained by mixing of melts derivedfrom different lithologies that have distinctive long-term chem-ical characteristics (Ben Othman and Allegre, 1990; Lundstromet al., 1995, 1999, 2000; Condomines and Sigmarsson, 2000).
It was originally thought that the large 230Th excesses mea-sured in MORB samples required melt extraction in the pres-ence of garnet (LaTourrette and Burnett, 1992; Beattie, 1993a,1993b; LaTourrette et al., 1993). However, recent studies haveshown that at or near solidus conditions, Th may also be moreincompatible than U during melting in the presence of high-temperature, high-pressure clinopyroxene (Wood et al., 1999;Landwehr et al., 2001). This would suggest that melting ofspinel peridotite at pressures � �1.5 GPa could also cause230Th excesses. While these new results appear to relax therequirement that 230Th excesses require melting in the presenceof garnet, Wood et al.’s (1999) clinopyroxene U-Th partitioncoefficients still require Th excesses to be generated deep(�1.5 GPa). In addition, they conclude that the large values of230Th excess in MORB “are unlikely to have been produced bymelting of spinel lherzolite, and that garnet lherzolite is a moreplausible source” (Landwehr et al., 2001, p. 346).
Because very few suites measured for U-series disequilibriahave also been measured for Hf, Nd, Sr, and Pb isotopes, theextent to which U-series disequilibria reflect variations in themelting processes, as opposed to variable mixing of melts fromdepleted (peridotitic) and enriched (pyroxenitic) sources, is notwell constrained. The Hf, Nd, and Sr isotopic ratios measuredin our very young axial 9 to 10°N lava suite are essentiallyconstant within analytical uncertainty and therefore not corre-lated with the observed 230Th excesses (Figs. 10A to 10B).These isotope ratios indicate that all of the samples come froma homogeneous mantle source that is depleted with respect toSm/Nd, Lu/Hf, and Rb/Sr. Furthermore, as will be discussedlater, when comparing the axial 9 to 10°N samples with theSiqueiros end-member D-MORB and E-MORB samples, theaxial 9 to 10°N N-MORB cannot be explained by binarymixing of melts from depleted and enriched sources, as pro-posed by Lundstrom et al. (1999).
In contrast, the Pb isotopic ratios of the axial 9 to 10°Nsamples are variable. This variation is larger than the analyticaluncertainties of the high-precision MC-ICP-MS measurements,but it is limited when compared to adjacent segments of theEPR (e.g., White, 1985; Galer et al., 2000). This variability islinear and well correlated, suggesting that there is some vari-ation in the time-integrated U/Pb and Th/Pb mantle sources ofthese samples. The extent to which this Pb isotopic variationalso reflects differences in Th/U source ratios is critical to theinterpretation of the U-series data. In this regard, it is importantto note that for our axial 9 to 10°N samples, 208Pb/206Pb, whichrepresents the time-integrated Th/U ratio of the mantle source,is essentially constant and independent of the samples’ 230Thexcesses (Fig. 10D). When compared to simple single- andtwo-stage Pb evolution models, which consider the time-inte-grated U/Th/Pb of the mantle source (Holmes, 1946; Houter-mans, 1946; Galer and O’Nions, 1985; Elliot et al., 1999), thenearly constant 208Pb/206Pb compositions of these samplessuggest that they came from a mantle source that is homoge-
Fig. 8. (A) 230Th excess vs. Mg# (molar Mg/[Mg � Fe]) for the axial9 to 10°N and Siqueiros Transform samples. Double-error regression(Sohn and Menke, in press) gives a slope of 0.97 � 0.2 and an interceptof 1.7 � 0.2, with a weighted linear correlation coefficient (rxy) of 0.87,which falls on the interval of 0.94 � rxy � 0.77 at the 90% confidencelimit. (B) 231Pa excess vs. Mg# for the 9 to 10°N and Siqueiros data. (C)226Ra excess vs. Mg# for the axial 9 to 10°N and Siqueiros Transformsamples. Error bars include both analytical and eruption age uncertainties.Double-error regression (Sohn and Menke, in press) gives a slope of 15 �6 and an intercept of 7 � 4, with a weighted linear correlation coefficient(rxy) of 0.65, which falls in the interval of 0.50 � rxy � 0.84 at the90% confidence limit. EPR � East Pacific Rise.
3491Melt generation and transport beneath the East Pacific Rise

neous with respect to its time-integrated Th/U. For a single-stage Pb evolution model, the 208Pb/206Pb lava compositionspredict a variation of � 1% in the Th/U source ratio of thesesamples. This 1% variation in Th/U inferred from the Pbisotope data is much smaller than the 6% variation in Th/Uobserved in our data (Fig. 11). Because these samples lie on alinear array in Pb isotope space, two-stage Pb evolution modelswould require that the Th/U ratio of their source was homoge-neous. However, interpretation of the Pb isotope compositionsof these samples in terms of a two-stage model also requiresthat the linear arrays in 207Pb/204Pb vs. 206Pb/204Pb representsecondary isochrons. In this case, the large slope of the our dataarray in 207Pb/204Pb vs. 206Pb/204Pb space would predict thatthe second stage of Pb evolution started very early in theEarth’s history and that the mantle source of these lavas hasremained closed ever since, a scenario which is highly unlikely.
In this regard, it is also important to note that the time-averaged Th/U inferred by the 208Pb/206Pb, using both single-stage (Th/U � 3.7 to 3.8) and two-stage (Th/U � 3.1 to 3.6) Pbevolution models is different than the Th/U of the source
inferred from either the samples 230Th/232Th (Th/U � 2.12 to2.24) or measured Th/U (2.45 to 2.60). This discrepancy be-tween MORB’s inferred long-term and more recent Th/Usource ratios has been previously noted and is referred to as the“kappa conundrum” (cf. Galer and O’Nions, 1985; Elliot et al.,1999). To explain this kappa conundrum, several models havebeen proposed that require either a recent influx of Pb from thelower mantle (Galer and O’Nions, 1985) or a multistage evo-lution for Pb (Elliot et al., 1999).
Regardless of the interpretation of the Pb isotopic composi-tions of our samples (single-stage, two-stage, multistage, oropen-system), their constant 208Pb/206Pb ratios suggest that ouryoung axial samples come from a source with effectivelyconstant time-integrated Th/U. Therefore, we conclude that thevariation in the observed Th/U reflects elemental fractionationduring melt generation and transport processes, rather thanvariability in the Th/U of the mantle source.
Most U-series measurements of MORB, including ours,show positive trends between 230Th/238U and Th/U for agiven ridge segment (Goldstein et al., 1989, 1993; Reinitz
Fig. 9. (A) 230Th excess and (B) 226Ra excess vs. alpha Sm/Nd for axial 9 to 10°N and Siqueiros Transform samples.Alpha Sm/Nd is a measure of the Sm/Nd fractionation during midocean ridge basalt (MORB) petrogenesis and is the Sm/Ndconcentration ratio measured in the lava normalized to a model Sm/Nd source ratio inferred from the 143Nd/144Nd of thelavas (for details, see DePaolo, 1988; Salters and Hart, 1989; Sims et al., 1995). Although the variance in the calculatedalpha Sm/Nd for the axial 9 to 10°N lavas, measured by isotope dilution, is similar to the analytical uncertainties, the isotopedilution data suggest correlations with 230Th and 226Ra excesses consistent with those observed in the larger data set, whichincludes the Siqueiros Transform D-MORBs and E-MORBs. (C) 230Th excess and (D) 226Ra excess vs. La/Yb for axial 9to 10°N and Siqueiros Transform samples. For the axial 9 to 10°N samples, the variance in La/Yb, measured by inductivelycoupled plasma mass spectrometry, is much smaller than the propagated analytical uncertainties. (E) 230Th excess and (F)226Ra excess vs. Na8 for axial 9 to 10°N and Siqueiros Transform samples. Na8 was calculated using a linear regression ofNa2O vs. MgO in the axial 9 to 10°N samples. For lavas with �8.5 wt.% MgO, Na8 is equal to the observed wt.% Na2O.EPR � East Pacific Rise.
3492 K. W. Sims et al.

and Turekian, 1989; Ben Othman and Allegre, 1990; Lundstrom etal., 1998). Because MORBs represent large degrees of partialmelting, and Th and U have commonly been thought to be highlyincompatible in mantle minerals, it has been proposed that theobserved variations in Th/U reflect variation in mantle sourcecomposition (Lundstrom et al., 1995; 1998, 1999, 2000). In thisview, the correlation between Th/U and the degree of 230Th/238Udisequilibria (Fig. 11) is interpreted to reflect mixing of meltsderived from enriched and depleted sources. The more enrichedsources (higher Th/U) are small-scale, garnet-bearing mafic veinsthat produce greater amounts of 230Th excesses because of thehigher garnet abundance.
The constant Nd, Sr, Hf, and 208Pb/206Pb isotopic composi-tions measured in our samples suggest that the variations ofTh/U and 230Th and 226Ra excesses are best explained byvariability in melt generation and transport processes, not themixing of enriched and depleted mantle melts, as has been
previously suggested (Lundstrom et al., 1999, 2000). Further-more, if the E-MORB isotope signature documented in theSiqueiros E-MORB samples is representative of a melt com-ponent derived from garnet pyroxenite veins, then the lack ofvariability in the heavy isotope ratios within the 9 to 10°N axialsample suite can also be interpreted as evidence against mixingof enriched melts from garnet pyroxenite veins with meltsderived from ambient peridotitic mantle (e.g., Ben Othman andAllegre, 1990; Lundstrom et al., 1999, 2000; Condomines andSigmarsson, 2000).
4.3. Influence of Crustal Processes and Magma StorageTime on U-Series Disequilibria
There is considerable geophysical and geological evi-dence that suggests that MORBs reside in crustal, and per-haps subcrustal, axial magma chambers (AMCs) before
Fig. 10. 230Th excess vs. (A) �Nd, (B) 87Sr/86Sr, (C) �Hf, and (D) 208Pb/206Pb for the axial 9 to 10°N and Siqueiros Transformsamples. Note that an unpublished 87Sr/86Sr analysis of �0.7026 for the East Pacific Rise (EPR) near axial E-MORB (midoceanridge basalt), R54-2, reported in Batiza and Niu (1992) but not shown here, is similar to the values measured for the axial 9 to10°N and Siqueiros Transform D-MORB samples. Inclusion of this sample in this data set would extend the range of 230Th excess(1.23) for samples having similar 87Sr/86Sr. For each plot, two possible mixing trends are shown. One uses the measured valuefor the end-member E-type Siqueiros lava, while the other uses the “age-corrected” value for the end-member E-type Siqueiroslava (Lundstrom et al., 1999) for the mixing calculations. Because of the large differences in the concentrations of Nd, Sr, Hf, Pb,U, and Th in the end-member Siqueiros D-MORB and E-MORB samples, these mixing curves are dominated by the E-MORBcomponent and therefore do not pass through the axial 9 to 10°N data array.
3493Melt generation and transport beneath the East Pacific Rise
eruption (e.g., Grove and Bryan, 1983; Detrick et al., 1987;Kent et al 1990; Toomey et al., 1990; Sinton and Detrick,1992; Boudier and Nicolas, 1995; Kelemen et al., 1997;Dunn et al., 2000). Chemical data also imply that MORBsare chemically evolved as a result of crystal fractionation(e.g., O’Hara, 1968). Determining the time scales of magmastorage and differentiation and the chemical influence of thiscrustal residence is critical to the interpretation of U-seriesdisequilibria in our samples. If magma storage time is significantrelative to the half-life of the daughter isotopes, then the daughter/parent activity ratios will decay toward their equilibrium valuesand cause us to infer too small an amount of daughter/parentfractionation during mantle petrogenesis. Similarly, if U-seriesdisequilibria in our samples have been produced or modified bycrustal processes (e.g., assimilation and fractional crystalliza-tion), then interpretation of the U-series data in terms of melt-ing processes would also be incorrect.
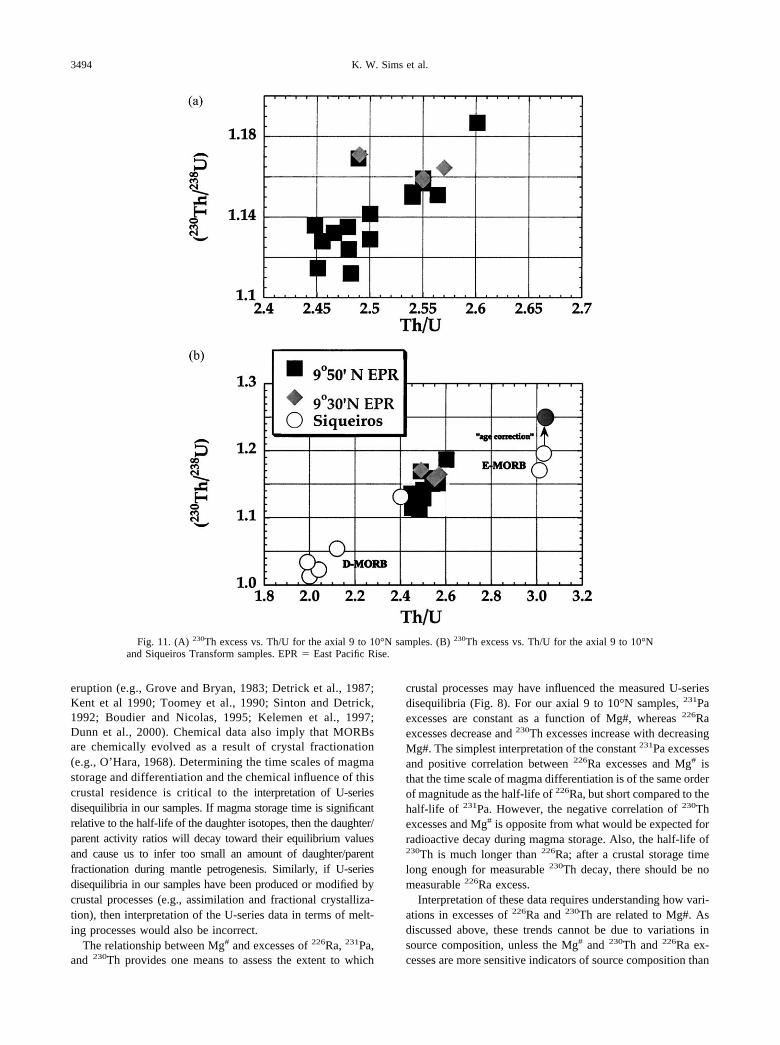
The relationship between Mg# and excesses of 226Ra, 231Pa,and 230Th provides one means to assess the extent to which
crustal processes may have influenced the measured U-seriesdisequilibria (Fig. 8). For our axial 9 to 10°N samples, 231Paexcesses are constant as a function of Mg#, whereas 226Raexcesses decrease and 230Th excesses increase with decreasingMg#. The simplest interpretation of the constant 231Pa excessesand positive correlation between 226Ra excesses and Mg# isthat the time scale of magma differentiation is of the same orderof magnitude as the half-life of 226Ra, but short compared to thehalf-life of 231Pa. However, the negative correlation of 230Thexcesses and Mg# is opposite from what would be expected forradioactive decay during magma storage. Also, the half-life of230Th is much longer than 226Ra; after a crustal storage timelong enough for measurable 230Th decay, there should be nomeasurable 226Ra excess.
Interpretation of these data requires understanding how vari-ations in excesses of 226Ra and 230Th are related to Mg#. Asdiscussed above, these trends cannot be due to variations insource composition, unless the Mg# and 230Th and 226Ra ex-cesses are more sensitive indicators of source composition than
Fig. 11. (A) 230Th excess vs. Th/U for the axial 9 to 10°N samples. (B) 230Th excess vs. Th/U for the axial 9 to 10°Nand Siqueiros Transform samples. EPR � East Pacific Rise.
3494 K. W. Sims et al.

Nd, Sr, Hf, and Pb isotopes, which is unlikely. The threesimplest possible explanations for the observed correlationbetween 226Ra and 230Th excesses and Mg# are as follows: (a)The positive correlation between 226Ra excesses and Mg# re-flects the time scale of magma differentiation, while the nega-tive correlation between 230Th excess and Mg# reflects theinfluence of secondary crustal processes, such as assimilationor crystallization; (b) the variations in the 226Ra and 230Thexcesses and Mg# result from melt generation and trans-port processes; and (c) one or both of the observedcorrelations between 226Ra and 230Th excesses and Mg# is acoincidence.
Before interpreting these data in terms of melting processes,we examine the possible influence of secondary crustal pro-cesses on U-series disequilibrium activity ratios and the effectof 226Ra decay as a function of magma storage time.
4.3.1. Assessing the influence of secondary alteration andcrustal assimilation on the U-SERIES data
There are several lines of evidence that suggest that 226Ra,230Th, and 231Pa excesses generated in our very young axialsamples are not a result of secondary processes, such as alter-ation or assimilation:
1. All of the samples used in this study were fresh, hand-picked glasses and have 234U/238U activity ratios � 1,indicating minimal posteruption alteration For submarinebasalts, 234U/238U activity ratios are a sensitive indicator ofalteration, as seawater is significantly enriched in 234U rel-ative to 238U (234U/238U � 1.14; Ku et al., 1977).
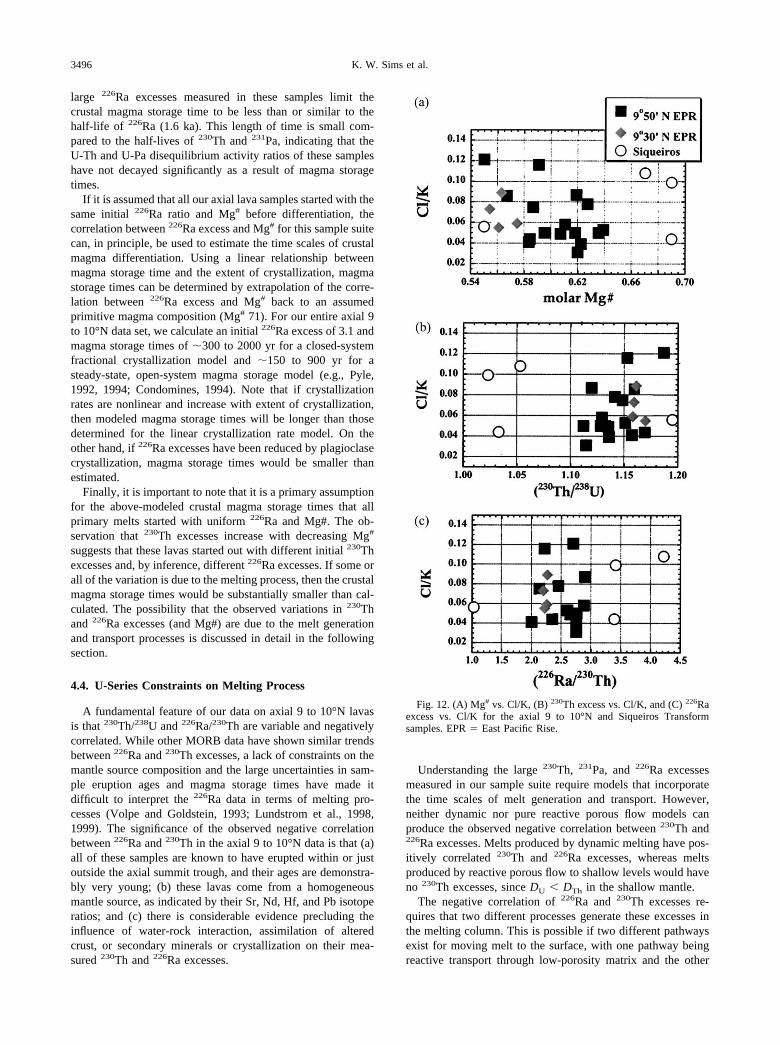
2. The Cl/K ratio is a sensitive indicator of assimilation ofhydrothermal fluids or hydrothermally altered crust thatcontains minerals such as barite (eg., Michael and Cornell,1998). For our samples, Cl/K varies from 0.02 to 0.4 and isnot correlated with Mg# (Fig. 12A). While this region of theEPR has extensive hydrothermal venting (Haymon et al.,1991, 1993; Von Damm et al 2000), which involves crustalalteration, there is no significant correlation between Cl/Kand 226Ra/230Th or 230Th/238U and Cl/K. This lack of cor-relation between 226Ra and 230Th excesses and Cl/K dem-onstrates that 226Ra and 230Th excesses are not caused byassimilation of hydrothermally modified material.
3. B isotopes are sensitive indicators of water-rock interactionand assimilation of altered oceanic crust, as there is a largerange of variability between unaltered MORB (d11B � 5to 10), seawater (d11B � �40), and altered crust (d11B ��8) Limited measurements of B isotopes in these samples(Sims et al unpublished data) show that they are in the rangeof normal MORB, demonstrating that these samples havenot assimilated significant amounts of altered oceanic crust.
4. Several studies have investigated the influence of secondary,low-temperature alteration on 230Th excesses and concludedthat 230Th excesses are not a result of such processes (Gold-stein et al, 1989; Reinitz and Turekian, 1989; Bourdon et al.,2000). Furthermore, it is important to note that Volpe andGoldstein (1993) have also shown that for old, off-axissamples, 226Ra is in equilibrium with 230Th activities, indi-cating that 226Ra excesses are decaying rather than increas-ing as the samples age and become altered.
4.3.2. Effect of apatite fractionation on 230th/238u
Th and U are highly incompatible in most crystallizingphases, and therefore, it is unlikely that crystal fractionation incrustal or subcrustal magma chambers is creating the observedincrease in Th excess with decreasing Mg#. There is someevidence to suggest that crystallization of apatite during magmadifferentiation could fractionate U from Th. However, it isunlikely that the large 230Th excesses observed in these sam-ples can be explained by apatite crystallization, particularlysince apatite is not on the solidus for these samples. Apatitedoes not start to crystallize until the P2O5 concentration is at�0.5 wt.% in basaltic liquids; our samples have P2O5 � 0.25wt.%. High F contents in a magma can stabilize the formationof apatite at lower levels of P2O5 concentration, but this is alsounlikely, as correlations between P2O5 and TiO2 and MgO andP2O5 indicate that P was behaving as an incompatible elementin this suite of magmas. Furthermore, apatite has a very highDTh/DU ratio, and its crystallization in the magmas would drivethe liquids toward 238U excesses rather than 230Th excesses, asobserved.
4.3.3. Effect of plagioclase fractionation on 226ra/230th
Plagioclase contains limited amounts of Ra, but negligibleamounts of U and Th (Blundy and Wood, 1994; Cooper et al.,2000). Therefore, in principle, plagioclase fractionation canfractionate Ra from Th, which would change the measured226Ra/230Th activity ratio. Crystallization and retention of pla-gioclase in the axial chamber during magma storage and dif-ferentiation could decrease the measured 226Ra/230Th ratio, asobserved. Like Ra, Ba is also an alkaline earth and is thoughtto be even more compatible than Ra during plagioclase frac-tionation (Blundy and Wood, 1994; Dunn and Sen, 1994;Cooper et al., 2000). Therefore, Ba/Th can be used to assess theeffects of plagioclase fractionation on the measured 226Ra/230Th ratio. Among our axial 9 to 10°N samples, there is �20%variation in Ba/Th, with Ba/Th decreasing slightly with de-creasing Mg#. If this variation is attributed to plagioclasefractionation and one assumes that the crystal/liquid partitioncoefficient, DBa, is equal to DRa for plagioclase/liquid, then the226Ra/230Th ratio in the more fractionated samples could bereduced by as much as 20%. This value is half the observedrange in 226Ra excess in our samples (�42%). Furthermore,recent evidence indicates that Ra is much less compatible thanBa in plagioclase (DBa � 4 DRa) (Blundy and Wood, 1994;Goldstein et al 1999; Cooper et al 2000). This evidence sug-gests that the large variation observed in 226Ra excesses cannotbe produced by plagioclase fractionation.
4.3.4. Influence of crustal magma storage times on U-SERIES disequilibria
For our axial 9 to 10°N lava suite, there are currently twoestimates of magma storage time. These estimates range from�2 yr, based on crystal growth rates from Kilauea Iki andplagioclase zonation in lavas from the EPR around 9o31'N(Brophy and Allan, 1993), to as much as 10 ka, based onthermal modeling of a large, hydrothermally cooled AMC(Lister, 1983).
If 226Ra/230Th is produced by the melting process, then the
3495Melt generation and transport beneath the East Pacific Rise
large 226Ra excesses measured in these samples limit thecrustal magma storage time to be less than or similar to thehalf-life of 226Ra (1.6 ka). This length of time is small com-pared to the half-lives of 230Th and 231Pa, indicating that theU-Th and U-Pa disequilibrium activity ratios of these sampleshave not decayed significantly as a result of magma storagetimes.
If it is assumed that all our axial lava samples started with thesame initial 226Ra ratio and Mg# before differentiation, thecorrelation between 226Ra excess and Mg# for this sample suitecan, in principle, be used to estimate the time scales of crustalmagma differentiation. Using a linear relationship betweenmagma storage time and the extent of crystallization, magmastorage times can be determined by extrapolation of the corre-lation between 226Ra excess and Mg# back to an assumedprimitive magma composition (Mg# 71). For our entire axial 9to 10°N data set, we calculate an initial 226Ra excess of 3.1 andmagma storage times of �300 to 2000 yr for a closed-systemfractional crystallization model and �150 to 900 yr for asteady-state, open-system magma storage model (e.g., Pyle,1992, 1994; Condomines, 1994). Note that if crystallizationrates are nonlinear and increase with extent of crystallization,then modeled magma storage times will be longer than thosedetermined for the linear crystallization rate model. On theother hand, if 226Ra excesses have been reduced by plagioclasecrystallization, magma storage times would be smaller thanestimated.
Finally, it is important to note that it is a primary assumptionfor the above-modeled crustal magma storage times that allprimary melts started with uniform 226Ra and Mg#. The ob-servation that 230Th excesses increase with decreasing Mg#
suggests that these lavas started out with different initial 230Thexcesses and, by inference, different 226Ra excesses. If some orall of the variation is due to the melting process, then the crustalmagma storage times would be substantially smaller than cal-culated. The possibility that the observed variations in 230Thand 226Ra excesses (and Mg#) are due to the melt generationand transport processes is discussed in detail in the followingsection.
4.4. U-Series Constraints on Melting Process
A fundamental feature of our data on axial 9 to 10°N lavasis that 230Th/238U and 226Ra/230Th are variable and negativelycorrelated. While other MORB data have shown similar trendsbetween 226Ra and 230Th excesses, a lack of constraints on themantle source composition and the large uncertainties in sam-ple eruption ages and magma storage times have made itdifficult to interpret the 226Ra data in terms of melting pro-cesses (Volpe and Goldstein, 1993; Lundstrom et al., 1998,1999). The significance of the observed negative correlationbetween 226Ra and 230Th in the axial 9 to 10°N data is that (a)all of these samples are known to have erupted within or justoutside the axial summit trough, and their ages are demonstra-bly very young; (b) these lavas come from a homogeneousmantle source, as indicated by their Sr, Nd, Hf, and Pb isotoperatios; and (c) there is considerable evidence precluding theinfluence of water-rock interaction, assimilation of alteredcrust, or secondary minerals or crystallization on their mea-sured 230Th and 226Ra excesses.
Understanding the large 230Th, 231Pa, and 226Ra excessesmeasured in our sample suite require models that incorporatethe time scales of melt generation and transport. However,neither dynamic nor pure reactive porous flow models canproduce the observed negative correlation between 230Th and226Ra excesses. Melts produced by dynamic melting have pos-itively correlated 230Th and 226Ra excesses, whereas meltsproduced by reactive porous flow to shallow levels would haveno 230Th excesses, since DU � DTh in the shallow mantle.
The negative correlation of 226Ra and 230Th excesses re-quires that two different processes generate these excesses inthe melting column. This is possible if two different pathwaysexist for moving melt to the surface, with one pathway beingreactive transport through low-porosity matrix and the other
Fig. 12. (A) Mg# vs. Cl/K, (B) 230Th excess vs. Cl/K, and (C) 226Raexcess vs. Cl/K for the axial 9 to 10°N and Siqueiros Transformsamples. EPR � East Pacific Rise.
3496 K. W. Sims et al.

being nonreactive transport through high-porosity channels(Iwamori, 1993; Kelemen et al., 1997; Sims et al., 1998;Lundstrom et al., 2000; Jull et al submitted). The high-porositypathways are envisaged to result from a “ reactive infiltrationinstability,” resulting in the localization of initially diffuse meltflow due to increased solubility of pyroxene at shallow depths(Kelemen et al., 1997; Spiegelman et al., 2001). Both Lund-strom et al. (2000) and Jull et al. (submitted) have modeled theconsequence of this “ two-porosity” melt transport mode onU-series disequilibria and trace element systematics. In thesemodels, they assumed that melt is transferred from the low-porosity interchannel region to the high-porosity channels as itmoves upward through the melting column. The results of Jullet al.’s (submitted) modeling show that these 9 to 10°N EPRdata can be explained by a two-porosity model if �60% of thetotal melt flux travels through the low-porosity region, and�40% travels through high-porosity channels that occupy�10% of the melting region. Mixing of melt from these twodifferent pathways at the top of the melt column can producethe observed negative slope and magnitude of 226Ra and 230Thexcesses, as well as the trace element systematics in MORB.Furthermore, Jull et al. (submitted) show that increased effi-ciency of melt transfer in the shallow mantle to the high-porosity channels can account for the depleted trace elementconcentrations observed in some abyssal peridotites and ex-plain the lack of orthopyroxene saturation in MORB. On thebasis of the numerical results of Jull et al. (submitted), we inferthat melt transport beneath the axial 9 to 10°N area of the EPRoccurs via both low-porosity reactive transport and high-poros-ity nonreactive transport and that the erupted magmas representmixtures of melts from these different regions. While notmodeled by Jull et al. (submitted), we suggest that the relativelyconstant 231Pa excesses in our samples are consistent with thismelt transport scenario. A constant 231Pa excess with increas-ing 230Th excess is because Pa and Th maintain DPa � DTh atshallow levels in the mantle, and the half-life of 231Pa is longcompared to that of 226Ra. As a result, 231Pa is maintainedalong both the low-porosity pathways and the high-porositychannels.
The major and trace element compositions of our samplesalso support the hypothesis that these lavas represent mixturesof melts equilibrated at different depths. This hypothesis isconsistent with our previous observations of Sm/Nd and U-Thdisequilibria in axial basalts from the Juan de Fuca and Gordaridges, which we interpreted as mixing of large and smalldegree partial melts (Sims et al., 1995). For the 9°N EPRsamples, we suggest that deep melts equilibrated with lessdepleted lherzolite near the base of the melting column, andshallow melts equilibrated with highly depleted harzburgitenear the top. Although the range of variability in the major andtrace element concentrations is limited compared to the analyt-ical uncertainties, 230Th excesses tend to be inversely corre-lated with the “degree of partial melting” as inferred fromLa/Yb, Sm/Nd, and Na8. In contrast, 226Ra excesses tend toincrease with the inferred “degree of melting,” opposite to thetrend expected for fractional melting. As discussed below,these trends are better correlated and greatly extended whendata from very depleted MORB from the Siqueiros Transformare also considered.
Finally, the correlation observed between 230Th and 226Ra
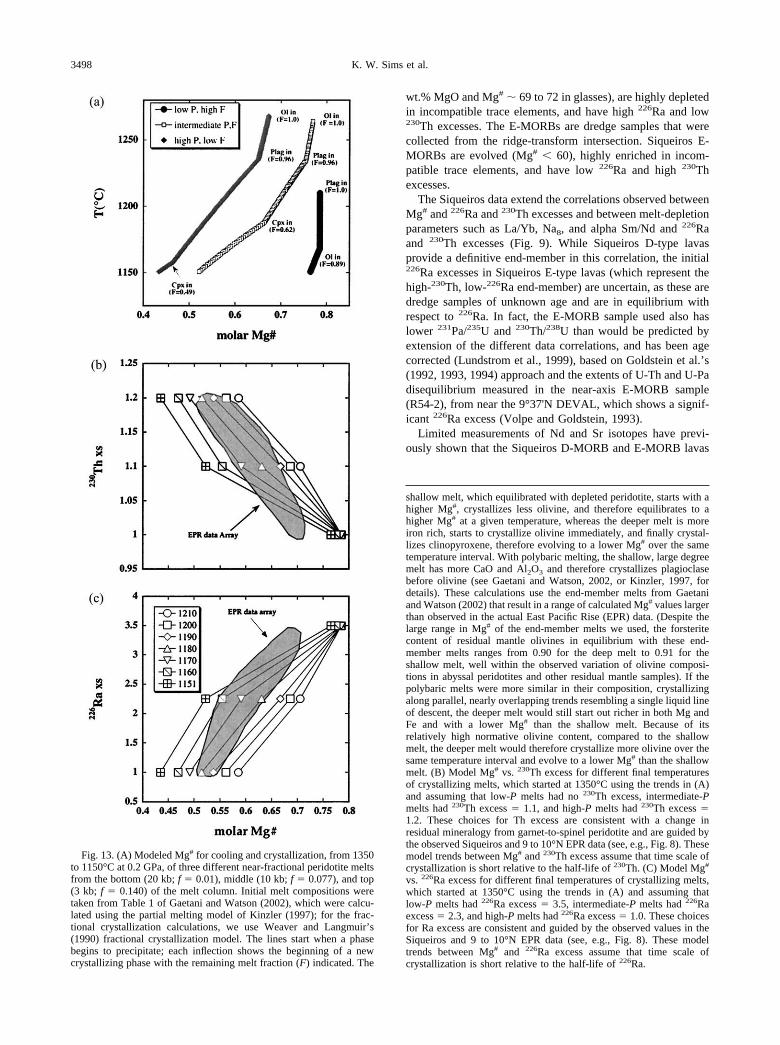
excesses and Mg# of these samples can also be explained by themixing of deep and shallow melts. Because primary meltsgenerated at variable depths have different compositions thatevolve along distinct liquid lines of descent, the differences incrystallization that occur during cooling results in a large rangeof Mg# for a given temperature. This is illustrated in Figure 13,which shows the predicted Mg# for cooling and crystallizationfrom 1350 to 1200°C of three different calculated melt com-positions from the bottom, middle, and top of the melt column(calculated from Gaetani and Watson, 2002). Because the shal-low melt equilibrated with depleted peridotite, it starts with ahigher Mg# compared to the deeper melt. Also, the shallowmelt is closer to its liquidus conditions at the base of the crust;as a result, it crystallizes less olivine and evolves to a higherMg# over a given temperature interval. The deeper melt is wellbelow its liquidus temperature at the base of the crust, starts tocrystallize olivine substantially earlier, and eventually crystal-lizes clinopyroxene; as a result of crystallizing both moreolivine and clinopyroxene, this deeper melt evolves to a lowerMg# over the same temperature interval. If it is assumed thatthe time scale of crystallization is short compared to the half-lives of 230Th and 226Ra, then these differences in model Mg#
values, for a given temperature of final crystallization, whencompared with the 230Th and 226Ra excesses of the SiqueirosE-MORB, D-MORB, and the average 9 to 10°N EPR N-MORB, produce trends that are similar to the correlationsbetween Mg# and 230Th excess and 226Ra excess observed inthe EPR data (Figs. 13B and 13C). The ability of this model toreproduce these correlations between Mg# and 230Th and 226Raexcesses suggests that (a) not all MORBs start with the sameprimary Mg#, (b) the average time scale of crystallization isshort compared to the half-life of 226Ra, and (c) the long-heldobservation that the most light rare earth element–enrichedMORB samples are also the ones with the lowest Mg# (Bryanet al., 1979, 1981; Perfit et al., 1994) can be explained by asimple and self-consistent model of mixing of melts taken fromdifferent depths.
5. COMPARISON BETWEEN AXIAL 9 TO 10°N LAVASAND SIQUEIROS TRANSFORM SAMPLES
Samples collected using Alvin and by dredge from theSiqueiros Transform at 8°20'N constitute an important data set,as they represent rocks from the first second-order discontinuitysouth of the EPR segment where our axial lava suite wascollected. The Siqueiros samples form both depleted and en-riched end-members of the global correlation between 230Thand 226Ra excesses in MORB.
The Siqueiros Transform is a left-lateral offset along theEPR with a displacement of 140 km, along which are fourintratransform spreading centers (Fornari et al., 1989). TheSiqueiros samples analyzed in this study and by Lundstrom etal. (1998), Perfit et al. (1996), and Natland (1989) are petro-logically and compositionally diverse. Glass compositionsrange from incompatible element–depleted “picritic” basalts,called “D-MORBs,” containing �9 wt.% MgO, to slighlynepheline-normative alkali basalts, termed “E-MORBs.” TheD-MORBs are very young–appearing, glassy basalts collectedby Alvin from a site in the middle of the A-B transform (Perfitet al., 1996). They represent near-primary, high-MgO melts (10
3497Melt generation and transport beneath the East Pacific Rise
wt.% MgO and Mg# � 69 to 72 in glasses), are highly depletedin incompatible trace elements, and have high 226Ra and low230Th excesses. The E-MORBs are dredge samples that werecollected from the ridge-transform intersection. Siqueiros E-MORBs are evolved (Mg# � 60), highly enriched in incom-patible trace elements, and have low 226Ra and high 230Thexcesses.
The Siqueiros data extend the correlations observed betweenMg# and 226Ra and 230Th excesses and between melt-depletionparameters such as La/Yb, Na8, and alpha Sm/Nd and 226Raand 230Th excesses (Fig. 9). While Siqueiros D-type lavasprovide a definitive end-member in this correlation, the initial226Ra excesses in Siqueiros E-type lavas (which represent thehigh-230Th, low-226Ra end-member) are uncertain, as these aredredge samples of unknown age and are in equilibrium withrespect to 226Ra. In fact, the E-MORB sample used also haslower 231Pa/235U and 230Th/238U than would be predicted byextension of the different data correlations, and has been agecorrected (Lundstrom et al., 1999), based on Goldstein et al.’s(1992, 1993, 1994) approach and the extents of U-Th and U-Padisequilibrium measured in the near-axis E-MORB sample(R54-2), from near the 9°37'N DEVAL, which shows a signif-icant 226Ra excess (Volpe and Goldstein, 1993).
Limited measurements of Nd and Sr isotopes have previ-ously shown that the Siqueiros D-MORB and E-MORB lavas
Fig. 13. (A) Modeled Mg# for cooling and crystallization, from 1350to 1150°C at 0.2 GPa, of three different near-fractional peridotite meltsfrom the bottom (20 kb; f � 0.01), middle (10 kb; f � 0.077), and top(3 kb; f � 0.140) of the melt column. Initial melt compositions weretaken from Table 1 of Gaetani and Watson (2002), which were calcu-lated using the partial melting model of Kinzler (1997); for the frac-tional crystallization calculations, we use Weaver and Langmuir’s(1990) fractional crystallization model. The lines start when a phasebegins to precipitate; each inflection shows the beginning of a newcrystallizing phase with the remaining melt fraction (F) indicated. The
shallow melt, which equilibrated with depleted peridotite, starts with ahigher Mg#, crystallizes less olivine, and therefore equilibrates to ahigher Mg# at a given temperature, whereas the deeper melt is moreiron rich, starts to crystallize olivine immediately, and finally crystal-lizes clinopyroxene, therefore evolving to a lower Mg# over the sametemperature interval. With polybaric melting, the shallow, large degreemelt has more CaO and Al2O3 and therefore crystallizes plagioclasebefore olivine (see Gaetani and Watson, 2002, or Kinzler, 1997, fordetails). These calculations use the end-member melts from Gaetaniand Watson (2002) that result in a range of calculated Mg# values largerthan observed in the actual East Pacific Rise (EPR) data. (Despite thelarge range in Mg# of the end-member melts we used, the forsteritecontent of residual mantle olivines in equilibrium with these end-member melts ranges from 0.90 for the deep melt to 0.91 for theshallow melt, well within the observed variation of olivine composi-tions in abyssal peridotites and other residual mantle samples). If thepolybaric melts were more similar in their composition, crystallizingalong parallel, nearly overlapping trends resembling a single liquid lineof descent, the deeper melt would still start out richer in both Mg andFe and with a lower Mg# than the shallow melt. Because of itsrelatively high normative olivine content, compared to the shallowmelt, the deeper melt would therefore crystallize more olivine over thesame temperature interval and evolve to a lower Mg# than the shallowmelt. (B) Model Mg# vs. 230Th excess for different final temperaturesof crystallizing melts, which started at 1350°C using the trends in (A)and assuming that low-P melts had no 230Th excess, intermediate-Pmelts had 230Th excess � 1.1, and high-P melts had 230Th excess �1.2. These choices for Th excess are consistent with a change inresidual mineralogy from garnet-to-spinel peridotite and are guided bythe observed Siqueiros and 9 to 10°N EPR data (see, e.g., Fig. 8). Thesemodel trends between Mg# and 230Th excess assume that time scale ofcrystallization is short relative to the half-life of 230Th. (C) Model Mg#
vs. 226Ra excess for different final temperatures of crystallizing melts,which started at 1350°C using the trends in (A) and assuming thatlow-P melts had 226Ra excess � 3.5, intermediate-P melts had 226Raexcess � 2.3, and high-P melts had 226Ra excess � 1.0. These choicesfor Ra excess are consistent and guided by the observed values in theSiqueiros and 9 to 10°N EPR data (see, e.g., Fig. 8). These modeltrends between Mg# and 226Ra excess assume that time scale ofcrystallization is short relative to the half-life of 226Ra.
3498 K. W. Sims et al.

come from isotopically distinct sources (Natland, 1989; Perfitet al., 1996). Here, we report additional measurements of Nd,Hf, Sr, and Pb isotopes for Siqueiros lava samples (Table 2 andFigs. 2 to 4 and 10A to 10D). These data show that theD-MORBs have Nd, Hf, Sr, and 208Pb/206Pb isotopic ratios thatare similar to our axial 9 to 10°N lava suite, whereas the oneanalyzed Siqueiros E-MORB sample clearly comes from anisotopically distinct and more enriched source. This wouldsuggest that melting and melt transport processes control thevariation observed in 230Th and 226Ra excesses for our both ouraxial 9 to 10°N suite and the Siqueiros D-MORB but that thevariation observed in the 230Th excesses for the E-MORB lavamight be attributable to melting of a chemically distinct source.
The Pb isotopic data for the Siqueiros samples, consideredindependently of our axial 9 to 10°N data, show a single array,which if interpreted in terms of a single- or two-stage Pbevolution model indicates that all the Siqueiros samples comefrom a source with a relatively constant Th/U ratio and variableU/Pb and Th/Pb ratios. However, the Siqueiros trend for thethorogenic and uranogenic Pb isotopes, 208Pb/204Pb vs. 206Pb/204Pb, is different from the trend formed by our axial 9 to 10°Ndata. On the basis of these data, one could infer that Th/U in theSiqueiros source is different from Th/U in the axial 9 to 10°Nsource. However, as indicated by the 208Pb/206Pb ratio of thesesamples, the range in Th/U inferred from the Pb isotopes forboth the D-MORBs and the axial 9 to 10°N N-MORBs is muchsmaller than the range in Th/U observed within the combinedSiqueiros and axial 9 to 10°N data sets. This suggests that mostof the variability in Th/U in this region must be due to elemen-tal fractionation during melting and melt transport rather thansource composition.
6. CONCLUSIONS
1. In very young lava samples collected using Alvin fromwithin the axial trough between 9°28' and 9°52'N, 230Thexcesses and 226Ra excesses are inversely correlated andvary with the major and trace element composition
2. These variations are not due to crustal processes such asassimilation of altered material or crystallization of apatiteor plagioclase
3. Axial 9 to 10°N samples have constant 143Nd/144Nd, 87Sr/86Sr, 176Hf/177Hf, and 208Pb/206Pb isotopic compositionsSiqueiros D-MORBs have 143Nd/144Nd, 87Sr/86Sr, 176Hf/177Hf, and 208Pb/206Pb isotopic ratios that are the same asaxial 9 to 10°N lavas. This observation suggests that themeasured variations of Th/U, 230Th, and 226Ra excesses andmajor and trace element compositions in both the axial 9 to10°N and Siqueiros D-MORB samples are not due to mix-ing of variable source compositions.
4. The one Siqueiros E-MORB sample analyzed clearly comesfrom an isotopically distinct and more enriched source thanthe axial 9 to 10°N samples and the Siqueiros D-MORB Thechemical differences between the Siqueiros E-MORB andthe other samples may be due in part to melting of achemically and isotopically distinct source.
5. The observed correlations between 230Th excess, 226Ra ex-cess, Mg#, La/Yb, alpha Sm/Nd, and Na8 suggest mixing oftwo types of melt: one having a high 226Ra excess and theother a high 230Th excess In this context, the high 226Ra
component preserves characteristics indicative of equilibra-tion with highly depleted, residual harzburgite in the upper-most (spinel facies) mantle, whereas the high 230Th compo-nent equilibrated with deeper, less depleted garnetperidotites. This suggests that melt transport requires somereactive process to produce the low-230Th, high-226Ra com-ponent at shallow depths. Furthermore, it would appear thatthe low 226Ra excess in the high 230Th component reflects226Ra decay before eruption (e.g., during magma transportand/or storage).
Acknowledgments—The authors thank Mark Reagan and Glenn Gaet-ani for invaluable discussions and Craig Lundstrom, Simon Turner,Tim Elliott, Haibou Zou, and Ken Rubin for constructive reviews.Support for this research was provided by a Woods Hole Oceano-graphic Institution postdoctoral fellowship (K. W. Sims); NataionlScience Foundation grants OCE-9730967 (K. W. Sims), OCE-9100503(M. R. Perfit and D. J. Fornari), OCE-9402360 and OCE-9403773(M. R. Perfit), and OCE-9408904 and OCE-9912072 (D. J. Fornari);and from Basic Energy Science, U.S. Department of Energy (M. T.Murrell and S. J. Goldstein).
Associate editor: F. A. Frey
REFERENCES
Bateman H. (1910) Solution of a system of partial differential equationsoccurring in the theory of radioactive transformations. Proc. Cam-bridge Philos. Soc. 15, 423.
Batiza R. and Niu Y. (1992) Petrology and magma chamber processesat the East Pacific Rise—9°30'N. J. Geophys. Res. 97, 6779–6797.
Beattie P. (1993a) Uranium-thorium disequilibria and partitioning onmelting of garnet peridotite. Nature 363, 63–65.
Beattie P. (1993b) The generation of uranium series disequilibria bypartial melting of spinel peridotite: Constraints from partitioningstudies. Earth Planet. Sci. Lett. 117, 379–391.
Ben Othman D. and Allegre C. J. (1990) U-Th isotopic systematics at13°N East Pacific Ridge segment. Earth Planet. Sci. Lett. 98, 129–137.
Blichert-Toft J., Chauvel C., and Albarede F. (1997) Separation of Hfand Lu for high-precision isotope analysis of rock samples bymagnetic sector-multiple collector ICP-MS. Contrib. Mineral.Petrol. 127, 248–260.
Blundy J. and Wood B. (1994) Prediction of crystal-melt paritioncoefficients from elastic moduli. Nature 372, 452–454.
Bourdon B., Zindler A., Elliott T., and Langmuir C. H. (1996) Con-straints on mantle melting at mid-ocean ridges from global 238U-230Th disequilibrium data. Nature 384, 231–235.
Bourdon B. Goldstein S. J. Murrell M. T. Bourles D. Langmuir C. H.2000Evidence from 10Be and U-series disequilibria on possiblecontamination of mid-ocean ridge basalt glasses by sedimentarymaterial. Geochem. Geophys. Geosys. 1 (paper number2000GC000047).
Boudier F. and Nicolas A. (1995) Nature of the Moho transition zonein the Oman ophiolite. J. Petrol. 36,777–796. .
Brophy J. G. Allan J. F. 1993Textural and mineralogic studies ofplagioclase phenocrysts from ODP Leg 142, Site 864A: Implicationsfor magmatic processes beneath the East Pacific Rise (EPR) 9o30'N.Trans. Am. Geophys. Union, Fall Meeting Suppl., 74, 644.
Bryan W. B., Thompson G., and Michael P. J. (1979) Compositionalvariation in a steady-state zoned magma chamber: Mid-AtlanticRidge at 36°50'N. Tectonphysics 55, 63–85.
Bryan W. B., Thompson G., and Ludden J. N. (1981) Compositionalvariation in normal mid-ocean ridge basalts from 22-25N: Mid-Atlantic Ridge and Kane Fracture Zone. J. Geophys. Res. 86, 11815–11836.
Carbotte S. M. and Macdonald K. C. (1992) East Pacific Rise 8°-10°30'N: Evolution of ridge segments and discontinuities from Sea-MARC II and three-dimensional magnetic studies. J. Geophys. Res.97, 6959–6982.
3499Melt generation and transport beneath the East Pacific Rise

Cochran J. R., Fornari D. J., Coakley B. J., Herr R., and Tivey M. A.(1999) Continuous near-bottom gravity measurements made with aBGM-3 gravimeter in DSV Alvin on the East Pacific Rise crest near9°30'N and 9°50'N. J. Geophys. Res. 104, 10841–10861.
Condomines M. (1994) Comment on: “The volume and residence timeof magma beneath active volcanoes determined by decay-seriesdisequilibria methods.” Earth Planet. Sci. Lett. 122, 251–255.
Condomines M.and Sigmarsson O. (2000) 238U-230Th disequilibria andmantle melting processes: A discussion. Chem. Geol. 162, 95-104.
Condomines M., Hemmond C., and Allegre C. J. (1988) U-Th-R adisequilibria and magmatic processes. Earth Planet. Sci. Lett. 90,243–263.
Cooper K. M., Reid M. R., Murrell M. T., and Clague D. A. (2000)Crystal and magma residence at Kilauea volcano, Hawaii: 230Th-226Ra dating of the 1955 east rift eruption. Earth Planet. Sci. Lett.5692, 1–16.
DePaolo D. J. (1988) Neodymium Isotope Geochemistry. Springer-Verlag, New York.
DePaolo D. J. (1996) High-frequency isotopic variations in the MaunaKea tholeiitic basalt sequence: Melt zone dispersivity and chroma-tography. J. Geophys. Res. 101, 11855–11864.
Detrick R. S., Buhl P., Vera E., Orcutt J., Madsen J., and Brocher T.(1987) Multi-channel seismic imaging of a crustal magma chamberalong the East Pacific Rise. Nature 326, 35–41.
Dick H. J. B., Fisher R. L., and Bryan W. B. (1984) Mineralogicvariability of the uppermost mantle along mid-ocean ridges. EarthPlanet. Sci. Lett. 69, 88–106.
Dunn T. and Sen C. (1994) Mineral/matrix partition coefficients fororthopyroxene, plagioclase, and olivine in basaltic to andesitic sys-tem: A combined analytical and experimental study. Geochim. Cos-mochim. Acta 58, 717–733.
Dunn R. A., Toomey D. R., and Solomon S. C. (2000) Three dimen-sional seismic structure and physical properties of the crust andshallow mantle beneath the East Pacific Rise at 9°30'N. J. Geophys.Res. 105, 23537–23555.
Elliott T., Zindler A., and Bourdon B. (1999) Exploring the kappaconundrum: The role of recycling in the lead isotope evolution of themantle. Earth Planet. Sci. Lett. 169, 129–145.
Fornari D. J., Gallo D. G., Edwards M. H., Madsen J. A., Perfit M. R.,and Shor A. N. (1989) Structure and topography of the SiqueirosTransform fault system: Evidence for the development of intra-transform spreading centers. Mar. Geophys. Res. 11, 263–299.
Fornari D., Haymon R., Perfit M., Gregg T. K. P., and Edwards M. H.(1998) Axial summit trough of the East Pacific Rise, 9°-10°N:Geological characteristics and evolution of the axial zone on fastspreading mid-ocean ridges. J. Geophys. Res. 103, 9827–9855.
Forsyth D. W. 1992Geophysical constraints on mantle flow and meltgeneration beneath mid-ocean ridges. In Mantle Flow and MeltGeneration at Mid-Ocean Ridges (eds. J. P. Morgan, D. K. Black-man, and J. M. Sinton). Geophys. Monogr. 71, 1–67. AmericanGeophysical Union, Washington, DC.
Galer S. J. G. and O’Nions R. K. (1985) Residence time of thorium,uranium and lead in the mantle with implications for mantle con-vection. Nature 316, 778–782.
Galer S. J. G., Abouchami W., and Macdougall J. D. (2000) Pb isotopicevidence for coherent mantle domains beneath the East Pacific Rise.J. Conf. Abst. 5, (2) 421 (abstract).
Gaetani G. A. and Watson E. B. (2002) Modeling the major-elementevolution of olivine-hosted melt inclusions. Chem. Geol. 183, 25–41.
Goldstein S. J., Murrell M. T., and Janecky D. R. (1989) Th and Uisotopic systematics of basalts from the Juan de Fuca and GordaRidges by mass spectrometry. Earth Planet. Sci. Lett. 96, 134–146.
Goldstein S. J., Murrell M. T., Janecky D. R., Delaney J. R., andClague D. A. (1992) Geochronology and petrogenesis of MORBfrom the Juan de Fuca and Gorda ridges by 238U-230Th disequilib-rium. Earth Planet. Sci. Lett. 107, 25–41.
Goldstein S. J., Murrell M. T., and Williams R. W. (1993) 231Pa and230Th chronology of mid-ocean ridge basalts. Earth Planet. Sci. Lett.115, 151–160.
Goldstein S. J., Perfit M. R., Batiza R., Fornari D. J., and Murrell M. T.(1994) Off-axis volcanism at the East Pacific Rise detected byuranium-series dating of basalts. Nature 367, 157–159.
Goldstein S. J. Sims K. W. Cooper K. Murrell M. T. Nunn A. J. (1999)Evidence for radium-barium rractionation in MORB plagioclase:Implications for chronology and mantle melting. Ninth Annual V. M.Goldschmidt Conference, Cambridge, MA.
Grove T. L. and Bryan W. B. (1983) Fractionation of pyroxene-phyricMORB at low pressures: An experimental study. Contrib. Mineral.Petrol. 84, 293–309.
Haymon R. M., Fornari D. J., Edwards M. H Carbotte S. C., Wright D.,and Macdonald K. C. (1991) Hydrothermal vent distribution alongthe East Pacific Rise Crest (9°09'-54'N) and its relationship tomagmatic and tectonic processes on fast-spreading mid-ocean ridges.Earth Planet. Sci. Lett. 104, 513–534.
Haymon R., Fornari D. J., Von Damm K., Lilley M., Perfit M., EdmondJ., Shank III W. C., Lutz R., Grebmeier J., Carbotte S., Wright D.,McLaughlin E., Smith M., Beedle N., and Olson E. (1993) Volcaniceruption of the mid-ocean ridge along the East Pacific at 9°45-52'N: I.Direct submersible observation of sea floor phenomena associated withan eruption event in April, 1991. Earth Planet. Sci. Lett. 119, 85–101.
Holmes A. (1946) An estimate of the age of the Earth. Nature 157,680–684.
Houtermans F. G. (1946) Die Isotopenhaufigkeiten im naturlichen Bleiund das Alter des Urans. Naturwissenschaften 33, 185–186.
Iwamori H. (1993) A model for disequilibrium mantle melting incor-porating melt transport by porous and channel flows. Nature 366,734–737.
Iwamori H. (1994) 238U-230Th-226Ra and 235U-231Pa disequilibriaproduced by mantle melting with porous and channel flows. EarthPlanet. Sci. Lett. 125, 1016.
Johnson K. T. M. and Dick H. J. B. (1992) Open system melting andtemporal and spatial variation of peridotite and basalt at the AtlantisII fracture zone. J. Geophys. Res. 97, 9219–9241.
Johnson K. T. M., Dick H. J. B., and Shimizu N. (1990) Melting in theoceanic upper mantle: An ion microprobe study of diopsides inabyssal peridotites. J. Geophys. Res. 95, 2661–2678.
Jull M. Kelemen P. B. Sims K. W. (submitted) Consequences of diffuseand channeled porous melt migration on U Series disequilibria.Geochim. Cosmochim. Acta.
Kelemen P. B., Shimizu N., and Salters V. J. M. (1995) Extraction ofmid-ocean-ridge basalt from the upwelling mantle by focused flowof melt in dunite channels. Nature 375, 747–753.
Kelemen P. B., Hirth G., Shimizu N., Spiegelman M., and Dick H. J. B.(1997) A review of melt migration processes in the adiabaticallyupwelling mantle beneath oceanic spreading ridges. Philos. Trans. R.Soc. London, Ser. A 355, 1–35.
Ken G. M., Harding A. J., and Orcutt J. A. (1990) Evidence for asmaller magma chamber beneath the East Pacific Rise at 9°30'N.Nature 344, 650–653.
Kinzler R. J. (1997) Melting of mantle peridotite at pressures approach-ing the spinel to garnet transition: Application to mid-ocean ridgebasalt petrogenesis. J. Geophys. Res. 102, 853–874.
Klein E. M. and Langmuir C. H. (1987) Global correlations of oceanridge basalt chemistry with axial depth and crustal thickness. J.Geophys. Res. 92, 8089.
Ku T. -L., Knauss K. G., and Mathieu G. G. (1977) Uranium in openocean: Concentration and isotopic composition. Deep Sea Res. 24,1005–1017.
Landwehr D., Blundy J., Chamorro-Perez E. M., Hill E., and Wood B.(2001) U-series diisequilibria generated by partial melting of spinellherzolite. Earth Planet Sci. Lett. 188, 329–348.
Langmuir C. H., Bender J. F., Bence A. E., Hanson G. N., and TaylorS. R. (1977) Petrogenesis of basalts from the FAMOUS area: Mid-Atlantic Ridge. Earth Planet Sci. Lett. 36, 133–156.
Langmuir C. H., Bender J. F., and Batiza R. (1986) Petrologicalsegmentation of the East Pacific Rise, 5°30'-14°30'N. Nature 322,422–429.
Langmuir C. H. Klein E. M. Plank T. M. 1992Petrological systematicsof mid-ocean ridge basalts: Constraints on melt generation beneathocean ridges. In Mantle Flow and Melt Generation at Mid-OceanRidges (eds. J. P. Morgan, D. K. Blackman, and J. M. Sinton).Geophys. Monogr. 71, 1–67. American Geophysical Union, Wash-ington, DC.
3500 K. W. Sims et al.
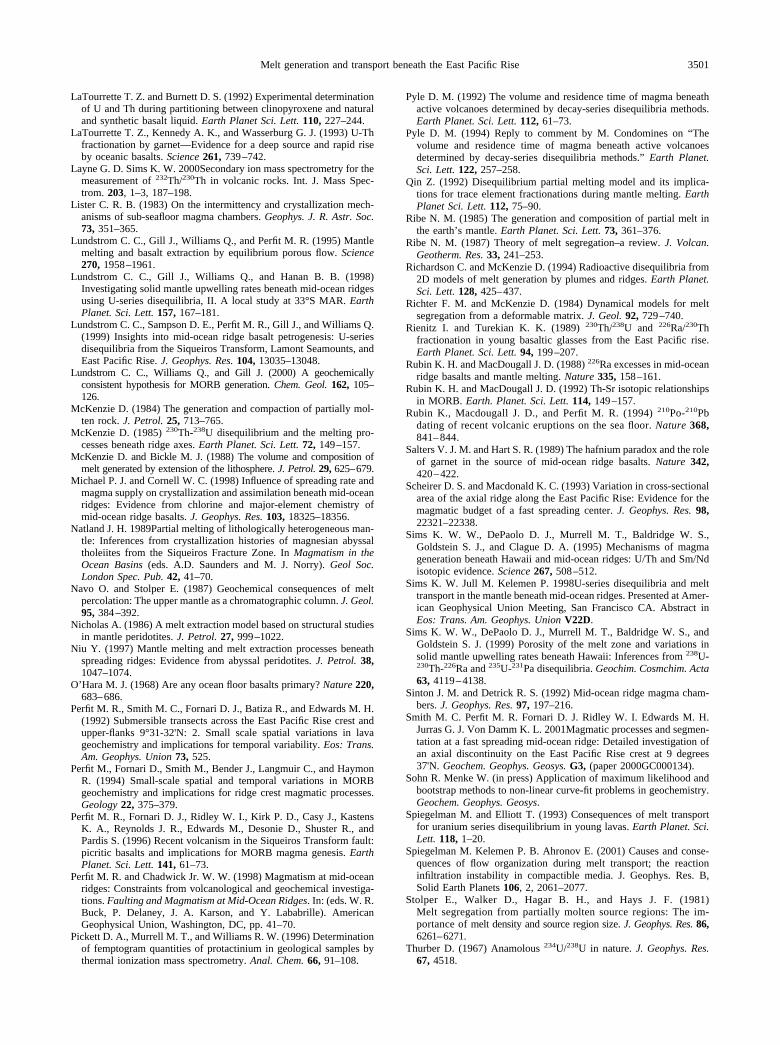
LaTourrette T. Z. and Burnett D. S. (1992) Experimental determinationof U and Th during partitioning between clinopyroxene and naturaland synthetic basalt liquid. Earth Planet Sci. Lett. 110, 227–244.
LaTourrette T. Z., Kennedy A. K., and Wasserburg G. J. (1993) U-Thfractionation by garnet—Evidence for a deep source and rapid riseby oceanic basalts. Science 261, 739–742.
Layne G. D. Sims K. W. 2000Secondary ion mass spectrometry for themeasurement of 232Th/230Th in volcanic rocks. Int. J. Mass Spec-trom. 203, 1–3, 187–198.
Lister C. R. B. (1983) On the intermittency and crystallization mech-anisms of sub-seafloor magma chambers. Geophys. J. R. Astr. Soc.73, 351–365.
Lundstrom C. C., Gill J., Williams Q., and Perfit M. R. (1995) Mantlemelting and basalt extraction by equilibrium porous flow. Science270, 1958–1961.
Lundstrom C. C., Gill J., Williams Q., and Hanan B. B. (1998)Investigating solid mantle upwelling rates beneath mid-ocean ridgesusing U-series disequilibria, II. A local study at 33°S MAR. EarthPlanet. Sci. Lett. 157, 167–181.
Lundstrom C. C., Sampson D. E., Perfit M. R., Gill J., and Williams Q.(1999) Insights into mid-ocean ridge basalt petrogenesis: U-seriesdisequilibria from the Siqueiros Transform, Lamont Seamounts, andEast Pacific Rise. J. Geophys. Res. 104, 13035–13048.
Lundstrom C. C., Williams Q., and Gill J. (2000) A geochemicallyconsistent hypothesis for MORB generation. Chem. Geol. 162, 105–126.
McKenzie D. (1984) The generation and compaction of partially mol-ten rock. J. Petrol. 25, 713–765.
McKenzie D. (1985) 230Th-238U disequilibrium and the melting pro-cesses beneath ridge axes. Earth Planet. Sci. Lett. 72, 149–157.
McKenzie D. and Bickle M. J. (1988) The volume and composition ofmelt generated by extension of the lithosphere. J. Petrol. 29, 625–679.
Michael P. J. and Cornell W. C. (1998) Influence of spreading rate andmagma supply on crystallization and assimilation beneath mid-oceanridges: Evidence from chlorine and major-element chemistry ofmid-ocean ridge basalts. J. Geophys. Res. 103, 18325–18356.
Natland J. H. 1989Partial melting of lithologically heterogeneous man-tle: Inferences from crystallization histories of magnesian abyssaltholeiites from the Siqueiros Fracture Zone. In Magmatism in theOcean Basins (eds. A.D. Saunders and M. J. Norry). Geol Soc.London Spec. Pub. 42, 41–70.
Navo O. and Stolper E. (1987) Geochemical consequences of meltpercolation: The upper mantle as a chromatographic column. J. Geol.95, 384–392.
Nicholas A. (1986) A melt extraction model based on structural studiesin mantle peridotites. J. Petrol. 27, 999–1022.
Niu Y. (1997) Mantle melting and melt extraction processes beneathspreading ridges: Evidence from abyssal peridotites. J. Petrol. 38,1047–1074.
O’Hara M. J. (1968) Are any ocean floor basalts primary? Nature 220,683–686.
Perfit M. R., Smith M. C., Fornari D. J., Batiza R., and Edwards M. H.(1992) Submersible transects across the East Pacific Rise crest andupper-flanks 9°31-32'N: 2. Small scale spatial variations in lavageochemistry and implications for temporal variability. Eos: Trans.Am. Geophys. Union 73, 525.
Perfit M., Fornari D., Smith M., Bender J., Langmuir C., and HaymonR. (1994) Small-scale spatial and temporal variations in MORBgeochemistry and implications for ridge crest magmatic processes.Geology 22, 375–379.
Perfit M. R., Fornari D. J., Ridley W. I., Kirk P. D., Casy J., KastensK. A., Reynolds J. R., Edwards M., Desonie D., Shuster R., andPardis S. (1996) Recent volcanism in the Siqueiros Transform fault:picritic basalts and implications for MORB magma genesis. EarthPlanet. Sci. Lett. 141, 61–73.
Perfit M. R. and Chadwick Jr. W. W. (1998) Magmatism at mid-oceanridges: Constraints from volcanological and geochemical investiga-tions. Faulting and Magmatism at Mid-Ocean Ridges. In: (eds. W. R.Buck, P. Delaney, J. A. Karson, and Y. Lababrille). AmericanGeophysical Union, Washington, DC, pp. 41–70.
Pickett D. A., Murrell M. T., and Williams R. W. (1996) Determinationof femptogram quantities of protactinium in geological samples bythermal ionization mass spectrometry. Anal. Chem. 66, 91–108.
Pyle D. M. (1992) The volume and residence time of magma beneathactive volcanoes determined by decay-series disequilibria methods.Earth Planet. Sci. Lett. 112, 61–73.
Pyle D. M. (1994) Reply to comment by M. Condomines on “Thevolume and residence time of magma beneath active volcanoesdetermined by decay-series disequilibria methods.” Earth Planet.Sci. Lett. 122, 257–258.
Qin Z. (1992) Disequilibrium partial melting model and its implica-tions for trace element fractionations during mantle melting. EarthPlanet Sci. Lett. 112, 75–90.
Ribe N. M. (1985) The generation and composition of partial melt inthe earth’s mantle. Earth Planet. Sci. Lett. 73, 361–376.
Ribe N. M. (1987) Theory of melt segregation–a review. J. Volcan.Geotherm. Res. 33, 241–253.
Richardson C. and McKenzie D. (1994) Radioactive disequilibria from2D models of melt generation by plumes and ridges. Earth Planet.Sci. Lett. 128, 425–437.
Richter F. M. and McKenzie D. (1984) Dynamical models for meltsegregation from a deformable matrix. J. Geol. 92, 729–740.
Rienitz I. and Turekian K. K. (1989) 230Th/238U and 226Ra/230Thfractionation in young basaltic glasses from the East Pacific rise.Earth Planet. Sci. Lett. 94, 199–207.
Rubin K. H. and MacDougall J. D. (1988) 226Ra excesses in mid-oceanridge basalts and mantle melting. Nature 335, 158–161.
Rubin K. H. and MacDougall J. D. (1992) Th-Sr isotopic relationshipsin MORB. Earth. Planet. Sci. Lett. 114, 149–157.
Rubin K., Macdougall J. D., and Perfit M. R. (1994) 210Po-210Pbdating of recent volcanic eruptions on the sea floor. Nature 368,841–844.
Salters V. J. M. and Hart S. R. (1989) The hafnium paradox and the roleof garnet in the source of mid-ocean ridge basalts. Nature 342,420–422.
Scheirer D. S. and Macdonald K. C. (1993) Variation in cross-sectionalarea of the axial ridge along the East Pacific Rise: Evidence for themagmatic budget of a fast spreading center. J. Geophys. Res. 98,22321–22338.
Sims K. W. W., DePaolo D. J., Murrell M. T., Baldridge W. S.,Goldstein S. J., and Clague D. A. (1995) Mechanisms of magmageneration beneath Hawaii and mid-ocean ridges: U/Th and Sm/Ndisotopic evidence. Science 267, 508–512.
Sims K. W. Jull M. Kelemen P. 1998U-series disequilibria and melttransport in the mantle beneath mid-ocean ridges. Presented at Amer-ican Geophysical Union Meeting, San Francisco CA. Abstract inEos: Trans. Am. Geophys. Union V22D.
Sims K. W. W., DePaolo D. J., Murrell M. T., Baldridge W. S., andGoldstein S. J. (1999) Porosity of the melt zone and variations insolid mantle upwelling rates beneath Hawaii: Inferences from 238U-230Th-226Ra and 235U-231Pa disequilibria. Geochim. Cosmchim. Acta63, 4119–4138.
Sinton J. M. and Detrick R. S. (1992) Mid-ocean ridge magma cham-bers. J. Geophys. Res. 97, 197–216.
Smith M. C. Perfit M. R. Fornari D. J. Ridley W. I. Edwards M. H.Jurras G. J. Von Damm K. L. 2001Magmatic processes and segmen-tation at a fast spreading mid-ocean ridge: Detailed investigation ofan axial discontinuity on the East Pacific Rise crest at 9 degrees37'N. Geochem. Geophys. Geosys. G3, (paper 2000GC000134).
Sohn R. Menke W. (in press) Application of maximum likelihood andbootstrap methods to non-linear curve-fit problems in geochemistry.Geochem. Geophys. Geosys.
Spiegelman M. and Elliott T. (1993) Consequences of melt transportfor uranium series disequilibrium in young lavas. Earth Planet. Sci.Lett. 118, 1–20.
Spiegelman M. Kelemen P. B. Ahronov E. (2001) Causes and conse-quences of flow organization during melt transport; the reactioninfiltration instability in compactible media. J. Geophys. Res. B,Solid Earth Planets 106, 2, 2061–2077.
Stolper E., Walker D., Hagar B. H., and Hays J. F. (1981)Melt segregation from partially molten source regions: The im-portance of melt density and source region size. J. Geophys. Res. 86,6261–6271.
Thurber D. (1967) Anamolous 234U/238U in nature. J. Geophys. Res.67, 4518.
3501Melt generation and transport beneath the East Pacific Rise

Todt W. Cliff R. A Hanser A. Hofmann A. W. 1996Evaluation of a202Pb-205Pb double spike for high-precision lead isotope analysis.In Earth Processes: Reading the Isotopic Code (eds. S. R. Hart andA. Basu). Am. Geophys. Union 95, 429–437.
Toomey D. R., Purdy G. M., Solomon S. C., and Wilcock W. S. D.(1990) The three dimensional seismic velocity structure of the EastPacific Rise near latitude 9°30'N. Nature 347, 639–645.
Turcotte D. L. (1982) Magma migration. Ann. Rev. Earth Planet. Sci.10, 397–408.
Volpe A. M. and Goldstein S. J. (1993) 226Ra-230Th disequilibrium inaxial and off-axis mid-ocean ridge basalts. Geochim. Cosmochim.Acta 57, 1233–1242.
Volpe A. M., Olivares J. A., and Murrell M. T. (1991) Determinationof radium isotope ratios and abundances in geologic samples byghermal ionization mass spectrometry. Anal. Chem. 63, 913–916.
Von Damm K. L. 2000Chemistry of hydrothermal vent fluids from
9–10°N, East Pacific Rise: “Time Zero” the immediate post-eruptiveperiod. J. Geophys. Res. 105, B5, 11203–11222.
Watson S. and McKenzie D. (1991) Melt generation by plumes: Astudy of Hawaiian volcanism. J. Petrol. 32, 501–537.
Weaver J. S. Langmuir C. H. 1990Calculation of phase equilibrium inmineral-melt systems. Computers Geosci. s16, 1, 1–19.
White W. M. (1985) Sources of oceanic basalts: Radioogenic isotopicevidence. Geology 13, 115–118.
White W. M., Albarede F., and Telouk P. (2000) High-precisionanalysis of Pb isotope ratios using multi-collector ICP-MS. Chem.Geol. 167, 257–270.
Williams R. W. and Gill J. B. (1989) Effects of partial melting on theuranium decay series. Geochim. Cosmochim. Acta 53, 1607–1619.
Wood B. J., Blundy J. D., and Robinson J. A. C. (1999) The role ofclinopyroxene in generating U-series disequilibrium during mantlemelting. Geochim. Cosmochim. Acta 63, 1613–1620.
Appendix 1a. Major element compositions of 9 to 10°N East Pacific Rise (EPR) axial samples.
Sample SiO2 TiO2 Al2O3 FeO(total) MnO MgO CaO Na2O K2O P2O5 Total
9–10°N EPR2359-4 50.39 1.54 14.76 10.06 0.21 7.90 12.01 2.74 0.13 0.19 99.932497-1b 50.00 1.52 14.93 10.12 0.19 7.97 12.01 2.77 0.12 0.17 99.792359-5 50.57 1.60 14.51 10.45 0.20 7.67 11.75 2.78 0.12 0.22 99.872368-4 50.00 1.26 15.58 9.25 0.16 8.55 12.19 2.52 0.07 0.11 99.702372-1 49.86 1.31 15.55 9.41 0.16 8.57 12.17 2.56 0.11 0.19 99.892392-9 50.04 1.31 15.48 9.38 0.18 8.50 12.15 2.56 0.09 0.13 99.812752-6 49.63 1.25 15.71 9.01 0.19 8.94 12.18 2.57 0.11 0.09 99.682504-1 50.01 1.30 15.53 9.32 0.17 8.53 12.10 2.54 0.08 0.15 99.732351-2 50.01 1.30 15.5 9.41 0.19 8.27 12.3 2.66 0.10 99.772746-4 50.10 1.30 15.41 9.37 0.18 8.12 12.03 2.56 0.09 0.14 99.302746-3b 49.95 1.17 15.92 8.82 0.17 8.62 11.99 2.44 0.10 0.10 99.262370-6 49.90 1.12 15.40 10.00 0.15 8.24 11.60 2.65 0.10 0.09 99.252370-1 51.00 1.39 15.30 11.00 0.16 7.54 11.40 2.77 0.12 0.13 100.812355-8 50.02 1.56 14.97 9.99 0.21 7.95 11.90 2.83 0.15 0.19 99.772356-7 50.58 1.54 14.69 10.03 0.22 8.12 11.83 2.64 0.11 0.19 99.952361-6 49.92 1.25 15.4 9.16 8.64 12.3 2.43 0.09 0.14 99.302352-2 50.06 1.61 14.60 10.30 0.19 7.80 12.40 2.74 0.11 0.19 100.002358-3 50.79 1.67 14.31 10.53 0.23 7.61 11.67 2.78 0.13 0.20 99.922358-4 50.66 1.69 14.34 10.62 0.23 7.61 11.68 2.73 0.15 0.19 99.902365-3 50.39 1.74 14.31 10.83 0.22 7.55 11.72 2.76 0.12 0.19 99.83
Siqueiros2390-5 48.60 2.01 16.00 10.40 0.17 7.01 9.80 3.16 0.63 0.31 98.09D20-2 48.81 0.96 17.31 7.92 0.1 10.01 12.08 2.35 nd 0.06 99.60A2384-3 48.95 0.95 17.35 7.98 0.17 10.12 12.09 2.33 nd 0.06 100.00A2384-6 49.2 0.95 17.14 8.26 0.16 9.57 12.38 2.27 nd 0.05 99.98
Major elements, measured by X-ray fluorescence, in weight percent. Estimated relative errors �2%, except for Na (5%), P (6%), and K (8%).
3502 K. W. Sims et al.

Appendix 1b. Rare earth element (REE) compositions of 9 to 10°N East Pacific Rise (EPR) axial samples measured by inductively coupled plasmamass spectrometry (ICP-MS) and isotope dilution thermal ionization mass spectrometry (ID-TIMS).
Sample La Ce Pr Nd Sm Eu Gd Tb Dy Ho Er Yb Lu
2359-4a 3.4 11.0 1.8 10.0 3.4 1.4 4.9 0.88 5.6 1.2 3.2 3.2 0.522359-4c 9.45 3.252359-5b 11.40 10.40 3.59 1.29 5.00 5.84 3.72 3.482359-5c 10.41 3.572368-4a 2.8 9.0 1.6 8.5 2.9 1.2 4.0 0.76 4.7 1.0 2.7 2.7 0.462372-1b 9.07 8.24 2.87 1.09 4.04 4.66 2.99 2.792372-1c 8.06 2.802392-9a 3.0 9.7 1.6 9.0 3.0 1.1 4.2 0.75 4.8 1.1 2.8 2.8 0.462392-9c 8.24 2.862752-6a 2.9 8.8 1.5 8.2 2.8 1.1 4.0 0.72 4.5 0.96 2.6 2.7 0.432752-6c 7.94 2.752504-1a 3.0 9.4 1.6 8.5 3.0 1.2 4.3 0.75 4.8 1.0 2.7 2.8 0.482504-1c 8.57 2.982351-2a 2.9 9.3 1.6 8.5 3.0 1.2 4.3 0.78 4.80 1.0 2.8 2.8 0.462746-4a 3.1 9.8 1.7 9.3 3.2 1.2 4.5 0.79 5.0 1.1 2.9 3.0 0.502746-4c 7.48 2.612746-3ba 2.8 9.0 1.5 8.2 2.8 1.1 3.9 0.70 4.5 0.98 2.6 2.7 0.452746-3bc 7.71 2.672370-6a 2.9 9.2 1.6 8.7 3.0 1.2 4.2 0.75 4.7 1.0 2.6 2.7 0.472370-6c 8.07 2.812370-1a 3.5 11 1.9 11 3.6 1.3 5.0 0.92 5.7 1.2 3.5 3.4 0.542370-1c 9.95 3.402355-8a 3.4 11.0 1.9 10.0 3.6 1.4 4.9 0.92 5.6 1.2 3.2 3.3 0.532355-8b 10.72 9.98 3.44 1.25 4.74 5.66 3.56 3.342355-8c 9.75 3.372356-7a 3.5 11.0 1.9 10.0 3.6 1.4 5.0 0.94 5.8 1.3 3.3 3.4 0.562356-7b 10.68 9.80 3.41 1.25 4.86 5.68 3.57 3.352356-7c 9.68 3.352361-6a 2.8 8.9 1.6 8.4 3.0 1.1 4.1 0.76 4.7 1.0 2.7 2.8 0.462361-6c 7.87 2.732352-2a 3.7 12.0 2.0 11.0 3.7 1.4 5.20 0.91 5.8 1.3 3.4 3.4 0.592352-2b 11.29 10.33 3.55 1.29 4.92 5.80 3.67 3.442352-2c 9.83 3.382358-3a 3.9 12.0 2.1 11.0 3.8 1.5 5.5 0.98 5.9 1.3 3.6 3.5 0.572358-3c 10.45 3.592358-4a 3.8 12.0 2.1 11.0 3.8 1.4 5.5 0.97 5.9 1.3 3.5 3.5 0.592358-4b 11.90 10.79 3.69 1.34 5.14 6.09 3.84 3.582365-3a 4.0 13.0 2.1 12.0 4.0 1.5 5.7 1.0 6.2 1.4 3.8 3.7 0.622365-3c 11.34 3.90Siqueiros
2390-5a 15.0 36.0 4.80 21.0 5.21 1.70 5.90 0.96 5.80 1.20 3.20 3.202390-5c 19.47 5.00D20-2a 0.77 3.67 4.31 1.67 0.69 2.56 1.8D20-2c 3.87 1.582384-3a 1.11 4.86 0.68 5.26 2.08 0.81 2.83 0.47 2.90 0.64 1.70 2.072384-3c 4.62 1.812384-6a 0.9 3.5 0.72 4.5 1.70 0.69 2.60 0.47 3.00 0.65 1.80 1.70
a REE measured by ICP-MS at Geological Survey of Canada; errors 5 to 10% (2 �).b REE measured by John Bender by ID-TIMS at the State University of New York Stony Brook; errors for Sm, Nd, and Eu are �1% (2�); errors
for Ce, Gd, Dy, Er, and Yb are 1 to 2% (2 �).c Sm and Nd concentrations measured by ID-TIMS at the University of California, Berkeley; errors �1% (2�).
3503Melt generation and transport beneath the East Pacific Rise

Appendix 1c. Cl, K, Ba, Ni, Nb, Y, Zr, Rb, Sr, and Hf concentrations of 9 to 10° N East Pacific Rise (EPR) axial samples.
Sample Cl (ppm)a K (ppm)a Ba (ppm)b Ni (ppm)c Nb (ppm)c Y (ppm)c Zr (ppm)c Rb (ppm)c Sr (ppm)c Hf (ppm)d
9 to 10°N EPR2359-4 32 772 8.82 80 3.3 35.4 101 1.2 122 2.52497-1 40 891 36.1 109 0.8 1212359-5 79 922 10.91 62 4.5 37.1 112 1.9 1252638-4 30 780 7.71 109 2.5 28.4 86 1.4 122 2.22372-1 62 710 7.88 110 29.7 88 2.0 1252392-9 39 790 8.01 102 2.9 30.0 90 1.8 124 2.22752-6 50 807 9.18 2.67 27.5 84 1.0 122 2.02504-1 23 737 7.72 3.2 30.0 91 1.7 127 2.32351-2 40 693 7.66 103 2.3 28.9 89 1.8 123 2.22746-4 39 800 8.31 3.0 30.3 92 0.9 122 2.32746-3b 39 780 7.62 2.9 26.7 81 0.9 124 2.02370-6 39 780 8.24 110 2.7 29.5 88 2.2 122 2.12370-1 117 970 9.85 79 2.4 35.8 107 1.2 1232355-8 62 830 2.7 34.8 108 1.6 1242356-7 92 796 77 3.1 34.1 103 2.0 118 2.72361-6 50 645 5.98 106 2.6 29.9 86 1.5 118 2.22352-2 53 898 9.14 66 2.6 34.6 107 1.7 122 2.82358-3 84 942 64 4.3 37.7 116 1.6 123 2.82358-4 52 946 10.24 55 2.0 36.3 115 2.0 125 2.92365-3 69 947 10.00 53 3.8 38.9 116 0.9 123 3.00
Siqueiros2390-5 302 5380 129 107 20.0 35.0 174 12.0 295 4.1D20-2 9 206 2.6 616 19.0 45 732384-3 20 202 2.22 753 0.48 18.0 45 0.3 58 1.32384-6 21 195 340 0.46 18.0 47 0.4 19 1.3
a Cl and K measured by electron microprobe at University of Tulsa (Michael and Cornell, 1998). Errors for both Cl and K are � 20 ppm (2�).b Ba measured by isotope dilution inductively coupled plasma mass spectrometry (ICP-MS) at Woods Hote Oceanographic Institution and isotope
dilution thermal ionization mass spectrometry at Los Alamos National Laboratory. Uncertainties for both techniques are � 1% (2�).c Ni, Rh, and Sr measured by X-ray Fluorescence at the University of Florida; errors for Ni are � 10%; errors for Rb are � 50%; errors for Nb,
Y, and Zr are � 5%; errors for Sr are � 3% (2�).d Hf concentrations measured by ICP-MS at Canadian Geological Survey; errors are � 5% (2�).
3504 K. W. Sims et al.


![POSTER PRESENTATIONS...The radon exhalation rate of 222Rn was determined using a theoretical model proposed by UNSCEAR [1], through the 226Ra concentration. The determination radon](https://img.pdfslide.us/doc/110x75/602628c2897e1a118641bad6/poster-presentations-the-radon-exhalation-rate-of-222rn-was-determined-using.jpg)