Embed Size (px)
Citation preview

CHEMICAL ANALYSIS OF MECHANICALLY
PROCESSED BEEF
By
JORETTA KAYE MORRIS /;
Bachelor of Science in Home Economi.cs
Oklahoma State University
Stillwater, Oklahoma
1976
Submitted to the Faculty of the Graduate College of the Oklahoma State University
in partial fulfillment of the requirements for the Degree of MASTER OF SCIENCE
July, 1978
CHEMICAL ANALYSIS OF MECHANICALLY
PROCESSED BEEF
Thesis Approved:
Dean of the Graduate College
ii

ACKNOWLEDGMENTS
The author wishes to extend her sincere thanks and grateful appre
ciation to Dr. Esther Winterfeldt, major adviser, for her valuable
assistance and encouragement throughout the course of this work.
Appreciation is also expressed to the members of the advisory com
mittee, Dr. R. L. Henrickson and Miss Hazel Baker, for their assistance
and constructive criticism during the course of the investigation and
in preparing the final manuscript.
The author wishes to express her sincere thanks to Dr. George
O'Dell and Dr. Lester Reed, who were always willing to give their time,
advice, and counsel. Indebtedness is expressed to them also for the
use of their laboratories and equipment, without which this study could
not have been possible.
The advice and laboratory assistance provided by those in the Food,
Nutrition, and Institution Administration Laboratory was greatly appre
ciated, and the author wishes to extend her thanks to each of them also.
Further indebtedness is acknowledged to the Agricultural Experi
ment Station for the funding which enabled the author to carry out this
project.
iii

Chapter
I.
TABLE OF CONTENTS
INTRODUCTION
Purpose and Objectives Hypotheses . . • . . Assumptions . • . . . Definition of Terms
II. REVIEW OF LITERATURE
Mechanical Processing Technique NutritionalValue ...•...
Calcium . . • .- • • . . . • • . Differences in Calcium Content
Other Nutrient Components of Bone Fluoride . . • . Ascorbic Acid Fat Content . Iron Protein ..
III. METHODS AND PROCEDURES • • • . . • •
Type of Research . Meat Sample • Nutrient Analyses •
Cleaning the Glassware •
IV. RESULTS AND DISCUSSION
Mineral Comparison . . . • . . • . • Zinc . . . . . . . . . Iron Lead Potassium
Lipid Content Moisture Content: • Protein Content
V. SUMMARY AND RECOMMENDATIONS
Recommendations for Further Study
iv
Page
1
3 3 4 4
6
6 11 12 14 17 18 19 19 21 22
25
25 26 26 28
29
29 34 34 35 37 37 42 43
44
45
Chapter
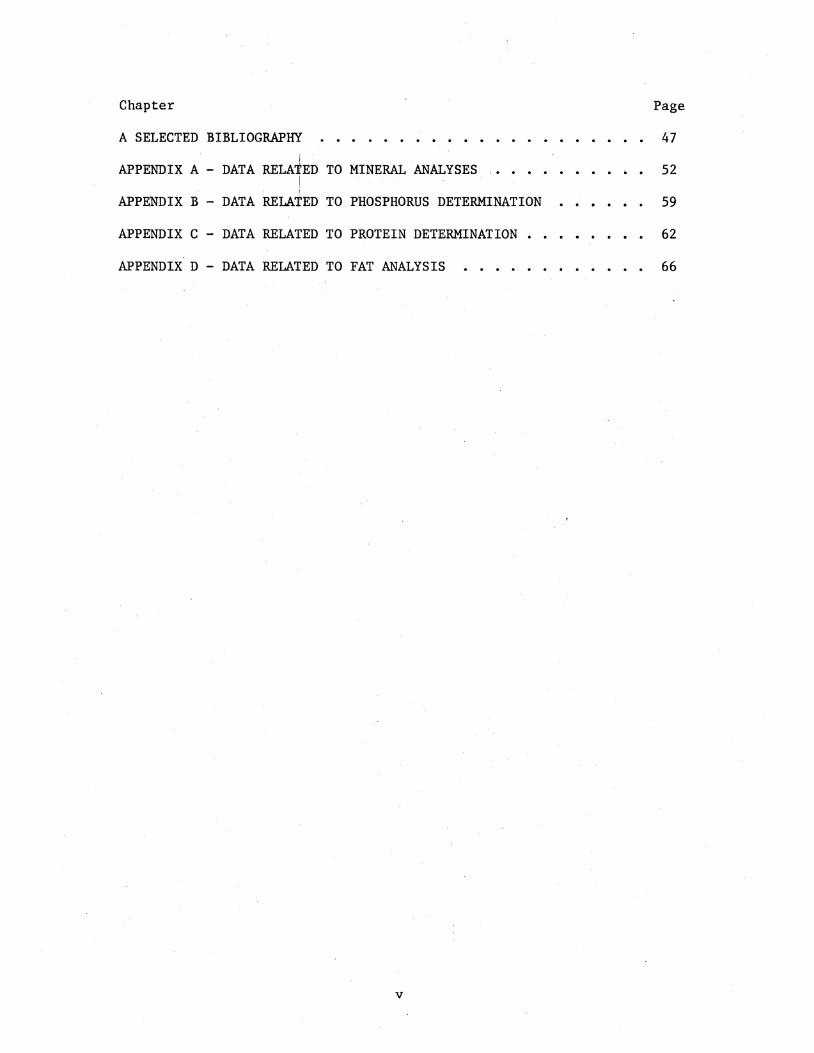
A SELECTED BIBLIOGRAPHY I
APPENDIX A - DATA RELATED TO MINERAL ANALYSES I I
APPENDIX B - DATA RELATED TO PHOSPHORUS DETERMINATION
APPENDIX C - DATA RELATED TO PROTEIN DETERMINATION .
APPENDIX D - DATA RELATED TO FAT ANALYSIS
v
Page
47
52
59
62
66

LIST OF TABLES
Table
I. Nutritional Quality Standards for Mechanically-Deboned Meat . . • • •
II. Nutritional Quality of Ground Beef
III. Projected Calcium Intake Due to MDM 90th Percentile MDM Intake and Average Calcium Concentration in MDM
IV. Projected Calcium Intake Due to MDM Average MDM Intake and Average Calcium Concentration in MDM
V. Mineral Content of Mechanically Processed Beef (in ug/gm) . • . • • . . . . • • . • . • • .
VI. Mineral Content of Hand-Deboned Beef (in ug/gm)
VII. Projected Calcium Intake Due to the Ingestion of Mechanically Processed Beef Products at a Concentration of 1 Percent Calcium . . . • •
VIII. Projected Lead Intake Due to the Ingestion of Mechanically Processed Beef Products at a Concentration of 1.685 ug Lead/gm Meat
IX. Fat Determination of Mechanically Processed Beef
X. Fatty Acid Analysis of Mechanically Processed Beef
XI.
XII.
Mechanicalty Processed Beef: Percent Saturated Fatty Acids Versus Percent Unsaturated Fatty Acids .. . . . . . . . . . . . . . . . . .
Percent Fat in Hand-Deboned Beef Versus Percent Fat in Mechanically Processed Beef .•.••
vi
Page
9
9
15
16
30
31
33
36
39
40
41
42

CHAPTER I
INTRODUCTION
As a result of the expanding world population, there has been an
increased emphasis on developing new ways of meeting the ever-growing
demand for food. Many different approaches have been investigated in
hopes of developing new or additional food sources. Materials.not
traditionally used as food in many parts of the world are now gaining
wide acceptance.. The problem of meeting the world demand for food has
triggered an all out search for new food sources, better utilization
of existing sources, and means of reducing waste of available materials.
However, until only recently, one major. source has been over-looked-
that of mechanically processed red meat.
The meat industry has recently utilized new non~meat materials
by combining them with traditional meat ingredients to process new
products that are appealing to the consumer. The mechanical-deboning
process allows the recovery of meat and marrow from bones of beef,
pork, and lamb which would otherwise be rendered as inedible. This
food source amounting to a.pproximately 2, 090,7 57 metric tons of
mechanically-deboned meat (1) has been wasted in the past. A large
percentage of the loss is due to the difficult task of hand-stripping
the backbones, ribs, and neckbones of slaughter animals. Not only is
it practically impossible to remove all of the meat from such bone
structures, but it is also economically unfeasible from the labor
1

standpoint (2). With the aid of a mechanical deboning machine, how
ever, each bone could be stripped of all meat, thus resulting·in a
possible gain of 13 to 16 additional pounds of meat per beef carcass.
The mechanical-deboning process also results in the incorporation
of microscopic bone particles in the final product. These particles
are composed of calcium, phosphorus, and a variety of trace minerals.
The human diet is usually lacking in the required amount of calcium
(3, 4). ·Therefore, since the retention of calcium from bone sources
is high, mechanically processed meat may be helpful in balancing the
calcium:phosphorus ratio and thus, preventing calcium deficiencies
in the diet.
2
The bone marrow, which is liberated during the mechanical-deboning
process, adds yet another nutrient lacking in hand-deboned meat, that
of ascorbic acid. Bone marrow contains relatively high amounts of this
vitamin as well as iron and a number of trace minerals. Data collected
at the University of Wyoming indicated that most mechanically processed
red meat produced commercially contains two to three mg of ascorbic
acid per 100 g meat on a fresh weight basis. Knox (5) also observed
that ischaemic heart disease is inversely related to the intake of
calcium and ascorbic acid in the diet.
This evidenc~ leads one to believe that mechanically processed
meat (MPM) is beneficial from the nutritional standpoint. However,
heavy minerals such as lead and fluorine are also known to collect
in the bone. Such minerals when consumed in large amounts can produce
toxicity. Therefore, before mechanically processed meat can be widely
distributed on the consumer market, its chemical composition needs
further researching to determine the actual nutritive value of the meat.
Purpose and Objectives
The purpose of this study was to analyze the chemical composition i
of mechanically proceased beef and compare its nutritive value with
3
that of hand-deboned ~eat thus ascertaining the variations in nutritive
quality that occur as a result of the processing technique being uti!-
ized. The researcher did not analyze the hand-deboned meat to determine
its nutritive value, but instead utilized the works of previous
researchers who had reported their results in this area.
The following objectives were developed for the study:
1. To analyze the calcium, phosphorus, magnesium, manganese,
zinc, iron, chromium, copper, lead, and potassium content
of mechanically processed beef. These values will then be
compared to the amounts found in hand-deboned beef to deter-
mine which ·sample contains the highest percentage of avail-
able specified nutrients.
2. To analyze the fat content and fatty acid composition of the
mechanically processed beef so as to determine the ratio of
polyunsaturated to saturated fat, and thus establish a com-
parison between the two deboning methods.
3. ·To determine the nitrogen content of mechanically processed
beef and make a comparison of the total percent of protein
available in the two types of meat.
Hypotheses
The following hypotheses gave the research focus. They are:
H1 : There will be significant differences in the nutritive
content of the two meats. The mechanically processed meat

will be higher in calcium~ phosphorus, magnesium, manganese,
zinc, iron, chromium, copper, lead, and potassium than the
hand-deboned meat.
H2 : The mechanically processed meat will contain significantly
more unsaturated fat than the hand-deboned meat.
H3 : After determining the total nitrogen content of the meat
sample, it will be found that the hand-deboned meat will
contain a somewhat greater percentage of nitrogen than the
mechanically processed sample.
Assumptions
4
· The study was planned and conducted in accordance with the follow
ing assumptions:
1. The mechanically processed meat under investigation has been
prepared in accordance with the standards specified in the
Federal Register, Volume 41, No. 82, page 19762, April 27,
1976, for Class 7, Mechanically-Deboned Meat.
2. ·The mechanically processed meat has been prepared under proper
conditions as specified in MPI Bulletin 76-111 issued July 6,
1976 by the United States Department of Agriculture.
3. The mechanically processed meat has been stored according to
the regulations outlined in MPI Bulletin 76-111 issued July 6,
1976 by the United States Department of Agriculture.
Definition of Terms
For the purpose of this study, the following definitions were used:
5
Dependent Variables--the conditions or characteristics that some-
how ch?nge as the experimenter manipulates the independent variable (8).
Independent yariables--the conditions or characteristics which
are manipulated in order to ascertain their relationship to observed
phenomena (8).
Mechanically Deboned Meat--
. • • the product resulting from the mechanical separation and removal of most of the bone from attached skeletal muscle tissue, and containing a minimum of 14.0 percent protein with a minimum Protein Efficiency Ratio value of 2.5, a maximum fat content of 30 percent, and a maximum calcium content of 0.75 percent (6).
Mechanical Deboning--a process which separates meat and some bone
marrow from bones (1).
Protein Efficiency Ratio (PER)--a measure of the weight gain of a
growing animal divided by protein intake (9).
Mechanically Processed Beef--the new nomenclature used to describe
the mechanical separation and removal of most of the bone from attached
skeletal'muscle tissue. This product was formerly known as mechanically
deboned meat.

CHAPTER II
REVIEW OF LITERATURE
This chapter contains a review of information from a collection of
articles related to mechanically processed meat. The mechanical proces
sing technique, as well as some possible reasons for the variations
often seen in the meat product are discussed. Some of the nutrients
found in mechanically processed beef and their cont-ribution to the
diet are also briefly discussed.
Mechanical Processing Technique
The mechanical processing technique is not new. Such procedures
have been in use in the poultry industry for nearly 12 years and even
longer in the fish industry. As a result, millions of pounds of pro
tein have been retained as a valuable food source. Due to the nature
of the bones of red-meat animals and the nature of the industry itself,
however, it has not been until several years ago that the equipment for
red-meat deboning has been developed to the point where its use can be
considered for approval by the United States Department of Agriculture
(10). Since that time, :researchers have been investigating and explor
ing the area of mechanically processed meat, but large gaps in the
knowledge concerning its use are still presen~.
The Meat and Poultry Inspection Program of the United States
Department of Agriculture has done considerable research in this area.
6

After several years evaluation, the Program staff concluded that a
sufficient basis existed for rule-making on the use of mechanically
processed red meat (11). It was also decided that the term "meat"
should be redefined so as to include mechanically-deboned meat (now
referred to as mechanically processed meat) in its definition. As
stated in the Federal Register, Volume 41, No. 82, Tuesday, April 27,
1976, p. 17535,
The proposed redefinition of 'meat' appears to be especially appropriate at this time, since the world wide food shortage, especially of protein, makes it mandatory that all available food be retained for consumption.
The revised definition reads as follows:
§ 301.2 Definitions.
(tt) Meat. Any edible portion of the carcass of any cattle, sheep, swine, or goats, exclusive of lips, snouts, ears, caul fat, leaf fat, kidney fat, and other visceral fat, and exclusive of all organs, except the heart, tongue, and esophagus; and including but not limited to the following classes of meat:
(1) Skeletal meat, (2) Heart meat, (3) Tongue meat, (4) Esophagus meat, (5) Meat trimmings, (6) Fatty meat trimmings, (7) Mechanically deboned meat, (8) Mechanically deboned meat for processing, (9) Mechanically deboned meat for rendering,
(10) Rendered meat,· (11) Rendered meat for processing, (12) Cooked rendered meat, and (13) Cooked rendered meat for processing (6, p. 17561-
17562).
A proposed regulation concerning the manufacture and use of
mechanically deboned meat was also published in the Register under
the title, f'Definition of Meat and Classes of Meat, Permitted Uses,
and Labeling Requirements." In it, the three different classes of
mechanically-deboned meat-- (1) mechanically-deboned meat.,
7

(2) mechanically-deboned meat for processing, and (3) mechanically~
deboned meat for rendering--are defined. The definitions, as outlined
in§ 319.5 Definitions of Classes of Meat (6, p. 17562), are as
follows:
Class 7: Mechanically Deboned Meat--the product resulting from the mechanical separation and removal of most of the bone from attached skeletal muscle tissue; and containing a minimum of 14.0 percent protein with a minimum Protein EfficiencyRatio (PER) value of 2.5 (or an essential amino acid content of 33 percent), a maximum fat content of 30 percent, and a maximum calcium content of 0.75 percent.
Class 8: Mechanically Deboned Meat for Processing-the product resulting from the mechanical separation and removal of most of the bone from attached skeletal muscle tissue and which fails to meet one or more of the limits prescribed for class 7, but contains a minimum of 10.0 percent protein with a minimum PER value of 2.5 (or an essential amino acid content of 33 percent), and a maximum calcium content of 1.0 percent.
Class 9: Mechanically Deboned Meat for Rendering--the product resulting from the mechanical separation and removal of most of. the.bone from attached skeletal muscle tissue and which fails to meet one or more of the limits prescribed for class 8.
The Register also includes the definition of "Rendered Meat" as
follows:
Class 10: Rendered Meat--the product resulting from the partial removal of fat from meat of class 1, 2, 3, 4, 5, 6, 7, 8, or 9, or a combination thereof, by a low temperature (120° F. or less) rendering process, and containing a minimum of 14 percent protein with a minimum PER of 2.5 (or an essential amino acid content of 33 percent), a maximum fat content of 30 percent, and, if mechanically deboned meat is used, a maximum calcium content of 0. 75 percent ••
Table I summarizes the standards as they were proposed for each
class of mechanically-deboned meat. Corresponding values of hand-
deboned meat as outlined in available literature were also listed in
Table II so as to provide the reader with a means of comparison bet-
ween the two products.
8

TABLE I
NUTRITIONAL QUALITY STANDARDS FOR MECHANICALLY-DEBONED MEAT
Min. Essen. Animo Acids
Hinimum Content Protein (% of
Max. Fat
Content Hinimum Total Content Product (%) PER Protein) (%)
Mechanically-Deboned Meat Interim Regulation 14 2.5 32 30 Proposed Regulation 14 2.5 33 30
Mechanically-De boned Meat for Processing
Interim Regulation 10 2.5 32 60 Proposed Regulation 10 2.5 33
Max. Calcium Content
(%)
0.5 0.75
0.75 1.00
Source: R. A. Field, "Mechanically-Deboned Red Meat," Food Technology (1976).
TABLE II
NUTRITIONAL QUALITY OF GROUND BEEF
9
Average Protein Content Average
PER
Essential Amino Acids
(% of Protein)
Fat Content
Calcium Content
Product (%) (%) (%)
Regular Ground Beef 16.24 2.52 38.46 25.28 0.01
Source: H. R. Cross, J. Stroud, Z. L. Carpenter, A. W. Kotula, T. W. Nolan, and G. C. Smith, "Use of Mechanically Deboned Meat in Ground Beef Patties," Journal of Food Science (1977).

10
As previously stated, the mechanical-deboning machinery which is
presently on the market has the potential of saving all the lean, red
meat that would otherwise end up as by-products. It is most useful
for stripping the meat from neckbones, backbones, ribs, and other such
difficult bones to clean by hand-deboning methods.
The resulting product is somewhat redder than regular ground beef because of the increased heme content from marrow and because much of·the white connective tissue is strained out with the large bone fragments. As compared with plain muscle meat, MDM contains more of the normal constituents of bone and marrow and less of the low-quality protein connective tissue (12, p. 501).
The process itself involves feeding the bones (and any attached
meat) into the machine where they are then chopped and shredded. Pres-
sure is applied which forces the meat through a stainless steel screen
containing very small conical holes so as to produce a fine-ground
meat. This allows a certain amount of pulverized bone as well as bone
marrow to come through the machine with the resulting meat fraction.
In examining the output from the machines, it was found that both the
quantity of bone and the size of the particles were satisfactory in
every respect. The bone particles ranged in size from 0.001 to 0.018
inches (10). This suggested that the particles in mechanically pro-
cessed meat would not represent any hazard, but would instead be dis-
solved by the stomach acid and provide an additional source of calcium
(11). Fried (10) also reports that the risk of mechanical damage,
piercing, and abrasion is much less in mechanically processed meat
than in its hand~deboned counterpart due to the fact that the use of
sharp knives to cut around bones often leads to the incorporation of
bone slivers and chips in the hand-deboned product.

11
The incorporation of these microscopic particles in the final pro
duct led to a great deal of controversy among consumer groups around
the nation. More than 1100 comments were received in response to the
United States Department of Agriculture's proposed regulations--many
questioning the health and safety aspects of the. product. As a result,
a coalition of consumer-oriented organizations and the Attorney General
of Maryland took legal steps to have the interim regulations repealed.
Thus, as of September 10, 1976, a Preliminary Injunction was placed on
the manufacture of mechanically processed meat which resulted in a com
plete halt to its production. Until that time, 1.6 million pounds of
mechanically processed meats were being produced and used weekly in
products by 43 companies (15). But, until further research proved
otherwi13e, mechanically processed meatwas to be considered "adulterated
and an adulterant" (11, p. 5). This injunction spurred further research
in the area of mechanically processed meat. The nutritional benefits
as well as sa"fety aspects of mechanically processed meat are now being
more fully investigated.
Nutritional Value
Many investigators (2, 13, 16, 17, 18, 19, 20, 2i, 22) recently
confirmed the fact that differences in nutritive value between mechan
ically processed meat and hand-deboned meat do exist. These differences
are due to the incorporation of fine bone particles and bone marrow
into mechanically processed meat as well as to the elimination of some
of the coliagen from the meat.

12
Calcium
Probably the greatest significant difference in mechanically pro
cessed meat and hand-deboned meat is the calcium content. Many factors
affect the percentage of this mineral's availability, but it was
reported that recent analyses of MPM for calcium indicated a concentra
tion of 0.5 percent in most samples of red meat (11). Watt and Merrill
(23) determined the calcium content of hand-deboned meat to be very
low (0.01 percent) with this amount being relatively constant. There
fore, any significant increase in calcium indicates an increase in bone
particles.
The Recommended Dietary Allowance (RDA) for calcium as determined
by the Food and Nutrition Board of the National Research Council (24)
is 800 mg per day for adults and for children from ages one to 10 years.
From the ages 11 to 18 years the requirement is increased to 1200 mg
calcium per day. However, a number of studies showed that the average
American diet tended to fall short of the recommended allowance for
this important mineral (25, 26, 27, 28). The 1965 Household Food Con
sumption Survey found that the average calcium intake for females after
age 12 was less than 75 percent of the RDA, and the intake for both
men and women, 35 years of age and older, was only 2/3's or less. The
other surveys previously cited reported similar findings. Therefore,
since the retention of calcium from bone sources is high (29, 30),
mechanically processed meat is beneficial from a dietary standpoint.
Persons with osteoperosis may require an even greater amount of
calcium per day. Spencer, H., Kramer, L. , Norris, C. , and Osis, D. ,
(31) reported that long-term calcium studies of adult subjects revealed
that about 50 percent of them were in negative calcium balance even
while ingesting 800 mg calcium per day. Those subjects who failed to
maintain calcium equilibrium at the 800 mg calcium intake level were
persons with subclinical or overt osteoperosis. When the dosage was
increased to 1200 mg per day, an average positive calcium balance was
also achieved. In addition, it was found that further increases in
the calcium level of the diet (to as much as 2200 mg per day) did not
result in any further calcium retention. This tends to indicate that
the body does not absorb excess calcium when it is not needed by the
body.
There is no evidence· to indicate that a high calcium intake leads to soft tissue calcifications in man. This process depends on many factors, most of which are still not understood. One may, however, assume that this may occur, if the high calcium intake were taken together w:i;th a large dose of vitamin D (11, p. 18). .
There is, however, a small percentage of the population which
requires a low calcium intake for medical reasons. Such persons as
kidney stone formers may be hyper-absorbers of calcium. This would
13
lead to a higher excretion of calcium in the urine, which could possi-
bly promote the formation of kidney stones. Therefore, it is suggested
that appropriate labeling of the meat products containing mechanically-
deboned meat be required so as to allow such individuals the choice to
avoid purchasing the items (11).
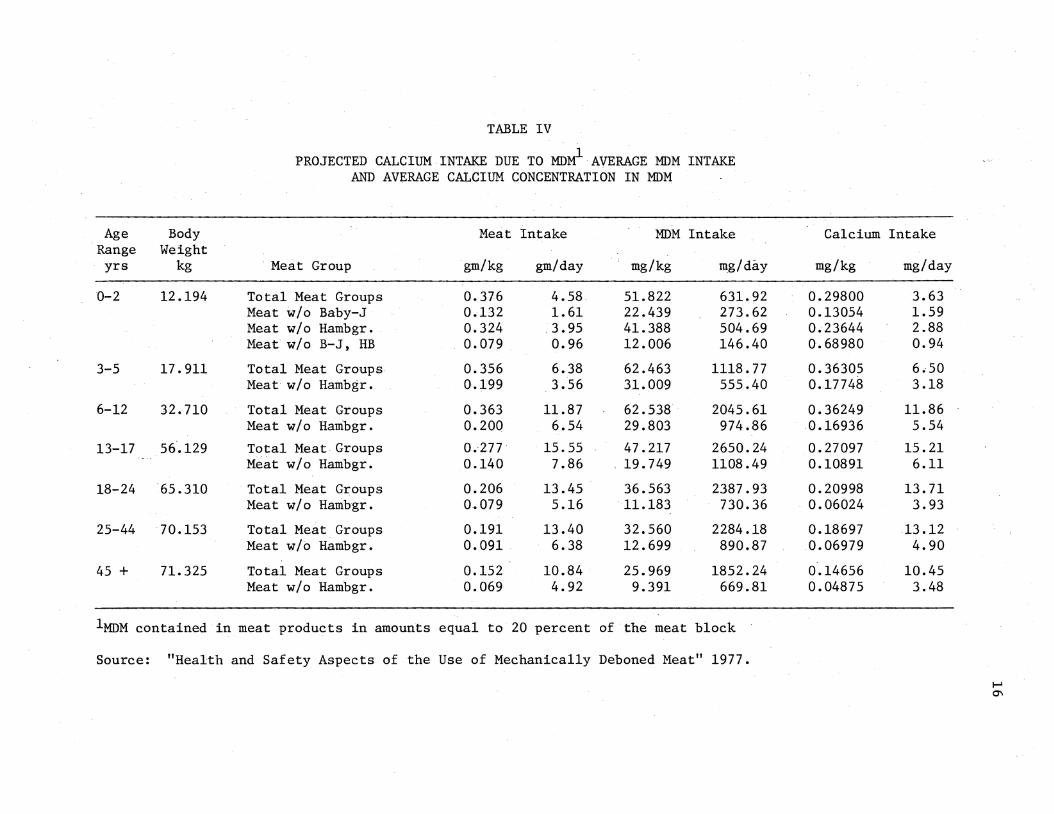
The Select Panel, convened at the request of the Administrator of
the Animal and Plant Health Inspection Service, esti~ated the risk/
benefit ratio of the increased calcium intake due to the ingestion of
meat products containing mechanically processed meat in persons with
normal calcium metabolism. On the basis of consumption data, the

14
Panel projected the intake of calcium due to the intake of meat products
containing mechanically processed meat. The data they obtained is
shown in Tables III and IV. The calcium intakes are presented as cal-
cium intake per kilogram body weight and also as calcium intake in
milligrams per day. In calculating the data, it is assumed that the
meat product contained 20 percent mechanically processed meat by weight,
and the calcium conc.entration is 0. 5 percent.
After careful study, the Panel concluded that:
The intake of the very small amounts of calcium result~ ing from the intake of mechanically deboned meat represents negligible increases in the daily calcium intake and cannot be considered hazardous. Should the calcium intake be higher because of the intake of greater amounts of MDM, this increased intake can be considered beneficial, as a large sector of the population may not consume an optimum or adequate amount of calcium. The additional calcium intake would be beneficial for persons maintained on a high calcium intake, for those who have osteoperosis and for those who receive long term treatment with medications which induce a loss of calcium (11, p. 25)
Differences in Calcium Content
Factors which affect the amount of calcium (bone particles) in the
final product were reported by Field, Riley, and Corbridge (32) and
Field (1). These factors included the yield of meat in the original
product, the design of the deboning equipment, amount of meat attached
to the bone at the time of deboning, type of bone, and the extent to
which the bones were broken prior to mechanical deboning.
An analysis of the calcium content of mechanically-deboned
mutton and lamb carcasses showed that a greater percentage of calcium
was otained when the mechanical· deboner was adjusted to produce the
greatest yield of meat (17). These investigators reported that the
calcium and fat content was extremely low (0.09 percent and 8.62

Age Body Range Weight yrs kg
Q-2 12.194
3-5 17.911
6-12 32.710
13-17 56.129
18-24 65.310
25-44 70.153
45 + 71.325
TABLE III
PROJECTED CALCIUM INTAKE DUE TO MDM1 90TH PERCENTILE MDM INTAKE AND AVERAGE CALCIUM CONCENTRATION IN MDM
Meat Intake MDM Intake
Meat Group gm/kg gm/day mg/kg mg/day
Total Meat 1.279 16 153.510 1872 Meat w/o Baby-J 0.320 4 60.148 733 Meat w/o Hambgr. 1.122 . 14 134.681 1642 Meat w/o B-J, HB 0.194 2 33.029 403
Total Meat 0. 719 13 134.985 2418 . Meat w/o Hambgr. 0.457 8 73.334 . 1313
Total Meat 0.813 27 145.119 4747 Meat w/o Hambgr. 0.490 16 76.429 2510
Total Meat 0.583 33 107.470 6032 Meat w/o Hambgr. 0.333 19 49.735 2792
Total Meat 0.506 33 96.399 6296 Meat w/o Hambgr. 0.200 13 27.201 1776
Total Meat 0.430 30 80.556 .5651 Meat w/o Hambgr. 0.220 15 30.403 2133
Total Meat 0.345 25 65.235 4653 Meat w/o Hambgr. 0.164 12 22.248 1587
lMDM contained in meat products in amounts equal to 20 percent of the meat block
Source: "Health and Safety Aspects of the Use of Mechanically Deboned Meat" 1977.
Calcium Intake
tng/kg mg/day
0.90570 11 0.35487 4 0.79461 10 0.19487 2
0.79641 14 0.43267 8
0.85620 28 0.45093 15
0.63407 36 0.29344 16
0.56875 37 0.16049 10
0.47528 . 33 0.17938 13
0.38489 27 0.13126 9
~ VI
Age Body Range Weight yrs kg
0-2 12.194
3-5 17.911
6-12 32.710
13-17 56 .• 129
18-24 65.310
25-44 70.153
45 + 71.325
TABLE IV
PROJECTED CALCIUM . INTAKE DUE TO MD~ AVERAGE MDM INTAKE AND AVERAGE CALCIUM CONCENTRATION IN MDM
Meat Intake MDM Intake
·Meat Group gm/kg gm/day mg/kg mg/day
Total Meat Groups 0.376 4.58 51.822 631.92 Meat w/o Baby-J 0.132 1.61 22.439 273.62 Meat w/o Hambgr. 0.324 .3.95 41.388 504.69 Heat w/o B-J, HB 0.079 0.96 12.006 146.40
Total Meat Groups 0.356 6.38 62.463 1118.77 Meat w/o Hambgr. 0.199 3.56 31.009 555.40
Total Meat Groups 0.363 11.87 62.538 2045.61 Meat w I o Hatribgr. 0.200 6.54 29.803 974.86
Total Meat Groups 0.277 15.55 47.217 2650.24 Meat w/o Hambgr. 0.140 7.86 19.749 1108.49
Total Meat Groups 0.206 13.45 36.563 2387.93 Meat w/o Hanibgr. 0.079 5.16 . 11.183 730.36
Total Meat Groups 0.191 13.40 32.560 2284.18 Meat w/o Hambgr. 0.091 6.38 12.699 890.87
Total Meat Groups 0.152 10.84 25.969 1852.24 Meat w/o Hambgr. 0.069 4.92 9.391 669.81
lMDM contained in meat products in amounts equal to 20 percent of the meat block
Source: "Health and Safety Aspects of the Use of Mechanically Deboned Meat" 1977.
Calcium Intake
mg/kg mg/day
0.29800 3.63 0.13054 1.59 0.23644 2.88 o. 68980 0.94
0.36305 6 .. 50 0.17748 3.18
0.36249 11.86 0.16936 5.54
0.27097 15.21 0.10891 6.11
0.20998 13.71 0.06024 3.93
0.18697 13.12 0.06979 4.90
0.14656 10.45 0.04875 3.48
1-' 0\
17
percent respectively) when the ring valve of the Beehive AUX 70 Model
deboner was set to obtain 52 percent of the mutton carcass weight as
boneless lean. After tightening the ring valve to yield 70 percent
boneless meat from mutton carcasses, the calcium content increased to
0.20 percent, and the fat content increased to 17.10 percent. After
tightening the valve a third time to increase the yield to 84 percent
boneless meat, it was found that the calcium and fat content increased
to 0.27 percent .and 24.93 percent respectively (17). These higher
percentages of calcium and fat were due to the fact that less bone was
discarded from the machine when it was operated at the higher setting
than was discarded when the value was adjusted to produce a lesser
yield of meat (17).
Field and Riley (17) have also reported that the design of mechani~
cal deboner being utilized can have further influence on the calcium
content of the meat. Goldstrand (19) also found this to be true. How
ever, he stated that the design had little influence on protein, fat,
or moisture content.
Other Nutrient Components of Bone
Bone also supplies marty other essential nutrients required for the
attainment of health (33). Copper, magnesium, z~nc, phosphorus, man
ganese, iron, and fluorine, as well as ascorbic acid, are known constit
uents of either the bone or its marrow (34). Guyton (34) also reported
that chromium and lead are known to collect in the bpne marrow. There
fore, the amount of bone material incorporated into the mechanically
processed meat also has an influence on the amounts of these nutrients
present.

Because some of the nutrients are known to produce toxicity when
consumed in excessive amounts (35), concern has been voiced as to
whether unacceptable levels are present in the finished product.
Fried (10) stated however, that a -search of the literature and dis
cussion with researchers in government and elsewhere indicated that
no apparent problem exists.
Fluoride
18
Field (13) reported that mechanically processed meat obtained
from aminals grazed in areas where vegetation is naturally high in
fluorides may have fluoride contents ranging from seven to 16 micro
grams per gram meat. Since the fluoride toxicity level, as estimated
by the Food and Nutrition Board (24), is 20 to 80 mg or more, this
does not tend to pose.a problem. Waldbott (36) and Marier and Rose
(37) also found that even when mechanically processed meat came from
areas where the water pr vegetation was relatively high in fluoride,
the fluoride content in MDM was still considerably lower than that
found in other foods. The proposed legal limitation on maximum cal
cium levels (6), in effect, limits the amount of boney material that
can be incorporated in mechanically processed meat. Because the
increased fluoride levels are also associated with the honey material,
the calcium limit also limits fluoride. Field (13), therefore, con
cluded that under these conditions, the fluoride would not approach
toxic levels. In fact, products which contain mechanically processed
meat should be of value in furnishing the needed amount of fluoride
and in reducing the incidence of tooth decay (13). Knight and Winter
feldt (12) also stated that beneficial intakes of fluoride may result

from the use of MDM in areas of the United States where the intake is
low or water is not fluoridated.
Ascorbic Acid
19
The deboning equipment also removes some of the bone marrow which
then becomes a part of the final mechanically processed meat product.
Nutritionally, this addition is beneficial. Meat has practically no
ascorbic acid, but marrow is relatively rich in this vitamin. Quite
a bit of this vitamin is oxidized during the deboning operation, but
Field (1) estimated there were two to three mg of ascorbic acid per
100 g meat on a fresh weight basis. However, he also stated that this
amount is dependent upon the freshness of the bones used for mechanical
deboning, and the amount of destruction (of ascorbic acid) which takes
place during the deboning process.
Fat Content
In addition to ascorbic acid, marrow also contributes a fair amount
of lipid components in the form of polyunsaturated fatty acids to the
mechanically processed meat product. These components are responsible
for the large increase in fat content of the meat (2). Field and Riley
(38) reported that.the femur marrow of two to three month old calves
contained 33.7 percent fat. However, they also approximated the total
fat content of the femur marrow in 48 to 96 month old cattle to be 91.8
percent. Gong .and Arnold (39) stated that the marrow from long bones
had a much higher concentration of fat than other bones in the carcass.
Moerck and Ball. (40) and Mello, Field, Froenza, and Kunsman (41) also
confirmed the fact that the bone marrow lipids contained more

20
unsaturated fatty acids than the subcutaneous or intramuscular fat from
the same animals.
This addition of "polyunsaturated" fatty acids is generally con
sidered good; however, it does affect the stability of mechanically
processed meat somewhat (13). The unsaturated fatty acids make it
more susceptible to oxidation, artd therefore, less stable than hand
deboned meat. However, the large decrease in flavor during storage
as reported by Dimick, MacNeil, and Grunden (42) for mechanically
processed poultry is not as likely to be present in mechcanically
processed red meats. This is thought to be due largely to the higher
percentage of heme pigments found in the red meats.
The total fat content ofmechanically processed meat varies due
to such things as differences in age of the cow, grade, and anatomical
location of the bones (20). Goldstrand (19) and Field (13) reported
that mechanically processed meat from beef neck bones was 9.9 to 24.4
percent fat, and 10 to 15 percent fat respectively. In contrast, how
ever, Field (13) reported that mechanically processed meat from beef
plates trimmed under commercial conditions was often 40 to 50 percent
fat. Analyses performed by the USDA indicated a range of 20 to 50
percent total lipids in mechanically processed meat (11). It should
be kept in mind, however,.that food products containing mechanically
processed meat are limited in the amount of total fat which can be
incorporated into the final product (6). It is, therefore, reasonable
to assume that the total fat content of those products would remain
the same. Thus, the use of mechanically processed meat would.not lead
to appreciable increases in dietary lipids when substituted for other
meat products of a similar fat content (11).

Iron
Being quite rich in myoglobin, the bone marrow also provides a
good source of iron (34). Because iron is an essential constituent
of hemoglobin, cytochrome, and other components of respiratory enzyme
systems (43), it is an element of great fundamental importance. How
ever a large segment of the population falls short of the recommended
dietary allowance for iron. Of all the nutrients, the iron allowance
is the most difficult to provide in the diet (35). With the lower
caloric requirements of girls and women, it is almost impossible for
them to supply their needs even with a good diet selection.
According to the 1965 dietary survey of the United States Depart
ment of Agriculture, females between the agesof nine and 54 years of
age fell short of the Recommended' Dietary Allowance for iron by 30
percent or more. Mayer (44) stated that iron deficiency anemia is
probably the most prevalent nutritional disorder among infants and
children in the United States. He further reported that one reason
for the prevalence of this condition among infants may be due to the
fact that the pregnant woman does not in.gest enough iron to maintain
adequate stores in the fetus.
Field (13) reported that although hand-deboned meat is a good
source of dietary iron, mechanically processed meat is an even better
source. He found that commercial hand-deboned ground meat contained
2.6 to 3 mg iron per 100 g meat. Mechanically processed meat, on the
other hand, contained an average of 4.3 to 6.3 mg per 100 g meat.
Therefore, approximately twice as much iron is present in mechanically
proc~ssed meat as in hand-deboned meat.
21

22
Since ground meat products are popular diet choices of the Ameri-
can population, the incorporation of mechanically processed meat in
such products may result in an increase in dietary iron intakes. Such
an increase is beneficial from a dietary standpoint.
Protein
The protein content of mechanically processed meat is somewhat
different from hand-deboned meat, but this difference can be expected
to be slight. The difference is due to the fact that some connective
tissue is removed by the mechanical deboner. Field and Riley (17)
found hydroxyproline, an indicator of the amount of connective tissue,
to be present in lesser amounts in mechanically-deboned lamb breasts
than in comparable hand-deboned lamb breasts. Field and Riley (17)
also reported that mechanically-deboned.lamb breasts contained less
glycine and proline than hand-deboned breasts. This further confirmed
that some connective tissue, as well as bone, is removed by the deboner
(13).
Beef, pork, and lamb bones come from the fabrication room with
large amounts of connective tissue attached to them. In addition,
the bones also contain 20 to 30 percent collagen (45). Therefore,
Field (13) reported,
Even though large amounts of connective tissue are removed during mechanical deboning, deboned meat from fabrication-room bones often contains as much connective tissue as many hand-deboned products (p. 42).
By determining the essential amino acid composition of various
mechanically processed meat samples, Field and Chang (46) were able
to assess the protein quality of the samples. Their findings revealed

the protein quality of mechanically processed meat to be dependent
on the amount of lean meat and collagen left on the bones prior to
deboning. The protein quality of mechanically processed meat which
contains more lean and less collagen is superior to the mechanically
processed meat which contains less lean and more collagen. This con
firmed Field's earlier findings (13). He reported that the highest
protein percentages were in mechanically processed meat samples from
bones which had the highest.percentages of meat left on them prior to
deboning. Bones which had the least meat adhering to them yielded
mechanically~deboned meat with the least protein and the most fat.
23
Field (1) also noted that there was an inverse relationship between
the percentages of protein and calcium present in mechanically processed
meat. Increasing the amount of meat on the bone increased the percent
age of protein present, but decreased the percentage of calcium and
ash. Just the opposite effect was seen when the amount of mean on the
bones was decreased. However, diluting the bone with more meat did
not reduce the weight.of calcium or ash extracted from the bone. It
merely·decreased the percentages because more meat.was present.
When whole carcasses or carcass parts are mechanically processed,
the composition of the resulting product is very similar to the compo
sition of hand-deboned meat from the same carcass (1). Field, Riley, ·
and Corbridge (18) hand~deboned one side of mutton carcasses and
mechanically processed the other side of the same carcass. They
reported that there was no significant differences in fat, protein,
or moisture content between hand-deboned and machine-deboned meat.
Field and Riley (17) reported similar results with whole beef carcasses
and lamb breasts. Calcium content of mechanically processed meat from

whole carcasses or carcass parts at 0.10 to 0.30 percent was much
lower than it was for bones (1).
24

CHAPTER III
METHODS AND PROCEDURES
In accordance with the stated purpose of this study, the researcher
analyzed the chemical composition of mechanically processed beef to
determine its nutritive content. The design of the study, the meat
sample selected, and the methods of analysis are contained in this
chapter.
Type of Research
The hypotheses were tested by means of the experimental method of
research design, Best (8) justifies the use of this method by stating
that experimentation is the most sophisticated, exacting, and powerful
method for discovering and developing an organized body of knowledge.
As defined by Compton and Hall (47), the experimental method is the
application of logic or reason to observations made in a completely
controlled situation where only one variable is permitted free play.
Such a variable is denoted as the independent variable.
In this study, the independent variable is the mechanical pro
cessing technique. Two dependent variables are included in the study.
These are the nutritive value of mechanically processed beef and the
nutritive value of hand-deboned beef (as reported in available
literature).
25

Meat Sample
Beehive Machinery, Inc., P.O. Box CC, Sandy, Utah, furnished the
mechanically p~ocessed meat to be used. Variables of age, grade, ana
tomical location, etc., were not controlled because mechanically pro
cessed meat samples typical of those likely to be used for commercial
products were desired.. However, the meat was to conform to standards
specified in the Federal Register, Volume 41, No. 82, page 19762,
April 27, 1976, for Class 7, Mechanically Deboned Meat.
Nutrient Analyses
26
Upon arrival of the mechanically processed meat, a series of chemical
analyses were performed to determine its:
1. mineral content,
2. protein content, and
3. fat content.
The procedures followed in the collection of data are also described.
Mineral Analyses. Mineral Analyses were determined with the aid of
the Perkin-Elmer Model 403 andModel 272 Atomic Absorption Spectropho
tometers. To obtain a reading of the percentages of minerals present,
the meat and standards were first digested. After reconstitution, they
were introduced into the spectrophotometer, and the concentration was
then multiplied times the dilution factor to arrive at the sample con
centration. Appendix Aoutlines the procedures used and the raw data
concerning the mineral analyses.
The above procedure was followed in determining calcium, magnesium,
manganese, zinc, iron, chromium, copper, lead, and potassium.

27
Phosphorus, however, was determined by means of chemical analysis (48).
To determine the phosphorus content, a set of standards ranging in
concentration from zero to 10 ug/g was first prepared. A mixture of
ammonium molybdate, ammonium metavandate, and concentrated nitric
acid was then added to the digested meat samples. The color was
allowed to develop for 30 minutes before the samples and standards
were read on the Coleman Junior II Spectrophotometer at 440 mu. A
standard curve was prepared and the samples were then plotted to
determine their concentration. Appendix B shows data related to
this determination.
Protein Analysis. Protein analysis of mechanically processed meat
was accomplished by means of the Kjeldahl procedure (Oklahoma State
University Meat Lab Procedure; outlined in Appendix C). The principle
of this method was to convert· the various nitrogenous compounds in the
meat into ammonia sulfate by boiling sampleswith concentrated sulfuric
acid. The ammonia sulfate was then decomposed upon the addition of
NaOH, and the liberated ammonia was collected in an acid of known
strength. The resulting solution was then titrated with an acid of
known strength and the protein content of the meat was computed.
(See Appendix C.)
Fat Analysis. To determine the percent fat present in mechanically
processed meat, the fat was first extracted from the sample. A.modified
version of the ether extraction proces~ described in the AOAC Handbook
(48) was used for this purpose. (See Appendix C.) To determine the
type and amount of fatty acids present in the samples, a portion of
the extracted fat was retained. A modified version of the quantative

28
method for the preparation of the extracted fat as described by Mason
and Waller (49) was utilized for this analysis. (See Appendix D.)
Cleaning the Glassware
In order to obtain accurate results from these tests, it was
imperative that the glassware be as clean as possible. This meant it
must be free not only of any dust, dirt, or adhering residue, but also
of any contaminants or minerals contained in the water in which it was
washed. Therefore, only double distilled, deionized water was used
throughout the study. The nitric acid used in the mineral analysis
was also glass-distilled to remove any impurities which it contained
and all glassware was washed with phosphate-free detergent. The glass-
ware was washed and rinsed in accordance with specifications outlined " .
in Handbook for Analytical Quality Control in Water and Wastewater
Laboratories (50). Distilled nitric acid was also used in the glass-
cleaning procedure. After being thoroughly rinsed, the glassware was
transferred to an enclosed drying oven and then stored in a sealed
glass cabinet. The samples and reagents were kept tightly covered
except when being used. Only plastic or teflon-coated tongs, forceps,
tweasers, etc., were used so as to avoid chromium contamination. For
the same reason, chrome-plated faucets and other· metalic items were
also covered with plastic.

CHAPTER IV
RESULTS AND DISCUSSION
This chapter includes a discussion of the data regarding the nutri
tive value of mechanically processed beef. The ·findings are compared
with previously reported data. A comparison was also made between the
nutritive content of mechanically processed meat and hand-deboned meat
when existirtg literature made such a comparison possible.
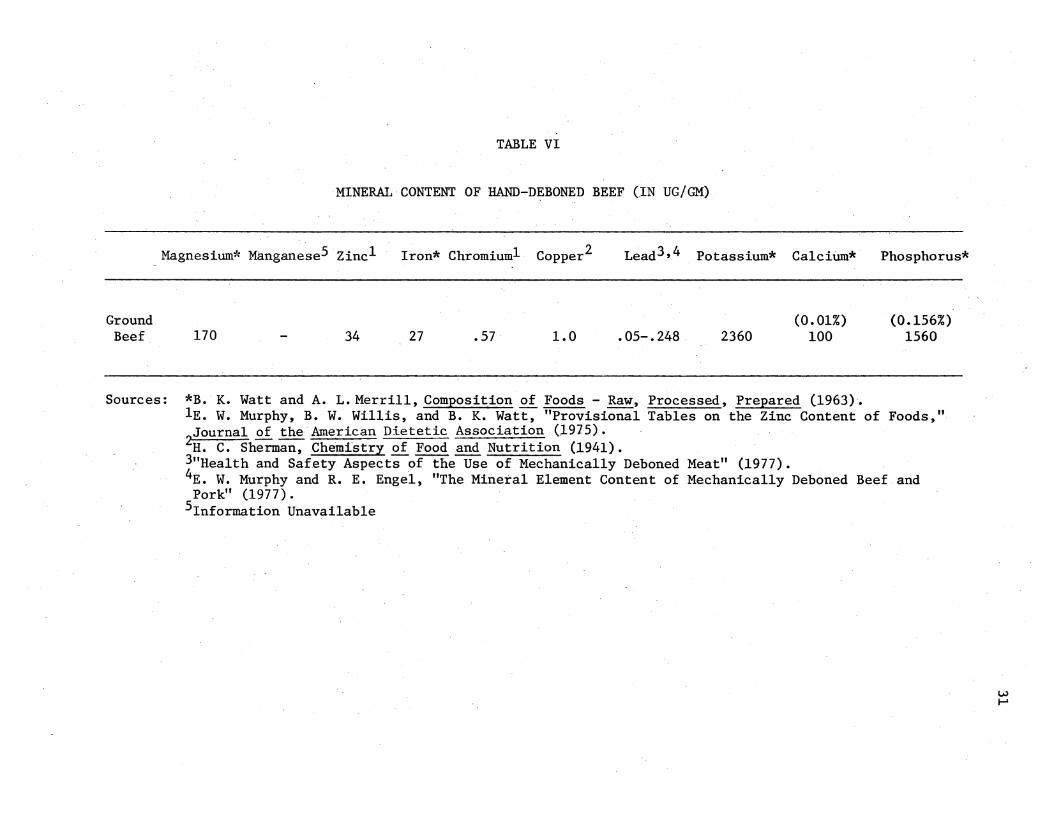
The individual minerals assayed and the corresponding quantities
present in mechanically processed meat are shown in Table V. Means,
variances (V.), and standard deviations (S.D.) are also shown for each
of the 10 minerals determined. For comparison, Table VI lists the
approximate quantity of the same minerals contained in hand-deboned
beef.
Mineral Comparison
As expected, mechanically processed beef was higher in calcium,
phosphorus, iron, chromium; and lead than was hand-deboned beef. A
very slight elevation in the copper content was noted in mechanically
processed beef, but not enough to be considered significant. Magnesium,
zinc, and potassium levels, however, were found to be higher in hand
deboned meat. Such an outcome could have been due to incomplete diges
tion, or the fact that the animals rations were low in these minerals.
However, judging from the large quantity of calcium present in the
29

TABLE V
MINERAL CONTE}IT OF MECHANICALLY PROCESSED BEEF (IN UG/GM)
Magnesium Hanganese Zinc Iron · Chromium Copper . Lead Potassium
Sample A 30.058 0.683 25.504 70.590 2.742 1~230 1.'776 139.359
Sample B 32.883 0. 715 25.497 71.486 .. 2.748 1.144 1. 763 141.065
Sample C 32.344 0. 708 25.269 63.171 2. 540 0.809 1.516 136.955
Mean 31.762 0. 702 25.423 68.416 2. 677 1.061 1.682 139.126
S.D. 1. 5000 0.017 0.134 4.564 0.119 0.222 0.144 2.065
v. 2.250 0.0003 0.018 20.831 0.014 0.050 0.021 4.264
Calcium
(1.72%) 17,218.978
(1. 81%) 18,068.702
(1. 78%) 17,750.000
(1. 77%) 17,679.227
0.046%
0.002%
Phosphorus
(0~68%) 6845.45
(0.69%) 6863.64
(0.74%) 7420.00
(0.70%) 7043.030
0.32%
0.001%
w 0
Ground Beef
TABLE VI
MINERAL CONTENT OF HAND-DEBONED BEEF (IN UG/GM)
Magnesium* Manganese5 Zincl Iron* Chromium! Copper2
170 34 27 .57 1.0
Lead3,4 Potassium* Calcium*
.05-.248 2360 (0.01%)
100
Phosphorus*
(0.156%) 1560
Sources: *B. K. Watt and A. L. Merrill, Composition of Foods- Raw, Processed, Prepared (1963). lE. W. Murphy, B. W. Willis, and B. K. Watt, "Provisional Tables on the Zinc Content of Foods," Journal of the American Dietetic Association (1915).
2H. C. Sherman, Chemistry of Food and Nutrition (1941). 3"Health and Safety Aspects of the Use of Mechanically Deboned Meat" (1977). 4E. W. Murphy and R. E. Engel, "The Mineral Element Content of Mechanically Deboned Beef and Pork" (1977).
5Information Unavailable

samples, it appeared that the processor may have used bones with very
little lean meat adhering to them--the net result being a product with
a great deal .of calcium, and a considerable amount of fat. Because the
aforementioned minerals were distributed in the lean muscle tissue of
the animal, this could account for the fact that the specified minerals
were present to a greater extent in hand-deboned meat than in mechan
ically processed meat.
The observed calcium values of 1.72 percent also exceeded the pro
posed USDA maximum calcium standards. Recent calcium analyses of
mechanically processed meat by other researchers in the field, however,
indicated a mean concentration of 0.5 percent in most samples of red
meat, with a few values being somewhat higher (11). In consideration
of this average calcium concentration (0.5 percent) for mechanically
processed meat, the additional calcium intake due to the ingestion of
mechanically processed beef in the form of 2 franks and 2 ounces of
bologna would be as follows in Table VII.
Assuming the mechanically processed meat contained an average
concentration of 1 percent calcium (the proposed USDA maximum allow
ance for mechanically deboned meat used for processing) the intake from
mechanically processed meat in these products would result in an addi
tion of 300 mg calcium per day.
In view of the fact that many people fall short of the RDA for
calcium, mechanically processed meat appears to be a good means of
supplementing the diet so as to compensate for that shortage. Assum
ing the RDA of 800 mg calcium per day was already met by the individual,
an addition of· 300 mg calcium per day would increase the ·intake: ·to
1100 mg calcium per day. In view of recent findings in the area of

33
calcium utilization and retention (52), this would not be considered an
excessive amount (11). However, the researcher is in favor of the pro-
posed ruling which requires appropriate labeling so as to inform the
consumer that the product contains additional calcium. If this were
done, the small percentage of the population which required a low cal-
cium intake for medical purposes could refrain from buying the product.
Also, those requiring a high calcium intake due to osteoporosis, or
long-term treatment with medications which induced a loss of calcium
could be made aware of the availability of the additional calcium.
Meat Product
Frank
Bologna
TABLE VII
PROJECTED CALCIUM INTAKE1 DUE TO THE INGESTION OF MECHANICALLY PROCESSED·BEEF PRODUCTS AT A
CONCENTRATION OF 1 PERCENT CALCIUM
MPM, 20% of ·Weight gm
Weight Calcium Quantity gm Theoretical Actual* mg/gm
2 120 24 20 5
2 oz. 60 12 10 5
Total. 30 gm/day
Calcium Cont.ent
of Added MPM
(mg)
100
50
150 mg/day
*Based on ~7 percent of weight because meat makes up approximately 85 percent of the total ingredients of the meat product.
!Projected intake of calcium due to the intake of meat products containing MPM has been calculated on the basis of cons~mption data. These data are showri in "Health and Safety Aspects of the Use of Mechanically Deboned Meat"· (1977).
Source: "Heal~h apd Safety Aspects of the Use of Mechanically Deboned Meat" (1977).

Average calcium~phosphorus ratios of the mechanically processed
meat as observed by the researcher were 2.5, while Murphy and Engel
(21) reported an average ratio of 1.7. This again tends to confirm
34
the researcher's hypoehesis that the mechanically processed meat under
investigation was composed of a large proportion of bone in relation to
lean meat. Soft tissues contain much higher amounts of phosphorus than
calcium, but in bones, the proportion of calcium to phosphorus is about
2:1 (35).
Zinc
Although Tables V and VI show·zinc to be higher in hand-deboned
meat than in mechanically processed meat, it would be expected that
this is not the case if the product was prepared in accordance with
government specifications. A study of mechanically processed meat per
formed by the USDA shows the concentration of zinc to range from 34.17
to 46.80 ug/gm (11). Thus, zinc content of the two kinds of beef were
very similar. These findings were also in agreement with the research
by Murphy and Engel (21).
Iron
The iron content of mechanically processed meat was considerably
higher than that of ha:nd-deboned meat. Murphy and Engel (21) reported
that a direct correlation existed between the calcium and iron content
of mechanically processed meat. Therefore, since the. mechanically pro
cessed meat analyzed for this study was higher in calcium than that
which would appear in consumer products, the mean value of 68.416 ug/gm
was also probably somewhat higher than that which would be observed in

35
mechanically processed meat prepared for commercial products. Murphy
and Engel (21) reported a mean value of 42.6 ug/g while the USDA
reported 54 ug/gm at the 90th percentile iron concentration (11). This
was slightly less than twice the value for iron in hand-deboned lean
beef.
Since many people do not meet the RDA for iron, mechanically pro-
cessed meat will be advantageous from a nutritional standpoint. Its
incorporation in the average American diet could result in a beneficial
increase in dietary iron intake by the United States population.
Lead
Murphy and Engel (21) reported a mean lead content of 0.09 ug
lead per gram meat when the mechanically processed meat contained a
mean calcium level of 0.63 percent. From this, they determined that
mechanically processed meat was only slightly higher in lead than its
hand-deboned counterpart, and thus presented no significant danger if
added to the American diet. United States Department of Agriculture
studies reported similar findings (11).
It was also determined that there was adirect relationship. bet-
ween the amounts of calcium and lead in mechanically processed meat. i
Therefore, the researcher in_ this.study determined that the samples
of mechanically processed meat under investigation contained agreater
quantity of lead (1.685 ug/gm) than was reported for mechanically pro-
cessed meat within the proposed calcium levels.
The quantities of lead that produce toxicity are 2000 to 3000 ug
per day for adults, and 1000 ug per day for children if exposure con-
tinues over several months. Furthermo-re, approximately one-half these

amounts can produce·changes in synthesis of hemoglobin (11). However,
the researcher determined that even at the concentration levels found
in the mechanically processed meat under investigation, the amount of
lead added to the diet would not lead to toxicity in the adult diet.
A representative lead intake due to the ingestion of mechanically pro-
cessed meat at a concentration of 1.685 ug/gm (the mean concentration
determined in this study) is shown in Table VIII.
TABLE VIII
PROJECTED LEAD INTAKE1 DUE TO THE INGESTION OF MECHANICALLY PROCESSED BEEF PRODUCTS AT A
CONCENTRATION OF 1.685 UG LEAD/GM MEAT
Meat Wt.
MPM, 20% of Weight gm
Product Quantity gm Theoretical Actual*
Frank 2 120 24 20
Bologna 2 oz 60 12 10
Lead mg/gm
.001685
. 001685
Lead Content
·of Added MPM
(mg)
.0337
.01685
36
Total 30 gm/day .05055 mg/day. or
50.55 ug/day :
*Based on 17 .percent of weight because meat makes up approximately 85 percent of the total ingredients of the meat product.
!Projected intake of lead due to the intake of meat products containing MPM has been calculated on the basis of consumption data. These data are shown in "Health and Safety Aspects of the Use of Mechanically Deboned Meat" (1977).

37
The tolerable lead intake for adults, as established by the World
Health Organization, is 429 ug lead per day or 7 ug lead per kg body
weight per day (11). Therefore, neither the 50 ug lead which would be
added to the adult diet, nor the amount added to the child's diet
(approximately one-half as much since his consumption would probably
be cut in half) should raise the concentration to a toxic level. The
concentration of lead (.05 ug/gm) found in mechanically processed meat
containing the proposed amount of calcium was considered insignificant
(11) and should not produce a noticeable change in one's lead intake.
Potassium
The potassium content of the mechanically processed meat was consid
ably lower than the level determined by Watt and Merrill (23) in hand
deboned beef. Because of the large percentage of bone material in the
mechanically processed meat, it is believed the observed reading may
be largely a measure of the potassium content of th~ bone and its
marrow.
Lipid Content
The mean total lipid content of the mechanically processed meat
under investigation was 33.32 percent, with individual samples ranging
from 25.44 percent to 49.06 percent. Since the fifteen samples analyzed
were obtained from the same batch of meat, the possibility exists that
there may have been pockets of fat distributed unevenly within the bulk
sample. The mean lipid content was actually only slightly greater
than that of regular ground beef which may contain as much as 30 per
cent fat (53). Watt and Merrill (23), however, established the mean
total fat content of ground beef to be 21.2 percent. Kunsman and
Field (20) also reported that mechanically processed meat from beef
has a lipid spectrum similar to that of ground beef. However, the
mechanically processed meat analyzed for their study contained con
siderably less fat (8.8 percent) than was determined by the researcher
in this project. Differences in lipid content reflect differences in
age, grade, anatomical location, amount of meat and fat attached to
the bone, size of bone, etc.
38
Tables IX through XII contain summarized results of the fat
determination. By means of gas chromatographic analysis, the research
er was able to identify and quantitate the various fatty acids present
in the lipid portion of the mechanically processed beef (see Table X).
Table XI portrays the percent saturated fatty acid versus the percent
unsaturated fatty acid present. As can be seen, the total lipid content
was low in polyunsaturated fatty acids. Linoleic and linolenic acid
comprised only 2.1 percent of the total lipid spectrum. Arachidonic,
if present, was in such small·quantities that it was undetectable by
the gas chromatograph. · The total polyunsaturated fatty acid content
of hand-deboned ground beef as determined by Anderson, Kinsella, and
Watt (54) was 0.9 percent. Therefore, mechanically processed meat is
significantly higher in polyunsaturated fatty acids than is hand
deboned meat. This was an expected outcome of the study because the
bone marrow lipl,ds found in mechanically processed meat contain more
polyUnsaturated fatty acids than the subcutaneous or intramuscular
fat (40, 41).
Mean total saturated fatty acid content of the mechanically pro
cessed meat was 18.95 percent while unsaturated fatty acids comprised

TABLE IX
FAT DETERMINATION OF MECHANICALLY PROCESSED BEEF
Weight Tube and Difference of Meat Meat Weight in Dry Wt.
(Dried) Weight Wet and Tube Moisture After Before and * Percent1 Tube Tube .of Meat Sample After (Difference Percent Extraction After
No. Wt. and Tube Weight Drying in Weight) Moisture and Drying Extraction Fat
10 11. 7044 13.8938 2.1894 13.0601 0.8337 38.08 12.2949 0.7652 34.95 60 12.5526 ·14.7886 2.2360 13.8790. 0.9096 40.68 13.0965 0.7825 35.00 80 12.2395 14.4026 2.1631 13.4821 0.9205 42.55 12.6479 0.8342 38.57
130 12.1472 14 0 2863 2.1391 13.4063 0.8800 41.14 12.8149 0.5914 27.65 140 12.4872 14.5406 2.0534 13.7544 0.·7862 38.29 13.1090 0.6454 31.43
4 12.3749 14.4504 2.0755 13.5425 0.9079 43.74 13.0607 0.4818 23.21 180 12.3737 14.5203 2.1466 13.5708 0.9495 44.23 12.7184 0.8524 39.71
C9 12.7700 14.7782 2.0082 13.8758 0.9024 44.94 13.3346 0.5412 26.95 190 12.4323 14.5763 2.1440 13.6322 0.9441 42.09 13 0 0867 0.5455 25.44 220 12.1055 14.3248 2.2193 13.3973 0.9275 41.79 12.7162 0.6811 30.69 250 12.2037 14.4966 2.2929 13.5741 0.9225 40.23 12.6453 0.9288 40.51 260 12.0394 14.0412 2.0018 13.1753 0.8659 43.26 12.1933 0.9820 49.06
1030 12.2608 14.5478 2.2870 13.6171 0.9307 40.70 12 0 9642 0.6529 28.55 6030 12.2585 14.4477 2.1892 13.5043 0.9434 43.09 12.7707 0.7336 33.51 4050 12.7335 14.8803 2.1468 13.9996 0.8807 41.02 13 0 2585 0. 7411 34.52
2= 625.83 ~= 499.7 5 X= 41.72 X= 33.32
*Percent moisture equals moisture ~ weight of sample x 100 lpercent fat equals difference in dry weight before and after extraction + weight of sample x 100 w
\0

TABLE X
FATTY ACID ANALYSIS OF MECHANICALLY PROCESSED BEEF

TABLE XI
MECHANICALLY PROCESSED BEEF: PERCENT SATURATED FATTY ACIDS VERSUS PERCENT UNSATURATED FATTY ACIDS
Percent Saturated Fatty Acids Total*
Percent Unsaturated Fatty Acids
col2 col4 col6 col8 Saturated
cll6 ellS c1118 clnls Sample Fatty Number Lauric Myristic Palmitic Stearic Acids Palmitoleic Oleic Linoleic Linolenic
10 1. 96 3.51 29.83 16.69 51.99 3.99 41.47 1.45 1.09 60 • 68 2.99 32.76 19.64 56.07 4.43 38.01 . 7 5 .74 80 . 93 3.34 29.02 17.11 50.40 4.30 42.81 1.37 1.12
130 1.26 3.30 29.71 18.42 52.69 3.10 41.99 1.23 .98 140 . 2.14 3.86 35.46 22.42 63.88 3.60 30.74 .86 .92
4 2.13 3.43 28.65 20.42 54.63 . 4.62 39.19 1.00 .56 180 1.03 3.31 32.33 20.45 57.12 .77 39.70 1.45 .96
C9 2.31 3.43 30.40. 21.59 57.73 3.63 36.71 .97 .97 190 2.87 3.67 35.46 21.94 63.94 3.42 30.71 .94 .99 ~20 .79 3. 72 31.10. 23.81 59.42 3.24 35.09 1.29 .96 250 . 65 3.17 33.37 21.73 58.92 3.98 35.35 .85 .91 260 1. 22 3.54 31.27 20.38 56.41 4.04 37.75 .85 .97
1030 4.37 3.94 29.47 22.78 60.56 3.65 33.84 1.00 .97 6030 .52 3.12 28.74 18.49 50.87 4.25 41.49 1.88 1.51 4050 .78 3. 28 . 33.14 21.26 58.46 3.59 35.99 1.00 .96
$ 23.64 51.61 470.71 307.13 853.09 54.61 560.84 16.89 14.61
Mean 1. 58 3.44 31.38 20.48 56.87 3.64 37.39 1.13 .97
v. 1.13 • 07 5.22 4.31 17.99 .8237 14.74 .10 .04
S.D. 1. 06 .26 2.28 2.08 4.24 .9076 3.84 .31 .20
*As·a percent of the total fat present
Total* Unsaturated
Fatty Acids
48.00 43.93 49.60 47.30 36.12 45.37 42.88 42.28 36.06 40.58 41.09 43.61 39.46 49.13 41.54
646.95
43.13
17.96
4.24
+:--I-'

42
the remaining 14.37 percent; thus totaling the 33.32 percent fat present.
Table XII shows a comparison of the fatty acid content of the two types
of meat in question. Due to the greater percentage of unsaturated fatty
acids in mechanically processed meat, its storage life may be noticeably
reduced.
TABLE XII
PERCENT FAT IN HAND-DEBONED BEEF VERSUS PERCENT FAT IN MECHANICALLY PROCESSED BEEF
Total Percent Fat Saturated
Meat Product % Fat**
fland-Deboned Beef* 21.20 10.00
Jlfechanically Processed Beef 33.32 18.95
Percent Unsaturated
Fat**
11.20
14.37
*Source: B. K." Watt and A. L. Merrill, Composition of Foods - Raw, Processed, Prepared (1963).
**As a percent of the total fat present
Moisture Content
Moisture content of the mechanically-deboned meat ranged from 38.08
to 44.94 percent with a mean of 41.72 percent. These findings were in
. agreement with those of Field (13) who reported a range of 30 to 45
percent moisture in mechanically processed meat obtained from beef
plates. This is in contrast to the 60.2 percent moisture content of
ground beef (23) .'

Protein Content
The mean protein content of mechanically processed meat as deter
mined by the Kjeldahl procedure was 13.55 percent. (See Appendix C.)
This was in agreement with the findings of Murphy and Engel (21) who
reported an average of 13.5 percent protein. Mechanically processed
meat was lower in protein than hand-deboned ground beef which was
determined to have a mean value of 17.9 percent protein (23). This
was expected, since some of the connective tissue is also discarded
along with the bone residue.
43

CHAPTER V
SUMMARY AND RECOMMENDATIONS
The purpose of this work was to d.etermine the protein, mineral,
and fat content of mechanically processed beef. In so doing, the
researcher wished also to compare its nutritive content with reported
values for hand-deboned beef.
A variety of methods were used. Mineral analyses were determined
by the atomic absorption spectrophotometer and a colorimetric assay
procedure.
An ether extraction was used to determine the fat content of
mechanically processed beef and the gas chromatograph was utilized to
identify the various fatty acid components of the fat. To ascertain
the amount of protein in mechanically processed meat, the Kjeldahl
method of protein analysis was used. Literature referring to the
nutritive quality of hand-deboned beef was used to establish a com
parison between the two types of meat.
The results were presented in chart form. The mean values were
compared with values reported by other researchers as well as with
values reported for a similar cut of hand-deboned beef. Minerals
determined were calcium, phosphorus, magnesium, manganese, zinc, iron,
chromium, copper, lead, and potassium.
In general, it was determined that mechanically processed meat
is similar to hand-deboned meat in many respects. Although higher
44

in calcium than hand-deboned beef, this is not considered detrimental
from a nutritional standpoint. In fact, it:may be considered an asset
to those not meeting the RDA for calcium.
The increased mineral content, which may also prove beneficial to
many, was not so highly concentrated in any one nutrient as to produce
toxicity. S.ince products containing mechanically processed meat would
be limited in total fat content, it is assumed that the use of mechan
ically processed meat would not lead to an appreciable increase in
dietary fat intake. However, the higher unsaturated fat content of
mechanically processed meat could result in accelerated deterioration
during storage.
Recommendations for Further Study
Because mechanically processed red meat is a relatively new pro
cedure in the food processing industry, there is still a lot to be
learned about the practical application and use of the product.
45
Due to the injunction imposed upon the manufacture of the product
at the time of this study, the author was able to receive only one
shipment of mechanically processed beef for research purposes. It is
therefore recommended that the study be repeated when production begins
again so 'that correlations and variances between the various nutrient
components could be established among a number of different samples.
A comparison of the nutrient values of cooked mechanically pro
cessed meat versus raw processed meat would also be of value. In so
doing, it would also be possible to determine the effect that differen~
cooking methods and/or temperatures had on the nutrient content of the
meat.

46
Many different rations and methods of feeding are available to
the rancher today. Therefore, it might also be interesting to conduct
a long-term study to see if either of these factors greatly affected
the quality of the resulting meat fraction. Because the soil differs
in mineral content between regions of the country, it is also recom
mended that studies be done to determine if there is enough variation
between geographic areas to affect the nutrient content of the mechan
ically processed meat. Studies of variances in grades as well as breeds
of animals would also add more to our knowledge in this area.

(1) Field, R. A.: deboners.
A SELECTED BIB~IOGRAPHY
Increased animal protein production with mechanical World Review of Animal Production. 12:61, 1976.
(2) Froning, G. W.: Mechanically-deboned poultry meat. Food Technology. 30(9):50, 1976.
(3) Walker, A. R. P.: The human requirement of calcium: should low intakes be supplemented? American Journal of Clinical Nutrition. 25:518, 1972.
(4) Lutwak, L.: The role of dietary calcium:phosphorus ratio in human nutrition. Proceedings of the Meat Industry Research Conference. 63, 1975.
(5) Knox, E. G.: Ischaemic-heart-disease mortality and dietary intake of calcium. Lancet. 1:1465, 1973.
(6) Federal Register. 41(82):17535-19762, April 27, 1976.
(7) MPI Bulletin 76-111. Washington, D. C.: U. S. Department of Agriculture, July 6, 1976.
(8) Best, J. W.: Research in Education (3rd ed.). Englewood Cliffs, New Jersey: Prentice-Hall, Inc., 1977.
(9) Pike, R. L., ·and Brown, M. L.: Nutrition: . An Integrated Approach. New York, New York: John Wiley and Sons, Inc., 1975.
(10) Fried, I.: Regulatory considerations concerning mechanically deboned red meat. Food Technology. 30:35, 1976.
(11) Health and Safety Aspects of the Use of Mechanically Deboned Meat. Final Report and Recommendations of the Select Panel. August, 1977.
(12) Knight, S., and Winterfeldt, E. A.: Nutrient quality and acceptability of mechanically deboned meat. Journal of the American Dietetic Association. 71:501, November, 1977.
(13) Field, R. A.: Mechanically-deboned red meat. Food Technology. 30(9):38-48+, 1976.
47

(14) Cross, H. R., Stroud, J., Carpenter, z. L., Kotula, A. W. Nolan, T. W., and Smith, G. C.: Use of mechanically deboned meat in ground beef patties. Journal of Food Science. 42(6):1496, 1977.
(15) Seligshon, M.: Fumble by USDA leads to setback for deboned meat. Food Engineering, November, 1976, 20.
(16) Field, R. A.: Mechanically-deboned meat. Proceedings of the Reciprocal Meats Conference. 35-42, 1974.
48
(17) Field, R. A., and Riley, M. L.: Characterization of meat from mechanically deboned lamb breasts. Journal of Food Science. 39:851, 1974.
(18) Field, R. A., Riley, M. L., and Corbridge, M. H.: Characterization of mechanically deboned hot and cold mutton carcasses. Journal of Food Science. 39:282, 1974.
(19) Goldstrand, R. E.: Mechanically-deboned meats--yields and product characteristics. Proceedings of the 28th Annual Reciprocal Meat Conference, National Livestock and Meat Board, ChicFgo, Illinois: 116, September, 1975.
(20) Kunsman, J. E., and Field, R. A. : The lipid content of mechanically deboned red meats. Division of Animal Science, University of Wyoming: 1977.
(21) Murphy, E. W., and Engel, R. E.: The Mineral Element Content of Mechanically Deboned Beef and Pork. Meat and Poultry Inspection Program Food Safety and Quality Service. Presented at Western Hemisphere Nutrition Congress V, Quebec, Quebec, Canada: August 17, 1977.
(22) Chang, Y-0., and Field, R. A.: Journal of Nutrition. 107:1947, 1977 0
(23) Watt, B. K., and Merrill, A. L.: Composition of Foods--Raw, Processed, Prepared (U. S. Department of Agriculture Handbook No.8). Washington, D. C.: U. S. Government Printing Office, 1963.
(24) Food and Nutrition Board. Recommended Dietary Allowances. National Academy of Sciences, Washington, D. C.: 1974.
(25) 1965 Household Food Consumption Survey 1965-66. Food and Nutrient Int:ake of Individuals in the United States, Spring 1965. Agricultural Research Service, U. S. Department of Agriculture. Tables 93 and 102. Report No. 11 Washington, D. C.: 1972.

(26) Ten-State Nutrition Survey 1968-1970. Center for Disease Control. Health Services and Mental Health Administration, U. S. Department of Health, Education and Welfare, V. Dietary. p. 11, 92, 267. DREW Publication (HSM) 72-8133.
(27) Abrahams, 0., Schaefer, M., Kohrs, M. B., O'Neal, R., Smith, D., and Eklund, D.: Nutritional status of preschool children in Missouri (abst.). Federal Proceedings. 36:1182, 1977.
(28) Lee, C. J., and Johnson, G. H.: Nutrient intakes of selected mothers and their school aged children in Kentucky (abst.). Federal Proceedings. 36:1182, 1977.
(29) Forbes, E. B., Halverson, J. 0., Morgan, L. E.,.and Schultz, J. A.: Ohio Agricultural Experiment Station. The Metabolism of Calcium Compounds by Growing Swine. Bulletin No. 437' 1921.
49
(30) Mitchell, H. H., Carrol, W. E., Hamilton, T. S., Garrigus, W. P., and Hunt, G. E.: University of Illinois Agricultural Experiment Station. Calcium and Phosphorus Supplements
(31)
for Growing Swine (Bulletin No. 434). 1937.
Spencer, H., Friedland, studies in mineral tion. L. Zipkin. Inc., 689, 1973.
J. A., and Ferguson, V.: Human balance metabolism. In: Biological Mineraliza~ New York, New York: John Wiley and Sons,
(32) Field, R. A., Riley, M. L., and Corbridge, M. H.: Influence of yield on calcium content of mechanically deboned lamb and mutton. Journal of Food Science. 39:285, 1974.
(33) Posner, A. S.: Crystal chemistry of bone mineral. Physiological Review. 49:760, 1969.
(34) Guyton, A. C.: Textbook of Medical Physiology. Philadelphia, Pennsylvania: W. B. Saunders Company, 1976. .
(35) Robinson, C. H.: Normal and Therapeutic Nutrition (14th ed.). New York, New York: MacMillan Publishing Company, Inc., 1972.
(36) Waldbott, G. L.: Fluoride in food. American Journal of Clinical Nutrition. 12:455, 1963.
(37) Marier, J. R., and Ro~e, D.: The fluoride content of some foods and beverages--a brief survey using a modified Zr-SPADNS method. Journal of Food Science. 31:941, 1966.
(38) Field, R. A., and Riley, M. L.: Specific gravity estimates of bon~ 'composition. Proceedings of the Western Sec. Amer. Soc. Animal Science. 26:70, 1975.

(39) Gong, J. K., and Arnold, J. S.: Skeletal marrow volume in dog. American Journal of Physiology. 209:340, 1975.
(40) Moreck, K., and Ball, H. R., Jr.: Lipids and fatty acids of chicken bone marrow. Journal of Food Science. 38:226, 1973.
50
(41) Mello, F. C., Jr., Field, R. A., Froenza, S., and Kunsman, J. E.: Lipid characterization of bovine bone marrow. Journal of Food Science. 41:226, 1976.
(42) Dimick, P. S., MacNeil, J. H., and Grunden, L. P.: Poultry product quality. Carbonyl composition and organoleptic evaluation of mechanically deboned poultry meat. Journal of Food Science. 37:544, 1972.
(43) Latner, A. L.: Clinical Biochemistry (7th ed.). Philadelphia, Pennsylvania: W. B. Saunders Company, 1975.
(44) Mayer, J.: U. S. Nutritrion Policies in the Seventies. San Francisco, California: W. H. Freeman and Company, 1973.
(45) Brown, R. G., Aeschbacker, H. U., and Frank, D.: Connective tissue metabolism in swine Iv: Growth dependent changes in the composition of long bones in female swine. Growth. 36:389, 1972.
(46) Field, R. A., and Chang, Y-0.: Protein utilization of mechanically d.eboned meat by growing rats. Journal of Nutrition. 107:194 7, 1977.
(47) Compton, N.H., and Hall, 0. A.: Foundations ofHome Economics Research A Human Ecology Approach. Minneapolis, Minnesota: Burgess Printing Company, 1972.
(48) AOAC Official Methods of Analysis (11th ed.). Washington, D. C.: Association of Official Agriculture Chemists, 1970.
(49) Mason, M. E., and Waller, G. ~.: Dimethoxypropane induced transesterification of fats and oils in preparation of methyl esters for gas chromatographic analysi~. Analytical Chemistry. 36:583, March, 1964.
(50) ;Handbook for Analytical Quality Control in Water and Wastewater Laboratories. Analytical Quality Control Laboratory, National Environmental Research Center. June, 1972.
(51) Sherman, H. C.: Chemistry of Food and Nutrition. New York, New York: The Macmillan Company, 1941.
(52) Spencer, H., Kramer, L., Norris, C., and Osis, D.: Studies of calcium requirement in man. Federal Proceedings. 103: ~021, 1~73.

(53) Kotschevar, L. H.: Quantity Food Purchasing (2nd ed.). New York, New York: John Wiley and Sons, Inc., 1975.
(54) Anderson, B. A., Kinsella, J. A., Watt, B. K.: Comprehensive evaluation of fatty acids in foods. Journal of the American Dietetic Association. 67:35, 1975.
(55) Knight, N. S.: "Comparison of Nutritional Adequacy and Other Variables with Chromium, Iron, Copper, Zinc, Magnesium, and Manganese Concentrations in Human Hair." (Unpublished Ph.D. dissertation, Library, Oklahoma State University, 1977). .
(56) Murphy, E. W., Willis, B. W., and Watt, B. K.: Provisional Tables on the Zinc Content of Foods. Journal of the American Dietetic Association. 66:345, 1975.
(57) Perkin Elmer Operating Manual. Analytical Methods for Atomic Absorption Spectrophotometry. Norwalk, Connecticut, 1964.
51

APPENDIX A
DATA RELATED TO MINERAL ANALYSES
52

53
Mineral Analyses
Digestion*
Fifteen samples of mechanically processed meat, each weighing
approximately two grams were covered with 60 ml concentrated 3:1 70
percent HN03 : 70 percent HCl04 in 200 ml beakers. Tight-fitting cover-
slips were then placed on each beaker, and they were allowed to sit
overnight •. After replacing the coverslips with raised ones, complete
oxidation of the organic matter was obtained by heating the samples.
To insure even heating, the beakers were placed in an electric skillet
containing mineral oil. A thermometer was placed in the oil to monitor
the temperature, and the digestion temperature was gradually raised
to approximately 1600 C.
The samples were allowed to evaporate to approximately two ml.
This usually required 10 to 15 hours. ·If at this point, any of the
samples were not clear and colorless, five ml of 30 percent HzOz was
added to each sample, and heating was continued. If still not color-
less, the procedure was again repeated.
Reconstitution
After the samples became clear and colorless, five ml HN03 was
added to the beakers and they were evaporated to near dryness (approxi-
mately one ml). The sides of the beakers were then rinsed several times
with distilled water, and they were again evaporated to approximately
*This procedure is a modified version of the one presented by Knight (55).

54
one to two ml. This rinsing process was repeated three times before the
beakers were removed from the heat and each sample transferred to a
separate 10 ml volumetric flask. The samples were then allowed to cool
before being brought to volume with distilled water. These 10 ml samples
were then filtered into plastic sample bottles where they were kept under
refrigeration until the mineral content was determined with the aid of
an atomic absorption spectrophotometer.
At this time, five of the 10 ml samples (excluding the blanks) were
randomly selected. They were combined in a 50 ml container and desig
nated as Sample A. The procedure was repeated a second and a third
time to generate Samples B and C respectively. The five blanks were
also combined.
Reading the Samples
Standard solutions, in ug/g, for each mineral to be assayed were
prepared to bracket the expected concentrations of the mechanically
processed meat samples. The standards and samples were then read on
the Perkin Elmer Atomic Absorption Spectrophotometer using the pro
cedure outlined in the Perkin Elmer Operating Manual (57).
The Perkin Elmer Model 403 was used to analyze the minerals in
higher concentration, while the Perkin Elmer Model 272, which is more
sensitive, was required for the analysis of those minerals present
only in very small concentration. The standards' readings were used
to plot standard curves and the sample concentrations were then read
from the standard curves. The machine did this automatically, thus
reducing any margif of error. The concentration of a mineral in the
mechanically processed meat was calculated as follows:

concentration (as read from Perkin-Elmer) x dilution factor = sample value (ug/g)
Raw data showing the amount of meat used in the 15 samples for the
digestion procedure, the result of the random selection which yielded
Samples A, B, and C, and the calculation of the dilution factors for
each sample follow.
55

56
MEAT DIGESTION DATA
Beaker Beaker Beaker and Meat Meat Number Weight Weight .weight
122 74.2277 76.2334 2.0057
2 76.9992 .79.0270 2.0278
3 89.0647 91.0316 1. 9669
102 54.2680 56.2476 1. 9796
54 91.8475 94.04 71 2.1996
55 77.1460 79.1481 2.0021
5 77.9495 80.2528 2.3033
66 94.9854 97.3548 2.3694
7 . 77.0341 79.1440 2.1099
6 77.4525 79~7394 2. 2869
63 90.7856 92.7842 1.9986
61 90.8901 93.1703 2.2802
1 . 76.3548 78.4802 2.1254
n. 76.2172 78.3430 2.1258
12* 76.2075 80.7661 2.5586
*Had to be discarded due to spillage
Five blanks were also prepared

57
GENERATION OF SAMPLES A, B, AND C AS A
RESULT OF RANDOM SELECTION
Sample A= Numbers: 61 5 6 7
63
in 50 ml solution
Sample B = Numbers: 66 2 3
55 1
in 50 ml solution
Sample C Numbers: 102 54 11
122
in 42 ml solution
Blank = Numbers: 51 401
16 402
50
in 50 ml solution

CALCULATION OF DILUTIONS:
Sample A = Numbers: 61 2.2802 gm meat
5 2.3033 gm meat
6 2.2869 gm meat
7 2.1099 gm meat
63 1.9986 gm meat
10.9789 gm meat I SO ml solution
Sample B Numbers: 66 2.3694 gm meat
2 2.0278 gm meat
3 1.9669 gm meat
55 2.0021 gm meat
1 · 2.1254 gm meat
10.4916 gm meat I 50 ml solution
Sample C = Numbers: 102
54
11
122
1. 9796 gm meat
2.1996 gm meat
2.1258 gm meat
2.0057 gm meat
8.3107 gm meat I 42 ml solution
Sample A Dilution Factor equals:
50 ml + 10.9789 4.5542
Sample B Dilution Factor equals:
50 ml + 10.4916 4.7657
Sample (. Dilution Factor equals:
42 ml + 8.3107 5.0537
58

APPENDIX B
DATA RELATED TO PHOSPHORUS DETERMINATION
59

PHOSPHORUS DETERMINATION
Sample A determination:
1. Had 10.9789 gm meat I 50 ml solution
2. Took 0.5 ml of #1 and diluted to 10 ml
3. Took 0.5 ml of tl2 and added 3.5 ml distilled H20 + 1 ml
HN03-ammonium molybdate, ammonium metavandate to equal 5 ml.
Calculations:
L 10.9787 -t 50 0.2196 gm meat I ml
2. .2196 X 0.5 = 0.1098 gm meat I 10 ml
.1098 -t 10 = 0.01098 gm meat I ml
3. 0.5 X .01098 = 0.00549 gm meat I 5 ml
.00549 -t 5 0.001098 gm meat I ml
Therefore, 1 ml solution contained 0.0011 gm meat. From the
graph, the researcher determined that the sample contained 7.53
ug phosphorus I ml solution .
7.53 -t 0.0011 = 6845.45 ug phosphorus I gm meat
Sample B determination:
1. Had 10.4916 gm meat I 50 ml solution
2. Took 0.5 ml of #1 and diluted to 10 ml
3. Took 0.5 ml of #2 and added 3.5 ml distilled H2o + 1 ml
HN03-ammonium molybdate, ammonium metavandate to equal
5 ml.
60 '
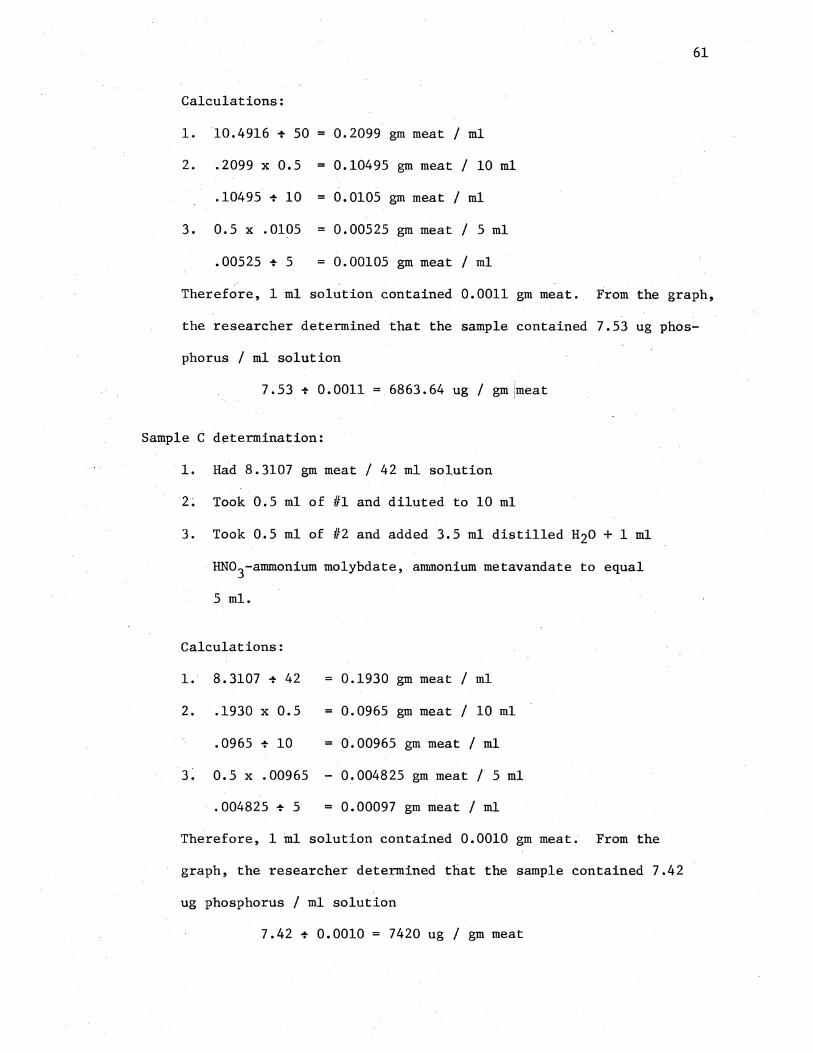
61
Calculations:
1. 10.4916 -t 50 = 0.2099 gm meat I ml
2. .2099 X 0.5 0.10495 gm meat I 10 ml
.10495 -t 10 = 0.0105 gm meat I ml
3. 0.5 X .0105 = 0.00525 gm meat I 5 ml
.00525 -t 5 0.00105 gm meat I ml
Therefore, 1 ml solution contained 0.0011 gm meat. From the graph,
the researcher determined that the sample contained 7.53 ug phos
phorus I ml solution
7.53 -t 0.0011 6863.64 ug I gm !meat
Sample C determination:
1. Had 8. 3107 gm meat I 42 ml solution
2~ Took 0.5 ml of #1 and diluted to 10 ml
3. Took 0.5 ml of #2 and added 3.5 ml distilled H20 + 1 ml
HN03-amrnonium molybdate, ammonium metavandate to equal
5 ml.
Calculations:
1. 8. 3107 -t 42
2. .1930 X 0.5
.0965 -t 10
0.1930 gm meat I ml
0.0965 gm meat I 10 ml
0.00965 gm meat I ml
3; 0.5 x .00965 -0.004825 gm meat /5 ml
.004825 -t 5 = 0.00097 gm meat I ml
Therefore, 1 ml solution contained 0.0010 gm meat. From the
graph, the researcher determined that the sample contained 7.42
ug phosphorus I ml solution
7.42 -t 0.0010 = 7420 ug I gm meat

APPENDIX C
DATA RELATED TO PROTEIN DETERMINATION
62
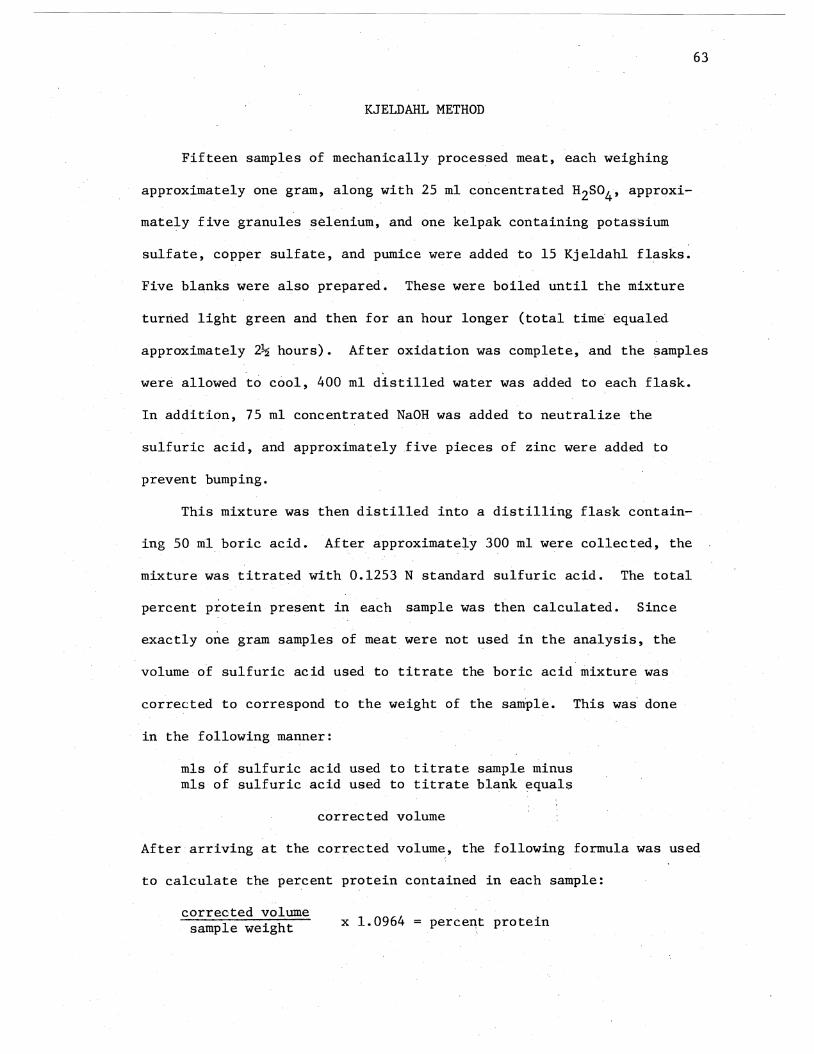
63
KJELDAHL METHOD
Fifteen samples of mechanically processed meat, each weighing
approximately one gram, along with 25 ml concentrated H2so4 , approxi-
mately five granules selenium, and one kelpak containing potassium
sulfate, copper sulfate, and pumice were added to 15 Kjeldahl flasks.
Five blanks were also prepared. These were boiled until the mixture
turned light green and then for an hour longer (total time equaled
approximately 2~ hours). After oxidation was complete, and the samples
were allowed to cool, 400 ml distilled water was added to each flask.
In addition, 75 ml concentrated NaOH was added to neutralize the
sulfuric acid, and approximately five pieces of zinc were added to
prevent bumping.
This mixture was then distilled into a distilling flask contain-
ing 50 ml boric acid. After approximately 300 ml were collected, the
mixture was titrated with 0.1253 N standard sulfuric acid. The total
percent protein present in each sample was then calculated. Since
exactly one gram samples of meat were not used in the analysis, the
volume of sulfuric acid used to titrate the boric acid mixture was
corrected to correspond to the weight of the sample. This was done
in the following manner:
mls of sulfuric acid used to titrate sample minus mls of sulfuric acid used to titrate blank equals
corrected volume
After·arriving at the corrected volume, the following formula was used
to calculate the percent protein contained in each sample:
corrected volume sample weight x 1.0964 = perce~t protein

Sample Number
8029
8030
8031
8032
8033
8058
8059
8060
8063
8064
8065
16
19
20
21
Blanks
18
5-17
26
27
Blk
PROTEIN DETERMINATiuN DATA
Weight of·Sample
.9998
1.0001
1.0000
1.0000
1.0000
.9997
.9997
1.0000
.9987
1.0000
1.0003
1. 0004
.9996
1.0000
1.0000
64
ml of sulfuric acid required to titrate
12.50
12.65
12.75
12.85
12.70
13.00
12.05
12.20
12.50
12.60
12.60
12.70
12.40
12.65
12.00
.15
.10
.15
.225
.10
.725
Mean = .145

65
PROTEIN CALCULATIONS
Mls of sulfuric acid used to titrate sample minus Mls of sulfuric acid used to titrate blank equals
Corrected Volume
Corrected volume X 1. 0964 percent protein = Sample weight
Sample Corrected Percent Number Volume Protein
8029 12.355 13.5487
8030 12.505 13.7091
8031 12.605 13.8201
8032 12.705 13,3238
8033 12.555 13.7653
8058 12.855 14.0985
8059 11.905 13.0566
8060 12.055 13.2183
8063 12.355 13.5637
8064 12.455 13.6557
8065 12.455 13.6516
16 12.555 13.7597
19 12.255 13.4418
20 12.505 13.7105
21 11.855 12.9978
203.3212 !'
mean = 13.5547

APPENDIX D
DATA RELATED TO FAT ANALYSIS
66

67
FAT ANALYSIS PROCEDURE
Ether Extraction
Fifteen mechanically processed samples, each weighing approximately
2 grams, were placed in fat extraction tubes and accurately weighed.
The samples were held in a drying oven for 6 hours at a temperature of
102-1090 C. After allowing them to cool in a desiccator, they were
again weighed with the loss in weight recorded as moisture. The samples
were extracted overnight with diethyl ether as outlined in the AOAC Hand
book (48), redried, and weighed again. Loss in weight was divided by the
sample weight and multiplied times 100 to determine the percent fat
present.
Fatty Acid Analysis
Approximately 20 mg o·f the extracted fat was accurately weighed
into 15 stoppered test tubes. Reagents were added in the following
order: 4 ml sodium-dried benzene, 0.04 ml 2,2-dimethoxypropane, and
0.5 ml of metanolic hydrochloric acid. The reaction mixture was
allowed to stand overnight at 22° C. to ensure complete transesterifi
cation. Afterwards, the mixture was evaporated to dryness so as to
remove the benzene, acetone, HCl, and MeOH. This was accomplished by
bubbling gaseous nitrogen through the mixture while blowing hot air
across the top of the test tube. The sample was the~ injected into
the Perkin-Elmer 990 gas chromatograph.
As the mixture passed through the instrument~ the shorter-chain
fatty acids proceeded through the column first and were recorded on
a recorder whi~h w~s hooked to the chromatograph. The longer chain

68
fatty acids followed .in sequence and were likewise recorded. After
each sample passed through the instrument (which required approximately
1 hour per sample), the area of the resulting peaks (which were recorded
on the accompanying chart) were calculated to determine the exact
amount of each fatty acid present. (The results are shown in Tables
IX-XII.)

?-VITA
JoRetta Kaye Morris
Candidate for the Degree of
Master of Science
Thesis: Chemical Analysis of Mechanically Processed Beef
Major Field: Food, Nutrition, and Institution Administration
Biographical:
Personal Data: Born in McAlester, Oklahoma, March 24, 1954, the daughter of Hr. and Mrs. Edwin G. O'Day.
Education: Graduated from Hartshorne High School, Hartshorne, Oklahoma, in May, 1972; received Associate degree in Home Economics from Eastern Oklahoma State College, Wilburton, Oklahoma, in May, 1974; received Bachelor of Science in Home Economics degree from Oklahoma State University in December, 1976; completed the requirements for Master of Science degree at Oklahoma State University in July, 1978.
Professional Experience: Food Service Supervisor, McAlester General Hospital, McAlester, Oklahoma, Summer, 1976; Graduate Assistant, Department of Food, Nutrition and Institution Administration, Oklahoma State University, 1977-78.
Organizations: Phi Kappa Phi, Omicron Nu, American Home Economics Association, Institute of Food Technologists, Oklahoma City Dietetic Association.