Embed Size (px)
Citation preview

AuthorRoger L. Firor
Agilent Technologies, Inc.
2850 Centerville Road
Wilmington, DE 19808-1610
USA
Abstract
The accelerating pace of fuel cell development is placingnew demands on diagnostic and monitoring tools that canhelp lower costs and improve efficiencies. Rapid quantita-tive chemical measurement can aid in the understandingand design of all aspects of fuel cell systems includingfuel processors and fuel cell stacks. A new quadrupolemass spectrometer based gas analyzer provides nearreal-time chemical measurement for fuel cell gases andimpurities. The Agilent 5000A Real-Time Gas Analyzerbased on the Agilent 5973N Mass Selective Detector iseasily interfaced to a process through a specializedtwo-stage gas interface. Customized control charting anddata logging software is provided for continuous processanalysis.
Introduction
Today, fuel cells offer the promise of reliablepower for a wide range of applications with
Chemical Analysis in Fuel Cell Systems:Application of the Agilent 5000A Real-TimeGas Analyzer
Application
reduced emissions, better efficiency, and lessreliance on fossil fuels. Applications include suchdiverse areas as backup power generation, distrib-uted power, cogeneration, residential, automotive/public transportation, military, and consumerappliance. Fuel cells will play an important role asthe worldwide demand for energy approximatelydoubles over the next 20 years.
Fuel cell processors that produce hydrogen fromhydrocarbons will be a necessary component ofmost fuel cell systems until means are developedand an infrastructure is built for economic storage,transportation, and generation of hydrogen. Thisincludes both stationary and vehicular on-boardsystems.
As a summary, Table 1 lists attributes of commonfuel cell types, including catalysts and fuel require-ments [1]. Fuel processors are complex systemsthat must be optimized for efficient and trouble-freeoperation of the overall fuel cell system. Most fuelcell developers agree that initial products forportable and stationary fuel cells applications willrely on fossil fuels. The generation of hydrogenfrom these fuels is a critical first step in fuel celldevelopment.
The task of fuel processors or fuel reformers is toproduce a gas mixture with high hydrogen content
Fuel Cells

without harmful levels of impurities that willpoison the downstream fuel cell system. Potentialfuels include natural gas, gasoline, diesel, methanol,ethanol, and biomass. In reality, the reformateobtained from processors can contain many com-pounds along with the desired hydrogen content.Also, electrochemical efficiencies depend on theamount and quality of hydrogen produced. Theseare a few of the reasons why chemical monitoringis essential to understanding and optimizing agiven fuel cell system [2].
Fuel processors can consist of six basic operationsthat include: 1. Fuel vaporization, 2. Fuel pretreat-ment, 3. Desulfurization, 4. Hydrogen production,5. Carbon monoxide reduction (partial oxidizers,shift reactors), and 6. Combustion of tail gases.Chemical composition of fuel and oxidant can beused to predict performance and efficiency of fuelcell systems. Thermal and partial oxidationreformer design and operation can also benefitfrom chemical measurements. Various purificationtechnologies are used in fuel cell systems. Chemicalmonitoring can assist in developing better systems.Some current technologies include: CaO adsorbentbeds for CO2 removal, membranes (palladium/silver) for hydrogen purification, ZnO, and othersupported metal catalysts for desulfurization.
2
Table 1. Common Fuel Cell Types
PAFC* MCFC* SOFC* PEMFC*Catalyst Platinum Nickel Perovskites Platinum
Electrolyte Phosphoric acid Molten carbonate salt Ceramic Polymer
Operating temperature 190 °C 650 °C 1000 °C 80 °C
Fuels Hydrogen Hydrogen/CO H2/CO2/CH4 Hydrogenreformate reformate reformate reformate
Reforming External External/Internal External/Internal External
Oxidant O2/Air CO2/O2/Air O2/Air O2/Air
Efficiency (HHV) 40_50% 50_60% 45_55% 40_50%
* PAFC: Phosphoric Acid Fuel Cell, MCFC: Molten Carbonate Fuel Cell, SOFC: Solid Oxide Fuel Cell, PEMFC: Proton Exchange Membrane Fuel Cell.
Reformers inherently dilute the hydrogen stream.Lower H2 concentrations can increase the risk ofCO anode poisoning. High CO2 and N2 concentra-tions can lower performance near the stack exit.Introduction of inert gases like N2, while notharmful, do alter the hydrogen concentration andcan affect performance. Monitoring of these gasesmay assist in reformer optimization.
Fast chemical measurements can also assist in thedevelopment and understanding of fuel cell stacks,particularly Proton Exchange Membrane (PEM)systems that operate at low temperatures. Someareas where chemical measurements are usefulinclude model development and validation, impu-rity tolerance studies, and water management [3].In general, the lower the operating temperature ofthe stack, the greater the demand for fuel purity.
While methanol powered fuel cells are attractive,much development work remains. Chemical mea-surements can assist in understanding CO2 man-agement. In direct methanol fuel cells, CO2 is theprimary reaction product of methanol oxidation atthe anode. Large amounts of CO2 can accumulatein the stack and lower cell efficiency. Methanolcrossover between anode and cathode can also bestudied through real-time chemical monitoring [3].

3
ExhaustHeatWater
Fuelprocessor
Fuel cellstack
InverterFuels H2 rich DC
Natural gas
Gasoline
Diesel
Landfill gas
Synthesis gas
H2, CO
CO2, H2O
O2, N2
Sulfur
CH4, C2+
Water gasshift
COoxidation
CO <10 ppmCO
Crossover
Anode/Cathode rxn’s
H2
O2
H2O H2O
O2
Characterize CO poisoning
Oxidant
Gas diffusion
Cathode
Elec
trol
yte
Anode
Figure 1. General fuel cell system overview with external fuel processor.
The Real-Time Gas Analyzer (RTGA) can assist insolving the current technical challenges associatedwith fuel processor and fuel cell stack design. Thissystem, based on Agilent’s 5973N high-performancequadrupole mass spectrometer, provides chemicalquantitation and speciation with wide dynamicrange in near real time. It provides a level of massaxis stability, dynamic range, speed of response,and calibration ease that is not possible withresidual gas analyzers (RGAs).
In Figure 1, a diagram of a typical fuel cell systemwith external reforming appears, highlightingareas where chemical measurements would beuseful among the various sub systems, and withinthe stack itself. This paper focuses on an overviewof the RTGA system while demonstrating perfor-mance with gases commonly encountered in fuelcell systems. A separate paper focuses on impurities,such as sulfur, in fuel cell streams.

4
To rough pump
To MSD
Processstream in
Out to vent
Molecular flow
Orifice 30 µ or 50 µ
Sonic flow
Manual isolation valve
Orifice 30 µ
Pressuretransducer
Figure 2. Diagram of the two-stage gas interface system.
Experimental
RTGA Overview
The RTGA system consists of a modified 5973Nmass spectrometer, specialized hardware gas inter-face system, and control software. The two-stagegas interface and control/monitoring software (MSSensor 2.0) were developed by Diablo Analytical,Inc. 1110 Burnett Ave., Suite C, Concord, CA 94520.Agilent MSD ChemStation software must be pre-sent prior to installation of MS Sensor 2.0. Modifi-cations to the 5973N for enhanced performancewith fuel cell gases include a low gauss magnet andmodified ion source components. This allows linearcalibration of hydrogen and other gases of interestover the concentration ranges needed for fuel cellresearch and development.
A schematic of the two-stage interface appears inFigure 2. Unlike GC/MS systems, no separation ofthe chemical components occurs prior to enteringthe mass spectrometer (mass spec). Control of thematerial entering the mass spec source is managedby a two-stage system consisting of two precisionsized orifices connected to a common cross fitting.Also attached to the cross is a 12-liter per minutefore pump and a pressure transducer. An isolationvalve is included to allow easy servicing/changingof orifices and process connections without vent-ing of the 5973N. The mass spec and pressuretransducer are interfaced to a personal computerthrough LAN and RS-232 interfaces, respectively.

Real-Time Gas Analyzer
Mass spectrometer 5973N
Pump Standard turboIonization mode Electron impactMass range 1.6 to 800 u (0.1 u steps)Resolution 1 amu Source temperature 230 °CQuad temperature 150 °CTypical scan range 1.6 to 50 amuThreshold 100Samples (2^) 4 TypicalTune (typical) Htune, custom5973 ChemStation software G1701DA
Gas inlet system First stage orifice 30 micronSecond stage orifice 30 or 50 micronFore pump Edwards 12 l/mInlet temperature 100 °CPressure transducer MKS Capacitance manometerHeater assembly 100 °CTemperature controller Agilent 19265Process stream in pressure Atmospheric pressure Process stream in flow 30 mL/min minimum
Gas mixturesFuel cell mix 50% H2, 10 % CO2, 5% CH4
Natural gas 70% CH4, 9% C2, 6% C3, 3% iC4
3% nC4, 1% IC4, 1% nC4,1.5% CO2
Other gases (as pure gases) H2, O2, N2, CO2, CO
RTGA SoftwareOperating system Microsoft® Windows 2000RTGA Control Diablo MS Sensor 2.0
5
Table 2. RTGA Configuration and Conditions
Calibration of the pressure transducer is requiredonce at initial setup. This is performed by cappingoff the process gas entrances to the interface andthe interface foreline pump connections, followedby pumping down the interface and transducerwith the 5973N vacuum system. The zero is thenset from the transducers controller/display frontpanel as per supplied instructions.
In operation, the process gas is pulled through thefirst-stage orifice under sonic flow conditionsusing the 12-liter/min pump. Using the 30-micronorifice, approximately 25- to 30-mL/min flow isrequired to satisfy system demands. Pressure atthis point in the cross, which is dependent on gascomposition and process inlet pressure, can bemonitored using the optional capacitance manome-ter. A small amount of material, regulated by thesize of the second-stage orifice, enters the massspec source under molecular flow conditions.
Ions are selected, calibrated, and monitored usingcustom control software that is installed afterinstallation of the parent mass spec ChemStationsoftware. Information is displayed in up to six dis-play windows that support real-time monitoring ofthe defined signals (usually an ion representativeof a single or group of compounds). Data is alsosent to a CSV file for later processing in Microsoft®Excel, for example.
Calibration of the system was performed using adynamic blending system. This system has beendescribed in detail in previous Agilent publications [4].Fuel cell gas standards were diluted in variousmatrices, such as helium, nitrogen, and natural gas,at point of use and time of use for the purpose ofestablishing calibration curves over the concentra-tion ranges of interest. Gas mixtures wereobtained from DCG Partnership, 4170 A. Main,Pearland, TX 77581.
Instrumental hardware details, operating condi-tions, and software versions are given in Table 2.The RTGA interface is also available in a “basic”version, which does not include the heater assemblyor pressure transducer.

6
process inlet pressure. This is illustrated inFigure 3 where cross pressure is plotted for Heand N2 at a series of process inlet pressures.
Because response of the mass spec is dependenton sample pressure, the transducer’s pressuremeasurement can be used to correct a given ionsignal.
This may be useful if the inlet process pressure issubject to fluctuation or when gas calibrationscover a very wide viscosity range. The pressurereading is treated in the same way as definedchemical masses (m/z values) are in the software.A basic method consists of defined ions represen-tative of unique masses for each compound to bemonitored and the pressure reading if desired. Forexample, a simple pressure corrected hydrogensignal can be defined in the software as:(Sig1.Raw)/(Sig2.Raw), where Sig1 is mass 2 forhydrogen and Sig2 is pressure.
The MS Sensor software allows user-definedformulas to be applied to any defined instrumentsignal in real-time for custom calculations, signalratios, normalization, background corrections, etc.This gives the user a great deal of flexibility incustomizing the method for a particular task.
Results and Discussion
Inlet Setup
The gas interface was installed with 30- and50-micron orifices for stage 1 and stage 2, respec-tively. This combination is suitable for concentra-tion ranges from about 0.1% to 100% for most fuelcell gases such as H2, O2, and CO2. In general, orificesizes of 30 micron to 50 micron for the second-stagework well for per cent level gas analysis. For traceanalysis the second-stage orifice can be changed to350 micron. Also, if 25 to 30 mL/min of total flowis not available from the process being monitored,the first-stage orifice can be smaller to accommodatelower flow rates.
All material entering the mass spec interfacemust be in the gas phase. In some cases, this mayrequire the user to supply and interface additionalsample conditioning hardware upstream of thesystem (for example, a vaporizer).
The pressure transducer’s response is independentof gas type. However, the flow rate through the ori-fices and, hence, pressure in the cross is depen-dent on gas type due to differences in viscosity and
0
20
40
60
80
100
120
140
160
180
0 2 4 6 8 10 12
Process pressure (PSIG)
Tran
sduc
er p
ress
ure
(mto
rr)
Helium
Nitrogen
Figure 3. Affect of gas type and process pressure on cross pressure.

7
Ion Monitoring
Figure 4 is representative of the real-time signaldisplay that is a core software feature. Here, fivesignals were defined and plotted in one window.Masses defined as separate signals were 2, 16, 27,30, 43, and 44, for H2, CH4, C2 to C5’s, ethane, C3 toC5’s, and CO2, respectively. Unique ions exist forhydrogen, methane, ethane (very small contribu-tion from other hydrocarbons at mass 30), andcarbon dioxide, while for C2—C5, a composite massis required because a significant unique mass foreach hydrocarbon is not available. This figure isintended to illustrate a generic application withmany of the compounds that might be found in afuel cell reformer feed or reformer output. Also,note the step change that occurs when simulatedhydrogen production startup occurs. The system isable to capture and record very rapid changes in aprocess that may be missed by other measurementtechniques.
The monitoring of hydrocarbons, in addition tothe common fuel cell gases, can be useful to checkconversion percentages and monitor potential forcarbon deposition in MCFC systems, for example.
Tuning the Mass Spectrometer
Several automated tuning procedures are availablewith the RTGA system that make mass axis cali-bration and signal optimization easy and straight-forward for the user. Three tunes that are usefulfor fuel cell applications are listed below. TheAtune is a general-purpose tune and a good placeto start when the system is initially setup or afterhardware maintance. For best performance andlinearity over a wide concentration range for allcommon fuel cell gases (hydrogen to carbon diox-ide through common light sulfur compounds), thehydrogen (Htune) is recommended. To cover ahigher mass range up to 250 amu, without opti-mized hydrogen response, the Ltune is provided.Once tuned, the 5973N will not require re-tuningfor many weeks or months depending on the par-ticular set of operating conditions and inputprocess stream.
Custom tunes can also be developed by the user tomeet specific needs of the application (for example,trace analysis). These are easily constructed fromwithin the 5973N software by starting with para-meters from one of the standard tune files.
Figure 4. Graphical display of five signals: methane, C3-C5 hydrocarbons, C2-C5 hydrocarbons, carbon dioxide, ethane, andhydrogen. Scan range: 12 _ 46 amu.
CH4
C3_C5
C2_C5
CO2
C2
Hydrogen
CH4
C3_C5
C2_C5
CO2
C2
H2
Tune file PurposeAtune General mass spec tune (full scan range)Ltune Optimized for mass ranges to approximately 250Htune Optimized for hydrogen and other fuel cell gases Custom Optimized for application (user developed)
8
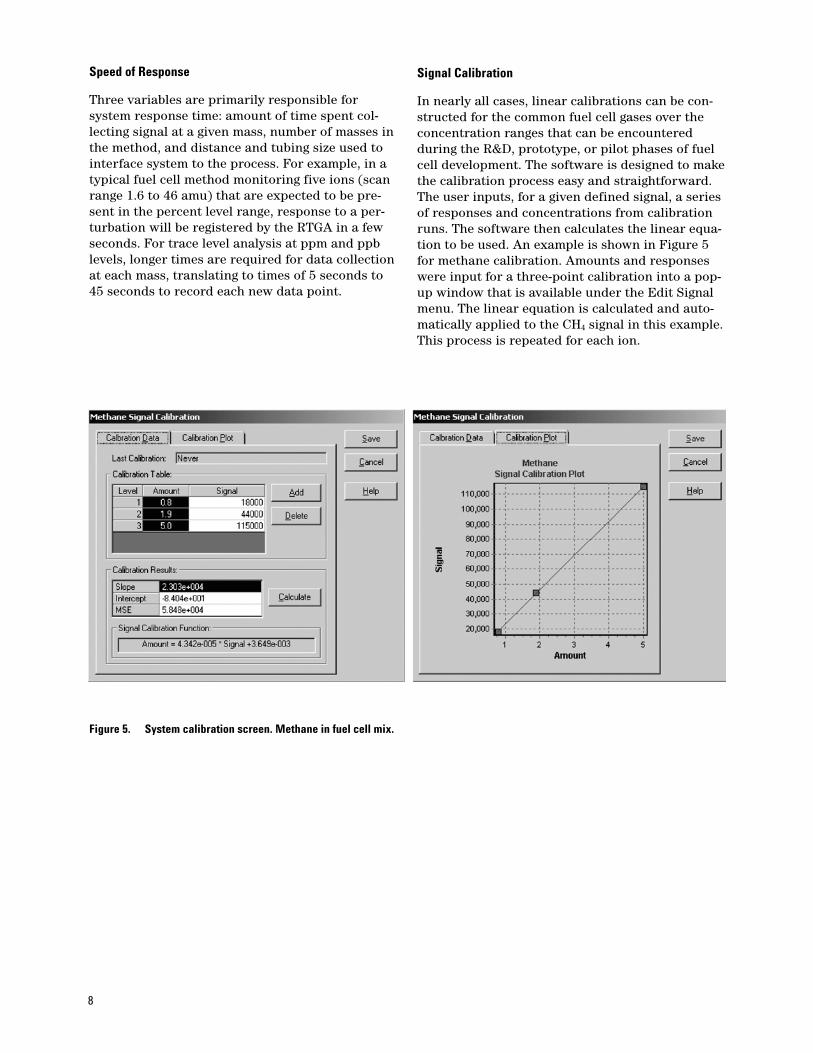
Figure 5. System calibration screen. Methane in fuel cell mix.
Signal Calibration
In nearly all cases, linear calibrations can be con-structed for the common fuel cell gases over theconcentration ranges that can be encounteredduring the R&D, prototype, or pilot phases of fuelcell development. The software is designed to makethe calibration process easy and straightforward.The user inputs, for a given defined signal, a seriesof responses and concentrations from calibrationruns. The software then calculates the linear equa-tion to be used. An example is shown in Figure 5for methane calibration. Amounts and responseswere input for a three-point calibration into a pop-up window that is available under the Edit Signalmenu. The linear equation is calculated and auto-matically applied to the CH4 signal in this example.This process is repeated for each ion.
Speed of Response
Three variables are primarily responsible forsystem response time: amount of time spent col-lecting signal at a given mass, number of masses inthe method, and distance and tubing size used tointerface system to the process. For example, in atypical fuel cell method monitoring five ions (scanrange 1.6 to 46 amu) that are expected to be pre-sent in the percent level range, response to a per-turbation will be registered by the RTGA in a fewseconds. For trace level analysis at ppm and ppblevels, longer times are required for data collectionat each mass, translating to times of 5 seconds to45 seconds to record each new data point.

9
Carbon Monoxide and Nitrogen
Carbon monoxide is a well-known poison at levelsto 1 ppm in fuel cells, competing with hydrogen forplatinum active sites, for example, in PEM fuel cellsystems. Because both nitrogen and carbonmonoxide have a mass of 28, they cannot be differ-entiated using the RTGA. Carbon dioxide also hasa small fragment ion at 28 amu. Figure 6 shows acalibration of CO performed in the absence of N2
and CO2. The background signal present at mass 28obtained from measuring a 99.999% helium streamwas subtracted. However, in most practical situa-tions, N2 or CO2 at some level are likely to be pre-sent rendering the RTGA unsuitable. In thesecases, the Agilent 3000 Micro gas chromatograph isrecommended as it can quantitate CO to approxi-mately 1 ppm with an analysis time of under90 seconds [5].
0
2000
4000
6000
8000
10000
12000
14000
0 5 10 15 20 25 30
Carbon monoxide (ppm)
Res
pons
e
Figure 6. Parts-per-million level carbon monoxide in N2 and CO2 free stream. Scan 1.6 to 32 amu.

10
0
200000
400000
600000
800000
1000000
1200000
1400000
1600000
0 20 40 60 80 100
H2 (mole%)
y = 18412x - 48231
R2 = 0.9975
Res
pons
e
Figure 7. Calibration of hydrogen in nitrogen diluent.
0
50000
100000
150000
200000
250000
0 20 40 60 80 100
Hydrogen (mole %)
Res
pons
e
y = 2893.8x - 4689
R2 = 0.999
Figure 8. Calibration of hydrogen in helium diluent.
Performance and Calibration: H2, CO2, O2, N2, CH4
The use and performance of any chemical mea-surement system is enhanced if quantitative infor-mation is easy to obtain. In the study of fuel cellsystems, including processors and cell stacks,quantitative chemical analysis may be required inaddition to qualitative trending. Knowledge of theelectrochemical reaction gases and diluent concen-trations can be valuable to fuel cell development
efforts. For example, maintaining oxidant composi-tion in the proper (or above) stoichiometric ratiowill increase fuel cell performance. Calibration plotsare shown in Figures 7 and 8, for H2 in nitrogenand helium, respectively. Both show good linearityover a wide concentration range indicating thatsimple two-point calibrations could be performedas described earlier in the “Signal Calibration” sec-tion. Correlation coefficients are better than 0.99.

11
y = 30676x - 27860
R2 = 0.9982
0
100000
200000
300000
400000
500000
600000
0 5 10 15 20
CO2 (mole %)
Res
pons
e
Figure 9. Calibration of carbon dioxide. Stage 1 and stage 2 orifices 30 micron. Ion 44 monitored.
A calibration plot for CO2 over concentrationranges of 2% to 20% is shown in Figure 9. Carbondioxide measurements can be important in thedevelopment of CO2 tolerant alkaline fuel cell sys-tems and in monitoring the performance of otherfuel cell types. Finally, calibrations are shownrespectively for oxygen, nitrogen and methane, inFigures 10, 11, and 12.
0
500000
1000000
1500000
2000000
2500000
3000000
3500000
4000000
0 10 20 30 40 50 60
Mole % O2
Res
pons
e
y = 65024x + 18433
R2 = 0.9959
Figure 10. Calibration of oxygen in helium.

Figure 11. Calibration of nitrogen in hydrogen.
0
20000
40000
60000
80000
100000
120000
0 1 2 3 4 5 6
CH4 (mole %)
Res
pons
e
y = 22617x + 3599.6
R2 = 0.9962
Figure 12. Calibration of methane in fuel cell mix.
12
0
100000
200000
300000
400000
500000
0 5 10 15 20 25 30 35
Mole % nitrogen
Resp
onse
These calibrations all show reasonably good linearityover the plotted concentration ranges, making itpossible to calibrate a gas with just two data points.These points should be chosen so that the calibra-tion range is representative of the expected con-centrations whenever possible. All calibrationswere performed with mass spec parameters froman automated fuel cell tune using a scan range from1.6 to 46 amu. No background correction was applied.

13
Measurement of Low-Level Impurities
Monitoring and quantitation of low-level impuri-ties, especially sulfur-containing compounds is asignificant area of study in fuel cell and relatedcatalyst development. For example, odorants pre-sent in natural gas feed to a fuel processor must beremoved to levels well below 1 ppm using activatedcarbon beds, in many cases, prior to steam reform-ing. Although this is the subject of a separate paper,an example is included here to complete the RTGAoverview. Figure 13 shows the calibration ofdimethyl disulfide to demonstrate typical perfor-mance capability in the ppb range. Actual detectionlimits will be matrix dependent.
0
100
200
300
400
500
600
700
800
0 200 400 600 800 1000
DMDS (ppb)
Res
pons
e
y = 1.0034x - 80.058
R2 = 0.9951
Figure 13. Calibration of dimethy disulfide at the ppb level. Ion 94 monitored. Dilution in helium.
Agilent shall not be liable for errors contained herein or for incidental or consequen-tial damages in connection with the furnishing, performance, or use of thismaterial.
Information, descriptions, and specifications in this publication are subject to changewithout notice.
Microsoft® Excel and Windows 2000 are registered trademark of Microsoft Corporation.
© Agilent Technologies, Inc. 2002
Printed in the USAJune 18, 20025988-6283EN
www.agilent.com/chem
Conclusions
One key challenge to successful fuel cell commer-cialization is cost reduction. To this end, there isincreasing focus on fuel processor design and cata-lyst optimization. With the level of developmenteffort intensifying in all fuel cell and fuel processortechnologies, any tools that can assist with thischallenge are being used. Detailed, real-time, quali-tative, and quantitative chemical analysis can bepowerful tools when applied to fuel cell develop-ment and optimization. This applies to the incom-ing fuels, processed fuels, reformer output, partialoxidation system gases, and fuel cell stack electro-chemical reaction gases.
The RTGA provides a stable, reliable, and quantita-tive solution to continuous chemical monitoring infuel cell systems that is not possible with RGAs.Good linearity is seen for hydrogen and othergases that are encountered in fuel cell systemsover a wide concentration range from ppb to per-cent levels, making calibration of the systemstraightforward. For qualitative chemical trending,the RTGA system can be running in a matter ofminutes after simply selecting the ions of interestin the software method screens. With a responsetime of 2 to 5 seconds, the system can monitor andcapture rapid transients that can be missed byother monitoring equipment.
References1. Fuel Cell Handbook, Fifth Edition,
Business/Technology Books, Orinda, CA.
2. Fuel Cell Integration-A Study of the Impactsof Gas Quality and Impurities, D.C. Dayton,M. Ratcliff, R. Bain, NREL, Golden, Colorado,2001.
3. Fuel Cell Systems Explained, J. Larminie,A. Dicks, John Wiley & Sons, LTD, England,2002.
4. R. Firor and B. Quimby, “Automated DynamicBlending System for the Agilent 6890 GasChromatograph: Low Level Sulfur Detection,”Agilent Application Note, publication5988-2465EN, April 2001.
5. M. Feeney, P. Larson, B. Wilson, “Analysis ofFuel Cell Reformer Gases in Seconds Using theAgilent 3000 Micro Gas Chromatograph,”Agilent Application Note, publication5988-5296EN, February 2002.
For More Information
For more information on our products and services,visit our Web site at www.agilent.com/chem.