Embed Size (px)
DESCRIPTION
CHEM 344. Organic Chemistry Lab. Spectroscopy of Organic Compounds Lecture 3 – Infrared and Mass Spec. September 9 th and 10 th 2008. 1. 1. Infrared radiation excites vibrational energy levels of a molecule Bond stretching, bending, twisting, rocking etc. - PowerPoint PPT Presentation
Citation preview
11
CHEM 344Organic Chemistry Lab
September 9th and 10th 2008
Spectroscopy of Organic Compounds
Lecture 3 –Infrared and Mass Spec
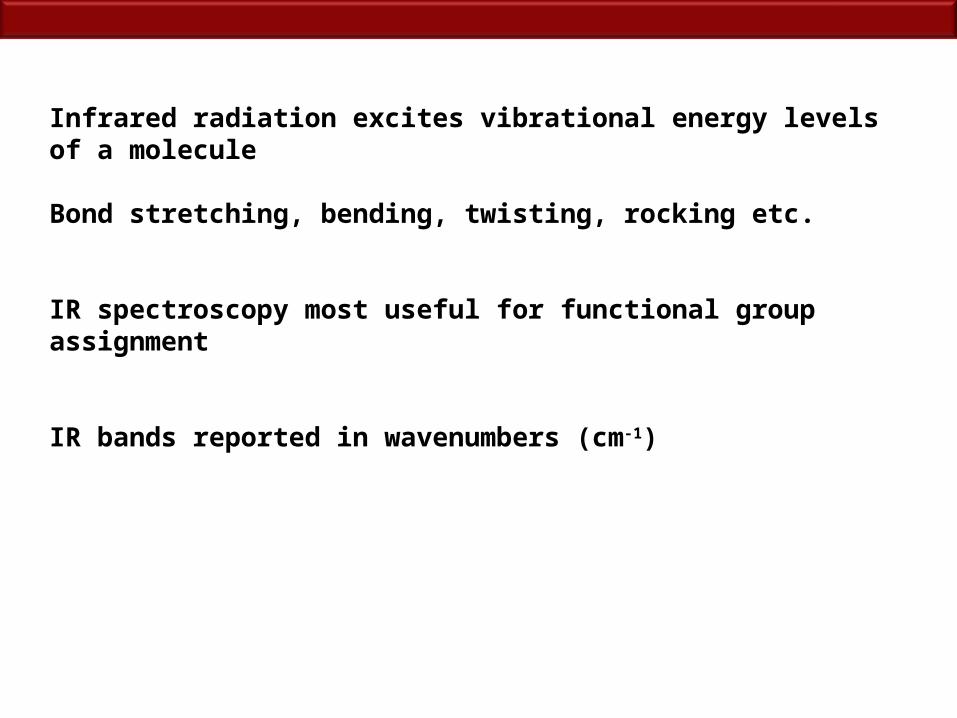
Infrared radiation excites vibrational energy levels of a molecule
Bond stretching, bending, twisting, rocking etc.
IR spectroscopy most useful for functional group assignment
IR bands reported in wavenumbers (cm-1)
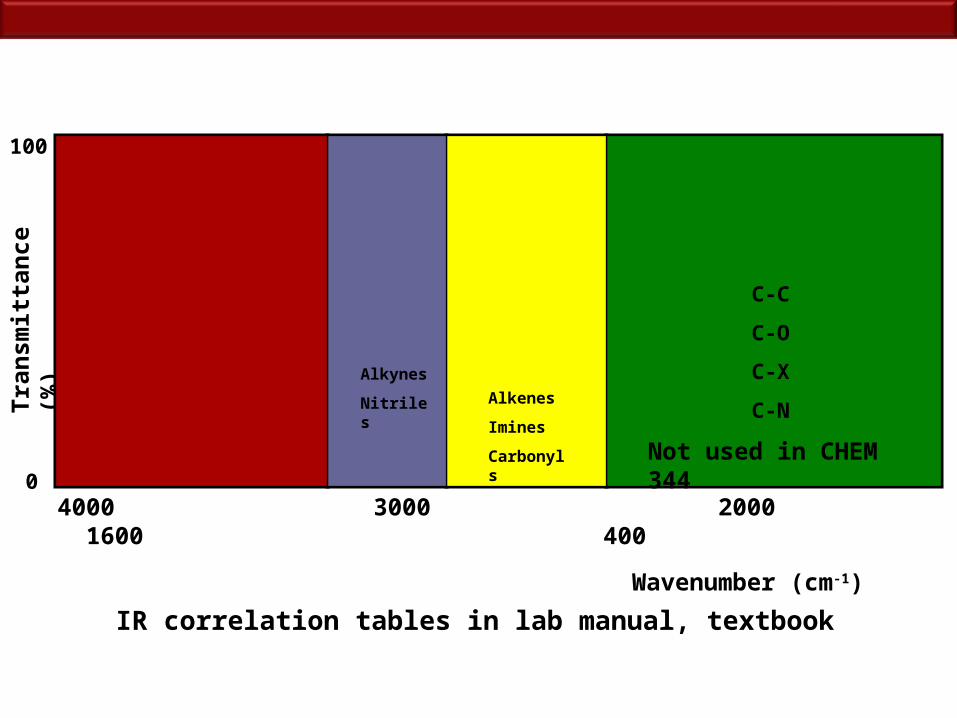
4000 3000 2000 1600 400
Wavenumber (cm-1)
N – H
O – H
C – H (sp > sp2 > sp3)
C≡C
C≡N
C=C
C=N
C=O
Fingerprint region
Tra
nsm
itta
nce
(%)
100
0
Alkynes
Nitriles
Alkenes
Imines
Carbonyls
C-C
C-O
C-X
C-N
IR correlation tables in lab manual, textbook
Not used in CHEM 344
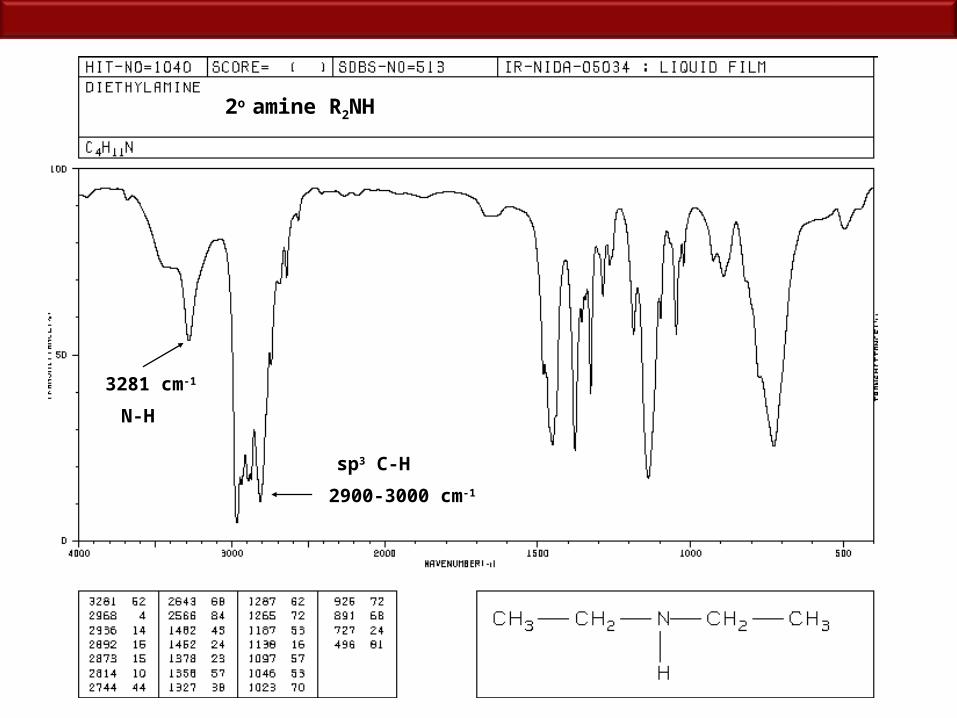
N-H
3281 cm-1
2900-3000 cm-1
sp3 C-H
2o amine R2NH
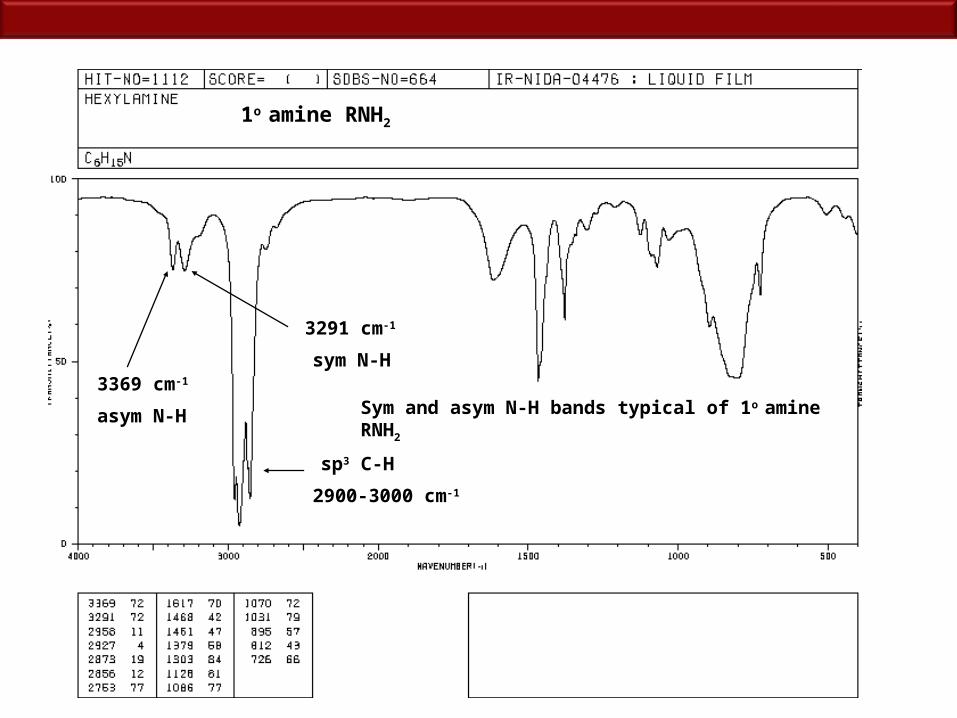
asym N-H
3369 cm-1
3291 cm-1
sym N-H
2900-3000 cm-1
sp3 C-H
1o amine RNH2
Sym and asym N-H bands typical of 1o amine RNH2
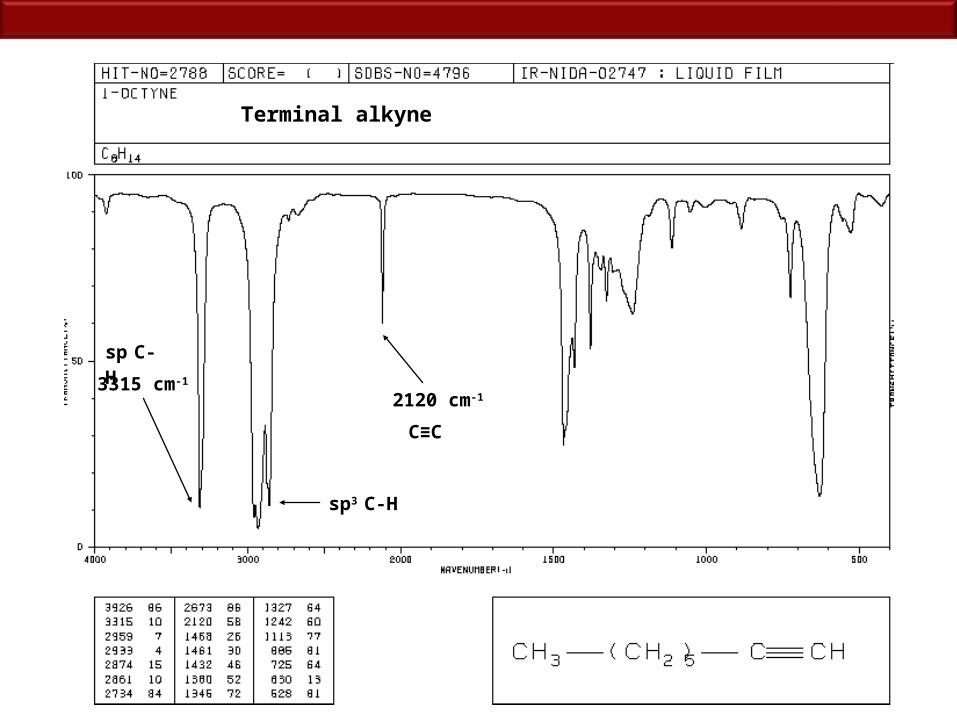
C≡C
2120 cm-1
sp3 C-H
sp C-H3315 cm-1
Terminal alkyne
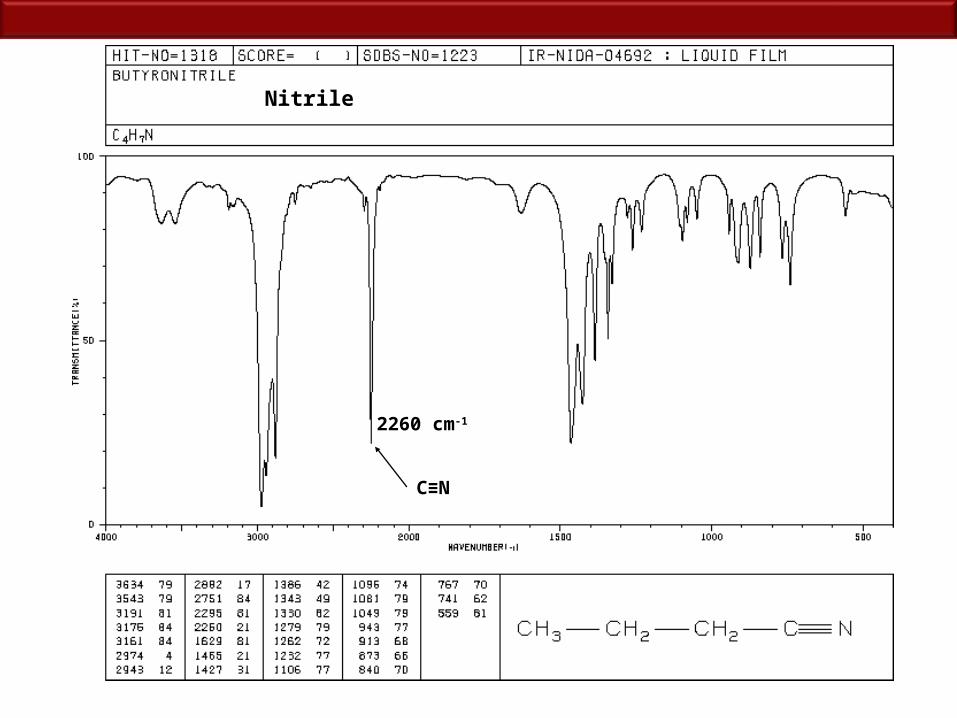
2260 cm-1
Nitrile
C≡N
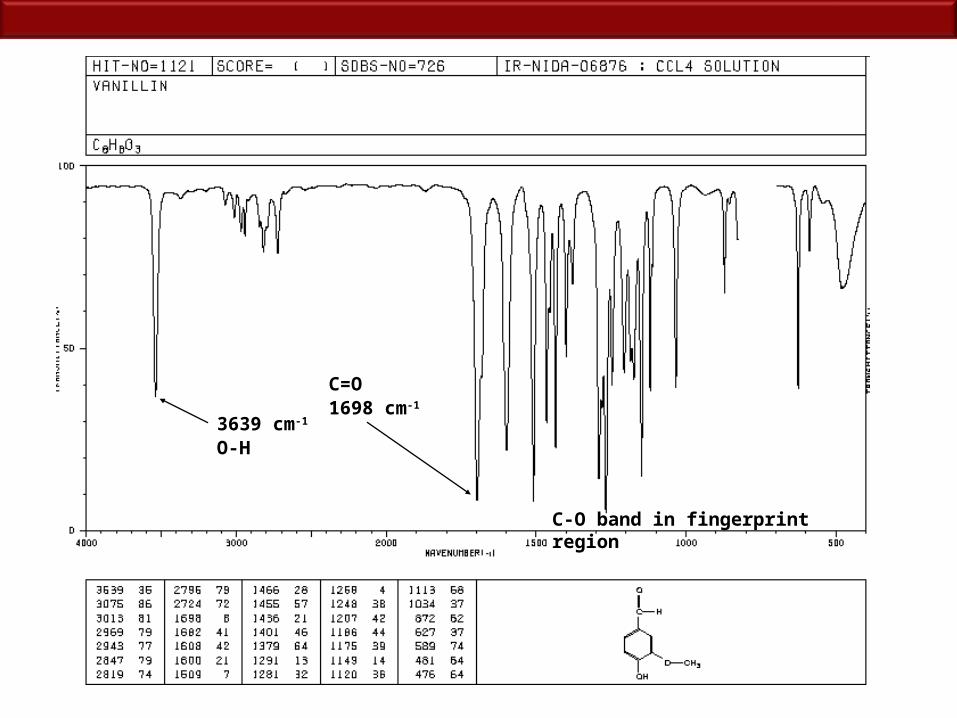
O-H3639 cm-1
C=O1698 cm-1
C-O band in fingerprint region
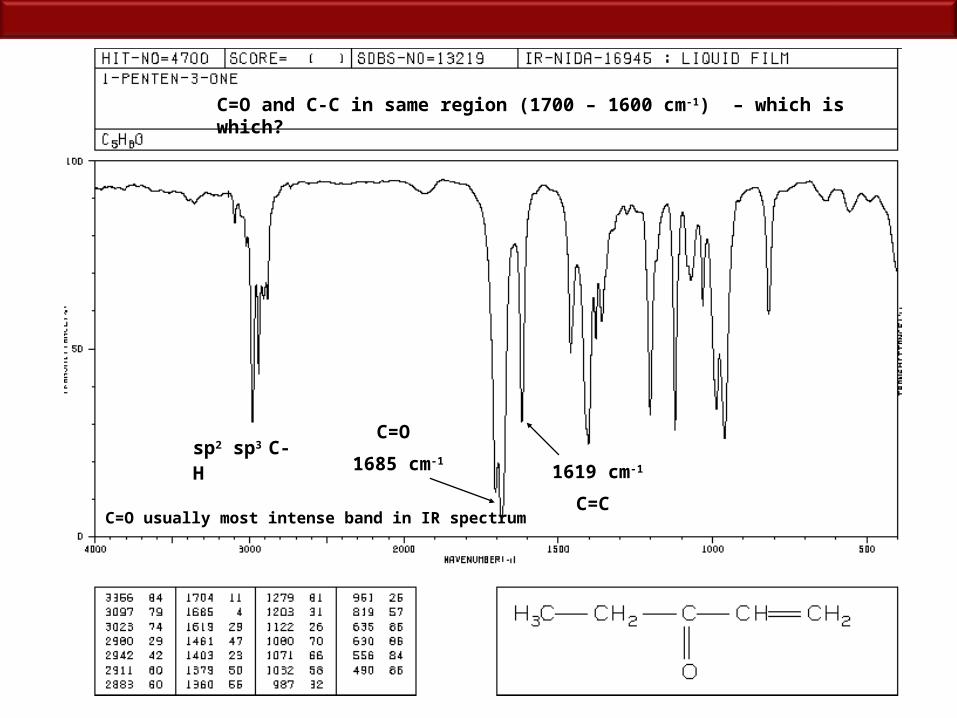
1685 cm-1
C=O
1619 cm-1
C=C
sp2 sp3 C-
H
C=O usually most intense band in IR spectrum
C=O and C-C in same region (1700 – 1600 cm-1) – which is which?
OC
Et
HO
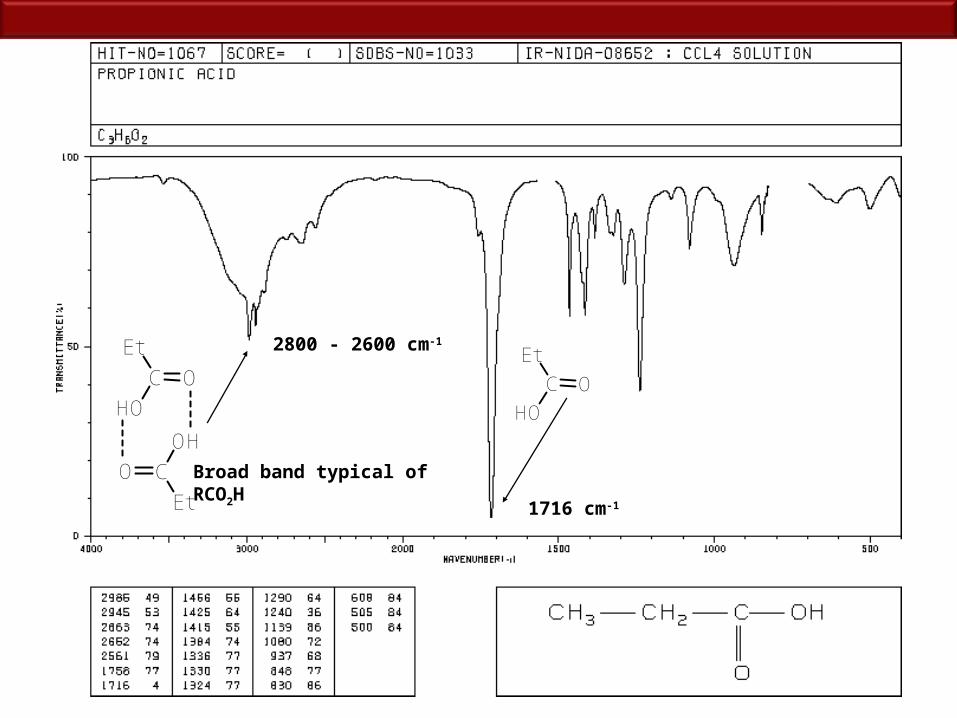
1716 cm-1
OC
Et
HO
O C
Et
OH
2800 - 2600 cm-
1
Broad band typical of RCO2H
Mass Spectrometry
Uses high energy electron beam (70 eV), sample in gas phase
Ionization potential for most organic molecules 8-15 eV
Gives info on molecular weight of compound by m/z
Gives info on connectivity of molecule by fragmentation pattern
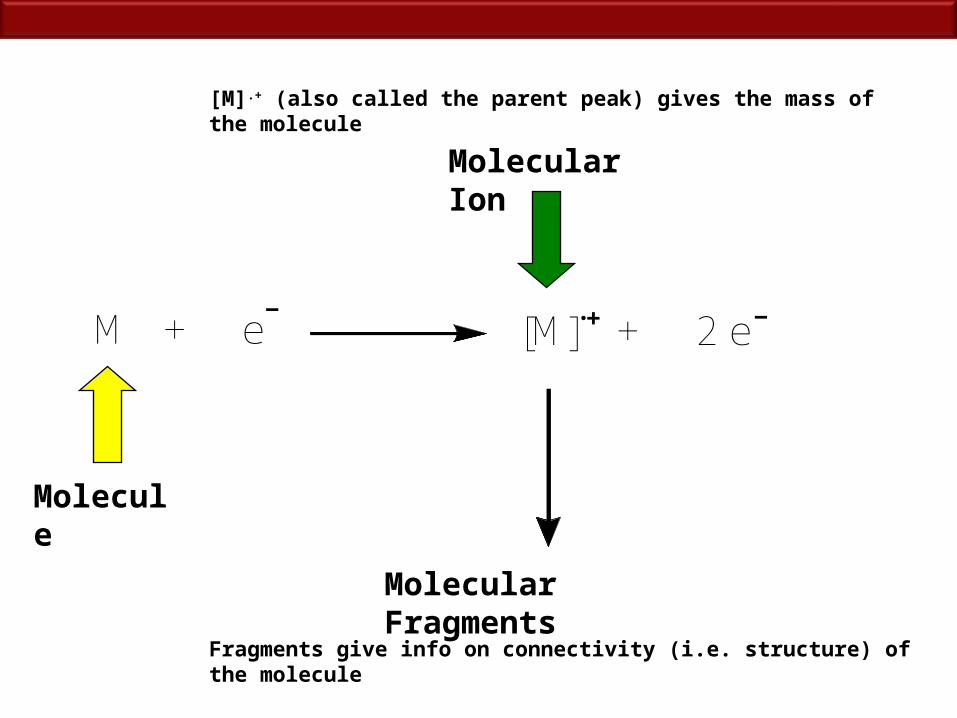
M + e [M] + 2 e
Molecular Fragments
Molecule
Molecular Ion
[M].+ (also called the parent peak) gives the mass of the molecule
Fragments give info on connectivity (i.e. structure) of the molecule
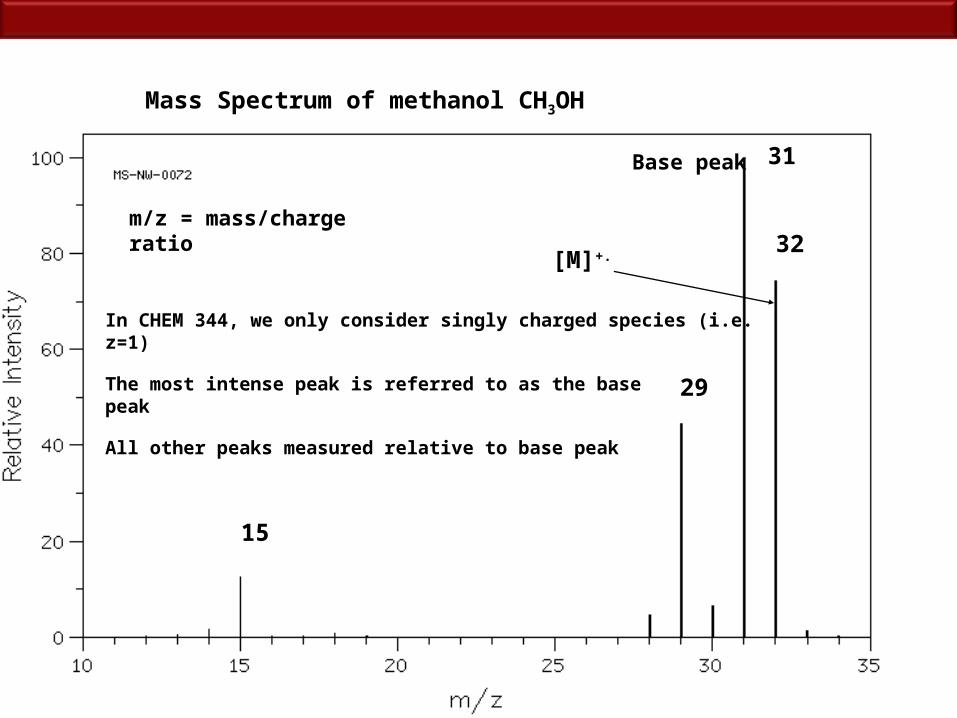
Mass Spectrum of methanol CH3OH
32
31
29
15
Base peak
[M]+.
m/z = mass/charge ratio
In CHEM 344, we only consider singly charged species (i.e. z=1)
The most intense peak is referred to as the base peak
All other peaks measured relative to base peak
[M]
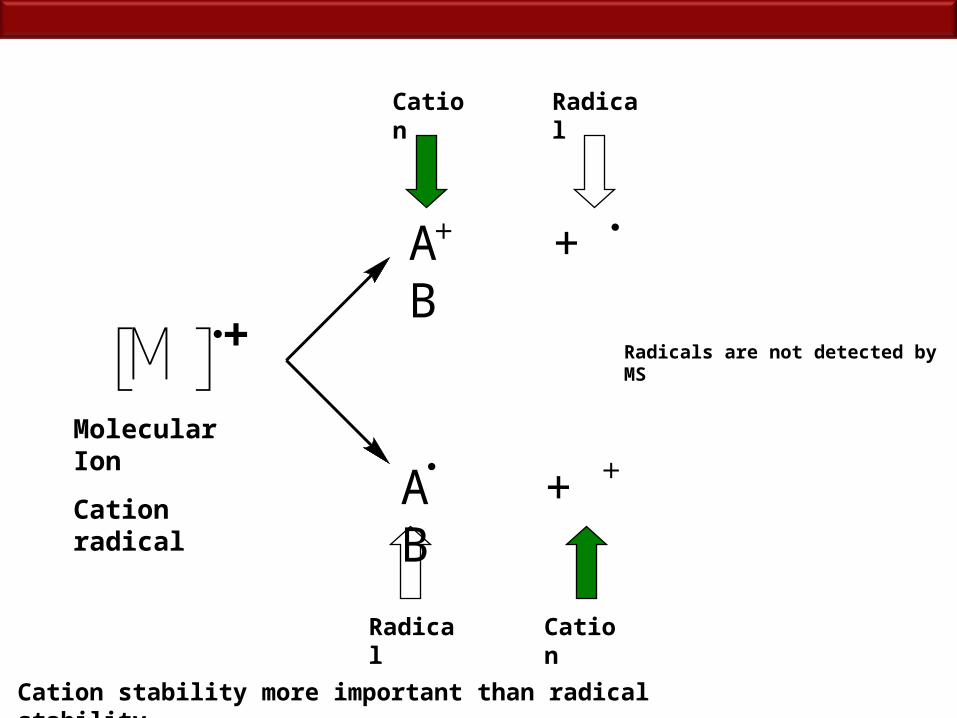
Cation stability more important than radical stability
Molecular Ion
Cation radical
A + B
Cation
Radical
A + B
Cation
Radical
Radicals are not detected by MS
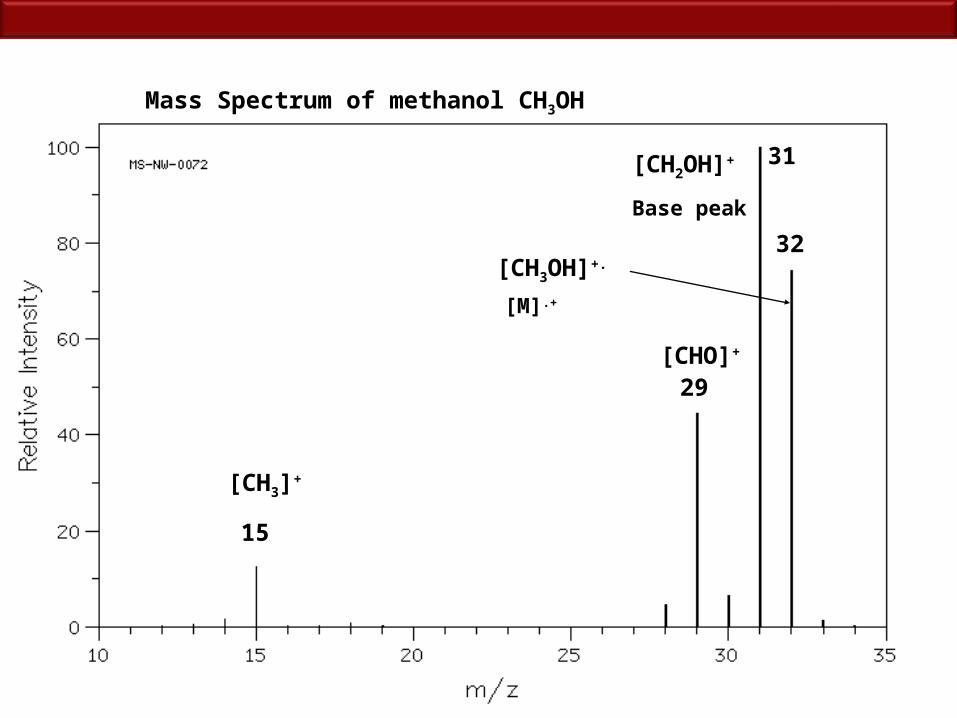
Mass Spectrum of methanol CH3OH
32
31
29
15
[CH2OH]+
Base peak
[CHO]+
[CH3]+
[CH3OH]+.
[M].+
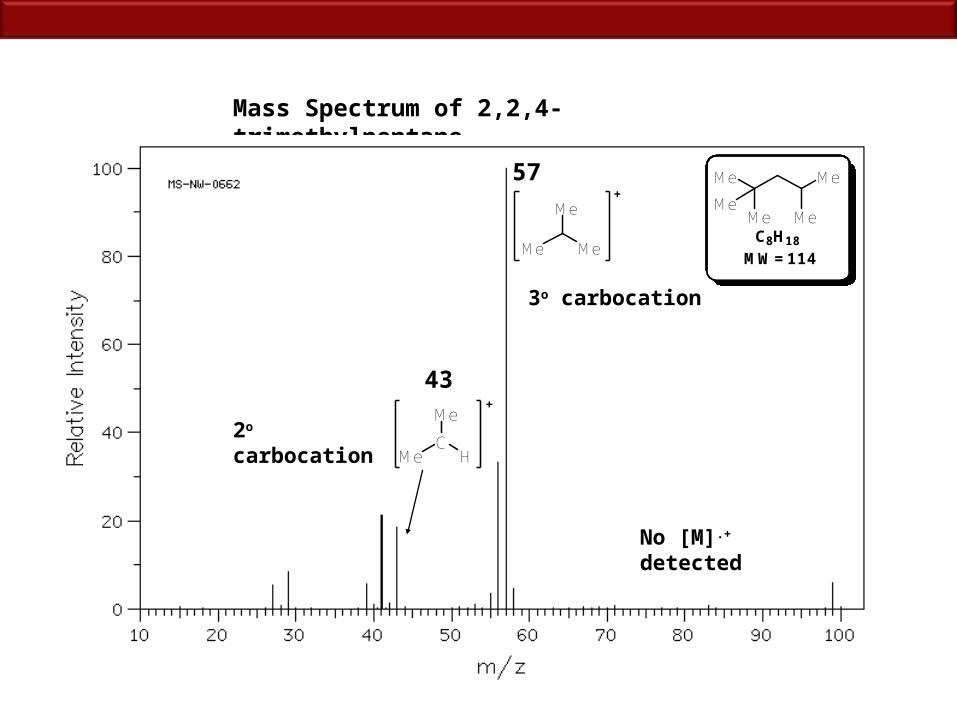
Mass Spectrum of 2,2,4-trimethylpentane
57
43
Me Me
MeMe
Me
MW=114C8H18
Me
Me
Me
C
Me
Me H
3o carbocation
2o carbocation
No [M].+ detected
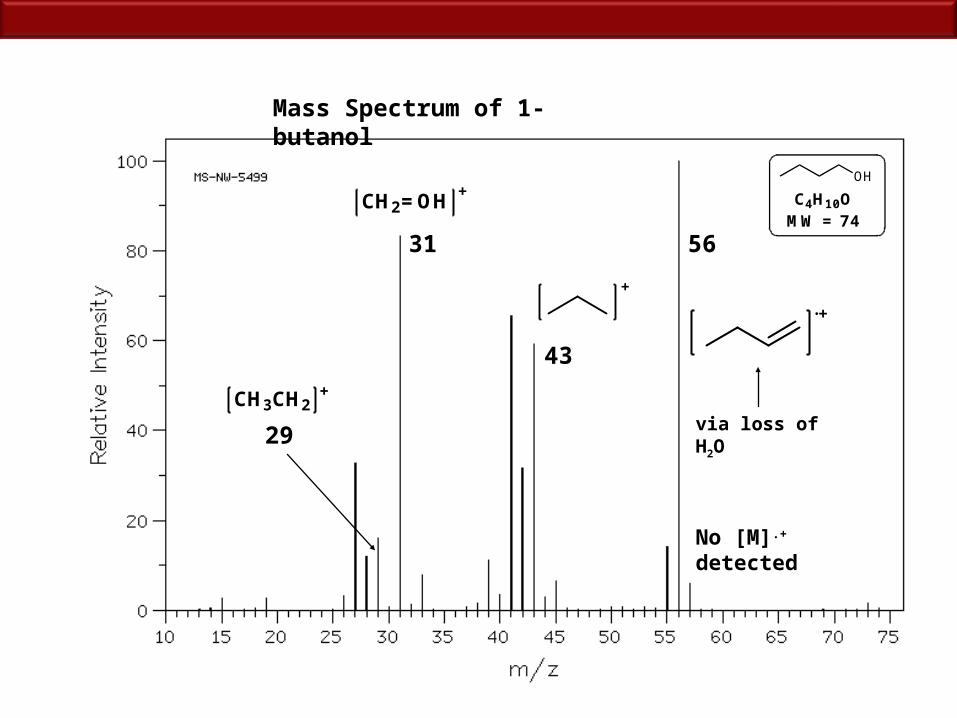
Mass Spectrum of 1-butanol
5631
43
29
CH2=OH
via loss of H2OCH3CH2
OH
C4H10O MW = 74
No [M].+ detected
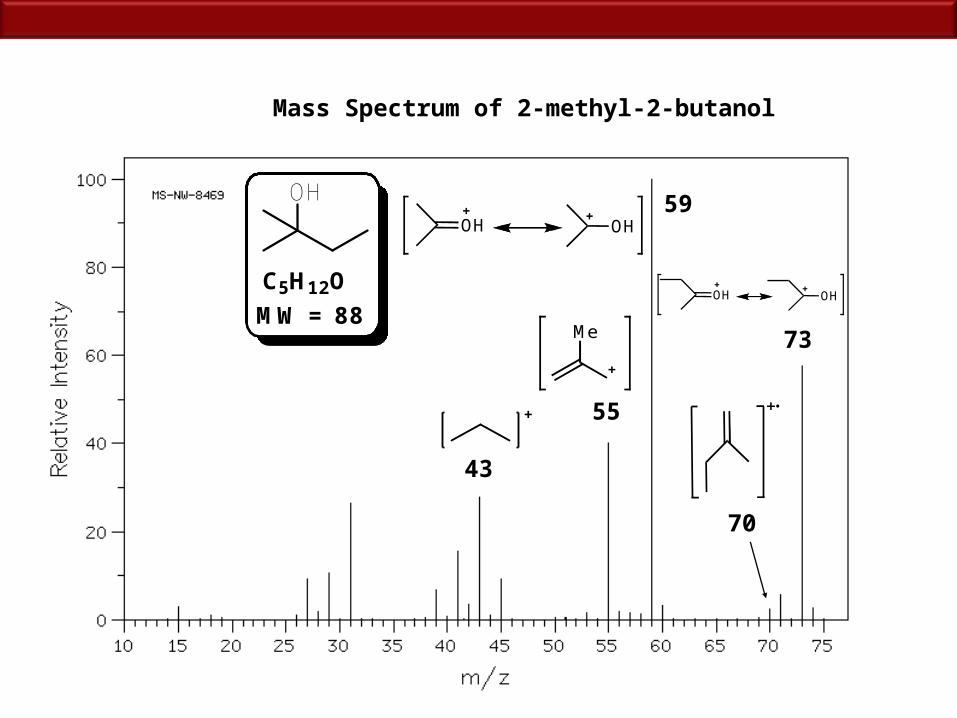
OH
MW = 88
C5H12O
Mass Spectrum of 2-methyl-2-butanol
59
73
70
43
Me
OH OH
55
OH OH
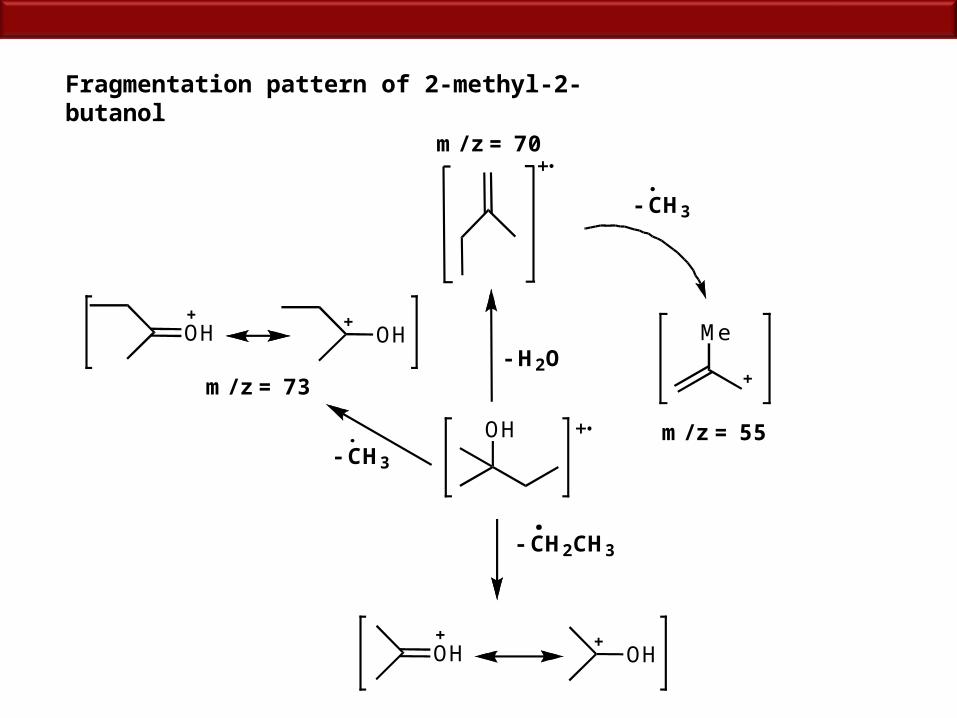
Fragmentation pattern of 2-methyl-2-butanol
OH
OH OH
- CH2CH3
- H2O
m/ z = 70
OH OH
m/ z = 73
- CH3
Me
m/ z = 55
- CH3
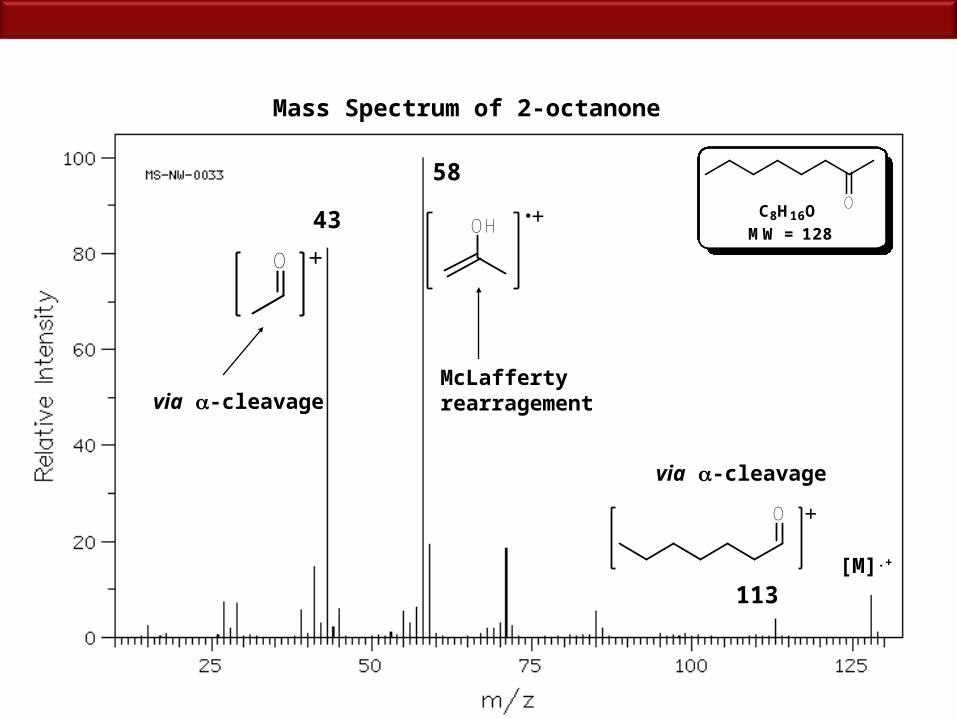
Mass Spectrum of 2-octanone
OC8H16OMW = 128
113
43 OH
58
O
O
via -cleavage
via -cleavageMcLafferty rearragement
[M].+
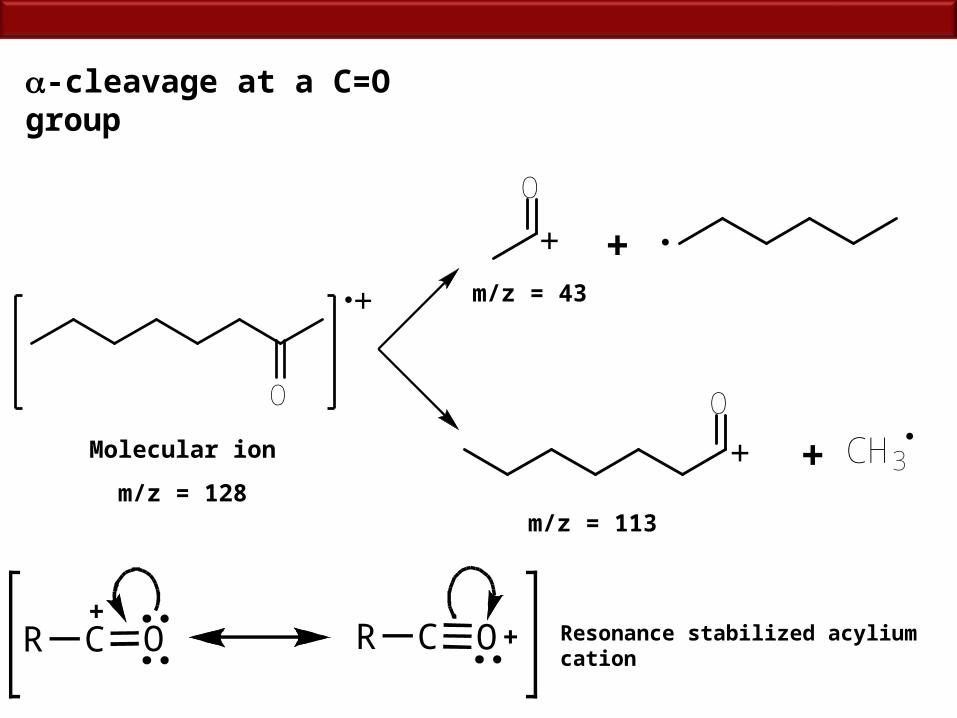
O
O
+
CH3+O
m/z = 43
m/z = 113
Molecular ion
m/z = 128
-cleavage at a C=O group
C OC O RR Resonance stabilized acylium cation
OH
m/z = 58
+OH
m/z = 128
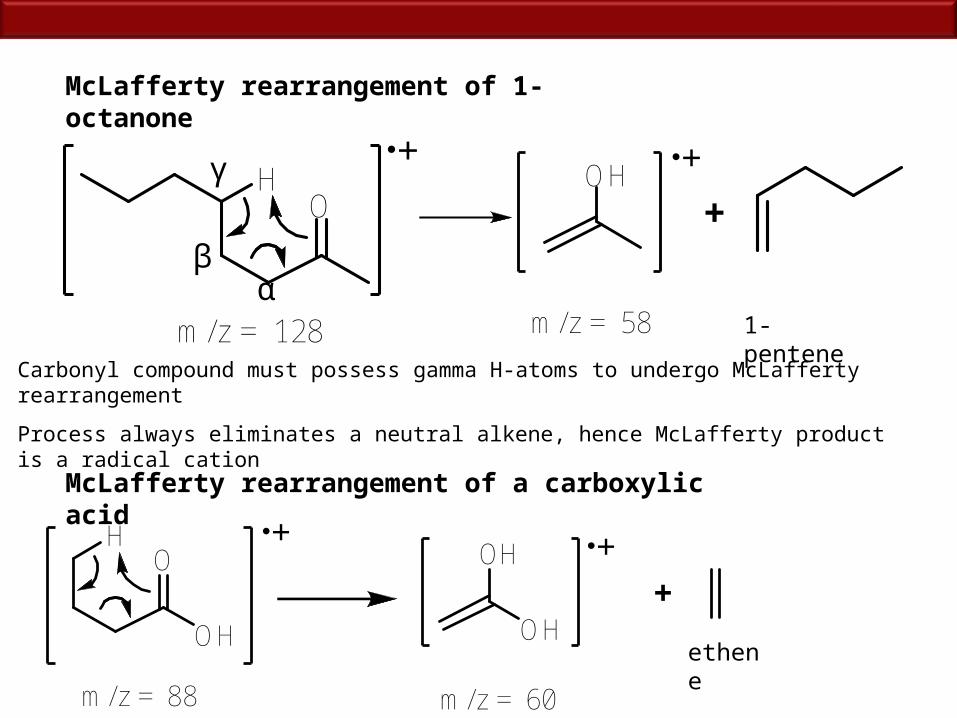
McLafferty rearrangement of 1-octanone
1-pentene
Carbonyl compound must possess gamma H-atoms to undergo McLafferty rearrangement
Process always eliminates a neutral alkene, hence McLafferty product is a radical cation
αβ
γ
O
OH
HOH
OH+
m/z = 60m/z = 88
McLafferty rearrangement of a carboxylic acid
ethene
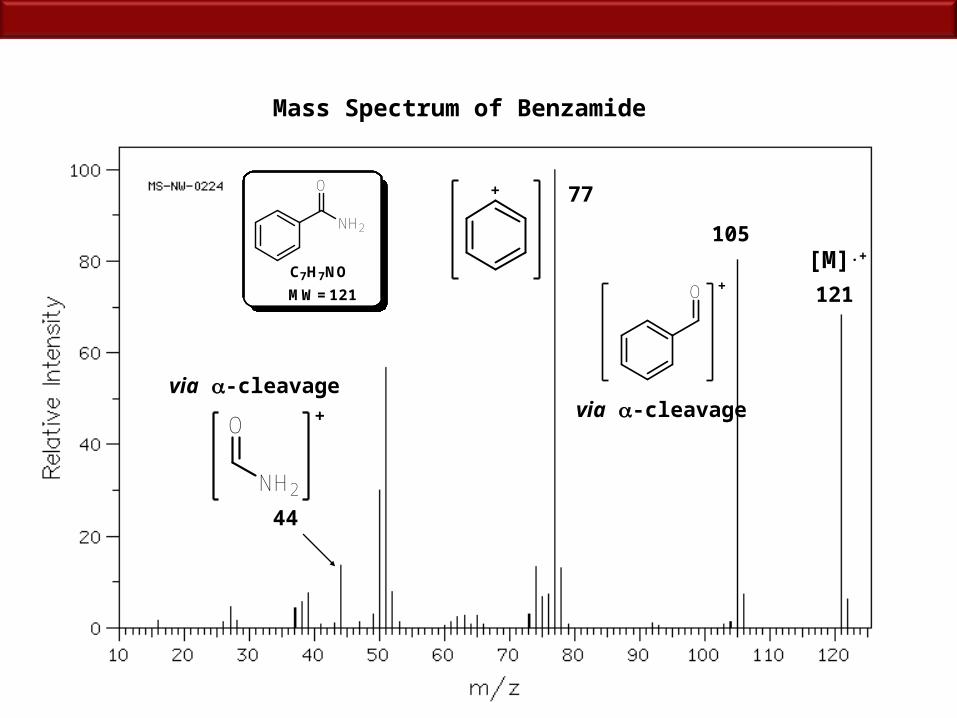
Mass Spectrum of Benzamide
105
77
44
O
O
NH2
O
NH2
C7H7NO
MW=121 121
via -cleavagevia -cleavage
[M].+
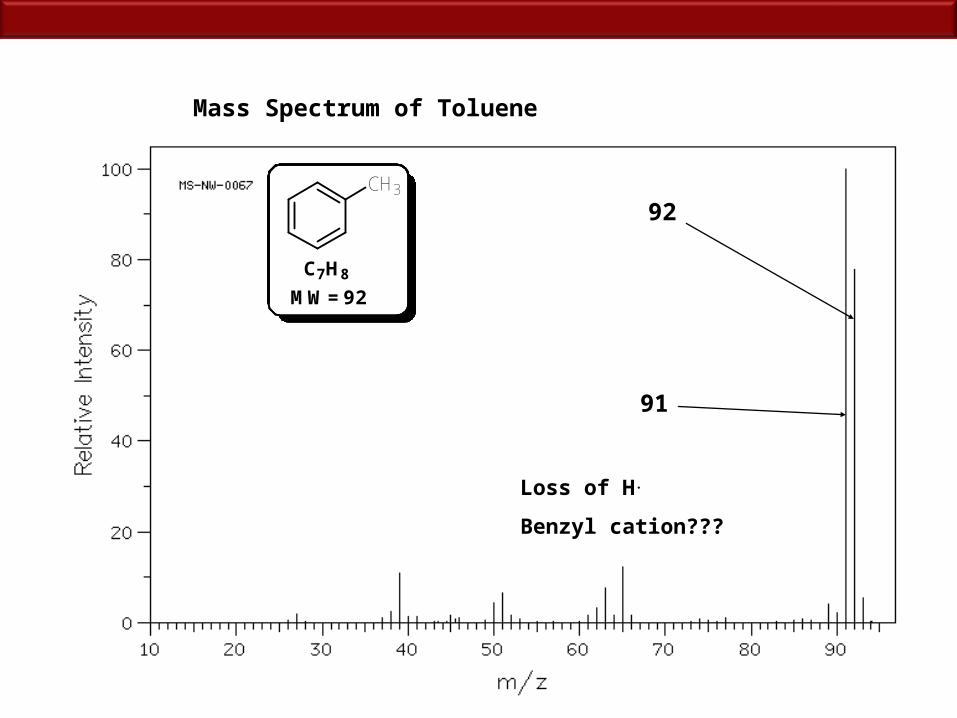
Mass Spectrum of Toluene
CH3
MW=92
C7H8
92
91
Loss of H.
Benzyl cation???
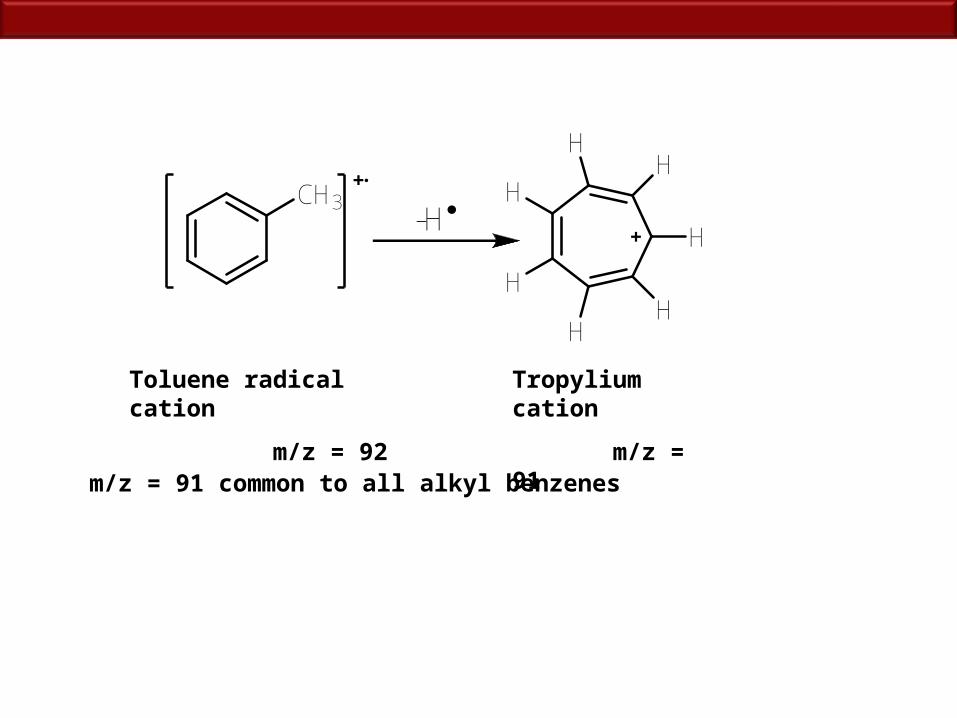
Tropylium cation
m/z = 91
CH3
HH
H
H
HH
H-H
Toluene radical cation
m/z = 92m/z = 91 common to all alkyl benzenes