Embed Size (px)
Citation preview

Chem. 230 – 9/30 Lecture

Announcements I
• Quiz 1 Results– Solutions have been
posted– See class
distribution– Large number of
high scores (best ever # 90%+)
– Also significant numbers of low scores
Score Range N
60-62 (100%+) 2
54-60 7
48-53 3
42-47 4
36-41 2
<36 3

Announcements II
• Second Homework Set Are Online (due 10/7)
• Today’s Topics – Mainly Chromatographic Theory– Basic definitions (more questions)– Rate Theory (cause of band broadening – Sect.
3.2)– Intermolecular Forces and Their Effects on
Chromatography (Sect. 4.1)– Optimization – if time

Chromatographic TheoryQuestions on Definitions
4. List 3 main components of chromatographs.5. A chemist perform trial runs on a 4.6 mm
diameter column with a flow rate of 1.4 mL/min. She then wants to scale up to a 15 mm diameter column (to isolate large quantities of compounds) of same length. What should be the flow rate to keep u (mobile phase velocity) constant?
6. A chemist purchases a new open tubular GC column that is identical to the old GC column except for having a greater film thickness of stationary phase. Which parameters will be affected: KC, k, tM, tR(component X), β, .

Chromatographic TheoryQuestions on Definitions
7. What “easy” change can be made to increase KC in GC? In HPLC?
8. A GC is operated close to the maximum column temperature and for a desired analyte, k = 10. Is this good?
9. If a new column for problem 8 could be purchased, what would be changed?
10. In reversed-phase HPLC, the mobile phase is 90% H2O, 10% ACN and k = 10, is this good?
11.Column A is 100 mm long with H = 0.024 mm. Column B is 250 mm long with H = 0.090 mm. Which column will give more efficient separations (under conditions for determining H)?

Chromatographic TheoryQuestions on Definitions
• Given the two chromatograms to the right:– Which column shows a
larger N value?– Which shows better
resolution (1st 2 peaks top chromatogram)?
– Which shows better selectivity (larger ; 1st 2 peaks on top)?
– Should be able to calculate k, N, RS, and α
min0 2.5 5 7.5 10 12.5 15 17.5
mV
0
200
400
600
800
1000
ADC1 A, ADC1 CHANNEL A (LILLIAN\102507000009.D)
0.9
26
7.1
73
8.4
44
12.
821
14.
242
15.
436
VWD1 A, Wavelength=210 nm (LILLIAN\102507000009.D)
0.8
41 1
.201
1.4
70 1
.613
2.6
96
8.3
09
14.
103
ADC1 A, ADC1 CHANNEL A (LILLIAN\102507000006.D)
0.9
24 1
.042
12.
754
VWD1 A, Wavelength=210 nm (LILLIAN\102507000006.D)
0.8
45 1
.204
1.4
73 1
.616
2.6
95
Unretained pk
min0 1 2 3 4 5 6 7 8
mV
50
100
150
200
250
ADC1 A, ADC1 CHANNEL A (MONIQUE\062608000004.D)
2.2
08
2.5
99
5.7
56
6.6
59
7.8
72
ADC1 B, ADC1 CHANNEL B (MONIQUE\062608000004.D) VWD1 A, Wavelength=205 nm (MONIQUE\062608000004.D)
2.8
42

Chromatographic TheoryRate Theory
• We have covered parameters measuring column efficiency, but not covered yet what factors influence efficiency
• In order to improve column efficiency, we must understand what causes band broadening (or dispersion)
• van Deemter Equation (simpler form)where H = Plate Heightu = linear velocityand A, B, and C are “constants”
Cuu
BAH

Chromatographic TheoryRate Theory
U
H
Most efficient velocity
A term
B termC term

Chromatographic TheoryRate Theory
• How is u determined?– u = L/tM
– u = F/A* (A* = effective cross-sectional area)
• “Constant” Terms– A term: This is due to
eddy diffusion– Eddy diffusion results
from multiple paths
Inside of column
(one quarter shown)
Shaded area = cross-sectional area = area*porosity
XXX
dispersion

Chromatographic TheoryRate Theory
• A Term– Independent of u– Smaller A term for: a) small particles, b)
spherical particles, or c) no particles (near zero)
– Small particles (trend in HPLC) results in greater pressure drop and lower flow rates

Chromatographic TheoryRate Theory
• B Term – Molecular Diffusion– Molecular diffusion is caused by random motions of
molecules– Larger for smaller molecules– Much larger for gases– Dispersion increases with time spent in mobile
phase– Slower flow means more time in mobile phase
XXX
Band broadening
at start

Chromatographic TheoryRate Theory
• C term – Mass transfer to and within the stationary phase– Analyte molecules in stationary phase are not moving
and get left behind– The greater u, the more dispersion occurs– Less dispersion for smaller particles and thinner films of
stationary phase– Less dispersion for solute capable of faster diffusion
(smaller molecules)
XX
dispersion
Column particle

Chromatographic TheoryRate Theory
• More generalities– Often run at u values
greater than minimum H (saves on time; reduces time based σ which can increase sensitivity depending on detector)
– For open tubular GC, A term is minimal, C term minimized by using smaller column diameters and stationary phase films
– For packed columns, A and C terms are minimized by using small particle sizes
Low flow conditions
Higher flow conditions

Chromatographic TheoryRate Theory
Some Questions:1. What are advantages and disadvantages
of running chromatographs at high flow rates?
2. Why is GC usually operated closer to the minimum H value than HPLC?
3. Which term is nearly negligible in open tubular GC?
4. How can H be decreased in HPLC? In open tubular GC?

Chromatographic TheoryEffects of Intermolecular Forces
• Phases in which intermolecular forces are important: solid surfaces, liquids, liquid-like layers, supercritical fluids (weaker)
• In ideal gases, there are no intermolecular forces (mostly valid in GC)
• Intermolecular forces affect:– Adsorption (partitioning to surface)– Phase Partitioning– Non-Gausian Peak Shapes

Chromatographic TheoryIntermolecular Forces – Types of Interactions
Interactions by decreasing strength• Ion – Ion Interactions
– Strong attractive force between oppositely charged ions– Of importance for ion exchange chromatography (ionic
solute and stationary phase)– Also important in ion-pairing used in reversed-phase HPLC– Very strong forces (cause extremely large K values in
absence of competitors)– From a practical standpoint, can not remove solute ions
from stationary phase except by ion replacement (ion-exchange)
• Ion – Dipole Interactions– Attractive force between ion and partial charge of dipole
M+ :N=C-CH3
- +

Chromatographic TheoryIntermolecular Forces – Types of Interactions
Interactions by decreasing strength – cont.
• Ion – Dipole Interactions – cont.– Determines strength of ionic solute – solvent interactions,
ionic solute – polar stationary phase interactions, and polar solute – ionic stationary phase interactions
– Important for some specific columns (e.g. ligand exchange for sugars or Ag+ for alkenes)
• Metal – Ligand Interactions– ion – ion or ion – dipole interaction, but also involve d
orbitals

Chromatographic TheoryIntermolecular Forces – Types of Interactions
Interactions by decreasing strength – continued (non-ionic interactions = van der Waal interactions)
• Van der Waals Forces– dipole – dipole interactions (requires two molecules with
dipole moments)• important for solute – solvent (especially reversed phase HPLC)
and solute – stationary phase (especially normal phase HPLC)• Hydrogen bonding is a particularly strong dipole-dipole type of
bonding– dipole – induced dipole interactions
• induced dipoles occur in molecules with no net dipole moment• larger, more electron rich molecules can get induced dipoles
more readily– induced dipole – induced dipole interactions (London
Forces)• occur in the complete absence of dipole moments• also occur in all molecules, but of less importance for polar molecules

Chromatographic TheoryIntermolecular Forces – Types of Interactions
• Modeling interactions– Somewhat of a one-dimensional model
can be made by assigning a single value related to polarity for analytes, stationary phases, and mobile phases (See section 4.3)
– These models neglect some interactions however (e.g. effects of whether an analyte can hydrogen bond with a solvent)

Chromatographic TheoryIntermolecular Forces – Asymmetric Peaks
- More than one possible cause (e.g. extra-column dispersion)
- One common cause is sample or analyte overloading of column
- Analyte loading shown →
- More common with solid stationary phase
- More common with open tubular GC; less common with HPLC
5% by mass ea.
20% by mass ea.
Chromatographic TheoryIntermolecular Forces – Asymmetric Peaks
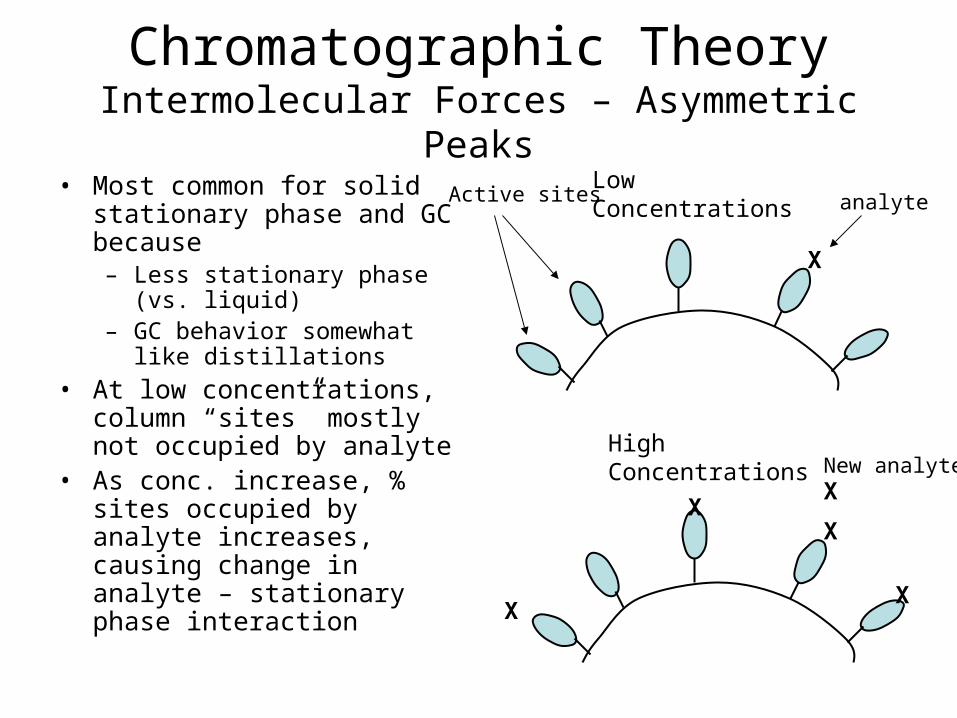
• Most common for solid stationary phase and GC because– Less stationary phase (vs.
liquid)– GC behavior somewhat
like distillations• At low concentrations,
column “sites” mostly not occupied by analyte
• As conc. increase, % sites occupied by analyte increases, causing change in analyte – stationary phase interaction
Active sitesLow Concentrations
X
analyte
High Concentrations
X
X
X
X
XNew analyte

Chromatographic TheoryIntermolecular Forces – Asymmetric Peaks
• As concentration increase, interactions go from analyte – active site to analyte – analyte
• If interaction is Langmuir type (weak analyte – analyte vs. strong analyte – active site), tailing occurs (blocking of active sites causes additional analyte to elute early)
• If interaction is anti-Langmuir type (stronger analyte – analyte interactions), fronting occurs (additional analyte sticks longer)
Tailing peak (up fast, down slow)
Fronting peak (up slow, down fast)

Chromatographic TheoryIntermolecular Forces – Asymmetric Peaks
• If tailing is caused by saturation of stationary phase, changing amount of analyte injected will change amount of tailing and retention times
Tailing Peaks
0100020003000400050006000700080009000
10000
0 2 4 6 8
Time (min.)
Re
sp
on
se
Low Conc. Std
High Conc. Std

Chromatographic TheoryIntermolecular Forces – Odd Peak Shapes
Other Reasons for Odd Peak Shapes• Large volume injections
– Example: 1.0 mL/min. + 0.1 mL injectionInjection plug time = 0.1 min = 6 s (so no peaks
narrower than 6 s unless on-column trapping is used)
• Injections at high temp./in strong solvents
X XX
X X X
In strong solvent
In weak solvent
Will not partition to stationary phase until mobile phase mixes in
Analytes stick on column until stronger mobile phase arives

Chromatographic TheoryIntermolecular Forces – Odd Peak Shapes
• Analyte exists in multiple forms– Example: maltotetraose
(glu[1→4]glu[1→4]glu)– Has 3 forms (α, β, or
aldehyde on right glu)– α and β forms migrate at
different rates– At low T, interconversion
is slow relative to tR. At high T, interconversion is faster
• Extra-column broadening/turbulent flow
• Multiple types of stationary phase
min6.5 7 7.5 8 8.5
mV
20
25
30
35
40
45
50
55
ADC1 A, ADC1 CHANNEL A (DIXON\HYPER0718000008.D)
6.8
29
7.6
19
VWD1 A, Wavelength=205 nm (DIXON\HYPER0718000008.D) ADC1 A, ADC1 CHANNEL A (DIXON\HYPER0718000006.D)
6.7
71
7.5
33
VWD1 A, Wavelength=205 nm (DIXON\HYPER0718000006.D) ADC1 A, ADC1 CHANNEL A (DIXON\HYPER0718000009.D) VWD1 A, Wavelength=205 nm (DIXON\HYPER0718000009.D) ADC1 A, ADC1 CHANNEL A (DIXON\HYPER0718000010.D) VWD1 A, Wavelength=205 nm (DIXON\HYPER0718000010.D)
Low T High T
X X
Non-polar groups
OH OH
Polar groups

Chromatographic TheoryIntermolecular Forces – Some Questions
1. Describe the dominant forces involving the molecules to the right in interacting with non-polar molecules? in interacting with polar molecules
2. How does going from DB-1 (100% methyl stationary phase) to DB-17 (50% methyl – 50% phenyl) in GC affect elution of fatty acid methyl esters? (e.g. C16 vs. C18 vs. C18:1)
CH3CH3
CH2CH3
O
CH2

Chromatographic TheoryIntermolecular Forces – Some Questions
3. Silica has many SiOH groups on the surface (pKa ~2). What interactions will occur with the analyte phenol, C6H5OH, if the eluent is a mixture of hexane and 2-propanol?
4. Sugars are often separated on amino columns. A sugar that has a carboxylic acid group in place of an OH group will have extremely large retention times (at least at neutral pH values). What does this say about the state of the amino groups?
Chromatographic TheoryIntermolecular Forces – Some Questions
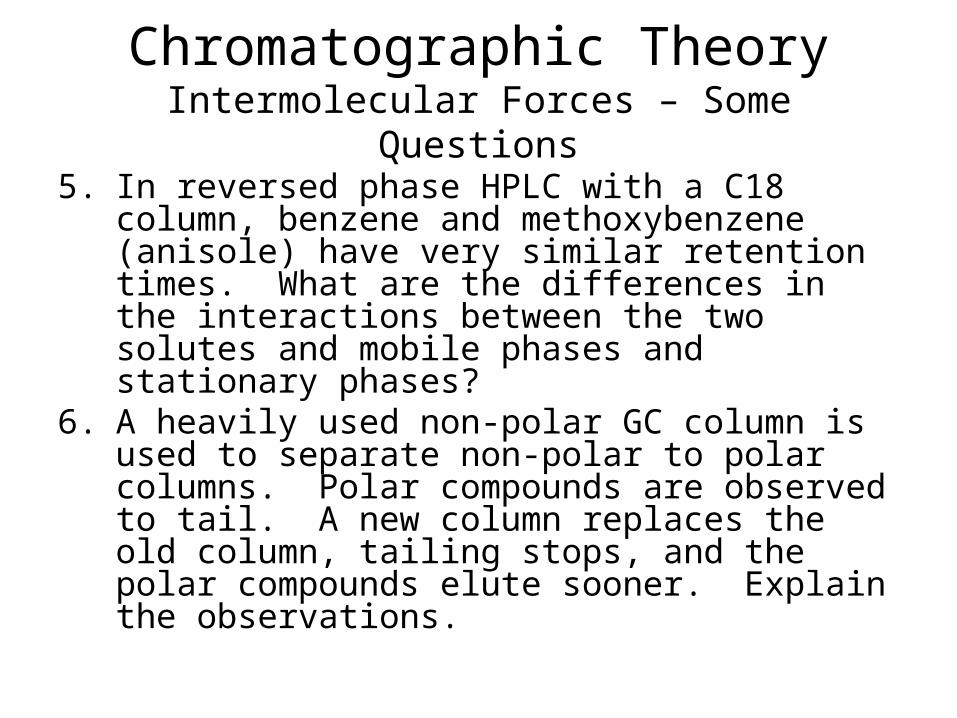
5. In reversed phase HPLC with a C18 column, benzene and methoxybenzene (anisole) have very similar retention times. What are the differences in the interactions between the two solutes and mobile phases and stationary phases?
6. A heavily used non-polar GC column is used to separate non-polar to polar columns. Polar compounds are observed to tail. A new column replaces the old column, tailing stops, and the polar compounds elute sooner. Explain the observations.

Chromatographic TheoryIntermolecular Forces – Some Questions
7. A megabore GC column (d = 0.53 mm) is replaced with an 0.25 mm diameter column in order to improve resolution of constituents from a sample. However, when the same sample is injected into the 0.25 mm diameter, little improvement in resolution and poor peak shape is seen. What is a possible reason? How can this be tested?
8. Normal phase HPLC is used to separate esters. Is better peak shape expected if hexane or methanol is the solvent? Why?

Chromatographic TheoryOptimization - Overview
• How does “method development” work?– Goal of method development is to select and improve a
chromatographic method to meet the purposes of the application
– Specific samples and analytes will dictate many of the requirements (e.g. how many analytes are being analyzed for and in what concentration?, what other compounds will be present?)
– Coarse method selection (e.g. GC vs HPLC and selection of column type and detectors) is often based on past work or can be based on initial assessment showing problems (e.g. 20 compounds all with k between 0.2 and 2.0 with no easy way to increase k)
– Optimization then involves making equipment work as well as possible (or limiting equipment changes)

Chromatographic TheoryOptimization – What are we optimizing?
• Ideally, we want sufficient resolution (Rs of 1.5 or greater for analyte/solute of interest peaks)
• We also want the separation performed in a minimum amount of time
• Other parameters may also be of importance:– sufficient quantity if performing “prep” scale separation– sufficient sensitivity for detection (covered more with
instrumentation and quantitation)– ability to identify unknowns (e.g. with MS detection)

Chromatographic TheoryOptimization – Some trade offs
• Flow rate at minimum H vs. higher flow rates (covered with van Deemter Equation) – low flow rate not always desired because of time required and sometimes smaller S/N
• Maximum flow rate often based on column/instrument damage – this can set flow rate
• Trade-offs in reducing H– In packed columns, going to small particle sizes results in
greater back-pressure (harder to keep high flow)– In GC, small column and film diameters means less
capacity and can require longer analysis times• Trade-offs in lengthening column (N = L/H)
– Longer times due to more column (often not proportional since backpressure at same flow rate will be higher)
Chromatographic TheoryOptimization – Improved Resolution Through Increased
Column Length
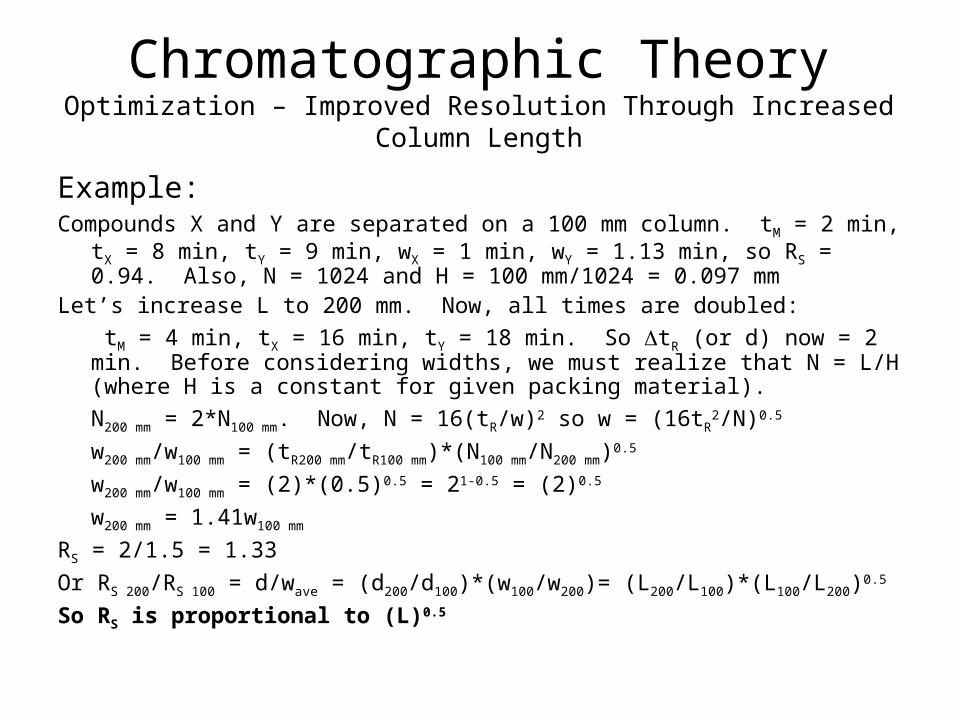
Example:Compounds X and Y are separated on a 100 mm column. tM = 2 min, tX
= 8 min, tY = 9 min, wX = 1 min, wY = 1.13 min, so RS = 0.94. Also, N = 1024 and H = 100 mm/1024 = 0.097 mm
Let’s increase L to 200 mm. Now, all times are doubled: tM = 4 min, tX = 16 min, tY = 18 min. So tR (or d) now = 2 min. Before considering widths, we must realize that N = L/H (where H is a constant for given packing material).N200 mm = 2*N100 mm. Now, N = 16(tR/w)2 so w = (16tR
2/N)0.5
w200 mm/w100 mm = (tR200 mm/tR100 mm)*(N100 mm/N200 mm)0.5
w200 mm/w100 mm = (2)*(0.5)0.5 = 21-0.5 = (2)0.5
w200 mm = 1.41w100 mm
RS = 2/1.5 = 1.33
Or RS 200/RS 100 = d/wave = (d200/d100)*(w100/w200)= (L200/L100)*(L100/L200)0.5
So RS is proportional to (L)0.5

Chromatographic TheoryOptimization – Resolution Equation
• Increasing column length is not usually the most desired way to improve resolution (because required time increases and signal to noise ratio decreases)
• Alternatively, k values can be increased (use lower T in GC or weaker solvents in HPLC); or α values can be increased (use different solvents in HPLC or column with better selectivity) but effect on RS is more complicated
B
BS k
kNR
11
41
Note: above equation is best used when deciding how to improve RS, not for calculating RS from chromatograms

Chromatographic TheoryOptimization – Resolution Equation
• Don’t use above equation for calculating Rs
• How to improve resolution– Increase N (increase column length, use more efficient
column)– Increase (use more selective column or mobile phase)– Increase k values (increase retention)
• Which way works best?– Increase in k is easiest (but best if k is initially small)– Increase in is best, but often hardest– Often, changes in k lead to small, but unpredictable,
changes in α also
B
BS k
kNR
11
41


![1].pdf · Detroit-Livonia-Dearborn, Mich. Dayton, Ohio; Youngstown-Warren-Boardman, Ohio-Pa., and Akron, Ohio. Five smaller housing markets posted even higher affordability scores](https://img.pdfslide.us/doc/110x75/602067f9042850498844d79b/1pdf-detroit-livonia-dearborn-mich-dayton-ohio-youngstown-warren-boardman.jpg)


![de partido a su piscina… - BINDER · Tipo BGA 160 BGA 215 BGA 275 BGA 320 BGA 430 BGA 550 BGA 600 BGA 1200 Tensión de conexión [VAC] 230 230 230 230 230 230 230 230 Rango de frecuencia](https://img.pdfslide.us/doc/110x75/5c132e8509d3f26c7c8c5e0d/de-partido-a-su-piscina-binder-tipo-bga-160-bga-215-bga-275-bga-320-bga-430.jpg)