Embed Size (px)
Citation preview

Chem. 133 – 2/19 Lecture

Announcements
• Lab Work– Turn in Electronics Lab– Starting Set 2
• HW1.2 Due Today• Quiz 2 Today• Today’s Lecture
– Noise– Electrochemistry

Signal Averaging - Question
• A 1H NMR is performed on a small amount of sample expected to be the compound at right:
• With 16 scans the S/N observed for the c 1H peak is 17.
• How many scans are needed so that the minimum peak has a S/N of 3? (Assume all peaks have the same width)
CH3CH3 O
CH3 CH3
a
b
c

NoiseSources – Fundamental Types
A. Thermal Noise = Johnson Noise (voltage associated)
- where:kB = Boltzmann’s constant, T = temp. (K), R =
resistance (W), and B = bandwidth (Hz) = range of frequencies accepted
- Solutions: cool devices, use lower R values, reduce bandwidth
B. Shot noise (current associated)
- Solutions: reduce bandwidth, use internally amplified transducers
TRBkV Brmsn 4)(
qIBI rmsn 2)( where q= fundamental charge = 1.6 x 10⁻¹⁹ C and I = current

NoiseSources – Other Types
A. Flicker Noise (or 1/f noise or pink noise)- Occurs at low frequencies- Can result from environmental changes (e.g.
change in light intensity over time, change in temperature)
- Can be reduced through modulating source

NoiseFlicker Noise Example
lamp
chopper (alternatively reflects light or lets light through)
light detectorsample cell
blank cell
mirrors
Example of equipment for noise reduction
To Digitizer
high pass filter
rectifier

NoiseFlicker Noise Example: Signals
Removal of 1/f Noise
0
50
100
150
200
250
300
0 50 100 150 200 250
Time (s)
Sig
nal
(m
V)
Noise
Mod Sig
light detector signal
High Pass Data
-150
-100
-50
0
50
100
150
0 50 100 150 200 250
Time (s)
Sig
nal
(m
V)
High Pass Data
slow increase in noise over 1st ~100 s
RC Filter only
low f noise removedPositive Only
0
20
40
60
80
100
120
0 50 100 150 200 250
Time (s)
Sig
nal
(m
V)
High Pass Data
RC Filter + diode
Smoothed Low Pass
0
10
20
30
40
50
60
70
80
90
100
0 50 100 150 200 250
Time (s)
Sig
nal
(m
V)
Add. Filtering
Signal following digital filtration

NoiseSources – Other Types
B. Interference– Noise originating from other electrical
signals (especially ones that use more power)
– Examples: 60 Hz from power lines, spikes from solenoids, turning heaters on/off
– Solution to problems: 1) use shielded cables, 2) shield major power sources, 3) use differential amplifiers

Noise Processing to Reduce
• Both analog and digital means can be used to reduce noise
• Band width reduction can reduce noise• Low pass filters (e.g. RC filters) reduce
high frequency noise but lose high frequency signals
• Similar methods (e.g. moving averages) for removing high frequency noise can easily be done on digital data
• A separate way to reduce noise is to signal average (e.g. collection and averaging spectra), provided experiment can be replicated closely

NoiseProcessing to Reduce
• Example of moving average (0.5, 2, 10, and 30 s) to remove high frequency noise
HPLC-FLD Plot
0.980.99
11.011.021.031.041.051.06
0 2 4 6 8 10
Time (min.)
Sig
nal
(F
LD
)
Raw Data (collected at 10 Hz)
HPLC-FLD Plot
0.980.99
11.011.021.031.041.051.06
0 2 4 6 8 10
Time (min.)
Sig
nal
(F
LD
)
Raw + 0.5 s data
HPLC-FLD Plot
0.980.99
11.011.021.031.041.051.06
0 2 4 6 8 10
Time (min.)
Sig
nal
(F
LD
)
Raw + 2 s data
Only slight reduction of noise observed
Definite reduction of noise observed
HPLC-FLD Plot
0.99
1
1.01
1.02
1.03
1.04
1.05
1.06
0 1 2 3 4 5 6 7 8
Time (min.)
Sig
nal
(F
LD
)
Raw + 10 s data
Even more noise reduction observed, but peak starting to broaden and flatten
HPLC-FLD Plot
0.99
1
1.01
1.02
1.03
1.04
1.05
1.06
0 1 2 3 4 5 6 7 8
Time (min.)
Sig
nal
(F
LD
)
Raw + 30 s data
Clearly over filtered (resolution lost by broadening)
5 0.1 s points averaged to make 0.5 s point

NoiseHPLC Example
Type Noise Baseline SignalBaseline corrected
signal S/N
Peak Width at half height
Unfiltered
0.002891
0.999447
1.0519 0.052470125 18 0.202
0.5 s MA0.00216
60.99946
11.048
9 0.049437891 23 0.202
2 s MA0.00123
2 0.999461.045
8 0.046335795 38 0.2282
10 s MA0.00053
50.99945
71.041
4 0.041971743 79 0.255
30s MA 0.000470.99951
21.022
1 0.022616734 48 0.507

NoiseQuestions
1. What type of noise is likely to be present when using thermocouples to measure temperature?
2. Why is modulation normally required to reduce 1/f noise?
3. What is the percent noise on a current producing transducer which generates signal over a 1000 Hz band if the signal is 10 nA? if the signal is 2.0 pA?
4. What specific type of noise is reduced best by shielding electronics?
5. How would use of a low pass filter reduce shot noise?
6. Suggest one method for reducing thermal noise.7. What type of noise is not effectively reduced by
using a low pass filter?

ElectronicsAdditional Questions
• Answer the questions 1-3 from the following plots which were obtained from background measurements (instrument noise):
1. Which plot is most likely shows 1/f
noise: ______________________
2. Which plot when Fourier transformed will produce a plot with a peak at 55 Hz: ______________
3. If plot c) shows noise from a GC signal in which peaks typically are on the order of 2 s (2000 ms) wide, what can be done to reduce the noise?
-50
0
50
100
150
200
250
0 50 100 150
Time (ms)
Vol
tage
(m
V)
0
20
40
60
80
100
120
140
160
180
0 20 40 60 80 100 120 140 160
time (ms)
Vo
ltag
e (m
V)
0
20
40
60
80
100
120
0 50 100 150
Time (ms)
Vo
lta
ge
(m
V)
a)
b)
c)

ElectrochemistryOverview
• Applications– quantitative analysis
• potential measurement methods (e.g. pH electrode)• current based measurements (amperometry)
– qualitative analysis (voltammetry)– note: potential normally gives qualitative
information and current quantitative measurements
• Why Use?– lower cost– high sensitivity possible (particularly mass
sensitivity)– simpler equipment, more useful for field, in-situ
type measurements
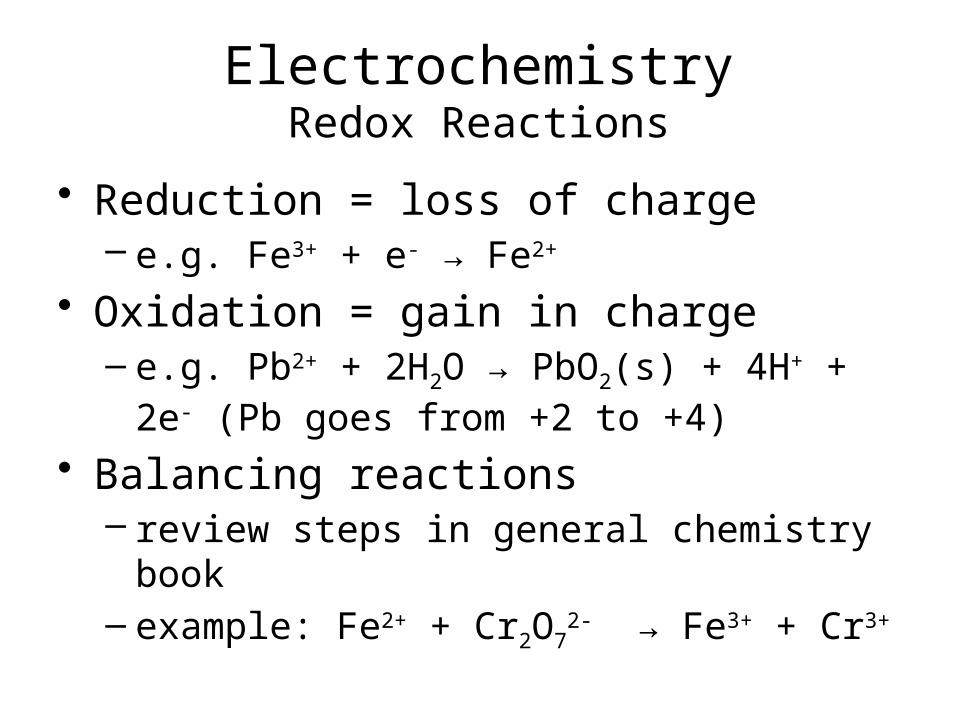
ElectrochemistryRedox Reactions
• Reduction = loss of charge– e.g. Fe3+ + e- → Fe2+
• Oxidation = gain in charge– e.g. Pb2+ + 2H2O → PbO2(s) + 4H+ + 2e-
(Pb goes from +2 to +4)• Balancing reactions
– review steps in general chemistry book– example: Fe2+ + Cr2O7
2- → Fe3+ + Cr3+