Embed Size (px)
Citation preview
CHEAP CHILDREN AND THE PERSISTENCE OFPOVERTY*
Omer Moav
This paper develops a theory of fertility that offers an explanation for the persistence of povertywithin and across countries. If educated individuals have a comparative advantage in raisingeducated children then parental fertility choice is shown to give rise to a poverty trap, in whichthe poor choose high fertility rates with low investment in child quality. Moreover, the impact ofchild quality choice on economic performance is amplified by the diluting effect of higherfertility on physical capital accumulation. The theory proposes insights regarding the effects ofinequality, globalisation and life expectancy on economic growth and demographic transitions.
This paper develops a theory of fertility and child educational choice that offers anexplanation for the persistence of poverty within and across countries. The jointdetermination of the quality (education) and quantity of children in a household isstudied under the key assumption that individuals’ productivity as teachersincreases with their own human capital. In contrast, the minimum time cost asso-ciated with raising a child regardless of the child’s quality – the quantity cost – is notaffected by parental education. As a result, the price of child quantity relative to theprice of child quality increases with individuals’ wages. In particular, for low-wageindividuals, for whom the opportunity cost of time is low, children of minimalquality are ‘cheap’. This assumption, therefore, generates a comparative advantagefor the poor in child quantity, whereas high-wage (educated) individuals have acomparative advantage in raising quality children. Consistent with the well-knownevidence, poor households thus choose relatively high fertility rates with relativelylow investment in their offspring’s education; and therefore, their offspring arepoor as well. In contrast, high-income families choose low fertility rates with highinvestment in education, and therefore, high income persists in the dynasty.
Evidence from the US, provided by Hanushek (1992), suggests that a trade-offbetween quantity and quality of children does indeed exist. Hanushek argues thatmovements in family size could explain over half the variance in some test scores,and that the elasticity of achievements with respect to the number of children inthe family is )0.03, implying that the annual achievement growth of each child in afamily will fall about 2% when a second child is added and about 0.5% when a sixthchild is added.1
* I wish to thank Daron Acemoglu, Josh Angrist, Ilhem Baghdadli, Abhijit Banerjee, Patricia Crifo,Oded Galor, Eric Gould, Moshe Hazan, Yishay Maoz, JoramMayshar, Olivier Morand, Avi Simhon, DavidWeil, Mathias Thoenig, Joseph Zeira, two anonymous referees, and participants in seminars and con-ferences at the Hebrew University of Jerusalem, MIT, CESifo conference on Economic Growth andInequality, Munich 2001, and the Israeli Economic Association conference, 2001, for helpful discussions.I am grateful to the Maurice Falk Institute for financial support. This publication has been funded by theMelchior Minerva Center for Macroeconomics and Growth. Minerva is funded through the BMBF.
1 Rosenzweig and Wolpin (1980) provide consistent evidence from India for the existence of a trade-off between child quality and quantity, and Knodel and Wongsith (1991) show that family size exerts asubstantial negative influence on the probability that a child will attend secondary school in Thailand.
The Economic Journal, 115 (January), 88–110. � Royal Economic Society 2005. Published by BlackwellPublishing, 9600 Garsington Road, Oxford OX4 2DQ, UK and 350 Main Street, Malden, MA 02148, USA.
[ 88 ]
Regarding the transmission of poverty across generations and its relationshipwith fertility, Lam and Duryea (1999) argue that there is a strong negative effect ofwomen’s schooling on fertility and a strong positive effect of parental schooling onchildren’s schooling.2 They find that Brazilian women with zero years of schoolinggive birth to 6.5 live children, whereas this number declines to 3 for women with8 years of schooling. Further, they argue that the effect of schooling on fertility, asconsistent with the underlying mechanism developed here, works primarilythrough increased investment in child quality. Lam and Duryea suggest thatmothers with more schooling, despite the large increase in their market wages, donot significantly increase their labour supply because of their higher productivityin producing well-educated children. In particular, while the wage rate for womenwith 8 years of schooling is 3.3 times larger than that of women with no schooling,labour force participation is 37% for women with 8 years of schooling, in com-parison to 32% for women with zero schooling. In addition, Behrman et al. (1999)find that increases in the schooling of women in India enhance the human capitalof the next generation, and argue that a component of the significant and positiverelationship between maternal literacy and child schooling reflects the produc-tivity effect of home teaching.3
Evidence on the allocation of time in home production, as consistent with theprediction of the theory developed in this paper, suggests that educated parents’time allocation is biased towards child quality. Behrman et al. (1999) find thatchildren with mothers who are literate (but not primary-school graduates) studyone hour more per day than children with illiterate mothers.4 In addition, Lynch(2000), based on US data from the National Household Education Survey of 1996,shows that 77% of college graduate mothers read to their 3 to 5 year old childrenevery day, in contrast to only 37% of mothers who do not have a college degree.5
Phillips et al. (1998) argue, moreover, that measures of maternal time input rendermothers’ IQ and parents’ education insignificant in explaining verbal skills,implying that the mechanism generating the correlation between parents’ andchildren’s education is highly related to the greater time invested by educatedmothers in the quality of their children.
[ J A N U A R Y 2005] 89P E R S I S T E N C E O F P O V E R T Y
2 Evidence of the negative correlation between fertility and education is also provided by Kremer andChen (2002), and evidence of the positive correlation between parents’ education and children’seducation is also provided by Altonji and Dunn (1996) and by Ahituv (2001), among others.
3 See also the survey of the evidence by Schultz (1993) and by Strauss and Thomas (1995). They showthat women’s education is strongly negatively correlated with fertility and positively correlated with childquality (education and health), and that fathers’ education has a similar effect but of less magnitude.Behrman and Rosenzweig (2002), however, find a marginally negative rather than a significantly pos-itive coefficient for mother’s schooling in the determination of child schooling once ability is con-trolled. They find that increased maternal schooling leads to reduced home time for mothers, implyingthat the increase in mother’s wages more than offsets their increased productivity in child quality. Theydo find, however, a positive and statistically significant coefficient of father’s schooling on children’sschooling. Finally, they argue that their findings must be interpreted with care because it is possible thatmother’s increased schooling leads to increased child schooling elsewhere, as shown by Behrman et al.(1999).
4 However, the relationship is non-monotonic; children of mothers who completed primary schoolspend more time studying than children of illiterate mothers but less time than children of literatemothers who did not graduate from primary school.
5 Rebello-Britto et al. (2001) provide consistent evidence regarding younger children.
� Royal Economic Society 2005
Finally, consistent with the paper’s key assumption that increases in marketproductivity are highly correlated with increases in the productivity of homeproduction of human capital, Psacharopoulos et al. (1996) find that teachers inLatin American countries are rewarded for their education similarly to the averagereward in the economy. Card and Krueger (1992) argue that schooling rates ofreturn are higher for individuals from states with better-educated teachers, andAngrist and Lavy (2001) find that teachers’ training led to an improvement instudents’ test scores.
In the paper’s basic model, dynasties within a country can converge to one oftwo equilibria; either a low education – high fertility equilibrium, or a high edu-cation – low fertility equilibrium. An extension of this basic model captures thediluting effect of fertility on the accumulation of physical capital, amplifying theeffect of quality choice on income per capita. Consistent with the negative cross-country relationship between fertility and growth and the positive cross-countryrelationship between education and growth, countries can converge to two dif-ferent levels of income per capita. The high-income steady state, in contrast to thelow-income steady state, is characterised by high levels of physical and humancapital per capita and low rates of fertility.
Ahituv (2001) finds that the cross-country distribution of fertility is character-ised by a twin-peak structure; in 1965, a mass of low-income countries, with aGDP of less than $1,000 per capita, had average fertility rates of 6.5 children perwoman, as opposed to 3.7 in the high-income group with a per capita GDP above$2,500. During the same period, only 6% of the relevant school-age childrenwere enrolled in secondary school in the low-income countries, compared to49.2% in the high-income countries. The picture in 1985 was very similar; theaverage fertility rate in the low-income countries was still above 6, and in thehigh-income group the average had declined to 2.4. During the last decade, datafrom the United Nations Statistical Yearbook shows that fertility rates have beendropping in most countries around the world and many of the poor countrieshave experienced a demographic transition in which fertility has declined dra-matically. Nevertheless, despite the decline in the number of countries belongingto the high-fertility club, with birth rates above 5 children per woman (allcharacterised by low levels of education), a twin-peak structure still characterisesthe distribution of fertility in the year 2000. In addition, as suggested by Barro(1991), fertility rates and education levels are related to economic growth. Heargues that economic growth is positively correlated with human capital andcountries with higher human capital also have lower fertility rates and higherratios of physical investment to GDP.6
Economic growth models of fertility designed to explain the possibility ofmultiple equilibria – a poverty-trap equilibrium and a high-income equilibrium– go back to Nelson (1956). He shows that in an environment in which fertilityand saving rates increase with income, an underdevelopment trap with lowsavings is plausible. In this trap, even if capital is accumulated, the population
6 See also Kelley and Schmidt (1995) regarding the negative correlation between economic growthand population growth.
90 [ J A N U A R YT H E E CONOM I C J O U RN A L
� Royal Economic Society 2005

rises at an equal rate. More recently, Becker et al. (1990), developed a repre-sentative agent model in which individuals face the trade-off between thequality and quantity of their offspring. Their model generates multiple steadystates consistent with the cross-country relationship between fertility, educationand growth. The source of multiplicity of equilibria in their model is theassumption that the return to education is lower in poor economies. In par-ticular, they assume that the return to human capital increases with theaggregate level of education in society. Their approach suffers from both the-oretical and empirical limitations. The poverty-trap equilibrium is a result of amarket failure in a framework in which education has a positive externality,where existing evidence contradicts the underlying assumption of increasingreturns to education with income or education.7 Furthermore, while fertilitydecisions in the analysis of Becker et al. (1990) may amplify the negative impactof low education investment on income per capita, they are not the source ofmultiple equilibria.8
In this paper, in contrast, a simple dynamical system generates multiple steadystates that emerge from the comparative advantage of educated workers in theproduction of educated children. The model is not based on restrictiveassumptions concerning preferences, or on any non-convexity in the productionof final output and human capital. Moreover, the model generates a testableprediction regarding the correlation of education and income within a dynasty.It suggests that individuals with a high level of human capital would investhighly in their offspring’s education, even in poor economies. In contrast, themodel developed by Becker et al. (1990) implies that in poor economies, wherehuman capital is scarce, the investment in human capital is low due to its lowreturn, regardless of the parents’ level of human capital. That is, their modelimplies that in poor economies all families eventually converge to a low-edu-cation equilibrium and in rich economies, all families eventually converge to ahigh-education equilibrium. In contrast, according to my model, poverty canpersist in wealthy countries, and wealthy (educated) individuals can exist in thelong run in poor countries.The micro-foundations of this paper follow the concept of a trade-off between
child quality and child quantity analysed by Becker and Lewis (1973). Theirprincipal observation is that the cost of an additional child increases with thedesired level of child quality. Therefore, under the assumption that both childquantity and child quality are normal goods, a rise in income has two oppositeeffects on the quantity of children. While the increase in income has a directpositive effect on the quantity of children, it also increases their quality and thustheir cost, negatively affecting their quantity. Becker and Lewis show, therefore,
7 See, for instance, Psacharopoulos (1994), Angrist (1995), Acemoglu and Angrist (2000), Cicconeand Peri (2002), Rudd (2002) and Moretti (2004).
8 Tamura (1996) also generates two development regimes based on a rising rate of return to humancapital investment and a conditional external effect in human capital investment. Hazan and Berdugo(2002) generate a poverty trap based on child labor and high fertility. See also Barro and Becker (1989)who offer an explanation for the negative cross-sectional relation between income and populationgrowth based on the effect of the trade-off between the size of the real transfer to each child and thenumber of children on the unique steady state of their model.
2005] 91P E R S I S T E N C E O F P O V E R T Y
� Royal Economic Society 2005
that in spite of the normality of the demand for children, if preferences arenon-homothetic, the observed relationship between the quantity of children andincome can be negative.
In this paper, as in Becker and Lewis (1973), the cost of an additional childincreases with the desired level of child quality, and the cost of quality increaseswith the number of children, generating a non-convex budget set. However, incontrast to Becker and Lewis, here the key assumption is that individuals’ pro-ductivity in educating children increases with their own human capital, whereasthe fraction of the individual’s time endowment that is required in order to raise achild, regardless of quality – the quantity cost – is equal across all individuals. Forinstance, while all individuals are equally able at feeding a child, their effectivenessin helping children with homework increases with their own level of education.This assumption implies that the ratio between the price of quantity and the priceof quality increases with the individual’s wage, which generates a comparativeadvantage for the poor in child quantity and a comparative advantage for thewealthy in raising quality children. The impact of changes in wages is amplified bythe non-convexity of the budget set, bringing about the negative correlationbetween income and fertility, and multiple equilibria.
On a more intuitive level, the mechanism generating multiple equilibria is basedon a ‘multiplier effect’. A decline in parental education, and hence in theirincome, leaves less resources for the children’s education. The increased fertility,due to the lower time cost, further reduces resources for education, which are inaddition divided between more children. Therefore, differences in parents’ edu-cation can be amplified when it comes to differences in offspring education,generating multiple equilibria. Interestingly, the poor in each generation canchoose to invest highly in education, at the expense of their fertility rate and allowtheir offspring to escape the poverty cycle. However, they prefer not to. Theendogenous fertility framework, with a trade-off between quality and quantity,raises an inherent conflict of interest between parents and offspring. Parents careabout both the quality of each child and the quantity of children, whereas childrenprefer less siblings and more human capital. Because parents make the decisionsin the household, poverty may persist.
This paper is also related to the literature on the effect of income inequality oneconomic growth – a line of research that has received a lot of attention in thelast decade.9 Due to mobility constraints, poor dynasties remain poor, leadingeconomies to an underdevelopment trap. Banerjee and Newman (1993), Galorand Zeira (1993), Benabou (1996), Durlauf (1996a), Piketty (1997), Maoz andMoav (1999), Ghatak and Jiang (2002) and Mookherjee and Ray (2003), amongothers, show that credit constraints combined with non-convexities in the tech-nology prevent investment by the poor, generating persistence of poverty and
9 The impact of economic growth on income inequality, while highly related, is beyond thefocus of this paper. Galor and Tsiddon (1997), Acemoglu (1998), Caselli (1999), Galor and Moav(2000), Eicher and Gracia-Penalosa (2001), Gould et al. (2001), Aghion et al. (2002), Gould (2002),Violante (2002) and Rubinstein and Tsiddon (2004), among others, have recently contributed tothe theoretical study of the effect of technological progress and economic growth on wageinequality.
92 [ J A N U A R YT H E E CONOM I C J O U RN A L
� Royal Economic Society 2005
thereby an impact of the initial wealth distribution on the long-run steady-stateequilibrium.10
In this paper, the dynamic system generates a poverty trap along with a high-income (high human capital) equilibrium. Poor dynasties with income below athreshold level converge to the low-income steady state, whereas dynasties withincome above the threshold level converge to a high-income steady state. There-fore, if the initial average income in society is above the threshold, then in a moreequal society, more individuals are above the threshold and more dynasties con-verge to the high steady state. Hence, consistent with evidence offered by Perotti(1996) and Barro (1999), and the quantitative analysis of de la Croix and Doepke(2003),11 inequality affects economic growth negatively via its interaction withfertility choice.12 Moreover, in contrast to the existing literature, the result of along-run impact of the initial wealth distribution is generated in spite of convexhuman capital and final good production technologies and convex homotheticpreferences.13 Inferences from the model, discussed in the concluding remarks,suggest that inequality has an additional direct negative effect on economic growthvia its effect on the relative reward to human capital and physical capital.Recent literature on population and growth offers explanations for a demo-
graphic transition and a take-off from economic stagnation to sustained economicgrowth. Galor and Weil (2000) assume that a rise in the rate of technologicalprogress increases the rate of return to human capital, inducing parents to sub-stitute child quality for child quantity. They show that a positive interactionbetween population and technology gradually increased the rate of technologicalprogress, inducing investment in human capital that led to a demographic trans-ition and sustained growth. Galor and Moav (2002) develop a unified evolutionarygrowth theory that captures the interplay between the evolution of mankind andeconomic growth. They suggest that prolonged economic stagnation, prior to thetransition to sustained growth, stimulated natural selection, which shaped theevolution of the human species and eventually brought about the take-off fromstagnation to sustained growth.14 In Galor and Weil (2000), as well as in Galor andMoav (2002), technological progress brings about an increase in the return toeducation, triggering a demographic transition and an escape from a temporary
10 In the model developed by Piketty (1997), the effort level, rather than capital investment, isindivisible. Mookherjee and Ray (2003) show that while inequality persists irrespective of the divisibilityof human capital, the multiplicity of steady states requires indivisibilities in the return to education.
11 de la Croix and Doepke (2003) provide a related mechanism regarding the effect of inequality oneconomic performance. In the presence of inequality, families who provide less education, have moreoffspring, and thereby have an impact on the future education distribution which is larger than theircurrent weight in the population.
12 Banerjee and Duflo (2003), however, argue that this is a result of a ‘Latin American effect’.13 Moav (2002), demonstrates that increasing saving rates with income can replace the role of non-
convexities in the technology in generating multiple steady states. In addition, regardless of non-convexities in the technology, Benabou (2000) shows that multiplicity of equilibria arises through thefeedback from the income distribution to the political determination of redistribution and Castello-Climent and Domenech (2002) generate multiple equilibria by combining endogenous life expectancyand schooling decisions.
14 Long-run growth models with endogenous population also include the work of Kremer (1993),Galor and Weil (1996), Dahan and Tsiddon (1998), Morand (1999), Jones (2001), Hansen and Prescott(2002), Doepke (2004) and Lagerloef (2003), among others.
2005] 93P E R S I S T E N C E O F P O V E R T Y
� Royal Economic Society 2005
poverty-trap steady state. Here, in contrast, because labour is a factor in the pro-duction of human capital, the cost of education increases with wages and hencethe model’s multiple steady states are robust to technical progress. Thus, whiletechnology is (at least partly) available to less developed economies,15 the modeloffers an explanation for the observed persistence of poverty accompanied by highfertility in many countries around the world.
1. The Basic Model
Consider an overlapping-generations economy in which activity extends overinfinite discrete time. In every period, the economy produces a single homogen-eous good, in a constant-returns-to-scale technology, using human capital as asingle input. The supply of human capital is determined by households’ decisionsin the preceding period regarding the number of their children and the level ofeducation investment in each child.
1.1. Individuals
In each period a generation of individuals, who each has a single parent, is born.Individuals live two periods: in childhood they acquire human capital; in adult-hood they are endowed with one unit of time, which they allocate between childrearing and participation in the labour force.
The preferences of members of generation t (born in t ) 1) are defined overconsumption as well as over the quality and quantity of their children, wherequality is measured by their offspring’s full income (potential income). Prefer-ences are represented by the utility function
uit ¼ ð1� bÞ log cit þ bðlog ni
t þ h logwhitþ1Þ; ð1Þ
where b 2 (0, 1) captures the relative weight given to children (quality as well asquantity) and h > 0 captures the relative weight given to child quality in the utilityfunction. cit is the consumption in the household of a member i of generation t, ni
t
is the number of children in this household, w is the wage rate per efficiency unitof labour,16 and hitþ1 is the level of human capital of each child measured inefficiency units.17
15 See Basu and Weil (1998) and Acemoglu and Zilibotti (2001).16 As follows from the assumption of a single production factor in a CRS technology, the wage rate
per efficiency unit of labour, w, is constant over time. This assumption is relaxed in the next sectionwhere both physical and human capital are employed in the production process. The inclusion of thewage rate in the utility function implies that parents care about offspring income. Removing the wagerate from the utility would allow for a different interpretation – that schooling is valued for its own sake– with no impact on the model’s results.
17 Defining preferences over the quality of each child, rather than the average quality, and thusimplicitly restricting parents from treating children unequally, is not a binding constraint in the contextof this model. Children are identical with respect to their human capital production technology, whichis characterised by decreasing returns, and therefore, parents provide equal education to all theirchildren under both specifications.
94 [ J A N U A R YT H E E CONOM I C J O U RN A L
� Royal Economic Society 2005
1.2. The Formation of Human Capital
In the first period of their lives individuals devote their entire time to the acqui-sition of human capital (measured in efficiency units of labour). The acquiredlevel of human capital increases if their time investment is supplemented byinvestment in education. However, even in the absence of investment in educa-tion, individuals acquire one efficiency unit of labour – basic skills. The level ofinvestment in education of individual i born in period t; eitþ1, is measured inefficiency units of labour, capturing the model’s key assumption that individuals’productivity as teachers increases with their own human capital. Since eitþ1 ismeasured in efficiency units of labour, the real cost of the investment in educationis weitþ1, whether this is viewed as a direct cost of hiring a teacher or an opportunitycost of teaching one’s own children.18 The resulting number of efficiency units oflabour of individual i in period t þ 1; hitþ1, is a strictly increasing, strictly concavefunction of investment in education in period t; eitþ1,
hitþ1 ¼ hðeitþ1Þ; ð2Þ
where hð0Þ¼ 1; lime!0þ h0ðeit Þ¼ c; lime!1 hðeit Þ> 1=shc,19 and lime!1 h0ðeit Þ ¼ 0.
The assumption that the slope of the production function of human capital isfinite, along with individuals’ ability to supply some minimal level of labourregardless of the investment in human capital (beyond time), ensure that undersome conditions, raising quality children is not optimal. The frequently postulatedassumption that the return to human capital is infinitely high at the lower limit(i.e., the Inada conditions), is designed to simplify the exposition by avoidingcorner solutions but it is surely not a realistic assumption and, as clearly evidentfrom Becker (1975), it is not the rule in either theoretical or empirical analyses.Indeed, following Mincer (1974), many empirical estimates of the returns toeducation do not assume or find slopes that are infinitely large (e.g., Psacharop-oulos, 1994). The assumption that h(0) is strictly positive is reasonable. It impliesthat when parents invest the minimal level in each child (captured by s), childrencan supply some labour when they become adults. An alternative approach,commonly employed in the literature about poverty traps and credit constraints,assumes indivisibilities in the production of human capital. Following thisapproach, i.e. adding non-convexities to the investment technology, wouldgenerate multiple equilibria in a rather trivial manner, as demonstrated, forinstance, by Galor and Zeira (1993).
18 The assumption that individuals’ productivity as teachers increases with their level of humancapital and therefore with their market productivity by more than their increased productivity in childquantity (providing children with the necessities that are less related to education) drives the model’sresults. It generates a comparative advantage in child quality to high-income individuals. The specificformulation implies that human capital increases the productivity in educating exactly as much as itincreases the productivity in the labour market. This is just a simplifying assumption that enablescircumventing the explicit modelling of the market for teachers. Alternatively, individuals within somerange of human capital would have a comparative advantage as teachers, and those individuals who havea comparative advantage in producing the final good would hire teachers for their children. This has noqualitative impact on the analysis, as, under the existing structure, individuals are indifferent betweenbuying education or providing it directly.
19 Where s, formally defined below, is the time cost for raising a child.
2005] 95P E R S I S T E N C E O F P O V E R T Y
� Royal Economic Society 2005
1.3. Budget Constraint
Let s be the minimum time cost required for raising a child; additional timeallocated to children positively affects their quality. That is, s is the fraction of theindividual’s unit of time endowment that is required in order to raise a child,regardless of quality.20 Following Becker and Lewis (1973), Rosenzweig and Wol-pin (1980) and Galor and Weil (2000), it is assumed, for the sake of simplicity, thatthe ‘quantity cost’ per child does not vary with family size. The economic forcebehind the fertility gap between rich and poor is the lower quantity cost faced bythe poor. Therefore, incorporating a range of decreasing quantity costs wouldincrease the marginal cost difference faced by poor and rich, amplifying the fer-tility gap and thus strengthening the paper’s results. Increasing returns to invest-ment in quality would work in the opposite direction but, up to a limit, should nothave a qualitative effect on the model’s results.
As will become apparent, fertility rates are bounded from above by b/s and,therefore, it is assumed that s < b. It is further assumed that s is sufficiently smallso that individuals with a low level of human capital choose the corner solution ofzero investment in child education,
s < 1=hc: ðA1Þ
Consider an adult member i of generation t who is endowed with hit efficiencyunits of labour at time t, where hit ¼ hðeit Þ. Full income, whit , is divided betweenexpenditure on child rearing (quantity as well as quality) and consumption, cit . The(opportunity) cost of raising each child, regardless of quality, is equal to wshit , andthe cost of quality of each child is equal to weitþ1. The cost of raising ni
t children,with an education level of eitþ1, is given, therefore, by ni
t ðwshit þ weitþ1Þ, and theindividual faces the budget constraint
nitwðshit þ eitþ1Þ þ cit � whit : ð3Þ
As captured by the budget constraint given in (3), the cost of child quantity,wshit , in contrast to the cost of child quality, weitþ1, increases with the level ofhuman capital of the individual, hit . This is a result of the assumption that indi-viduals’ productivity as educators, in contrast to their productivity in child quan-tity, increases with their own human capital.
1.4. Optimisation
Members of generation t choose the number and quality of their children, andtheir own consumption, so as to maximise their utility function, subject to thebudget constraint. It follows from the optimisation that consumption is
20 It is implicitly assumed that the time cost of raising a child cannot be reduced by child-careemployment. As suggested by Mincer (1962) ‘… substitutes for a mother’s care of small children aremuch more difficult to come by than those for food preparation or for physical maintenance of thehousehold’. Leibowitz and Klerman (1995) show that mothers of infants under 1 year old in the USwere less likely to be labour-force participants than mothers of older children, supporting Mincer’sspeculation.
96 [ J A N U A R YT H E E CONOM I C J O U RN A L
� Royal Economic Society 2005
cit ¼ ð1� bÞwhit ¼ ð1� bÞwhðeit Þ: ð4Þ
That is, a fraction 1 ) b of full income is devoted to consumption and hence afraction b of full income is devoted to child rearing in terms of quality and quantity.Furthermore, the optimisation with respect to child quality, eitþ1, implies that21
hh0ðeitþ1Þhðeitþ1Þ
� 1
shðeit Þ þ eitþ1
� 0 if eitþ1 ¼ 0;¼ 0 if eitþ1 > 0,
�ð5Þ
where it is assumed that h is sufficiently small such that the optimal investment,eitþ1, does not approach infinity.22 In particular it is assumed that
g00ðeitþ1Þ < 0; ðA2Þ
where gðeitþ1Þ � ½hðeitþ1Þ�h.
Lemma 1 Under assumptions (A1) and (A2) there exists a single valued function,/ðeitÞ, such that
eitþ1 ¼ /ðeit Þ¼ 0 if eit � e;> 0 if eit > e ,
�
where /0ðeit Þ > 0 for eit > e and e > 0 is unique and given by 1=hc ¼ shðeÞ.
Proof. Define G(et+1) ” h(et+1)/hh¢(et+1). It follows from (5) that
Gðeitþ1Þ � shðeit Þ þ eitþ1: ð6Þ
As follows from (A1), @Gðeitþ1Þ=@eit ¼ 0, @½shðeit Þ þ eitþ1�=@eit > 0, and G(0) ¼1/hc > sh(0) ¼ s, and as follows from the properties of (2),Gð0Þ ¼ 1=hc < lime!1 shðeit Þ, and h0ðeit Þ > 0. Therefore, as follows from theintermediate value theorem, there exists a unique eit ¼ e > 0, given by1=hc ¼ shðeÞ, such that Gð0Þ ¼ shðeÞ and Gð0Þ > ð<Þshðeit Þ for all eit < ð>Þe,implying that /ðeit Þ ¼ 0 for all eit � e and /ðeit Þ > 0 otherwise.As follows from implicit differentiation of the first-order condition of the max-
imisation problem as given by (5), noting that under A2 the second-order con-dition holds for a maximum, /ðeit Þ is single valued, and for eit > e; /0ðeit Þ > 0.
21 Which is consistent with the standard condition of setting the marginal rate of substitutionbetween quality and quantity equal to the price ratio (or larger in the case of a corner solution)
hðeitþ1Þhni
t
� shðeit Þ þ etþ1
nit=h
0ðeitþ1Þ� 0 if eitþ1 ¼ 0;¼ 0 if eitþ1 > 0,
�
where hðeitþ1Þ=hnit is the marginal rate of substitution between quality and quantity, ½shðeit Þ þ etþ1�w is
the cost of an additional child and wnit=h
0ðeitþ1Þ is the marginal cost of children’s quality (humancapital). The wage rate has no bearing on the optimisation since both the quality and quantity costsare its products.
22 Alternatively, a strictly positive lower limit to the number of children can be postulated. This is areasonable restriction since children come in natural numbers and zero is ruled out by the optimisation.Under this restriction, there is a threshold level of education above which individuals choose a cornersolution of having the lowest possible number of children and the accordingly high investment ineducation, with no qualitative impact on the model’s results.
2005] 97P E R S I S T E N C E O F P O V E R T Y
� Royal Economic Society 2005
It follows from Lemma 1, (3) and (4) that the number of children of a member iof generation t; ni
t is given by
nit ¼ nðeit Þ ¼
b=s if eit � e;bhðeit Þ=½shðeit Þ þ /ðeit Þ� if eit > e;
�ð7Þ
where b=s � bhðeit Þ=½shðeit Þ þ /ðeit Þ�. That is, fertility rates among low-educationindividuals (eit � e), who choose not to invest in the quality of their children, arehigher than those among individuals with higher education levels who choose toinvest in the education of their children. However, depending on the properties ofthe human capital production function, fertility rates may decrease or increasewith the level of human capital for eit > e.
The effect of non-wage income is straightforward. A change in income, which isnot related to a change in individuals’ human capital, has no effect on the quality-quantity price ratio, or on the consumption price. Therefore, due to theassumption that preferences are homothetic, it will give rise to a proportionalincrease in resources allocated to consumption, quality and quantity. That is, theeducation of each child is not affected, implying that (5) and Lemma 1 hold forthe general case in which individuals’ income is not restricted to labour.
1.5. The Dynamic System
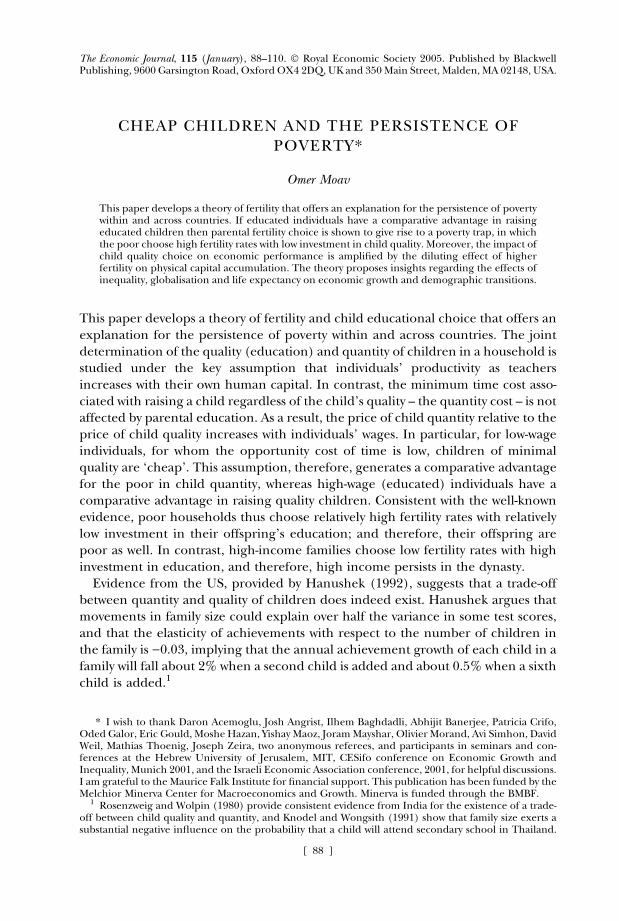
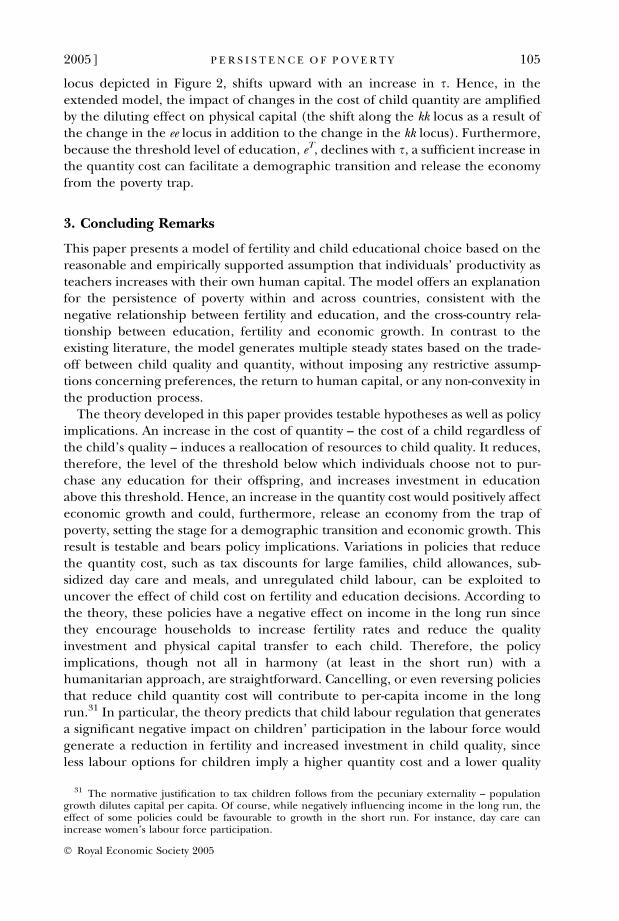
Figure 1 depicts the dynamic system, /ðeit Þ. Assumption (A1) ensures the existenceof a low-education steady state, /(0) ¼ 0. However, in order for /ðeit Þ to generate a
45°
f (et)
e et
et +1
e eT
Fig. 1. The Evolution of EducationOffspring level education et+1 is uniquely determined by parental education et
98 [ J A N U A R YT H E E CONOM I C J O U RN A L
� Royal Economic Society 2005
high-education steady state, there must exist a range of eit in which /ðeit Þ is suffi-ciently sensitive to changes in eit , i.e. a range in which small changes in the parent’seducation bring about large changes in the offspring’s education and as a result,/ðeit Þ > eit for some eit .
Proposition 1 For a sufficiently large h, there exists a human capital productionfunction that satisfies assumptions (A1) and (A2), and the properties of hðeitÞ in (2), suchthat the dynamic system, /ðeitÞ, is characterised by multiple steady states.
Proof. The proof follows from an example. Consider the following human cap-ital production function
hitþ1 ¼ hðeitþ1Þ ¼1þ ceitþ1 if eitþ1 < �e;1þ c�e if eitþ1 � �e;
�ð8Þ
where �e > ð1 � scÞ=sc2. It follows from the optimisation problem of a memberi of generation t, endowed with hðeit Þ efficiency units of human capital, that forh ¼ 1,23
eitþ1 ¼ �/ðeit Þ¼ 0 if eit < e;2 ½0; �e� if eit ¼ e;¼ �e if eit > e;
8<: ð9Þ
where, as follows from (8) and Assumption (A1), e ¼ ð1 � scÞ=sc2 > 0 andtherefore �e > e . The dynamic system �/ðeit Þ is characterised by two stable steadystates, �e and 0, and an unstable steady state e , which is the threshold level ofeducation. The proposition thus follows from continuity considerations.24
1.6. Steady States and Implications of the Basic Model
As depicted in Figure 1, a dynasty i, with a given initial level of education, ei0, willconverge to a high-education, high-income, and low-fertility steady state ifei0 > eT .25 Otherwise, the dynasty will converge to a low-income, low human cap-ital, and high-fertility steady-state. The mechanism generating multiple steady
23 For h > 1; 1 þ ceitþ1 and 1 þ c�e are replaced by ð1 þ ~ceitþ1Þ1=h and by ð1 þ ~c�eÞ1=h. It is straight-
forward to confirm that this specification satisfies (A2), and the proof follows, noting thath0ð0Þ ¼ ~c=h � c.
24 While the model is not designed to perform calibrations, a numerical illustration reveals thatreasonable parameters, in particular the lifetime dollar return for each dollar invested in education, asgiven by c (Psacharopoulos, 1994), can generate multiple equilibria. In particular, for c ¼ 2, h ¼ 1, s ¼0.15, b ¼ 1/2 and �e ¼ 1:5, earnings at the high-income equilibrium are four times higher than earn-ings at the low-income, and fertility rates are 1.9 children per household (of two parents) in the high-income equilibrium and 6.6 at the low-income equilibrium. Note that multiplicity will hold for any set ofparameters restricted by (A1), (A2) and �e > e. An alternative example, more closely related to thecommonly assumed Cobb-Douglas human capital production satisfies concavity; see, for instance,(Heckman et al. 1998). Suppose h(e) ¼ a)ac(a + e)ac. It is straightforward to verify that the properties of(2) are satisfied. Under this specification multiplicity arises if, for instance, c ¼ 2, h ¼ 1, s ¼ 0.15, b ¼1/2, a ¼ 0.45, and an upper limit to e of 2.5 or higher is imposed. Note that the simple Cobb-Douglasfunction implies that Inada conditions hold, and thus will be inconsistent with this paper’s assumptions.
25 Note that the threshold level of education that is sufficient to converge to the high human capitalsteady state, eT, is higher than the threshold level that generates a strictly positive investment in humancapital, e.
2005] 99P E R S I S T E N C E O F P O V E R T Y
� Royal Economic Society 2005
states is based on the effect of parental education on child quantity cost. The lowerthe parents’ education, that is the cheaper the parents’ time, the cheaper thechildren and the parents’ choice shifts to higher fertility rates and lower invest-ment in offspring’s human capital. Note that a decline in parental education, andhence in their income, leaves less resources for children’s education. Theincreased fertility further reduces investment in education which is, in addition,divided among more children. Therefore, consistent with Proposition 1, differ-ences in parental education can be amplified when it comes to differences inoffspring education.
The dynamic system generates predictions on the effect of income inequality oneconomic growth. If initial average income and the corresponding average level ofhuman capital are above the threshold, eT, then growth in the economy will behigher the more equal the society, since more dynasties converge to the highsteady state. Hence, consistent with evidence (Perotti, 1996; Barro, 1999), incomeequality generates higher output via its interaction with fertility choice.
The effect of changes in the quantity cost parameter, s, on the dynamic systemand its steady states follows from (5) and Lemma 1. An increase in s increases therelative cost of quantity, inducing a shift to child quality. Hence, it reduces thelevel of the threshold below which individuals choose not to purchase any edu-cation for their offspring, e, and increases the level of human capital, /ðeit Þ, abovee . This implies that the dynamic system depicted in Figure 1 shifts upward, thethreshold level, eT, declines and the high-income steady-state, �e, increases.
The effect of changes in the cost of education is not that straightforward. Ananalysis of public schooling on fertility and education, which is the most relevantquestion regarding policy implications, follows.26 Assume that the governmentsupplies free-of-charge schooling at a level egt , which is financed by foreign aid ortaxation.27 It follows from (5) that if /ðeit Þ < e
gt , parental investment in education
would be zero, or otherwise it would equal /ðeit Þ � egt . Public schooling has,
therefore, a positive effect on offspring’s level of education (for all i such that/ðeit Þ < e
gt Þ but it also reduces parental expenditure on education (for all i such
that /ðeit Þ > 0Þ and therefore gives rise to a reallocation of resources for increasedfertility. In the long run, however, if egt > eT , public schooling will shift dynastiesto a path of increased education and income and reduced fertility.
2. The Extended Model
In this Section, endogenous physical capital accumulation is introduced, allowingthe model to capture the diluting effect of fertility on capital per worker, whichamplifies the effect of quality choice on economic growth. This Section, therefore,focuses on the impact of fertility on the economy rather than on poverty within aneconomy, offering an explanation for cross-country income differences and clubconvergence.
26 The analysis abstracts from the potential effect of public schooling on the quantity cost.27 An indirect consumption tax, for instance, will not have an impact on the quality and quantity
choice of individuals.
100 [ J A N U A R YT H E E CONOM I C J O U RN A L
� Royal Economic Society 2005
The basic model is enriched by allowing individuals to bequeath capital to theiroffspring, in addition to the investment in child quality. Final output is thusproduced by two factors of production: physical and human capital. The aggregatesupply of production factors is determined by individuals’ choice of physicalcapital bequest, educational expenditures, and fertility in the previous period. Forthe sake of simplicity, the parameter h in the utility function is set to 1 and, giventhe Section’s focus, the analysis assumes homogeneous individuals.
2.1. Production
Production occurs within a period according to a neoclassical, constant-returns-to-scale, Cobb-Douglas production technology. The output produced at time t, Yt,is given by
Yt ¼ F ðKt ;HtÞ � Htf ðktÞ ¼ HtAkat ; kt � Kt=Ht ; ð10Þ
where Kt andHt are physical and human capital employed in production in period t.Producers operate in a perfectly competitive environment and therefore pro-
duction factors are paid according to their marginal products,
wt ¼ ð1� aÞAka � wðktÞ;rt ¼ aAka�1 � r ðktÞ;
ð11Þ
where wt is the wage rate per efficiency unit of labour in time t, and rt is the capitalrate of return, where physical capital fully depreciates at the end of each period.
2.2. Optimisation
Members of generation t choose the number, nt, and quality, et+1, of their children,the quantity of physical capital they transfer to each child, st+1, and the householdconsumption, ct, so as to maximise their utility function,
ut ¼ ð1� bÞ log ct þ b½lognt þ logðwtþ1htþ1 þ rtþ1stþ1Þ�; ð12Þ
subject to the human capital production technology, ht+1 ¼ h(et+1), and the budgetconstraint,
ntðwtsht þ wtetþ1 þ stþ1Þ þ ct � wtht þ rt st ; ð13Þ
where wtht + rtst is the full income of each individual in period t, and ht ¼ h(et).Defining preferences over the income of each child implies that investment ineducation is optimal in the standard form of equalising the marginal returns tohuman and physical capital in any interior solution. It follows from theoptimisation that individuals consume a fraction (1 ) b) of full income,
ct ¼ ð1� bÞðwtht þ rt stÞ;
and a fraction b of full income is devoted to children’s quality, quantity, andcapital transfers. In particular, the optimisation with respect to capital transfers,st+1, is given by
2005] 101P E R S I S T E N C E O F P O V E R T Y
� Royal Economic Society 2005
hðetþ1Þwtþ1
ðsht þ etþ1Þwt� rtþ1
> 0 stþ1 ¼ 0;¼ 0 stþ1 2 ½0;1Þ;< 0 stþ1 ! 1;
8<: ð14Þ
where st+1 fi ¥ implies that nt fi 0. In equilibrium, however, since individualsare identical within each generation, it follows from (14) that
hðetþ1Þwtþ1
ðsht þ etþ1Þwt¼ rtþ1: ð15Þ
Otherwise, if the left-hand side is larger (smaller), there is no physical (human)capital in period t + 1, and the left-hand side is smaller (larger) in contradiction.Given (15), it follows from the optimisation with respect to et+1 that28
hðetþ1Þsht þ etþ1
� h0ðetþ1Þ� 0 if etþ1 ¼ 0;¼ 0 if etþ1 > 0;
�ð16Þ
which is the condition derived in (5) in the basic model section for h ¼ 1. That is,for h ¼ 1, the introduction of endogenous wages and capital bequest does notalter the optimal level of education parents choose for each child and therefore, asfollows from Lemma 1, the dynamic system governing the evolution of education isgiven by et+1 ¼ /(et).
29
2.3. The Dynamic System
It follows from Lemma 1 and (11), (15) and (16) that the dynamic system isuniquely determined by the sequence fkt ; etg1t¼0 such that
etþ1 ¼ /ðetÞ;ktþ1 ¼ wðet ; ktÞ ¼ aAkat ½shðetÞ þ /ðetÞ�=h½/ðetÞ�;
(ð17Þ
where k0 and e0 are given. Note that kt is the physical human capital ratio and thatphysical capital per worker is equal to h(et)kt ¼ st ‡ kt. Output per worker, yt, asfollows from (10), is therefore uniquely determined by the dynamic system
yt ¼ hðetÞAkat ¼ Ah1�at sat :
2.3.1. The kk locusLet kk be the locus of all pairs (kt, et) such that physical capital per efficiency unit oflabour, kt, is in a steady state: kk ” {(kt, et):kt+1 ¼ kt}. As follows from (17), thereexists a function
28 Individuals’ optimisation, regardless of the homogeneity assumption and therefore regardless ofequation (15), ensures efficient investment in education:
rtþ1 �h0ðetþ1Þwtþ1
wt
� 0 if etþ1 ¼ 0;¼ 0 etþ1 > 0.
�
29 Resources allocated to capital transfers come at the expense of the fertility rate.
102 [ J A N U A R YT H E E CONOM I C J O U RN A L
� Royal Economic Society 2005
kkkðetÞ ¼aA½shðetÞ þ /ðetÞ�
h½/ðetÞ�
� �1=ð1�aÞ; ð18Þ
such that if kt ¼ kkk(et), then kt+1 ¼ w(et,kt) ¼ kt, i.e. the kk locus consists of all thepairs {kkk(et), et}.
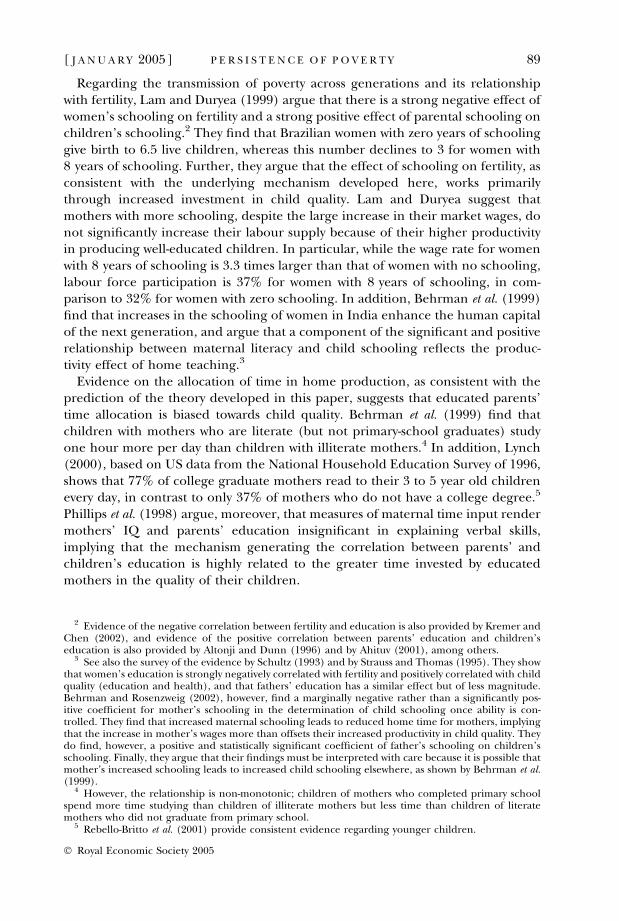
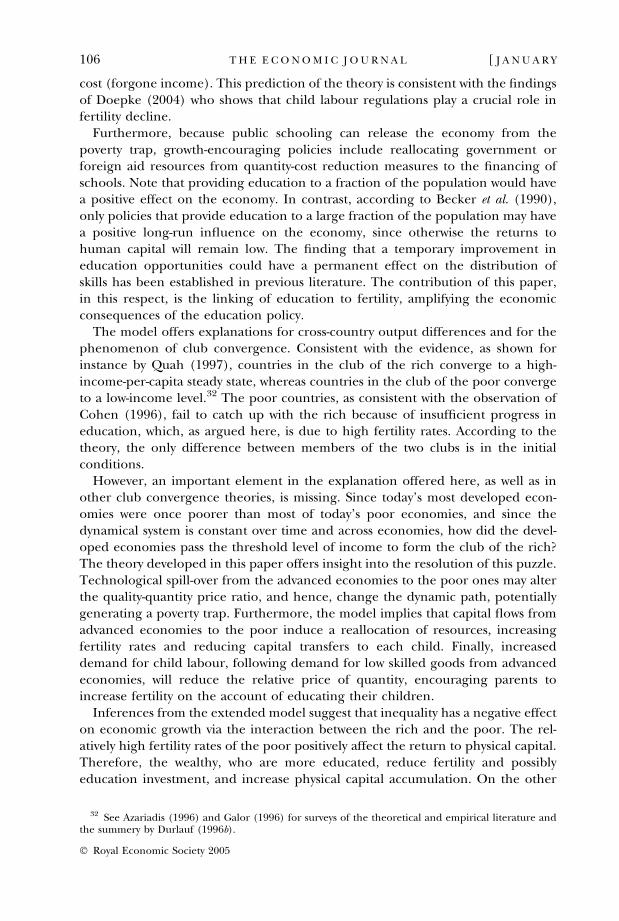
Lemma 2 dkkk(et)/det > 0. That is, as depicted in Figure 2, the kk locus is strictlyincreasing in the plane (et, kt).
Proof. For et � e , as follows from Lemma 1, /(et) ¼ 0, and, therefore, h[/(et)] ¼ 1, and as h¢(et) > 0, it follows that dkkk(et)/det > 0 for et � e .For et > e, it follows from (16) and Lemma 1 that h[/(et)]/[sh(et) + /(et)] ¼ h¢[/(et)]. Furthermore, as established in Lemma 1, /¢(et) > 0 for et > e; and ash¢¢(et) < 0, it follows that h[/(et)]/[sh(et) + /(et)] is strictly decreasing with et, andtherefore dkkk(et)/det > 0 for et > e.
2.3.2. The ee locusLet ee be the locus of all pairs (kt, et) such that the level of investment in humancapital per capita, et, is in a steady state: ee ” {(kt, et):et+1 ¼ et}. However, as followsfrom (17), the evolution of et is independent of the evolution of the physicalhuman capital ratio and hence ee ” {et : /(et) ¼ et}. As follows from the properties
e et
kt
e eT
kk
eeeeee
0
Fig. 2. The Dynamic SystemThe co-evolution of education and the capital/labour ratio
2005] 103P E R S I S T E N C E O F P O V E R T Y
� Royal Economic Society 2005
of /(et), as depicted in Figure 1, et ¼ /(et) for et ¼ 0, et ¼ eT and et ¼ �e; and,therefore, the ee locus consists of three vertical lines, depicted in Figure 2: e ¼ 0,e ¼ eT and e ¼ �e.
The evolution of et, as follows from (17) and depicted in Figure 1, is given byet ¼ /(et). Therefore, as depicted in Figure 2, et+1 > et for all et 2 ðeT ; �eÞ, whereaset+1 < et for all et < eT and all et > �e. The dynamics of kt follow from (17). Asdepicted in Figure 2, kt+1 > kt for all kt < kkk(et) and vice versa. Hence, kt isincreasing below the kk locus and decreasing above it.
2.4. Steady States and Implications of the Extended Model
The model generates two locally stable steady states. If the initial level of educationis above the threshold level, e0 > eT, the economy converges monotonically to thehigh-capital labour ratio, high-education steady state, characterised by a low fer-tility rate. If, however, e0 < eT, the economy converges to the low-capital labourratio, low-education steady state – the poverty trap – that is characterised by a highrate of fertility.30
It is interesting to note that in the context of a closed economy, the low-outputsteady state is not a result of capital market imperfections or any other marketfailure and resource allocation is dynamically efficient – the marginal return toeducation is not higher than the marginal return to physical capital. Hence, even ifindividuals could borrow to finance their own education, they choose not to. Ashift of the economy from the low to the high-output steady state can be achievedonly if one generation gives up child quantity in favour of child quality and suffersa utility cost. Of course, if countries differ from each other, in particular, if someeconomies are in the high-output steady state, then the low-output steady state isan outcome of imperfection in international capital markets (taken to the extremeof closed economies in the model).
As argued previously, the mechanism generating multiple steady states is basedon the effect of parental education on child quantity cost. Lower parental edu-cation implies lower time cost and therefore cheaper children. Hence, lowerparental education brings about a reallocation of resources from child quality toquantity. The effect of quality choice on output per capita is amplified in theextended model by its consequence on fertility and the diluting effect fertility hason capital accumulation. In the poverty trap, therefore, the high fertility rate yieldsa low capital-labour ratio.
An increase in the quantity time cost, s, reduces the threshold for purchasingeducation, e, and raises the level of education, /(et), above e. This implies that/(et), depicted in Figure 1, shifts upward, the threshold level, eT, declines, and thehigh-income steady state, �e , increases. Therefore, the ee locus, depicted in Figure 2,shifts accordingly, i.e. the vertical line at �e shifts to the right, while the verticalthreshold line at eT shifts to the left. Furthermore, because /(et) increases with sfor e > e, it follows from Lemma 1, the concavity of h(et), (16) and (18), that the kk
30 In the poverty trap, the level of education is zero and as follows from (18), the capital labour ratiois (aAs)1/(1)a).
104 [ J A N U A R YT H E E CONOM I C J O U RN A L
� Royal Economic Society 2005
locus depicted in Figure 2, shifts upward with an increase in s. Hence, in theextended model, the impact of changes in the cost of child quantity are amplifiedby the diluting effect on physical capital (the shift along the kk locus as a result ofthe change in the ee locus in addition to the change in the kk locus). Furthermore,because the threshold level of education, eT, declines with s, a sufficient increase inthe quantity cost can facilitate a demographic transition and release the economyfrom the poverty trap.
3. Concluding Remarks
This paper presents a model of fertility and child educational choice based on thereasonable and empirically supported assumption that individuals’ productivity asteachers increases with their own human capital. The model offers an explanationfor the persistence of poverty within and across countries, consistent with thenegative relationship between fertility and education, and the cross-country rela-tionship between education, fertility and economic growth. In contrast to theexisting literature, the model generates multiple steady states based on the trade-off between child quality and quantity, without imposing any restrictive assump-tions concerning preferences, the return to human capital, or any non-convexity inthe production process.The theory developed in this paper provides testable hypotheses as well as policy
implications. An increase in the cost of quantity – the cost of a child regardless ofthe child’s quality – induces a reallocation of resources to child quality. It reduces,therefore, the level of the threshold below which individuals choose not to pur-chase any education for their offspring, and increases investment in educationabove this threshold. Hence, an increase in the quantity cost would positively affecteconomic growth and could, furthermore, release an economy from the trap ofpoverty, setting the stage for a demographic transition and economic growth. Thisresult is testable and bears policy implications. Variations in policies that reducethe quantity cost, such as tax discounts for large families, child allowances, sub-sidized day care and meals, and unregulated child labour, can be exploited touncover the effect of child cost on fertility and education decisions. According tothe theory, these policies have a negative effect on income in the long run sincethey encourage households to increase fertility rates and reduce the qualityinvestment and physical capital transfer to each child. Therefore, the policyimplications, though not all in harmony (at least in the short run) with ahumanitarian approach, are straightforward. Cancelling, or even reversing policiesthat reduce child quantity cost will contribute to per-capita income in the longrun.31 In particular, the theory predicts that child labour regulation that generatesa significant negative impact on children’ participation in the labour force wouldgenerate a reduction in fertility and increased investment in child quality, sinceless labour options for children imply a higher quantity cost and a lower quality
31 The normative justification to tax children follows from the pecuniary externality – populationgrowth dilutes capital per capita. Of course, while negatively influencing income in the long run, theeffect of some policies could be favourable to growth in the short run. For instance, day care canincrease women’s labour force participation.
2005] 105P E R S I S T E N C E O F P O V E R T Y
� Royal Economic Society 2005
cost (forgone income). This prediction of the theory is consistent with the findingsof Doepke (2004) who shows that child labour regulations play a crucial role infertility decline.
Furthermore, because public schooling can release the economy from thepoverty trap, growth-encouraging policies include reallocating government orforeign aid resources from quantity-cost reduction measures to the financing ofschools. Note that providing education to a fraction of the population would havea positive effect on the economy. In contrast, according to Becker et al. (1990),only policies that provide education to a large fraction of the population may havea positive long-run influence on the economy, since otherwise the returns tohuman capital will remain low. The finding that a temporary improvement ineducation opportunities could have a permanent effect on the distribution ofskills has been established in previous literature. The contribution of this paper,in this respect, is the linking of education to fertility, amplifying the economicconsequences of the education policy.
The model offers explanations for cross-country output differences and for thephenomenon of club convergence. Consistent with the evidence, as shown forinstance by Quah (1997), countries in the club of the rich converge to a high-income-per-capita steady state, whereas countries in the club of the poor convergeto a low-income level.32 The poor countries, as consistent with the observation ofCohen (1996), fail to catch up with the rich because of insufficient progress ineducation, which, as argued here, is due to high fertility rates. According to thetheory, the only difference between members of the two clubs is in the initialconditions.
However, an important element in the explanation offered here, as well as inother club convergence theories, is missing. Since today’s most developed econ-omies were once poorer than most of today’s poor economies, and since thedynamical system is constant over time and across economies, how did the devel-oped economies pass the threshold level of income to form the club of the rich?The theory developed in this paper offers insight into the resolution of this puzzle.Technological spill-over from the advanced economies to the poor ones may alterthe quality-quantity price ratio, and hence, change the dynamic path, potentiallygenerating a poverty trap. Furthermore, the model implies that capital flows fromadvanced economies to the poor induce a reallocation of resources, increasingfertility rates and reducing capital transfers to each child. Finally, increaseddemand for child labour, following demand for low skilled goods from advancedeconomies, will reduce the relative price of quantity, encouraging parents toincrease fertility on the account of educating their children.
Inferences from the extended model suggest that inequality has a negative effecton economic growth via the interaction between the rich and the poor. The rel-atively high fertility rates of the poor positively affect the return to physical capital.Therefore, the wealthy, who are more educated, reduce fertility and possiblyeducation investment, and increase physical capital accumulation. On the other
32 See Azariadis (1996) and Galor (1996) for surveys of the theoretical and empirical literature andthe summery by Durlauf (1996b).
106 [ J A N U A R YT H E E CONOM I C J O U RN A L
� Royal Economic Society 2005
hand, due to the comparative advantage in child quantity, the increased physicalcapital accumulation by the wealthy turn the poor away from savings to increasedfertility. The wealthy, therefore, specialise in accumulating wealth, while the poorspecialise in high fertility rates, both negatively affecting the average level ofhuman capital and output per capita in the economy.Finally, the model sheds light on the role of increased life expectancy on the
demographic transition. The rise in the potential return to investment in childquality due to the prolongation of the productive life is not as straightforward as itmay appear. In fact, if a longer productive life increases life-time earnings pro-portionally to all skill levels, then the return to quality relative to the return toquantity is unchanged and therefore it will not generate a change in parentalinvestment in child quality.33 Indeed, consistent with evidence surveyed by Galor(2004), life expectancy in England and Western Europe increased at a stable pacefor more than a century prior to significant increases in schooling and thedemographic transition that occurred in the second half of the nineteenth cen-tury. Similarly, in the less developed economies during the twentieth century thedecline in fertility, if occurred, lagged significantly behind the increase in lifeexpectancy. The theory developed in this paper offers an alternative mechanismthat can link increases in life expectancy with a demographic transition in a waythat is consistent with the evidence. An increase in life expectancy, while having noeffect on parental choice between quality and quantity, induces individuals toincrease their own human capital (via more on the job training for instance).Eventually, once life expectancy has increased significantly, it will generate a suf-ficient level of self investment in human capital bringing about lower fertility andhigher investment in child quality, triggering the demographic transition.
Hebrew University, Jerusalem
Date of receipt of first submission: March 2001Date of receipt of final typescript: March 2004
ReferencesAcemoglu, D. (1998). ‘Why do new technologies complement skills? Directed technical change and
wage inequality’, Quarterly Journal of Economics, vol. 113, pp. 1055–89.Acemoglu, D. and Angrist, J. D. (2000). ‘How large are the external returns to education? Evidence
from compulsory schooling laws’, NBER Macroannual, vol. 15, pp. 9–59.Acemoglu, D. and Zilibotti, F. (2001). ‘Productivity differences’, Quarterly Journal of Economics, vol. 116,
pp. 563–606.Aghion, P., Howitt, P. and Violante, G. (2002). ‘General purpose technology and wage inequality’,
Journal of Economic Growth, vol. 7, pp. 315–45.Ahituv, A. (2001). ‘Be fruitful or multiply: on the interplay between fertility and economic develop-
ment’, Journal of Population Economics, vol. 14, pp. 51–71.Altonji, J. G. and Dunn, T. A. (1996). ‘The effect of family characteristics on the return to education’,
Review of Economics and Statistics, vol. 78, pp. 692–704.
33 In order to maintain a positive effect of life expectancy on children’s education Hazan and Zoabi(2004) assume that an increase in life expectancy is correlated with an increase in the health of studentswhich enhances the production process of human capital and thus increases the return to qualityrelative to the return to quantity, and thereby bring about a demographic transition.
2005] 107P E R S I S T E N C E O F P O V E R T Y
� Royal Economic Society 2005
Angrist, J. D. (1995). ‘The economic returns to schooling in the West Bank and Gaza Strip’, AmericanEconomic Review, vol. 85, pp. 1065–87.
Angrist, J. D. and Lavy, V. (2001). ‘Does teacher training affect pupil learning? Evidence from matchedcomparisons in Jerusalem public schools’, Journal of Labour Economics, vol. 19, pp. 343–69.
Azariadis, C. (1996). ‘The economics of poverty traps, part one: complete markets’, Journal of EconomicGrowth, vol. 1, pp. 449–86.
Banerjee, A. and Duflo, E. (2003). ‘Inequality and growth: what can the data say’? Journal of EconomicGrowth, vol. 8, pp. 267–300.
Banerjee, A. and Newman, A. (1993). ‘Occupational choice and the process of development’, Journal ofPolitical Economy, vol. 101, pp. 274–98.
Barro, R. J. (1991). ‘Economic growth in a cross section of countries’, Quarterly Journal of Economics,vol. 106, pp. 407–43.
Barro, R. J. (1999). ‘Inequality, growth and investment’, Journal of Economic Growth, vol. 5, pp. 87–120.Barro, R. J. and Becker, G. S. (1989). ‘Fertility choice in a model of economic growth’, Econometrica,
vol. 57, pp. 481–501.Basu, S. and Weil, D. N. (1998). ‘Appropriate technology and growth’, Quarterly Journal of Economics,
vol. 113, pp. 1025–54.Becker, G. S. (1975). Human Capital: A Theoretical and Empirical Analysis, with Special Reference to Education,
Chicago: The University of Chicago Press.Becker, G. S. and Lewis, H. G. (1973). ‘On the interaction between quantity and quality of children’,
Journal of Political Economy, vol. 82, pp. S279–88.Becker, G. S., Murphy, K. M. and Tamura, R. F. (1990). ‘Human capital, fertility, and economic growth’,
Journal of Political Economy, vol. 98, pp. S12–37.Behrman, J. R., Foster, A. D., Rosenzweig, M. R. and Vashishtha, P. (1999). ‘Women’s schooling, home
teaching, and economic growth’, Journal of Political Economy, vol. 107, pp. 682–714.Behrman, J. R. and Rosenzweig, M. R. (2002). ‘Does increasing women’s schooling raise the schooling
of the next generation?’, American Economic Review, vol. 92, pp. 323–34.Benabou, R. (1996). ‘Equity and efficiency in human capital investment: the local connection’, Review of
Economic Studies, vol. 63, pp. 237–64.Benabou, R. (2000). ‘Unequal societies: income distribution and the social contract’, American Economic
Review, vol. 90, pp. 96–129.Card, D. and Krueger, A. B. (1992). ‘Does school quality matter – returns to education and the
characteristics of public-schools in the United States’, Journal of Political Economy, vol. 100,pp. 1–40.
Caselli, F. (1999). ‘Technological revolutions’, American Economic Review, vol. 89, pp. 78–102.Castello-Climent, A. and Domenech, R. (2002). ‘Human capital inequality, life expectancy and
economic growth’, mimeo, Universidad Jaume I.Ciccone, A. and Peri, G. (2002). ‘Identifying human capital externalities: theory with an application to
US cities’, mimeo, Universitat Pompeu Fabra.Cohen, D. (1996). ‘Tests of the ‘‘convergence hypothesis’’: some further results’, Journal of Economic
Growth, vol. 1, pp. 351–61.Dahan, M. and Tsiddon, D. (1998). ‘Demographic transition, income distribution, and economic
growth’, Journal of Economic Growth, vol. 3, pp. 29–52.de la Croix, D. and Doepke, M. (2003). ‘Inequality and growth: why differential fertility matters’,
American Economic Review, vol. 93, pp. 1091–113.Doepke, M. (2004). ‘Accounting for fertility decline during the transition to growth’, Journal of Economic
Growth, vol. 9, pp. 347–83.Durlauf, S. N. (1996a). ‘A theory of persistent income inequality’, Journal of Economic Growth, vol. 1,
pp. 75–93.Durlauf, S. N. (1996b). ‘Controversy – on the convergence and divergence of growth rates – an intro-
duction’, Economic Journal, vol. 106, pp. 1016–8.Eicher, T. and Gracia-Penalosa, C. (2001). ‘Inequality and growth: the dual role of human capital in
development’, Journal of Development Economics, vol. 66, pp. 173–97.Galor, O. (1996). ‘Convergence? Inferences from theoretical models’, Economic Journal, vol. 106,
pp. 1056–69.Galor, O. (2004). ‘From stagnation to growth: unified growth theory’, in (P. Aghion and S. Durlauf,
eds.) Handbook of Economic Growth, Amsterdam: North Holland (forthcoming).Galor, O. and Moav, O. (2000). ‘Ability biased technological transition, wage inequality and growth’,
Quarterly Journal of Economics, vol. 115, pp. 469–98.Galor, O. and Moav, O. (2002). ‘Natural selection and the origin of economic growth’, Quarterly Journal
of Economics, vol. 117, pp. 1133–91.Galor, O. and Tsiddon, D. (1997). ‘Technological progress, mobility, and growth’, American Economic
Review, vol. 87, pp. 363–82.
108 [ J A N U A R YT H E E CONOM I C J O U RN A L
� Royal Economic Society 2005
Galor, O. and Weil, D. (1996). ‘The gender gap, fertility and growth’, American Economic Review, vol. 86,pp. 931–53.
Galor, O. and Weil, D. (2000). ‘Population, technology, and growth: from Malthusian stagnation todemographic transition and beyond’, American Economic Review, vol. 90, pp. 806–28.
Galor, O. and Zeira, J. (1993). ‘Income distribution and macroeconomics’, Review of Economic Studies,vol. 60, pp. 35–52.
Ghatak, M. and Jiang, N. H. (2002). ‘A simple model of inequality, occupational choice, and devel-opment’, Journal of Development Economics, vol. 69, pp. 205–26.
Gould, E. D. (2002). ‘Rising wage inequality, comparative advantage, and the growing importance ofgeneral skills in the United States’, Journal of Labor Economics, vol. 20, pp. 105–47.
Gould, E. D., Moav, O. and Weinberg, B. (2001). ‘Precautionary demand for education, inequality andtechnological progress’, Journal of Economic Growth, vol. 6, pp. 285–16.
Hansen, G. and Prescott, E. (2002). ‘Malthus to Solow’, American Economic Review, vol. 92, pp. 1205–17.Hanushek, E. A. (1992). ‘The trade-off between child quantity and quality’, Journal of Political Economy,
vol. 100, pp. 84–117.Hazan, M. and Berdugo, B. (2002). ‘Child labour, fertility, and economic growth’, Economic Journal,
vol. 112, pp. 810–28.Hazan, M. and Zoabi, H. (2004). ‘Longevity, fertility and economic growth’, mimeo, Heberew University.Heckman, J. J., Lochner, L. and Taber, C. (1998). ‘Explaining rising wage inequality: explorations with a
dynamic general equilibrium model of labor earnings with heterogeneous agents’, Review ofEconomic Dynamics, vol. 1, pp. 1–58.
Jones, C. I. (2001). ‘Was the Industrial Revolution inevitable? Economic growth over the very long run’,Advances in Macroeconomics, vol. 1.
Kelley, A. C. and Schmidt, R. M. (1995). ‘Aggregate population and economic growth correlations: therole of the components of demographic change’, Demography, vol. 32, pp. 543–55.
Knodel, J. and Wongsith, M. (1991). ‘Family size and children’s education in Thailand: evidence from anational sample’, Demography, vol. 28, pp. 119–32.
Kremer, M. (1993). ‘Population growth and technological change: one million B.C. to 1990’, QuarterlyJournal of Economics, vol. 108, pp. 681–716.
Kremer, M. and Chen, D. L. (2002). ‘Income distribution dynamics with endogenous fertility’, Journal ofEconomic Growth, vol. 7, pp. 227–58.
Lagerloef, N. P. (2003). ‘From Malthus to modern growth: can epidemics explain the three regimes’?International Economic Review, vol. 44, pp. 755–77.
Lam, D. and Duryea, S. (1999). ‘Effects of schooling on fertility, labor supply and investments inchildren, with evidence from Brazil’, Journal of Human Resources, vol. 34, pp. 160–92.
Leibowitz, A. and Klerman, J. A. (1995). ‘Explaining changes in married mothers’ employment overtime’, Demography, vol. 32, pp. 365–78.
Lynch, L. (2000). ‘Trends and consequences of investment in children’, in (J. Waldfogel andS. Danziger, eds.) Securing the Future, The Ford Foundation Series on Asset Building, New York: RussellSage Foundation, pp. 19–46.
Maoz, Y. D. and Moav, O. (1999). ‘Intergenerational mobility and the process of development’,Economic Journal, vol. 109, pp. 677–97.
Mincer, J. (1962). ‘Labor force participation of married women: a study of labor supply’, Aspects of LaborEconomics, National Bureau of Economic Research, Princeton: Princeton University Press.
Mincer, J. (1974). Schooling Experience and Earnings, New York: Colombia University Press.Moav, O. (2002). ‘Income distribution and macroeconomics: the persistence of inequality in a convex
technology framework’, Economics Letters, vol. 75, pp. 187–92.Mookherjee, D. and Ray, D. (2003). ‘Persistent inequality’, Review of Economic Studies, vol. 70, pp. 369–93.Morand, O. F. (1999). ‘Endogenous fertility, income distribution, and growth’, Journal of Economic
Growth, vol. 4, pp. 331–49.Moretti, E. (2004). ‘Estimating the social return to higher education: evidence from longitudinal and
repeated cross section data’, Journal of Econometrics, vol. 121, pp. 175–212.Nelson, R. R. (1956). ‘A theory of low-level equilibrium trap in underdeveloped economies’, American
Economic Review, vol. 46, pp. 894–908.Perotti, R. (1996). ‘Growth, income distribution, and democracy: what the data say’, Journal of Economic
Growth, vol. 1, pp. 153–91.Phillips, M., Brooks-Gunn, J., Duncan, G. J., Klebanov, P. and Crane, J. (1998). ‘Family background,
parenting practices, and the black-white test score gap’, in (C. Jencks and M. Phillips, eds.) TheBlack-White Test Score Gap, Washington, DC: Brookings Institution, pp. 103–45.
Piketty, T. (1997). ‘The dynamics of the wealth distribution and interest rate with credit-rationing’,Review of Economic Studies, vol. 64, pp. 173–89.
Psacharopoulos, G. (1994). ‘Returns to investment in education – a global update’, World Development,vol. 22, pp. 1325–43.
2005] 109P E R S I S T E N C E O F P O V E R T Y
� Royal Economic Society 2005

Psacharopoulos, G., Valenzuela, J. and Arends, M. (1996). ‘Teacher salaries in Latin America: a review’,Economics of Education Review, vol. 15, pp. 401–6.
Quah, D.T. (1997). ‘Empirics for growth and distribution: stratification, polarization, and convergenceclubs’, Journal of Economic Growth, vol. 2, pp. 27–59.
Rebello-Britto, P., Fuligni, A. and Brooks-Gunn, J. (2001). ‘Reading, rhymes, and routines: Americanparents and their young children’, in (N. Halfron, M. Schuster and K. McLearn, eds.) The Healthand Social Conditions of Young Children and Their Families, New York: Cambridge University Press.
Rosenzweig, M.R. and Wolpin, K.I. (1980). ‘Testing the quantity-quality fertility model: the use of twinsas a natural experiment’, Econometrica, vol. 48, pp. 227–40.
Rubinstein, Y. and Tsiddon, D. (2004). ‘Coping with technological change: the role of ability in makinginequality so persistent’, Journal of Economic Growth, vol. 9, pp. 305–46.
Rudd, J. (2002). ‘Empirical evidence on human capital spillovers’, mimeo, Federal Reserve Board.Schultz, T.P. (1993). ‘Returns to women’s education’, in (E.M. King and M.A. Hill, eds.) Women’s
Education in Developing Countries: Barriers, Benefits, and Policies, Baltimore: John Hopkins UniversityPress.
Strauss, J. and Thomas, D. (1995). ‘Human resources: empirical modeling of household and familydecisions’, in (J. Behrman and T.N. Srinivasan, eds.) Handbook of Development Economics, Vol. 2.Amsterdam: North Holland.
Tamura, R. (1996). ‘From decay to growth: a demographic transition to economic growth’, Journal ofEconomic Dynamics and Control, vol. 20, pp. 1237–61.
Violante, G. (2002). ‘Skill transferability, technological acceleration and the rise in residual wageinequality’, Quarterly Journal of Economics, vol. 117, pp. 297–338.
110 [ J A N U A R Y 2005]T H E E CONOM I C J O U RN A L
� Royal Economic Society 2005