Embed Size (px)
Citation preview

ChE 455 Major #1
Ethyl Benzene Process
Background
You have recently been assigned to the ethyl benzene (EB) plant at the XYZ petrochemical facility. This facility produces a wide range of monomers, polymers, and solvents, all derived from petroleum. The EB process produces 80,000 tonne/yr of 99.8 mol% ethyl benzene that is totally consumed by the styrene facility on site. Like most EB/styrene facilities, there is significant heat integration between the two plants. In order to decouple the operation of the two plants, the energy integration is achieved by the generation and consumption of steam within the two processes. The EB reaction is exothermic, so steam is produced, and the styrene reaction is endothermic, so energy is used in the form of steam.
Several changes are anticipated within the EB process, and your job is to evaluate the effect
that each change will have on the processes (EB and styrene) and to recommend ways to minimize upsets in current operation and maximize the positive economic impact of each change. Ethyl Benzene Production Reactions The production of EB takes place via the direct addition reaction between ethylene and benzene:
6 6 2 4 6 5 2 5
benzene ethylene ethyl benzeneC H C H C H C H+ →
(1)
The reaction between EB and ethylene to produce diethyl benzene (DEB) also takes place:
6 5 2 5 2 4 6 4 2 5 2( )
ethyl benzene ethylene diethyl benzeneC H C H C H C H C H+ →
(2)
Additional reactions between DEB and ethylene yielding tri- and higher ethyl benzene are also possible. However, in order to minimize these additional reactions, the molar ratio of benzene to ethylene is kept high, at approximately 8:1. The production of diethyl benzene is undesirable, and its value as a side product is low. In addition, even small amounts of DEB in EB cause significant processing problems in the downstream styrene process. Therefore, the maximum amount of DEB in EB is specified as 2 ppm. In order to maximize the production of the desired EB, the DEB is separated and returned to a separate reactor in which excess benzene is added to produce EB via the following equilibrium reaction:

2
(3) benzene ethyl benzene benzene diethyl2)( 52566625246 HCHCHCHCHC ↔+
The incoming benzene contains a small amount of toluene impurity. The toluene reacts with ethylene to form ethyl benzene and propylene:
(4) 6 5 3 2 4 6 5 2 5 3 62toluene ethyl benzene propyleneC H CH C H C H C H C H+ → +
The reaction kinetics are of the form: (5) /
, e iE RT a b c d ei o i ethylene EB toluene benzene DEBr k C C C C C−− =
where i is the reaction number above, and
i Ei kcal/kmol
ko,i
a b c d e
1
22,500 1.00×10⁶ 1 0 0 1 0
2
22,500 6.00×10⁵ 1 1 0 0 0
3
25,000 7.80×10⁶ 0 0 0 1 1
4 20,000 1.80×10⁸
2 0 1 0 0
The units of ri are kmol/s/m3-reactor, the units of Ci are kmol/m3-gas and the units of ko,i vary depending upon the form of the equation. Process Description The PFD is in Appendix 1. A refinery cut of benzene is fed from storage to an on-site process vessel (V-301) where it is mixed with the recycled benzene. From V-301, it is pumped to reaction pressure of approximately 2,000 kPa (20 atm) and sent to a fired heater (H-301) to bring it to reaction temperature (approximately 400°C). The preheated benzene is mixed with feed ethylene just prior to entering the first stage of a reactor system consisting of three adiabatic packed bed reactors (R-301 to R-303) with inter-stage feed addition and cooling. Reaction occurs in the gas phase and is exothermic. The hot, partially converted reactor effluent leaves the first packed bed, is mixed with more feed ethylene, and is fed to E-301, where the stream is cooled to 380°C prior to passing to the second reactor (R-302) where further reaction takes place. High-pressure steam is produced in E-301, which is subsequently used in the styrene unit. The effluent stream from R-302 is similarly mixed with feed ethylene and is cooled in E-302 (with generation of high-pressure steam) prior to entering the third and final packed bed reactor, R-303. The effluent stream leaving the reactor contains products, by-products, unreacted

3
benzene, and small amounts of unreacted ethylene and other non-condensable gases. The reactor effluent is cooled in two waste-heat boilers (E-303 and E-304) in which high-pressure and low-pressure steam are generated, respectively. This steam is also consumed in the styrene unit. The two-phase mixture leaving E-304 is sent to a trim cooler (E-305), where the stream is cooled to 80°C, and then to a two-phase separator (V-302), where the light gases are separated and sent overhead as fuel gas to be consumed in the fired heater. The condensed liquid is then sent to the benzene tower, T-301, where the unreacted benzene is separated as the overhead product and returned to the front end of the process. The bottoms product from the first column is sent to T-302, where product ethyl benzene (at 99.8 mol% and containing less than 2 ppm DEB) is taken as the top product and is sent directly to the styrene unit. The bottom product from T-302 contains all the diethyl benzene and trace amounts of higher ethyl benzenes. This stream is mixed with recycle benzene and passes through fired heater (H-301) prior to being sent to a fourth packed bed reactor (R-304) in which the excess benzene is reacted with the DEB to produce EB and unreacted benzene. The effluent from this reactor is mixed with the liquid stream entering the waste heat boiler (E-303). The PFD for this process is shown in Figure 1 in Appendix 1, and a stream table indicating current operation is given as Table 1 in Appendix 1. The utility summary is in Table 2 in Appendix 1. Pertinent equipment information is given in Table 3 in Appendix 1. Proposed Changes and Improvements Several changes to the process have been suggested and your job is to determine which of the proposed changes (if any) should be implemented. Change 1: A new catalyst has been developed by your supplier that is claimed to suppress the ethylation of EB to give DEB. Information on this new catalyst along with information on the existing catalyst is given in Appendix 3. You are to determine what changes in the process are required in order to utilize this new catalyst and what economic benefits would be achieved. Change 2: An opportunity has arisen to purchase a lower of grade of benzene that contains a significantly greater fraction of toluene than the existing feed. For this new feed (containing 10% toluene), you are to determine what changes, if any, are required to process this new feed and the reduction in price of the benzene feed stream (currently $1.22/kg) that would make a switch to the new feed economically attractive. You should assume an internal hurdle rate of 11% before taxes and a length of 5 years for these economic calculations. Economic improvements: Although no specific recommendations or changes are suggested, if you see anywhere that process improvements can be made, these should be evaluated using the same hurdle rate and project time given above.

4
Deliverables A written report of your results, an analysis of your results, your conclusions, and your recommendations is required by 9:00 am, Monday, November 14, 2005. There will be an oral presentation of your results which will be scheduled between Monday, November 14, 2005 and Friday, November 18, 2005. More details about the written and oral reports are given below. Your report should address all of the following issues:
1. You should describe the changes in the process required in order to utilize the new catalyst and the economic benefits that would be achieved
2. For the new feed, you are to determine the changes, if any, required to process the new
feed and the reduction in price of the benzene feed stream that would make a switch to the new feed economically attractive.
3. Chemcad reports (that include stream compositions, equipment summaries, and
convergence results but without stream properties) for any new cases that you present should be included as separate, labeled appendices.
4. PFD and stream tables for any new cases that you present should be included in the main
written report. 5. Cost-saving measures that you recommend for the plant should be suggested. 6. A written report, conforming to the guidelines, detailing the information in items 1-5
should be included. 7. A legible, organized set of calculations justifying your recommendations, including any
assumptions made should be included as an appendix. 8. A signed copy of the attached confidentiality statement should be included as the last
page of the report.
Report Format This report should be brief and should conform to the guidelines. It should be bound in a folder that is not oversized relative to the number of pages in the report. Figures and tables should be included as appropriate. An appendix should be attached that includes items such as the requested calculations. These calculations should be easy to follow. The confidentiality statement should be the very last page of the report. The written report is a very important part of the assignment. Reports that do not conform to the guidelines will receive severe deductions and will have to be rewritten to receive credit. Poorly written and/or organized written reports may also require re-writing. Be sure to follow the format outlined in the guidelines for written reports.

5
Oral Presentation You will be expected to present and defend your results to XYZ’s management representatives some time between November 14 and November 18, 2005. Your presentation should be 15-20 minutes, followed by about a 30 minute question and answer period. Make certain that you prepare for this meeting since it is an important part of your assignment. You should also prepare a hard copy of your transparencies to be handed in at the beginning of your report. Other Rules You may not discuss this major with anyone other than the instructors. Discussion, collaboration, or any other interaction with anyone other than the instructors is prohibited. Violators will be subject to the penalties and procedures outlined in the University Procedures for Handling Academic Dishonesty Cases (begins on p. 47 of the Undergraduate Catalog). Consulting is available from the instructors. Chemcad consulting, i.e., questions on how to use Chemcad, not how to interpret results, is unlimited and free, but only from the instructors. Each individual may receive five free minutes of consulting from the instructors. After five minutes of consulting, the rate is 2.5 points deducted for 15 minutes or any fraction of 15 minutes, on a cumulative basis. The initial 15-minute period includes the 5 minutes of free consulting. Late Reports Late reports are unacceptable. The following severe penalties will apply:
• late report on due date before noon: one letter grade (10 points) • late report after noon on due date: two letter grades (20 points) • late report one day late: three letter grades (30 points) • each additional day late: 10 additional points per day

6
Appendix 1 Figure 1 is a flowsheet of Unit 300 as it was designed. Table 2, the stream table, follows and identifies design operating conditions, which, as far as we know, reflect the actual operating conditions prior to the shut down. Table 3 provides a summary of available equipment specifications. If information is missing or incomplete for a particular piece of equipment, it is not available.

7

8
Table 1: Stream Flow Table
Stream No. 1 2 3 4 5 6 Temp °C 25.0 25.0 58.5 25.0 25.0 383.3 Pres kPa 110.0 2000.0 110.0 2000.0 2000.0 1985.0 Vapor mole fraction 0.0 1.0 0.0 1.0 1.0 1.0 Total kmol/h 99.0 100.0 229.2 30.0 35.0 259.2 Total kg/h 7761.3 2819.5 17952.2 845.9 986.8 18797.9 Flowrates in kmol/h Ethylene 0.0000 93.0000 0.0000 27.9000 32.5500 27.9000 Ethane 0.0000 7.0000 0.0000 2.1000 2.4500 2.1000 Propylene 0.0000 0.0000 0.0000 0.0000 0.0000 0.0000 Benzene 97.0000 0.0000 226.5099 0.0000 0.0000 226.5077 Toluene 2.0000 0.0000 2.0000 0.0000 0.0000 2.0000 Ethylbenzene 0.0000 0.0000 0.7003 0.0000 0.0000 0.7003 1,4-DiEthBenzene 0.0000 0.0000 0.0000 0.0000 0.0000 0.0000
Stream No. 7 8 9 10 11 12 Temp °C 444.1 380.0 453.4 25.0 380.0 449.2 Pres kPa 1970.0 1960.0 1945.0 2000.0 1935.0 1920.0 Vapor mole fraction 1.0 1.0 1.0 1.0 1.0 1.0 Total kmol/h 234.0 269.0 236.4 35.0 271.4 238.7 Total kg/h 18797.9 19784.7 19784.7 986.8 20771.5 20771.5 Flowrates in kmol/h Ethylene 0.8510 33.4010 0.6226 32.5500 33.1726 0.5407 Ethane 2.1000 4.5500 4.5500 2.4500 7.0000 7.0000 Propylene 1.8129 1.8129 1.9974 0.0000 1.9974 2.0000 Benzene 203.9113 203.9113 174.9631 0.0000 174.9631 148.3445 Toluene 0.1871 0.1871 0.0026 0.0000 0.0026 0.0000 Ethylbenzene 24.2827 24.2827 49.9541 0.0000 49.9541 70.5669 1,4-DiEthBenzene 0.8268 0.8268 4.2881 0.0000 4.2881 10.2963

9
Table 1: Stream Flow Table (cont’d)
Stream No. 13 14 15 16 17 18 Temp °C 497.9 458.1 73.6 73.6 81.4 145.4 Pres kPa 1988.0 1920.0 110.0 110.0 105.0 120.0 Vapor mole fraction 1.0 1.0 1.0 0.0 0.0 0.0 Total kmol/h 51.3 290.0 18.6 271.4 170.2 101.1 Total kg/h 4616.5 25387.9 1042.0 24345.9 13321.5 11024.5 Flowrates in kmol/h Ethylene 0.0000 0.5407 0.5407 0.0000 0.0000 0.0000 Ethane 0.0000 7.0000 7.0000 0.0000 0.0000 0.0000 Propylene 0.0000 2.0000 2.0000 0.0000 0.0000 0.0000 Benzene 29.5018 177.8462 8.3819 169.4643 169.2948 0.1695 Toluene 0.0000 0.0000 0.0000 0.0000 0.0000 0.0000 Ethylbenzene 21.6875 92.2546 0.7128 91.5419 0.9154 90.6265 1,4-DiEthBenzene 0.0705 10.3668 0.0132 10.3536 0.0000 10.3536 Stream No. 19 20 21 22 23 Temp °C 139.0 191.1 82.6 82.6 121.4 Pres kPa 110.0 140.0 2000.0 2000.0 2000.0 Vapor mole fraction 0.0 0.0 0.0 0.0 0.0 Total kmol/h 89.9 11.3 130.2 40.0 51.3 Total kg/h 9538.6 1485.9 10190.9 3130.6 4616.5 Flowrates in kmol/h Ethylene 0.0000 0.0000 0.0000 0.0000 0.0000Ethane 0.0000 0.0000 0.0000 0.0000 0.0000Propylene 0.0000 0.0000 0.0000 0.0000 0.0000Benzene 0.1695 0.0000 129.5100 39.7849 39.7849Toluene 0.0000 0.0000 0.0000 0.0000 0.0000Ethylbenzene 89.7202 0.9063 0.7003 0.2151 1.12141,4-DiEthBenzene 0.0001 10.3535 0.0000 0.0000 10.3535

Table 2: Utility Summary
Stream Name bfw to E-301 bfw to E-302 bfw to E-303 bfw to E-304 cw to E-305 Temp °C 115 115 115 115 30
Pressure kPa 4,200 4,200 4,200 600 400 Flowrate in 103kg/h 0.851 1.121 4.341 5.424 118.3
Duty (MJ/h) -1,967 -2,592 -10,080 -12,367 -4,943
Stream Name lps to E-306 cw to E-307 hps to E-308* cw to E-309 Temp °C 160 30 254 30
Pressure kPa 600 400 4200 400 Flowrate in 103kg/h 4.362 174.1 3.124 125.9
Duty (MJ/h) 9,109 -7,276 5,281 -5,262
10
*throttled and desuperheated at exchanger
11
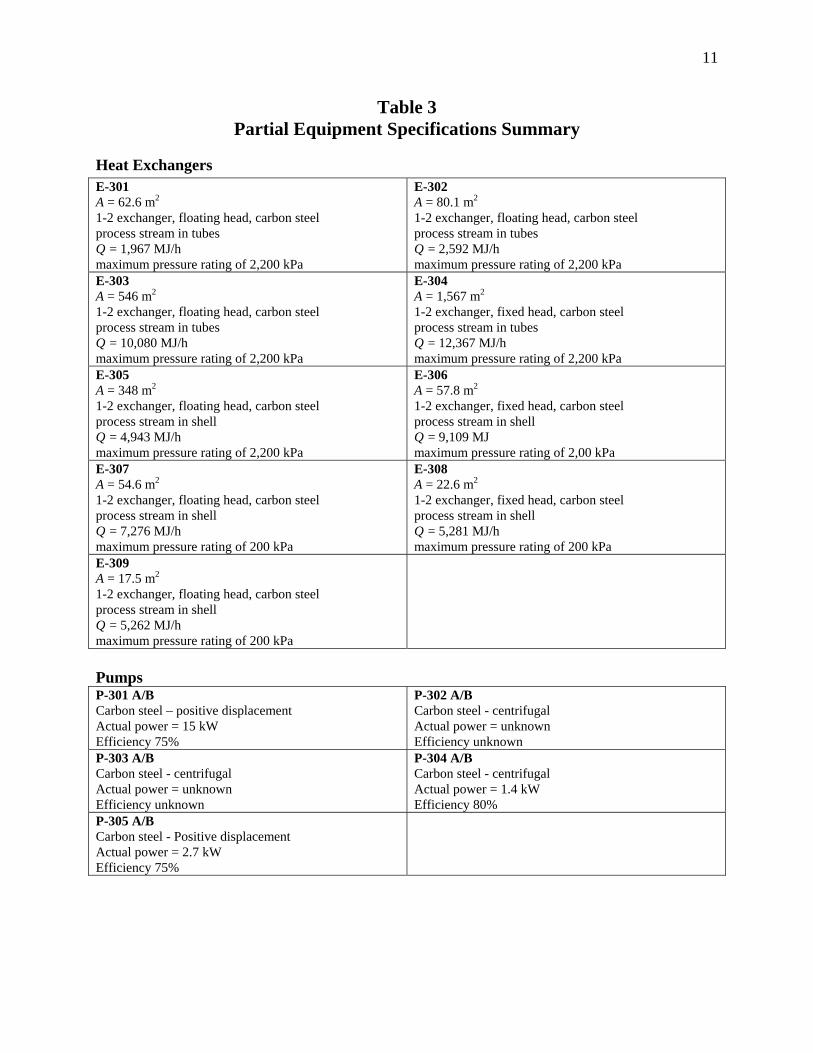
Table 3 Partial Equipment Specifications Summary
Heat Exchangers E-301 A = 62.6 m2
1-2 exchanger, floating head, carbon steel process stream in tubes Q = 1,967 MJ/h maximum pressure rating of 2,200 kPa
E-302 A = 80.1 m2
1-2 exchanger, floating head, carbon steel process stream in tubes Q = 2,592 MJ/h maximum pressure rating of 2,200 kPa
E-303 A = 546 m2
1-2 exchanger, floating head, carbon steel process stream in tubes Q = 10,080 MJ/h maximum pressure rating of 2,200 kPa
E-304 A = 1,567 m2
1-2 exchanger, fixed head, carbon steel process stream in tubes Q = 12,367 MJ/h maximum pressure rating of 2,200 kPa
E-305 A = 348 m2
1-2 exchanger, floating head, carbon steel process stream in shell Q = 4,943 MJ/h maximum pressure rating of 2,200 kPa
E-306 A = 57.8 m2
1-2 exchanger, fixed head, carbon steel process stream in shell Q = 9,109 MJ maximum pressure rating of 2,00 kPa
E-307 A = 54.6 m2
1-2 exchanger, floating head, carbon steel process stream in shell Q = 7,276 MJ/h maximum pressure rating of 200 kPa
E-308 A = 22.6 m2
1-2 exchanger, fixed head, carbon steel process stream in shell Q = 5,281 MJ/h maximum pressure rating of 200 kPa
E-309 A = 17.5 m2
1-2 exchanger, floating head, carbon steel process stream in shell Q = 5,262 MJ/h maximum pressure rating of 200 kPa
Pumps P-301 A/B Carbon steel – positive displacement Actual power = 15 kW Efficiency 75%
P-302 A/B Carbon steel - centrifugal Actual power = unknown Efficiency unknown
P-303 A/B Carbon steel - centrifugal Actual power = unknown Efficiency unknown
P-304 A/B Carbon steel - centrifugal Actual power = 1.4 kW Efficiency 80%
P-305 A/B Carbon steel - Positive displacement Actual power = 2.7 kW Efficiency 75%

12
Fired Heater H-301 required heat load = 22,376 MJ/h design (maximum) heat load = 35,000 MJ/h 75% thermal efficiency maximum pressure rating of 2,200 kPa
Reactors R-301 carbon steel packed bed, ZSM-5 mol. sieve catalyst V = 20 m3
11 m long, 1.72 m diameter maximum pressure rating of 2,200 kPa Maximum allowable catalyst temperature = 500°C
R-302 carbon steel packed bed, ZSM-5 mol. sieve catalyst V = 25 m3
12 m long, 1.85 m diameter maximum pressure rating of 2,200 kPa Maximum allowable catalyst temperature = 500°C
R-303 carbon steel packed bed, ZSM-5 mol. sieve catalyst V = 30 m3
12 m long, 1.97 m diameter maximum pressure rating of 2,200 kPa Maximum allowable catalyst temperature = 500°C
R-304 carbon steel packed bed, ZSM-5 mol. sieve catalyst V = 1.67 m3
5 m long, 0.95 m diameter maximum pressure rating of 2,200 kPa Maximum allowable catalyst temperature = 525°C
Vessels V-301 7 m3
Maximum operating pressure = 250 kPa horizontal height = 4.35 m Diameter = 1.45 m
V-302 10 m3
Maximum operating pressure = 250 kPa vertical height = 4.90 m Diameter =1.62 m
Towers T-301 carbon steel 45 sieve trays plus reboiler and total condenser 42% efficient trays feed on tray 19 additional feeds ports on tray 14 and 24 reflux ratio = 0.3874 24 in tray spacing column height 27.45 m diameter = 1.7 m maximum pressure rating of 300 kPa
T-302 carbon steel 76 sieve trays plus reboiler and total condenser 45% efficient trays feed on tray 56 additional feeds ports on 50 and 62 reflux ratio = 0.6608 15 in tray spacing column height 28.96 m diameter = 1.5 m maximum pressure rating of 300 kPa

13
Appendix 2 Design Calculations
The following design calculations are available for this process. If information is not given, then it is not available. Heat Exchangers
E-301
254
380
423.9
T
Q
Q = 1,967 MJ/h ΔTlm = 146.9°C process fluid hi = 60 W/m2K bfw to hps ho = 6000 W/m2K U ≈ 1/hi + 1/ho = 59.4 W/m2K A = 62.6 m2
E-302
254
380
434.1
T
Q
Q = 2,592 MJ/h ΔTlm = 151.4°C process fluid hi = 60 W/m2K bfw to hps ho = 6000 W/m2K U ≈ 1/hi + 1/ho = 59.4 W/m2K A = 80.1 m2
E-303
254
280
458.1
T
Q
Q = 10,080 MJ/h ΔTlm = 86.4°C process fluid hi = 60 W/m2K bfw to hps ho = 6000 W/m2K U ≈ 1/hi + 1/ho = 59.4 W/m2K A = 546 m2
E-304
160
170
280
T
Q
Q = 12,367 MJ/h ΔTlm = 44.3°C process fluid hi = 50 W/m2K bfw to lps ho = 5000 W/m2K U ≈ 1/hi + 1/ho = 49.5 W/m2K A = 1567 m2
NOTE: for E-301 – E-304 duties include specific heat change for bfw to saturation temperature but the shell side is assumed to be well mixed and at the temperature of the saturated steam.

14
E-305
4080
170.
T
Q
30
Q = 4,943 MJ/h ΔTlm = 83.7°C process fluid ho = 50 W/m2K cw hi = 1000 W/m2K U ≈ 1/hi + 1/ho = 47.6 W/m2K P = 90/10 = 9 R = 10/140 = 0.07 F = 0.99 A = 348 m2
145.4
160T
Q
E-306 Q = 9,109 MJ/h ΔTlm = 14.6°C process fluid ho = 6000 W/m2K lps condensing hi = 6000 W/m2K U ≈ 1/hi + 1/ho = 3000 W/m2K A = 57.8 m2
E-307
40
81.4T
Q
30
Q = 7,276 MJ/h ΔTlm = 46.2°C process fluid ho = 4000 W/m2K cw hi = 1000 W/m2K U ≈ 1/hi + 1/ho = 800 W/m2K A = 54.6 m2
191.1
210T
Q
E-308 Q = 5,281 MJ/h ΔTlm = 18.9°C process fluid ho = 8000 W/m2K throttled hps condensing hi = 6000 W/m2K U ≈ 1/hi + 1/ho = 3429 W/m2K A = 22.6 m2
E-309
40
139T
Q
30
Q = 5,262 MJ/h ΔTlm = 103.92°C process fluid ho = 4000 W/m2K cw hi = 1000 W/m2K U ≈ 1/hi + 1/ho = 800 W/m2K A = 17.5 m2

15
T-301 tray/tower sizing done on Chemcad efficiency from O’Connell correlation run flash on distillate and bottom stream at top αtop = Kbenzene/Kethylbenzene = 6.01 at bottom αbottom = Kbenzene/Kethylbenzene = 3.93 αavg = (αtopαbottom)0.5 = 4.9 from Chemcad μfeed = 0.003612 Pa s = 0.3612 cp See Figure 12-14 in Wankat efficiency ≈ 0.42 21 stages = 19 trays + condenser + reboiler 19/0.42 = 45 actual trays + condenser + reboiler feed on stage 9 = tray 8 8/0.42 = 19 so feed on tray 19 T-302 tray/tower sizing done on Chemcad efficiency from O’Connell correlation run flash on distillate and bottom stream at top αtop = Kethylbenzene/Kdi-ethylbenzene= 3.84 at bottom αbottom = Kethylbenzene/Kdi-ethylbenzene = 3.2 αavg = (αtopαbottom)0.5 = 3.5 from Chemcad μfeed = 0.003612 Pa s = 0.3612 cp See Figure 12-14 in Wankat efficiency ≈ 0.45 36 stages = 34 trays + condenser + reboiler 34/0.45 = 76 actual trays + condenser + reboiler feed on stage 26 = tray 25 25/0.45 = 56 so feed on tray 56 V-301 from Chemcad, liquid throughput (volumetric rate of Stream 3) = 21.4 m3/h = 0.3567 m3/min assume 10 min residence time, so volume = 3.567 m3
assume vessel size is approximately double this volume = 7 m3
horizontal vessel V = πD2L/4, where D = diameter and L = length of vessel (as drawn on PFD) L/D = 3
3(4)(7) 1.45m and 3 4.35 m
(3)D L= = = =
πD
P-301

16
Flow of liquid at normal operating conditions, =17,912 kg/h, T = 58.4°C, pm& ben* = 50.6 kPa Vol flow of liquid, Q = 21.36 m3/h = 5.93 L/s ρl = 839 kg/m3, μl = 0.000404 kg/m s
FIC
V-301
P-301A/B
1.5 m 2.5 inch sch 40
3 inch sch 40
1 inch sch 40
PIC
V-302
4 m
Q2 = 0.87 L/s Q1 = 5.93 L/s
The pump curve and NPSH curves for P-301 are attached as Figures 2 and 3. Under normal operating conditions, approximately 15% of the flow through P-301 A/B is recycled back to V-301. The normal operating level of liquid is 1.5 m above the pump inlet. Pipe calculations for 100 ft of suction and discharge piping are
variable 2.5"sch 40 3" sch 40 unitsD 2.469 3.0680 inch D 0.062713 0.0779 m Q 0.0068 0.0068 m3/s v 2.207766 1.4298 m/s μ 4.04×10⁻⁴ 4.04×10⁻⁴ kg/m s ρ 839 839 kg/m3
Re 287,533 231,395 e/D 0.000718 0.000577
f 0.004582 0.0044 L 30.48 30.48 m
ΔPf 9,107 2,937 Pa

17
NPSHA = Psupply + hρg – (-ΔPf) – P* = 101,000 + (1.5)(839)(9.81) – 2937 – 50,600 = 59,810 Pa = (59,810)/(839)/(9.81) = 7.3 m of liquid – cavitation is not a problem Equivalent length of suction piping (Leq,suct) is approx 100 ft, discharge piping (Leq,disch) = 500 ft −ΔPf = 2,937 + (500)(9,107)(5.93/6.8)2/(100) + ΔPH-301 + ΔPR-301 + ΔPR-302 + ΔPR-303 + ΔPE-301 + ΔPE-302 + ΔPE-303 + ΔPE-304 + ΔPE-305 = 2,937 + 34,627 + 15,000 + 15,000 + 15,000 + 15,000 + 10,000 + 10,000 + 10,000 + 10,000 + 10,000 = 147,560 Pa M E Balance from V-301 to V-302 ΔP12 + ρgΔz12 + 0.5ρΔv12 + (−ΔPf) + ΔPcv = -ρws We require 2000 kPa at pump outlet thus (-ρws) + 101 + (1.5)(9.81)(839)/1000 – 2.937 = 2,000 -ρws = 1890 kPa System Curve at normal flow = (110 - 101) + (839)(9.81)(4.0 - 1.5)/1000 + (0) + 147.6 = 177.2 kPa ∴ ΔPcv = 1890 – 177 = 1,723 kPa
0
500
1,000
1,500
2,000
2,500
3,000
0 1 2 3 4 5 6 7 8
flow rate of benzene at 58oC, lit/s
Pres
sure
incr
ease
acr
oss
pum
p, k
Pa
ΔPcv at design conditions

18
0
1
2
3
4
5
6
7
8
9
10
6 6.2 6.4 6.6 6.8 7
Flow rate of benzene at 58oC, lit/s
NPS
H (m
of l
iqui
d)
NPSHR
NPSHA
V-302 from Chemcad, liquid throughput (volumetric rate of Stream 16) = 29.7 m3/h = 0.495 m3/min assume 10 min residence time, so volume = 4.95 m3
assume vessel size is approximately double this volume = 10 m3
Vapor flow (Stream 15) = 476 m3/h = 0.1322 m3/s, ρg = 2.17 kg/m3
vertical vessel V = πD2h/4, where D = diameter and L = height of vessel (as drawn on PFD) Assume L/D = 3
3(4)(10) 1.62m and 3 4.90 m
(3)D L= = = =
πD
Check gas velocity
2 24 (4)(0.1322) 0.064 m/s
(1.62)gasQvD
= = =π π
Criterion for phase separators is 8210.11 1 0.11 1 2.14 m/s2.17
lgas
gv ρ
≤ − = − =ρ
- no problem
Design of Fuel gas feed line from V-302 to H-301 Vapor from V-302 (Stream 15) is fuel gas that is consumed in H-301. Available pressure drop across line from V-302 to H-301 is 10 kPa.

19
Assume 2 kPa across regulating flow valve at heater. Equivalent length of pipe from V-302 to H-301 is 110 ft.
2 228,000 2(2.17)(110)(0.3048)g eq
ffv L fvPD D
ρ−Δ = = =
Choose values of D and calculate -ΔPf
Variable Units 2"sch 40 3" sch 40 4" sch 40 D inch 2.067 3.068 4.026 D m 0.0525 0.07792 0.10226 Q m3/s 0.1322 0.1322 0.1322 v m/s 61.0651 27.7181 16.0963 μ kg/m s 9.51×10⁻⁶ 9.51×10⁻⁶ 9.51×10⁻⁶
Re 7.32×10⁵ 4.93×10⁵ 3.76×10⁵
e m 0.000045 0.000045 0.000045 e/D 0.000857 0.000577 0.000440
f 0.004748 0.004346 0.004108 -ΔPf Pa 49,068 6,235 1,515
Choose 3” sch 40 carbon steel
R-301 packed bed Volume of reactor containing catalyst, Vreac = 20 m3 Vreac = 20 = Vcat/(1-ε) Voidage, ε = 0.4 Vcat = 12 m3 of catalyst Catalyst size = 2 mm approx spherical Vertical vessel V = πD2L/4, where D = diameter and L = height of vessel containing catalyst Assume an L/D = 5
3(4)(20) 1.72 m
(5)5 8.6 m
D
L D
= =π
= =
Add 1 m either end for vapor distribution, giving L = 11 m R-302 packed bed Volume of reactor containing catalyst, Vreac = 25 m3 Vreac = 25 = Vcat/(1-ε) Voidage, ε = 0.4 Vcat = 15 m3 of catalyst

20
Catalyst size = 2 mm approx spherical Vertical vessel Vreac = πD2L/4, where D = diameter and L = height of vessel containing catalyst Assume an L/D = 5
3(4)(25) 1.85m
(5)5 9.27 m
D
L D
= =π
= =
Add 1 m either end for vapor distribution, giving L = 12 m R-303 packed bed Volume of reactor containing catalyst, Vreac = 30 m3 Vreac = 30 = Vcat/(1-ε) Voidage, ε = 0.4 Vcat = 18 m3 of catalyst Catalyst size = 2 mm approx spherical Vertical vessel Vreac = πD2L/4, where D = diameter and L = height of vessel containing catalyst Assume an L/D = 5
3(4)(30) 1.97 m
(5)5 9.85 m
D
L D
= =π
= =
Add 1 m either end for vapor distribution, giving L = 12 m R-304 packed bed Volume of reactor containing catalyst, Vreac = 1.67 m3 Vreac = 1.67 = Vcat/(1-ε) Voidage, ε = 0.4 Vcat = 1 m3 of catalyst Catalyst size = 2 mm approx spherical Vertical vessel V = πD2L/4, where D = diameter and L = height of vessel containing catalyst, assume an L/D = 2.5
3(4)(1.67) 0.95m
(2.5)2.5 2.37 m
D
L D
= =π
= =
Add 1 m either end for vapor distribution, giving L = 5 m

21
Appendix 3
Pressure drop calculations for reactors R-301 – R-304 – Existing Conditions
Variable Units R-301 R-302 R-303 R-304 Vcat m3 12 15 18 1 Voidage, ε 0.4 0.4 0.4 0.4 volume of cat filled reactor, Vreac m3 20.00 25.00 30.00 1.67 L/D 5 5 5 2.5 D m 1.72 1.85 1.97 0.95 Lcat m 8.60 9.27 9.85 2.37 Dcat m 0.002 0.002 0.002 0.002 gas density, ρg kg/m3 28.00 28.30 29.70 29.60 gas viscosity, (×10-5)μg kg/m s 1.80 1.75 1.70 1.82 Volumetric gas flow, Q m3/s 0.1889 0.1939 0.1936 0.0433 Superficial gas vel, v m/s 0.0812 0.0719 0.0636 0.0615 ΔP Ergun Equation Pa 15,700 13,600 11,900 2,700
Look at pore diffusion resistance in catalysts Consider the main reaction (Reaction 1) only since this is the fastest reaction and will provide the limiting case. Since benzene is in high excess, we can consider this as pseudo-first-order reaction with respect to ethylene Use highest temperature in reaction system which is approx. 450°C = 723K Mole fraction of benzene at reactor R-301 inlet (Stream 6) = 226.34/259.3 = 0.8729 Mole fraction of ethylene at reactor R-301 inlet (Stream 6) = 27.9/259.3 = 0.1076 Total molar concentration at reactor inlet (Stream 6) = P/RT = (1985000)/(8.314)/(383+273) = 363.9 mol/m3 = 0.3639 kmol/m3
Benzene concentration at reactor inlet = (0.8729)(0.3639) = 0.3177 kmol/m3
Pseudo first-order reaction rate constant, k1Cbenzene = 1.00×10⁶exp(-22,500/1.986/723)(0.3177) = 0.04974 m3-gas/m3-reactor/s Changing the basis to the volume of catalyst ⇒ k’1= k1/(1-ε) = (0.04974)/(1-0.4) = 0.08290 m3-gas/m3-catalyst/s Effective diffusivity of catalyst (from catalyst manufacturer) = 6×10⁻⁸ m3-gas/m-catalyst/s
Thiele Modulus,'1
80.002 0.0829 0.39
6 6 6 10cat
Teff
D kMD −= = =
×
This gives an effectiveness factor of approximately 0.95 – close to 1, so use of intrinsic kinetics should be ok. Next, check for external mass transfer resistance.

22
External mass transfer to surface of catalyst
Particle Reynolds number, 6(0.002)(28)(0.0812 / 0.4)Re 632
(18 10 )cat g bed
pg
D u−
ρ= = =
μ ×
Estimate mass transfer coefficient from correlation due to Froessling [N. Froessling, Gerlands Beitr. Geophys., 52, 170 (1938).]
1/30.52.0 0.552Rem catp
A AB AB
k Dy D D
⎛ ⎞μ= + ⎜ ⎟ρ⎝ ⎠
At these conditions the diffusivity of ethylene in benzene, DAB, is estimated to be 1×10⁻² cm2/s = 1×10⁻⁶ m2/s
1/ 360.5
6 6
4
(0.002) (18 10 )2.0 0.552(632) 14.0(0.1076)(1 10 ) (28)(1 10 )
7.519 10 m/s
m
m
k
k
−
− −
−
⎛ ⎞×∴ = + ⎜ ⎟⎜ ⎟× ×⎝ ⎠
= ×
=
Fraction of resistance in the external film = 4'1
1 1 0.0357.519 101 1( / 6) (0.0829)(0.002 / 6)
m
cat
kk D
−= =×+ +
Therefore, the external mass transfer resistance is only 3.5% of the total and can be safely ignored. Therefore, the reaction is controlled by the intrinsic kinetics of the reaction and these should be used in the simulation. Properties of new Catalyst The new catalyst is available as a cylindrical extruded pellet with diameter 4 mm and length 8 mm. For the sake of calculations, you may assume that the catalyst behaves like a spherical particle of diameter = 5.8 mm and packed bed voidage of 0.52. You should assume that the maximum allowable catalyst temperature = 500°C. According to the manufacturer, the intrinsic rates of reaction are given in the following table:
i Ei kcal/kmol
ko,i
a b c d e
1
22,500 1.50×10⁶ 1 0 0 1 0
2
22,500 6.00×10³ 1 1 0 0 0
3
25,000 7.80×10⁶ 0 0 0 1 1
4 20,000 1.80×10⁸
2 0 1 0 0

23
The pore structure of the new catalyst is somewhat smaller than the existing catalyst and the manufacturer gives the effective diffusivity as 1×10⁻⁸ m3-gas/m-catalyst/s. The bulk density of the new catalyst is 1,200 kg/m3.

24
Appendix 4 Cost Information
Raw Materials Ethylene $0.77/kg Benzene $1.22/kg Products Ethyl Benzene not available Utility Costs See Table 6.3 of text Equipment Costs and Cost Factor Use CAPCOST if needed

25
Appendix 5 Chemcad Simulation
A Chemcad simulation is provided to aid in the solution of the current problem. The simulation is for the current operating conditions. The thermodynamics models are K-val = UNIFAC and Enthalpy = Latent Heat, these should not be changed. It should be noted that, in the simulation, a component separator is placed after the high-pressure flash drum (V-302) in order to remove non-condensables from Stream 16 prior to entering T-301. This is done in order to avoid problems in simulating this tower. In practice, the non-condensables would be removed from the overhead reflux drum, V-303 after entering T-301. Both towers are simulated as Shortcut columns in the main simulation but each is separately simulated using the rigorous TOWER module. You should use the same approach in your simulations. The rigorous TOWER module provides accurate design and simulation data and should be used to assess column operation.