Embed Size (px)
Citation preview
Charts to WatchGlobal Market Update
November 21, 2014
Global Clients…Global Portfolios
disclosure: The opinions expressed in this Charts to Watch report are those of the author. The materials and commentary are strictly informational and should be used for research use only. This bulletin is not intended to provide investing or other advice or guidance with respect to the matters addressed in the bulletin. All relevant facts, including individual circumstances, need to be considered by the reader to arrive at investment conclusions that comply with matters addressed in this bulletin. Charts and information used in this report are sourced from Bloomberg.
2
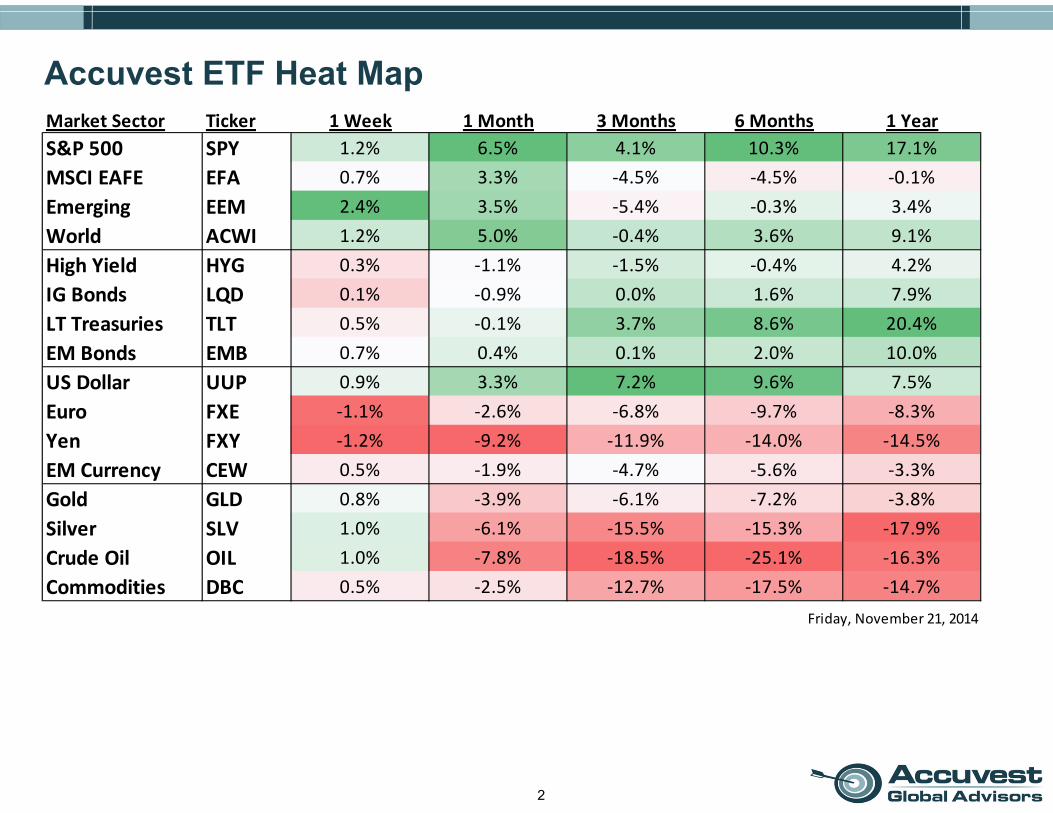
Accuvest ETF Heat MapMarket Sector Ticker 1 Week 1 Month 3 Months 6 Months 1 YearS&P 500 SPY 1.2% 6.5% 4.1% 10.3% 17.1%MSCI EAFE EFA 0.7% 3.3% ‐4.5% ‐4.5% ‐0.1%Emerging EEM 2.4% 3.5% ‐5.4% ‐0.3% 3.4%World ACWI 1.2% 5.0% ‐0.4% 3.6% 9.1%High Yield HYG 0.3% ‐1.1% ‐1.5% ‐0.4% 4.2%IG Bonds LQD 0.1% ‐0.9% 0.0% 1.6% 7.9%LT Treasuries TLT 0.5% ‐0.1% 3.7% 8.6% 20.4%EM Bonds EMB 0.7% 0.4% 0.1% 2.0% 10.0%US Dollar UUP 0.9% 3.3% 7.2% 9.6% 7.5%Euro FXE ‐1.1% ‐2.6% ‐6.8% ‐9.7% ‐8.3%Yen FXY ‐1.2% ‐9.2% ‐11.9% ‐14.0% ‐14.5%EM Currency CEW 0.5% ‐1.9% ‐4.7% ‐5.6% ‐3.3%Gold GLD 0.8% ‐3.9% ‐6.1% ‐7.2% ‐3.8%Silver SLV 1.0% ‐6.1% ‐15.5% ‐15.3% ‐17.9%Crude Oil OIL 1.0% ‐7.8% ‐18.5% ‐25.1% ‐16.3%Commodities DBC 0.5% ‐2.5% ‐12.7% ‐17.5% ‐14.7%
Friday, November 21, 2014

3
Accuvest Country ETF Heat MapCountry Ticker 1 Week 1 Month 3 Months 6 Months 1 YearAustralia EWA ‐2.9% ‐1.5% ‐10.4% ‐6.0% ‐1.9%Austria EWO 2.1% 3.4% ‐8.3% ‐13.3% ‐15.9%Belgium EWK 1.5% 3.5% ‐4.0% ‐4.6% 7.8%Brazil EWZ 11.9% 5.4% ‐13.9% ‐6.7% ‐4.3%Canada EWC 2.3% 4.1% ‐4.5% 2.2% 7.6%Chile ECH 2.8% 3.5% ‐1.3% ‐6.1% ‐7.2%China MCHI ‐1.4% 3.8% ‐2.6% 10.7% 2.7%France EWQ 2.2% 3.0% ‐5.1% ‐11.4% ‐3.5%Germany EWG 3.9% 5.8% ‐3.5% ‐9.3% ‐4.0%Hong Kong EWH ‐2.3% 3.2% ‐2.7% 6.6% 9.5%India INDY 1.8% 5.8% 6.2% 12.5% 46.8%Indonesia EIDO 3.5% 2.0% ‐3.4% 1.4% 20.1%Ireland EIRL 3.8% 2.8% ‐1.7% ‐5.6% ‐0.6%Israel EIS ‐0.1% ‐2.7% ‐4.2% ‐6.1% 4.5%Italy EWI 3.6% 1.8% ‐6.2% ‐11.2% ‐0.6%Japan EWJ ‐1.1% 4.4% ‐3.1% 4.9% ‐3.0%Korea EWY 0.3% ‐1.7% ‐13.2% ‐12.6% ‐8.9%Malaysia EWM 0.8% ‐1.5% ‐7.8% ‐6.4% ‐1.4%Mexico EWW 2.3% 1.6% ‐6.1% 1.4% 4.7%Netherlands EWN 1.3% 4.9% ‐0.7% ‐3.3% ‐0.4%Norway NORW 0.8% 1.9% ‐12.4% ‐14.2% ‐6.0%Peru EPU 3.2% 1.6% ‐6.3% ‐0.6% 9.5%Poland EPOL ‐0.2% ‐2.1% ‐6.7% ‐8.0% ‐11.2%Russia RSX 3.6% ‐0.6% ‐15.8% ‐16.0% ‐22.8%Singapore EWS 0.9% 2.5% ‐3.1% ‐0.8% 3.0%South Africa EZA 1.8% 8.6% 1.2% 3.4% 15.0%Spain EWP 2.7% 0.7% ‐6.6% ‐8.9% 6.0%Sweden EWD 1.1% 4.4% ‐3.8% ‐8.6% 2.0%Switzerland EWL 0.8% 4.9% ‐1.7% ‐4.4% 4.8%Taiwan EWT 1.7% 4.4% ‐1.2% 7.3% 17.3%Thailand THD 1.9% 3.8% 2.2% 15.2% 16.9%Turkey TUR 3.0% 8.5% 3.5% 3.1% 2.6%United Kingdom EWU 1.3% 2.7% ‐5.8% ‐7.9% ‐0.4%United States IVV 1.2% 6.5% 4.1% 10.4% 17.2%
Friday, November 21, 2014
Financial Conditions
5
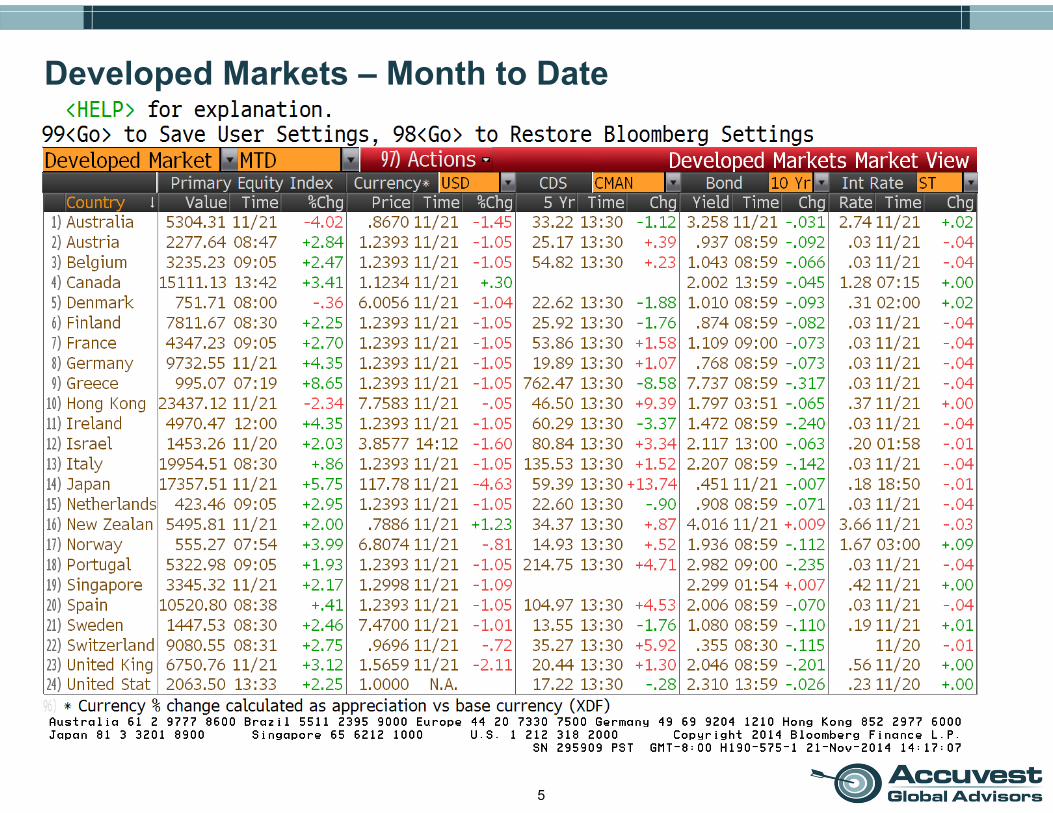
Developed Markets – Month to Date
6
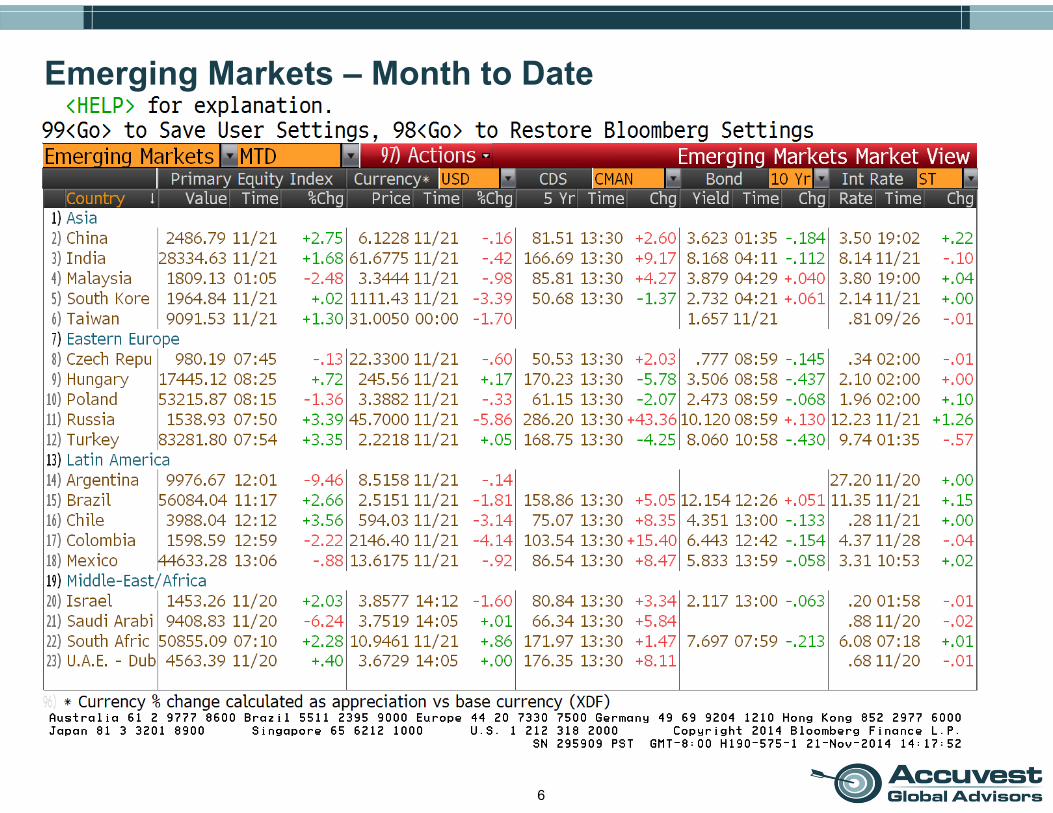
Emerging Markets – Month to Date

7
The VIX Index (S&P 500 Implied Volatility)
8
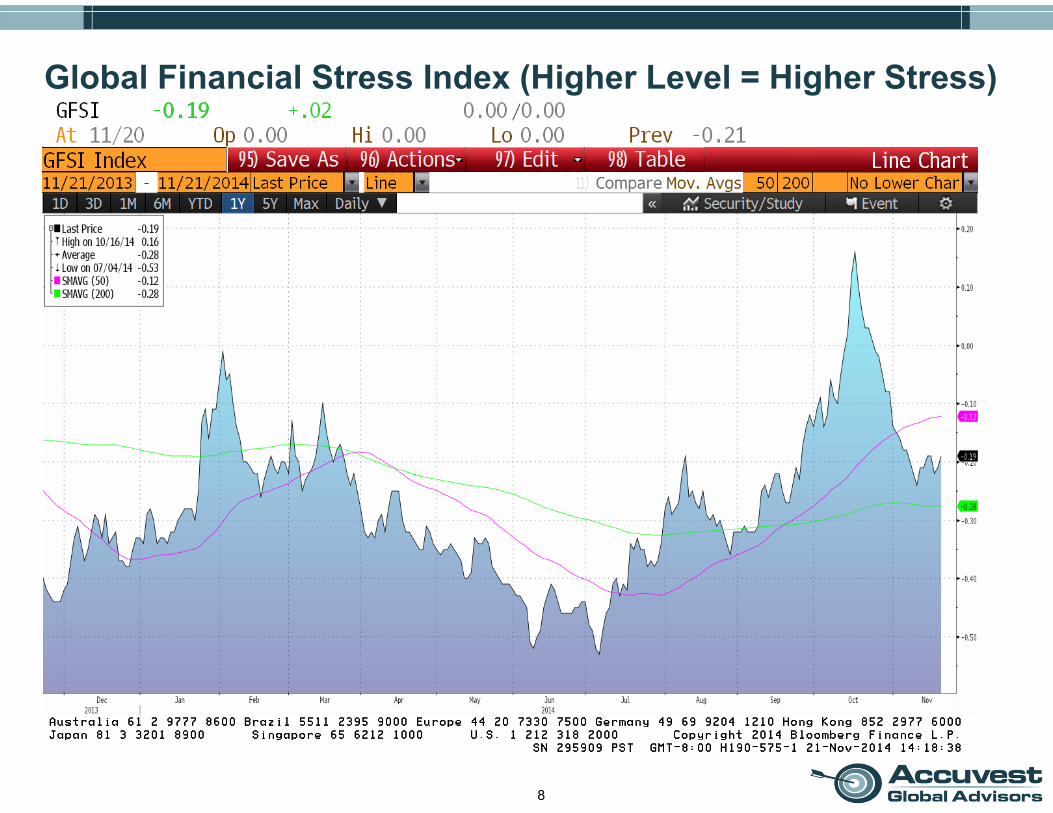
Global Financial Stress Index (Higher Level = Higher Stress)
9
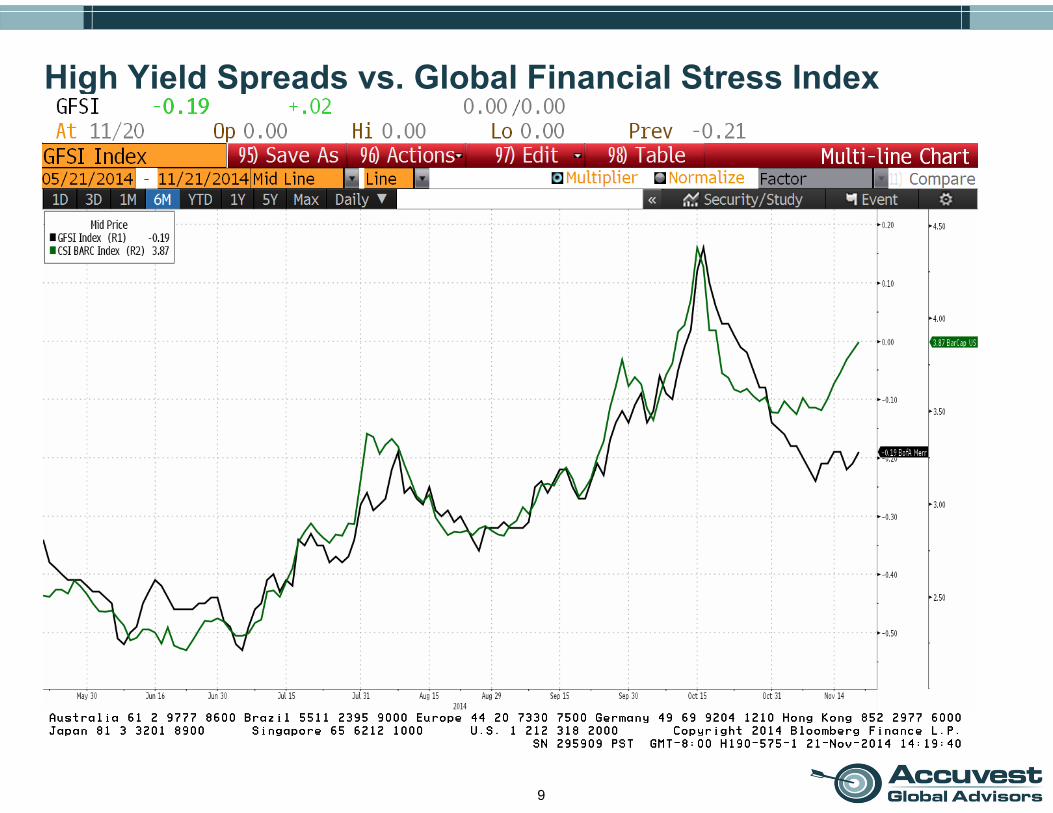
High Yield Spreads vs. Global Financial Stress Index

Fixed Income & Credit

11
US Yield Curve (Current vs. 1 Month & 12 Months Ago)

12
UST Curve vs. US Investment Grade Curve

13
U.S. Treasury 2 Year Yield

14
U.S. Treasury 10 Year Yield
15
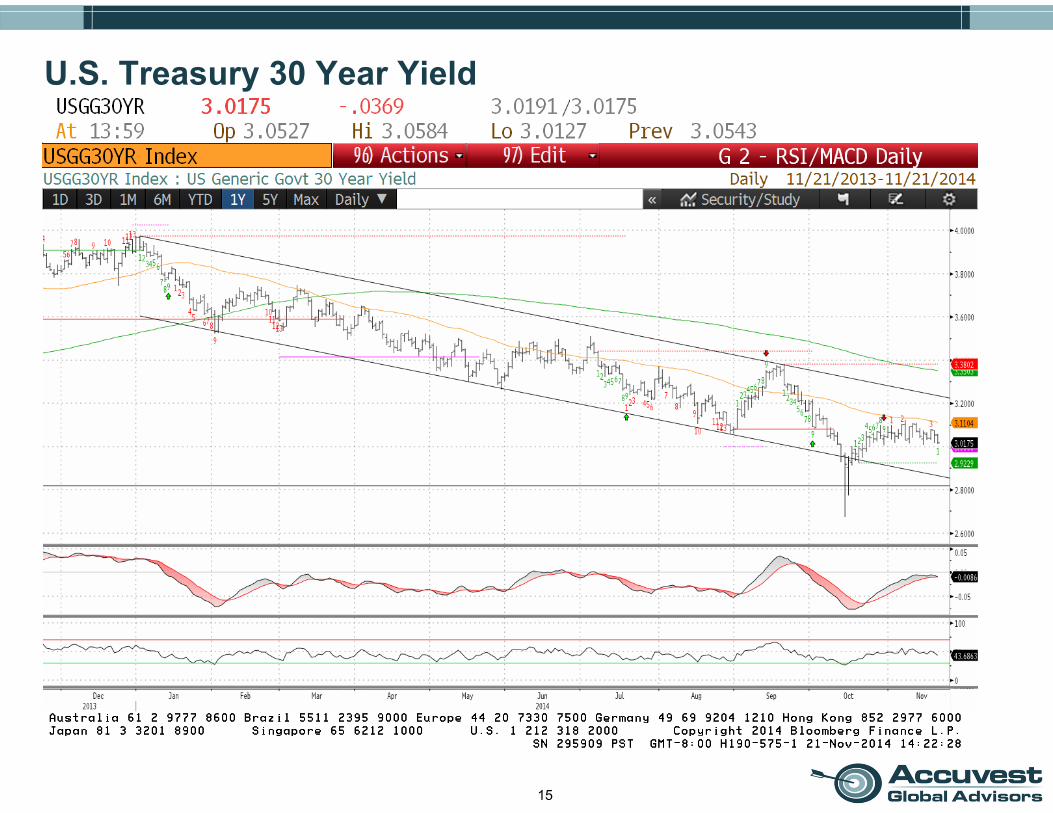
U.S. Treasury 30 Year Yield
16
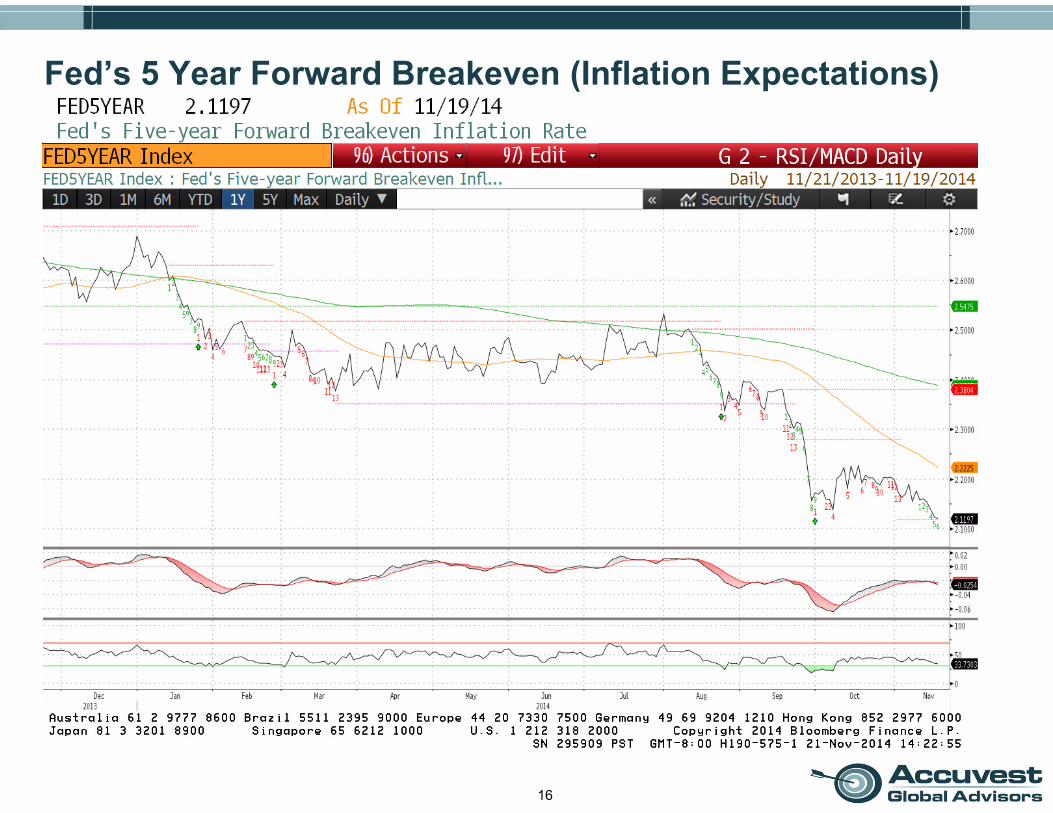
Fed’s 5 Year Forward Breakeven (Inflation Expectations)

17
Investment Grade Bond Prices
18
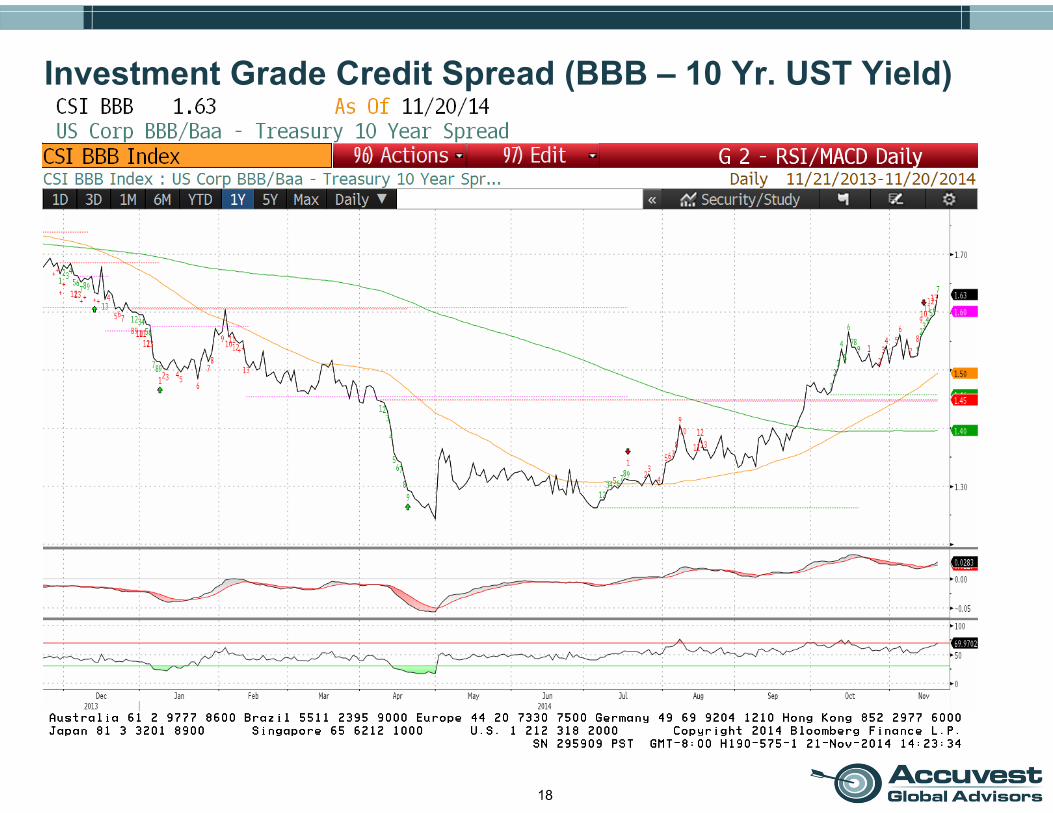
Investment Grade Credit Spread (BBB – 10 Yr. UST Yield)
19
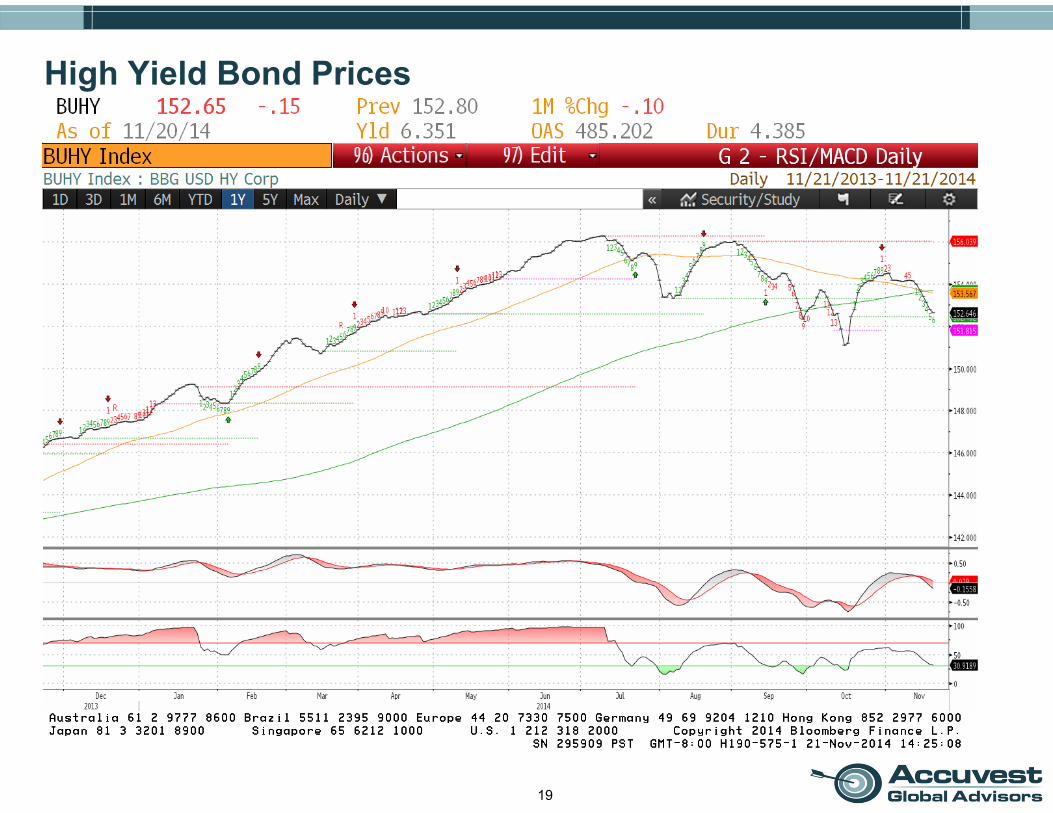
High Yield Bond Prices

20
High Yield Credit Spreads (HY – 10 Yr. UST Yield)

21
Emerging Market Debt (USD Denominated)
22
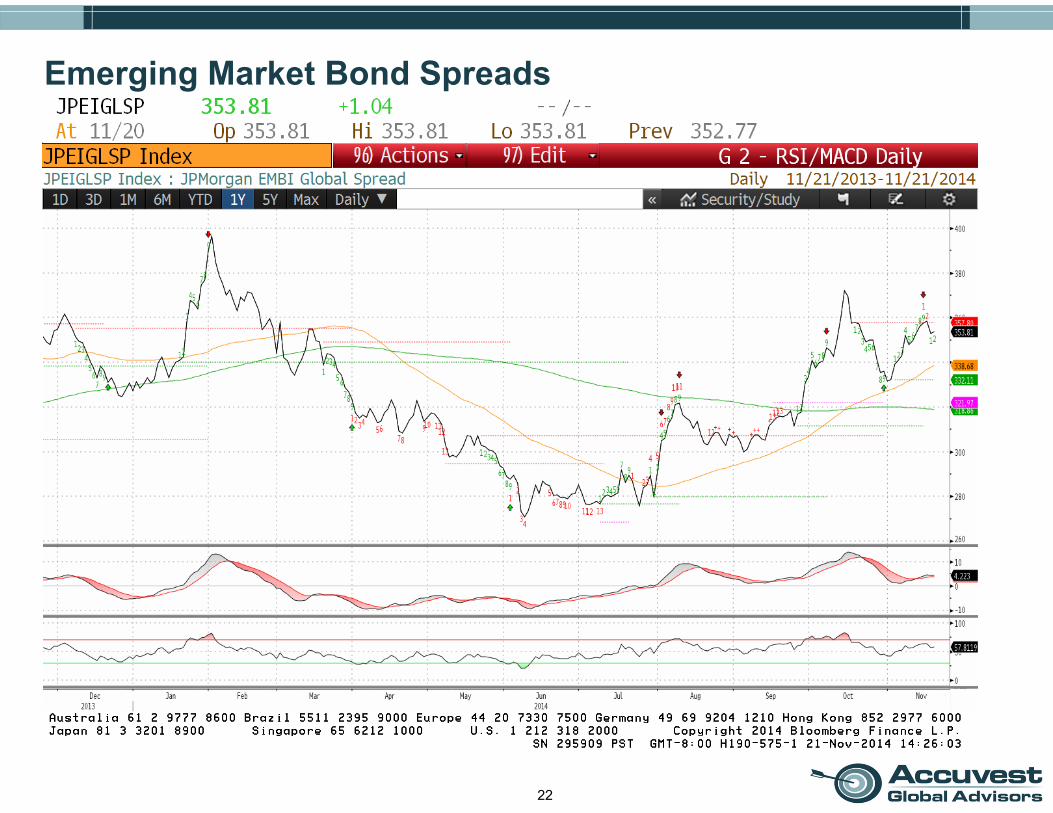
Emerging Market Bond Spreads
23
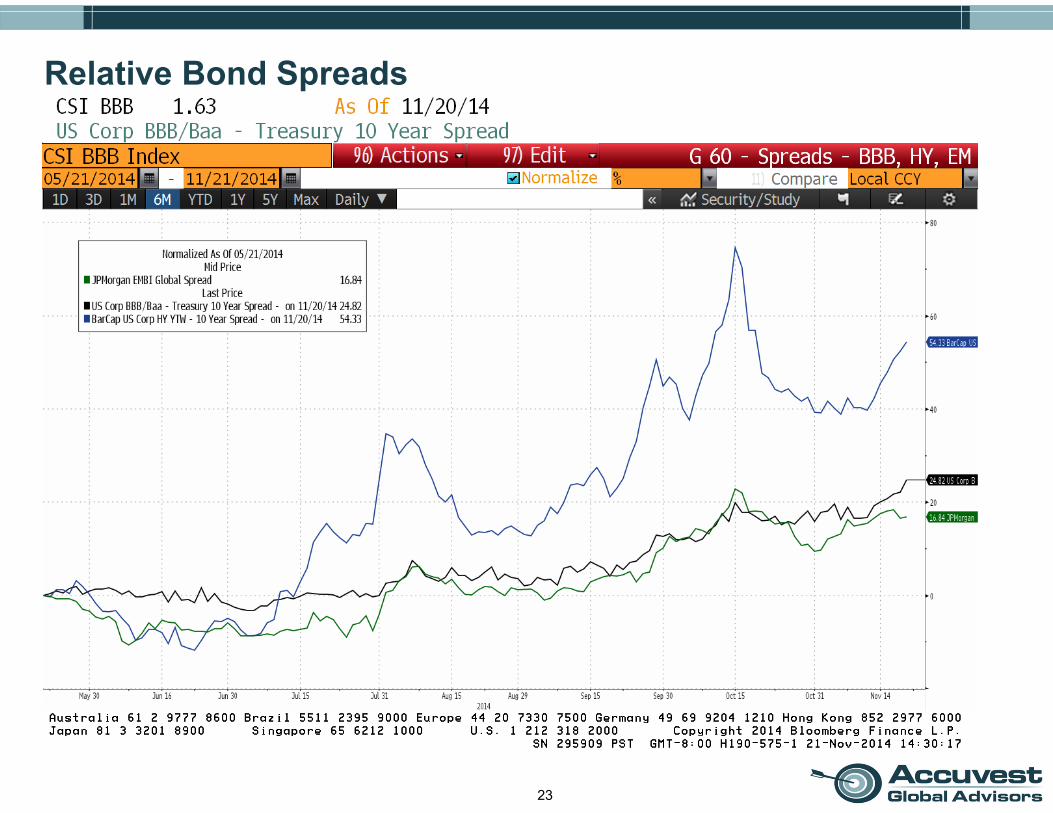
Relative Bond Spreads

Global Equities

25
MSCI All Country World Index - USD
26
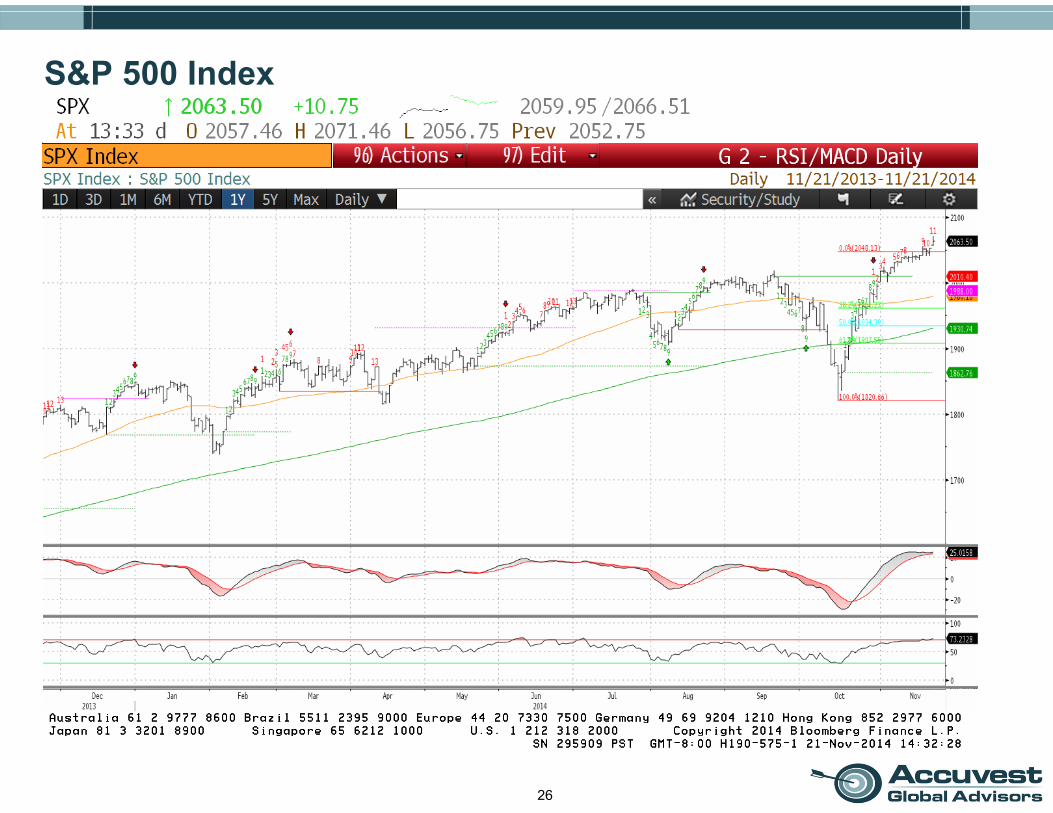
S&P 500 Index
27
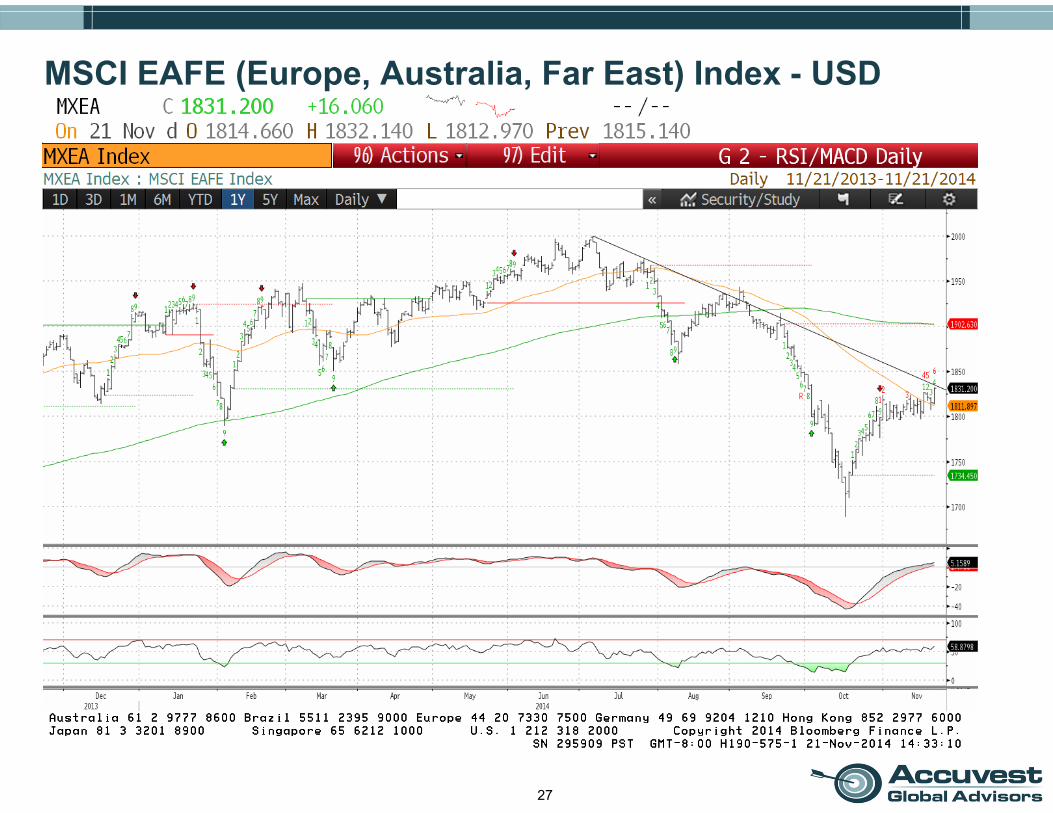
MSCI EAFE (Europe, Australia, Far East) Index - USD

28
MSCI Emerging Markets Index - USD
29
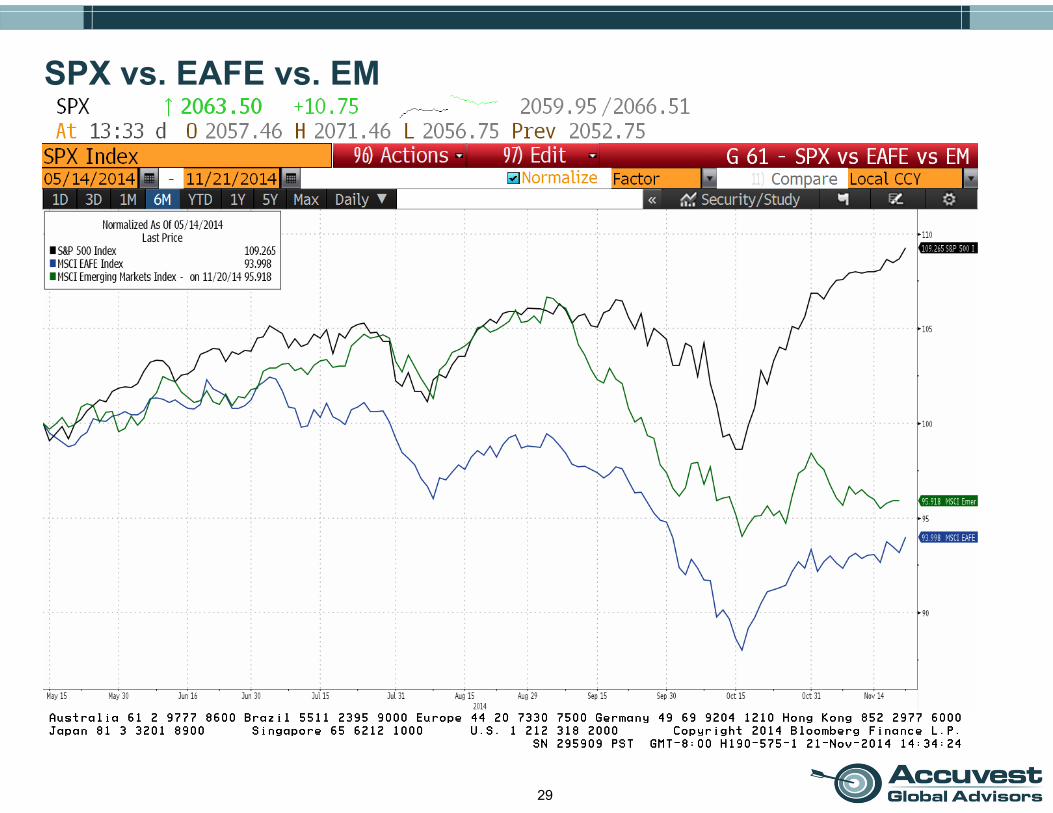
SPX vs. EAFE vs. EM
30
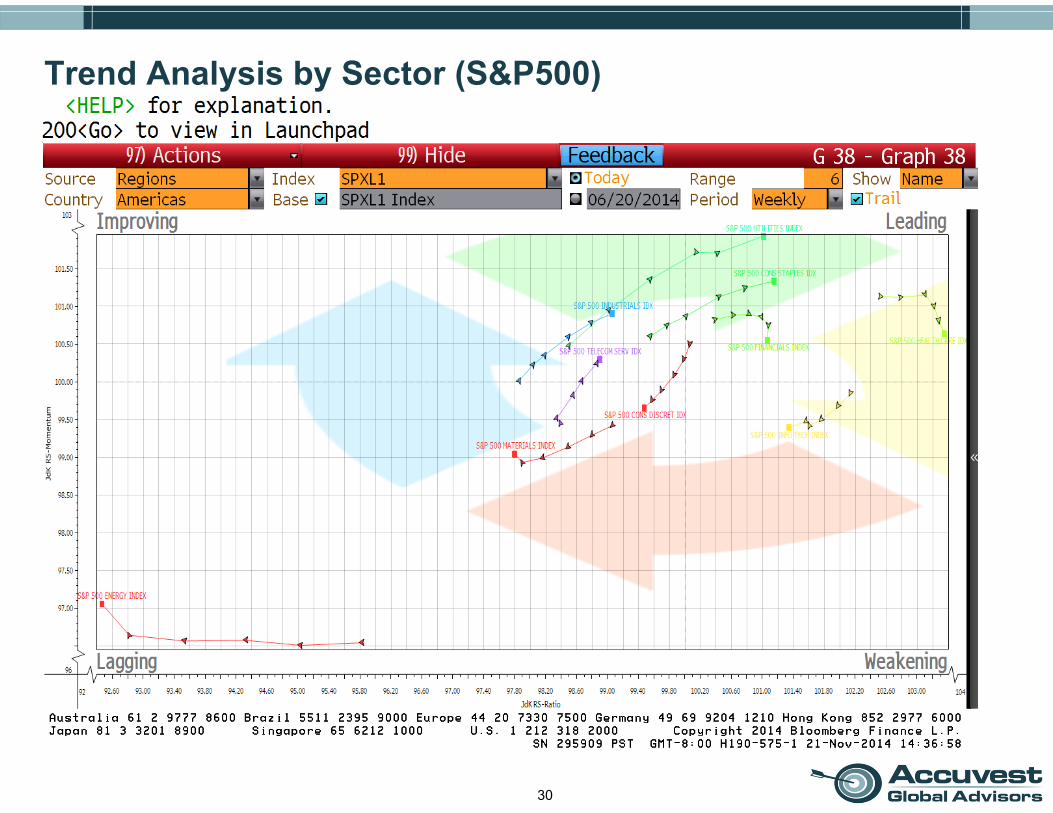
Trend Analysis by Sector (S&P500)
31
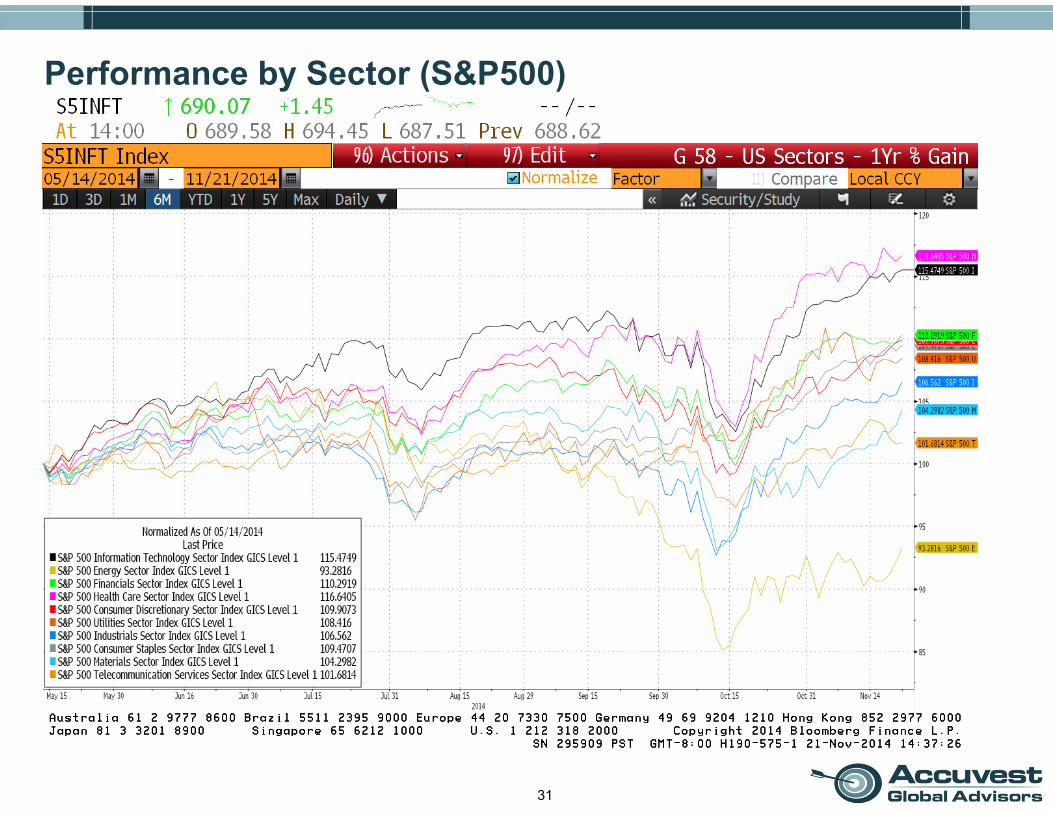
Performance by Sector (S&P500)

The Economy

33
Last week’s Economic Calendar

34
Next week’s Economic Calendar
35
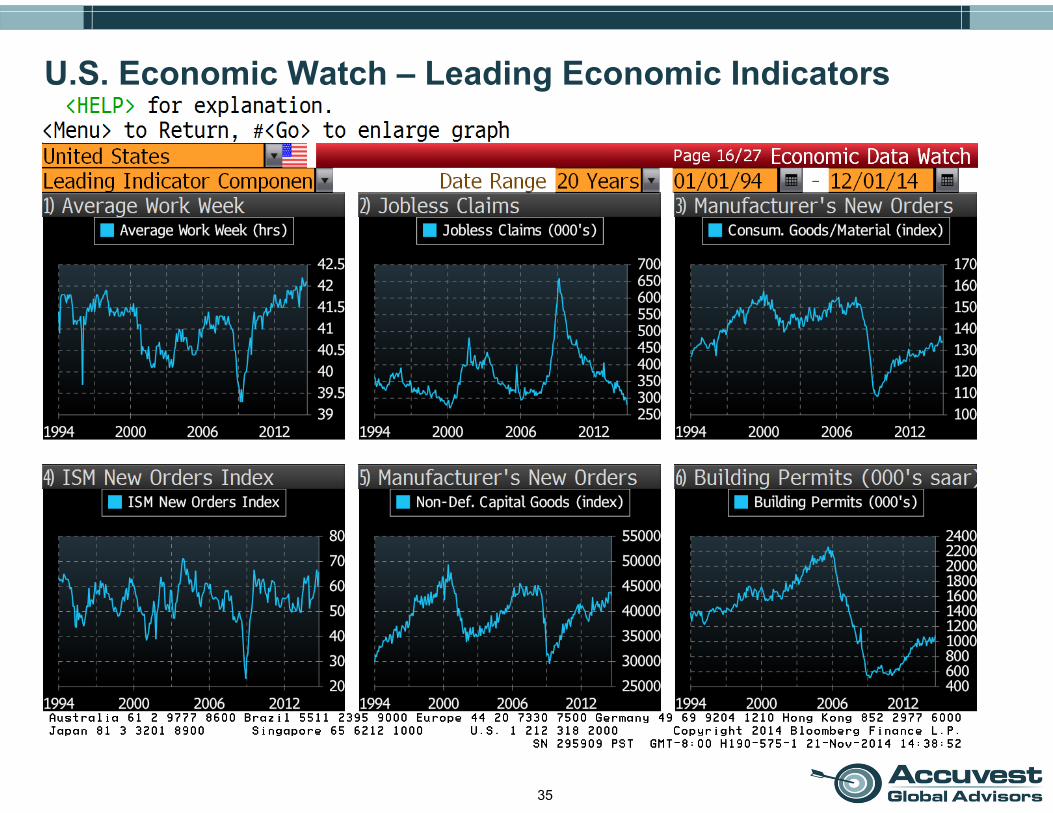
U.S. Economic Watch – Leading Economic Indicators

36
U.S. Economic Watch – Leading Economic Indicators

37
U.S. Economic Watch – Housing Market

38
U.S. Economic Watch – Housing Market

Currencies & Commodities

40
World Currencies vs. U.S. Dollar (6 Month Spot Returns)
41
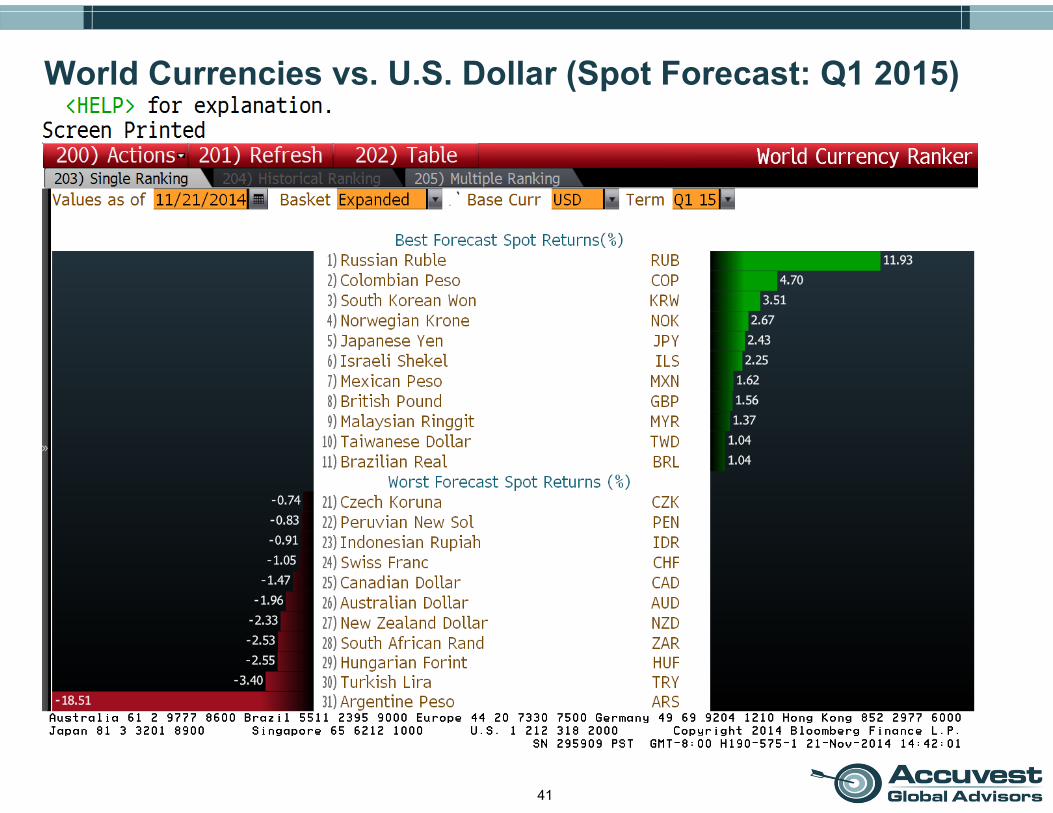
World Currencies vs. U.S. Dollar (Spot Forecast: Q1 2015)

42
US Dollar $

43
Euro €
44
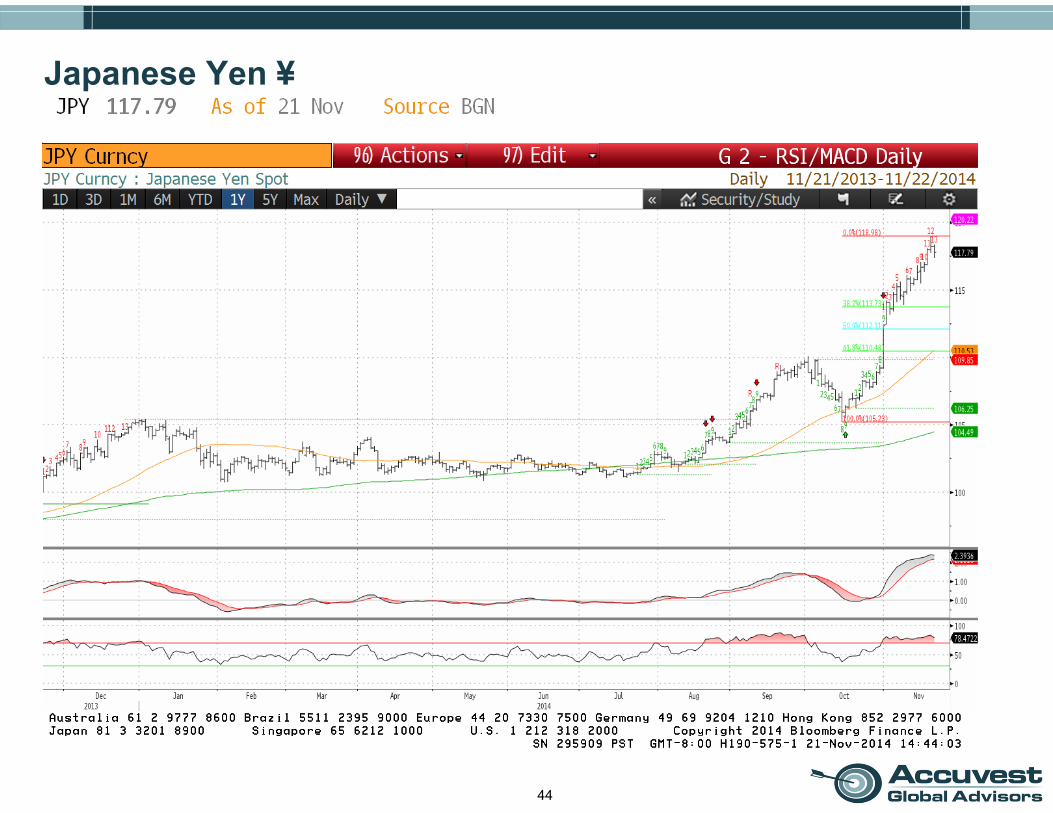
Japanese Yen ¥
45
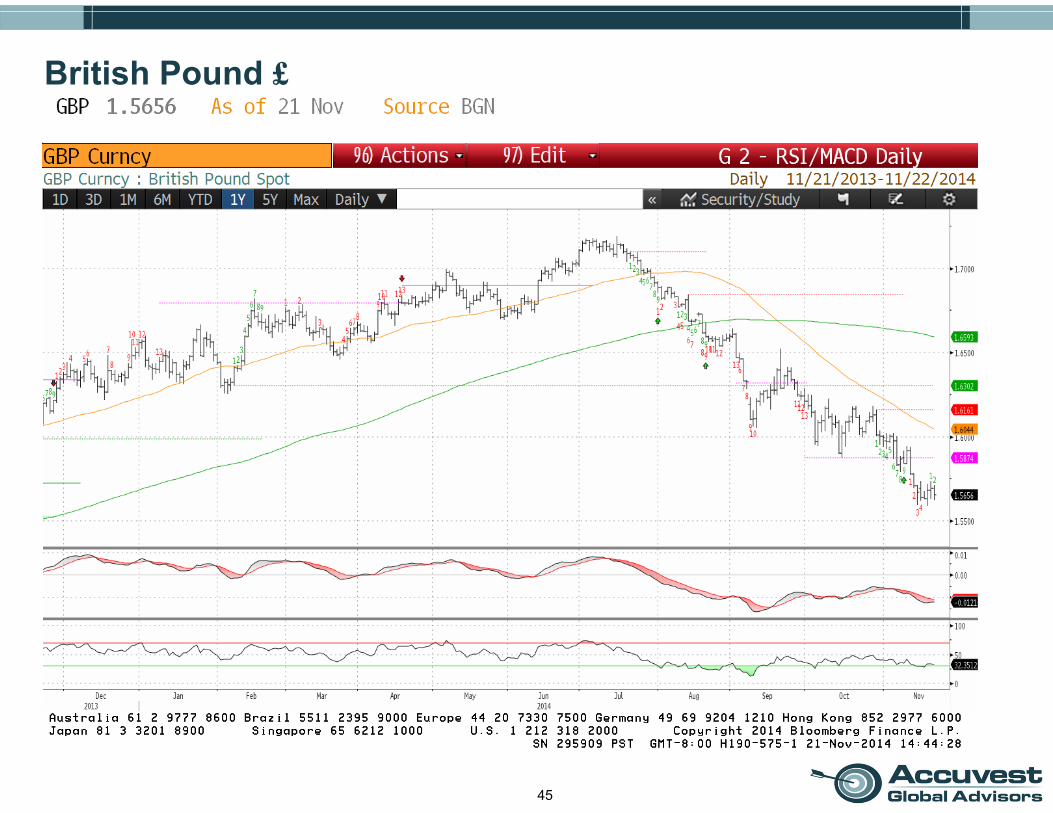
British Pound £
46
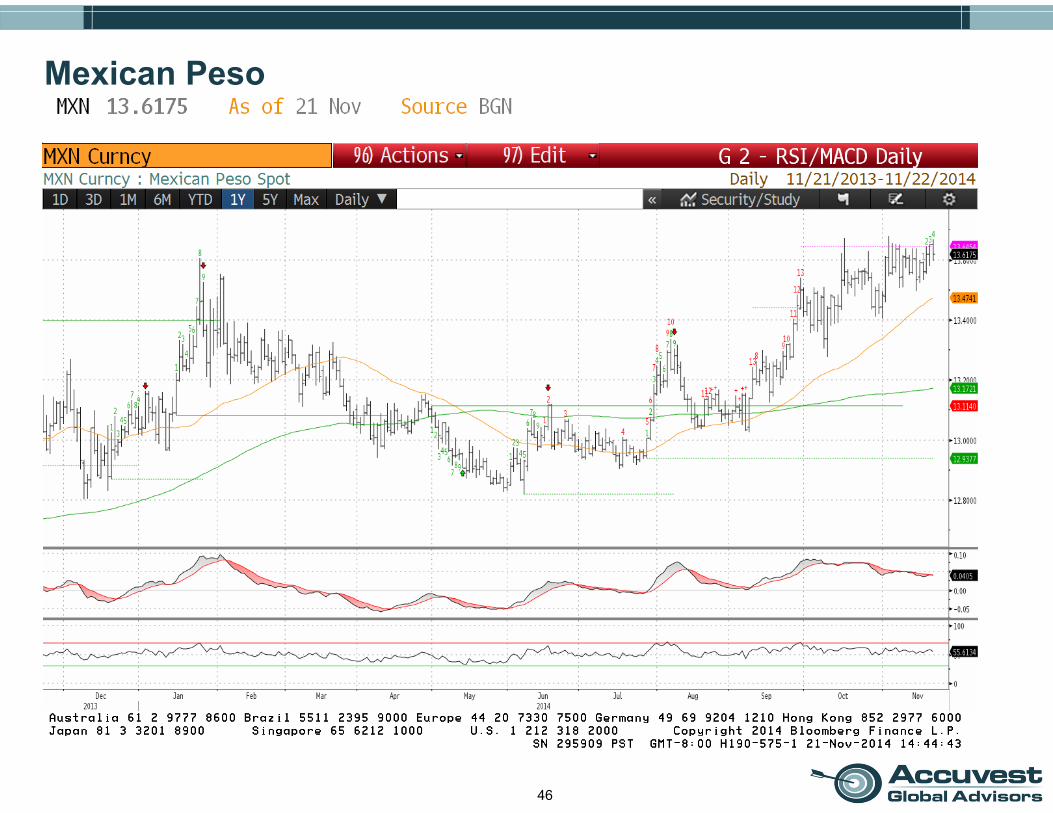
Mexican Peso
47
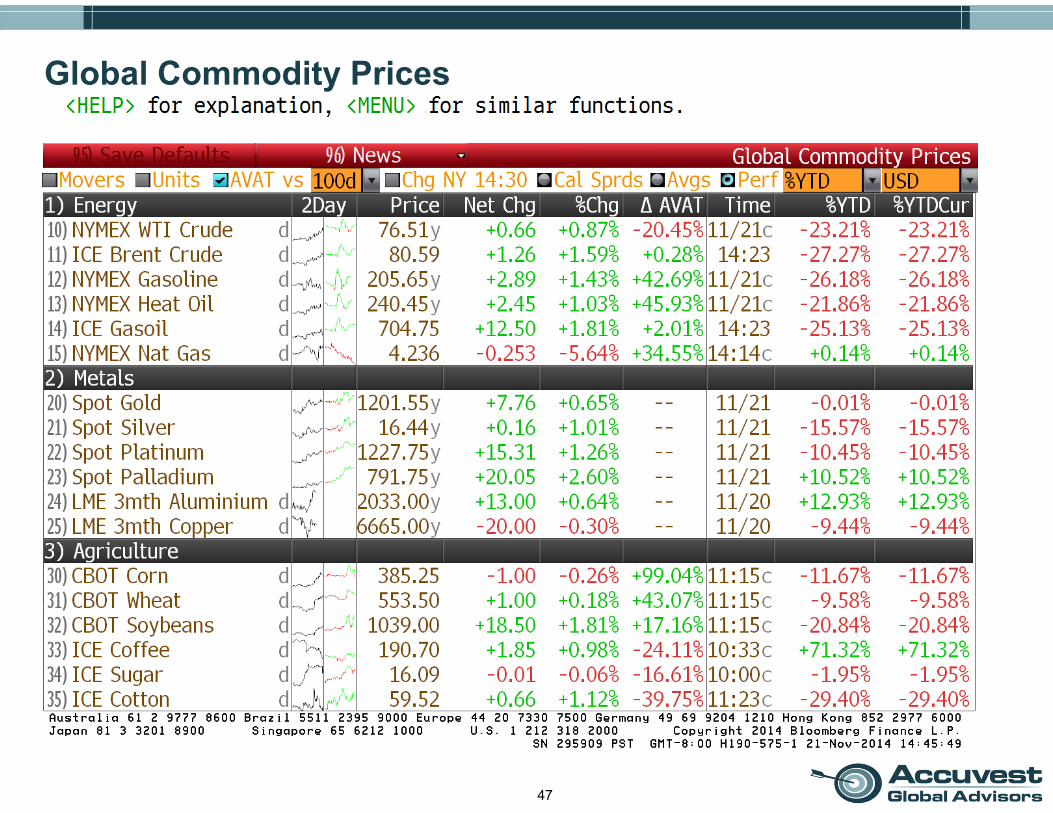
Global Commodity Prices

48
Continuous Commodity Index – 5 Years
49
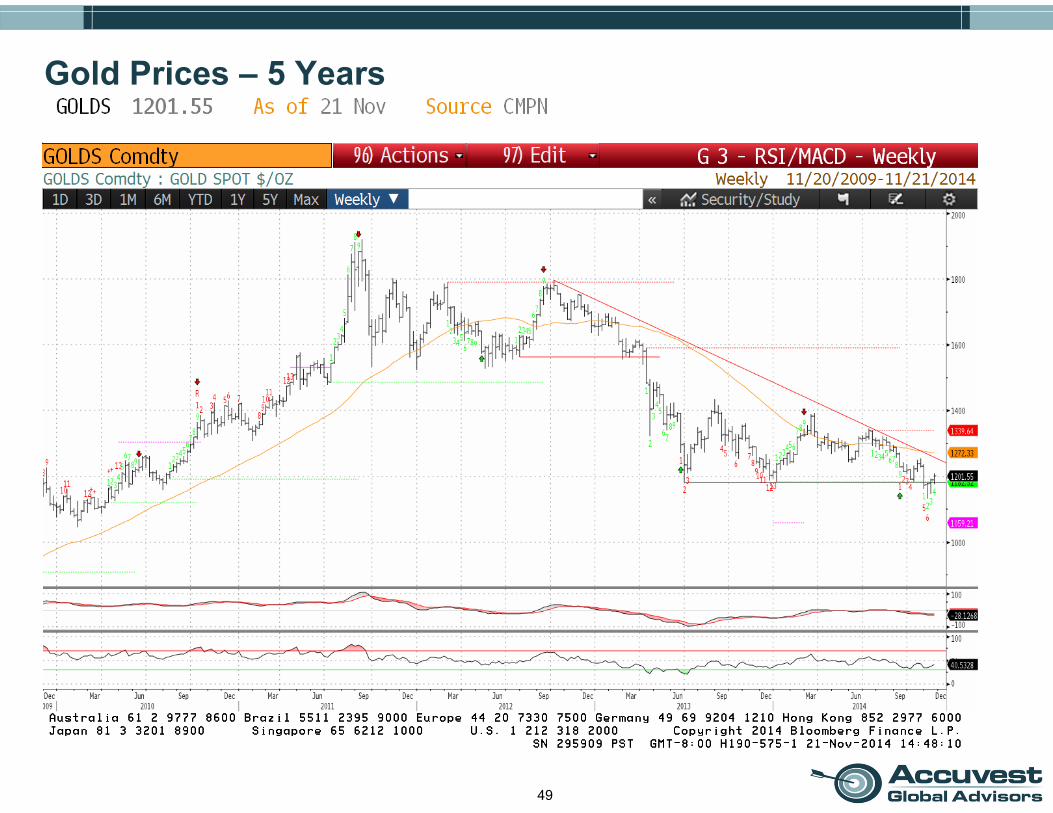
Gold Prices – 5 Years

50
Crude Oil Prices – 5 Years
51
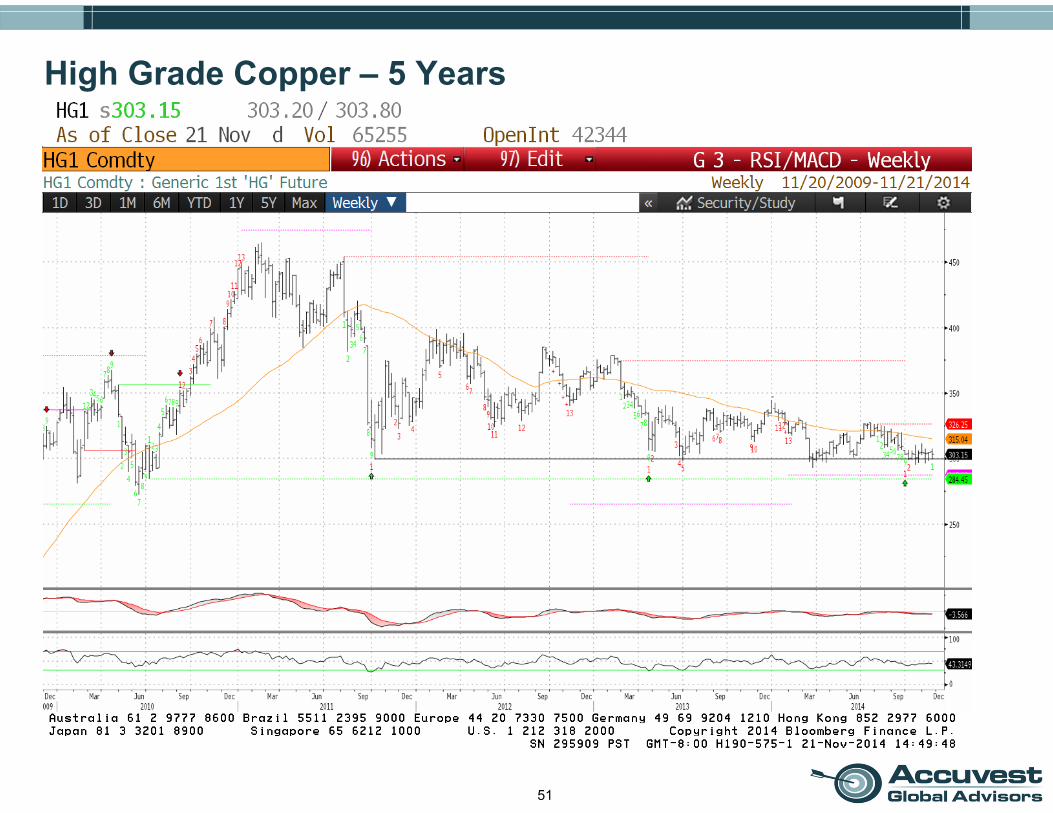
High Grade Copper – 5 Years


![CUSTOMS CLEARANCE PROCESSING · PDF file11/20/2010 · customs clearance processing ... in ternational post [chapters 7, 9 – 11, 13 -21] clearance & release of goods [chapter 24]](https://img.pdfslide.us/doc/110x75/5a729bcc7f8b9ab6538d9bf2/customs-clearance-processing-nbsppdf-file11202010customs.jpg)