Embed Size (px)
Citation preview

ECONOMIC PERSPECTIVES GOVERNOR ØYSTEIN OLSEN
5 MARCH, NORGES BANK

GDP per capita in 1971
2
PPP adjusted. Index. US=100
Sources: OECD and Norges Bank
0 20 40 60 80 100 120 140
Greece
Norway
Italy
France
UK
Germany
Denmark
Sweden
US
Switzerland

GDP per capita in 2013
3
PPP adjusted. Index. US=100
Sources: OECD and Norges Bank
0 20 40 60 80 100 120 140
Greece
Italy
France
UK
Germany
Denmark
Sweden
US
Switzerland
Norway

Wages per full-time equivalent by industry
4
In thousands of NOK. 2014
Sources: Statistics Norway and Norges Bank
0 200 400 600 800 1000
Hotel and restaurant
General government
Other manufacturing
Shipbuilding and machinery
Technical services
Finance
Oil and gas extraction

Business investment
5
In percent of mainland GDP
Sources: Statistics Norway and Norges Bank
0
3
6
9
12
15
0
3
6
9
12
15
2000 2003 2006 2009 2012
Norwegian continental shelf Mainland

Labour costs1) relative to trading partners
6
Index. 1995=100
1) Hourly labour costs.
Sources: The Technical Reporting Committee on Income Settlements and Norges Bank
90
100
110
120
130
140
90
100
110
120
130
140
1995 1998 2001 2004 2007 2010 2013
Domestic currency
Common currency
US crude oil production
7
Million barrels per day
Sources: Energy Information Administration (EIA) and Norges Bank
0
2
4
6
8
10
0
2
4
6
8
10
2000 2002 2004 2006 2008 2010 2012 2014
Conventional crude oil Shale oil
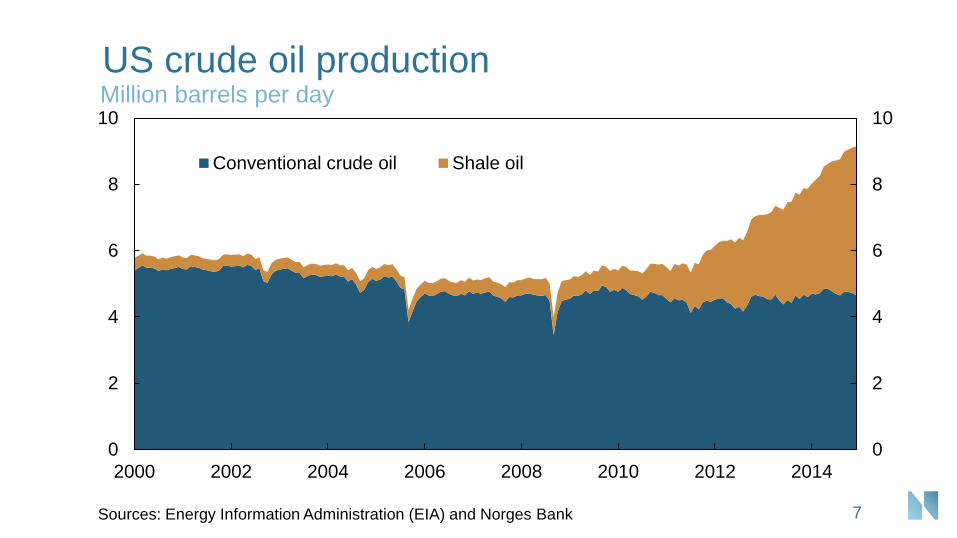
Labour costs1) relative to trading partners
8
Index. 1995=100
1) Hourly labour costs. Estimates for 2015
Sources: The Technical Reporting Committee on Income Settlements and Norges Bank
90
100
110
120
130
140
90
100
110
120
130
140
1995 1998 2001 2004 2007 2010 2013
Domestic currency
Common currency

Labour costs1) relative to trading partners
9
Index. 1995=100
1) Hourly labour costs. Estimates for 2015
Sources: The Technical Reporting Committee on Income Settlements and Norges Bank
90
100
110
120
130
140
90
100
110
120
130
140
1995 1998 2001 2004 2007 2010 2013
Domestic currency
Common currency

Gross domestic product
10
Seasonally adjusted. Volume index. 2008 Q1=100
Source: Thomson Reuters
90
95
100
105
110
115
120
90
95
100
105
110
115
120
2008 2009 2010 2011 2012 2013 2014
Mainland Norway
US
Euro area

Productivity growth in the OECD area
11
Annual growth. Percent
Sources: The Conference Board (Total Economy Database) and Norges Bank
-1
0
1
2
3
4
5
6
-1
0
1
2
3
4
5
6
1970 1980 1990 2000 2010
Productivity growth
Trend

Exports and the GPFG's dividend, interest and
rental income
12
In billions of NOK. 2014
1) GPFG's cash flow comprises dividend, interest and rental income.
Sources: Statistics Norway and Norges Bank
0
100
200
300
400
0
100
200
300
400
Oil Services Gas Cash flow
GPFG¹⁾
Machinery Fish Metals

International real interest rates1)
13
Percent
1) Market yields on 10-year inflation-linked government bonds.
Source: Bloomberg
-2
-1
0
1
2
3
4
5
-2
-1
0
1
2
3
4
5
2000 2003 2006 2009 2012 2015
US UK

Petroleum revenues and petroleum revenue
spending
14
In billions of NOK
Sources: Ministry of Finance and Norges Bank
-400
-200
0
200
400
-400
-200
0
200
400
2004–2013 2014 2015
Government net cash flow from petroleum activities
Non-oil budget deficit
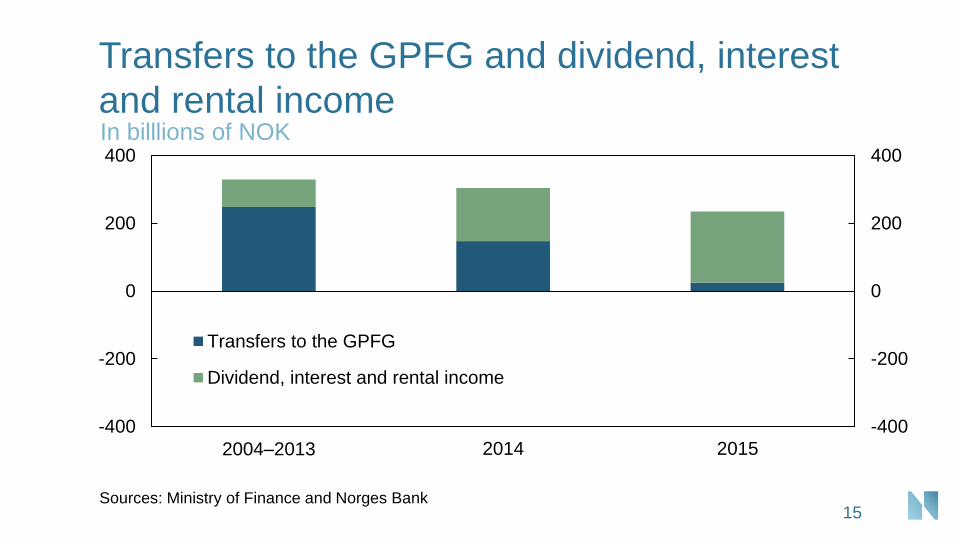
Transfers to the GPFG and dividend, interest
and rental income
15
In billlions of NOK
Sources: Ministry of Finance and Norges Bank
-400
-200
0
200
400
-400
-200
0
200
400
2004–2013 2014 2015
Transfers to the GPFG
Dividend, interest and rental income

Different return scenarios for the GPFG
16
In percent of mainland GDP
Sources: Ministry of Finance and Norges Bank
0
2
4
6
8
10
0
2
4
6
8
10
2000 2010 2020 2030 2040 2050 2060
Petroleum revenue spending
4% return
3% return
3% return and lower oil price²⁾

ECONOMIC PERSPECTIVES GOVERNOR ØYSTEIN OLSEN
5 MARCH, NORGES BANK