Embed Size (px)
Citation preview

Charter Court Financial Services Group PLCFull Year 2017 Results
20 March 2018
2
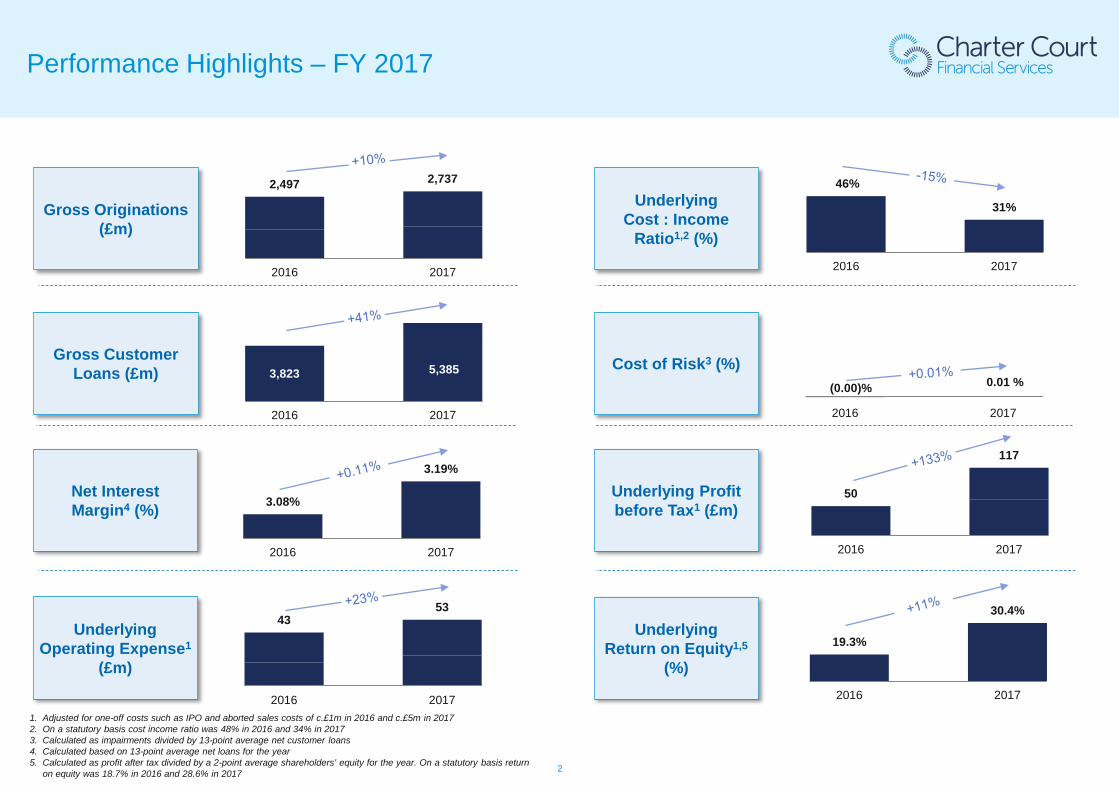
19.3%
30.4%
2016 2017
46%
31%
2016 2017
Performance Highlights – FY 2017
Underlying Operating Expense1
(£m)
Cost of Risk3 (%)
3.08%
3.19%
2016 2017
Net InterestMargin4 (%)
Underlying Cost : Income
Ratio1,2 (%)
UnderlyingReturn on Equity1,5
(%)
4353
2016 2017
(0.00)% 0.01 %
2016 2017
1. Adjusted for one-off costs such as IPO and aborted sales costs of c.£1m in 2016 and c.£5m in 20172. On a statutory basis cost income ratio was 48% in 2016 and 34% in 20173. Calculated as impairments divided by 13-point average net customer loans4. Calculated based on 13-point average net loans for the year5. Calculated as profit after tax divided by a 2-point average shareholders’ equity for the year. On a statutory basis return
on equity was 18.7% in 2016 and 28.6% in 2017
Underlying Profit before Tax1 (£m)
Gross Originations (£m)
Gross Customer Loans (£m)
2,497 2,737
2016 2017
5,3853,823
2016 2017
50
117
2016 2017
3
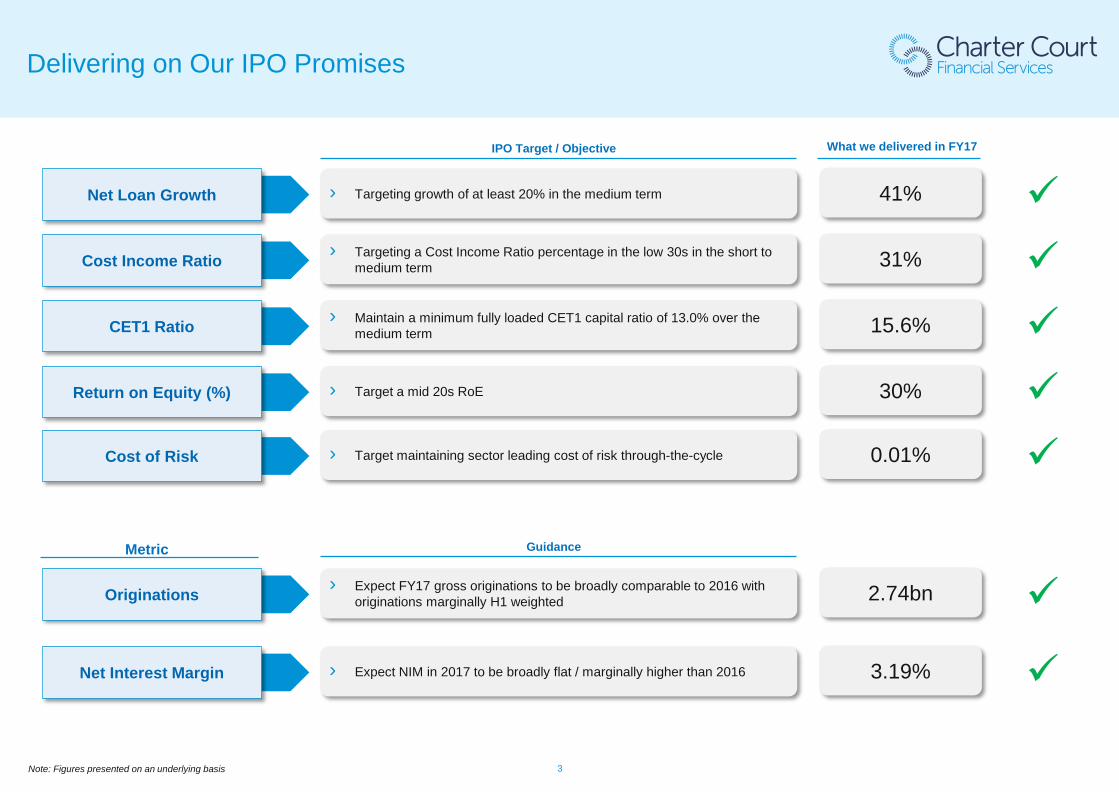
Delivering on Our IPO Promises
› Targeting a Cost Income Ratio percentage in the low 30s in the short to medium termCost Income Ratio
CET1 Ratio
Return on Equity (%)
Net Loan Growth
› Maintain a minimum fully loaded CET1 capital ratio of 13.0% over the medium term
› Target a mid 20s RoE
› Targeting growth of at least 20% in the medium term
IPO Target / Objective
› Expect FY17 gross originations to be broadly comparable to 2016 with originations marginally H1 weightedOriginations
Net Interest Margin
Cost of Risk
› Expect NIM in 2017 to be broadly flat / marginally higher than 2016
› Target maintaining sector leading cost of risk through-the-cycle
Metric Guidance
31%
15.6%
30%
41%
2.74bn
3.19%
0.01%
What we delivered in FY17
Note: Figures presented on an underlying basis
4
Financial Performance
Sebastien Maloney
Chief Financial Officer
5
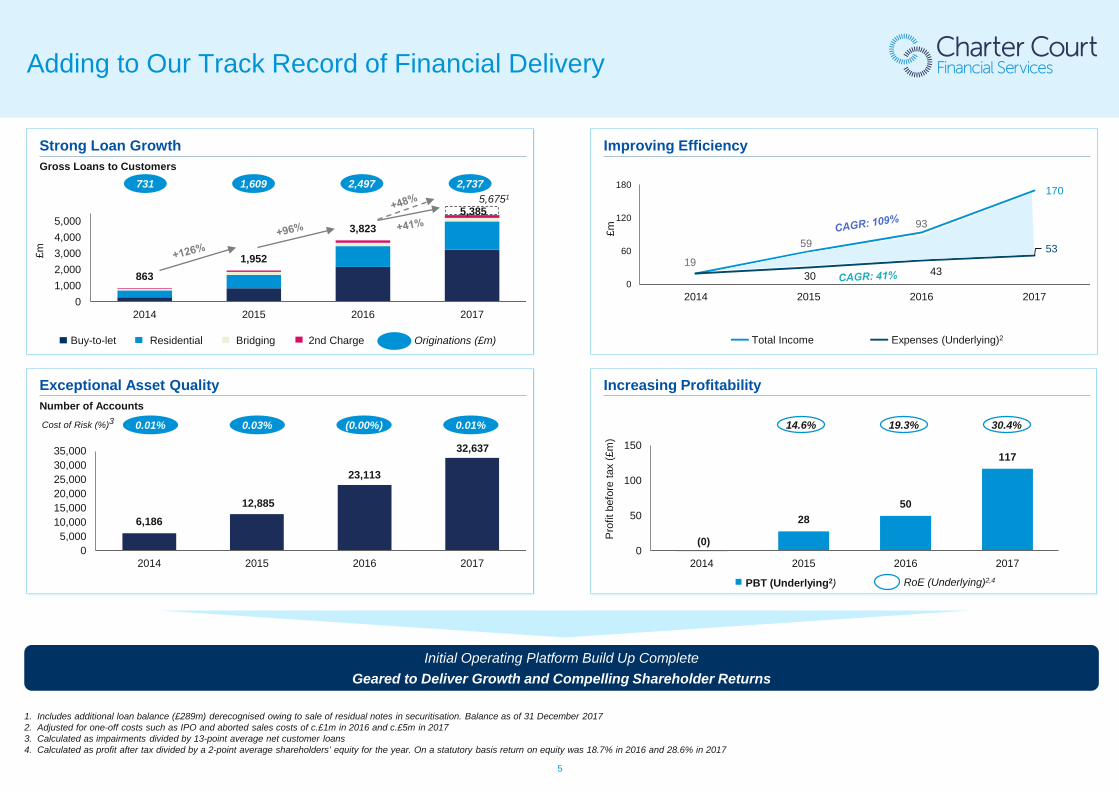
8631,952
3,8235,385
01,0002,0003,0004,0005,000
2014 2015 2016 2017
Adding to Our Track Record of Financial Delivery
Strong Loan GrowthGross Loans to Customers
Initial Operating Platform Build Up CompleteGeared to Deliver Growth and Compelling Shareholder Returns
Residential 2nd ChargeBuy-to-let Bridging Originations (£m)
£m
2,4971,609731
Improving Efficiency
£m
19
59
93
170
30 43
53
2014 2015 2016 20170
60
120
180
Expenses (Underlying)2Total Income
Exceptional Asset QualityNumber of Accounts
Increasing Profitability
6,18612,885
23,113
32,637
05,000
10,00015,00020,00025,00030,00035,000
2014 2015 2016 2017
Cost of Risk (%)3 (0.00%)0.03%0.01%
2850
117
0
50
100
150
2014 2015 2016 2017
Pro
fit b
efor
e ta
x (£
m)
PBT (Underlying2)
1. Includes additional loan balance (£289m) derecognised owing to sale of residual notes in securitisation. Balance as of 31 December 20172. Adjusted for one-off costs such as IPO and aborted sales costs of c.£1m in 2016 and c.£5m in 20173. Calculated as impairments divided by 13-point average net customer loans4. Calculated as profit after tax divided by a 2-point average shareholders’ equity for the year. On a statutory basis return on equity was 18.7% in 2016 and 28.6% in 2017
19.3%14.6%
RoE (Underlying)2,4
(0)
2,737
0.01% 30.4%
5,6751
6
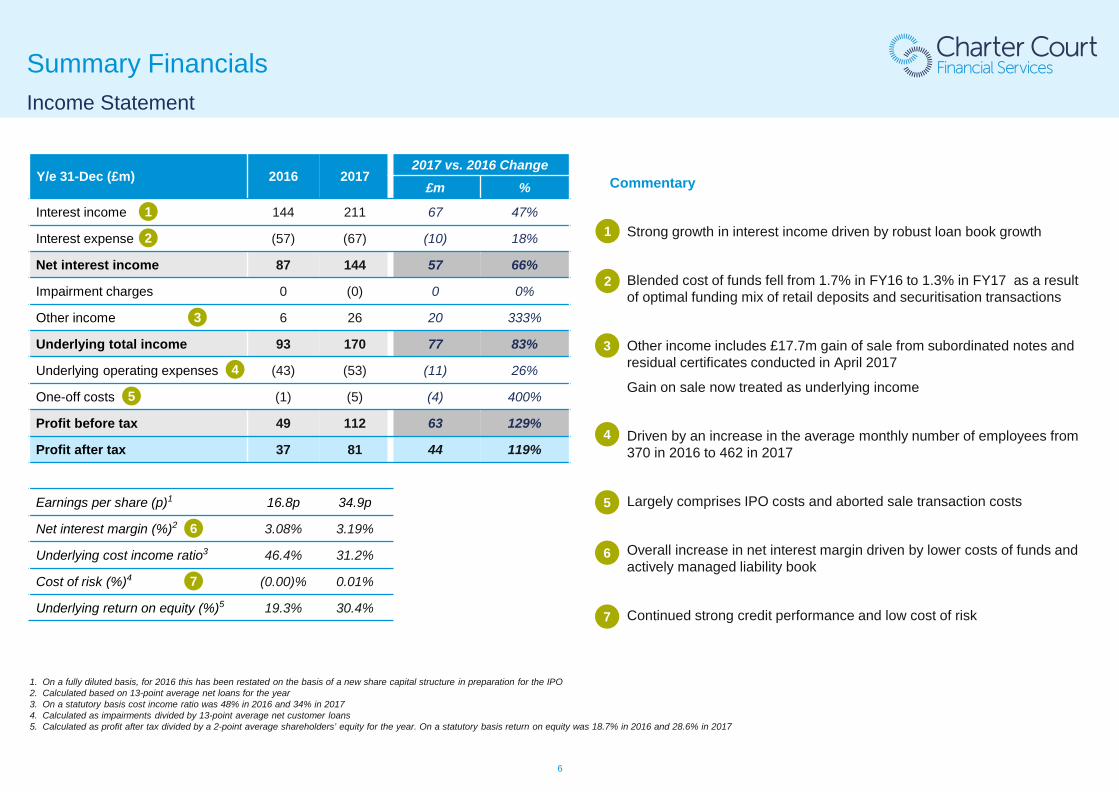
Y/e 31-Dec (£m) 2016 20172017 vs. 2016 Change
£m %
Interest income 144 211 67 47%
Interest expense (57) (67) (10) 18%
Net interest income 87 144 57 66%
Impairment charges 0 (0) 0 0%
Other income 6 26 20 333%
Underlying total income 93 170 77 83%
Underlying operating expenses (43) (53) (11) 26%
One-off costs (1) (5) (4) 400%
Profit before tax 49 112 63 129%
Profit after tax 37 81 44 119%
Earnings per share (p)1 16.8p 34.9p
Net interest margin (%)2 3.08% 3.19%
Underlying cost income ratio3 46.4% 31.2%
Cost of risk (%)4 (0.00)% 0.01%
Underlying return on equity (%)5 19.3% 30.4%
Summary FinancialsIncome Statement
Commentary
› Strong growth in interest income driven by robust loan book growth
› Blended cost of funds fell from 1.7% in FY16 to 1.3% in FY17 as a result of optimal funding mix of retail deposits and securitisation transactions
› Other income includes £17.7m gain of sale from subordinated notes and residual certificates conducted in April 2017
› Gain on sale now treated as underlying income
› Driven by an increase in the average monthly number of employees from 370 in 2016 to 462 in 2017
› Largely comprises IPO costs and aborted sale transaction costs
› Overall increase in net interest margin driven by lower costs of funds and actively managed liability book
› Continued strong credit performance and low cost of risk
11
2
2
3
4
5
1. On a fully diluted basis, for 2016 this has been restated on the basis of a new share capital structure in preparation for the IPO2. Calculated based on 13-point average net loans for the year3. On a statutory basis cost income ratio was 48% in 2016 and 34% in 20174. Calculated as impairments divided by 13-point average net customer loans5. Calculated as profit after tax divided by a 2-point average shareholders’ equity for the year. On a statutory basis return on equity was 18.7% in 2016 and 28.6% in 2017
4
5
6
6
3
7
7
7
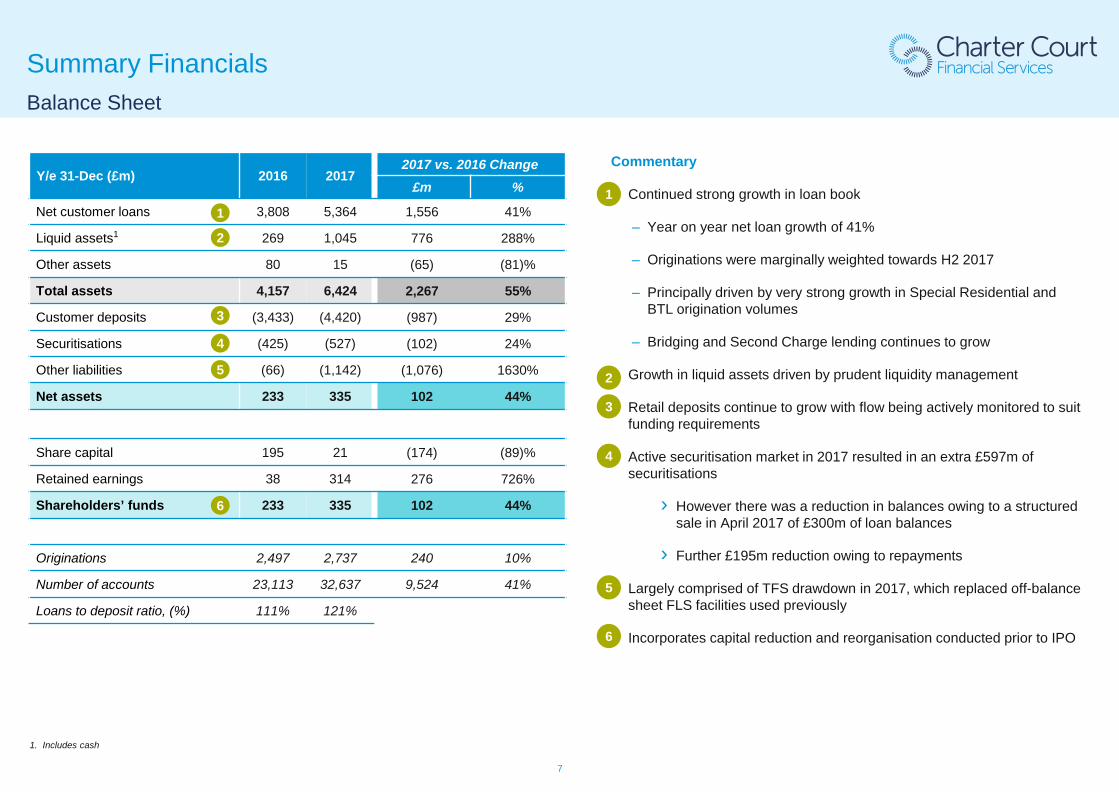
Y/e 31-Dec (£m) 2016 20172017 vs. 2016 Change
£m %
Net customer loans 3,808 5,364 1,556 41%
Liquid assets1 269 1,045 776 288%
Other assets 80 15 (65) (81)%
Total assets 4,157 6,424 2,267 55%
Customer deposits (3,433) (4,420) (987) 29%
Securitisations (425) (527) (102) 24%
Other liabilities (66) (1,142) (1,076) 1630%
Net assets 233 335 102 44%
Share capital 195 21 (174) (89)%
Retained earnings 38 314 276 726%
Shareholders’ funds 233 335 102 44%
Originations 2,497 2,737 240 10%
Number of accounts 23,113 32,637 9,524 41%
Loans to deposit ratio, (%) 111% 121%
Commentary
› Continued strong growth in loan book
‒ Year on year net loan growth of 41%
‒ Originations were marginally weighted towards H2 2017
‒ Principally driven by very strong growth in Special Residential and BTL origination volumes
‒ Bridging and Second Charge lending continues to grow
› Growth in liquid assets driven by prudent liquidity management
› Retail deposits continue to grow with flow being actively monitored to suit funding requirements
› Active securitisation market in 2017 resulted in an extra £597m of securitisations
› However there was a reduction in balances owing to a structured sale in April 2017 of £300m of loan balances
› Further £195m reduction owing to repayments
› Largely comprised of TFS drawdown in 2017, which replaced off-balance sheet FLS facilities used previously
› Incorporates capital reduction and reorganisation conducted prior to IPO
11
2
3
4
5
2
Balance Sheet
Summary Financials
4
6
3
1. Includes cash
5
6
8
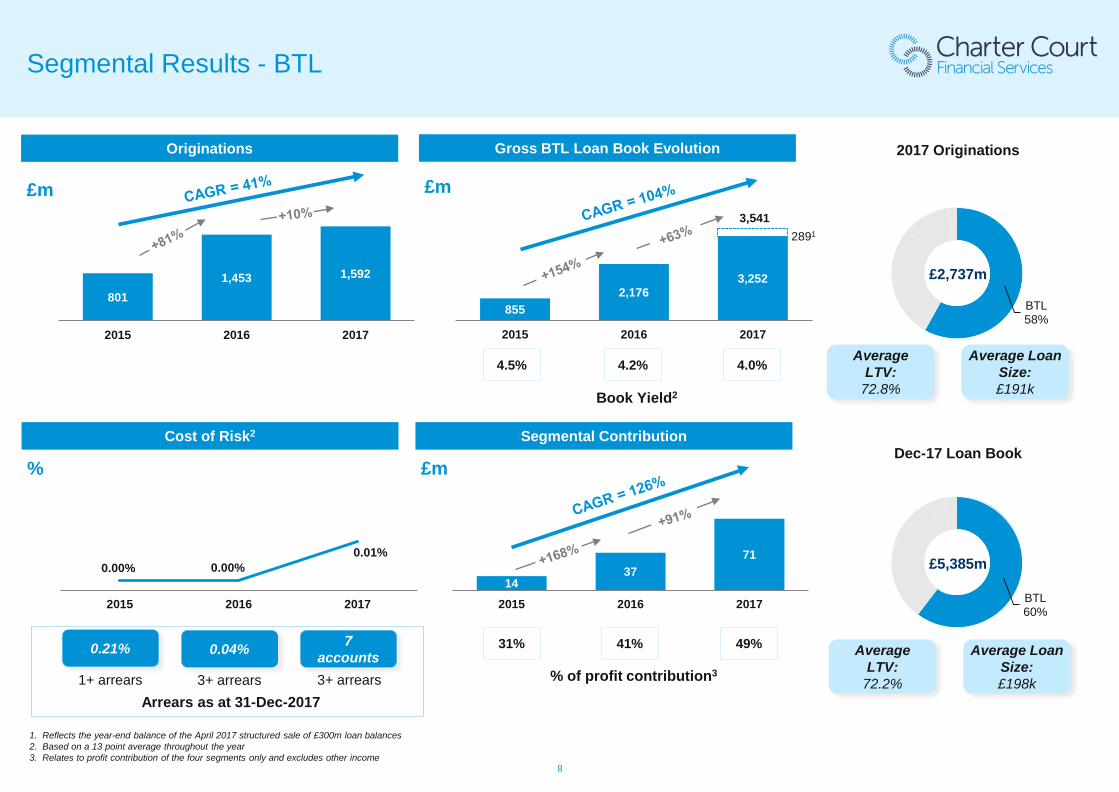
Segmental Results - BTL
1. Reflects the year-end balance of the April 2017 structured sale of £300m loan balances2. Based on a 13 point average throughout the year3. Relates to profit contribution of the four segments only and excludes other income
1437
71
2015 2016 2017
Segmental Contribution
£m
% of profit contribution3
31% 41% 49%
8011,453 1,592
2015 2016 2017
Originations
£m
8552,176
3,252
2891
2015 2016 2017
Gross BTL Loan Book Evolution
£m
Book Yield2
4.5% 4.2% 4.0%
3,541
0.00% 0.00%0.01%
2015 2016 2017
Cost of Risk2
%
0.21%
1+ arrears
0.04% 7accounts
3+ arrears 3+ arrearsArrears as at 31-Dec-2017
BTL58%
£2,737m
2017 Originations
Dec-17 Loan Book
£5,385m
BTL60%
Average LTV:
72.8%
Average Loan Size:£191k
Average LTV:
72.2%
Average Loan Size:£198k
9
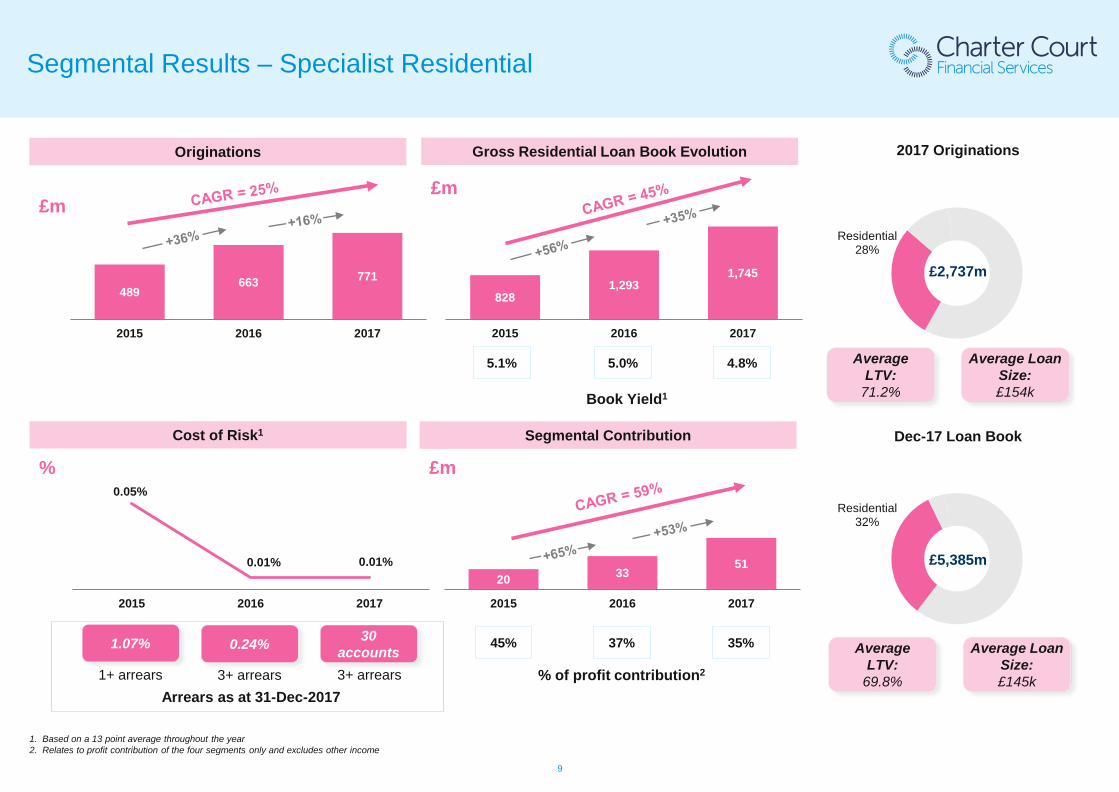
Segmental Results – Specialist Residential
1. Based on a 13 point average throughout the year2. Relates to profit contribution of the four segments only and excludes other income
8281,293
1,745
2015 2016 2017
Gross Residential Loan Book Evolution
£m
Book Yield1
5.1% 5.0% 4.8%
20 3351
2015 2016 2017
Segmental Contribution
£m
% of profit contribution2
45% 37% 35%
489663 771
2015 2016 2017
Originations
£m
0.05%
0.01% 0.01%
2015 2016 2017
Cost of Risk1
%
1.07%
1+ arrears
0.24% 30accounts
3+ arrears 3+ arrearsArrears as at 31-Dec-2017
Residential28%
£2,737m
2017 Originations
Dec-17 Loan Book
£5,385m
Residential32%
Average LTV:
71.2%
Average Loan Size:£154k
Average LTV:
69.8%
Average Loan Size:£145k
10
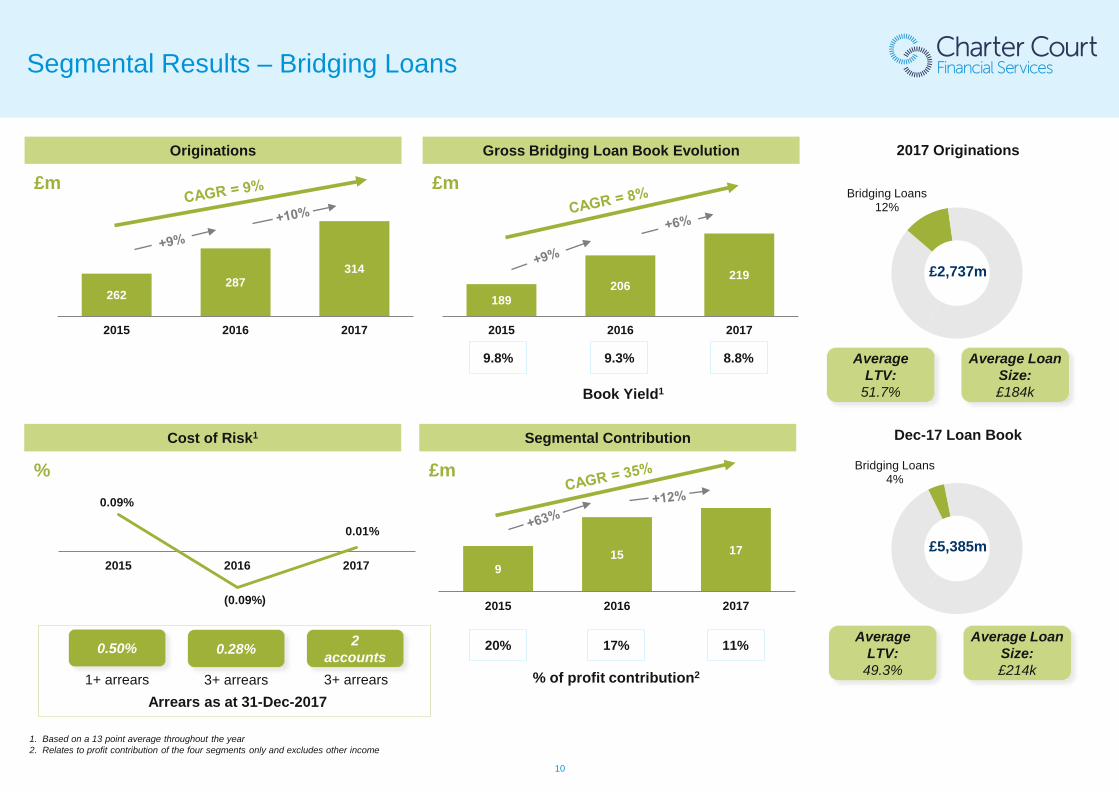
Segmental Results – Bridging Loans
1. Based on a 13 point average throughout the year2. Relates to profit contribution of the four segments only and excludes other income
189206
219
2015 2016 2017
Gross Bridging Loan Book Evolution
£m
Book Yield1
9.8% 9.3% 8.8%
915 17
2015 2016 2017
Segmental Contribution
£m
% of profit contribution2
20% 17% 11%
262287
314
2015 2016 2017
Originations
£m
0.09%
(0.09%)
0.01%
2015 2016 2017
Cost of Risk1
%
0.50%
1+ arrears
0.28% 2accounts
3+ arrears 3+ arrearsArrears as at 31-Dec-2017
Bridging Loans12%
£2,737m
2017 Originations
Dec-17 Loan Book
£5,385m
Bridging Loans4%
Average LTV:
51.7%
Average Loan Size:£184k
Average LTV:
49.3%
Average Loan Size:£214k
11
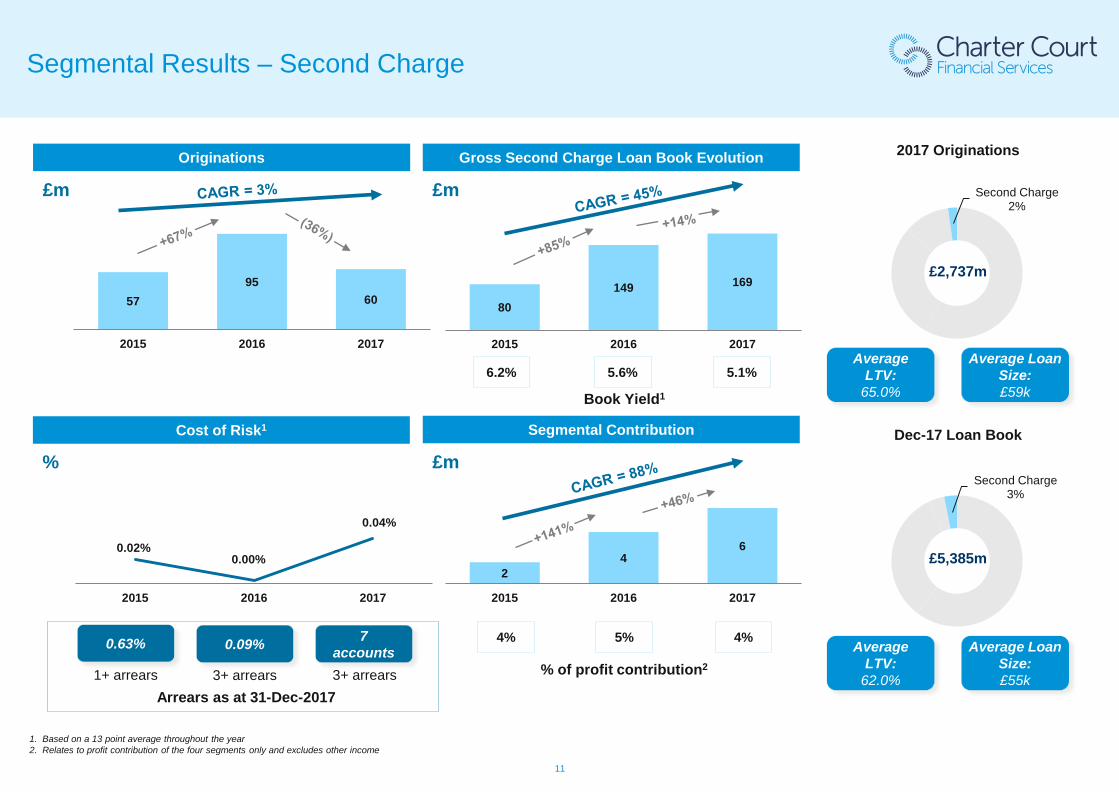
Segmental Results – Second Charge
1. Based on a 13 point average throughout the year2. Relates to profit contribution of the four segments only and excludes other income
80149 169
2015 2016 2017
Gross Second Charge Loan Book Evolution
£m
Book Yield1
6.2% 5.6% 5.1%
24
6
2015 2016 2017
Segmental Contribution
£m
% of profit contribution2
4% 5% 4%
5795
60
2015 2016 2017
Originations
£m
0.02%0.00%
0.04%
2015 2016 2017
Cost of Risk1
%
0.63%
1+ arrears
0.09% 7accounts
3+ arrears 3+ arrearsArrears as at 31-Dec-2017
Second Charge2%
£2,737m
2017 Originations
Dec-17 Loan Book
£5,385m
Second Charge3%
Average LTV:
65.0%
Average Loan Size:£59k
Average LTV:
62.0%
Average Loan Size:£55k
12
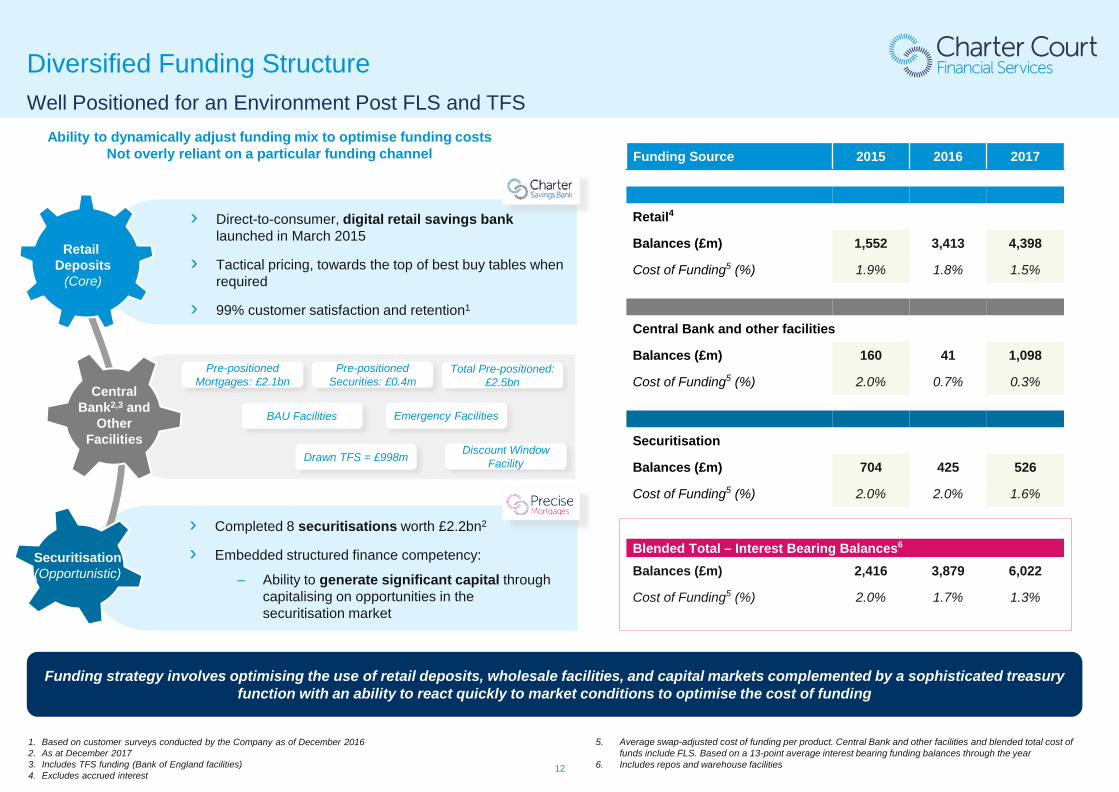
Diversified Funding Structure
1. Based on customer surveys conducted by the Company as of December 20162. As at December 20173. Includes TFS funding (Bank of England facilities) 4. Excludes accrued interest
Well Positioned for an Environment Post FLS and TFS
› Direct-to-consumer, digital retail savings bank launched in March 2015
› Tactical pricing, towards the top of best buy tables when required
› 99% customer satisfaction and retention1
Central Bank2,3 and
Other Facilities
Securitisation(Opportunistic)
Retail Deposits
(Core)
Discount Window Facility
Emergency FacilitiesBAU Facilities
Drawn TFS = £998m
Funding strategy involves optimising the use of retail deposits, wholesale facilities, and capital markets complemented by a sophisticated treasury function with an ability to react quickly to market conditions to optimise the cost of funding
5. Average swap-adjusted cost of funding per product. Central Bank and other facilities and blended total cost of funds include FLS. Based on a 13-point average interest bearing funding balances through the year
6. Includes repos and warehouse facilities
Retail4
Balances (£m) 1,552 3,413 4,398
Cost of Funding5 (%) 1.9% 1.8% 1.5%
Ability to dynamically adjust funding mix to optimise funding costsNot overly reliant on a particular funding channel Funding Source 2015 2016 2017
Securitisation
Balances (£m) 704 425 526
Cost of Funding5 (%) 2.0% 2.0% 1.6%
Central Bank and other facilities
Balances (£m) 160 41 1,098
Cost of Funding5 (%) 2.0% 0.7% 0.3%
Blended Total – Interest Bearing Balances6
Balances (£m) 2,416 3,879 6,022
Cost of Funding5 (%) 2.0% 1.7% 1.3%
› Completed 8 securitisations worth £2.2bn2
› Embedded structured finance competency:
‒ Ability to generate significant capital through capitalising on opportunities in the securitisation market
Pre-positioned Mortgages: £2.1bn
Pre-positioned Securities: £0.4m
Total Pre-positioned: £2.5bn
13
18 18 44 57 126227 289 244
374
24 41 32 24
115
267 164
235 230 206 224
518
300 297 246
374
PMF No.1 PMF 2014-1 PMF 2014-2 PMF 2015-1 PMF 2015-2B PMF 2015-3R PMF 2017-1B CMF 2017-1 PMF 2018-1B PMF 2018-2B
BTL Residential
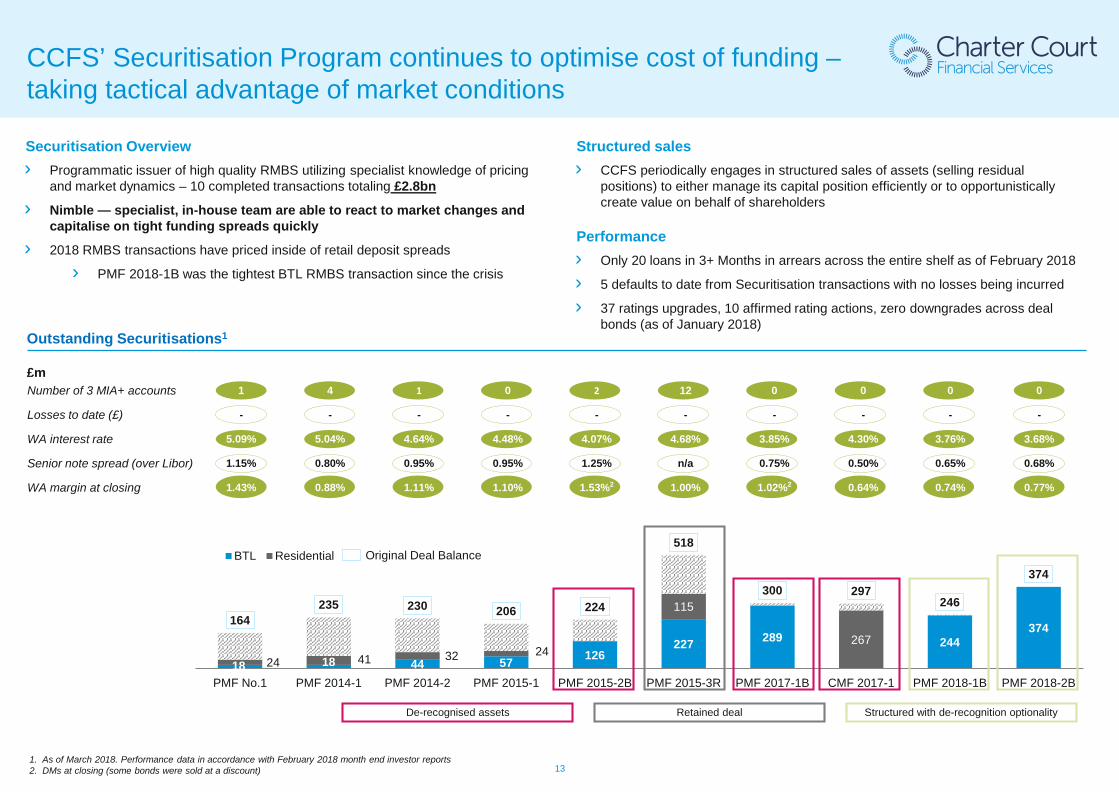
CCFS’ Securitisation Program continues to optimise cost of funding –taking tactical advantage of market conditions
Securitisation Overview› Programmatic issuer of high quality RMBS utilizing specialist knowledge of pricing
and market dynamics – 10 completed transactions totaling £2.8bn
› Nimble — specialist, in-house team are able to react to market changes and capitalise on tight funding spreads quickly
› 2018 RMBS transactions have priced inside of retail deposit spreads
› PMF 2018-1B was the tightest BTL RMBS transaction since the crisis
Outstanding Securitisations1
£mNumber of 3 MIA+ accounts 1 4 1 0 2 12 0 0 0 0
Losses to date (£) - - - - - - - - - -
WA interest rate 5.09% 5.04% 4.64% 4.48% 4.07% 4.68% 3.85% 4.30% 3.76% 3.68%
Senior note spread (over Libor) 1.15% 0.80% 0.95% 0.95% 1.25% n/a 0.75% 0.50% 0.65% 0.68%
WA margin at closing 1.43% 0.88% 1.11% 1.10% 1.53%2 1.00% 1.02%2 0.64% 0.74% 0.77%
Original Deal Balance
Structured sales› CCFS periodically engages in structured sales of assets (selling residual
positions) to either manage its capital position efficiently or to opportunistically create value on behalf of shareholders
Performance› Only 20 loans in 3+ Months in arrears across the entire shelf as of February 2018
› 5 defaults to date from Securitisation transactions with no losses being incurred
› 37 ratings upgrades, 10 affirmed rating actions, zero downgrades across deal bonds (as of January 2018)
1. As of March 2018. Performance data in accordance with February 2018 month end investor reports2. DMs at closing (some bonds were sold at a discount)
De-recognised assets Retained deal Structured with de-recognition optionality
14
IFRS 9 Impacts
52
548
861
422
136
82
304
304
988
1,720
Dec ‘17 IAS 39 Dec ‘17 IFRS 9
Pipeline IBNR Stage 1 Stage 2 Modelled stage 3 / Impaired Special provisions
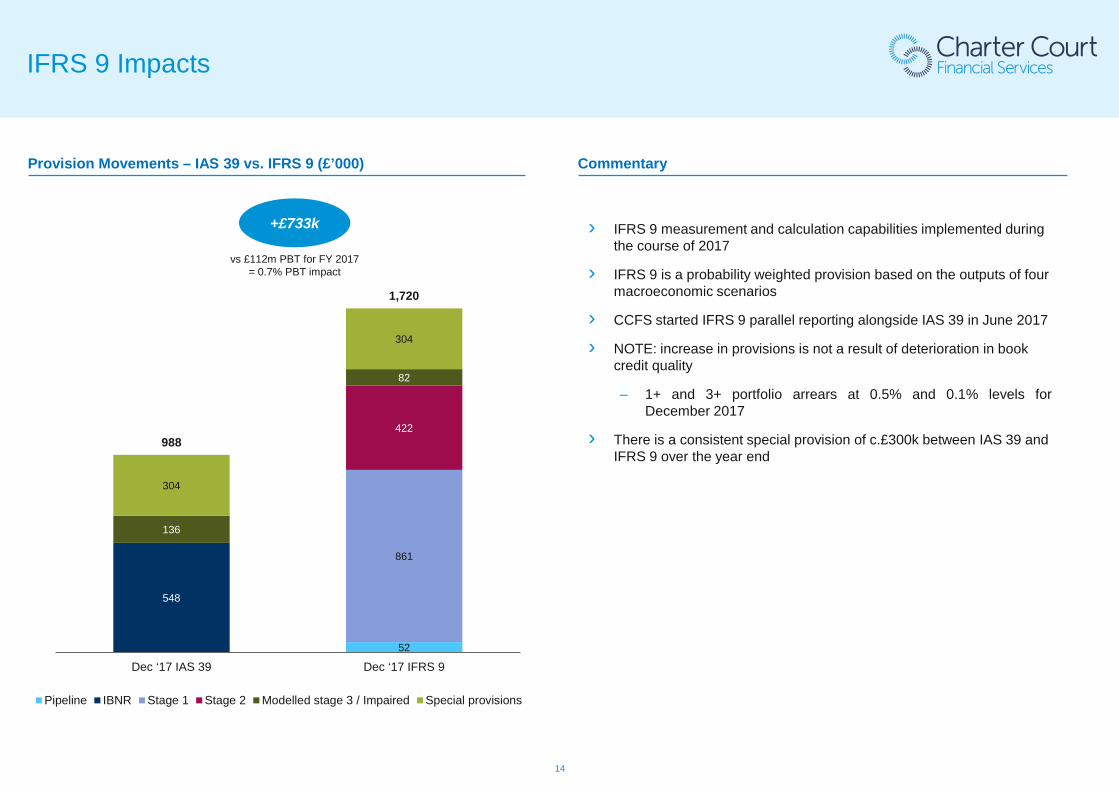
Provision Movements – IAS 39 vs. IFRS 9 (£’000) Commentary
+£733k › IFRS 9 measurement and calculation capabilities implemented during the course of 2017
› IFRS 9 is a probability weighted provision based on the outputs of four macroeconomic scenarios
› CCFS started IFRS 9 parallel reporting alongside IAS 39 in June 2017
› NOTE: increase in provisions is not a result of deterioration in book credit quality
‒ 1+ and 3+ portfolio arrears at 0.5% and 0.1% levels forDecember 2017
› There is a consistent special provision of c.£300k between IAS 39 and IFRS 9 over the year end
vs £112m PBT for FY 2017= 0.7% PBT impact
15
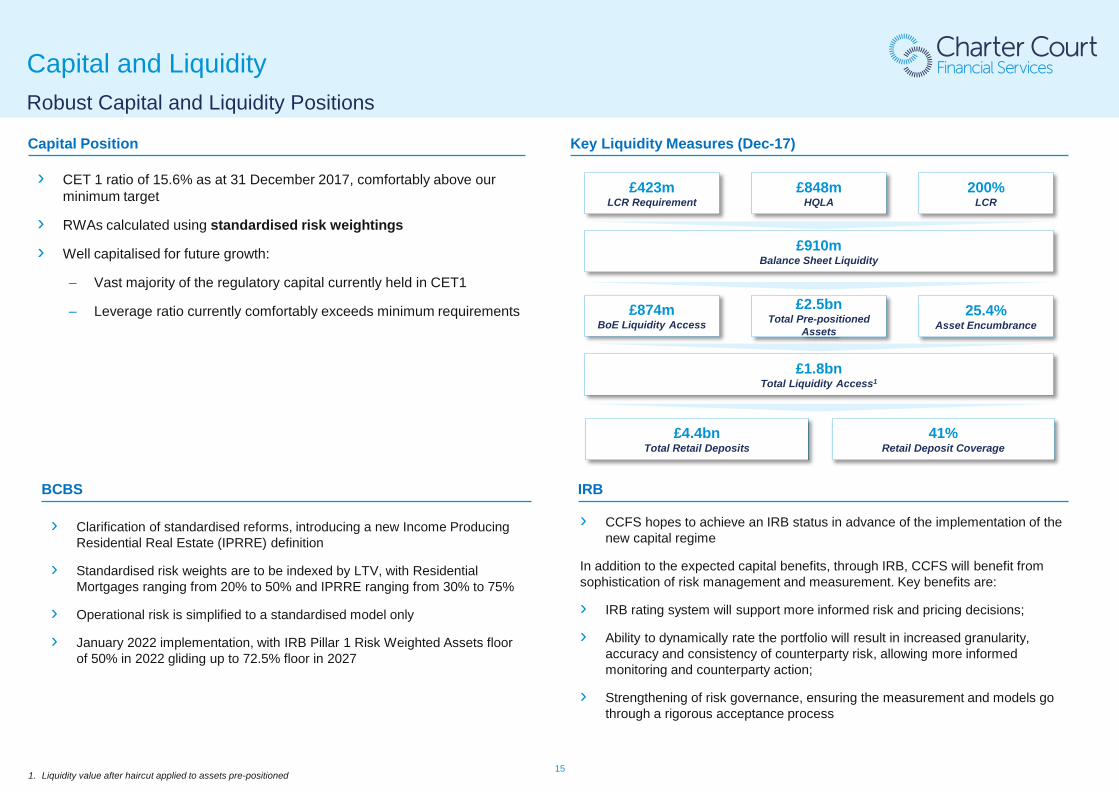
Capital and LiquidityRobust Capital and Liquidity Positions
› CET 1 ratio of 15.6% as at 31 December 2017, comfortably above our minimum target
› RWAs calculated using standardised risk weightings
› Well capitalised for future growth:
‒ Vast majority of the regulatory capital currently held in CET1
‒ Leverage ratio currently comfortably exceeds minimum requirements
Key Liquidity Measures (Dec-17)
1. Liquidity value after haircut applied to assets pre-positioned
£423mLCR Requirement
£848mHQLA
200%LCR
£910mBalance Sheet Liquidity
£2.5bnTotal Pre-positioned
Assets
25.4%Asset Encumbrance
£4.4bnTotal Retail Deposits
41%Retail Deposit Coverage
Capital Position
BCBS IRB
› CCFS hopes to achieve an IRB status in advance of the implementation of the new capital regime
In addition to the expected capital benefits, through IRB, CCFS will benefit from sophistication of risk management and measurement. Key benefits are:
› IRB rating system will support more informed risk and pricing decisions;
› Ability to dynamically rate the portfolio will result in increased granularity, accuracy and consistency of counterparty risk, allowing more informed monitoring and counterparty action;
› Strengthening of risk governance, ensuring the measurement and models go through a rigorous acceptance process
› Clarification of standardised reforms, introducing a new Income Producing Residential Real Estate (IPRRE) definition
› Standardised risk weights are to be indexed by LTV, with Residential Mortgages ranging from 20% to 50% and IPRRE ranging from 30% to 75%
› Operational risk is simplified to a standardised model only
› January 2022 implementation, with IRB Pillar 1 Risk Weighted Assets floor of 50% in 2022 gliding up to 72.5% floor in 2027
£874mBoE Liquidity Access
£1.8bnTotal Liquidity Access1
16
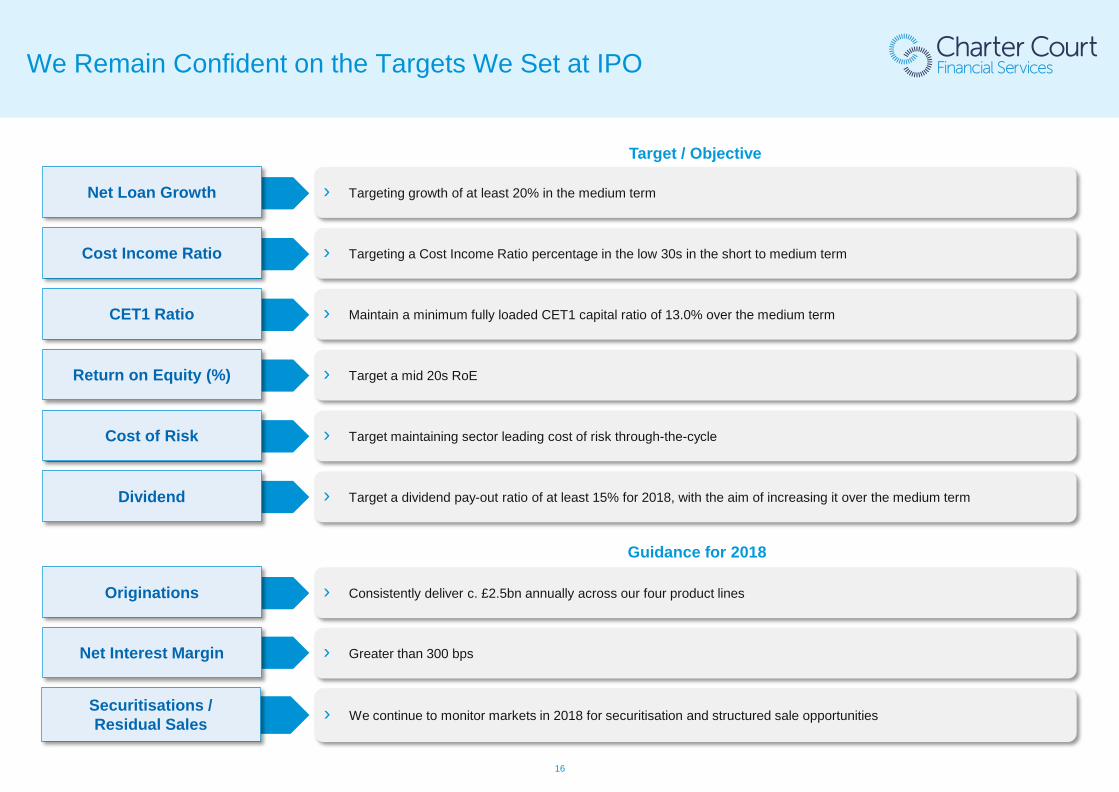
We Remain Confident on the Targets We Set at IPO
Securitisations / Residual Sales › We continue to monitor markets in 2018 for securitisation and structured sale opportunities
Net Loan Growth › Targeting growth of at least 20% in the medium term
› Targeting a Cost Income Ratio percentage in the low 30s in the short to medium termCost Income Ratio
CET1 Ratio › Maintain a minimum fully loaded CET1 capital ratio of 13.0% over the medium term
Return on Equity (%) › Target a mid 20s RoE
Cost of Risk › Target maintaining sector leading cost of risk through-the-cycle
Dividend › Target a dividend pay-out ratio of at least 15% for 2018, with the aim of increasing it over the medium term
Target / Objective
Originations › Consistently deliver c. £2.5bn annually across our four product lines
Net Interest Margin › Greater than 300 bps
Guidance for 2018
17
Corporate Review
Ian Lonergan
Chief Executive Officer
18
Corporate Review & Summary
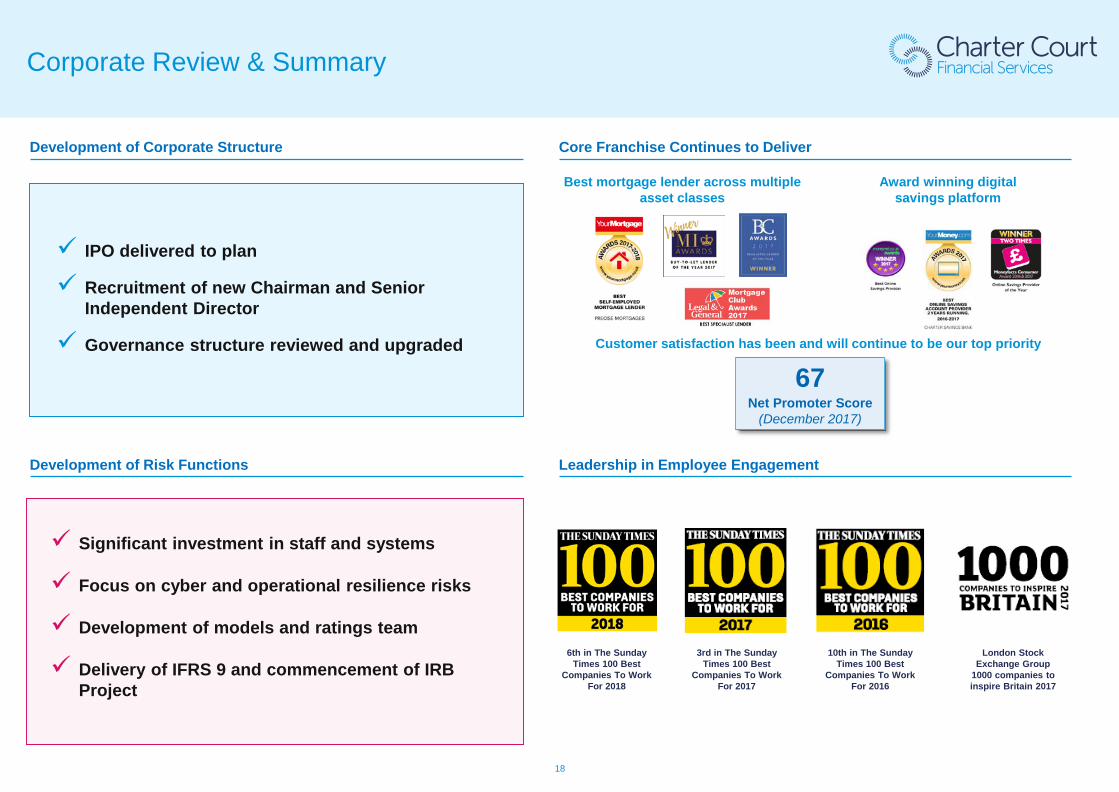
London Stock Exchange Group
1000 companies to inspire Britain 2017
3rd in The Sunday Times 100 Best
Companies To Work For 2017
10th in The Sunday Times 100 Best
Companies To Work For 2016
Development of Corporate Structure Core Franchise Continues to Deliver
67Net Promoter Score
(December 2017)
Development of Risk Functions Leadership in Employee Engagement
Best mortgage lender across multiple asset classes
Award winning digital savings platform
Customer satisfaction has been and will continue to be our top priority
IPO delivered to plan
Recruitment of new Chairman and Senior Independent Director
Governance structure reviewed and upgraded
Significant investment in staff and systems
Focus on cyber and operational resilience risks
Development of models and ratings team
Delivery of IFRS 9 and commencement of IRB Project
6th in The Sunday Times 100 Best
Companies To Work For 2018
19
Second ChargeBridging Loans
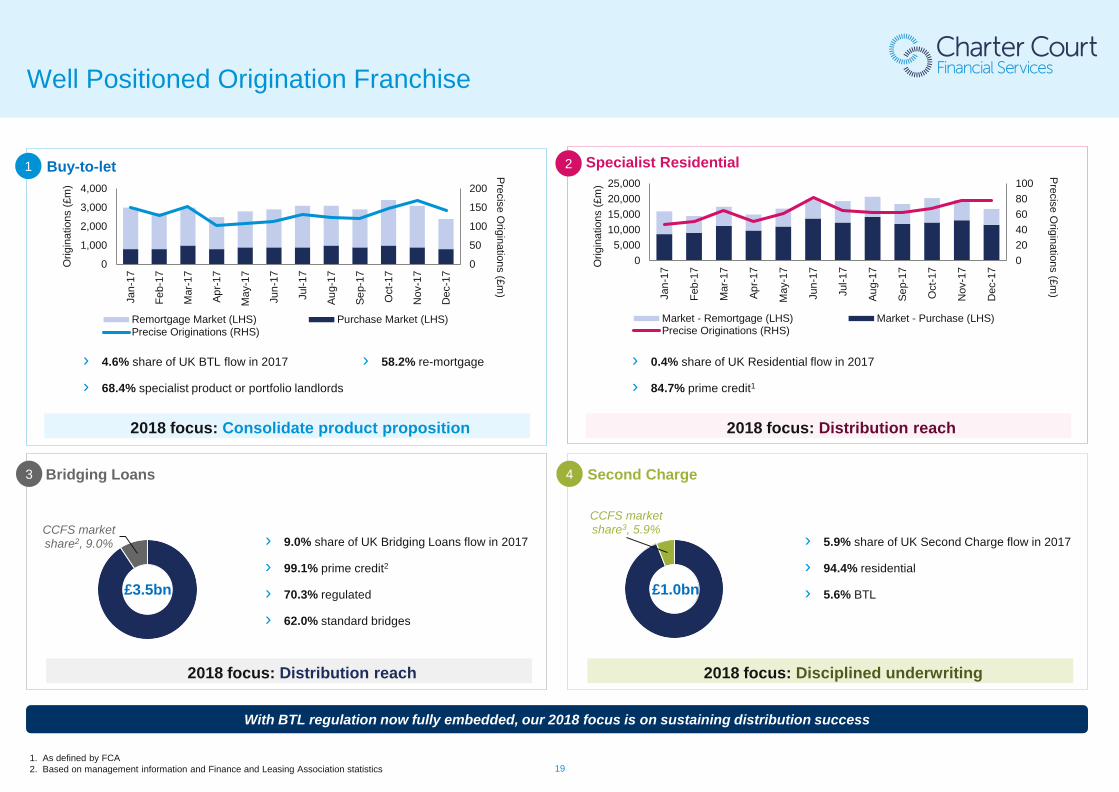
Well Positioned Origination Franchise
Buy-to-let Specialist Residential 1 2
3 4
With BTL regulation now fully embedded, our 2018 focus is on sustaining distribution success
1. As defined by FCA2. Based on management information and Finance and Leasing Association statistics
› 4.6% share of UK BTL flow in 2017
› 68.4% specialist product or portfolio landlords
› 58.2% re-mortgage
Orig
inat
ions
(£m
)
Precise O
riginations (£m)
0
50
100
150
200
0
1,000
2,000
3,000
4,000
Jan-
17
Feb-
17
Mar
-17
Apr-1
7
May
-17
Jun-
17
Jul-1
7
Aug-
17
Sep-
17
Oct
-17
Nov
-17
Dec
-17
Remortgage Market (LHS) Purchase Market (LHS)Precise Originations (RHS)
020406080100
05,000
10,00015,00020,00025,000
Jan-
17
Feb-
17
Mar
-17
Apr-1
7
May
-17
Jun-
17
Jul-1
7
Aug-
17
Sep-
17
Oct
-17
Nov
-17
Dec
-17
Market - Remortgage (LHS) Market - Purchase (LHS)Precise Originations (RHS)
› 0.4% share of UK Residential flow in 2017
› 84.7% prime credit1
› 9.0% share of UK Bridging Loans flow in 2017
› 99.1% prime credit2
› 70.3% regulated
› 62.0% standard bridges
› 5.9% share of UK Second Charge flow in 2017
› 94.4% residential
› 5.6% BTL
2018 focus: Consolidate product proposition 2018 focus: Distribution reach
2018 focus: Distribution reach 2018 focus: Disciplined underwriting
Orig
inat
ions
(£m
)
Precise O
riginations (£m)
CCFS market share2, 9.0%
£3.5bn
CCFS market share3, 5.9%
£1.0bn
20
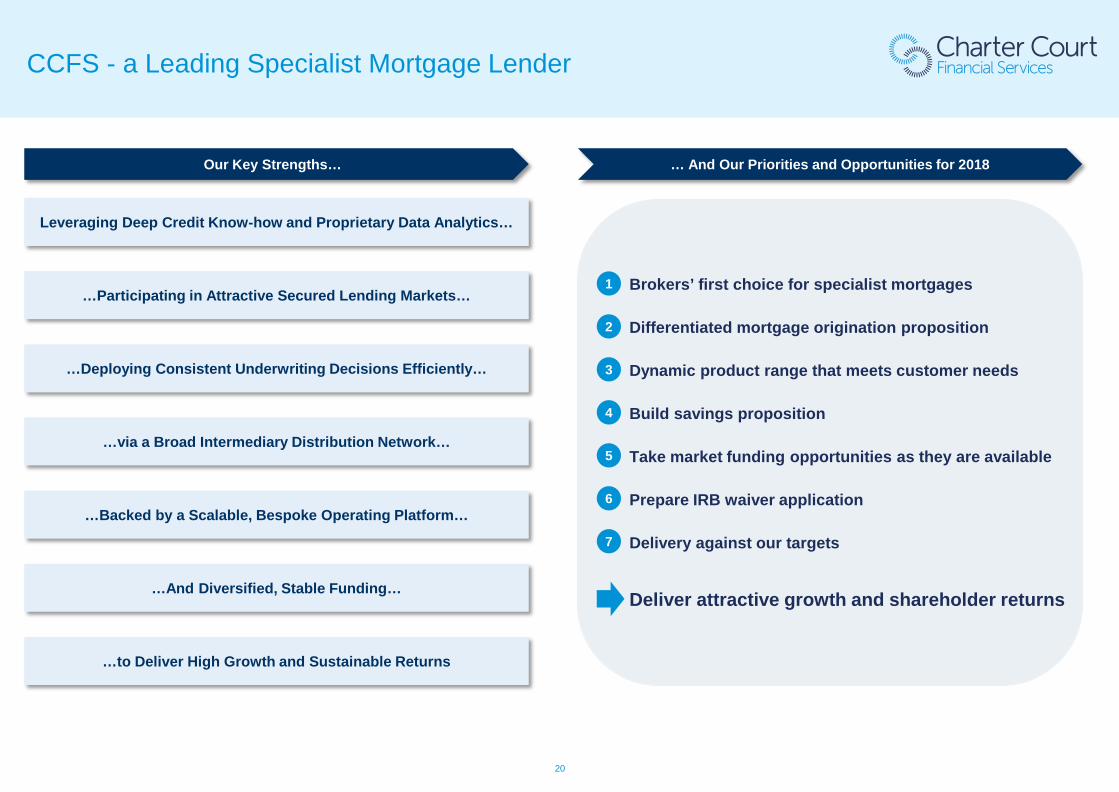
CCFS - a Leading Specialist Mortgage Lender
Our Key Strengths…
Leveraging Deep Credit Know-how and Proprietary Data Analytics…
…Participating in Attractive Secured Lending Markets…
…Deploying Consistent Underwriting Decisions Efficiently…
…via a Broad Intermediary Distribution Network…
…Backed by a Scalable, Bespoke Operating Platform…
…And Diversified, Stable Funding…
…to Deliver High Growth and Sustainable Returns
… And Our Priorities and Opportunities for 2018
1. Brokers’ first choice for specialist mortgages
2. Differentiated mortgage origination proposition
3. Dynamic product range that meets customer needs
4. Build savings proposition
5. Take market funding opportunities as they are available
6. Prepare IRB waiver application
7. Delivery against our targets
8. Deliver attractive growth and shareholder returns
1
2
3
4
5
6
7

21
Q&A