Embed Size (px)
Citation preview
CHARTBOOK ON PATIENT SAFETY
National Healthcare Quality and Disparities Report
Agency for Healthcare Research and Quality Advancing Excellence in Health Care wwwahrqgov
This document is in the public domain and may be used and reprinted without permission
Citation of the source is appreciated Suggested citation National Healthcare Quality and
Disparities Report chartbook on patient safety Rockville MD Agency for Healthcare Research
and Quality March 2016 AHRQ Pub No 16-0015-2-EF
NATIONAL HEALTHCARE QUALITY AND DISPARITIES REPORT PATIENT SAFETY CHARTBOOK
US DEPARTMENT OF
HEALTH AND HUMAN SERVICES
Agency for Healthcare Research and Quality
540 Gaither Road
Rockville MD 20850
AHRQ Publication No 16-0015-2-EF
March 2016
wwwahrqgovresearchfindingsnhqrdrindexhtml
ACKNOWLEDGMENTS
The National Healthcare Quality and Disparities Report is the product of collaboration among agencies
across the Department of Health and Human Services (HHS) Many individuals guided and contributed to
these reports Without their magnanimous support the reports would not have been possible
Specifically we thank
Authors Susan Raetzman (lead author-Truven Health Analytics) Darryl Gray (AHRQ) Sharl Talan
(Truven Health Analytics) Kathleen Whitley (Truven Health Analytics) Naomi Yount (Westat)
Primary AHRQ Staff Richard Kronick Jeffrey Brady Amy Helwig Ernest Moy Barbara Barton
Darryl Gray Nancy Wilson Irim Azam Diane Cousins Noel Eldridge Sebastiana Gianci Melissa
Miller Kamila Mistry William Munier and Doreen Bonnett
HHS Interagency Workgroup for the NHQRNHDR Girma Alemu (HRSA) Chisara N Asomugha
(CMS) Kirsten Beronio (ASPE) Nancy Breen (NCI) Miya Cain (ACF) Victoria Cargill (NIH) Steven
Clauser (NCI) Wayne Duffus (CDC) Olinda Gonzalez (SAMHSA) Kirk Greenway (IHS) Chris Haffer
(CMS-OMH) Linda Harlan (NCI) Rebecca Hines (CDC-NCHS) Edwin Huff (CMS) Deloris Hunter
(NIH) Sonja Hutchins (CDC) Ruth Katz (ASPE) Tanya Telfair LeBlanc (CDC) Shari Ling (CMS)
Darlene Marcoe (ACF) Tracy Matthews (HRSA) Karen McDonnell(CMS) Curt Mueller (HRSA)
Karen Nakano (CMS) Iran Naqvi (HRSA) Ann Page (ASPE) Kimberly Proctor (CMS-OMH) DEB
Potter (ASPE) Asel Ryskulova (CDC-NCHS) Adelle Simmons (ASPE) Alan Simon (CDC-NCHS)
Marsha Smith (CMS) Caroline Taplin (ASPE) Emmanuel Taylor (NCI) Sayeedha Uddin (CDC-NCHS)
Nadarajen Vydelingum (NIH) Chastity Walker (CDC) Barbara Wells (NHLBI) Valerie Welsh (OASH-
OMH) and Tia Zeno (ASPE)
Data Support Contractors Social amp Scientific Systems Truven Health Analytics Westat
Other Data Contributors American College of Surgeons National Surgical Quality Improvement
Program Pennsylvania Patient Safety Authority Veterans Health Administration
PATIENT SAFETY
This Patient Safety Chartbook is part of a family of documents and tools that support the
National Healthcare Quality and Disparities Reports (QDR) The QDR are annual reports to
Congress mandated in the Healthcare Research and Quality Act of 1999 (PL 106-129) These
reports provide a comprehensive overview of the quality of health care received by the general
US population and disparities in care experienced by different racial ethnic and socioeconomic
groups The purpose of the reports is to assess the performance of our health system and to
identify areas of strengths and weaknesses in the health care system along three main axes
access to health care quality of health care and priorities of the National Quality Strategy
The reports are based on more than 250 measures of quality and disparities covering a broad
array of health care services and settings Data are generally available through 2013 although
rates of uninsurance have been tracked through the first half of 2015 The reports are produced
with the help of an Interagency Work Group led by the Agency for Healthcare Research and
Quality (AHRQ) and submitted on behalf of the Secretary of Health and Human Services (HHS)
Chartbooks Organized Around Priorities of the National Quality Strategy
1 Making care safer by reducing harm caused in the delivery of care
2 Ensuring that each person and family is engaged as partners in their care
3 Promoting effective communication and coordination of care
4 Promoting the most effective prevention and treatment practices for the leading causes of
mortality starting with cardiovascular disease
5 Working with communities to promote wide use of best practices to enable healthy living
6 Making quality care more affordable for individuals families employers and governments
by developing and spreading new health care delivery models
Patient Safety is one of the six national priorities identified by the National Quality Strategy
(httpwwwahrqgovworkingforqualityindexhtml)
The National Quality Strategy has identified three long-term goals related to patient safety
reduce preventable hospital admissions and readmissions reduce the incidence of adverse health
care-associated conditions and reduce harm from inappropriate or unnecessary care
This chartbook focuses on adverse health care-associated conditions and harm from care
Preventable admissions and readmissions can result from problems with patient safety or
problems with care coordination We have chosen to include measures of preventable admissions
and readmissions in the Care Coordination chartbook
National Healthcare Quality and Disparities Report | 1
Patient Safety
Chartbook Contents
This chartbook includes
Summary of trends across measures of Patient Safety from the QDR
Figures illustrating select measures of Patient Safety
Introduction and Methods contains information about methods used in the chartbook A Data
Query tool (httpnhqrnetahrqgovinhqrdrdataquery) provides access to all data tables
Summary of Trends Across National Quality Strategy Priorities
Number and percentage of all quality measures that are improving not changing or worsening through 2013 overall and by NQS priority
110
16
19 35 2118
62
3
10 18 1313
19 1 2 5 36
0
20
40
60
80
100
Total (n=191) Person-Centered Care
(n=20)
Patient Safety(n=31)
Healthy Living(n=58)
EffectiveTreatment
(n=37)
CareCoordination
(n=37)
Improving No Change Worsening
Key n = number of measures
Note For most measures trend data are available from 2001-2002 to 2012 For each measure with at least four
estimates over time weighted log-linear regression is used to calculate average annual percentage change and to assess statistical significance Measures are aligned so that positive change indicates improved access to care
Improving = Rates of change are positive at 1 per year or greater and are statistically significant
No Change = Rate of change is less than 1 per year or is not statistically significant
Worsening = Rates of change are negative at -1 per year or greater and are statistically significant
2 | National Healthcare Quality and Disparities Report
Patient Safety
Through 2013 across a broad spectrum of measures of health care quality 60 showed
improvement (black)
About 80 of measures of Person-Centered Care improved
About 60 of measures of Effective Treatment Healthy Living and Patient Safety
improved
Fewer than half of measures of Care Coordination improved
There are insufficient numbers of reliable measures of Care Affordability to summarize in
this way
Summary of Quality Disparities
Number and percentage of patient safety measures for which members of selected groups experienced better same or worse quality of care compared with reference group
28
123
11
8
19
16 1117
814
103 6
0
20
40
60
80
100
Poor vs HighIncome (n=18)
Black vs White(n=41)
Asian vs White(n=38)
AIAN vs White(n=17)
Hispanic vsWhite (n=34)
Better Same Worse
Key AIAN = American Indian and Alaska Native n = number of measures
Note Poor indicates family income less than the Federal poverty level High Income indicates family income four
times the Federal poverty level or greater Numbers of measures differ across groups because of sample size limitations For most measures data from 2012 are shown The relative difference between a selected group and its reference group is used to assess disparities
Better = Selected group received better quality of care than reference group Differences are statistically
significant are equal to or larger than 10 and favor the selected group
Same = Selected group and reference group received about the same quality of care Differences are not
statistically significant or are smaller than 10
Worse = Selected group received worse quality of care than reference group Differences are statistically
significant are equal to or larger than 10 and favor the reference group
National Healthcare Quality and Disparities Report | 3
Patient Safety
People in poor households received worse care than people in high-income households for
about 45 of patient safety measures
Blacks received worse care than Whites for about 20 of patient safety measures and
Asians received worse care than Whites for about 30 of patient safety measures
Patient Safety Measures With Disparities That Were Getting Smaller Over Time
Note Bold indicates disparities that were eliminated
Black vs White Gap
Admissions with central venous catheter-related bloodstream infection per 1000 medical
and surgical discharges of length 2 or more days
Postoperative pulmonary embolism or deep vein thrombosis per 1000 surgical admissions
Postoperative respiratory failure per 1000 elective-surgery admissions
Admissions with iatrogenic pneumothorax per 1000 discharges
Poor vs High Income Gap
Admissions with accidental puncture or laceration during procedure per 1000 medical
and surgical admissions age less than 18 years
Hispanic vs Non-Hispanic White Gap
Adult surgery patients with postoperative catheter-associated urinary tract infection
Asian vs White Gap
Deaths per 1000 elective-surgery admissions having developed specified complications
of care during hospitalization
Patient Safety Measures That Developed New Disparities
Asian vs White Gap
Accidental puncture or laceration during procedure per 1000 medical and surgical
admissions age 18 and over
Home health care patients who get better at taking their medication correctly
Obstetric trauma per 1000 instrument-assisted vaginal deliveries
Hispanic vs Non-Hispanic White Gap
Postoperative physiologic and metabolic derangements per 1000 elective-surgery admissions
4 | National Healthcare Quality and Disparities Report
Patient Safety
Measures of Patient Safety
Summary of information on patient safety from the National Healthcare Quality and
Disparities Report
Individual measures of patient safety overall and by age sex race ethnicity income
education insurance birth weight health status and presence of various health conditions
Measures of patient safety by setting
Hospitals
Nursing homes
Home health
Ambulatory care
All settings Infrastructure
Patient Safety in the Hospital Setting
Hospitals are a common setting for patient safety events
Many patients admitted to the hospital are in a clinically compromised state
Care often includes the use of invasive devices and procedures increasing patientsrsquo risk
for infection and harm
Measures include
Overall hospital-acquired conditions (HACs)
Healthcare-associated infections (HAIs)
Procedure-related events
National Healthcare Quality and Disparities Report | 5
Patient Safety
6 | National Healthcare Quality and Disparities Report
Distribution of Hospital-Acquired Conditions
Importance Hospital-acquired conditions (HACs) are conditions that patients did not have upon hospital admission but which developed during the patientrsquos hospital stay They can lead to poor patient outcomes and increased spending on health care HACs are often preventable
Overall Rate
In 2014 the overall HAC rate was 121 per 1000 hospital discharges Adverse drug events (414 per 1000 hospital discharges) accounted for 342 of total HACs and pressure ulcers (309 per 1000 hospital discharges) accounted for 255 of the total
Trends
From 2010 through 2014 the overall rate of hospital-acquired conditions declined 17 from 145 to 121 per 1000 hospital discharges
Among the most frequent HACs between 2010 and 2014 the rate of pressure ulcers decreased the most from 403 per 1000 discharges (more than 13 million events) to 309 per 1000 discharges (about 1 million events)
403 404 394 325 309
495 487 419403 414
122 113106
88 76
79 7872
72 79
81 7374
69 67
273 267257
251 266
0
20
40
60
80
100
120
140
160
2010 2011 2012 2013 2014
Rat
e p
er 1
00
0 D
isch
arge
s
Pressure Ulcers Adverse DrugEvents
Catheter-AssociatedUrinary Tract Infections
Falls Lower FrequencyHACs
All Other HACs
145 142132
121 121
Source Agency for Healthcare Research and Quality (AHRQ) Medicare Patient Safety Monitoring System 2010-2014 Healthcare Cost and
Utilization Project Nationwide Inpatient Sample 2010-2013 Centers for Disease Control and Prevention National Healthcare Safety Network
2010-2013
Denominator Adult hospital discharges age 18 and over
Note Lower Frequency HACs (lt31000 discharges) include central line-associated bloodstream infections venous thromboembolisms surgical
site infections obstetric adverse events and ventilator-associated pneumonia All Other Hospital-Acquired Conditions includes inadvertent femoral
artery puncture for catheter angiographic procedures adverse event associated with hip joint replacement adverse event associated with knee
joint replacement contrast nephropathy associated with catheter angiography methicillin-resistant Staphylococcus aureus (MRSA) vancomycin-
resistant Enterococcus (VRE) C difficile mechanical complications associated with central venous catheters postoperative cardiac events for
cardiac and noncardiac surgeries postoperative pneumonia iatrogenic pneumothorax postoperative hemorrhage or hematoma postoperative
respiratory failure and accidental puncture or laceration For more information on methods see httpwwwahrqgovprofessionalsquality-patient-
safetypfpinterimhacrate2014html
Distribution of hospital-acquired conditions based on national rates per 1000 adult hospital discharges 2010-2014
Patient Safety
During that same period adverse drug events decreased from a rate of 495 per 1000
discharges (more than 16 million events) to 414 per 1000 discharges (fewer than 14
million events) The catheter-associated urinary tract infection rate decreased from 122
to 76 per 1000 discharges (400000 and 250000 events respectively)
Among the less frequent HACs central line-associated bloodstream infections had the
greatest percentage decrease in rate (67) between 2010 and 2014 The rates of venous
thromboembolism (44) surgical site infections (17) and obstetric events (4) also
decreased
Healthcare-Associated Infections
Infections acquired during a hospital stay are among the most common complications of
hospital care
On any given day about 1 in 25 hospital patients has at least one healthcare-associated
infection (HAI) (CDC 2016)
HAIs often increase the patientrsquos length of stay in the hospital risk of mortality and hospital
costs
New infections in critically ill infants children and other patients generally reduce their
chances for recovery
For more information see the PSNet link to Patient Safety Primer Health Care-Associated
Infections at httpspsnetahrqgovprimersprimer7
Measures of Patient Safety in the Hospital Setting HAIs
Postoperative sepsis per 1000 adult discharges with an elective operating room procedure
Standardized infection ratios (SIRs) for central line-associated bloodstream infections
surgical site infections and catheter-associated urinary tract infections (CAUTIs)
SIRs compare the observed number of infections reported to the National Healthcare
Safety Network (NHSN) during a year to the predicted number of infections based on the
January 2006 to December 2008 referent period for central line-associated bloodstream
infections (CLABSIs) and surgical site infections (SSIs) and the calendar year 2009
referent period for CAUTIs
Change in SIRs for CAUTIs
Bloodstream infections per 1000 central-line days
In neonatal intensive care units (NICUs)
In adult intensive care units
National Healthcare Quality and Disparities Report | 7
Patient Safety
Postoperative Sepsis
Postoperative sepsis per 1000 adult discharges with an elective operating room procedure by sex and insurance status 2008-2013
Source Agency for Healthcare Research and Quality (AHRQ) Healthcare Cost and Utilization Project Nationwide Inpatient Sample 2008-
2013 and AHRQ Quality Indicators version 44
Denominator All elective hospital surgical discharges for patients age 18 years and over with length of stay of 4 or more days excluding
patients admitted for infection those with cancer or immunocompromised states those with obstetric conditions and admissions specifically for
sepsis
Note For this measure lower rates are better Acute care hospitalizations only Rates are adjusted by age sex age-sex interactions
comorbidities major diagnostic category diagnosis-related group and transfers into the hospital
0
5
10
15
20
25
2008 2009 2010 2011 2012 2013
Rat
e p
er
10
00
Dis
char
ges
Total Male Female
0
5
10
15
20
25
2008 2009 2010 2011 2012 2013
Rat
e p
er
10
00
Dis
char
ges
Private MedicareMedicaid Uninsured
Overall Rate In 2013 the postoperative sepsis rate was 143 per 1000 adult discharges with
an elective operating room procedure
Groups With Disparities
In 2013 female patients had a lower rate of postoperative sepsis than male patients
Also in 2013 patients with Medicaid and those with Medicare had worse sepsis rates
than privately insured patients
From 2008 to 2013 there were no statistically significant changes in the gap between
males and females
From 2008 to 2013 there were no statistically significant changes in the gap between
privately insured patients and other insurance groups
8 | National Healthcare Quality and Disparities Report
Patient Safety
Standardized Infection Ratios
Standardized infection ratios for central line-associated bloodstream infections and surgical site infections 2009-2013 and catheter-associated
urinary tract infections 2010-2013
Key CLABSI = central line-associated bloodstream infection SSI = surgical site infection SCIP = Surgical Care Improvement Project CAUTI =
catheter-associated urinary tract infection
Source Centers for Disease Control and Prevention National Center for Emerging and Zoonotic Infectious Diseases 2013 National and State
Healthcare Associated Infections Progress Report and National Healthcare Safety Network 2009ndash2013
Note For this measure lower numbers are better Acute care hospitalizations only CAUTI excludes neonatal intensive care units
00
02
04
06
08
10
12
14
2009 2010 2011 2012 2013
Stan
dar
diz
ed
Infe
ctio
n R
atio
CLABSI All SSI Combined SCIP Procedures CAUTI All
Background SIRs compare the observed number of infections reported to the NHSN during
a year to the predicted number of infections based on the January 2006 to December 2008
referent period for CLABSIs and SSIs and the calendar year 2009 referent period for
CAUTIs For example a ratio of 81 for SSIs in 2013 indicates that 19 fewer SSIs were
observed in 2013 than predicted based on the 2006-2008 baseline period Data are from all
intensive care units wards and other non-critical care locations CLABSI data also include
neonatal intensive care units but exclude long-term acute care hospitals and inpatient
rehabilitation facilities SCIP procedures are those performed on adults Number of facilities
reporting to NHSN roughly tripled from 2009 to 2013 Procedures include abdominal aortic
aneurysm repair peripheral vascular bypass surgery coronary artery bypass graft with both
chest and donor site incisions or with chest incision only other cardiac surgery colon
surgery rectal surgery hip arthroplasty abdominal hysterectomy knee arthroplasty and
vaginal hysterectomy
Overall Rate In 2013 the overall SIR for CLABSIs among intensive care units in the 50
States District of Columbia and Puerto Rico was 054 and the overall SIR for CAUTIs was
106 The overall SIR for SSIs following 10 common procedures in adults was 081
Trends From 2009 to 2013 the SIR for CLABSIs improved and from 2010 to 2013 the
SIR for CAUTIs worsened for facilities reporting to NHSN
National Healthcare Quality and Disparities Report | 9
Patient Safety
Change in Statewide SIRs
Change from 2012 to 2013 in Statewide SIRs for CAUTI
Key CAUTI = catheter-associated urinary tract infection NHSN = National Healthcare Safety Network
Source Centers for Disease Control and Prevention National Center for Emerging and Zoonotic Infectious Diseases 2013 National and State
Healthcare Associated Infections Progress Report
Note For this measure lower numbers are better Changes in SIRs are categorized as ldquono changerdquo if they are not statistically significant Acute
care hospitalizations only Excludes neonatal intensive care units For this measure District of Columbia and Puerto Rico are treated as States
No Change
Increase
Indicates State mandate
in 2013 to report CAUTI
to NHSN
Decrease
AKAK
HI PR
AZ
CA
UT
CT
FL
GA
IA
IL
KS
MA
MDMO
NJ
NY
OR
PA
SCTN
CO
WA
WI
VA
ME
MN
MI
NC
TX
KY
WV
RI
NE
VT
NVOH
SD
AR
IN
NH
MT
ID
WY
ND
NM
OK
LA
MS AL
DE
DC
Geographic Variation In 2013 31 States had SIRs greater than 1 indicating that on average
their hospitals had more CAUTIs than hospitals of similar type and size during the 2009
referent period The States were Alaska Arkansas Arizona Connecticut District of Columbia
Delaware Georgia Idaho Indiana Kansas Kentucky Massachusetts Maryland Maine
Michigan Minnesota Missouri Mississippi North Carolina New Jersey Nevada New York
Oregon Pennsylvania Rhode Island South Carolina Tennessee Texas Utah Virginia and
Washington
Trends Of 52 reporting States 33 had no change from 2012 to 2013 in CAUTI SIRs 9
decreased and 10 increased
Toolkit for Reducing Catheter-Associated Urinary Tract Infections in Hospitals
Purpose To help hospitals prevent catheter-associated urinary tract infections (CAUTIs) and
improve safety culture
Method Implementing evidence-based practical resources and concepts from the
Comprehensive Unit-based Safety Program
Intended User Hospital facilities
Available Tools Guides checklists webinars learning modules data interpretation guides
10 | National Healthcare Quality and Disparities Report
Patient Safety
Potential Measures of Effectiveness
Number of symptomatic CAUTIs attributable to each unit by month
Days since last CAUTI
Link httpwwwahrqgovprofessionalsquality-patient-safetyhaistoolscautishy
hospitalsIndexhtml
Central Line-Associated Bloodstream Infections in Neonatal Intensive Care Units
Central line-associated bloodstream infections per 1000 central-line days by birth weight of child in Level III neonatal intensive care units and by type
of pediatric ICU 2009-2013
Source Centers for Disease Control and Prevention National Healthcare Safety Network 2009-2013
Denominator Infections per 1000 central-line days
Note For this measure lower rates are better Acute care hospitalizations only
00
05
10
15
20
25
30
35
40
2009 2010 2011 2012 2013
Rat
e p
er
10
00
Ce
ntr
al-
Lin
e D
ays
le750 g 751-1000 g1001-1500 g 1501-2500 ggt2500 g
Level III Neonatal ICUs
00
05
10
15
20
25
30
35
40
2009 2010 2011 2012 2013
Rat
e p
er
10
00
Ce
ntr
al-
Lin
e D
ays
Pediatric Cardiothoracic ICUPediatric Medical ICUPediatric MedicalSurgical ICU
Pediatric ICUs
Central line-associated bloodstream infections per 1000 central-line days by birth weight of child in Level III neonatal intensive care units and by type
of pediatric ICU 2009-2013
Source Centers for Disease Control and Prevention National Healthcare Safety Network 2009-2013
Denominator Infections per 1000 central-line days
Note For this measure lower rates are better Acute care hospitalizations only
00
05
10
15
20
25
30
35
40
2009 2010 2011 2012 2013
Rat
e p
er
10
00
Ce
ntr
al-
Lin
e D
ays
le750 g 751-1000 g1001-1500 g 1501-2500 ggt2500 g
Level III Neonatal ICUs
00
05
10
15
20
25
30
35
40
2009 2010 2011 2012 2013
Rat
e p
er 1
000
Cen
tral
-Lin
e D
ays
Pediatric Cardiothoracic ICUPediatric Medical ICUPediatric MedicalSurgical ICU
Pediatric ICUs
Overall Rates
In 2013 among patients in Level III NICUs pooled mean CLABSI rates ranged from a
low of 06 infections per 1000 central-line days among neonates born at 1501 to 2500
grams to a high of 21 infections per 1000 central-line days among neonates born at less
than or equal to 750 grams
Trends
The rate of CLABSI among pediatric cardiothoracic ICUs was 25 in 2009 and 13 in
2013 among pediatric medical ICUs 26 in 2009 and 08 in 2013 and among pediatric
medicalsurgical ICUs 22 in 2009 and 12 in 2013
National Healthcare Quality and Disparities Report | 11
Patient Safety
Central Line-Associated Bloodstream Infections in Adult Intensive Care Units
Central linendashassociated bloodstream infections per 1000 central-line days in adult medical vs medicalsurgical intensive care units by hospital teaching
status 2006ndash2013
Source Centers for Disease Control and Prevention National Healthcare Safety Network 2006-2013
Denominator Infections per 1000 central-line days
Note For this measure lower rates are better Acute care hospitalizations only Major teaching facilities are defined as facilities with a program
for medical students and postgraduate medical training All other medical facilities include graduate facilities with programs for postgraduate
medical training only (ie residency andor fellowships) and undergraduate facilities with programs for medical students only
00
05
10
15
20
25
30
2006-2008 2009 2010 2011 2012 2013
Rat
e p
er
10
00
Ce
ntr
al-L
ine
Day
s
Major Teaching Medical ICU All Others Medical ICU
Major Teaching MedicalSurgical ICU All Others MedicalSurgical ICU
Trends
Between 2006-2008 (combined) and 2013 there was a 46 decrease in CLABSIs (data
not shown)
From 2006-2008 (combined) to 2013 rates of CLABSIs in hospitals decreased 538
among adult medical ICU patients in hospitals with major teaching programs 476
among adult medicalsurgical ICU patients in hospitals with major teaching programs
421 among adult medical ICU patients in all other hospitals and 467 among adult
medicalsurgical ICU patients in all other hospitals
Tools for Reducing Central Line-Associated Bloodstream Infections
Purpose To help hospitals prevent central line-associated bloodstream infections (CLABSIs)
and improve safety culture
Methods Implementing evidence-based practical resources and concepts from the
Comprehensive Unit-based Safety Program (CUSP)
Intended user Hospital facilities
Available tools Checklists preventable incidence calculator audit form event report
template
12 | National Healthcare Quality and Disparities Report
Patient Safety
Impact
Through use of the CUSP toolkit and CLABSI tools more than 100 intensive care units
in Michigan have nearly eliminated CLABSIs
Nationwide the use of this toolkit has helped more than 1000 hospitals reduce rates of
CLABSI by 41 in aggregate See httpwwwahrqgovworkingforqualitypias
mhhakcpiahtm and httpwwwahrqgovprofessionalseducationcurriculumshy
toolsclabsitoolsindexhtmlpurpose
Procedure-Related Events
More than 40 million operative procedures are performed in the United States each year
Postoperative adverse events are not uncommon and increase both hospitalization length and
cost (AHRQ 2013)
Measures include
Risk-adjusted mortality at 30 days postoperation for colorectal surgery performed in
adults
Percentage of adult patients receiving hip joint replacement (because of fracture or
degenerative conditions) who experienced adverse events
Percentage of adults with mechanical adverse events associated with central venous
catheter placement
Postoperative Mortality
Risk-adjusted mortality rate within 30 days postoperation for adults undergoing colorectal surgery in ACS NSQIP participating hospitals in the United States by
raceethnicity and hospital teaching status 2008-2014
0
1
2
3
4
5
6
Pe
rce
nt
Teaching Nonteaching
Source American College of Surgeons (ACS) National Surgical Quality Improvement Program (NSQIP) 2008-2014
Denominator Adults age 18 years and over
Note For this measure lower percentages are better The participation in the ACS NSQIP is voluntary and current participation is weighted
when calculating rates Participating hospitals have changed over time 203 hospitals participated in 2008 and 531 hospitals participated in
2014 Other includes Asian American Indian or Alaska Native and Native Hawaiian or Other Pacific Islander White Black and Other are non-
Hispanic Hispanic includes all races
0
1
2
3
4
5
6
Pe
rce
nt
Total White Black Hispanic Other
National Healthcare Quality and Disparities Report | 13
Patient Safety
Importance Colorectal procedures have high rates of postoperative complications
Nonadherence to evidence-based best practices is associated with an increased risk of these
complications (Arriaga et al 2009)
Overall Rate In 2014 the risk-adjusted mortality rate was 31 among patients undergoing
colorectal surgeries at ACS NSQIP participating hospitals
Trends From 2008 to 2014 30-day postoperative mortality after colorectal surgery
improved
Groups With Disparities
In 2014 the percentage of patients with 30-day postoperative mortality was worse for
Blacks (36) compared with Whites (30)
From 2008 to 2014 there were no statistically significant changes in the gap between
minority groups and Whites in the percentage of patients with 30-day postoperative
mortality
Adverse Events After Hip Joint Replacement
Adult patients receiving hip joint replacement due to fracture or degenerative conditions who experienced adverse events by age and chronic obstructive
pulmonary disease 2009-2013
02468
101214161820
2009 2010 2011 2012 2013
Pe
rce
nt
Total 65-74 75-84 85+
02468
101214161820
2009 2010 2011 2012 2013
Pe
rce
nt
COPD No COPD
Key COPD = chronic obstructive pulmonary disease
Source Agency for Healthcare Research and Quality (AHRQ) and Centers for Medicare amp Medicaid Services (CMS) Medicare Patient Safety
Monitoring System (MPSMS) 2009-2013
Denominator All patients age 18 years and over in the MPSMS sample who had a surgical procedure performed to replace a hip joint due to
degenerative conditions or a fractured hip
Note For this measure lower percentages are better Hospitals in Puerto Rico the Virgin Islands and Maryland were not included in the
annual samples Samples were drawn from the CMS Hospital Inpatient Quality Reporting program and consist of medical records for
discharges following hip arthroplasty procedures as defined by the Surgical Care Improvement Project Rates for patients age 85 years and
over in 2013 and for ages 18-64 years old for all years are not shown because the data did not meet the criteria for statistical reliability data
quality or confidentiality COPD status relates to patients with a principal or secondary discharge diagnosis of COPD
Adult patients receiving hip joint replacement due to fracture or degenerative conditions who experienced adverse events by age and chronic obstructive
pulmonary disease 2009-2013
02468
101214161820
2009 2010 2011 2012 2013
Pe
rce
nt
Total 65-74 75-84 85+
02
4
68
10
12
1416
18
20
2009 2010 2011 2012 2013
Pe
rce
nt
COPD No COPD
Key COPD = chronic obstructive pulmonary disease
Source Agency for Healthcare Research and Quality (AHRQ) and Centers for Medicare amp Medicaid Services (CMS) Medicare Patient Safety
Monitoring System (MPSMS) 2009-2013
Denominator All patients age 18 years and over in the MPSMS sample who had a surgical procedure performed to replace a hip joint due to
degenerative conditions or a fractured hip
Note For this measure lower percentages are better Hospitals in Puerto Rico the Virgin Islands and Maryland were not included in the
annual samples Samples were drawn from the CMS Hospital Inpatient Quality Reporting program and consist of medical records for
discharges following hip arthroplasty procedures as defined by the Surgical Care Improvement Project Rates for patients age 85 years and
over in 2013 and for ages 18-64 years old for all years are not shown because the data did not meet the criteria for statistical reliability data
quality or confidentiality COPD status relates to patients with a principal or secondary discharge diagnosis of COPD
Importance Hip replacement is most common among older adults who have an increased
risk of adverse events after these surgeries
14 | National Healthcare Quality and Disparities Report
Patient Safety
Overall Percentage In 2013 49 of patients receiving a hip joint replacement experienced
an adverse event
Trends From 2009 to 2013 the overall percentage of adverse events improved for patients
who had a hip joint replacement due to fracture or degenerative conditions
Groups With Disparities
In 2013 there were no statistically significant differences by age or COPD status in the
percentage of hip replacement patients who had adverse events
From 2009 to 2013 there were no statistically significant changes in the gap between
patients age 75 and over and those ages 65-74 in adverse event frequencies Similarly
there were no statistically significant changes in disparities between patients with COPD
and those without COPD
Adverse Events Associated With Central Venous Catheter Placement
Adults with mechanical adverse events associated with central venous catheter placement by race and obesity status 2009-2013
Source Agency for Healthcare Research and Quality and Centers for Medicare amp Medicaid Services Medicare Patient Safety Monitoring
System 2009-2013
Denominator Selected discharges of hospitalized patients age 18 years and over with central venous catheter placement
Note For this measure lower percentages are better Mechanical adverse events include allergic reaction to the catheter tamponade
perforation pneumothorax hematoma shearing off of the catheter air embolism misplaced catheter thrombosisembolism knotting of the
pulmonary artery catheter and certain other events
0
2
4
6
8
10
2009 2010 2011 2012 2013
Pe
rce
nt
Total White Black
0
2
4
6
8
10
2009 2010 2011 2012 2013
Pe
rce
nt
Obese Not Obese
Importance Central venous catheterization (CVC) allows medical personnel quick access to
a patientrsquos bloodstream This ease of access is important when a patient requires life-saving
medications or when a physician needs to measure central venous pressure Mechanical
adverse events are most likely to occur while medical personnel are placing or maintaining
the central venous catheter
National Healthcare Quality and Disparities Report | 15
Patient Safety
Overall Percentage In 2013 32 of adults with central venous catheter placements
experienced an associated mechanical adverse event
Trends From 2009 to 2013 there were no statistically significant changes in the overall
percentage of adults with mechanical adverse events associated with central venous catheter
placement
Groups With Disparities
In 2013 the percentage of adults with mechanical adverse events associated with CVC
was worse for Blacks (67) compared with Whites (27) There were no statistically
significant differences by obesity status
From 2009 to 2013 there were no statistically significant changes in the gap between
Blacks and Whites in the percentage of adults with mechanical adverse events associated
with CVC
Adverse Drug Events
An estimated 400000 preventable ADEs occur each year in US hospitals generating
additional costs of $35 billion in 2006 dollars (IOM 2007)
An ADE is an injurymdashincluding physical harm mental harm or loss of functionmdash
resulting from medical intervention involving a drug
For more information see the PSNet link to Patient Safety Primer Medication Errors
httpspsnetahrqgovprimersprimer23medication-errors
The three initial targets of the HHS National Action Plan for Adverse Drug Event Prevention are
Anticoagulants and related bleeding
Diabetes agents and related hypoglycemia
Opioids and accidental overdose oversedation and respiratory depression
Measures of Patient Safety in the Hospital Setting Adverse Drug Events
Percentage of hospitalized adult patients who received a hypoglycemic agent and had an
adverse drug event
Percentage of hospitalized adult patients who had an anticoagulant-related adverse drug
event to warfarin
Number of opioid-related medication errors in patients of all ages
16 | National Healthcare Quality and Disparities Report
Patient Safety
Adverse Drug Events With Hypoglycemic Agents
Hospitalized adult patients who received a hypoglycemic agent who had adverse drug events with hypoglycemic agents by
raceethnicity 2010-2013 and renal disease 2009-2013
Source Agency for Healthcare Research and Quality and Centers for Medicare amp Medicaid Services Medicare Patient Safety Monitoring
System 2009-2013
Note For this measure lower percentages are better Hypoglycemic agents received by patients age 18 and over during a hospital stay include
insulin oral hypoglycemic or a combination of both The 2009 data for races did not meet the criteria for statistical reliability data quality or confidentiality
0
2
4
6
8
10
12
14
16
18
20
2009 2010 2011 2012 2013
Pe
rce
nt
Total Renal DiseaseNo Renal Disease
0
2
4
6
8
10
12
14
16
18
20
2010 2011 2012 2013
Pe
rce
nt
Total White BlackAsian Hispanic
Importance Hypoglycemic agents which are ingested orally are typically used in patients
with type II diabetes to control blood sugar levels In some cases diabetic patients use
hypoglycemic agents together with insulin The risk of chronic kidney disease increases
twofold for people with diabetes and renal impairment can increase the risk for adverse
events related to hypoglycemic agents
Overall Percentage In 2013 85 of hospital patients receiving hypoglycemic agents had
an adverse drug event
Trends The overall percentage of adverse drug events associated with hypoglycemic agents
improved from 2009 to 2013
Groups With Disparities
In 2013 the percentage of hospital patients who had adverse drug events with hypoglycemic agents was higher for Blacks (111) than for Whites (8)
Also in 2013 the percentage of hospital patients who had adverse drug events with
hypoglycemic agents was higher for those with renal disease (122) than for those
without renal disease (56)
From 2010 to 2013 there were no statistically significant changes in the gap between
minority groups and Whites in the percentage of patients who had adverse drug events
associated with hypoglycemic agents Similarly there were no statistically significant
changes in the gap between those with renal disease and those without
National Healthcare Quality and Disparities Report | 17
Patient Safety
Adverse Drug Events With Warfarin
Hospitalized adult patients with an anticoagulant-related adverse drug event with warfarin by age and corticosteroid use 2009-2013
Source Agency for Healthcare Research and Quality and Centers for Medicare amp Medicaid Services Medicare Patient Safety Monitoring
System 2009ndash2013
Denominator Patients 18 and over who received warfarin and had their international normalized ratio (INR) measured during their hospital
stay
Note For this measure lower percentages are better Adverse events occurring the day of hospital arrival were excluded
0
2
4
6
8
10
12
2009 2010 2011 2012 2013
Pe
rce
nt
TotalCorticosteroid UseNo Corticosteroid Use
0
2
4
6
8
10
12
2009 2010 2011 2012 2013
Pe
rce
nt
lt65 65-74 75-84 85+
Importance Blood clots in arteries and veins can cause a blockage of blood flow and lead to
strokes and heart attacks Anticoagulants such as warfarin reduce this risk but pose an
increased risk of bleeding Corticosteroids can interact with anticoagulants to raise the risk of
potential bleeding complications
Overall Percentage In 2013 50 of adults using warfarin experienced an anticoagulant-
related adverse drug event
Trends From 2009 to 2013 there were no statistically significant changes in the overall
percentage of hospital patients with an adverse drug event related to warfarin
Groups With Disparities
In 2013 the percentage of hospital patients who had an adverse drug event to warfarin
was the same regardless of corticosteroid use status
From 2009 to 2013 there were no statistically significant changes in the gap between
older age groups and those under age 65 in the percentage of patients who had adverse
events associated with warfarin Similarly there were no statistically significant changes
in the gap between those using corticosteroids and those not using corticosteroids
18 | National Healthcare Quality and Disparities Report
Patient Safety
Opioid-Related Medication Errors
Number of opioid-related medication errors reported in Pennsylvania by AHRQ eventharm category and age 2006 2008 2010 2012 2014
30 53 44 27 23
2947 2798 2714 27082408
9531014
984 969
910
175 245251 398
330
0
500
1000
1500
2000
2500
3000
3500
4000
4500
2006 2008 2010 2012 2014
Nu
mb
er o
f Ev
ents
Unsafe Condition Near Miss
Patient Event No Harm Patient Event Harm
Source Institute of Safe Medication Practices on behalf of the Pennsylvania Patient Safety Authority 2006-2014
Note Pennsylvania Patient Safety Reporting System reports of medication errors are from acute-level facilities that consist of hospitals
ambulatory surgical facilities birthing centers and abortion facilities Medication errors do not include adverse drug reactions Eventharm
categories refer to those in the Agency for Healthcare Research and Quality Common Formats Unsafe condition is defined as any
circumstance that increases the probability of a patient safety event A near miss is defined as a patient safety event that did not reach the
patient Deaths are included in the total but not shown on the chart because there were too few to render graphically
192 166 336530 662
2287 24842385
2364 1955
16271461 1272
1208
1055
0
500
1000
1500
2000
2500
3000
3500
4000
4500
2006 2008 2010 2012 2014
Nu
mb
er o
f Ev
en
ts
lt18 18-64 65+
Number of opioid-related medication errors reported in Pennsylvania by AHRQ eventharm category and age 2006 2008 2010 2012 2014
30 53 44 27 23
2947 2798 2714 27082408
9531014
984 969
910
175 245251 398
330
0
500
1000
1500
2000
2500
3000
3500
4000
4500
2006 2008 2010 2012 2014
Nu
mb
er o
f Ev
ents
Unsafe Condition Near Miss
Patient Event No Harm Patient Event Harm
Source Institute of Safe Medication Practices on behalf of the Pennsylvania Patient Safety Authority 2006-2014
Note Pennsylvania Patient Safety Reporting System reports of medication errors are from acute-level facilities that consist of hospitals
ambulatory surgical facilities birthing centers and abortion facilities Medication errors do not include adverse drug reac tions Eventharm
categories refer to those in the Agency for Healthcare Research and Quality Common Formats Unsafe condition is defined as any
circumstance that increases the probability of a patient safety event A near miss is defined as a patient safety event that did not reach the
patient Deaths are included in the total but not shown on the chart because there were too few to render graphically
192 166 336530 662
2287 24842385
2364 1955
16271461 1272
1208
1055
0
500
1000
1500
2000
2500
3000
3500
4000
4500
2006 2008 2010 2012 2014
Nu
mb
er o
f Ev
ents
lt18 18-64 65+
Importance Acute malignant andmdashincreasinglymdashchronic pain often is treated or managed
with prescription opioids Reducing patient harm from the use of opioids in both inpatient
and outpatient settings is a main area of focus because opioid-related adverse drug events are
often preventable
Trends
In Pennsylvania the total number of medication error reports related to opioids decreased
106 between 2006 (4106) and 2014 (3672)
Between 24 and 54 opioid-related medication errors resulting in patient harm or death
were reported from 2006 through 2014 accounting for approximately 1 of all reported
opioid medication errors each year
The largest share of opioid-related medication errors reported each year in Pennsylvania
related to those that reached the patient but did not result in harm Of these no-harm
events reaching the patient about one in four required monitoring andor intervention to
preclude the harm
National Healthcare Quality and Disparities Report | 19
Patient Safety
20 | National Healthcare Quality and Disparities Report
Although small in number reports of unsafe conditions increased from 43 (175) of
total opioid-related medication error reports in 2006 to 9 (330) in 2014 Reports of
unsafe conditions and near misses can provide important learning opportunities for
preventing patient harm
Differences Between Groups Reports of opioid-related medication errors involving
pediatric patients increased nearly fourfold from 192 (47) in 2006 to 662 (18) in 2014
During the same period reports of opioid-related medication errors involving older adult
patients decreased from nearly 40 of the total to less than 30
Patient Safety in the Nursing Home Setting
More than 3 million people receive care in US nursing homes and skilled nursing facilities
each year (CDC 2015)
For nursing home residents optimal care seeks to maximize quality of life and minimize
unintended complications
Measures tracked for patients of various age ranges include
Nursing home residents with urinary tract infections
Nursing home residents experiencing use of restraints
Nursing home residents who have pressure ulcers
Nursing home residents who had a fall with major injury
Nursing home residents who received antipsychotic medication
Urinary Tract Infections
Long-stay nursing home residents experiencing urinary tract infections by sex and raceethnicity 2011-2013
Source Centers for Medicare amp Medicaid Services Minimum Data Set 2011-2013
DenominatorNursing home residents of any age w ho have at least 101 cumulative days in the facility
Note For this measure low er percentages are better The measure w as calculated as follows Percentage of long-stay residents with a urinary
tract infection w ithin the 30 days prior to assessment White Black and Asian are non-Hispanic Hispanic includes all races
0
2
4
6
8
10
2011 2012 2013
Pe
rce
nt
Total Male Female
2011 Achievable
Benchmark 61
0
2
4
6
8
10
2011 2012 2013
Pe
rce
nt
White Black Asian Hispanic
2011 Achievable
Benchmark 61
Long-stay nursing home residents experiencing urinary tract infections by sex and raceethnicity 2011-2013
Source Centers for Medicare amp Medicaid Services Minimum Data Set 2011-2013
DenominatorNursing home residents of any age w ho have at least 101 cumulative days in the facilityNote For this measure low er percentages are better The measure w as calculated as follows Percentage of long-stay residents with a urinary
tract infection w ithin the 30 days prior to assessment White Black and Asian are non-Hispanic Hispanic includes all races
0
2
4
6
8
10
2011 2012 2013
Pe
rce
nt
Total Male Female
2011 Achievable
Benchmark 61
0
2
4
6
8
10
2011 2012 2013
Pe
rce
nt
White Black Asian Hispanic
2011 Achievable
Benchmark 61
Patient Safety
Importance Bacteria that cause urinary tract infections (UTIs) can spread to other body
parts and become more serious or contribute to further complications such as delirium
Overall Percentage In 2013 the percentage of long-stay nursing home residents with a UTI
was 64
Groups With Disparities
In 2013 compared with males (51) the percentage with UTIs was worse for females
(7)
In 2013 compared with White residents (68) the percentage of residents with UTIs
was lower for Blacks and Asians (47) as well as Hispanics (54)
Achievable Benchmark
In 2011 the top 5 State achievable benchmark for UTIs was 61 The States that
contributed to the achievable benchmark are Connecticut Hawaii Minnesota North
Dakota and Pennsylvania
Males Blacks Asians and Hispanics have achieved the benchmark
Use of Restraints
00
05
10
15
20
25
30
35
40
2011 2012 2013
Pe
rce
nt
White Black Asian Hispanic
00
05
10
15
20
25
30
35
40
2011 2012 2013
Pe
rce
nt
Total 0-64 65-74 75-84 85+
2011 Achievable
Benchmark 07
Long-stay nursing home residents experiencing use of restraints by age and raceethnicity 2011-2013
Source Centers for Medicare amp Medicaid Services Minimum Data Set 2011-2013
Denominator Nursing home residents of any age who have at least 101 cumulative days in the facility
Note For this measure lower percentages are better The measure was calculated as follows Percentage of long-stay residents who are
physically restrained on a daily basis
2011 Achievable
Benchmark 07
00
05
10
15
20
25
30
35
40
2011 2012 2013
Pe
rce
nt
White Black Asian Hispanic
00
05
10
15
20
25
30
35
40
2011 2012 2013
Pe
rce
nt
Total 0-64 65-74 75-84 85+
2011 Achievable
Benchmark 07
Long-stay nursing home residents experiencing use of restraints by age and raceethnicity 2011-2013
Source Centers for Medicare amp Medicaid Services Minimum Data Set 2011-2013
Denominator Nursing home residents of any age who have at least 101 cumulative days in the facility
Note For this measure lower percentages are better The measure was calculated as follows Percentage of long-stay residents who are
physically restrained on a daily basis
2011 Achievable
Benchmark 07
National Healthcare Quality and Disparities Report | 21
Patient Safety
Importance Residents who are restrained daily can become weak lose their ability to go to
the bathroom by themselves and develop pressure ulcers or other medical conditions
Overall Percentage In 2013 the percentage of long-stay nursing home residents who were
physically restrained on a daily basis was 14
Groups With Disparities
In 2011 2012 and 2013 the percentage of residents with restraint use on a daily basis
was lower for those ages 65-74 years compared with those under age 65 In 2013 the
percentage of residents ages 65-74 years experiencing use of restraints was 12
compared with 16 for residents younger than 65
In 2013 compared with Whites (14) Asians (2) and Hispanics (18) had worse
percentages of daily restraint use and Blacks (12) had a better percentage of daily
restraint use
Achievable Benchmark
In 2011 the top 5 State achievable benchmark for restraint use was 07 The States that
contributed to the achievable benchmark are Kansas Maine Nebraska New Hampshire
and Vermont
No group achieved the benchmark from 2011 to 2013
Pressure Ulcers
Low-risk short-stay and high-risk long-stay nursing home residents who have pressure ulcers by sex 2011-2013
Source Centers for Medicare amp Medicaid Services Minimum Data Set 2011-2013
Denominator Low-risk short-stay Nursing home residents of any age who have 100 or fewer cumulative days in the facility and are active can
change positions and are getting the nutrients they need to maintain good skin health High-risk long-stay Nursing home residents of any age
who have at least 101 cumulative days in the facility and are in a coma do not get the nutrients needed to maintain good skin health or cannot
change position on their own
Note For this measure lower percentages are better
0
2
4
6
8
10
12
2011 2012 2013
Pe
rce
nt
Low-Risk Short StayTotal Male Female
2011 Achievable Benchmark10
0
2
4
6
8
10
12
2011 2012 2013
Pe
rce
nt
High-Risk Long StayTotal Male Female
2008 Achievable Benchmark 71
22 | National Healthcare Quality and Disparities Report
Patient Safety
Importance Pressure ulcers are serious medical conditions They typically result from
prolonged periods of uninterrupted pressure on the skin soft tissue muscle and bone
Vulnerable patients include older adults stroke and diabetic patients patients with dementia
circulatory diseases dehydration and malnutrition and people who use wheelchairs or are
bedriddenmdashthat is any patient with impaired mobility or sensation
Overall Percentage In 2013 the percentage of low-risk short-stay residents with pressure
ulcers was 13 and the percentage of high-risk long-stay residents with pressure ulcers was
77
Groups with Disparities
As in 2011 and 2012 male low-risk short-stay nursing home residents had a worse
percentage with pressure ulcers (15) compared with female residents (12) in 2013
As in 2011 and 2012 male high-risk long-stay nursing home residents had a worse
percentage with pressure ulcers (94) compared with female residents (70) in 2013
Achievable Benchmark
The 2011 top 5 State achievable benchmark for low-risk short-stay nursing home residents was 10 The States that contributed to the benchmark were Alabama Arizona Colorado Connecticut and Idaho
The 2008 top 5 State achievable benchmark for high-risk long-stay nursing home residents was 71 The States that contributed to the benchmark were Hawaii Minnesota Nebraska New Hampshire and North Dakota
No low-risk short-stay residents achieved the benchmark from 2011 to 2013 Among
high-risk long-stay residents only females achieved the benchmark by 2013
National Healthcare Quality and Disparities Report | 23
Patient Safety
Falls
00
05
10
15
20
25
30
35
40
45
50
Pe
rce
nt
2012 2013
Long-stay nursing home residents who had a fall with major injury by sex age and raceethnicity 2012-2013
Source Centers for Medicare amp Medicaid Services Minimum Data Set 2012-2013
Denominator Nursing home residents of any age who have at least 101 cumulative days in the facility with one or more look-back scan
assessments except when the occurrence of falls or number of falls with major injury was not assessed in the look-back scan assessment
Note For this measure lower percentages are better White Black and Other are non-Hispanic Hispanic includes all races
2012 Achievable
Benchmark 22
Importance Nursing home residents who experience falls resulting in major injuries are at
higher risk of death and disability as well as emotional trauma that can affect functional
abilities and social well-being
Overall Percentage In 2013 the percentage of long-stay nursing home residents who had a
fall with a major injury was 34
Groups With Disparities
In 2013 female nursing home residents had a worse percentage of falls (38) compared
with male residents (25)
In 2013 the percentage of falls with major injury was worse for all subgroups of
residents age 65 years and over compared with their younger counterparts The
percentage for residents under 65 years old was 17 compared with 26 for ages 65shy
74 years 34 for ages 75-84 years and 41 for 85 years and over
Also in 2013 compared with Whites (38) the percentage of falls with major injury
was better for Black (13) Other (22) and Hispanic (24) residents
24 | National Healthcare Quality and Disparities Report
Patient Safety
National Healthcare Quality and Disparities Report | 25
Achievable Benchmark
The 2012 top 5 State achievable benchmark for falls with major injury was 22 The
States that contributed to the achievable benchmark are Alaska California District of
Columbia Hawaii and New Jersey The benchmark was achieved by Black residents and those ages 0-64 years
Antipsychotic Medication Among Nursing Home Residents
Importance The high use of antipsychotic medications among nursing home residents for
indications other than those for which the drug was approved has been noted by the Federal
Government These drugs are often used for too long at too high a dose or when
unnecessary In the past inappropriate prescribing of antipsychotics in nursing homes has
primarily been considered a marker of suboptimal care Recent studies have shown
antipsychotic use is also a drug safety issue (Huybrechts et al 2012) Antipsychotic
medication use is associated with increased risks of adverse events such as movement
disorders falls hip fractures and cerebrovascular events Their use in older adults with
dementia carries an increased risk of death Safety concerns with antipsychotic medication
use in older adults also include the risks of hyperprolactinemia pneumonia
0
5
10
15
20
25
30
Percent
2012 2013
Adult long-stay nursing home residents who received antipsychotic medication by raceethnicity and number of chronic conditions 2012-2013
Key NHOPI = Native Hawaiian or Other Pacific Islander AIAN = American Indian or Alaska Native
Source Centers for Medicare amp Medicaid Services Minimum Data Set 2012-2013
Denominator Nursing home residents of any age who have at least 101 cumulative days in the facility excluding residents with schizophrenia
Tourettersquos syndrome and Huntingtonrsquos disease
Numerator Subset of denominator that receives an antipsychotic medication
Note For this measure lower percentages are better
2012 Achievable
Benchmark 150
Patient Safety
26 | National Healthcare Quality and Disparities Report
thromboembolism cerebrovascular events and other cardiovascular adverse events (Chiu et
al 2015)
Overall Percentage The percentage of long-stay nursing home residents who had
antipsychotic medications was 176 in 2013
Groups With Disparities
In 2013 the percentage of residents receiving antipsychotic medication was higher for
Hispanic residents (201) than for White residents (180)
In 2012 and 2013 the percentage of long-stay residents who received antipsychotic
medications was worse for residents with one or more chronic conditions than for
residents with no chronic conditions
Achievable Benchmark
The 2012 top 6 State achievable benchmark was 150 The States that contributed to the
achievable benchmark are Alaska California Hawaii Michigan New Jersey and
Wyoming Asians NHOPIs residents with no chronic conditions and residents with one chronic
condition achieved the benchmark
Antipsychotic Medication Among Nursing Home Residents by State
Long-stay nursing home residents who received antipsychotic medication by State 2013
Source Centers for Medicare amp Medicaid Services Minimum Data Set 2013
Denominator Nursing home residents of any age who have at least 101 cumulative days in the facility
Note For this measure lower percentages are better
AZ
CA
UT
CT
FL
GA
IA
IL
KS
MA
MDMO
NJ
NY
OR
PA
SC
TN
CO
WA
WI
VA
ME
MN
MI
NC
TX
KY
WV
RI
NE
VT
NV OH
SD
AR
IN
NH
MT
ID
WY
ND
NMOK
LA
MS AL
DE
AKAK
HI
DC
85-153 (1st Quartile)
154-173 (2nd Quartile)
No Data
174-192 (3rd Quartile)
PR193-234 (4th Quartile)
Patient Safety
Overall This map shows overall rankings of States (by quartiles) in the percentage of long-
stay nursing home residents who received antipsychotic medication in 2013 Values ranged
from 85 to 234
Differences by State Interquartile ranges follow
First quartile (lowest) 85-153 (AK CA DC DE HI MD MI MN NJ NC SC
WI WV)
Second quartile (second lowest) 153 -173 (CO ID MT NM NY ND OR PA
RI SD VT WA WY)
Third quartile (second highest) 174-192 (AZ CT GA IN IA KS ME MA MO
NV OH OK VA)
Fourth quartile (highest) 193-234 (AL AR FL IL KY LA MS NE NH TN
TX UT)
Eight of the 12 States in the quartile with the highest percentage of long-stay nursing
home residents who received antipsychotic medication were in the South
Patient Safety in the Home Health Setting
Home health agencies provide services to beneficiaries who are homebound and need skilled
nursing care or therapy
Approximately 12 million individuals receive home health care from more than 33000
providers for causes including acute illness long-term health conditions permanent
disability or terminal illness (NAHCH 2010)
Improvements among home health patients can reflect the quality of care from home health
agencies
Measures include
Home health patients with improvement in surgical wounds
Home health patients with improvements in their ability to take medications orally
National Healthcare Quality and Disparities Report | 27
Patient Safety
Improvement in Surgical Wounds
75
80
85
90
95
100
2010 2011 2012 2013
Pe
rce
nt
White Black Asian Hispanic
75
80
85
90
95
100
2010 2011 2012 2013
Pe
rce
nt
Total 0-64 65-74
75-84 85+
2011 Achievable
Benchmark 913
Home health patients with improvement in surgical wounds by age and raceethnicity 2010-2013
Source Centers for Medicare amp Medicaid Services Outcome and Assessment Information Set 2010-2013
Denominator Number of home health episodes during the measurement period in which the patient of any age had a surgical wound and the
episode ended with the patient discharged from home health care
Note White Black and Asian are non-Hispanic Hispanic includes all races
2011 Achievable
Benchmark 913
75
80
85
90
95
100
2010 2011 2012 2013
Per
cen
t
White Black Asian Hispanic
75
80
85
90
95
100
2010 2011 2012 2013
Per
cen
t
Total 0-64 65-74
75-84 85+
2011 Achievable
Benchmark 913
Home health patients with improvement in surgical wounds by age and raceethnicity 2010-2013
Source Centers for Medicare amp Medicaid Services Outcome and Assessment Information Set 2010-2013
Denominator Number of home health episodes during the measurement period in which the patient of any age had a surgical wound and the
episode ended with the patient discharged from home health care
Note White Black and Asian are non-Hispanic Hispanic includes all races
2011 Achievable
Benchmark 913
Importance Normal wound healing after an operation is an important marker of good care
The home health team should regularly change wound dressing and teach the patient about
wound care
Overall Percentage In 2013 the percentage of home health patients with improvement in
their surgical wounds was 890
Trends The percentage of health home patients with surgical wound improvement increased
between 2010 and 2013
Groups With Disparities
In 2013 compared with residents under age 65 years (856) all other age groups had
better percentages of improvement in surgical wounds The percentage was 893 for
ages 65-74 905 for ages 75-84 and 917 for ages 85 and over
In 2013 compared with Whites (893) Blacks (878) Asians (882) and Hispanics
(874) had worse percentages of improvement in surgical wounds
The 2010 through 2013 trend in the percent of home health patients with surgical wound
improvement did not change for those over age 65 relative to persons under age 65 years
28 | National Healthcare Quality and Disparities Report
Patient Safety
Achievable Benchmark
The 2011 top 5 State achievable benchmark was 913 The States that contributed to the
benchmark are Alabama Mississippi Nevada Oklahoma and South Carolina
Home health patients age 85 years and over achieved the benchmark for surgical wound
improvement in 2013
At the current rate of progress patients ages 75-84 years could reach the benchmark
within a year Patients ages 65-74 years could achieve the benchmark in approximately 2
years
White home health patients could achieve the benchmark in approximately 2 years
Improvement in Ability To Take Medication Orally
0
20
40
60
80
100
2010 2011 2012 2013
Per
cen
t
White Black Asian Hispanic
0
20
40
60
80
100
2010 2011 2012 2013
Per
cen
t
Total 0-64 65-74
75-84 85+
2008 Achievable
Benchmark 516
Home health patients with improvement in their ability to take medications orally by age and raceethnicity 2010-2013
Source Centers for Medicare amp Medicaid Services Outcome and Assessment Information Set 2010-2013
Denominator Number of home health care episodes in which a patient of any age was unable to take oral medications independently at the
start of the episode that ended during the measurement period
Note White Black and Asian are non-Hispanic Hispanic includes all races
2008 Achievable
Benchmark 516
0
20
40
60
80
100
2010 2011 2012 2013
Per
cen
t
White Black Asian Hispanic
0
20
40
60
80
100
2010 2011 2012 2013
Per
cen
t
Total 0-64 65-74
75-84 85+
2008 Achievable
Benchmark 516
Home health patients with improvement in their ability to take medications orally by age and raceethnicity 2010-2013
Source Centers for Medicare amp Medicaid Services Outcome and Assessment Information Set 2010-2013
Denominator Number of home health care episodes in which a patient of any age was unable to take oral medications independently at the
start of the episode that ended during the measurement period
Note White Black and Asian are non-Hispanic Hispanic includes all races
2008 Achievable
Benchmark 516
Importance Taking medications correctly is important to the health status and quality of life
of individuals living in the community The home health team can help teach a patient ways
to organize drugs and take them properly
Overall Percentage In 2013 the percentage of home health patients with improvement in
their ability to take medications orally was 513
Trends Between 2010 and 2013 there was improvement in the overall percentage of home
health patients with improved ability to take medications orally
National Healthcare Quality and Disparities Report | 29
Patient Safety
Groups With Disparities
In 2013 the percentage of home health patients with improvement in their ability to take
medications orally was worse for those age 85 years and over (398) compared with
those under age 65 years (577)
The percentage of patients with improvement in their ability to take medications orally
was worse among Hispanic home health patients (400) than among White patients
(526) in 2013
From 2010 to 2013 the gap between Blacks and Whites decreased and the gap between
Asians and Whites and Hispanics and Whites increased
Achievable Benchmark
The 2008 top 5 State achievable benchmark was 516 The States that contributed to the
achievable benchmark are Iowa Massachusetts New Jersey North Dakota and South
Carolina
The benchmark was achieved among age groups under 85 years and by White and Black
home health patients
The total population is estimated to reach the benchmark in less than a year Hispanic
patients and patients age 85 years and over are farthest from the benchmark
Improvement in Ability To Take Medication Orally by State
Home health patients with improvement in their ability to take medications orally by raceethnicity by State 2013
Source Centers for Medicare amp Medicaid Services Outcome and Assessment Information Set 2013
Denominator Number of home health care episodes in which a patient of any age was unable to take oral medications independently at the
start of the episode that ended during the measurement period
AZ
CA
UT
CT
FL
GA
IA
IL
KS
MA
MDMO
NJ
NY
OR
PA
SC
TN
CO
WA
WI
VA
ME
MN
MI
NC
TX
KY
WV
RI
NE
VT
NV OH
SD
AR
IN
NH
MT
ID
WY
ND
NMOK
LA
MS AL
DE
AKAK
HI
No significant difference between rates
of Hispanics and non-Hispanic Whites
Non-Hispanic Whites have significantly
worse rate than Hispanics
States do not have data that meet the
criteria for statistical reliability data
quality or confidentiality
Hispanics have significantly worse rate
than non-Hispanic Whites
DC
30 | National Healthcare Quality and Disparities Report
Patient Safety
Geographic Variation
In 2013 Hispanic home health patients had worse rates of improvement in taking oral
medications than non-Hispanic White patients in 11 States (Arizona California
Connecticut Florida Illinois Indiana Massachusetts Nevada New York North
Carolina and Texas
Non-Hispanic White patients had worse rates of improvement than Hispanic patients in
five States (Hawaii Idaho Iowa Michigan and Pennsylvania)
Patient Safety in the Ambulatory Setting
Although patient safety initiatives frequently focus on inpatient hospital events adverse
effects of medical care may be identified and treated in outpatient settings
Adverse effects of medical care can follow care or procedures in hospitals emergency
departments physician offices or other settings
Measures include
Patient safety and quality issues by frequency of occurrence in outpatient medical offices
Adults age 65 years and over who received potentially inappropriate prescription medications during the calendar year
Percentage of hemodialysis patients with vascular catheter in use for 90 days or longer
For more information see the PSNet link to Patient Safety Primer Patient Safety in
Ambulatory Care httpspsnetahrqgovprimersprimer16patient-safety-in-ambulatory-care
National Healthcare Quality and Disparities Report | 31
Patient Safety
Patient Safety and Quality Issues
Patient safety and quality issues by frequency of occurrence in outpatient medical offices 2014
Source Westat analysis of the AHRQ 2014 Medical Office Survey on Patient Safety Culture Comparative Database (N=935)
Note For this measure less frequent occurrences during the year are better
0
20
40
60
80
100
A pharmacy contactedour office to clarify orcorrect a prescription
A patient was unableto get an appointmentwithin 48 hours for anacuteserious problem
A patients medicationlist was not updatedduring his or her visit
The results from a labor imaging test were notavailable when needed
A patients chartmedicalrecord was not available
when needed
Occurred DailyWeekly
Occurred Monthly
Occurred Not at All to Several Times Over the Past Year
Importance Most health care takes place in the outpatient or ambulatory care setting Lack
of access to care and lack of access to timely and accurate medical information and test
results may contribute to patient safety events such as missed or delayed diagnoses
medication errors failure to order appropriate diagnostic or laboratory tests incorrect
interpretation of tests and inadequate followup on results
Overall Percentage
Almost 30 of medical offices participating in the survey reported daily or weekly
occurrences of being contacted by the pharmacist for clarification or correction on a
prescription
After prescription clarifications or corrections by the pharmacy medical offices were
next most likely to report daily or weekly issues with patients being unable to get an
appointment within 48 hours for an acute or serious problem (14) or the patientrsquos
medication list not getting updated during their visit (11)
The share of medical offices reporting that lab or imaging tests were not available when
needed reached nearly 20 when considering monthly occurrences as well as those that
occurred more frequently
32 | National Healthcare Quality and Disparities Report
Patient Safety
Potentially Inappropriate Prescriptions for Older Adults
Adults age 65 years and over who received potentially inappropriate prescription medications during the calendar year by sex and
perceived health status 2003ndash2013
Source Agency for Healthcare Research and Quality Medical Expenditure Panel Survey 2003-2013
Note For this measure lower percentages are better Prescription medications received include all prescribed medications initiall y purchased
or otherwise obtained as well as any refills For more information on inappropriate medications see the American Geriatrics Society 2012 Beers
Criteria Update Expert Panel American Geriatrics Society updated Beers Criteria for potentially inappropriate medication use in older adults J
Am Geriatr Soc 2012 Apr60(4)616-31
0
5
10
15
20
25
30
Per
cen
t
Total Male Female
0
5
10
15
20
25
30
Per
cen
t
ExcellentVery GoodGood FairPoor
Adults age 65 years and over who received potentially inappropriate prescription medications during the calendar year by sex and
perceived health status 2003ndash2013
Source Agency for Healthcare Research and Quality Medical Expenditure Panel Survey 2003-2013
Note For this measure lower percentages are better Prescription medications received include all prescribed medications initially purchased
or otherwise obtained as well as any refills For more information on inappropriate medications see the American Geriatrics Society 2012 Beers
Criteria Update Expert Panel American Geriatrics Society updated Beers Criteria for potentially inappropriate medication use in older adults J
Am Geriatr Soc 2012 Apr60(4)616-31
0
5
10
15
20
25
30
Per
cen
t
Total Male Female
0
5
10
15
20
25
30
Per
cen
t
ExcellentVery GoodGood FairPoor
Importance Some drugs that are prescribed for older patients are known to be potentially
harmful for this age group
Overall Percentage In 2013 the percentage of adults age 65 years and over who received
potentially inappropriate prescription medications was 114
Trends From 2003 to 2013 the percentage of adults age 65 years and over who received
potentially inappropriate prescription medications improved overall for both sexes and for
people with excellentvery goodgood health status and people with fairpoor health status
Groups With Disparities
In all years the percentage of patients receiving potentially inappropriate medications
was higher among females compared with males This gap was not changing over time
In all years from 2003 to 2013 the percentage of patients receiving potentially
inappropriate medications was higher among people with fairpoor health status
compared with people with excellentgood health status This gap was not changing over
time
National Healthcare Quality and Disparities Report | 33
Patient Safety
Long-Term Catheter Use in Dialysis Patients
HI
AKAK
AZ
CA
UT
CT
FL
GA
IA
IL
KS
MA
MDMO
NJ
NY
OR
PA
SC
TN
CO
WA
WI
VA
ME
MN
MI
NC
TX
KY
WV
RI
NE
VT
NV OH
SD
AR
IN
NH
MT
ID
WY
ND
NMOK
LA
MSAL
DE
DC
10-12
13-18
7-9
PR
Source Centers for Medicare and Medicaid Services Dialysis Facility Compare 2014
Denominator At-risk adult Medicare patients with a central venous catheter who were receiving regular hemodialysis treatments at dialysis
facilities
Note For this measure lower percentages are better
Percentage of hemodialysis patients with central venous catheters used for vascular access for 90 days or longer by State 2014
Importance Central venous catheters are frequently used for vascular access to dialysis
patients until a fistula or graft is formed Central venous catheters have higher rates of
infection and adverse events among patients receiving dialysis treatment compared with
other forms of vascular access To decrease the likelihood of adverse events catheters should
be used for less than 90 days
Overall Percentage Nationally an average of 10 of dialysis patients used central venous
catheters for 90 days or longer in 2014
Geographic Variation In 2014 Alabama and Kansas had the lowest percentages of dialysis
patients using central venous catheters for 90 days or longer (7) and Puerto Rico had the
highest percentage (18) of long-term catheter use
Patient Safety Infrastructure
Efforts to improve patient safety have been accompanied by various infrastructure
enhancements
Growth in patient safety organizations which assist providers in detecting and reducing
risks and hazards from care delivery that may lead to patient harm
System improvement initiatives at the Veterans Health Administration (VHA)
34 | National Healthcare Quality and Disparities Report
Patient Safety
Development of the National Practitioner Data Bank a clearinghouse for information on
medical malpractice payments
Patient Safety Organizations
Patient safety organizations (PSOs) aim to reduce preventable adverse events near misses
and unsafe conditions in all health care settings
PSOs provide an environment for health care providers to voluntarily report discuss and
learn from patient safety events and quality analyses on a privileged and confidential basis
Measures include
Number of PSOs serving each State
Variation in concentrations of compounded liquid medications for children
Patient Safety Organizations AHRQ Common Formats
AHRQ Common Formats provide a standardized method for PSOs health care providers
and other organizations to collect and report patient safety events
Data element standards are important for aggregating and analyzing events across
providers
AHRQ Common Formats have been developed for a variety of settings of care
Acute care hospitals
Skilled nursing facilities
Retail pharmacy
More information is available at httpspsoahrqgovcommon
National Healthcare Quality and Disparities Report | 35
Patient Safety
Number of Patient Safety Organizations
AZ (2)
CA (3)
UT (2)
CT(3)
FL (8)
GA (5)
IA (4)
IL (7)
KS (5)
MA(3)
MD (4)MO(2)
NJ(3)
NY (5)
OR (3)
PA (5)
SC (4)
TN (5)
CO (2)
WA (2)
WI (5)
VA (7)
ME(2)
MN(3)
MI (3)
NC (7)
TX (6)
KY (4)WV (3)
RI(2)
NE (2)
VT(2)
NV (2)
OH (2)
SD (1)
AR (4)
IN (2)
NH(2)
MT (2)
ID (3)
WY (2)
ND (1)
NM (3)OK (2)
LA (1)
MS (2)
AL (2)
DE(2)
HI (2)
AKAK (2)
DC(3)
PR (0)
1-2
3-4
5-6
7-8
Number of PSOs
excluding PSOs
operating nationally
Number of Patient Safety Organizations by area served 2014
Source Agency for Healthcare Research and Quality Patient Safety Organization Information Form Calendar Year 2014 and PSO-PPC
Contact Database
Note PSOs included in this map were AHRQ-listed during any part of 2014 and submitted the PSO Profile to the PSO Privacy Protection
Center (PSO-PPC) in early 2015 A PSO may have members in one or more States regardless of headquarters location Each State shows the
number of PSOs that serve that State map excludes 38 PSOs that are available to providers in all States
Importance All patient safety organizations (PSOs) have authority to operate in all 50
States and US territories but not all do In 2014 38 PSOs self-reported being available to
providers nationally PSOs not available nationally serve specific States
Geographic Variation
Nearly all States have at least 2 PSOs available to providers in their State in addition to
the 38 national PSOs that serve all States
Florida has the most PSOs available with 8 in addition to the 38 nationally available
PSOs The States with the largest number of PSOs available are generally on the East
Coast (eg North Carolina Virginia New York Pennsylvania Tennessee Georgia) or
have large populations (eg Texas Illinois)
North Dakota South Dakota and Louisiana are the only states with just one PSO serving
their State in addition to the 38 national PSOs
Puerto Rico is served by one national PSO only
36 | National Healthcare Quality and Disparities Report
Patient Safety
Compounded Liquid Medications for Children
Compounded liquid medications for children in Michigan 2012
Source Levy S Buckley B Safe Table Success The MI Pediatric Safety Collaboration Presentation presented at the 7th Annual
Meeting of Patient Safety Organizations (PSOs) Rockville MD 2015 April and Rood JM Engels MJ Ciarkowski SL et al Variability in
compounding of oral liquids for pediatric patients a patient safety concern J Am Pharm Assn 201454(4)383-9
Note Information represents 244 responses to online survey of approximately 2000 Michigan pharmacies conducted in June 2012 by
The University of Michigan College of Pharmacy in collaboration with the Michigan Pharmacists Association
0
10
20
30
40
50
1 2 3 4 5 6 7 8 9
Nu
mb
er o
f D
rugs
Number of Unique Concentrations
Number of Different Compounded Concentrations per Drug
0
10
20
30
40
50
No Harm No Harm ButMonitoring
TemporaryHarm
Pe
rce
nt
Compounding Errors by Related Harm and Pharmacy Setting
Inpatient Outpatient
Compounded liquid medications for children in Michigan 2012
Source Levy S Buckley B Safe Table Success The MI Pediatric Safety Collaboration Presentation presented at the 7th Annual
Meeting of Patient Safety Organizations (PSOs) Rockville MD 2015 April and Rood JM Engels MJ Ciarkowski SL et al Variability in
compounding of oral liquids for pediatric patients a patient safety concern J Am Pharm Assn 201454(4)383-9
Note Information represents 244 responses to online survey of approximately 2000 Michigan pharmacies conducted in June 2012 by
The University of Michigan College of Pharmacy in collaboration with the Michigan Pharmacists Association
0
10
20
30
40
50
1 2 3 4 5 6 7 8 9
Nu
mb
er o
f D
rugs
Number of Unique Concentrations
Number of Different Compounded Concentrations per Drug
0
10
20
30
40
50
No Harm No Harm ButMonitoring
TemporaryHarm
Per
cen
t
Compounding Errors by Related Harm and Pharmacy Setting
Inpatient Outpatient
Importance
Liquid medications are widely used in pediatrics because many children find it difficult
to swallow tablets or capsules If not commercially manufactured these liquid
medications require a pharmacist to compound them to the correct dosage for the patient
This practice of compounding has led to a variety of medication concentrations in use In
the absence of standard concentrations for compounded medications there is a risk that
children may accidentally receive medications that are too potent and can be dangerous
or are too weak to be effective
The Michigan Health amp Hospital Association Keystone Center Patient Safety
Organization hosts five Pediatric Safe Tables each year Safe Tables provided a
confidential and legally protected environment to discuss challenges and improvement
strategies regarding inconsistent medication concentrations for compounded oral liquids
without fear of punitive action against them
National Healthcare Quality and Disparities Report | 37
Patient Safety
Overall Percentage
More than half (527) of drugs identified in the 2012 survey had 3 or more unique
concentrations dispensed to children across Michigan For example Rifampin used to
treat bacterial infections was reported to have 8 different concentrations dispensed to
patients
Nearly one-third (313) of reported errors caused temporary harm or required additional
monitoring despite no harm
Standardization of Compounded Liquid Medications
Source Michigan Health amp Hospital Association Keystone Center Patient Safety Organization and University of Michigan College of Pharmacy
State-Wide Initiative to Standardize the Compounding of Oral Liquids in Pediatrics
Standardization of compounded liquid medications for children in Michigan 2011
Issue identificationbull Hospitals attending PSO Pediatrics Safe
Table raise compounded medication concentrations as a major safety issue
bull Small focus group determines extent of problem
bull Michigan pharmacies are surveyed about baseline concentrations
Develop Interventionbull PSO Quarterly Safe Tables are held to
discuss cases and practicesbull Team develops recommendations for
standard concentrationsbull Consensus is achieved for frequently
compounded pediatric medications 470 formulations for 147 drug entities are reduced to 104 concentrations for 100 drugs
Practice changebull Toolkit is createdbull Standards are disseminated to Michigan
prescribers and pharmacies bull Standards are disseminated to PSO
members and Safe Table participants
The Role of PSO Safe Tables Based on adverse medication events discussed in the
Michigan Health amp Hospital Association (MHA) Keystone Center Patient Safety
Organization (PSO) Safe Tables in July 2011 the Michigan Pediatric Safety Collaboration
was developed to further assess the scope of the problem and formulate a solution
The Collaborative The Michigan Pediatric Safety Collaboration includes individuals from
the University of Michigan College of Pharmacy the Michigan Pharmacists Association
(MPA) the Food and Drug Administration (FDA) and the MHA Keystone PSO
38 | National Healthcare Quality and Disparities Report
Patient Safety
Practice Change
As a result of the standardization effort 470 unique formulations for 147 drug entities
were reduced to 104 different concentrations for 100 drugs
The Michigan Pediatric Safety Collaboration developed a multistep process to implement
standards for compounding medications The MPA surveyed pharmacies in Michigan to
better define the nature and scope of the problem The PSO continued to act as convener
The result was the creation and dissemination of statewide standards for 120 frequently
compounded pediatric medications
Veterans Health Administration
The National Center for Patient Safety is part of the Veterans Health Administration the
Nationrsquos largest integrated health care system
Patient safety-related system improvement initiatives include
The Daily Planreg
Purchasing for Safety Initiative
Patient Safety Improvement Initiative
Patient safety improvement initiative The Daily Planreg at Veterans Affairs Medical Centers 2009
Source King BJ Mills PD Fore A et al The Daily Planreg including patients for safetys sake Nurs Manage 201243(3)15-8
0
10
20
30
40
50
Identified atleast one
error
Identifiederror
of omission
Identifiederror
ofcommission
Nurses Who Identified Errors in Patient Treatment Plan by Type
0
10
20
30
40
50
Patient founddiscrepancy inplanned care
Family founddiscrepancy inplanned care
Nursing Stafffound
discrepancyin plannedtreatment
Respondents Who Identified Errors or Discrepancies Through The Daily Plan reg
National Healthcare Quality and Disparities Report | 39
Patient Safety
Importance The Daily Planreg
is a two-page printed summary that acts as a schedule for
patients and providers each day It shows the procedures laboratory tests and medications
scheduled for that day and lists essential health information such as patientrsquos name allergies
and current medications It can be tailored for a patientrsquos needs by extracting orders from the
electronic medical record (EMR) The Daily Planreg
is intended to facilitate patient and family
engagement throughout the course of care The Daily Planreg
shows promise for improving
patient safety Since 2009 the VA has implemented The Daily Planreg
in more than 65
hospitals both inpatient and outpatient care settings The Daily Planreg
is shared more than
75000 times a month and the VA plans to continue the spread of The Daily Planreg
at
additional sites in 2016
Findings
As part of a pilot test in 2009 a total of 198 patients and 85 nurses responded to a survey
across 10 facilities Nurses had an average of 34 patients per shift who received The
Daily Planreg Patients responded about their own experiences whereas nurses reported
about all of their patients who received The Daily Planreg
Nearly half (475) of patients reported finding a discrepancy in planned care through
The Daily Planreg In addition 30 of patients reported that their family members found a
discrepancy Although not every discrepancy will be a potential medical error having a
shared understanding of the plan of care decreases the risk of error
More than one in six nurses (176) identified a discrepancy in treatment among their
patients through The Daily Planreg Most of these nurses (153) found one or more errors
of omission and a smaller share (106) of nurses found one or more errors of
commission some found both
40 | National Healthcare Quality and Disparities Report
Patient Safety
Issues Related to Ventilators
Common use-issues related to ventilators at the Veterans Health Administration 2006-2014 (combined)
Source Veterans Health Administration National Center for Patient Safety data collected October 2006 to October 2014
Note Examples of equipment failures include ventilator shutdown and other ventilator problems Ventilator settings include setup problems and
incorrect settings Support activities include space utilities and supplies Transport includes accidental extubation other transportation issues
and vehicle-related issues Alarms include alarm settings and alarm connection Training includes unknown ventilator model and other training
concerns
0
20
40
60
80
100
120
140
160
EquipmentFailure
VentilatorSettings
SupportActivities
Transport Alarms Training
Nu
mb
er o
f R
epo
rts
Importance Beginning with a focus on ventilators the Veterans Health Administrationrsquos
human factors-based Purchasing for Safety Initiative communicates the most common use-
issues associated with medical devices in order to ultimately remove or contain identified
vulnerabilities and prevent further harm
Event Reporting Patient safety managers report events and close calls from more than 150
VA facilities to a national database The largest number of use issues related to ventilators
involved equipment failure and issues such as spontaneous ventilator shutdown compressor
failure and broken or missing parts Other categories of ventilator use issues involved the
physical space where the ventilator was used challenges of transporting patients on
ventilators and problems with ventilator settings and alarms Root cause analyses on reports
are conducted and Patient Safety Alerts are issued to share the learning internally
Other Key Components
Data on ventilator issues from the VA and the Food and Drug Administrationrsquos Medical
Product Safety Network are the basis for a ldquogovernment-industry dayrdquo to work with
manufacturers This information is used to help the device manufacturers better
understand the limits of human use of their products
National Healthcare Quality and Disparities Report | 41
Patient Safety
The VA also trains noncliniciansmdashsuch as biomedical engineers across the
organizationmdashto understand the devices consider the situation for their use and identify
what can go wrong (ldquofailure modesrdquo) in advance
The VA encourages discussions among clinicians about their experience in using devices
In the Applied Patient Safety Challenge hundreds of staff participate in brainstorming
about solutions and strategies for dealing with unexpected scenarios involving devices
National Practitioner Data Bank
Medical malpractice actions are one way to flag potential medical errors
Medical Malpractice Payment Reports are submitted to the National Practitioner Data Bank
by medical malpractice payers
Report of a monetary exchange made for the benefit of a physician dentist or other
health care provider
Result of a settlement or judgment of a written complaint or claim based on that
providerrsquos delivery of or failure to deliver health care services
Number of Medical Malpractice Payment Reports by Setting
Number of Medical Malpractice Payment Reports by health care setting 2004-2014
Source National Practitioner Data Bank (NPDB) Public Use Data File Health Resources and Services Administration Bureau of Health
Professions Division of Practitioner Data Banks 2004-2014
Note Health care setting was not collected by the NPDB for 2104 reports in 2004 ldquoOtherrdquo includes Medical Malpractice Payment Reports
related to unknown settings as well as those for a combination of inpatient and outpatient settings Reports pertain to patients of any age
0
2000
4000
6000
8000
10000
12000
14000
16000
18000
20000
2004 2005 2006 2007 2008 2009 2010 2011 2012 2013 2014
Nu
mb
er o
f R
epo
rts
Total Inpatient Outpatient Other
42 | National Healthcare Quality and Disparities Report
Patient Safety
Trends The total number of medical malpractice payment reports (MMPRs) per year
decreased from 17641 in 2004 to 12699 in 2014
Variation Across Reports
Of 157022 MMPRs from 2004 through 2014 more reports related to care in the
outpatient setting (71937) than in the inpatient setting (60391)
Diagnosis-related and treatment-related payments were the most frequent types of
reports each accounting for about 27 of cases Reports of payments for medication-
related cases accounted for only 5 of MMPRs (data not shown)
Number of Medical Malpractice Payment Reports by Allegation and Harm
Number of Medical Malpractice Payment Reports by type of allegation and harm severity 2004-2014
Key Temporary injury = Minor temporary injury and Major temporary injury Permanent significant injury = Significant Permanent Injury
Major Permanent Injury Quadriplegia Brain Damage Lifelong care
Source National Practitioner Data Bank Public Use Data File Health Resources and Services Administration Bureau of Health Professions
Division of Practitioner Data Banks 2004-2014
Note Reports pertain to patients of any age
0
20
40
60
80
100
Treatment(n=42913)
Diagnosis(n=42507)
Surgery(n=36845)
Obstetrics(n=10555)
Medication(n=8287)
Monitoring(n=5329)
Anesthesia(n=4276)
Equipment(n=1161)
BehavioralHealth
(n=879)
Blood(n=379)
EmotionalInjury Only
InsignificantInjury
TemporaryInjury
PermanentMinor Injury
PermanentSignificant Injury
Death Unknown
Overall Percentage From 2004 to 2014 medical malpractice payments were made for
allegations related to
Treatment (42913)
Diagnosis (42507)
Surgery (36845)
Obstetrics (10555)
Medication (8287)
Monitoring (5329)
National Healthcare Quality and Disparities Report | 43
Patient Safety
Anesthesia (4276)
Equipment or products (1161)
Behavioral health (879) and
IV and blood products (379)
Variation Across Reports
Death accounted for more than one-third of harm in payments related to monitoring
(499) diagnosis (393) medication (383) and anesthesia (363) allegations
More than half of all obstetric payments were for allegations of permanent severe harm
(570)
Temporary harm accounted for more than one-third of payments related to equipment
(485) and surgery (360)
Most of the behavioral health-related payments were for emotional harm (457) or
death (338)
References
Agency for Healthcare Research and Quality Making Health Care Safer II An Updated Critical Analysis of the
Evidence for Patient Safety Practices Comparative Effectiveness Review No 211 Rockville MD Agency for
Healthcare Research and Quality March 2013 AHRQ Publication No 13-E001-EF
httpwwwahrqgovsitesdefaultfileswysiwygresearchfindingsevidence-basedshy
reportsservicesqualityptsafetyII-fullpdf
Arriaga AF Lancaster RT Berry RW et al The better colectomy project association of evidence-based best-
practice adherence rates to outcomes in colorectal surgery Ann Surg 2009 Oct250(4)507-13
httpwwwncbinlmnihgovpubmed19734778
Centers for Disease Control and Prevention HAI Prevalence Survey
httpwwwcdcgovHAIsurveillanceindexhtml Last updated March 2016 Accessed March 4 2016
Centers for Disease Control and Prevention Nursing Homes and Assisted Living (Long-Term Care Facilities)
httpwwwcdcgovlongtermcare Last updated September 2015 Accessed March 4 2016
Chassin MR Loeb JM High-reliability health care getting there from here Milbank Q 201391(3)459-90
httpwwwncbinlmnihgovpmcarticlesPMC3790522 Accessed September 23 2015
Chiu Y Bero L Hessol NA et al A literature review of clinical outcomes associated with antipsychotic medication
use in North American nursing home residents Health Policy 2015 Jun119(6)802-813 Epub 2015 Feb 28 PMID
25791166 httpwwwsciencedirectcomsciencearticlepiiS0168851015000652 Accessed June 17 2015
Huybrechts KF Gerhard Crystal S et al Differential risk of death in older residents in nursing homes prescribed
specific antipsychotic drugs Population based cohort study BMJ 2012 Feb 23344e977 PMID 22362541
httpwwwncbinlmnihgovpmcarticlesPMC3285717 Accessed June 17 2015
Institute of Medicine Preventing Medication Errors Quality Chasm Series 2007
httpwwwnapeducatalog11623preventing-medication-errors-quality-chasm-series
National Association for Home Care amp Hospice Basic Statistics About Home Care Updated 2010
httpwwwnahcorgassets1710hc_statspdf Accessed August 31 2015
44 | National Healthcare Quality and Disparities Report

Patient Safety
Chartbook Contents
This chartbook includes
Summary of trends across measures of Patient Safety from the QDR
Figures illustrating select measures of Patient Safety
Introduction and Methods contains information about methods used in the chartbook A Data
Query tool (httpnhqrnetahrqgovinhqrdrdataquery) provides access to all data tables
Summary of Trends Across National Quality Strategy Priorities
Number and percentage of all quality measures that are improving not changing or worsening through 2013 overall and by NQS priority
110
16
19 35 2118
62
3
10 18 1313
19 1 2 5 36
0
20
40
60
80
100
Total (n=191) Person-Centered Care
(n=20)
Patient Safety(n=31)
Healthy Living(n=58)
EffectiveTreatment
(n=37)
CareCoordination
(n=37)
Improving No Change Worsening
Key n = number of measures
Number and percentage of all quality measures that are improving not changing or worsening through 2013 overall and by NQS priority
110
16
19 35 2118
62
3
10 18 1313
19 1 2 5 36
0
20
40
60
80
100
Total (n=191) Person-Centered Care
(n=20)
Patient Safety(n=31)
Healthy Living(n=58)
EffectiveTreatment
(n=37)
CareCoordination
(n=37)
Improving No Change Worsening
Key n = number of measures
Note For most measures trend data are available from 2001-2002 to 2012 For each measure with at least four
estimates over time weighted log-linear regression is used to calculate average annual percentage change and to assess statistical significance Measures are aligned so that positive change indicates improved access to care
Improving = Rates of change are positive at 1 per year or greater and are statistically significant
No Change = Rate of change is less than 1 per year or is not statistically significant
Worsening = Rates of change are negative at -1 per year or greater and are statistically significant
2 | National Healthcare Quality and Disparities Report
Patient Safety
Through 2013 across a broad spectrum of measures of health care quality 60 showed
improvement (black)
About 80 of measures of Person-Centered Care improved
About 60 of measures of Effective Treatment Healthy Living and Patient Safety
improved
Fewer than half of measures of Care Coordination improved
There are insufficient numbers of reliable measures of Care Affordability to summarize in
this way
Summary of Quality Disparities
Number and percentage of patient safety measures for which members of selected groups experienced better same or worse quality of care compared with reference group
28
123
11
8
19
16 1117
814
103 6
0
20
40
60
80
100
Poor vs HighIncome (n=18)
Black vs White(n=41)
Asian vs White(n=38)
AIAN vs White(n=17)
Hispanic vsWhite (n=34)
Better Same Worse
Key AIAN = American Indian and Alaska Native n = number of measures
Number and percentage of patient safety measures for which members of selected groups experienced better same or worse quality of care compared with reference group
28
123
11
8
19
16 1117
814
103 6
0
20
40
60
80
100
Poor vs HighIncome (n=18)
Black vs White(n=41)
Asian vs White(n=38)
AIAN vs White(n=17)
Hispanic vsWhite (n=34)
Better Same Worse
Key AIAN = American Indian and Alaska Native n = number of measures
Note Poor indicates family income less than the Federal poverty level High Income indicates family income four
times the Federal poverty level or greater Numbers of measures differ across groups because of sample size limitations For most measures data from 2012 are shown The relative difference between a selected group and its reference group is used to assess disparities
Better = Selected group received better quality of care than reference group Differences are statistically
significant are equal to or larger than 10 and favor the selected group
Same = Selected group and reference group received about the same quality of care Differences are not
statistically significant or are smaller than 10
Worse = Selected group received worse quality of care than reference group Differences are statistically
significant are equal to or larger than 10 and favor the reference group
National Healthcare Quality and Disparities Report | 3
Patient Safety
People in poor households received worse care than people in high-income households for
about 45 of patient safety measures
Blacks received worse care than Whites for about 20 of patient safety measures and
Asians received worse care than Whites for about 30 of patient safety measures
Patient Safety Measures With Disparities That Were Getting Smaller Over Time
Note Bold indicates disparities that were eliminated
Black vs White Gap
Admissions with central venous catheter-related bloodstream infection per 1000 medical
and surgical discharges of length 2 or more days
Postoperative pulmonary embolism or deep vein thrombosis per 1000 surgical admissions
Postoperative respiratory failure per 1000 elective-surgery admissions
Admissions with iatrogenic pneumothorax per 1000 discharges
Poor vs High Income Gap
Admissions with accidental puncture or laceration during procedure per 1000 medical
and surgical admissions age less than 18 years
Hispanic vs Non-Hispanic White Gap
Adult surgery patients with postoperative catheter-associated urinary tract infection
Asian vs White Gap
Deaths per 1000 elective-surgery admissions having developed specified complications
of care during hospitalization
Patient Safety Measures That Developed New Disparities
Asian vs White Gap
Accidental puncture or laceration during procedure per 1000 medical and surgical
admissions age 18 and over
Home health care patients who get better at taking their medication correctly
Obstetric trauma per 1000 instrument-assisted vaginal deliveries
Hispanic vs Non-Hispanic White Gap
Postoperative physiologic and metabolic derangements per 1000 elective-surgery admissions
4 | National Healthcare Quality and Disparities Report
Patient Safety
Measures of Patient Safety
Summary of information on patient safety from the National Healthcare Quality and
Disparities Report
Individual measures of patient safety overall and by age sex race ethnicity income
education insurance birth weight health status and presence of various health conditions
Measures of patient safety by setting
Hospitals
Nursing homes
Home health
Ambulatory care
All settings Infrastructure
Patient Safety in the Hospital Setting
Hospitals are a common setting for patient safety events
Many patients admitted to the hospital are in a clinically compromised state
Care often includes the use of invasive devices and procedures increasing patientsrsquo risk
for infection and harm
Measures include
Overall hospital-acquired conditions (HACs)
Healthcare-associated infections (HAIs)
Procedure-related events
National Healthcare Quality and Disparities Report | 5
Patient Safety
6 | National Healthcare Quality and Disparities Report
Distribution of Hospital-Acquired Conditions
Importance Hospital-acquired conditions (HACs) are conditions that patients did not have upon hospital admission but which developed during the patientrsquos hospital stay They can lead to poor patient outcomes and increased spending on health care HACs are often preventable
Overall Rate
In 2014 the overall HAC rate was 121 per 1000 hospital discharges Adverse drug events (414 per 1000 hospital discharges) accounted for 342 of total HACs and pressure ulcers (309 per 1000 hospital discharges) accounted for 255 of the total
Trends
From 2010 through 2014 the overall rate of hospital-acquired conditions declined 17 from 145 to 121 per 1000 hospital discharges
Among the most frequent HACs between 2010 and 2014 the rate of pressure ulcers decreased the most from 403 per 1000 discharges (more than 13 million events) to 309 per 1000 discharges (about 1 million events)
403 404 394 325 309
495 487 419403 414
122 113106
88 76
79 7872
72 79
81 7374
69 67
273 267257
251 266
0
20
40
60
80
100
120
140
160
2010 2011 2012 2013 2014
Rat
e p
er 1
00
0 D
isch
arge
s
Pressure Ulcers Adverse DrugEvents
Catheter-AssociatedUrinary Tract Infections
Falls Lower FrequencyHACs
All Other HACs
145 142132
121 121
Source Agency for Healthcare Research and Quality (AHRQ) Medicare Patient Safety Monitoring System 2010-2014 Healthcare Cost and
Utilization Project Nationwide Inpatient Sample 2010-2013 Centers for Disease Control and Prevention National Healthcare Safety Network
2010-2013
Denominator Adult hospital discharges age 18 and over
Note Lower Frequency HACs (lt31000 discharges) include central line-associated bloodstream infections venous thromboembolisms surgical
site infections obstetric adverse events and ventilator-associated pneumonia All Other Hospital-Acquired Conditions includes inadvertent femoral
artery puncture for catheter angiographic procedures adverse event associated with hip joint replacement adverse event associated with knee
joint replacement contrast nephropathy associated with catheter angiography methicillin-resistant Staphylococcus aureus (MRSA) vancomycin-
resistant Enterococcus (VRE) C difficile mechanical complications associated with central venous catheters postoperative cardiac events for
cardiac and noncardiac surgeries postoperative pneumonia iatrogenic pneumothorax postoperative hemorrhage or hematoma postoperative
respiratory failure and accidental puncture or laceration For more information on methods see httpwwwahrqgovprofessionalsquality-patient-
safetypfpinterimhacrate2014html
Distribution of hospital-acquired conditions based on national rates per 1000 adult hospital discharges 2010-2014
403 404 394 325 309
495 487 419403 414
122 113106
88 76
79 7872
72 79
81 7374
69 67
273 267257
251 266
0
20
40
60
80
100
120
140
160
2010 2011 2012 2013 2014
Rat
e p
er 1
00
0 D
isch
arge
s
Pressure Ulcers Adverse DrugEvents
Catheter-AssociatedUrinary Tract Infections
Falls Lower FrequencyHACs
All Other HACs
145 142132
121 121
Source Agency for Healthcare Research and Quality (AHRQ) Medicare Patient Safety Monitoring System 2010-2014 Healthcare Cost and
Utilization Project Nationwide Inpatient Sample 2010-2013 Centers for Disease Control and Prevention National Healthcare Safety Network
2010-2013
Denominator Adult hospital discharges age 18 and over
Note Lower Frequency HACs (lt31000 discharges) include central line-associated bloodstream infections venous thromboembolisms surgical
site infections obstetric adverse events and ventilator-associated pneumonia All Other Hospital-Acquired Conditions includes inadvertent femoral
artery puncture for catheter angiographic procedures adverse event associated with hip joint replacement adverse event associated with knee
joint replacement contrast nephropathy associated with catheter angiography methicillin-resistant Staphylococcus aureus (MRSA) vancomycin-
resistant Enterococcus (VRE) C difficile mechanical complications associated with central venous catheters postoperative cardiac events for
cardiac and noncardiac surgeries postoperative pneumonia iatrogenic pneumothorax postoperative hemorrhage or hematoma postoperative
respiratory failure and accidental puncture or laceration For more information on methods see httpwwwahrqgovprofessionalsquality-patient-
safetypfpinterimhacrate2014html
Distribution of hospital-acquired conditions based on national rates per 1000 adult hospital discharges 2010-2014
Patient Safety
During that same period adverse drug events decreased from a rate of 495 per 1000
discharges (more than 16 million events) to 414 per 1000 discharges (fewer than 14
million events) The catheter-associated urinary tract infection rate decreased from 122
to 76 per 1000 discharges (400000 and 250000 events respectively)
Among the less frequent HACs central line-associated bloodstream infections had the
greatest percentage decrease in rate (67) between 2010 and 2014 The rates of venous
thromboembolism (44) surgical site infections (17) and obstetric events (4) also
decreased
Healthcare-Associated Infections
Infections acquired during a hospital stay are among the most common complications of
hospital care
On any given day about 1 in 25 hospital patients has at least one healthcare-associated
infection (HAI) (CDC 2016)
HAIs often increase the patientrsquos length of stay in the hospital risk of mortality and hospital
costs
New infections in critically ill infants children and other patients generally reduce their
chances for recovery
For more information see the PSNet link to Patient Safety Primer Health Care-Associated
Infections at httpspsnetahrqgovprimersprimer7
Measures of Patient Safety in the Hospital Setting HAIs
Postoperative sepsis per 1000 adult discharges with an elective operating room procedure
Standardized infection ratios (SIRs) for central line-associated bloodstream infections
surgical site infections and catheter-associated urinary tract infections (CAUTIs)
SIRs compare the observed number of infections reported to the National Healthcare
Safety Network (NHSN) during a year to the predicted number of infections based on the
January 2006 to December 2008 referent period for central line-associated bloodstream
infections (CLABSIs) and surgical site infections (SSIs) and the calendar year 2009
referent period for CAUTIs
Change in SIRs for CAUTIs
Bloodstream infections per 1000 central-line days
In neonatal intensive care units (NICUs)
In adult intensive care units
National Healthcare Quality and Disparities Report | 7
Patient Safety
Postoperative Sepsis
Postoperative sepsis per 1000 adult discharges with an elective operating room procedure by sex and insurance status 2008-2013
Source Agency for Healthcare Research and Quality (AHRQ) Healthcare Cost and Utilization Project Nationwide Inpatient Sample 2008-
2013 and AHRQ Quality Indicators version 44
Denominator All elective hospital surgical discharges for patients age 18 years and over with length of stay of 4 or more days excluding
patients admitted for infection those with cancer or immunocompromised states those with obstetric conditions and admissions specifically for
sepsis
Note For this measure lower rates are better Acute care hospitalizations only Rates are adjusted by age sex age-sex interactions
comorbidities major diagnostic category diagnosis-related group and transfers into the hospital
0
5
10
15
20
25
2008 2009 2010 2011 2012 2013
Rat
e p
er
10
00
Dis
char
ges
Total Male Female
0
5
10
15
20
25
2008 2009 2010 2011 2012 2013
Rat
e p
er
10
00
Dis
char
ges
Private MedicareMedicaid Uninsured
Postoperative sepsis per 1000 adult discharges with an elective operating room procedure by sex and insurance status 2008-2013
Source Agency for Healthcare Research and Quality (AHRQ) Healthcare Cost and Utilization Project Nationwide Inpatient Sample 2008-
2013 and AHRQ Quality Indicators version 44
Denominator All elective hospital surgical discharges for patients age 18 years and over with length of stay of 4 or more days excluding
patients admitted for infection those with cancer or immunocompromised states those with obstetric conditions and admissions specifically for
sepsis
Note For this measure lower rates are better Acute care hospitalizations only Rates are adjusted by age sex age-sex interactions
comorbidities major diagnostic category diagnosis-related group and transfers into the hospital
0
5
10
15
20
25
2008 2009 2010 2011 2012 2013
Rat
e p
er
10
00
Dis
char
ges
Total Male Female
0
5
10
15
20
25
2008 2009 2010 2011 2012 2013
Rat
e p
er
10
00
Dis
char
ges
Private MedicareMedicaid Uninsured
Overall Rate In 2013 the postoperative sepsis rate was 143 per 1000 adult discharges with
an elective operating room procedure
Groups With Disparities
In 2013 female patients had a lower rate of postoperative sepsis than male patients
Also in 2013 patients with Medicaid and those with Medicare had worse sepsis rates
than privately insured patients
From 2008 to 2013 there were no statistically significant changes in the gap between
males and females
From 2008 to 2013 there were no statistically significant changes in the gap between
privately insured patients and other insurance groups
8 | National Healthcare Quality and Disparities Report
Patient Safety
Standardized Infection Ratios
Standardized infection ratios for central line-associated bloodstream infections and surgical site infections 2009-2013 and catheter-associated
urinary tract infections 2010-2013
Key CLABSI = central line-associated bloodstream infection SSI = surgical site infection SCIP = Surgical Care Improvement Project CAUTI =
catheter-associated urinary tract infection
Source Centers for Disease Control and Prevention National Center for Emerging and Zoonotic Infectious Diseases 2013 National and State
Healthcare Associated Infections Progress Report and National Healthcare Safety Network 2009ndash2013
Note For this measure lower numbers are better Acute care hospitalizations only CAUTI excludes neonatal intensive care units
00
02
04
06
08
10
12
14
2009 2010 2011 2012 2013
Stan
dar
diz
ed
Infe
ctio
n R
atio
CLABSI All SSI Combined SCIP Procedures CAUTI All
Standardized infection ratios for central line-associated bloodstream infections and surgical site infections 2009-2013 and catheter-associated
urinary tract infections 2010-2013
Key CLABSI = central line-associated bloodstream infection SSI = surgical site infection SCIP = Surgical Care Improvement Project CAUTI =
catheter-associated urinary tract infection
Source Centers for Disease Control and Prevention National Center for Emerging and Zoonotic Infectious Diseases 2013 National and State
Healthcare Associated Infections Progress Report and National Healthcare Safety Network 2009ndash2013
Note For this measure lower numbers are better Acute care hospitalizations only CAUTI excludes neonatal intensive care units
00
02
04
06
08
10
12
14
2009 2010 2011 2012 2013
Stan
dar
diz
ed
Infe
ctio
n R
atio
CLABSI All SSI Combined SCIP Procedures CAUTI All
Background SIRs compare the observed number of infections reported to the NHSN during
a year to the predicted number of infections based on the January 2006 to December 2008
referent period for CLABSIs and SSIs and the calendar year 2009 referent period for
CAUTIs For example a ratio of 81 for SSIs in 2013 indicates that 19 fewer SSIs were
observed in 2013 than predicted based on the 2006-2008 baseline period Data are from all
intensive care units wards and other non-critical care locations CLABSI data also include
neonatal intensive care units but exclude long-term acute care hospitals and inpatient
rehabilitation facilities SCIP procedures are those performed on adults Number of facilities
reporting to NHSN roughly tripled from 2009 to 2013 Procedures include abdominal aortic
aneurysm repair peripheral vascular bypass surgery coronary artery bypass graft with both
chest and donor site incisions or with chest incision only other cardiac surgery colon
surgery rectal surgery hip arthroplasty abdominal hysterectomy knee arthroplasty and
vaginal hysterectomy
Overall Rate In 2013 the overall SIR for CLABSIs among intensive care units in the 50
States District of Columbia and Puerto Rico was 054 and the overall SIR for CAUTIs was
106 The overall SIR for SSIs following 10 common procedures in adults was 081
Trends From 2009 to 2013 the SIR for CLABSIs improved and from 2010 to 2013 the
SIR for CAUTIs worsened for facilities reporting to NHSN
National Healthcare Quality and Disparities Report | 9
Patient Safety
Change in Statewide SIRs
Change from 2012 to 2013 in Statewide SIRs for CAUTI
Key CAUTI = catheter-associated urinary tract infection NHSN = National Healthcare Safety Network
Source Centers for Disease Control and Prevention National Center for Emerging and Zoonotic Infectious Diseases 2013 National and State
Healthcare Associated Infections Progress Report
Note For this measure lower numbers are better Changes in SIRs are categorized as ldquono changerdquo if they are not statistically significant Acute
care hospitalizations only Excludes neonatal intensive care units For this measure District of Columbia and Puerto Rico are treated as States
No Change
Increase
Indicates State mandate
in 2013 to report CAUTI
to NHSN
Decrease
AKAK
HI PR
AZ
CA
UT
CT
FL
GA
IA
IL
KS
MA
MDMO
NJ
NY
OR
PA
SCTN
CO
WA
WI
VA
ME
MN
MI
NC
TX
KY
WV
RI
NE
VT
NVOH
SD
AR
IN
NH
MT
ID
WY
ND
NM
OK
LA
MS AL
DE
DC
Change from 2012 to 2013 in Statewide SIRs for CAUTI
Key CAUTI = catheter-associated urinary tract infection NHSN = National Healthcare Safety Network
Source Centers for Disease Control and Prevention National Center for Emerging and Zoonotic Infectious Diseases 2013 National and State
Healthcare Associated Infections Progress Report
Note For this measure lower numbers are better Changes in SIRs are categorized as ldquono changerdquo if they are not statistically significant Acute
care hospitalizations only Excludes neonatal intensive care units For this measure District of Columbia and Puerto Rico are treated as States
No Change
Increase
Indicates State mandate
in 2013 to report CAUTI
to NHSN
Decrease
AKAK
HI PR
AZ
CA
UT
CT
FL
GA
IA
IL
KS
MA
MDMO
NJ
NY
OR
PA
SCTN
CO
WA
WI
VA
ME
MN
MI
NC
TX
KY
WV
RI
NE
VT
NVOH
SD
AR
IN
NH
MT
ID
WY
ND
NM
OK
LA
MS AL
DE
DC
Geographic Variation In 2013 31 States had SIRs greater than 1 indicating that on average
their hospitals had more CAUTIs than hospitals of similar type and size during the 2009
referent period The States were Alaska Arkansas Arizona Connecticut District of Columbia
Delaware Georgia Idaho Indiana Kansas Kentucky Massachusetts Maryland Maine
Michigan Minnesota Missouri Mississippi North Carolina New Jersey Nevada New York
Oregon Pennsylvania Rhode Island South Carolina Tennessee Texas Utah Virginia and
Washington
Trends Of 52 reporting States 33 had no change from 2012 to 2013 in CAUTI SIRs 9
decreased and 10 increased
Toolkit for Reducing Catheter-Associated Urinary Tract Infections in Hospitals
Purpose To help hospitals prevent catheter-associated urinary tract infections (CAUTIs) and
improve safety culture
Method Implementing evidence-based practical resources and concepts from the
Comprehensive Unit-based Safety Program
Intended User Hospital facilities
Available Tools Guides checklists webinars learning modules data interpretation guides
10 | National Healthcare Quality and Disparities Report
Patient Safety
Potential Measures of Effectiveness
Number of symptomatic CAUTIs attributable to each unit by month
Days since last CAUTI
Link httpwwwahrqgovprofessionalsquality-patient-safetyhaistoolscautishy
hospitalsIndexhtml
Central Line-Associated Bloodstream Infections in Neonatal Intensive Care Units
Central line-associated bloodstream infections per 1000 central-line days by birth weight of child in Level III neonatal intensive care units and by type
of pediatric ICU 2009-2013
Source Centers for Disease Control and Prevention National Healthcare Safety Network 2009-2013
Denominator Infections per 1000 central-line days
Note For this measure lower rates are better Acute care hospitalizations only
00
05
10
15
20
25
30
35
40
2009 2010 2011 2012 2013
Rat
e p
er
10
00
Ce
ntr
al-
Lin
e D
ays
le750 g 751-1000 g1001-1500 g 1501-2500 ggt2500 g
Level III Neonatal ICUs
00
05
10
15
20
25
30
35
40
2009 2010 2011 2012 2013
Rat
e p
er
10
00
Ce
ntr
al-
Lin
e D
ays
Pediatric Cardiothoracic ICUPediatric Medical ICUPediatric MedicalSurgical ICU
Pediatric ICUs
Central line-associated bloodstream infections per 1000 central-line days by birth weight of child in Level III neonatal intensive care units and by type
of pediatric ICU 2009-2013
Source Centers for Disease Control and Prevention National Healthcare Safety Network 2009-2013
Denominator Infections per 1000 central-line days
Note For this measure lower rates are better Acute care hospitalizations only
00
05
10
15
20
25
30
35
40
2009 2010 2011 2012 2013
Rat
e p
er
10
00
Ce
ntr
al-
Lin
e D
ays
le750 g 751-1000 g1001-1500 g 1501-2500 ggt2500 g
Level III Neonatal ICUs
00
05
10
15
20
25
30
35
40
2009 2010 2011 2012 2013
Rat
e p
er 1
000
Cen
tral
-Lin
e D
ays
Pediatric Cardiothoracic ICUPediatric Medical ICUPediatric MedicalSurgical ICU
Pediatric ICUs
Overall Rates
In 2013 among patients in Level III NICUs pooled mean CLABSI rates ranged from a
low of 06 infections per 1000 central-line days among neonates born at 1501 to 2500
grams to a high of 21 infections per 1000 central-line days among neonates born at less
than or equal to 750 grams
Trends
The rate of CLABSI among pediatric cardiothoracic ICUs was 25 in 2009 and 13 in
2013 among pediatric medical ICUs 26 in 2009 and 08 in 2013 and among pediatric
medicalsurgical ICUs 22 in 2009 and 12 in 2013
National Healthcare Quality and Disparities Report | 11
Patient Safety
Central Line-Associated Bloodstream Infections in Adult Intensive Care Units
Central linendashassociated bloodstream infections per 1000 central-line days in adult medical vs medicalsurgical intensive care units by hospital teaching
status 2006ndash2013
Source Centers for Disease Control and Prevention National Healthcare Safety Network 2006-2013
Denominator Infections per 1000 central-line days
Note For this measure lower rates are better Acute care hospitalizations only Major teaching facilities are defined as facilities with a program
for medical students and postgraduate medical training All other medical facilities include graduate facilities with programs for postgraduate
medical training only (ie residency andor fellowships) and undergraduate facilities with programs for medical students only
00
05
10
15
20
25
30
2006-2008 2009 2010 2011 2012 2013
Rat
e p
er
10
00
Ce
ntr
al-L
ine
Day
s
Major Teaching Medical ICU All Others Medical ICU
Major Teaching MedicalSurgical ICU All Others MedicalSurgical ICU
Central linendashassociated bloodstream infections per 1000 central-line days in adult medical vs medicalsurgical intensive care units by hospital teaching
status 2006ndash2013
Source Centers for Disease Control and Prevention National Healthcare Safety Network 2006-2013
Denominator Infections per 1000 central-line days
Note For this measure lower rates are better Acute care hospitalizations only Major teaching facilities are defined as facilities with a program
for medical students and postgraduate medical training All other medical facilities include graduate facilities with programs for postgraduate
medical training only (ie residency andor fellowships) and undergraduate facilities with programs for medical students only
00
05
10
15
20
25
30
2006-2008 2009 2010 2011 2012 2013
Rat
e p
er
10
00
Ce
ntr
al-L
ine
Day
s
Major Teaching Medical ICU All Others Medical ICU
Major Teaching MedicalSurgical ICU All Others MedicalSurgical ICU
Trends
Between 2006-2008 (combined) and 2013 there was a 46 decrease in CLABSIs (data
not shown)
From 2006-2008 (combined) to 2013 rates of CLABSIs in hospitals decreased 538
among adult medical ICU patients in hospitals with major teaching programs 476
among adult medicalsurgical ICU patients in hospitals with major teaching programs
421 among adult medical ICU patients in all other hospitals and 467 among adult
medicalsurgical ICU patients in all other hospitals
Tools for Reducing Central Line-Associated Bloodstream Infections
Purpose To help hospitals prevent central line-associated bloodstream infections (CLABSIs)
and improve safety culture
Methods Implementing evidence-based practical resources and concepts from the
Comprehensive Unit-based Safety Program (CUSP)
Intended user Hospital facilities
Available tools Checklists preventable incidence calculator audit form event report
template
12 | National Healthcare Quality and Disparities Report
Patient Safety
Impact
Through use of the CUSP toolkit and CLABSI tools more than 100 intensive care units
in Michigan have nearly eliminated CLABSIs
Nationwide the use of this toolkit has helped more than 1000 hospitals reduce rates of
CLABSI by 41 in aggregate See httpwwwahrqgovworkingforqualitypias
mhhakcpiahtm and httpwwwahrqgovprofessionalseducationcurriculumshy
toolsclabsitoolsindexhtmlpurpose
Procedure-Related Events
More than 40 million operative procedures are performed in the United States each year
Postoperative adverse events are not uncommon and increase both hospitalization length and
cost (AHRQ 2013)
Measures include
Risk-adjusted mortality at 30 days postoperation for colorectal surgery performed in
adults
Percentage of adult patients receiving hip joint replacement (because of fracture or
degenerative conditions) who experienced adverse events
Percentage of adults with mechanical adverse events associated with central venous
catheter placement
Postoperative Mortality
Risk-adjusted mortality rate within 30 days postoperation for adults undergoing colorectal surgery in ACS NSQIP participating hospitals in the United States by
raceethnicity and hospital teaching status 2008-2014
0
1
2
3
4
5
6
Pe
rce
nt
Teaching Nonteaching
Source American College of Surgeons (ACS) National Surgical Quality Improvement Program (NSQIP) 2008-2014
Denominator Adults age 18 years and over
Note For this measure lower percentages are better The participation in the ACS NSQIP is voluntary and current participation is weighted
when calculating rates Participating hospitals have changed over time 203 hospitals participated in 2008 and 531 hospitals participated in
2014 Other includes Asian American Indian or Alaska Native and Native Hawaiian or Other Pacific Islander White Black and Other are non-
Hispanic Hispanic includes all races
0
1
2
3
4
5
6
Pe
rce
nt
Total White Black Hispanic Other
Risk-adjusted mortality rate within 30 days postoperation for adults undergoing colorectal surgery in ACS NSQIP participating hospitals in the United States by
raceethnicity and hospital teaching status 2008-2014
0
1
2
3
4
5
6
Pe
rce
nt
Teaching Nonteaching
Source American College of Surgeons (ACS) National Surgical Quality Improvement Program (NSQIP) 2008-2014
Denominator Adults age 18 years and over
Note For this measure lower percentages are better The participation in the ACS NSQIP is voluntary and current participation is weighted
when calculating rates Participating hospitals have changed over time 203 hospitals participated in 2008 and 531 hospitals participated in
2014 Other includes Asian American Indian or Alaska Native and Native Hawaiian or Other Pacific Islander White Black and Other are non-
Hispanic Hispanic includes all races
0
1
2
3
4
5
6
Pe
rce
nt
Total White Black Hispanic Other
National Healthcare Quality and Disparities Report | 13
Patient Safety
Importance Colorectal procedures have high rates of postoperative complications
Nonadherence to evidence-based best practices is associated with an increased risk of these
complications (Arriaga et al 2009)
Overall Rate In 2014 the risk-adjusted mortality rate was 31 among patients undergoing
colorectal surgeries at ACS NSQIP participating hospitals
Trends From 2008 to 2014 30-day postoperative mortality after colorectal surgery
improved
Groups With Disparities
In 2014 the percentage of patients with 30-day postoperative mortality was worse for
Blacks (36) compared with Whites (30)
From 2008 to 2014 there were no statistically significant changes in the gap between
minority groups and Whites in the percentage of patients with 30-day postoperative
mortality
Adverse Events After Hip Joint Replacement
Adult patients receiving hip joint replacement due to fracture or degenerative conditions who experienced adverse events by age and chronic obstructive
pulmonary disease 2009-2013
02468
101214161820
2009 2010 2011 2012 2013
Pe
rce
nt
Total 65-74 75-84 85+
02468
101214161820
2009 2010 2011 2012 2013
Pe
rce
nt
COPD No COPD
Key COPD = chronic obstructive pulmonary disease
Source Agency for Healthcare Research and Quality (AHRQ) and Centers for Medicare amp Medicaid Services (CMS) Medicare Patient Safety
Monitoring System (MPSMS) 2009-2013
Denominator All patients age 18 years and over in the MPSMS sample who had a surgical procedure performed to replace a hip joint due to
degenerative conditions or a fractured hip
Note For this measure lower percentages are better Hospitals in Puerto Rico the Virgin Islands and Maryland were not included in the
annual samples Samples were drawn from the CMS Hospital Inpatient Quality Reporting program and consist of medical records for
discharges following hip arthroplasty procedures as defined by the Surgical Care Improvement Project Rates for patients age 85 years and
over in 2013 and for ages 18-64 years old for all years are not shown because the data did not meet the criteria for statistical reliability data
quality or confidentiality COPD status relates to patients with a principal or secondary discharge diagnosis of COPD
Adult patients receiving hip joint replacement due to fracture or degenerative conditions who experienced adverse events by age and chronic obstructive
pulmonary disease 2009-2013
02468
101214161820
2009 2010 2011 2012 2013
Pe
rce
nt
Total 65-74 75-84 85+
02
4
68
10
12
1416
18
20
2009 2010 2011 2012 2013
Pe
rce
nt
COPD No COPD
Key COPD = chronic obstructive pulmonary disease
Source Agency for Healthcare Research and Quality (AHRQ) and Centers for Medicare amp Medicaid Services (CMS) Medicare Patient Safety
Monitoring System (MPSMS) 2009-2013
Denominator All patients age 18 years and over in the MPSMS sample who had a surgical procedure performed to replace a hip joint due to
degenerative conditions or a fractured hip
Note For this measure lower percentages are better Hospitals in Puerto Rico the Virgin Islands and Maryland were not included in the
annual samples Samples were drawn from the CMS Hospital Inpatient Quality Reporting program and consist of medical records for
discharges following hip arthroplasty procedures as defined by the Surgical Care Improvement Project Rates for patients age 85 years and
over in 2013 and for ages 18-64 years old for all years are not shown because the data did not meet the criteria for statistical reliability data
quality or confidentiality COPD status relates to patients with a principal or secondary discharge diagnosis of COPD
Importance Hip replacement is most common among older adults who have an increased
risk of adverse events after these surgeries
14 | National Healthcare Quality and Disparities Report
Patient Safety
Overall Percentage In 2013 49 of patients receiving a hip joint replacement experienced
an adverse event
Trends From 2009 to 2013 the overall percentage of adverse events improved for patients
who had a hip joint replacement due to fracture or degenerative conditions
Groups With Disparities
In 2013 there were no statistically significant differences by age or COPD status in the
percentage of hip replacement patients who had adverse events
From 2009 to 2013 there were no statistically significant changes in the gap between
patients age 75 and over and those ages 65-74 in adverse event frequencies Similarly
there were no statistically significant changes in disparities between patients with COPD
and those without COPD
Adverse Events Associated With Central Venous Catheter Placement
Adults with mechanical adverse events associated with central venous catheter placement by race and obesity status 2009-2013
Source Agency for Healthcare Research and Quality and Centers for Medicare amp Medicaid Services Medicare Patient Safety Monitoring
System 2009-2013
Denominator Selected discharges of hospitalized patients age 18 years and over with central venous catheter placement
Note For this measure lower percentages are better Mechanical adverse events include allergic reaction to the catheter tamponade
perforation pneumothorax hematoma shearing off of the catheter air embolism misplaced catheter thrombosisembolism knotting of the
pulmonary artery catheter and certain other events
0
2
4
6
8
10
2009 2010 2011 2012 2013
Pe
rce
nt
Total White Black
0
2
4
6
8
10
2009 2010 2011 2012 2013
Pe
rce
nt
Obese Not Obese
Adults with mechanical adverse events associated with central venous catheter placement by race and obesity status 2009-2013
Source Agency for Healthcare Research and Quality and Centers for Medicare amp Medicaid Services Medicare Patient Safety Monitoring
System 2009-2013
Denominator Selected discharges of hospitalized patients age 18 years and over with central venous catheter placement
Note For this measure lower percentages are better Mechanical adverse events include allergic reaction to the catheter tamponade
perforation pneumothorax hematoma shearing off of the catheter air embolism misplaced catheter thrombosisembolism knotting of the
pulmonary artery catheter and certain other events
0
2
4
6
8
10
2009 2010 2011 2012 2013
Pe
rce
nt
Total White Black
0
2
4
6
8
10
2009 2010 2011 2012 2013
Pe
rce
nt
Obese Not Obese
Importance Central venous catheterization (CVC) allows medical personnel quick access to
a patientrsquos bloodstream This ease of access is important when a patient requires life-saving
medications or when a physician needs to measure central venous pressure Mechanical
adverse events are most likely to occur while medical personnel are placing or maintaining
the central venous catheter
National Healthcare Quality and Disparities Report | 15
Patient Safety
Overall Percentage In 2013 32 of adults with central venous catheter placements
experienced an associated mechanical adverse event
Trends From 2009 to 2013 there were no statistically significant changes in the overall
percentage of adults with mechanical adverse events associated with central venous catheter
placement
Groups With Disparities
In 2013 the percentage of adults with mechanical adverse events associated with CVC
was worse for Blacks (67) compared with Whites (27) There were no statistically
significant differences by obesity status
From 2009 to 2013 there were no statistically significant changes in the gap between
Blacks and Whites in the percentage of adults with mechanical adverse events associated
with CVC
Adverse Drug Events
An estimated 400000 preventable ADEs occur each year in US hospitals generating
additional costs of $35 billion in 2006 dollars (IOM 2007)
An ADE is an injurymdashincluding physical harm mental harm or loss of functionmdash
resulting from medical intervention involving a drug
For more information see the PSNet link to Patient Safety Primer Medication Errors
httpspsnetahrqgovprimersprimer23medication-errors
The three initial targets of the HHS National Action Plan for Adverse Drug Event Prevention are
Anticoagulants and related bleeding
Diabetes agents and related hypoglycemia
Opioids and accidental overdose oversedation and respiratory depression
Measures of Patient Safety in the Hospital Setting Adverse Drug Events
Percentage of hospitalized adult patients who received a hypoglycemic agent and had an
adverse drug event
Percentage of hospitalized adult patients who had an anticoagulant-related adverse drug
event to warfarin
Number of opioid-related medication errors in patients of all ages
16 | National Healthcare Quality and Disparities Report
Patient Safety
Adverse Drug Events With Hypoglycemic Agents
Hospitalized adult patients who received a hypoglycemic agent who had adverse drug events with hypoglycemic agents by
raceethnicity 2010-2013 and renal disease 2009-2013
Source Agency for Healthcare Research and Quality and Centers for Medicare amp Medicaid Services Medicare Patient Safety Monitoring
System 2009-2013
Note For this measure lower percentages are better Hypoglycemic agents received by patients age 18 and over during a hospital stay include
insulin oral hypoglycemic or a combination of both The 2009 data for races did not meet the criteria for statistical reliability data quality or confidentiality
0
2
4
6
8
10
12
14
16
18
20
2009 2010 2011 2012 2013
Pe
rce
nt
Total Renal DiseaseNo Renal Disease
0
2
4
6
8
10
12
14
16
18
20
2010 2011 2012 2013
Pe
rce
nt
Total White BlackAsian Hispanic
Hospitalized adult patients who received a hypoglycemic agent who had adverse drug events with hypoglycemic agents by
raceethnicity 2010-2013 and renal disease 2009-2013
Source Agency for Healthcare Research and Quality and Centers for Medicare amp Medicaid Services Medicare Patient Safety Monitoring
System 2009-2013
Note For this measure lower percentages are better Hypoglycemic agents received by patients age 18 and over during a hospital stay include
insulin oral hypoglycemic or a combination of both The 2009 data for races did not meet the criteria for statistical reliability data quality or confidentiality
0
2
4
6
8
10
12
14
16
18
20
2009 2010 2011 2012 2013
Pe
rce
nt
Total Renal DiseaseNo Renal Disease
0
2
4
6
8
10
12
14
16
18
20
2010 2011 2012 2013
Pe
rce
nt
Total White BlackAsian Hispanic
Importance Hypoglycemic agents which are ingested orally are typically used in patients
with type II diabetes to control blood sugar levels In some cases diabetic patients use
hypoglycemic agents together with insulin The risk of chronic kidney disease increases
twofold for people with diabetes and renal impairment can increase the risk for adverse
events related to hypoglycemic agents
Overall Percentage In 2013 85 of hospital patients receiving hypoglycemic agents had
an adverse drug event
Trends The overall percentage of adverse drug events associated with hypoglycemic agents
improved from 2009 to 2013
Groups With Disparities
In 2013 the percentage of hospital patients who had adverse drug events with hypoglycemic agents was higher for Blacks (111) than for Whites (8)
Also in 2013 the percentage of hospital patients who had adverse drug events with
hypoglycemic agents was higher for those with renal disease (122) than for those
without renal disease (56)
From 2010 to 2013 there were no statistically significant changes in the gap between
minority groups and Whites in the percentage of patients who had adverse drug events
associated with hypoglycemic agents Similarly there were no statistically significant
changes in the gap between those with renal disease and those without
National Healthcare Quality and Disparities Report | 17
Patient Safety
Adverse Drug Events With Warfarin
Hospitalized adult patients with an anticoagulant-related adverse drug event with warfarin by age and corticosteroid use 2009-2013
Source Agency for Healthcare Research and Quality and Centers for Medicare amp Medicaid Services Medicare Patient Safety Monitoring
System 2009ndash2013
Denominator Patients 18 and over who received warfarin and had their international normalized ratio (INR) measured during their hospital
stay
Note For this measure lower percentages are better Adverse events occurring the day of hospital arrival were excluded
0
2
4
6
8
10
12
2009 2010 2011 2012 2013
Pe
rce
nt
TotalCorticosteroid UseNo Corticosteroid Use
0
2
4
6
8
10
12
2009 2010 2011 2012 2013
Pe
rce
nt
lt65 65-74 75-84 85+
Hospitalized adult patients with an anticoagulant-related adverse drug event with warfarin by age and corticosteroid use 2009-2013
Source Agency for Healthcare Research and Quality and Centers for Medicare amp Medicaid Services Medicare Patient Safety Monitoring
System 2009ndash2013
Denominator Patients 18 and over who received warfarin and had their international normalized ratio (INR) measured during their hospital
stay
Note For this measure lower percentages are better Adverse events occurring the day of hospital arrival were excluded
0
2
4
6
8
10
12
2009 2010 2011 2012 2013
Pe
rce
nt
TotalCorticosteroid UseNo Corticosteroid Use
0
2
4
6
8
10
12
2009 2010 2011 2012 2013
Pe
rce
nt
lt65 65-74 75-84 85+
Importance Blood clots in arteries and veins can cause a blockage of blood flow and lead to
strokes and heart attacks Anticoagulants such as warfarin reduce this risk but pose an
increased risk of bleeding Corticosteroids can interact with anticoagulants to raise the risk of
potential bleeding complications
Overall Percentage In 2013 50 of adults using warfarin experienced an anticoagulant-
related adverse drug event
Trends From 2009 to 2013 there were no statistically significant changes in the overall
percentage of hospital patients with an adverse drug event related to warfarin
Groups With Disparities
In 2013 the percentage of hospital patients who had an adverse drug event to warfarin
was the same regardless of corticosteroid use status
From 2009 to 2013 there were no statistically significant changes in the gap between
older age groups and those under age 65 in the percentage of patients who had adverse
events associated with warfarin Similarly there were no statistically significant changes
in the gap between those using corticosteroids and those not using corticosteroids
18 | National Healthcare Quality and Disparities Report
Patient Safety
Opioid-Related Medication Errors
Number of opioid-related medication errors reported in Pennsylvania by AHRQ eventharm category and age 2006 2008 2010 2012 2014
30 53 44 27 23
2947 2798 2714 27082408
9531014
984 969
910
175 245251 398
330
0
500
1000
1500
2000
2500
3000
3500
4000
4500
2006 2008 2010 2012 2014
Nu
mb
er o
f Ev
ents
Unsafe Condition Near Miss
Patient Event No Harm Patient Event Harm
Source Institute of Safe Medication Practices on behalf of the Pennsylvania Patient Safety Authority 2006-2014
Note Pennsylvania Patient Safety Reporting System reports of medication errors are from acute-level facilities that consist of hospitals
ambulatory surgical facilities birthing centers and abortion facilities Medication errors do not include adverse drug reactions Eventharm
categories refer to those in the Agency for Healthcare Research and Quality Common Formats Unsafe condition is defined as any
circumstance that increases the probability of a patient safety event A near miss is defined as a patient safety event that did not reach the
patient Deaths are included in the total but not shown on the chart because there were too few to render graphically
192 166 336530 662
2287 24842385
2364 1955
16271461 1272
1208
1055
0
500
1000
1500
2000
2500
3000
3500
4000
4500
2006 2008 2010 2012 2014
Nu
mb
er o
f Ev
en
ts
lt18 18-64 65+
Number of opioid-related medication errors reported in Pennsylvania by AHRQ eventharm category and age 2006 2008 2010 2012 2014
30 53 44 27 23
2947 2798 2714 27082408
9531014
984 969
910
175 245251 398
330
0
500
1000
1500
2000
2500
3000
3500
4000
4500
2006 2008 2010 2012 2014
Nu
mb
er o
f Ev
ents
Unsafe Condition Near Miss
Patient Event No Harm Patient Event Harm
Source Institute of Safe Medication Practices on behalf of the Pennsylvania Patient Safety Authority 2006-2014
Note Pennsylvania Patient Safety Reporting System reports of medication errors are from acute-level facilities that consist of hospitals
ambulatory surgical facilities birthing centers and abortion facilities Medication errors do not include adverse drug reac tions Eventharm
categories refer to those in the Agency for Healthcare Research and Quality Common Formats Unsafe condition is defined as any
circumstance that increases the probability of a patient safety event A near miss is defined as a patient safety event that did not reach the
patient Deaths are included in the total but not shown on the chart because there were too few to render graphically
192 166 336530 662
2287 24842385
2364 1955
16271461 1272
1208
1055
0
500
1000
1500
2000
2500
3000
3500
4000
4500
2006 2008 2010 2012 2014
Nu
mb
er o
f Ev
ents
lt18 18-64 65+
Importance Acute malignant andmdashincreasinglymdashchronic pain often is treated or managed
with prescription opioids Reducing patient harm from the use of opioids in both inpatient
and outpatient settings is a main area of focus because opioid-related adverse drug events are
often preventable
Trends
In Pennsylvania the total number of medication error reports related to opioids decreased
106 between 2006 (4106) and 2014 (3672)
Between 24 and 54 opioid-related medication errors resulting in patient harm or death
were reported from 2006 through 2014 accounting for approximately 1 of all reported
opioid medication errors each year
The largest share of opioid-related medication errors reported each year in Pennsylvania
related to those that reached the patient but did not result in harm Of these no-harm
events reaching the patient about one in four required monitoring andor intervention to
preclude the harm
National Healthcare Quality and Disparities Report | 19
Patient Safety
20 | National Healthcare Quality and Disparities Report
Although small in number reports of unsafe conditions increased from 43 (175) of
total opioid-related medication error reports in 2006 to 9 (330) in 2014 Reports of
unsafe conditions and near misses can provide important learning opportunities for
preventing patient harm
Differences Between Groups Reports of opioid-related medication errors involving
pediatric patients increased nearly fourfold from 192 (47) in 2006 to 662 (18) in 2014
During the same period reports of opioid-related medication errors involving older adult
patients decreased from nearly 40 of the total to less than 30
Patient Safety in the Nursing Home Setting
More than 3 million people receive care in US nursing homes and skilled nursing facilities
each year (CDC 2015)
For nursing home residents optimal care seeks to maximize quality of life and minimize
unintended complications
Measures tracked for patients of various age ranges include
Nursing home residents with urinary tract infections
Nursing home residents experiencing use of restraints
Nursing home residents who have pressure ulcers
Nursing home residents who had a fall with major injury
Nursing home residents who received antipsychotic medication
Urinary Tract Infections
Long-stay nursing home residents experiencing urinary tract infections by sex and raceethnicity 2011-2013
Source Centers for Medicare amp Medicaid Services Minimum Data Set 2011-2013
DenominatorNursing home residents of any age w ho have at least 101 cumulative days in the facility
Note For this measure low er percentages are better The measure w as calculated as follows Percentage of long-stay residents with a urinary
tract infection w ithin the 30 days prior to assessment White Black and Asian are non-Hispanic Hispanic includes all races
0
2
4
6
8
10
2011 2012 2013
Pe
rce
nt
Total Male Female
2011 Achievable
Benchmark 61
0
2
4
6
8
10
2011 2012 2013
Pe
rce
nt
White Black Asian Hispanic
2011 Achievable
Benchmark 61
Long-stay nursing home residents experiencing urinary tract infections by sex and raceethnicity 2011-2013
Source Centers for Medicare amp Medicaid Services Minimum Data Set 2011-2013
DenominatorNursing home residents of any age w ho have at least 101 cumulative days in the facilityNote For this measure low er percentages are better The measure w as calculated as follows Percentage of long-stay residents with a urinary
tract infection w ithin the 30 days prior to assessment White Black and Asian are non-Hispanic Hispanic includes all races
0
2
4
6
8
10
2011 2012 2013
Pe
rce
nt
Total Male Female
2011 Achievable
Benchmark 61
0
2
4
6
8
10
2011 2012 2013
Pe
rce
nt
White Black Asian Hispanic
2011 Achievable
Benchmark 61
Patient Safety
Importance Bacteria that cause urinary tract infections (UTIs) can spread to other body
parts and become more serious or contribute to further complications such as delirium
Overall Percentage In 2013 the percentage of long-stay nursing home residents with a UTI
was 64
Groups With Disparities
In 2013 compared with males (51) the percentage with UTIs was worse for females
(7)
In 2013 compared with White residents (68) the percentage of residents with UTIs
was lower for Blacks and Asians (47) as well as Hispanics (54)
Achievable Benchmark
In 2011 the top 5 State achievable benchmark for UTIs was 61 The States that
contributed to the achievable benchmark are Connecticut Hawaii Minnesota North
Dakota and Pennsylvania
Males Blacks Asians and Hispanics have achieved the benchmark
Use of Restraints
00
05
10
15
20
25
30
35
40
2011 2012 2013
Pe
rce
nt
White Black Asian Hispanic
00
05
10
15
20
25
30
35
40
2011 2012 2013
Pe
rce
nt
Total 0-64 65-74 75-84 85+
2011 Achievable
Benchmark 07
Long-stay nursing home residents experiencing use of restraints by age and raceethnicity 2011-2013
Source Centers for Medicare amp Medicaid Services Minimum Data Set 2011-2013
Denominator Nursing home residents of any age who have at least 101 cumulative days in the facility
Note For this measure lower percentages are better The measure was calculated as follows Percentage of long-stay residents who are
physically restrained on a daily basis
2011 Achievable
Benchmark 07
00
05
10
15
20
25
30
35
40
2011 2012 2013
Pe
rce
nt
White Black Asian Hispanic
00
05
10
15
20
25
30
35
40
2011 2012 2013
Pe
rce
nt
Total 0-64 65-74 75-84 85+
2011 Achievable
Benchmark 07
Long-stay nursing home residents experiencing use of restraints by age and raceethnicity 2011-2013
Source Centers for Medicare amp Medicaid Services Minimum Data Set 2011-2013
Denominator Nursing home residents of any age who have at least 101 cumulative days in the facility
Note For this measure lower percentages are better The measure was calculated as follows Percentage of long-stay residents who are
physically restrained on a daily basis
2011 Achievable
Benchmark 07
National Healthcare Quality and Disparities Report | 21
Patient Safety
Importance Residents who are restrained daily can become weak lose their ability to go to
the bathroom by themselves and develop pressure ulcers or other medical conditions
Overall Percentage In 2013 the percentage of long-stay nursing home residents who were
physically restrained on a daily basis was 14
Groups With Disparities
In 2011 2012 and 2013 the percentage of residents with restraint use on a daily basis
was lower for those ages 65-74 years compared with those under age 65 In 2013 the
percentage of residents ages 65-74 years experiencing use of restraints was 12
compared with 16 for residents younger than 65
In 2013 compared with Whites (14) Asians (2) and Hispanics (18) had worse
percentages of daily restraint use and Blacks (12) had a better percentage of daily
restraint use
Achievable Benchmark
In 2011 the top 5 State achievable benchmark for restraint use was 07 The States that
contributed to the achievable benchmark are Kansas Maine Nebraska New Hampshire
and Vermont
No group achieved the benchmark from 2011 to 2013
Pressure Ulcers
Low-risk short-stay and high-risk long-stay nursing home residents who have pressure ulcers by sex 2011-2013
Source Centers for Medicare amp Medicaid Services Minimum Data Set 2011-2013
Denominator Low-risk short-stay Nursing home residents of any age who have 100 or fewer cumulative days in the facility and are active can
change positions and are getting the nutrients they need to maintain good skin health High-risk long-stay Nursing home residents of any age
who have at least 101 cumulative days in the facility and are in a coma do not get the nutrients needed to maintain good skin health or cannot
change position on their own
Note For this measure lower percentages are better
0
2
4
6
8
10
12
2011 2012 2013
Pe
rce
nt
Low-Risk Short StayTotal Male Female
2011 Achievable Benchmark10
0
2
4
6
8
10
12
2011 2012 2013
Pe
rce
nt
High-Risk Long StayTotal Male Female
2008 Achievable Benchmark 71
Low-risk short-stay and high-risk long-stay nursing home residents who have pressure ulcers by sex 2011-2013
Source Centers for Medicare amp Medicaid Services Minimum Data Set 2011-2013
Denominator Low-risk short-stay Nursing home residents of any age who have 100 or fewer cumulative days in the facility and are active can
change positions and are getting the nutrients they need to maintain good skin health High-risk long-stay Nursing home residents of any age
who have at least 101 cumulative days in the facility and are in a coma do not get the nutrients needed to maintain good skin health or cannot
change position on their own
Note For this measure lower percentages are better
0
2
4
6
8
10
12
2011 2012 2013
Pe
rce
nt
Low-Risk Short StayTotal Male Female
2011 Achievable Benchmark10
0
2
4
6
8
10
12
2011 2012 2013
Pe
rce
nt
High-Risk Long StayTotal Male Female
2008 Achievable Benchmark 71
22 | National Healthcare Quality and Disparities Report
Patient Safety
Importance Pressure ulcers are serious medical conditions They typically result from
prolonged periods of uninterrupted pressure on the skin soft tissue muscle and bone
Vulnerable patients include older adults stroke and diabetic patients patients with dementia
circulatory diseases dehydration and malnutrition and people who use wheelchairs or are
bedriddenmdashthat is any patient with impaired mobility or sensation
Overall Percentage In 2013 the percentage of low-risk short-stay residents with pressure
ulcers was 13 and the percentage of high-risk long-stay residents with pressure ulcers was
77
Groups with Disparities
As in 2011 and 2012 male low-risk short-stay nursing home residents had a worse
percentage with pressure ulcers (15) compared with female residents (12) in 2013
As in 2011 and 2012 male high-risk long-stay nursing home residents had a worse
percentage with pressure ulcers (94) compared with female residents (70) in 2013
Achievable Benchmark
The 2011 top 5 State achievable benchmark for low-risk short-stay nursing home residents was 10 The States that contributed to the benchmark were Alabama Arizona Colorado Connecticut and Idaho
The 2008 top 5 State achievable benchmark for high-risk long-stay nursing home residents was 71 The States that contributed to the benchmark were Hawaii Minnesota Nebraska New Hampshire and North Dakota
No low-risk short-stay residents achieved the benchmark from 2011 to 2013 Among
high-risk long-stay residents only females achieved the benchmark by 2013
National Healthcare Quality and Disparities Report | 23
Patient Safety
Falls
00
05
10
15
20
25
30
35
40
45
50
Pe
rce
nt
2012 2013
Long-stay nursing home residents who had a fall with major injury by sex age and raceethnicity 2012-2013
Source Centers for Medicare amp Medicaid Services Minimum Data Set 2012-2013
Denominator Nursing home residents of any age who have at least 101 cumulative days in the facility with one or more look-back scan
assessments except when the occurrence of falls or number of falls with major injury was not assessed in the look-back scan assessment
Note For this measure lower percentages are better White Black and Other are non-Hispanic Hispanic includes all races
2012 Achievable
Benchmark 22
00
05
10
15
20
25
30
35
40
45
50
Pe
rce
nt
2012 2013
Long-stay nursing home residents who had a fall with major injury by sex age and raceethnicity 2012-2013
Source Centers for Medicare amp Medicaid Services Minimum Data Set 2012-2013
Denominator Nursing home residents of any age who have at least 101 cumulative days in the facility with one or more look-back scan
assessments except when the occurrence of falls or number of falls with major injury was not assessed in the look-back scan assessment
Note For this measure lower percentages are better White Black and Other are non-Hispanic Hispanic includes all races
2012 Achievable
Benchmark 22
Importance Nursing home residents who experience falls resulting in major injuries are at
higher risk of death and disability as well as emotional trauma that can affect functional
abilities and social well-being
Overall Percentage In 2013 the percentage of long-stay nursing home residents who had a
fall with a major injury was 34
Groups With Disparities
In 2013 female nursing home residents had a worse percentage of falls (38) compared
with male residents (25)
In 2013 the percentage of falls with major injury was worse for all subgroups of
residents age 65 years and over compared with their younger counterparts The
percentage for residents under 65 years old was 17 compared with 26 for ages 65shy
74 years 34 for ages 75-84 years and 41 for 85 years and over
Also in 2013 compared with Whites (38) the percentage of falls with major injury
was better for Black (13) Other (22) and Hispanic (24) residents
24 | National Healthcare Quality and Disparities Report
Patient Safety
National Healthcare Quality and Disparities Report | 25
Achievable Benchmark
The 2012 top 5 State achievable benchmark for falls with major injury was 22 The
States that contributed to the achievable benchmark are Alaska California District of
Columbia Hawaii and New Jersey The benchmark was achieved by Black residents and those ages 0-64 years
Antipsychotic Medication Among Nursing Home Residents
Importance The high use of antipsychotic medications among nursing home residents for
indications other than those for which the drug was approved has been noted by the Federal
Government These drugs are often used for too long at too high a dose or when
unnecessary In the past inappropriate prescribing of antipsychotics in nursing homes has
primarily been considered a marker of suboptimal care Recent studies have shown
antipsychotic use is also a drug safety issue (Huybrechts et al 2012) Antipsychotic
medication use is associated with increased risks of adverse events such as movement
disorders falls hip fractures and cerebrovascular events Their use in older adults with
dementia carries an increased risk of death Safety concerns with antipsychotic medication
use in older adults also include the risks of hyperprolactinemia pneumonia
0
5
10
15
20
25
30
Percent
2012 2013
Adult long-stay nursing home residents who received antipsychotic medication by raceethnicity and number of chronic conditions 2012-2013
Key NHOPI = Native Hawaiian or Other Pacific Islander AIAN = American Indian or Alaska Native
Source Centers for Medicare amp Medicaid Services Minimum Data Set 2012-2013
Denominator Nursing home residents of any age who have at least 101 cumulative days in the facility excluding residents with schizophrenia
Tourettersquos syndrome and Huntingtonrsquos disease
Numerator Subset of denominator that receives an antipsychotic medication
Note For this measure lower percentages are better
2012 Achievable
Benchmark 150
0
5
10
15
20
25
30
Percent
2012 2013
Adult long-stay nursing home residents who received antipsychotic medication by raceethnicity and number of chronic conditions 2012-2013
Key NHOPI = Native Hawaiian or Other Pacific Islander AIAN = American Indian or Alaska Native
Source Centers for Medicare amp Medicaid Services Minimum Data Set 2012-2013
Denominator Nursing home residents of any age who have at least 101 cumulative days in the facility excluding residents with schizophrenia
Tourettersquos syndrome and Huntingtonrsquos disease
Numerator Subset of denominator that receives an antipsychotic medication
Note For this measure lower percentages are better
2012 Achievable
Benchmark 150
Patient Safety
26 | National Healthcare Quality and Disparities Report
thromboembolism cerebrovascular events and other cardiovascular adverse events (Chiu et
al 2015)
Overall Percentage The percentage of long-stay nursing home residents who had
antipsychotic medications was 176 in 2013
Groups With Disparities
In 2013 the percentage of residents receiving antipsychotic medication was higher for
Hispanic residents (201) than for White residents (180)
In 2012 and 2013 the percentage of long-stay residents who received antipsychotic
medications was worse for residents with one or more chronic conditions than for
residents with no chronic conditions
Achievable Benchmark
The 2012 top 6 State achievable benchmark was 150 The States that contributed to the
achievable benchmark are Alaska California Hawaii Michigan New Jersey and
Wyoming Asians NHOPIs residents with no chronic conditions and residents with one chronic
condition achieved the benchmark
Antipsychotic Medication Among Nursing Home Residents by State
Long-stay nursing home residents who received antipsychotic medication by State 2013
Source Centers for Medicare amp Medicaid Services Minimum Data Set 2013
Denominator Nursing home residents of any age who have at least 101 cumulative days in the facility
Note For this measure lower percentages are better
AZ
CA
UT
CT
FL
GA
IA
IL
KS
MA
MDMO
NJ
NY
OR
PA
SC
TN
CO
WA
WI
VA
ME
MN
MI
NC
TX
KY
WV
RI
NE
VT
NV OH
SD
AR
IN
NH
MT
ID
WY
ND
NMOK
LA
MS AL
DE
AKAK
HI
DC
85-153 (1st Quartile)
154-173 (2nd Quartile)
No Data
174-192 (3rd Quartile)
PR193-234 (4th Quartile)
Long-stay nursing home residents who received antipsychotic medication by State 2013
Source Centers for Medicare amp Medicaid Services Minimum Data Set 2013
Denominator Nursing home residents of any age who have at least 101 cumulative days in the facility
Note For this measure lower percentages are better
AZ
CA
UT
CT
FL
GA
IA
IL
KS
MA
MDMO
NJ
NY
OR
PA
SC
TN
CO
WA
WI
VA
ME
MN
MI
NC
TX
KY
WV
RI
NE
VT
NV OH
SD
AR
IN
NH
MT
ID
WY
ND
NMOK
LA
MS AL
DE
AKAK
HI
DC
85-153 (1st Quartile)
154-173 (2nd Quartile)
No Data
174-192 (3rd Quartile)
PR193-234 (4th Quartile)
Patient Safety
Overall This map shows overall rankings of States (by quartiles) in the percentage of long-
stay nursing home residents who received antipsychotic medication in 2013 Values ranged
from 85 to 234
Differences by State Interquartile ranges follow
First quartile (lowest) 85-153 (AK CA DC DE HI MD MI MN NJ NC SC
WI WV)
Second quartile (second lowest) 153 -173 (CO ID MT NM NY ND OR PA
RI SD VT WA WY)
Third quartile (second highest) 174-192 (AZ CT GA IN IA KS ME MA MO
NV OH OK VA)
Fourth quartile (highest) 193-234 (AL AR FL IL KY LA MS NE NH TN
TX UT)
Eight of the 12 States in the quartile with the highest percentage of long-stay nursing
home residents who received antipsychotic medication were in the South
Patient Safety in the Home Health Setting
Home health agencies provide services to beneficiaries who are homebound and need skilled
nursing care or therapy
Approximately 12 million individuals receive home health care from more than 33000
providers for causes including acute illness long-term health conditions permanent
disability or terminal illness (NAHCH 2010)
Improvements among home health patients can reflect the quality of care from home health
agencies
Measures include
Home health patients with improvement in surgical wounds
Home health patients with improvements in their ability to take medications orally
National Healthcare Quality and Disparities Report | 27
Patient Safety
Improvement in Surgical Wounds
75
80
85
90
95
100
2010 2011 2012 2013
Pe
rce
nt
White Black Asian Hispanic
75
80
85
90
95
100
2010 2011 2012 2013
Pe
rce
nt
Total 0-64 65-74
75-84 85+
2011 Achievable
Benchmark 913
Home health patients with improvement in surgical wounds by age and raceethnicity 2010-2013
Source Centers for Medicare amp Medicaid Services Outcome and Assessment Information Set 2010-2013
Denominator Number of home health episodes during the measurement period in which the patient of any age had a surgical wound and the
episode ended with the patient discharged from home health care
Note White Black and Asian are non-Hispanic Hispanic includes all races
2011 Achievable
Benchmark 913
75
80
85
90
95
100
2010 2011 2012 2013
Per
cen
t
White Black Asian Hispanic
75
80
85
90
95
100
2010 2011 2012 2013
Per
cen
t
Total 0-64 65-74
75-84 85+
2011 Achievable
Benchmark 913
Home health patients with improvement in surgical wounds by age and raceethnicity 2010-2013
Source Centers for Medicare amp Medicaid Services Outcome and Assessment Information Set 2010-2013
Denominator Number of home health episodes during the measurement period in which the patient of any age had a surgical wound and the
episode ended with the patient discharged from home health care
Note White Black and Asian are non-Hispanic Hispanic includes all races
2011 Achievable
Benchmark 913
Importance Normal wound healing after an operation is an important marker of good care
The home health team should regularly change wound dressing and teach the patient about
wound care
Overall Percentage In 2013 the percentage of home health patients with improvement in
their surgical wounds was 890
Trends The percentage of health home patients with surgical wound improvement increased
between 2010 and 2013
Groups With Disparities
In 2013 compared with residents under age 65 years (856) all other age groups had
better percentages of improvement in surgical wounds The percentage was 893 for
ages 65-74 905 for ages 75-84 and 917 for ages 85 and over
In 2013 compared with Whites (893) Blacks (878) Asians (882) and Hispanics
(874) had worse percentages of improvement in surgical wounds
The 2010 through 2013 trend in the percent of home health patients with surgical wound
improvement did not change for those over age 65 relative to persons under age 65 years
28 | National Healthcare Quality and Disparities Report
Patient Safety
Achievable Benchmark
The 2011 top 5 State achievable benchmark was 913 The States that contributed to the
benchmark are Alabama Mississippi Nevada Oklahoma and South Carolina
Home health patients age 85 years and over achieved the benchmark for surgical wound
improvement in 2013
At the current rate of progress patients ages 75-84 years could reach the benchmark
within a year Patients ages 65-74 years could achieve the benchmark in approximately 2
years
White home health patients could achieve the benchmark in approximately 2 years
Improvement in Ability To Take Medication Orally
0
20
40
60
80
100
2010 2011 2012 2013
Per
cen
t
White Black Asian Hispanic
0
20
40
60
80
100
2010 2011 2012 2013
Per
cen
t
Total 0-64 65-74
75-84 85+
2008 Achievable
Benchmark 516
Home health patients with improvement in their ability to take medications orally by age and raceethnicity 2010-2013
Source Centers for Medicare amp Medicaid Services Outcome and Assessment Information Set 2010-2013
Denominator Number of home health care episodes in which a patient of any age was unable to take oral medications independently at the
start of the episode that ended during the measurement period
Note White Black and Asian are non-Hispanic Hispanic includes all races
2008 Achievable
Benchmark 516
0
20
40
60
80
100
2010 2011 2012 2013
Per
cen
t
White Black Asian Hispanic
0
20
40
60
80
100
2010 2011 2012 2013
Per
cen
t
Total 0-64 65-74
75-84 85+
2008 Achievable
Benchmark 516
Home health patients with improvement in their ability to take medications orally by age and raceethnicity 2010-2013
Source Centers for Medicare amp Medicaid Services Outcome and Assessment Information Set 2010-2013
Denominator Number of home health care episodes in which a patient of any age was unable to take oral medications independently at the
start of the episode that ended during the measurement period
Note White Black and Asian are non-Hispanic Hispanic includes all races
2008 Achievable
Benchmark 516
Importance Taking medications correctly is important to the health status and quality of life
of individuals living in the community The home health team can help teach a patient ways
to organize drugs and take them properly
Overall Percentage In 2013 the percentage of home health patients with improvement in
their ability to take medications orally was 513
Trends Between 2010 and 2013 there was improvement in the overall percentage of home
health patients with improved ability to take medications orally
National Healthcare Quality and Disparities Report | 29
Patient Safety
Groups With Disparities
In 2013 the percentage of home health patients with improvement in their ability to take
medications orally was worse for those age 85 years and over (398) compared with
those under age 65 years (577)
The percentage of patients with improvement in their ability to take medications orally
was worse among Hispanic home health patients (400) than among White patients
(526) in 2013
From 2010 to 2013 the gap between Blacks and Whites decreased and the gap between
Asians and Whites and Hispanics and Whites increased
Achievable Benchmark
The 2008 top 5 State achievable benchmark was 516 The States that contributed to the
achievable benchmark are Iowa Massachusetts New Jersey North Dakota and South
Carolina
The benchmark was achieved among age groups under 85 years and by White and Black
home health patients
The total population is estimated to reach the benchmark in less than a year Hispanic
patients and patients age 85 years and over are farthest from the benchmark
Improvement in Ability To Take Medication Orally by State
Home health patients with improvement in their ability to take medications orally by raceethnicity by State 2013
Source Centers for Medicare amp Medicaid Services Outcome and Assessment Information Set 2013
Denominator Number of home health care episodes in which a patient of any age was unable to take oral medications independently at the
start of the episode that ended during the measurement period
AZ
CA
UT
CT
FL
GA
IA
IL
KS
MA
MDMO
NJ
NY
OR
PA
SC
TN
CO
WA
WI
VA
ME
MN
MI
NC
TX
KY
WV
RI
NE
VT
NV OH
SD
AR
IN
NH
MT
ID
WY
ND
NMOK
LA
MS AL
DE
AKAK
HI
No significant difference between rates
of Hispanics and non-Hispanic Whites
Non-Hispanic Whites have significantly
worse rate than Hispanics
States do not have data that meet the
criteria for statistical reliability data
quality or confidentiality
Hispanics have significantly worse rate
than non-Hispanic Whites
DC
Home health patients with improvement in their ability to take medications orally by raceethnicity by State 2013
Source Centers for Medicare amp Medicaid Services Outcome and Assessment Information Set 2013
Denominator Number of home health care episodes in which a patient of any age was unable to take oral medications independently at the
start of the episode that ended during the measurement period
AZ
CA
UT
CT
FL
GA
IA
IL
KS
MA
MDMO
NJ
NY
OR
PA
SC
TN
CO
WA
WI
VA
ME
MN
MI
NC
TX
KY
WV
RI
NE
VT
NV OH
SD
AR
IN
NH
MT
ID
WY
ND
NMOK
LA
MS AL
DE
AKAK
HI
No significant difference between rates
of Hispanics and non-Hispanic Whites
Non-Hispanic Whites have significantly
worse rate than Hispanics
States do not have data that meet the
criteria for statistical reliability data
quality or confidentiality
Hispanics have significantly worse rate
than non-Hispanic Whites
DC
30 | National Healthcare Quality and Disparities Report
Patient Safety
Geographic Variation
In 2013 Hispanic home health patients had worse rates of improvement in taking oral
medications than non-Hispanic White patients in 11 States (Arizona California
Connecticut Florida Illinois Indiana Massachusetts Nevada New York North
Carolina and Texas
Non-Hispanic White patients had worse rates of improvement than Hispanic patients in
five States (Hawaii Idaho Iowa Michigan and Pennsylvania)
Patient Safety in the Ambulatory Setting
Although patient safety initiatives frequently focus on inpatient hospital events adverse
effects of medical care may be identified and treated in outpatient settings
Adverse effects of medical care can follow care or procedures in hospitals emergency
departments physician offices or other settings
Measures include
Patient safety and quality issues by frequency of occurrence in outpatient medical offices
Adults age 65 years and over who received potentially inappropriate prescription medications during the calendar year
Percentage of hemodialysis patients with vascular catheter in use for 90 days or longer
For more information see the PSNet link to Patient Safety Primer Patient Safety in
Ambulatory Care httpspsnetahrqgovprimersprimer16patient-safety-in-ambulatory-care
National Healthcare Quality and Disparities Report | 31
Patient Safety
Patient Safety and Quality Issues
Patient safety and quality issues by frequency of occurrence in outpatient medical offices 2014
Source Westat analysis of the AHRQ 2014 Medical Office Survey on Patient Safety Culture Comparative Database (N=935)
Note For this measure less frequent occurrences during the year are better
0
20
40
60
80
100
A pharmacy contactedour office to clarify orcorrect a prescription
A patient was unableto get an appointmentwithin 48 hours for anacuteserious problem
A patients medicationlist was not updatedduring his or her visit
The results from a labor imaging test were notavailable when needed
A patients chartmedicalrecord was not available
when needed
Occurred DailyWeekly
Occurred Monthly
Occurred Not at All to Several Times Over the Past Year
Patient safety and quality issues by frequency of occurrence in outpatient medical offices 2014
Source Westat analysis of the AHRQ 2014 Medical Office Survey on Patient Safety Culture Comparative Database (N=935)
Note For this measure less frequent occurrences during the year are better
0
20
40
60
80
100
A pharmacy contactedour office to clarify orcorrect a prescription
A patient was unableto get an appointmentwithin 48 hours for anacuteserious problem
A patients medicationlist was not updatedduring his or her visit
The results from a labor imaging test were notavailable when needed
A patients chartmedicalrecord was not available
when needed
Occurred DailyWeekly
Occurred Monthly
Occurred Not at All to Several Times Over the Past Year
Importance Most health care takes place in the outpatient or ambulatory care setting Lack
of access to care and lack of access to timely and accurate medical information and test
results may contribute to patient safety events such as missed or delayed diagnoses
medication errors failure to order appropriate diagnostic or laboratory tests incorrect
interpretation of tests and inadequate followup on results
Overall Percentage
Almost 30 of medical offices participating in the survey reported daily or weekly
occurrences of being contacted by the pharmacist for clarification or correction on a
prescription
After prescription clarifications or corrections by the pharmacy medical offices were
next most likely to report daily or weekly issues with patients being unable to get an
appointment within 48 hours for an acute or serious problem (14) or the patientrsquos
medication list not getting updated during their visit (11)
The share of medical offices reporting that lab or imaging tests were not available when
needed reached nearly 20 when considering monthly occurrences as well as those that
occurred more frequently
32 | National Healthcare Quality and Disparities Report
Patient Safety
Potentially Inappropriate Prescriptions for Older Adults
Adults age 65 years and over who received potentially inappropriate prescription medications during the calendar year by sex and
perceived health status 2003ndash2013
Source Agency for Healthcare Research and Quality Medical Expenditure Panel Survey 2003-2013
Note For this measure lower percentages are better Prescription medications received include all prescribed medications initiall y purchased
or otherwise obtained as well as any refills For more information on inappropriate medications see the American Geriatrics Society 2012 Beers
Criteria Update Expert Panel American Geriatrics Society updated Beers Criteria for potentially inappropriate medication use in older adults J
Am Geriatr Soc 2012 Apr60(4)616-31
0
5
10
15
20
25
30
Per
cen
t
Total Male Female
0
5
10
15
20
25
30
Per
cen
t
ExcellentVery GoodGood FairPoor
Adults age 65 years and over who received potentially inappropriate prescription medications during the calendar year by sex and
perceived health status 2003ndash2013
Source Agency for Healthcare Research and Quality Medical Expenditure Panel Survey 2003-2013
Note For this measure lower percentages are better Prescription medications received include all prescribed medications initially purchased
or otherwise obtained as well as any refills For more information on inappropriate medications see the American Geriatrics Society 2012 Beers
Criteria Update Expert Panel American Geriatrics Society updated Beers Criteria for potentially inappropriate medication use in older adults J
Am Geriatr Soc 2012 Apr60(4)616-31
0
5
10
15
20
25
30
Per
cen
t
Total Male Female
0
5
10
15
20
25
30
Per
cen
t
ExcellentVery GoodGood FairPoor
Importance Some drugs that are prescribed for older patients are known to be potentially
harmful for this age group
Overall Percentage In 2013 the percentage of adults age 65 years and over who received
potentially inappropriate prescription medications was 114
Trends From 2003 to 2013 the percentage of adults age 65 years and over who received
potentially inappropriate prescription medications improved overall for both sexes and for
people with excellentvery goodgood health status and people with fairpoor health status
Groups With Disparities
In all years the percentage of patients receiving potentially inappropriate medications
was higher among females compared with males This gap was not changing over time
In all years from 2003 to 2013 the percentage of patients receiving potentially
inappropriate medications was higher among people with fairpoor health status
compared with people with excellentgood health status This gap was not changing over
time
National Healthcare Quality and Disparities Report | 33
Patient Safety
Long-Term Catheter Use in Dialysis Patients
HI
AKAK
AZ
CA
UT
CT
FL
GA
IA
IL
KS
MA
MDMO
NJ
NY
OR
PA
SC
TN
CO
WA
WI
VA
ME
MN
MI
NC
TX
KY
WV
RI
NE
VT
NV OH
SD
AR
IN
NH
MT
ID
WY
ND
NMOK
LA
MSAL
DE
DC
10-12
13-18
7-9
PR
Source Centers for Medicare and Medicaid Services Dialysis Facility Compare 2014
Denominator At-risk adult Medicare patients with a central venous catheter who were receiving regular hemodialysis treatments at dialysis
facilities
Note For this measure lower percentages are better
Percentage of hemodialysis patients with central venous catheters used for vascular access for 90 days or longer by State 2014
HI
AKAK
AZ
CA
UT
CT
FL
GA
IA
IL
KS
MA
MDMO
NJ
NY
OR
PA
SC
TN
CO
WA
WI
VA
ME
MN
MI
NC
TX
KY
WV
RI
NE
VT
NV OH
SD
AR
IN
NH
MT
ID
WY
ND
NMOK
LA
MSAL
DE
DC
10-12
13-18
7-9
PR
Source Centers for Medicare and Medicaid Services Dialysis Facility Compare 2014
Denominator At-risk adult Medicare patients with a central venous catheter who were receiving regular hemodialysis treatments at dialysis
facilities
Note For this measure lower percentages are better
Percentage of hemodialysis patients with central venous catheters used for vascular access for 90 days or longer by State 2014
Importance Central venous catheters are frequently used for vascular access to dialysis
patients until a fistula or graft is formed Central venous catheters have higher rates of
infection and adverse events among patients receiving dialysis treatment compared with
other forms of vascular access To decrease the likelihood of adverse events catheters should
be used for less than 90 days
Overall Percentage Nationally an average of 10 of dialysis patients used central venous
catheters for 90 days or longer in 2014
Geographic Variation In 2014 Alabama and Kansas had the lowest percentages of dialysis
patients using central venous catheters for 90 days or longer (7) and Puerto Rico had the
highest percentage (18) of long-term catheter use
Patient Safety Infrastructure
Efforts to improve patient safety have been accompanied by various infrastructure
enhancements
Growth in patient safety organizations which assist providers in detecting and reducing
risks and hazards from care delivery that may lead to patient harm
System improvement initiatives at the Veterans Health Administration (VHA)
34 | National Healthcare Quality and Disparities Report
Patient Safety
Development of the National Practitioner Data Bank a clearinghouse for information on
medical malpractice payments
Patient Safety Organizations
Patient safety organizations (PSOs) aim to reduce preventable adverse events near misses
and unsafe conditions in all health care settings
PSOs provide an environment for health care providers to voluntarily report discuss and
learn from patient safety events and quality analyses on a privileged and confidential basis
Measures include
Number of PSOs serving each State
Variation in concentrations of compounded liquid medications for children
Patient Safety Organizations AHRQ Common Formats
AHRQ Common Formats provide a standardized method for PSOs health care providers
and other organizations to collect and report patient safety events
Data element standards are important for aggregating and analyzing events across
providers
AHRQ Common Formats have been developed for a variety of settings of care
Acute care hospitals
Skilled nursing facilities
Retail pharmacy
More information is available at httpspsoahrqgovcommon
National Healthcare Quality and Disparities Report | 35
Patient Safety
Number of Patient Safety Organizations
AZ (2)
CA (3)
UT (2)
CT(3)
FL (8)
GA (5)
IA (4)
IL (7)
KS (5)
MA(3)
MD (4)MO(2)
NJ(3)
NY (5)
OR (3)
PA (5)
SC (4)
TN (5)
CO (2)
WA (2)
WI (5)
VA (7)
ME(2)
MN(3)
MI (3)
NC (7)
TX (6)
KY (4)WV (3)
RI(2)
NE (2)
VT(2)
NV (2)
OH (2)
SD (1)
AR (4)
IN (2)
NH(2)
MT (2)
ID (3)
WY (2)
ND (1)
NM (3)OK (2)
LA (1)
MS (2)
AL (2)
DE(2)
HI (2)
AKAK (2)
DC(3)
PR (0)
1-2
3-4
5-6
7-8
Number of PSOs
excluding PSOs
operating nationally
Number of Patient Safety Organizations by area served 2014
Source Agency for Healthcare Research and Quality Patient Safety Organization Information Form Calendar Year 2014 and PSO-PPC
Contact Database
Note PSOs included in this map were AHRQ-listed during any part of 2014 and submitted the PSO Profile to the PSO Privacy Protection
Center (PSO-PPC) in early 2015 A PSO may have members in one or more States regardless of headquarters location Each State shows the
number of PSOs that serve that State map excludes 38 PSOs that are available to providers in all States
AZ (2)
CA (3)
UT (2)
CT(3)
FL (8)
GA (5)
IA (4)
IL (7)
KS (5)
MA(3)
MD (4)MO(2)
NJ(3)
NY (5)
OR (3)
PA (5)
SC (4)
TN (5)
CO (2)
WA (2)
WI (5)
VA (7)
ME(2)
MN(3)
MI (3)
NC (7)
TX (6)
KY (4)WV (3)
RI(2)
NE (2)
VT(2)
NV (2)
OH (2)
SD (1)
AR (4)
IN (2)
NH(2)
MT (2)
ID (3)
WY (2)
ND (1)
NM (3)OK (2)
LA (1)
MS (2)
AL (2)
DE(2)
HI (2)
AKAK (2)
DC(3)
PR (0)
1-2
3-4
5-6
7-8
Number of PSOs
excluding PSOs
operating nationally
Number of Patient Safety Organizations by area served 2014
Source Agency for Healthcare Research and Quality Patient Safety Organization Information Form Calendar Year 2014 and PSO-PPC
Contact Database
Note PSOs included in this map were AHRQ-listed during any part of 2014 and submitted the PSO Profile to the PSO Privacy Protection
Center (PSO-PPC) in early 2015 A PSO may have members in one or more States regardless of headquarters location Each State shows the
number of PSOs that serve that State map excludes 38 PSOs that are available to providers in all States
Importance All patient safety organizations (PSOs) have authority to operate in all 50
States and US territories but not all do In 2014 38 PSOs self-reported being available to
providers nationally PSOs not available nationally serve specific States
Geographic Variation
Nearly all States have at least 2 PSOs available to providers in their State in addition to
the 38 national PSOs that serve all States
Florida has the most PSOs available with 8 in addition to the 38 nationally available
PSOs The States with the largest number of PSOs available are generally on the East
Coast (eg North Carolina Virginia New York Pennsylvania Tennessee Georgia) or
have large populations (eg Texas Illinois)
North Dakota South Dakota and Louisiana are the only states with just one PSO serving
their State in addition to the 38 national PSOs
Puerto Rico is served by one national PSO only
36 | National Healthcare Quality and Disparities Report
Patient Safety
Compounded Liquid Medications for Children
Compounded liquid medications for children in Michigan 2012
Source Levy S Buckley B Safe Table Success The MI Pediatric Safety Collaboration Presentation presented at the 7th Annual
Meeting of Patient Safety Organizations (PSOs) Rockville MD 2015 April and Rood JM Engels MJ Ciarkowski SL et al Variability in
compounding of oral liquids for pediatric patients a patient safety concern J Am Pharm Assn 201454(4)383-9
Note Information represents 244 responses to online survey of approximately 2000 Michigan pharmacies conducted in June 2012 by
The University of Michigan College of Pharmacy in collaboration with the Michigan Pharmacists Association
0
10
20
30
40
50
1 2 3 4 5 6 7 8 9
Nu
mb
er o
f D
rugs
Number of Unique Concentrations
Number of Different Compounded Concentrations per Drug
0
10
20
30
40
50
No Harm No Harm ButMonitoring
TemporaryHarm
Pe
rce
nt
Compounding Errors by Related Harm and Pharmacy Setting
Inpatient Outpatient
Compounded liquid medications for children in Michigan 2012
Source Levy S Buckley B Safe Table Success The MI Pediatric Safety Collaboration Presentation presented at the 7th Annual
Meeting of Patient Safety Organizations (PSOs) Rockville MD 2015 April and Rood JM Engels MJ Ciarkowski SL et al Variability in
compounding of oral liquids for pediatric patients a patient safety concern J Am Pharm Assn 201454(4)383-9
Note Information represents 244 responses to online survey of approximately 2000 Michigan pharmacies conducted in June 2012 by
The University of Michigan College of Pharmacy in collaboration with the Michigan Pharmacists Association
0
10
20
30
40
50
1 2 3 4 5 6 7 8 9
Nu
mb
er o
f D
rugs
Number of Unique Concentrations
Number of Different Compounded Concentrations per Drug
0
10
20
30
40
50
No Harm No Harm ButMonitoring
TemporaryHarm
Per
cen
t
Compounding Errors by Related Harm and Pharmacy Setting
Inpatient Outpatient
Importance
Liquid medications are widely used in pediatrics because many children find it difficult
to swallow tablets or capsules If not commercially manufactured these liquid
medications require a pharmacist to compound them to the correct dosage for the patient
This practice of compounding has led to a variety of medication concentrations in use In
the absence of standard concentrations for compounded medications there is a risk that
children may accidentally receive medications that are too potent and can be dangerous
or are too weak to be effective
The Michigan Health amp Hospital Association Keystone Center Patient Safety
Organization hosts five Pediatric Safe Tables each year Safe Tables provided a
confidential and legally protected environment to discuss challenges and improvement
strategies regarding inconsistent medication concentrations for compounded oral liquids
without fear of punitive action against them
National Healthcare Quality and Disparities Report | 37
Patient Safety
Overall Percentage
More than half (527) of drugs identified in the 2012 survey had 3 or more unique
concentrations dispensed to children across Michigan For example Rifampin used to
treat bacterial infections was reported to have 8 different concentrations dispensed to
patients
Nearly one-third (313) of reported errors caused temporary harm or required additional
monitoring despite no harm
Standardization of Compounded Liquid Medications
Source Michigan Health amp Hospital Association Keystone Center Patient Safety Organization and University of Michigan College of Pharmacy
State-Wide Initiative to Standardize the Compounding of Oral Liquids in Pediatrics
Standardization of compounded liquid medications for children in Michigan 2011
Issue identificationbull Hospitals attending PSO Pediatrics Safe
Table raise compounded medication concentrations as a major safety issue
bull Small focus group determines extent of problem
bull Michigan pharmacies are surveyed about baseline concentrations
Develop Interventionbull PSO Quarterly Safe Tables are held to
discuss cases and practicesbull Team develops recommendations for
standard concentrationsbull Consensus is achieved for frequently
compounded pediatric medications 470 formulations for 147 drug entities are reduced to 104 concentrations for 100 drugs
Practice changebull Toolkit is createdbull Standards are disseminated to Michigan
prescribers and pharmacies bull Standards are disseminated to PSO
members and Safe Table participants
Source Michigan Health amp Hospital Association Keystone Center Patient Safety Organization and University of Michigan College of Pharmacy
State-Wide Initiative to Standardize the Compounding of Oral Liquids in Pediatrics
Standardization of compounded liquid medications for children in Michigan 2011
Issue identificationbull Hospitals attending PSO Pediatrics Safe
Table raise compounded medication concentrations as a major safety issue
bull Small focus group determines extent of problem
bull Michigan pharmacies are surveyed about baseline concentrations
Develop Interventionbull PSO Quarterly Safe Tables are held to
discuss cases and practicesbull Team develops recommendations for
standard concentrationsbull Consensus is achieved for frequently
compounded pediatric medications 470 formulations for 147 drug entities are reduced to 104 concentrations for 100 drugs
Practice changebull Toolkit is createdbull Standards are disseminated to Michigan
prescribers and pharmacies bull Standards are disseminated to PSO
members and Safe Table participants
The Role of PSO Safe Tables Based on adverse medication events discussed in the
Michigan Health amp Hospital Association (MHA) Keystone Center Patient Safety
Organization (PSO) Safe Tables in July 2011 the Michigan Pediatric Safety Collaboration
was developed to further assess the scope of the problem and formulate a solution
The Collaborative The Michigan Pediatric Safety Collaboration includes individuals from
the University of Michigan College of Pharmacy the Michigan Pharmacists Association
(MPA) the Food and Drug Administration (FDA) and the MHA Keystone PSO
38 | National Healthcare Quality and Disparities Report
Patient Safety
Practice Change
As a result of the standardization effort 470 unique formulations for 147 drug entities
were reduced to 104 different concentrations for 100 drugs
The Michigan Pediatric Safety Collaboration developed a multistep process to implement
standards for compounding medications The MPA surveyed pharmacies in Michigan to
better define the nature and scope of the problem The PSO continued to act as convener
The result was the creation and dissemination of statewide standards for 120 frequently
compounded pediatric medications
Veterans Health Administration
The National Center for Patient Safety is part of the Veterans Health Administration the
Nationrsquos largest integrated health care system
Patient safety-related system improvement initiatives include
The Daily Planreg
Purchasing for Safety Initiative
Patient Safety Improvement Initiative
Patient safety improvement initiative The Daily Planreg at Veterans Affairs Medical Centers 2009
Source King BJ Mills PD Fore A et al The Daily Planreg including patients for safetys sake Nurs Manage 201243(3)15-8
0
10
20
30
40
50
Identified atleast one
error
Identifiederror
of omission
Identifiederror
ofcommission
Nurses Who Identified Errors in Patient Treatment Plan by Type
0
10
20
30
40
50
Patient founddiscrepancy inplanned care
Family founddiscrepancy inplanned care
Nursing Stafffound
discrepancyin plannedtreatment
Respondents Who Identified Errors or Discrepancies Through The Daily Plan reg
Patient safety improvement initiative The Daily Planreg at Veterans Affairs Medical Centers 2009
Source King BJ Mills PD Fore A et al The Daily Planreg including patients for safetys sake Nurs Manage 201243(3)15-8
0
10
20
30
40
50
Identified atleast one
error
Identifiederror
of omission
Identifiederror
ofcommission
Nurses Who Identified Errors in Patient Treatment Plan by Type
0
10
20
30
40
50
Patient founddiscrepancy inplanned care
Family founddiscrepancy inplanned care
Nursing Stafffound
discrepancyin plannedtreatment
Respondents Who Identified Errors or Discrepancies Through The Daily Plan reg
National Healthcare Quality and Disparities Report | 39
Patient Safety
Importance The Daily Planreg
is a two-page printed summary that acts as a schedule for
patients and providers each day It shows the procedures laboratory tests and medications
scheduled for that day and lists essential health information such as patientrsquos name allergies
and current medications It can be tailored for a patientrsquos needs by extracting orders from the
electronic medical record (EMR) The Daily Planreg
is intended to facilitate patient and family
engagement throughout the course of care The Daily Planreg
shows promise for improving
patient safety Since 2009 the VA has implemented The Daily Planreg
in more than 65
hospitals both inpatient and outpatient care settings The Daily Planreg
is shared more than
75000 times a month and the VA plans to continue the spread of The Daily Planreg
at
additional sites in 2016
Findings
As part of a pilot test in 2009 a total of 198 patients and 85 nurses responded to a survey
across 10 facilities Nurses had an average of 34 patients per shift who received The
Daily Planreg Patients responded about their own experiences whereas nurses reported
about all of their patients who received The Daily Planreg
Nearly half (475) of patients reported finding a discrepancy in planned care through
The Daily Planreg In addition 30 of patients reported that their family members found a
discrepancy Although not every discrepancy will be a potential medical error having a
shared understanding of the plan of care decreases the risk of error
More than one in six nurses (176) identified a discrepancy in treatment among their
patients through The Daily Planreg Most of these nurses (153) found one or more errors
of omission and a smaller share (106) of nurses found one or more errors of
commission some found both
40 | National Healthcare Quality and Disparities Report
Patient Safety
Issues Related to Ventilators
Common use-issues related to ventilators at the Veterans Health Administration 2006-2014 (combined)
Source Veterans Health Administration National Center for Patient Safety data collected October 2006 to October 2014
Note Examples of equipment failures include ventilator shutdown and other ventilator problems Ventilator settings include setup problems and
incorrect settings Support activities include space utilities and supplies Transport includes accidental extubation other transportation issues
and vehicle-related issues Alarms include alarm settings and alarm connection Training includes unknown ventilator model and other training
concerns
0
20
40
60
80
100
120
140
160
EquipmentFailure
VentilatorSettings
SupportActivities
Transport Alarms Training
Nu
mb
er o
f R
epo
rts
Common use-issues related to ventilators at the Veterans Health Administration 2006-2014 (combined)
Source Veterans Health Administration National Center for Patient Safety data collected October 2006 to October 2014
Note Examples of equipment failures include ventilator shutdown and other ventilator problems Ventilator settings include setup problems and
incorrect settings Support activities include space utilities and supplies Transport includes accidental extubation other transportation issues
and vehicle-related issues Alarms include alarm settings and alarm connection Training includes unknown ventilator model and other training
concerns
0
20
40
60
80
100
120
140
160
EquipmentFailure
VentilatorSettings
SupportActivities
Transport Alarms Training
Nu
mb
er o
f R
epo
rts
Importance Beginning with a focus on ventilators the Veterans Health Administrationrsquos
human factors-based Purchasing for Safety Initiative communicates the most common use-
issues associated with medical devices in order to ultimately remove or contain identified
vulnerabilities and prevent further harm
Event Reporting Patient safety managers report events and close calls from more than 150
VA facilities to a national database The largest number of use issues related to ventilators
involved equipment failure and issues such as spontaneous ventilator shutdown compressor
failure and broken or missing parts Other categories of ventilator use issues involved the
physical space where the ventilator was used challenges of transporting patients on
ventilators and problems with ventilator settings and alarms Root cause analyses on reports
are conducted and Patient Safety Alerts are issued to share the learning internally
Other Key Components
Data on ventilator issues from the VA and the Food and Drug Administrationrsquos Medical
Product Safety Network are the basis for a ldquogovernment-industry dayrdquo to work with
manufacturers This information is used to help the device manufacturers better
understand the limits of human use of their products
National Healthcare Quality and Disparities Report | 41
Patient Safety
The VA also trains noncliniciansmdashsuch as biomedical engineers across the
organizationmdashto understand the devices consider the situation for their use and identify
what can go wrong (ldquofailure modesrdquo) in advance
The VA encourages discussions among clinicians about their experience in using devices
In the Applied Patient Safety Challenge hundreds of staff participate in brainstorming
about solutions and strategies for dealing with unexpected scenarios involving devices
National Practitioner Data Bank
Medical malpractice actions are one way to flag potential medical errors
Medical Malpractice Payment Reports are submitted to the National Practitioner Data Bank
by medical malpractice payers
Report of a monetary exchange made for the benefit of a physician dentist or other
health care provider
Result of a settlement or judgment of a written complaint or claim based on that
providerrsquos delivery of or failure to deliver health care services
Number of Medical Malpractice Payment Reports by Setting
Number of Medical Malpractice Payment Reports by health care setting 2004-2014
Source National Practitioner Data Bank (NPDB) Public Use Data File Health Resources and Services Administration Bureau of Health
Professions Division of Practitioner Data Banks 2004-2014
Note Health care setting was not collected by the NPDB for 2104 reports in 2004 ldquoOtherrdquo includes Medical Malpractice Payment Reports
related to unknown settings as well as those for a combination of inpatient and outpatient settings Reports pertain to patients of any age
0
2000
4000
6000
8000
10000
12000
14000
16000
18000
20000
2004 2005 2006 2007 2008 2009 2010 2011 2012 2013 2014
Nu
mb
er o
f R
epo
rts
Total Inpatient Outpatient Other
Number of Medical Malpractice Payment Reports by health care setting 2004-2014
Source National Practitioner Data Bank (NPDB) Public Use Data File Health Resources and Services Administration Bureau of Health
Professions Division of Practitioner Data Banks 2004-2014
Note Health care setting was not collected by the NPDB for 2104 reports in 2004 ldquoOtherrdquo includes Medical Malpractice Payment Reports
related to unknown settings as well as those for a combination of inpatient and outpatient settings Reports pertain to patients of any age
0
2000
4000
6000
8000
10000
12000
14000
16000
18000
20000
2004 2005 2006 2007 2008 2009 2010 2011 2012 2013 2014
Nu
mb
er o
f R
epo
rts
Total Inpatient Outpatient Other
42 | National Healthcare Quality and Disparities Report
Patient Safety
Trends The total number of medical malpractice payment reports (MMPRs) per year
decreased from 17641 in 2004 to 12699 in 2014
Variation Across Reports
Of 157022 MMPRs from 2004 through 2014 more reports related to care in the
outpatient setting (71937) than in the inpatient setting (60391)
Diagnosis-related and treatment-related payments were the most frequent types of
reports each accounting for about 27 of cases Reports of payments for medication-
related cases accounted for only 5 of MMPRs (data not shown)
Number of Medical Malpractice Payment Reports by Allegation and Harm
Number of Medical Malpractice Payment Reports by type of allegation and harm severity 2004-2014
Key Temporary injury = Minor temporary injury and Major temporary injury Permanent significant injury = Significant Permanent Injury
Major Permanent Injury Quadriplegia Brain Damage Lifelong care
Source National Practitioner Data Bank Public Use Data File Health Resources and Services Administration Bureau of Health Professions
Division of Practitioner Data Banks 2004-2014
Note Reports pertain to patients of any age
0
20
40
60
80
100
Treatment(n=42913)
Diagnosis(n=42507)
Surgery(n=36845)
Obstetrics(n=10555)
Medication(n=8287)
Monitoring(n=5329)
Anesthesia(n=4276)
Equipment(n=1161)
BehavioralHealth
(n=879)
Blood(n=379)
EmotionalInjury Only
InsignificantInjury
TemporaryInjury
PermanentMinor Injury
PermanentSignificant Injury
Death Unknown
Number of Medical Malpractice Payment Reports by type of allegation and harm severity 2004-2014
Key Temporary injury = Minor temporary injury and Major temporary injury Permanent significant injury = Significant Permanent Injury
Major Permanent Injury Quadriplegia Brain Damage Lifelong care
Source National Practitioner Data Bank Public Use Data File Health Resources and Services Administration Bureau of Health Professions
Division of Practitioner Data Banks 2004-2014
Note Reports pertain to patients of any age
0
20
40
60
80
100
Treatment(n=42913)
Diagnosis(n=42507)
Surgery(n=36845)
Obstetrics(n=10555)
Medication(n=8287)
Monitoring(n=5329)
Anesthesia(n=4276)
Equipment(n=1161)
BehavioralHealth
(n=879)
Blood(n=379)
EmotionalInjury Only
InsignificantInjury
TemporaryInjury
PermanentMinor Injury
PermanentSignificant Injury
Death Unknown
Overall Percentage From 2004 to 2014 medical malpractice payments were made for
allegations related to
Treatment (42913)
Diagnosis (42507)
Surgery (36845)
Obstetrics (10555)
Medication (8287)
Monitoring (5329)
National Healthcare Quality and Disparities Report | 43
Patient Safety
Anesthesia (4276)
Equipment or products (1161)
Behavioral health (879) and
IV and blood products (379)
Variation Across Reports
Death accounted for more than one-third of harm in payments related to monitoring
(499) diagnosis (393) medication (383) and anesthesia (363) allegations
More than half of all obstetric payments were for allegations of permanent severe harm
(570)
Temporary harm accounted for more than one-third of payments related to equipment
(485) and surgery (360)
Most of the behavioral health-related payments were for emotional harm (457) or
death (338)
References
Agency for Healthcare Research and Quality Making Health Care Safer II An Updated Critical Analysis of the
Evidence for Patient Safety Practices Comparative Effectiveness Review No 211 Rockville MD Agency for
Healthcare Research and Quality March 2013 AHRQ Publication No 13-E001-EF
httpwwwahrqgovsitesdefaultfileswysiwygresearchfindingsevidence-basedshy
reportsservicesqualityptsafetyII-fullpdf
Arriaga AF Lancaster RT Berry RW et al The better colectomy project association of evidence-based best-
practice adherence rates to outcomes in colorectal surgery Ann Surg 2009 Oct250(4)507-13
httpwwwncbinlmnihgovpubmed19734778
Centers for Disease Control and Prevention HAI Prevalence Survey
httpwwwcdcgovHAIsurveillanceindexhtml Last updated March 2016 Accessed March 4 2016
Centers for Disease Control and Prevention Nursing Homes and Assisted Living (Long-Term Care Facilities)
httpwwwcdcgovlongtermcare Last updated September 2015 Accessed March 4 2016
Chassin MR Loeb JM High-reliability health care getting there from here Milbank Q 201391(3)459-90
httpwwwncbinlmnihgovpmcarticlesPMC3790522 Accessed September 23 2015
Chiu Y Bero L Hessol NA et al A literature review of clinical outcomes associated with antipsychotic medication
use in North American nursing home residents Health Policy 2015 Jun119(6)802-813 Epub 2015 Feb 28 PMID
25791166 httpwwwsciencedirectcomsciencearticlepiiS0168851015000652 Accessed June 17 2015
Huybrechts KF Gerhard Crystal S et al Differential risk of death in older residents in nursing homes prescribed
specific antipsychotic drugs Population based cohort study BMJ 2012 Feb 23344e977 PMID 22362541
httpwwwncbinlmnihgovpmcarticlesPMC3285717 Accessed June 17 2015
Institute of Medicine Preventing Medication Errors Quality Chasm Series 2007
httpwwwnapeducatalog11623preventing-medication-errors-quality-chasm-series
National Association for Home Care amp Hospice Basic Statistics About Home Care Updated 2010
httpwwwnahcorgassets1710hc_statspdf Accessed August 31 2015
44 | National Healthcare Quality and Disparities Report
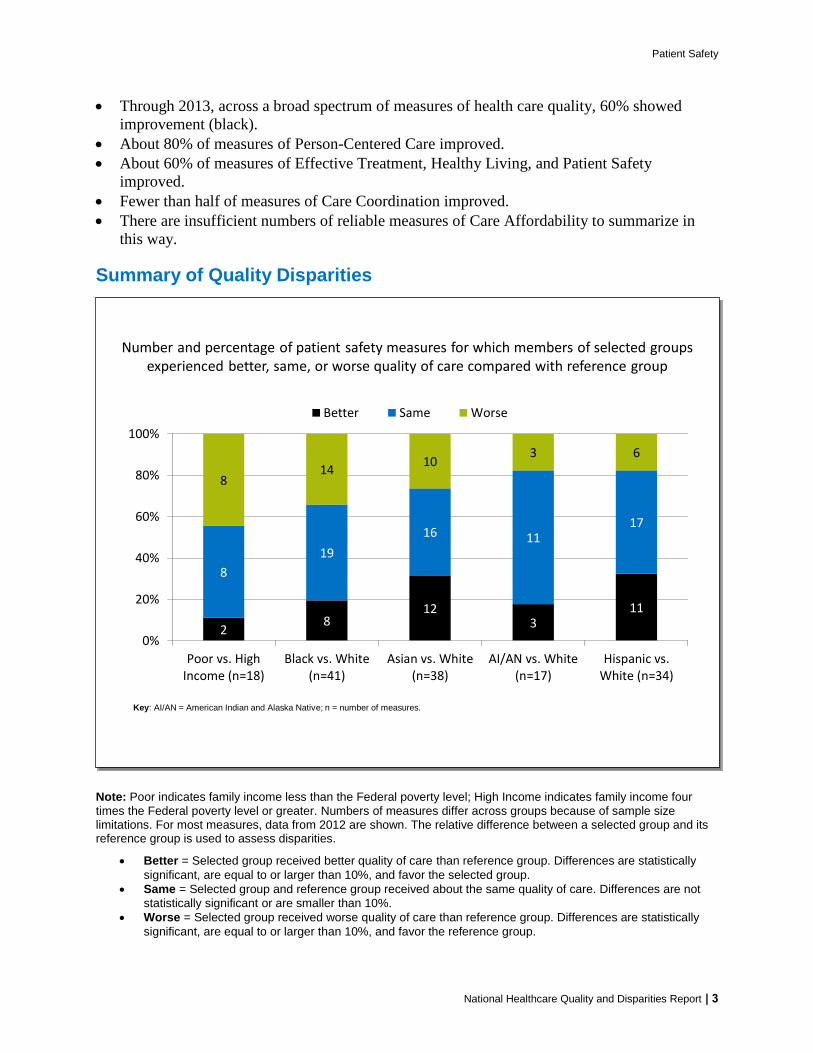
Patient Safety
Through 2013 across a broad spectrum of measures of health care quality 60 showed
improvement (black)
About 80 of measures of Person-Centered Care improved
About 60 of measures of Effective Treatment Healthy Living and Patient Safety
improved
Fewer than half of measures of Care Coordination improved
There are insufficient numbers of reliable measures of Care Affordability to summarize in
this way
Summary of Quality Disparities
Number and percentage of patient safety measures for which members of selected groups experienced better same or worse quality of care compared with reference group
28
123
11
8
19
16 1117
814
103 6
0
20
40
60
80
100
Poor vs HighIncome (n=18)
Black vs White(n=41)
Asian vs White(n=38)
AIAN vs White(n=17)
Hispanic vsWhite (n=34)
Better Same Worse
Key AIAN = American Indian and Alaska Native n = number of measures
Number and percentage of patient safety measures for which members of selected groups experienced better same or worse quality of care compared with reference group
28
123
11
8
19
16 1117
814
103 6
0
20
40
60
80
100
Poor vs HighIncome (n=18)
Black vs White(n=41)
Asian vs White(n=38)
AIAN vs White(n=17)
Hispanic vsWhite (n=34)
Better Same Worse
Key AIAN = American Indian and Alaska Native n = number of measures
Note Poor indicates family income less than the Federal poverty level High Income indicates family income four
times the Federal poverty level or greater Numbers of measures differ across groups because of sample size limitations For most measures data from 2012 are shown The relative difference between a selected group and its reference group is used to assess disparities
Better = Selected group received better quality of care than reference group Differences are statistically
significant are equal to or larger than 10 and favor the selected group
Same = Selected group and reference group received about the same quality of care Differences are not
statistically significant or are smaller than 10
Worse = Selected group received worse quality of care than reference group Differences are statistically
significant are equal to or larger than 10 and favor the reference group
National Healthcare Quality and Disparities Report | 3
Patient Safety
People in poor households received worse care than people in high-income households for
about 45 of patient safety measures
Blacks received worse care than Whites for about 20 of patient safety measures and
Asians received worse care than Whites for about 30 of patient safety measures
Patient Safety Measures With Disparities That Were Getting Smaller Over Time
Note Bold indicates disparities that were eliminated
Black vs White Gap
Admissions with central venous catheter-related bloodstream infection per 1000 medical
and surgical discharges of length 2 or more days
Postoperative pulmonary embolism or deep vein thrombosis per 1000 surgical admissions
Postoperative respiratory failure per 1000 elective-surgery admissions
Admissions with iatrogenic pneumothorax per 1000 discharges
Poor vs High Income Gap
Admissions with accidental puncture or laceration during procedure per 1000 medical
and surgical admissions age less than 18 years
Hispanic vs Non-Hispanic White Gap
Adult surgery patients with postoperative catheter-associated urinary tract infection
Asian vs White Gap
Deaths per 1000 elective-surgery admissions having developed specified complications
of care during hospitalization
Patient Safety Measures That Developed New Disparities
Asian vs White Gap
Accidental puncture or laceration during procedure per 1000 medical and surgical
admissions age 18 and over
Home health care patients who get better at taking their medication correctly
Obstetric trauma per 1000 instrument-assisted vaginal deliveries
Hispanic vs Non-Hispanic White Gap
Postoperative physiologic and metabolic derangements per 1000 elective-surgery admissions
4 | National Healthcare Quality and Disparities Report
Patient Safety
Measures of Patient Safety
Summary of information on patient safety from the National Healthcare Quality and
Disparities Report
Individual measures of patient safety overall and by age sex race ethnicity income
education insurance birth weight health status and presence of various health conditions
Measures of patient safety by setting
Hospitals
Nursing homes
Home health
Ambulatory care
All settings Infrastructure
Patient Safety in the Hospital Setting
Hospitals are a common setting for patient safety events
Many patients admitted to the hospital are in a clinically compromised state
Care often includes the use of invasive devices and procedures increasing patientsrsquo risk
for infection and harm
Measures include
Overall hospital-acquired conditions (HACs)
Healthcare-associated infections (HAIs)
Procedure-related events
National Healthcare Quality and Disparities Report | 5
Patient Safety
6 | National Healthcare Quality and Disparities Report
Distribution of Hospital-Acquired Conditions
Importance Hospital-acquired conditions (HACs) are conditions that patients did not have upon hospital admission but which developed during the patientrsquos hospital stay They can lead to poor patient outcomes and increased spending on health care HACs are often preventable
Overall Rate
In 2014 the overall HAC rate was 121 per 1000 hospital discharges Adverse drug events (414 per 1000 hospital discharges) accounted for 342 of total HACs and pressure ulcers (309 per 1000 hospital discharges) accounted for 255 of the total
Trends
From 2010 through 2014 the overall rate of hospital-acquired conditions declined 17 from 145 to 121 per 1000 hospital discharges
Among the most frequent HACs between 2010 and 2014 the rate of pressure ulcers decreased the most from 403 per 1000 discharges (more than 13 million events) to 309 per 1000 discharges (about 1 million events)
403 404 394 325 309
495 487 419403 414
122 113106
88 76
79 7872
72 79
81 7374
69 67
273 267257
251 266
0
20
40
60
80
100
120
140
160
2010 2011 2012 2013 2014
Rat
e p
er 1
00
0 D
isch
arge
s
Pressure Ulcers Adverse DrugEvents
Catheter-AssociatedUrinary Tract Infections
Falls Lower FrequencyHACs
All Other HACs
145 142132
121 121
Source Agency for Healthcare Research and Quality (AHRQ) Medicare Patient Safety Monitoring System 2010-2014 Healthcare Cost and
Utilization Project Nationwide Inpatient Sample 2010-2013 Centers for Disease Control and Prevention National Healthcare Safety Network
2010-2013
Denominator Adult hospital discharges age 18 and over
Note Lower Frequency HACs (lt31000 discharges) include central line-associated bloodstream infections venous thromboembolisms surgical
site infections obstetric adverse events and ventilator-associated pneumonia All Other Hospital-Acquired Conditions includes inadvertent femoral
artery puncture for catheter angiographic procedures adverse event associated with hip joint replacement adverse event associated with knee
joint replacement contrast nephropathy associated with catheter angiography methicillin-resistant Staphylococcus aureus (MRSA) vancomycin-
resistant Enterococcus (VRE) C difficile mechanical complications associated with central venous catheters postoperative cardiac events for
cardiac and noncardiac surgeries postoperative pneumonia iatrogenic pneumothorax postoperative hemorrhage or hematoma postoperative
respiratory failure and accidental puncture or laceration For more information on methods see httpwwwahrqgovprofessionalsquality-patient-
safetypfpinterimhacrate2014html
Distribution of hospital-acquired conditions based on national rates per 1000 adult hospital discharges 2010-2014
403 404 394 325 309
495 487 419403 414
122 113106
88 76
79 7872
72 79
81 7374
69 67
273 267257
251 266
0
20
40
60
80
100
120
140
160
2010 2011 2012 2013 2014
Rat
e p
er 1
00
0 D
isch
arge
s
Pressure Ulcers Adverse DrugEvents
Catheter-AssociatedUrinary Tract Infections
Falls Lower FrequencyHACs
All Other HACs
145 142132
121 121
Source Agency for Healthcare Research and Quality (AHRQ) Medicare Patient Safety Monitoring System 2010-2014 Healthcare Cost and
Utilization Project Nationwide Inpatient Sample 2010-2013 Centers for Disease Control and Prevention National Healthcare Safety Network
2010-2013
Denominator Adult hospital discharges age 18 and over
Note Lower Frequency HACs (lt31000 discharges) include central line-associated bloodstream infections venous thromboembolisms surgical
site infections obstetric adverse events and ventilator-associated pneumonia All Other Hospital-Acquired Conditions includes inadvertent femoral
artery puncture for catheter angiographic procedures adverse event associated with hip joint replacement adverse event associated with knee
joint replacement contrast nephropathy associated with catheter angiography methicillin-resistant Staphylococcus aureus (MRSA) vancomycin-
resistant Enterococcus (VRE) C difficile mechanical complications associated with central venous catheters postoperative cardiac events for
cardiac and noncardiac surgeries postoperative pneumonia iatrogenic pneumothorax postoperative hemorrhage or hematoma postoperative
respiratory failure and accidental puncture or laceration For more information on methods see httpwwwahrqgovprofessionalsquality-patient-
safetypfpinterimhacrate2014html
Distribution of hospital-acquired conditions based on national rates per 1000 adult hospital discharges 2010-2014
Patient Safety
During that same period adverse drug events decreased from a rate of 495 per 1000
discharges (more than 16 million events) to 414 per 1000 discharges (fewer than 14
million events) The catheter-associated urinary tract infection rate decreased from 122
to 76 per 1000 discharges (400000 and 250000 events respectively)
Among the less frequent HACs central line-associated bloodstream infections had the
greatest percentage decrease in rate (67) between 2010 and 2014 The rates of venous
thromboembolism (44) surgical site infections (17) and obstetric events (4) also
decreased
Healthcare-Associated Infections
Infections acquired during a hospital stay are among the most common complications of
hospital care
On any given day about 1 in 25 hospital patients has at least one healthcare-associated
infection (HAI) (CDC 2016)
HAIs often increase the patientrsquos length of stay in the hospital risk of mortality and hospital
costs
New infections in critically ill infants children and other patients generally reduce their
chances for recovery
For more information see the PSNet link to Patient Safety Primer Health Care-Associated
Infections at httpspsnetahrqgovprimersprimer7
Measures of Patient Safety in the Hospital Setting HAIs
Postoperative sepsis per 1000 adult discharges with an elective operating room procedure
Standardized infection ratios (SIRs) for central line-associated bloodstream infections
surgical site infections and catheter-associated urinary tract infections (CAUTIs)
SIRs compare the observed number of infections reported to the National Healthcare
Safety Network (NHSN) during a year to the predicted number of infections based on the
January 2006 to December 2008 referent period for central line-associated bloodstream
infections (CLABSIs) and surgical site infections (SSIs) and the calendar year 2009
referent period for CAUTIs
Change in SIRs for CAUTIs
Bloodstream infections per 1000 central-line days
In neonatal intensive care units (NICUs)
In adult intensive care units
National Healthcare Quality and Disparities Report | 7
Patient Safety
Postoperative Sepsis
Postoperative sepsis per 1000 adult discharges with an elective operating room procedure by sex and insurance status 2008-2013
Source Agency for Healthcare Research and Quality (AHRQ) Healthcare Cost and Utilization Project Nationwide Inpatient Sample 2008-
2013 and AHRQ Quality Indicators version 44
Denominator All elective hospital surgical discharges for patients age 18 years and over with length of stay of 4 or more days excluding
patients admitted for infection those with cancer or immunocompromised states those with obstetric conditions and admissions specifically for
sepsis
Note For this measure lower rates are better Acute care hospitalizations only Rates are adjusted by age sex age-sex interactions
comorbidities major diagnostic category diagnosis-related group and transfers into the hospital
0
5
10
15
20
25
2008 2009 2010 2011 2012 2013
Rat
e p
er
10
00
Dis
char
ges
Total Male Female
0
5
10
15
20
25
2008 2009 2010 2011 2012 2013
Rat
e p
er
10
00
Dis
char
ges
Private MedicareMedicaid Uninsured
Postoperative sepsis per 1000 adult discharges with an elective operating room procedure by sex and insurance status 2008-2013
Source Agency for Healthcare Research and Quality (AHRQ) Healthcare Cost and Utilization Project Nationwide Inpatient Sample 2008-
2013 and AHRQ Quality Indicators version 44
Denominator All elective hospital surgical discharges for patients age 18 years and over with length of stay of 4 or more days excluding
patients admitted for infection those with cancer or immunocompromised states those with obstetric conditions and admissions specifically for
sepsis
Note For this measure lower rates are better Acute care hospitalizations only Rates are adjusted by age sex age-sex interactions
comorbidities major diagnostic category diagnosis-related group and transfers into the hospital
0
5
10
15
20
25
2008 2009 2010 2011 2012 2013
Rat
e p
er
10
00
Dis
char
ges
Total Male Female
0
5
10
15
20
25
2008 2009 2010 2011 2012 2013
Rat
e p
er
10
00
Dis
char
ges
Private MedicareMedicaid Uninsured
Overall Rate In 2013 the postoperative sepsis rate was 143 per 1000 adult discharges with
an elective operating room procedure
Groups With Disparities
In 2013 female patients had a lower rate of postoperative sepsis than male patients
Also in 2013 patients with Medicaid and those with Medicare had worse sepsis rates
than privately insured patients
From 2008 to 2013 there were no statistically significant changes in the gap between
males and females
From 2008 to 2013 there were no statistically significant changes in the gap between
privately insured patients and other insurance groups
8 | National Healthcare Quality and Disparities Report
Patient Safety
Standardized Infection Ratios
Standardized infection ratios for central line-associated bloodstream infections and surgical site infections 2009-2013 and catheter-associated
urinary tract infections 2010-2013
Key CLABSI = central line-associated bloodstream infection SSI = surgical site infection SCIP = Surgical Care Improvement Project CAUTI =
catheter-associated urinary tract infection
Source Centers for Disease Control and Prevention National Center for Emerging and Zoonotic Infectious Diseases 2013 National and State
Healthcare Associated Infections Progress Report and National Healthcare Safety Network 2009ndash2013
Note For this measure lower numbers are better Acute care hospitalizations only CAUTI excludes neonatal intensive care units
00
02
04
06
08
10
12
14
2009 2010 2011 2012 2013
Stan
dar
diz
ed
Infe
ctio
n R
atio
CLABSI All SSI Combined SCIP Procedures CAUTI All
Standardized infection ratios for central line-associated bloodstream infections and surgical site infections 2009-2013 and catheter-associated
urinary tract infections 2010-2013
Key CLABSI = central line-associated bloodstream infection SSI = surgical site infection SCIP = Surgical Care Improvement Project CAUTI =
catheter-associated urinary tract infection
Source Centers for Disease Control and Prevention National Center for Emerging and Zoonotic Infectious Diseases 2013 National and State
Healthcare Associated Infections Progress Report and National Healthcare Safety Network 2009ndash2013
Note For this measure lower numbers are better Acute care hospitalizations only CAUTI excludes neonatal intensive care units
00
02
04
06
08
10
12
14
2009 2010 2011 2012 2013
Stan
dar
diz
ed
Infe
ctio
n R
atio
CLABSI All SSI Combined SCIP Procedures CAUTI All
Background SIRs compare the observed number of infections reported to the NHSN during
a year to the predicted number of infections based on the January 2006 to December 2008
referent period for CLABSIs and SSIs and the calendar year 2009 referent period for
CAUTIs For example a ratio of 81 for SSIs in 2013 indicates that 19 fewer SSIs were
observed in 2013 than predicted based on the 2006-2008 baseline period Data are from all
intensive care units wards and other non-critical care locations CLABSI data also include
neonatal intensive care units but exclude long-term acute care hospitals and inpatient
rehabilitation facilities SCIP procedures are those performed on adults Number of facilities
reporting to NHSN roughly tripled from 2009 to 2013 Procedures include abdominal aortic
aneurysm repair peripheral vascular bypass surgery coronary artery bypass graft with both
chest and donor site incisions or with chest incision only other cardiac surgery colon
surgery rectal surgery hip arthroplasty abdominal hysterectomy knee arthroplasty and
vaginal hysterectomy
Overall Rate In 2013 the overall SIR for CLABSIs among intensive care units in the 50
States District of Columbia and Puerto Rico was 054 and the overall SIR for CAUTIs was
106 The overall SIR for SSIs following 10 common procedures in adults was 081
Trends From 2009 to 2013 the SIR for CLABSIs improved and from 2010 to 2013 the
SIR for CAUTIs worsened for facilities reporting to NHSN
National Healthcare Quality and Disparities Report | 9
Patient Safety
Change in Statewide SIRs
Change from 2012 to 2013 in Statewide SIRs for CAUTI
Key CAUTI = catheter-associated urinary tract infection NHSN = National Healthcare Safety Network
Source Centers for Disease Control and Prevention National Center for Emerging and Zoonotic Infectious Diseases 2013 National and State
Healthcare Associated Infections Progress Report
Note For this measure lower numbers are better Changes in SIRs are categorized as ldquono changerdquo if they are not statistically significant Acute
care hospitalizations only Excludes neonatal intensive care units For this measure District of Columbia and Puerto Rico are treated as States
No Change
Increase
Indicates State mandate
in 2013 to report CAUTI
to NHSN
Decrease
AKAK
HI PR
AZ
CA
UT
CT
FL
GA
IA
IL
KS
MA
MDMO
NJ
NY
OR
PA
SCTN
CO
WA
WI
VA
ME
MN
MI
NC
TX
KY
WV
RI
NE
VT
NVOH
SD
AR
IN
NH
MT
ID
WY
ND
NM
OK
LA
MS AL
DE
DC
Change from 2012 to 2013 in Statewide SIRs for CAUTI
Key CAUTI = catheter-associated urinary tract infection NHSN = National Healthcare Safety Network
Source Centers for Disease Control and Prevention National Center for Emerging and Zoonotic Infectious Diseases 2013 National and State
Healthcare Associated Infections Progress Report
Note For this measure lower numbers are better Changes in SIRs are categorized as ldquono changerdquo if they are not statistically significant Acute
care hospitalizations only Excludes neonatal intensive care units For this measure District of Columbia and Puerto Rico are treated as States
No Change
Increase
Indicates State mandate
in 2013 to report CAUTI
to NHSN
Decrease
AKAK
HI PR
AZ
CA
UT
CT
FL
GA
IA
IL
KS
MA
MDMO
NJ
NY
OR
PA
SCTN
CO
WA
WI
VA
ME
MN
MI
NC
TX
KY
WV
RI
NE
VT
NVOH
SD
AR
IN
NH
MT
ID
WY
ND
NM
OK
LA
MS AL
DE
DC
Geographic Variation In 2013 31 States had SIRs greater than 1 indicating that on average
their hospitals had more CAUTIs than hospitals of similar type and size during the 2009
referent period The States were Alaska Arkansas Arizona Connecticut District of Columbia
Delaware Georgia Idaho Indiana Kansas Kentucky Massachusetts Maryland Maine
Michigan Minnesota Missouri Mississippi North Carolina New Jersey Nevada New York
Oregon Pennsylvania Rhode Island South Carolina Tennessee Texas Utah Virginia and
Washington
Trends Of 52 reporting States 33 had no change from 2012 to 2013 in CAUTI SIRs 9
decreased and 10 increased
Toolkit for Reducing Catheter-Associated Urinary Tract Infections in Hospitals
Purpose To help hospitals prevent catheter-associated urinary tract infections (CAUTIs) and
improve safety culture
Method Implementing evidence-based practical resources and concepts from the
Comprehensive Unit-based Safety Program
Intended User Hospital facilities
Available Tools Guides checklists webinars learning modules data interpretation guides
10 | National Healthcare Quality and Disparities Report
Patient Safety
Potential Measures of Effectiveness
Number of symptomatic CAUTIs attributable to each unit by month
Days since last CAUTI
Link httpwwwahrqgovprofessionalsquality-patient-safetyhaistoolscautishy
hospitalsIndexhtml
Central Line-Associated Bloodstream Infections in Neonatal Intensive Care Units
Central line-associated bloodstream infections per 1000 central-line days by birth weight of child in Level III neonatal intensive care units and by type
of pediatric ICU 2009-2013
Source Centers for Disease Control and Prevention National Healthcare Safety Network 2009-2013
Denominator Infections per 1000 central-line days
Note For this measure lower rates are better Acute care hospitalizations only
00
05
10
15
20
25
30
35
40
2009 2010 2011 2012 2013
Rat
e p
er
10
00
Ce
ntr
al-
Lin
e D
ays
le750 g 751-1000 g1001-1500 g 1501-2500 ggt2500 g
Level III Neonatal ICUs
00
05
10
15
20
25
30
35
40
2009 2010 2011 2012 2013
Rat
e p
er
10
00
Ce
ntr
al-
Lin
e D
ays
Pediatric Cardiothoracic ICUPediatric Medical ICUPediatric MedicalSurgical ICU
Pediatric ICUs
Central line-associated bloodstream infections per 1000 central-line days by birth weight of child in Level III neonatal intensive care units and by type
of pediatric ICU 2009-2013
Source Centers for Disease Control and Prevention National Healthcare Safety Network 2009-2013
Denominator Infections per 1000 central-line days
Note For this measure lower rates are better Acute care hospitalizations only
00
05
10
15
20
25
30
35
40
2009 2010 2011 2012 2013
Rat
e p
er
10
00
Ce
ntr
al-
Lin
e D
ays
le750 g 751-1000 g1001-1500 g 1501-2500 ggt2500 g
Level III Neonatal ICUs
00
05
10
15
20
25
30
35
40
2009 2010 2011 2012 2013
Rat
e p
er 1
000
Cen
tral
-Lin
e D
ays
Pediatric Cardiothoracic ICUPediatric Medical ICUPediatric MedicalSurgical ICU
Pediatric ICUs
Overall Rates
In 2013 among patients in Level III NICUs pooled mean CLABSI rates ranged from a
low of 06 infections per 1000 central-line days among neonates born at 1501 to 2500
grams to a high of 21 infections per 1000 central-line days among neonates born at less
than or equal to 750 grams
Trends
The rate of CLABSI among pediatric cardiothoracic ICUs was 25 in 2009 and 13 in
2013 among pediatric medical ICUs 26 in 2009 and 08 in 2013 and among pediatric
medicalsurgical ICUs 22 in 2009 and 12 in 2013
National Healthcare Quality and Disparities Report | 11
Patient Safety
Central Line-Associated Bloodstream Infections in Adult Intensive Care Units
Central linendashassociated bloodstream infections per 1000 central-line days in adult medical vs medicalsurgical intensive care units by hospital teaching
status 2006ndash2013
Source Centers for Disease Control and Prevention National Healthcare Safety Network 2006-2013
Denominator Infections per 1000 central-line days
Note For this measure lower rates are better Acute care hospitalizations only Major teaching facilities are defined as facilities with a program
for medical students and postgraduate medical training All other medical facilities include graduate facilities with programs for postgraduate
medical training only (ie residency andor fellowships) and undergraduate facilities with programs for medical students only
00
05
10
15
20
25
30
2006-2008 2009 2010 2011 2012 2013
Rat
e p
er
10
00
Ce
ntr
al-L
ine
Day
s
Major Teaching Medical ICU All Others Medical ICU
Major Teaching MedicalSurgical ICU All Others MedicalSurgical ICU
Central linendashassociated bloodstream infections per 1000 central-line days in adult medical vs medicalsurgical intensive care units by hospital teaching
status 2006ndash2013
Source Centers for Disease Control and Prevention National Healthcare Safety Network 2006-2013
Denominator Infections per 1000 central-line days
Note For this measure lower rates are better Acute care hospitalizations only Major teaching facilities are defined as facilities with a program
for medical students and postgraduate medical training All other medical facilities include graduate facilities with programs for postgraduate
medical training only (ie residency andor fellowships) and undergraduate facilities with programs for medical students only
00
05
10
15
20
25
30
2006-2008 2009 2010 2011 2012 2013
Rat
e p
er
10
00
Ce
ntr
al-L
ine
Day
s
Major Teaching Medical ICU All Others Medical ICU
Major Teaching MedicalSurgical ICU All Others MedicalSurgical ICU
Trends
Between 2006-2008 (combined) and 2013 there was a 46 decrease in CLABSIs (data
not shown)
From 2006-2008 (combined) to 2013 rates of CLABSIs in hospitals decreased 538
among adult medical ICU patients in hospitals with major teaching programs 476
among adult medicalsurgical ICU patients in hospitals with major teaching programs
421 among adult medical ICU patients in all other hospitals and 467 among adult
medicalsurgical ICU patients in all other hospitals
Tools for Reducing Central Line-Associated Bloodstream Infections
Purpose To help hospitals prevent central line-associated bloodstream infections (CLABSIs)
and improve safety culture
Methods Implementing evidence-based practical resources and concepts from the
Comprehensive Unit-based Safety Program (CUSP)
Intended user Hospital facilities
Available tools Checklists preventable incidence calculator audit form event report
template
12 | National Healthcare Quality and Disparities Report
Patient Safety
Impact
Through use of the CUSP toolkit and CLABSI tools more than 100 intensive care units
in Michigan have nearly eliminated CLABSIs
Nationwide the use of this toolkit has helped more than 1000 hospitals reduce rates of
CLABSI by 41 in aggregate See httpwwwahrqgovworkingforqualitypias
mhhakcpiahtm and httpwwwahrqgovprofessionalseducationcurriculumshy
toolsclabsitoolsindexhtmlpurpose
Procedure-Related Events
More than 40 million operative procedures are performed in the United States each year
Postoperative adverse events are not uncommon and increase both hospitalization length and
cost (AHRQ 2013)
Measures include
Risk-adjusted mortality at 30 days postoperation for colorectal surgery performed in
adults
Percentage of adult patients receiving hip joint replacement (because of fracture or
degenerative conditions) who experienced adverse events
Percentage of adults with mechanical adverse events associated with central venous
catheter placement
Postoperative Mortality
Risk-adjusted mortality rate within 30 days postoperation for adults undergoing colorectal surgery in ACS NSQIP participating hospitals in the United States by
raceethnicity and hospital teaching status 2008-2014
0
1
2
3
4
5
6
Pe
rce
nt
Teaching Nonteaching
Source American College of Surgeons (ACS) National Surgical Quality Improvement Program (NSQIP) 2008-2014
Denominator Adults age 18 years and over
Note For this measure lower percentages are better The participation in the ACS NSQIP is voluntary and current participation is weighted
when calculating rates Participating hospitals have changed over time 203 hospitals participated in 2008 and 531 hospitals participated in
2014 Other includes Asian American Indian or Alaska Native and Native Hawaiian or Other Pacific Islander White Black and Other are non-
Hispanic Hispanic includes all races
0
1
2
3
4
5
6
Pe
rce
nt
Total White Black Hispanic Other
Risk-adjusted mortality rate within 30 days postoperation for adults undergoing colorectal surgery in ACS NSQIP participating hospitals in the United States by
raceethnicity and hospital teaching status 2008-2014
0
1
2
3
4
5
6
Pe
rce
nt
Teaching Nonteaching
Source American College of Surgeons (ACS) National Surgical Quality Improvement Program (NSQIP) 2008-2014
Denominator Adults age 18 years and over
Note For this measure lower percentages are better The participation in the ACS NSQIP is voluntary and current participation is weighted
when calculating rates Participating hospitals have changed over time 203 hospitals participated in 2008 and 531 hospitals participated in
2014 Other includes Asian American Indian or Alaska Native and Native Hawaiian or Other Pacific Islander White Black and Other are non-
Hispanic Hispanic includes all races
0
1
2
3
4
5
6
Pe
rce
nt
Total White Black Hispanic Other
National Healthcare Quality and Disparities Report | 13
Patient Safety
Importance Colorectal procedures have high rates of postoperative complications
Nonadherence to evidence-based best practices is associated with an increased risk of these
complications (Arriaga et al 2009)
Overall Rate In 2014 the risk-adjusted mortality rate was 31 among patients undergoing
colorectal surgeries at ACS NSQIP participating hospitals
Trends From 2008 to 2014 30-day postoperative mortality after colorectal surgery
improved
Groups With Disparities
In 2014 the percentage of patients with 30-day postoperative mortality was worse for
Blacks (36) compared with Whites (30)
From 2008 to 2014 there were no statistically significant changes in the gap between
minority groups and Whites in the percentage of patients with 30-day postoperative
mortality
Adverse Events After Hip Joint Replacement
Adult patients receiving hip joint replacement due to fracture or degenerative conditions who experienced adverse events by age and chronic obstructive
pulmonary disease 2009-2013
02468
101214161820
2009 2010 2011 2012 2013
Pe
rce
nt
Total 65-74 75-84 85+
02468
101214161820
2009 2010 2011 2012 2013
Pe
rce
nt
COPD No COPD
Key COPD = chronic obstructive pulmonary disease
Source Agency for Healthcare Research and Quality (AHRQ) and Centers for Medicare amp Medicaid Services (CMS) Medicare Patient Safety
Monitoring System (MPSMS) 2009-2013
Denominator All patients age 18 years and over in the MPSMS sample who had a surgical procedure performed to replace a hip joint due to
degenerative conditions or a fractured hip
Note For this measure lower percentages are better Hospitals in Puerto Rico the Virgin Islands and Maryland were not included in the
annual samples Samples were drawn from the CMS Hospital Inpatient Quality Reporting program and consist of medical records for
discharges following hip arthroplasty procedures as defined by the Surgical Care Improvement Project Rates for patients age 85 years and
over in 2013 and for ages 18-64 years old for all years are not shown because the data did not meet the criteria for statistical reliability data
quality or confidentiality COPD status relates to patients with a principal or secondary discharge diagnosis of COPD
Adult patients receiving hip joint replacement due to fracture or degenerative conditions who experienced adverse events by age and chronic obstructive
pulmonary disease 2009-2013
02468
101214161820
2009 2010 2011 2012 2013
Pe
rce
nt
Total 65-74 75-84 85+
02
4
68
10
12
1416
18
20
2009 2010 2011 2012 2013
Pe
rce
nt
COPD No COPD
Key COPD = chronic obstructive pulmonary disease
Source Agency for Healthcare Research and Quality (AHRQ) and Centers for Medicare amp Medicaid Services (CMS) Medicare Patient Safety
Monitoring System (MPSMS) 2009-2013
Denominator All patients age 18 years and over in the MPSMS sample who had a surgical procedure performed to replace a hip joint due to
degenerative conditions or a fractured hip
Note For this measure lower percentages are better Hospitals in Puerto Rico the Virgin Islands and Maryland were not included in the
annual samples Samples were drawn from the CMS Hospital Inpatient Quality Reporting program and consist of medical records for
discharges following hip arthroplasty procedures as defined by the Surgical Care Improvement Project Rates for patients age 85 years and
over in 2013 and for ages 18-64 years old for all years are not shown because the data did not meet the criteria for statistical reliability data
quality or confidentiality COPD status relates to patients with a principal or secondary discharge diagnosis of COPD
Importance Hip replacement is most common among older adults who have an increased
risk of adverse events after these surgeries
14 | National Healthcare Quality and Disparities Report
Patient Safety
Overall Percentage In 2013 49 of patients receiving a hip joint replacement experienced
an adverse event
Trends From 2009 to 2013 the overall percentage of adverse events improved for patients
who had a hip joint replacement due to fracture or degenerative conditions
Groups With Disparities
In 2013 there were no statistically significant differences by age or COPD status in the
percentage of hip replacement patients who had adverse events
From 2009 to 2013 there were no statistically significant changes in the gap between
patients age 75 and over and those ages 65-74 in adverse event frequencies Similarly
there were no statistically significant changes in disparities between patients with COPD
and those without COPD
Adverse Events Associated With Central Venous Catheter Placement
Adults with mechanical adverse events associated with central venous catheter placement by race and obesity status 2009-2013
Source Agency for Healthcare Research and Quality and Centers for Medicare amp Medicaid Services Medicare Patient Safety Monitoring
System 2009-2013
Denominator Selected discharges of hospitalized patients age 18 years and over with central venous catheter placement
Note For this measure lower percentages are better Mechanical adverse events include allergic reaction to the catheter tamponade
perforation pneumothorax hematoma shearing off of the catheter air embolism misplaced catheter thrombosisembolism knotting of the
pulmonary artery catheter and certain other events
0
2
4
6
8
10
2009 2010 2011 2012 2013
Pe
rce
nt
Total White Black
0
2
4
6
8
10
2009 2010 2011 2012 2013
Pe
rce
nt
Obese Not Obese
Adults with mechanical adverse events associated with central venous catheter placement by race and obesity status 2009-2013
Source Agency for Healthcare Research and Quality and Centers for Medicare amp Medicaid Services Medicare Patient Safety Monitoring
System 2009-2013
Denominator Selected discharges of hospitalized patients age 18 years and over with central venous catheter placement
Note For this measure lower percentages are better Mechanical adverse events include allergic reaction to the catheter tamponade
perforation pneumothorax hematoma shearing off of the catheter air embolism misplaced catheter thrombosisembolism knotting of the
pulmonary artery catheter and certain other events
0
2
4
6
8
10
2009 2010 2011 2012 2013
Pe
rce
nt
Total White Black
0
2
4
6
8
10
2009 2010 2011 2012 2013
Pe
rce
nt
Obese Not Obese
Importance Central venous catheterization (CVC) allows medical personnel quick access to
a patientrsquos bloodstream This ease of access is important when a patient requires life-saving
medications or when a physician needs to measure central venous pressure Mechanical
adverse events are most likely to occur while medical personnel are placing or maintaining
the central venous catheter
National Healthcare Quality and Disparities Report | 15
Patient Safety
Overall Percentage In 2013 32 of adults with central venous catheter placements
experienced an associated mechanical adverse event
Trends From 2009 to 2013 there were no statistically significant changes in the overall
percentage of adults with mechanical adverse events associated with central venous catheter
placement
Groups With Disparities
In 2013 the percentage of adults with mechanical adverse events associated with CVC
was worse for Blacks (67) compared with Whites (27) There were no statistically
significant differences by obesity status
From 2009 to 2013 there were no statistically significant changes in the gap between
Blacks and Whites in the percentage of adults with mechanical adverse events associated
with CVC
Adverse Drug Events
An estimated 400000 preventable ADEs occur each year in US hospitals generating
additional costs of $35 billion in 2006 dollars (IOM 2007)
An ADE is an injurymdashincluding physical harm mental harm or loss of functionmdash
resulting from medical intervention involving a drug
For more information see the PSNet link to Patient Safety Primer Medication Errors
httpspsnetahrqgovprimersprimer23medication-errors
The three initial targets of the HHS National Action Plan for Adverse Drug Event Prevention are
Anticoagulants and related bleeding
Diabetes agents and related hypoglycemia
Opioids and accidental overdose oversedation and respiratory depression
Measures of Patient Safety in the Hospital Setting Adverse Drug Events
Percentage of hospitalized adult patients who received a hypoglycemic agent and had an
adverse drug event
Percentage of hospitalized adult patients who had an anticoagulant-related adverse drug
event to warfarin
Number of opioid-related medication errors in patients of all ages
16 | National Healthcare Quality and Disparities Report
Patient Safety
Adverse Drug Events With Hypoglycemic Agents
Hospitalized adult patients who received a hypoglycemic agent who had adverse drug events with hypoglycemic agents by
raceethnicity 2010-2013 and renal disease 2009-2013
Source Agency for Healthcare Research and Quality and Centers for Medicare amp Medicaid Services Medicare Patient Safety Monitoring
System 2009-2013
Note For this measure lower percentages are better Hypoglycemic agents received by patients age 18 and over during a hospital stay include
insulin oral hypoglycemic or a combination of both The 2009 data for races did not meet the criteria for statistical reliability data quality or confidentiality
0
2
4
6
8
10
12
14
16
18
20
2009 2010 2011 2012 2013
Pe
rce
nt
Total Renal DiseaseNo Renal Disease
0
2
4
6
8
10
12
14
16
18
20
2010 2011 2012 2013
Pe
rce
nt
Total White BlackAsian Hispanic
Hospitalized adult patients who received a hypoglycemic agent who had adverse drug events with hypoglycemic agents by
raceethnicity 2010-2013 and renal disease 2009-2013
Source Agency for Healthcare Research and Quality and Centers for Medicare amp Medicaid Services Medicare Patient Safety Monitoring
System 2009-2013
Note For this measure lower percentages are better Hypoglycemic agents received by patients age 18 and over during a hospital stay include
insulin oral hypoglycemic or a combination of both The 2009 data for races did not meet the criteria for statistical reliability data quality or confidentiality
0
2
4
6
8
10
12
14
16
18
20
2009 2010 2011 2012 2013
Pe
rce
nt
Total Renal DiseaseNo Renal Disease
0
2
4
6
8
10
12
14
16
18
20
2010 2011 2012 2013
Pe
rce
nt
Total White BlackAsian Hispanic
Importance Hypoglycemic agents which are ingested orally are typically used in patients
with type II diabetes to control blood sugar levels In some cases diabetic patients use
hypoglycemic agents together with insulin The risk of chronic kidney disease increases
twofold for people with diabetes and renal impairment can increase the risk for adverse
events related to hypoglycemic agents
Overall Percentage In 2013 85 of hospital patients receiving hypoglycemic agents had
an adverse drug event
Trends The overall percentage of adverse drug events associated with hypoglycemic agents
improved from 2009 to 2013
Groups With Disparities
In 2013 the percentage of hospital patients who had adverse drug events with hypoglycemic agents was higher for Blacks (111) than for Whites (8)
Also in 2013 the percentage of hospital patients who had adverse drug events with
hypoglycemic agents was higher for those with renal disease (122) than for those
without renal disease (56)
From 2010 to 2013 there were no statistically significant changes in the gap between
minority groups and Whites in the percentage of patients who had adverse drug events
associated with hypoglycemic agents Similarly there were no statistically significant
changes in the gap between those with renal disease and those without
National Healthcare Quality and Disparities Report | 17
Patient Safety
Adverse Drug Events With Warfarin
Hospitalized adult patients with an anticoagulant-related adverse drug event with warfarin by age and corticosteroid use 2009-2013
Source Agency for Healthcare Research and Quality and Centers for Medicare amp Medicaid Services Medicare Patient Safety Monitoring
System 2009ndash2013
Denominator Patients 18 and over who received warfarin and had their international normalized ratio (INR) measured during their hospital
stay
Note For this measure lower percentages are better Adverse events occurring the day of hospital arrival were excluded
0
2
4
6
8
10
12
2009 2010 2011 2012 2013
Pe
rce
nt
TotalCorticosteroid UseNo Corticosteroid Use
0
2
4
6
8
10
12
2009 2010 2011 2012 2013
Pe
rce
nt
lt65 65-74 75-84 85+
Hospitalized adult patients with an anticoagulant-related adverse drug event with warfarin by age and corticosteroid use 2009-2013
Source Agency for Healthcare Research and Quality and Centers for Medicare amp Medicaid Services Medicare Patient Safety Monitoring
System 2009ndash2013
Denominator Patients 18 and over who received warfarin and had their international normalized ratio (INR) measured during their hospital
stay
Note For this measure lower percentages are better Adverse events occurring the day of hospital arrival were excluded
0
2
4
6
8
10
12
2009 2010 2011 2012 2013
Pe
rce
nt
TotalCorticosteroid UseNo Corticosteroid Use
0
2
4
6
8
10
12
2009 2010 2011 2012 2013
Pe
rce
nt
lt65 65-74 75-84 85+
Importance Blood clots in arteries and veins can cause a blockage of blood flow and lead to
strokes and heart attacks Anticoagulants such as warfarin reduce this risk but pose an
increased risk of bleeding Corticosteroids can interact with anticoagulants to raise the risk of
potential bleeding complications
Overall Percentage In 2013 50 of adults using warfarin experienced an anticoagulant-
related adverse drug event
Trends From 2009 to 2013 there were no statistically significant changes in the overall
percentage of hospital patients with an adverse drug event related to warfarin
Groups With Disparities
In 2013 the percentage of hospital patients who had an adverse drug event to warfarin
was the same regardless of corticosteroid use status
From 2009 to 2013 there were no statistically significant changes in the gap between
older age groups and those under age 65 in the percentage of patients who had adverse
events associated with warfarin Similarly there were no statistically significant changes
in the gap between those using corticosteroids and those not using corticosteroids
18 | National Healthcare Quality and Disparities Report
Patient Safety
Opioid-Related Medication Errors
Number of opioid-related medication errors reported in Pennsylvania by AHRQ eventharm category and age 2006 2008 2010 2012 2014
30 53 44 27 23
2947 2798 2714 27082408
9531014
984 969
910
175 245251 398
330
0
500
1000
1500
2000
2500
3000
3500
4000
4500
2006 2008 2010 2012 2014
Nu
mb
er o
f Ev
ents
Unsafe Condition Near Miss
Patient Event No Harm Patient Event Harm
Source Institute of Safe Medication Practices on behalf of the Pennsylvania Patient Safety Authority 2006-2014
Note Pennsylvania Patient Safety Reporting System reports of medication errors are from acute-level facilities that consist of hospitals
ambulatory surgical facilities birthing centers and abortion facilities Medication errors do not include adverse drug reactions Eventharm
categories refer to those in the Agency for Healthcare Research and Quality Common Formats Unsafe condition is defined as any
circumstance that increases the probability of a patient safety event A near miss is defined as a patient safety event that did not reach the
patient Deaths are included in the total but not shown on the chart because there were too few to render graphically
192 166 336530 662
2287 24842385
2364 1955
16271461 1272
1208
1055
0
500
1000
1500
2000
2500
3000
3500
4000
4500
2006 2008 2010 2012 2014
Nu
mb
er o
f Ev
en
ts
lt18 18-64 65+
Number of opioid-related medication errors reported in Pennsylvania by AHRQ eventharm category and age 2006 2008 2010 2012 2014
30 53 44 27 23
2947 2798 2714 27082408
9531014
984 969
910
175 245251 398
330
0
500
1000
1500
2000
2500
3000
3500
4000
4500
2006 2008 2010 2012 2014
Nu
mb
er o
f Ev
ents
Unsafe Condition Near Miss
Patient Event No Harm Patient Event Harm
Source Institute of Safe Medication Practices on behalf of the Pennsylvania Patient Safety Authority 2006-2014
Note Pennsylvania Patient Safety Reporting System reports of medication errors are from acute-level facilities that consist of hospitals
ambulatory surgical facilities birthing centers and abortion facilities Medication errors do not include adverse drug reac tions Eventharm
categories refer to those in the Agency for Healthcare Research and Quality Common Formats Unsafe condition is defined as any
circumstance that increases the probability of a patient safety event A near miss is defined as a patient safety event that did not reach the
patient Deaths are included in the total but not shown on the chart because there were too few to render graphically
192 166 336530 662
2287 24842385
2364 1955
16271461 1272
1208
1055
0
500
1000
1500
2000
2500
3000
3500
4000
4500
2006 2008 2010 2012 2014
Nu
mb
er o
f Ev
ents
lt18 18-64 65+
Importance Acute malignant andmdashincreasinglymdashchronic pain often is treated or managed
with prescription opioids Reducing patient harm from the use of opioids in both inpatient
and outpatient settings is a main area of focus because opioid-related adverse drug events are
often preventable
Trends
In Pennsylvania the total number of medication error reports related to opioids decreased
106 between 2006 (4106) and 2014 (3672)
Between 24 and 54 opioid-related medication errors resulting in patient harm or death
were reported from 2006 through 2014 accounting for approximately 1 of all reported
opioid medication errors each year
The largest share of opioid-related medication errors reported each year in Pennsylvania
related to those that reached the patient but did not result in harm Of these no-harm
events reaching the patient about one in four required monitoring andor intervention to
preclude the harm
National Healthcare Quality and Disparities Report | 19
Patient Safety
20 | National Healthcare Quality and Disparities Report
Although small in number reports of unsafe conditions increased from 43 (175) of
total opioid-related medication error reports in 2006 to 9 (330) in 2014 Reports of
unsafe conditions and near misses can provide important learning opportunities for
preventing patient harm
Differences Between Groups Reports of opioid-related medication errors involving
pediatric patients increased nearly fourfold from 192 (47) in 2006 to 662 (18) in 2014
During the same period reports of opioid-related medication errors involving older adult
patients decreased from nearly 40 of the total to less than 30
Patient Safety in the Nursing Home Setting
More than 3 million people receive care in US nursing homes and skilled nursing facilities
each year (CDC 2015)
For nursing home residents optimal care seeks to maximize quality of life and minimize
unintended complications
Measures tracked for patients of various age ranges include
Nursing home residents with urinary tract infections
Nursing home residents experiencing use of restraints
Nursing home residents who have pressure ulcers
Nursing home residents who had a fall with major injury
Nursing home residents who received antipsychotic medication
Urinary Tract Infections
Long-stay nursing home residents experiencing urinary tract infections by sex and raceethnicity 2011-2013
Source Centers for Medicare amp Medicaid Services Minimum Data Set 2011-2013
DenominatorNursing home residents of any age w ho have at least 101 cumulative days in the facility
Note For this measure low er percentages are better The measure w as calculated as follows Percentage of long-stay residents with a urinary
tract infection w ithin the 30 days prior to assessment White Black and Asian are non-Hispanic Hispanic includes all races
0
2
4
6
8
10
2011 2012 2013
Pe
rce
nt
Total Male Female
2011 Achievable
Benchmark 61
0
2
4
6
8
10
2011 2012 2013
Pe
rce
nt
White Black Asian Hispanic
2011 Achievable
Benchmark 61
Long-stay nursing home residents experiencing urinary tract infections by sex and raceethnicity 2011-2013
Source Centers for Medicare amp Medicaid Services Minimum Data Set 2011-2013
DenominatorNursing home residents of any age w ho have at least 101 cumulative days in the facilityNote For this measure low er percentages are better The measure w as calculated as follows Percentage of long-stay residents with a urinary
tract infection w ithin the 30 days prior to assessment White Black and Asian are non-Hispanic Hispanic includes all races
0
2
4
6
8
10
2011 2012 2013
Pe
rce
nt
Total Male Female
2011 Achievable
Benchmark 61
0
2
4
6
8
10
2011 2012 2013
Pe
rce
nt
White Black Asian Hispanic
2011 Achievable
Benchmark 61
Patient Safety
Importance Bacteria that cause urinary tract infections (UTIs) can spread to other body
parts and become more serious or contribute to further complications such as delirium
Overall Percentage In 2013 the percentage of long-stay nursing home residents with a UTI
was 64
Groups With Disparities
In 2013 compared with males (51) the percentage with UTIs was worse for females
(7)
In 2013 compared with White residents (68) the percentage of residents with UTIs
was lower for Blacks and Asians (47) as well as Hispanics (54)
Achievable Benchmark
In 2011 the top 5 State achievable benchmark for UTIs was 61 The States that
contributed to the achievable benchmark are Connecticut Hawaii Minnesota North
Dakota and Pennsylvania
Males Blacks Asians and Hispanics have achieved the benchmark
Use of Restraints
00
05
10
15
20
25
30
35
40
2011 2012 2013
Pe
rce
nt
White Black Asian Hispanic
00
05
10
15
20
25
30
35
40
2011 2012 2013
Pe
rce
nt
Total 0-64 65-74 75-84 85+
2011 Achievable
Benchmark 07
Long-stay nursing home residents experiencing use of restraints by age and raceethnicity 2011-2013
Source Centers for Medicare amp Medicaid Services Minimum Data Set 2011-2013
Denominator Nursing home residents of any age who have at least 101 cumulative days in the facility
Note For this measure lower percentages are better The measure was calculated as follows Percentage of long-stay residents who are
physically restrained on a daily basis
2011 Achievable
Benchmark 07
00
05
10
15
20
25
30
35
40
2011 2012 2013
Pe
rce
nt
White Black Asian Hispanic
00
05
10
15
20
25
30
35
40
2011 2012 2013
Pe
rce
nt
Total 0-64 65-74 75-84 85+
2011 Achievable
Benchmark 07
Long-stay nursing home residents experiencing use of restraints by age and raceethnicity 2011-2013
Source Centers for Medicare amp Medicaid Services Minimum Data Set 2011-2013
Denominator Nursing home residents of any age who have at least 101 cumulative days in the facility
Note For this measure lower percentages are better The measure was calculated as follows Percentage of long-stay residents who are
physically restrained on a daily basis
2011 Achievable
Benchmark 07
National Healthcare Quality and Disparities Report | 21
Patient Safety
Importance Residents who are restrained daily can become weak lose their ability to go to
the bathroom by themselves and develop pressure ulcers or other medical conditions
Overall Percentage In 2013 the percentage of long-stay nursing home residents who were
physically restrained on a daily basis was 14
Groups With Disparities
In 2011 2012 and 2013 the percentage of residents with restraint use on a daily basis
was lower for those ages 65-74 years compared with those under age 65 In 2013 the
percentage of residents ages 65-74 years experiencing use of restraints was 12
compared with 16 for residents younger than 65
In 2013 compared with Whites (14) Asians (2) and Hispanics (18) had worse
percentages of daily restraint use and Blacks (12) had a better percentage of daily
restraint use
Achievable Benchmark
In 2011 the top 5 State achievable benchmark for restraint use was 07 The States that
contributed to the achievable benchmark are Kansas Maine Nebraska New Hampshire
and Vermont
No group achieved the benchmark from 2011 to 2013
Pressure Ulcers
Low-risk short-stay and high-risk long-stay nursing home residents who have pressure ulcers by sex 2011-2013
Source Centers for Medicare amp Medicaid Services Minimum Data Set 2011-2013
Denominator Low-risk short-stay Nursing home residents of any age who have 100 or fewer cumulative days in the facility and are active can
change positions and are getting the nutrients they need to maintain good skin health High-risk long-stay Nursing home residents of any age
who have at least 101 cumulative days in the facility and are in a coma do not get the nutrients needed to maintain good skin health or cannot
change position on their own
Note For this measure lower percentages are better
0
2
4
6
8
10
12
2011 2012 2013
Pe
rce
nt
Low-Risk Short StayTotal Male Female
2011 Achievable Benchmark10
0
2
4
6
8
10
12
2011 2012 2013
Pe
rce
nt
High-Risk Long StayTotal Male Female
2008 Achievable Benchmark 71
Low-risk short-stay and high-risk long-stay nursing home residents who have pressure ulcers by sex 2011-2013
Source Centers for Medicare amp Medicaid Services Minimum Data Set 2011-2013
Denominator Low-risk short-stay Nursing home residents of any age who have 100 or fewer cumulative days in the facility and are active can
change positions and are getting the nutrients they need to maintain good skin health High-risk long-stay Nursing home residents of any age
who have at least 101 cumulative days in the facility and are in a coma do not get the nutrients needed to maintain good skin health or cannot
change position on their own
Note For this measure lower percentages are better
0
2
4
6
8
10
12
2011 2012 2013
Pe
rce
nt
Low-Risk Short StayTotal Male Female
2011 Achievable Benchmark10
0
2
4
6
8
10
12
2011 2012 2013
Pe
rce
nt
High-Risk Long StayTotal Male Female
2008 Achievable Benchmark 71
22 | National Healthcare Quality and Disparities Report
Patient Safety
Importance Pressure ulcers are serious medical conditions They typically result from
prolonged periods of uninterrupted pressure on the skin soft tissue muscle and bone
Vulnerable patients include older adults stroke and diabetic patients patients with dementia
circulatory diseases dehydration and malnutrition and people who use wheelchairs or are
bedriddenmdashthat is any patient with impaired mobility or sensation
Overall Percentage In 2013 the percentage of low-risk short-stay residents with pressure
ulcers was 13 and the percentage of high-risk long-stay residents with pressure ulcers was
77
Groups with Disparities
As in 2011 and 2012 male low-risk short-stay nursing home residents had a worse
percentage with pressure ulcers (15) compared with female residents (12) in 2013
As in 2011 and 2012 male high-risk long-stay nursing home residents had a worse
percentage with pressure ulcers (94) compared with female residents (70) in 2013
Achievable Benchmark
The 2011 top 5 State achievable benchmark for low-risk short-stay nursing home residents was 10 The States that contributed to the benchmark were Alabama Arizona Colorado Connecticut and Idaho
The 2008 top 5 State achievable benchmark for high-risk long-stay nursing home residents was 71 The States that contributed to the benchmark were Hawaii Minnesota Nebraska New Hampshire and North Dakota
No low-risk short-stay residents achieved the benchmark from 2011 to 2013 Among
high-risk long-stay residents only females achieved the benchmark by 2013
National Healthcare Quality and Disparities Report | 23
Patient Safety
Falls
00
05
10
15
20
25
30
35
40
45
50
Pe
rce
nt
2012 2013
Long-stay nursing home residents who had a fall with major injury by sex age and raceethnicity 2012-2013
Source Centers for Medicare amp Medicaid Services Minimum Data Set 2012-2013
Denominator Nursing home residents of any age who have at least 101 cumulative days in the facility with one or more look-back scan
assessments except when the occurrence of falls or number of falls with major injury was not assessed in the look-back scan assessment
Note For this measure lower percentages are better White Black and Other are non-Hispanic Hispanic includes all races
2012 Achievable
Benchmark 22
00
05
10
15
20
25
30
35
40
45
50
Pe
rce
nt
2012 2013
Long-stay nursing home residents who had a fall with major injury by sex age and raceethnicity 2012-2013
Source Centers for Medicare amp Medicaid Services Minimum Data Set 2012-2013
Denominator Nursing home residents of any age who have at least 101 cumulative days in the facility with one or more look-back scan
assessments except when the occurrence of falls or number of falls with major injury was not assessed in the look-back scan assessment
Note For this measure lower percentages are better White Black and Other are non-Hispanic Hispanic includes all races
2012 Achievable
Benchmark 22
Importance Nursing home residents who experience falls resulting in major injuries are at
higher risk of death and disability as well as emotional trauma that can affect functional
abilities and social well-being
Overall Percentage In 2013 the percentage of long-stay nursing home residents who had a
fall with a major injury was 34
Groups With Disparities
In 2013 female nursing home residents had a worse percentage of falls (38) compared
with male residents (25)
In 2013 the percentage of falls with major injury was worse for all subgroups of
residents age 65 years and over compared with their younger counterparts The
percentage for residents under 65 years old was 17 compared with 26 for ages 65shy
74 years 34 for ages 75-84 years and 41 for 85 years and over
Also in 2013 compared with Whites (38) the percentage of falls with major injury
was better for Black (13) Other (22) and Hispanic (24) residents
24 | National Healthcare Quality and Disparities Report
Patient Safety
National Healthcare Quality and Disparities Report | 25
Achievable Benchmark
The 2012 top 5 State achievable benchmark for falls with major injury was 22 The
States that contributed to the achievable benchmark are Alaska California District of
Columbia Hawaii and New Jersey The benchmark was achieved by Black residents and those ages 0-64 years
Antipsychotic Medication Among Nursing Home Residents
Importance The high use of antipsychotic medications among nursing home residents for
indications other than those for which the drug was approved has been noted by the Federal
Government These drugs are often used for too long at too high a dose or when
unnecessary In the past inappropriate prescribing of antipsychotics in nursing homes has
primarily been considered a marker of suboptimal care Recent studies have shown
antipsychotic use is also a drug safety issue (Huybrechts et al 2012) Antipsychotic
medication use is associated with increased risks of adverse events such as movement
disorders falls hip fractures and cerebrovascular events Their use in older adults with
dementia carries an increased risk of death Safety concerns with antipsychotic medication
use in older adults also include the risks of hyperprolactinemia pneumonia
0
5
10
15
20
25
30
Percent
2012 2013
Adult long-stay nursing home residents who received antipsychotic medication by raceethnicity and number of chronic conditions 2012-2013
Key NHOPI = Native Hawaiian or Other Pacific Islander AIAN = American Indian or Alaska Native
Source Centers for Medicare amp Medicaid Services Minimum Data Set 2012-2013
Denominator Nursing home residents of any age who have at least 101 cumulative days in the facility excluding residents with schizophrenia
Tourettersquos syndrome and Huntingtonrsquos disease
Numerator Subset of denominator that receives an antipsychotic medication
Note For this measure lower percentages are better
2012 Achievable
Benchmark 150
0
5
10
15
20
25
30
Percent
2012 2013
Adult long-stay nursing home residents who received antipsychotic medication by raceethnicity and number of chronic conditions 2012-2013
Key NHOPI = Native Hawaiian or Other Pacific Islander AIAN = American Indian or Alaska Native
Source Centers for Medicare amp Medicaid Services Minimum Data Set 2012-2013
Denominator Nursing home residents of any age who have at least 101 cumulative days in the facility excluding residents with schizophrenia
Tourettersquos syndrome and Huntingtonrsquos disease
Numerator Subset of denominator that receives an antipsychotic medication
Note For this measure lower percentages are better
2012 Achievable
Benchmark 150
Patient Safety
26 | National Healthcare Quality and Disparities Report
thromboembolism cerebrovascular events and other cardiovascular adverse events (Chiu et
al 2015)
Overall Percentage The percentage of long-stay nursing home residents who had
antipsychotic medications was 176 in 2013
Groups With Disparities
In 2013 the percentage of residents receiving antipsychotic medication was higher for
Hispanic residents (201) than for White residents (180)
In 2012 and 2013 the percentage of long-stay residents who received antipsychotic
medications was worse for residents with one or more chronic conditions than for
residents with no chronic conditions
Achievable Benchmark
The 2012 top 6 State achievable benchmark was 150 The States that contributed to the
achievable benchmark are Alaska California Hawaii Michigan New Jersey and
Wyoming Asians NHOPIs residents with no chronic conditions and residents with one chronic
condition achieved the benchmark
Antipsychotic Medication Among Nursing Home Residents by State
Long-stay nursing home residents who received antipsychotic medication by State 2013
Source Centers for Medicare amp Medicaid Services Minimum Data Set 2013
Denominator Nursing home residents of any age who have at least 101 cumulative days in the facility
Note For this measure lower percentages are better
AZ
CA
UT
CT
FL
GA
IA
IL
KS
MA
MDMO
NJ
NY
OR
PA
SC
TN
CO
WA
WI
VA
ME
MN
MI
NC
TX
KY
WV
RI
NE
VT
NV OH
SD
AR
IN
NH
MT
ID
WY
ND
NMOK
LA
MS AL
DE
AKAK
HI
DC
85-153 (1st Quartile)
154-173 (2nd Quartile)
No Data
174-192 (3rd Quartile)
PR193-234 (4th Quartile)
Long-stay nursing home residents who received antipsychotic medication by State 2013
Source Centers for Medicare amp Medicaid Services Minimum Data Set 2013
Denominator Nursing home residents of any age who have at least 101 cumulative days in the facility
Note For this measure lower percentages are better
AZ
CA
UT
CT
FL
GA
IA
IL
KS
MA
MDMO
NJ
NY
OR
PA
SC
TN
CO
WA
WI
VA
ME
MN
MI
NC
TX
KY
WV
RI
NE
VT
NV OH
SD
AR
IN
NH
MT
ID
WY
ND
NMOK
LA
MS AL
DE
AKAK
HI
DC
85-153 (1st Quartile)
154-173 (2nd Quartile)
No Data
174-192 (3rd Quartile)
PR193-234 (4th Quartile)
Patient Safety
Overall This map shows overall rankings of States (by quartiles) in the percentage of long-
stay nursing home residents who received antipsychotic medication in 2013 Values ranged
from 85 to 234
Differences by State Interquartile ranges follow
First quartile (lowest) 85-153 (AK CA DC DE HI MD MI MN NJ NC SC
WI WV)
Second quartile (second lowest) 153 -173 (CO ID MT NM NY ND OR PA
RI SD VT WA WY)
Third quartile (second highest) 174-192 (AZ CT GA IN IA KS ME MA MO
NV OH OK VA)
Fourth quartile (highest) 193-234 (AL AR FL IL KY LA MS NE NH TN
TX UT)
Eight of the 12 States in the quartile with the highest percentage of long-stay nursing
home residents who received antipsychotic medication were in the South
Patient Safety in the Home Health Setting
Home health agencies provide services to beneficiaries who are homebound and need skilled
nursing care or therapy
Approximately 12 million individuals receive home health care from more than 33000
providers for causes including acute illness long-term health conditions permanent
disability or terminal illness (NAHCH 2010)
Improvements among home health patients can reflect the quality of care from home health
agencies
Measures include
Home health patients with improvement in surgical wounds
Home health patients with improvements in their ability to take medications orally
National Healthcare Quality and Disparities Report | 27
Patient Safety
Improvement in Surgical Wounds
75
80
85
90
95
100
2010 2011 2012 2013
Pe
rce
nt
White Black Asian Hispanic
75
80
85
90
95
100
2010 2011 2012 2013
Pe
rce
nt
Total 0-64 65-74
75-84 85+
2011 Achievable
Benchmark 913
Home health patients with improvement in surgical wounds by age and raceethnicity 2010-2013
Source Centers for Medicare amp Medicaid Services Outcome and Assessment Information Set 2010-2013
Denominator Number of home health episodes during the measurement period in which the patient of any age had a surgical wound and the
episode ended with the patient discharged from home health care
Note White Black and Asian are non-Hispanic Hispanic includes all races
2011 Achievable
Benchmark 913
75
80
85
90
95
100
2010 2011 2012 2013
Per
cen
t
White Black Asian Hispanic
75
80
85
90
95
100
2010 2011 2012 2013
Per
cen
t
Total 0-64 65-74
75-84 85+
2011 Achievable
Benchmark 913
Home health patients with improvement in surgical wounds by age and raceethnicity 2010-2013
Source Centers for Medicare amp Medicaid Services Outcome and Assessment Information Set 2010-2013
Denominator Number of home health episodes during the measurement period in which the patient of any age had a surgical wound and the
episode ended with the patient discharged from home health care
Note White Black and Asian are non-Hispanic Hispanic includes all races
2011 Achievable
Benchmark 913
Importance Normal wound healing after an operation is an important marker of good care
The home health team should regularly change wound dressing and teach the patient about
wound care
Overall Percentage In 2013 the percentage of home health patients with improvement in
their surgical wounds was 890
Trends The percentage of health home patients with surgical wound improvement increased
between 2010 and 2013
Groups With Disparities
In 2013 compared with residents under age 65 years (856) all other age groups had
better percentages of improvement in surgical wounds The percentage was 893 for
ages 65-74 905 for ages 75-84 and 917 for ages 85 and over
In 2013 compared with Whites (893) Blacks (878) Asians (882) and Hispanics
(874) had worse percentages of improvement in surgical wounds
The 2010 through 2013 trend in the percent of home health patients with surgical wound
improvement did not change for those over age 65 relative to persons under age 65 years
28 | National Healthcare Quality and Disparities Report
Patient Safety
Achievable Benchmark
The 2011 top 5 State achievable benchmark was 913 The States that contributed to the
benchmark are Alabama Mississippi Nevada Oklahoma and South Carolina
Home health patients age 85 years and over achieved the benchmark for surgical wound
improvement in 2013
At the current rate of progress patients ages 75-84 years could reach the benchmark
within a year Patients ages 65-74 years could achieve the benchmark in approximately 2
years
White home health patients could achieve the benchmark in approximately 2 years
Improvement in Ability To Take Medication Orally
0
20
40
60
80
100
2010 2011 2012 2013
Per
cen
t
White Black Asian Hispanic
0
20
40
60
80
100
2010 2011 2012 2013
Per
cen
t
Total 0-64 65-74
75-84 85+
2008 Achievable
Benchmark 516
Home health patients with improvement in their ability to take medications orally by age and raceethnicity 2010-2013
Source Centers for Medicare amp Medicaid Services Outcome and Assessment Information Set 2010-2013
Denominator Number of home health care episodes in which a patient of any age was unable to take oral medications independently at the
start of the episode that ended during the measurement period
Note White Black and Asian are non-Hispanic Hispanic includes all races
2008 Achievable
Benchmark 516
0
20
40
60
80
100
2010 2011 2012 2013
Per
cen
t
White Black Asian Hispanic
0
20
40
60
80
100
2010 2011 2012 2013
Per
cen
t
Total 0-64 65-74
75-84 85+
2008 Achievable
Benchmark 516
Home health patients with improvement in their ability to take medications orally by age and raceethnicity 2010-2013
Source Centers for Medicare amp Medicaid Services Outcome and Assessment Information Set 2010-2013
Denominator Number of home health care episodes in which a patient of any age was unable to take oral medications independently at the
start of the episode that ended during the measurement period
Note White Black and Asian are non-Hispanic Hispanic includes all races
2008 Achievable
Benchmark 516
Importance Taking medications correctly is important to the health status and quality of life
of individuals living in the community The home health team can help teach a patient ways
to organize drugs and take them properly
Overall Percentage In 2013 the percentage of home health patients with improvement in
their ability to take medications orally was 513
Trends Between 2010 and 2013 there was improvement in the overall percentage of home
health patients with improved ability to take medications orally
National Healthcare Quality and Disparities Report | 29
Patient Safety
Groups With Disparities
In 2013 the percentage of home health patients with improvement in their ability to take
medications orally was worse for those age 85 years and over (398) compared with
those under age 65 years (577)
The percentage of patients with improvement in their ability to take medications orally
was worse among Hispanic home health patients (400) than among White patients
(526) in 2013
From 2010 to 2013 the gap between Blacks and Whites decreased and the gap between
Asians and Whites and Hispanics and Whites increased
Achievable Benchmark
The 2008 top 5 State achievable benchmark was 516 The States that contributed to the
achievable benchmark are Iowa Massachusetts New Jersey North Dakota and South
Carolina
The benchmark was achieved among age groups under 85 years and by White and Black
home health patients
The total population is estimated to reach the benchmark in less than a year Hispanic
patients and patients age 85 years and over are farthest from the benchmark
Improvement in Ability To Take Medication Orally by State
Home health patients with improvement in their ability to take medications orally by raceethnicity by State 2013
Source Centers for Medicare amp Medicaid Services Outcome and Assessment Information Set 2013
Denominator Number of home health care episodes in which a patient of any age was unable to take oral medications independently at the
start of the episode that ended during the measurement period
AZ
CA
UT
CT
FL
GA
IA
IL
KS
MA
MDMO
NJ
NY
OR
PA
SC
TN
CO
WA
WI
VA
ME
MN
MI
NC
TX
KY
WV
RI
NE
VT
NV OH
SD
AR
IN
NH
MT
ID
WY
ND
NMOK
LA
MS AL
DE
AKAK
HI
No significant difference between rates
of Hispanics and non-Hispanic Whites
Non-Hispanic Whites have significantly
worse rate than Hispanics
States do not have data that meet the
criteria for statistical reliability data
quality or confidentiality
Hispanics have significantly worse rate
than non-Hispanic Whites
DC
Home health patients with improvement in their ability to take medications orally by raceethnicity by State 2013
Source Centers for Medicare amp Medicaid Services Outcome and Assessment Information Set 2013
Denominator Number of home health care episodes in which a patient of any age was unable to take oral medications independently at the
start of the episode that ended during the measurement period
AZ
CA
UT
CT
FL
GA
IA
IL
KS
MA
MDMO
NJ
NY
OR
PA
SC
TN
CO
WA
WI
VA
ME
MN
MI
NC
TX
KY
WV
RI
NE
VT
NV OH
SD
AR
IN
NH
MT
ID
WY
ND
NMOK
LA
MS AL
DE
AKAK
HI
No significant difference between rates
of Hispanics and non-Hispanic Whites
Non-Hispanic Whites have significantly
worse rate than Hispanics
States do not have data that meet the
criteria for statistical reliability data
quality or confidentiality
Hispanics have significantly worse rate
than non-Hispanic Whites
DC
30 | National Healthcare Quality and Disparities Report
Patient Safety
Geographic Variation
In 2013 Hispanic home health patients had worse rates of improvement in taking oral
medications than non-Hispanic White patients in 11 States (Arizona California
Connecticut Florida Illinois Indiana Massachusetts Nevada New York North
Carolina and Texas
Non-Hispanic White patients had worse rates of improvement than Hispanic patients in
five States (Hawaii Idaho Iowa Michigan and Pennsylvania)
Patient Safety in the Ambulatory Setting
Although patient safety initiatives frequently focus on inpatient hospital events adverse
effects of medical care may be identified and treated in outpatient settings
Adverse effects of medical care can follow care or procedures in hospitals emergency
departments physician offices or other settings
Measures include
Patient safety and quality issues by frequency of occurrence in outpatient medical offices
Adults age 65 years and over who received potentially inappropriate prescription medications during the calendar year
Percentage of hemodialysis patients with vascular catheter in use for 90 days or longer
For more information see the PSNet link to Patient Safety Primer Patient Safety in
Ambulatory Care httpspsnetahrqgovprimersprimer16patient-safety-in-ambulatory-care
National Healthcare Quality and Disparities Report | 31
Patient Safety
Patient Safety and Quality Issues
Patient safety and quality issues by frequency of occurrence in outpatient medical offices 2014
Source Westat analysis of the AHRQ 2014 Medical Office Survey on Patient Safety Culture Comparative Database (N=935)
Note For this measure less frequent occurrences during the year are better
0
20
40
60
80
100
A pharmacy contactedour office to clarify orcorrect a prescription
A patient was unableto get an appointmentwithin 48 hours for anacuteserious problem
A patients medicationlist was not updatedduring his or her visit
The results from a labor imaging test were notavailable when needed
A patients chartmedicalrecord was not available
when needed
Occurred DailyWeekly
Occurred Monthly
Occurred Not at All to Several Times Over the Past Year
Patient safety and quality issues by frequency of occurrence in outpatient medical offices 2014
Source Westat analysis of the AHRQ 2014 Medical Office Survey on Patient Safety Culture Comparative Database (N=935)
Note For this measure less frequent occurrences during the year are better
0
20
40
60
80
100
A pharmacy contactedour office to clarify orcorrect a prescription
A patient was unableto get an appointmentwithin 48 hours for anacuteserious problem
A patients medicationlist was not updatedduring his or her visit
The results from a labor imaging test were notavailable when needed
A patients chartmedicalrecord was not available
when needed
Occurred DailyWeekly
Occurred Monthly
Occurred Not at All to Several Times Over the Past Year
Importance Most health care takes place in the outpatient or ambulatory care setting Lack
of access to care and lack of access to timely and accurate medical information and test
results may contribute to patient safety events such as missed or delayed diagnoses
medication errors failure to order appropriate diagnostic or laboratory tests incorrect
interpretation of tests and inadequate followup on results
Overall Percentage
Almost 30 of medical offices participating in the survey reported daily or weekly
occurrences of being contacted by the pharmacist for clarification or correction on a
prescription
After prescription clarifications or corrections by the pharmacy medical offices were
next most likely to report daily or weekly issues with patients being unable to get an
appointment within 48 hours for an acute or serious problem (14) or the patientrsquos
medication list not getting updated during their visit (11)
The share of medical offices reporting that lab or imaging tests were not available when
needed reached nearly 20 when considering monthly occurrences as well as those that
occurred more frequently
32 | National Healthcare Quality and Disparities Report
Patient Safety
Potentially Inappropriate Prescriptions for Older Adults
Adults age 65 years and over who received potentially inappropriate prescription medications during the calendar year by sex and
perceived health status 2003ndash2013
Source Agency for Healthcare Research and Quality Medical Expenditure Panel Survey 2003-2013
Note For this measure lower percentages are better Prescription medications received include all prescribed medications initiall y purchased
or otherwise obtained as well as any refills For more information on inappropriate medications see the American Geriatrics Society 2012 Beers
Criteria Update Expert Panel American Geriatrics Society updated Beers Criteria for potentially inappropriate medication use in older adults J
Am Geriatr Soc 2012 Apr60(4)616-31
0
5
10
15
20
25
30
Per
cen
t
Total Male Female
0
5
10
15
20
25
30
Per
cen
t
ExcellentVery GoodGood FairPoor
Adults age 65 years and over who received potentially inappropriate prescription medications during the calendar year by sex and
perceived health status 2003ndash2013
Source Agency for Healthcare Research and Quality Medical Expenditure Panel Survey 2003-2013
Note For this measure lower percentages are better Prescription medications received include all prescribed medications initially purchased
or otherwise obtained as well as any refills For more information on inappropriate medications see the American Geriatrics Society 2012 Beers
Criteria Update Expert Panel American Geriatrics Society updated Beers Criteria for potentially inappropriate medication use in older adults J
Am Geriatr Soc 2012 Apr60(4)616-31
0
5
10
15
20
25
30
Per
cen
t
Total Male Female
0
5
10
15
20
25
30
Per
cen
t
ExcellentVery GoodGood FairPoor
Importance Some drugs that are prescribed for older patients are known to be potentially
harmful for this age group
Overall Percentage In 2013 the percentage of adults age 65 years and over who received
potentially inappropriate prescription medications was 114
Trends From 2003 to 2013 the percentage of adults age 65 years and over who received
potentially inappropriate prescription medications improved overall for both sexes and for
people with excellentvery goodgood health status and people with fairpoor health status
Groups With Disparities
In all years the percentage of patients receiving potentially inappropriate medications
was higher among females compared with males This gap was not changing over time
In all years from 2003 to 2013 the percentage of patients receiving potentially
inappropriate medications was higher among people with fairpoor health status
compared with people with excellentgood health status This gap was not changing over
time
National Healthcare Quality and Disparities Report | 33
Patient Safety
Long-Term Catheter Use in Dialysis Patients
HI
AKAK
AZ
CA
UT
CT
FL
GA
IA
IL
KS
MA
MDMO
NJ
NY
OR
PA
SC
TN
CO
WA
WI
VA
ME
MN
MI
NC
TX
KY
WV
RI
NE
VT
NV OH
SD
AR
IN
NH
MT
ID
WY
ND
NMOK
LA
MSAL
DE
DC
10-12
13-18
7-9
PR
Source Centers for Medicare and Medicaid Services Dialysis Facility Compare 2014
Denominator At-risk adult Medicare patients with a central venous catheter who were receiving regular hemodialysis treatments at dialysis
facilities
Note For this measure lower percentages are better
Percentage of hemodialysis patients with central venous catheters used for vascular access for 90 days or longer by State 2014
HI
AKAK
AZ
CA
UT
CT
FL
GA
IA
IL
KS
MA
MDMO
NJ
NY
OR
PA
SC
TN
CO
WA
WI
VA
ME
MN
MI
NC
TX
KY
WV
RI
NE
VT
NV OH
SD
AR
IN
NH
MT
ID
WY
ND
NMOK
LA
MSAL
DE
DC
10-12
13-18
7-9
PR
Source Centers for Medicare and Medicaid Services Dialysis Facility Compare 2014
Denominator At-risk adult Medicare patients with a central venous catheter who were receiving regular hemodialysis treatments at dialysis
facilities
Note For this measure lower percentages are better
Percentage of hemodialysis patients with central venous catheters used for vascular access for 90 days or longer by State 2014
Importance Central venous catheters are frequently used for vascular access to dialysis
patients until a fistula or graft is formed Central venous catheters have higher rates of
infection and adverse events among patients receiving dialysis treatment compared with
other forms of vascular access To decrease the likelihood of adverse events catheters should
be used for less than 90 days
Overall Percentage Nationally an average of 10 of dialysis patients used central venous
catheters for 90 days or longer in 2014
Geographic Variation In 2014 Alabama and Kansas had the lowest percentages of dialysis
patients using central venous catheters for 90 days or longer (7) and Puerto Rico had the
highest percentage (18) of long-term catheter use
Patient Safety Infrastructure
Efforts to improve patient safety have been accompanied by various infrastructure
enhancements
Growth in patient safety organizations which assist providers in detecting and reducing
risks and hazards from care delivery that may lead to patient harm
System improvement initiatives at the Veterans Health Administration (VHA)
34 | National Healthcare Quality and Disparities Report
Patient Safety
Development of the National Practitioner Data Bank a clearinghouse for information on
medical malpractice payments
Patient Safety Organizations
Patient safety organizations (PSOs) aim to reduce preventable adverse events near misses
and unsafe conditions in all health care settings
PSOs provide an environment for health care providers to voluntarily report discuss and
learn from patient safety events and quality analyses on a privileged and confidential basis
Measures include
Number of PSOs serving each State
Variation in concentrations of compounded liquid medications for children
Patient Safety Organizations AHRQ Common Formats
AHRQ Common Formats provide a standardized method for PSOs health care providers
and other organizations to collect and report patient safety events
Data element standards are important for aggregating and analyzing events across
providers
AHRQ Common Formats have been developed for a variety of settings of care
Acute care hospitals
Skilled nursing facilities
Retail pharmacy
More information is available at httpspsoahrqgovcommon
National Healthcare Quality and Disparities Report | 35
Patient Safety
Number of Patient Safety Organizations
AZ (2)
CA (3)
UT (2)
CT(3)
FL (8)
GA (5)
IA (4)
IL (7)
KS (5)
MA(3)
MD (4)MO(2)
NJ(3)
NY (5)
OR (3)
PA (5)
SC (4)
TN (5)
CO (2)
WA (2)
WI (5)
VA (7)
ME(2)
MN(3)
MI (3)
NC (7)
TX (6)
KY (4)WV (3)
RI(2)
NE (2)
VT(2)
NV (2)
OH (2)
SD (1)
AR (4)
IN (2)
NH(2)
MT (2)
ID (3)
WY (2)
ND (1)
NM (3)OK (2)
LA (1)
MS (2)
AL (2)
DE(2)
HI (2)
AKAK (2)
DC(3)
PR (0)
1-2
3-4
5-6
7-8
Number of PSOs
excluding PSOs
operating nationally
Number of Patient Safety Organizations by area served 2014
Source Agency for Healthcare Research and Quality Patient Safety Organization Information Form Calendar Year 2014 and PSO-PPC
Contact Database
Note PSOs included in this map were AHRQ-listed during any part of 2014 and submitted the PSO Profile to the PSO Privacy Protection
Center (PSO-PPC) in early 2015 A PSO may have members in one or more States regardless of headquarters location Each State shows the
number of PSOs that serve that State map excludes 38 PSOs that are available to providers in all States
AZ (2)
CA (3)
UT (2)
CT(3)
FL (8)
GA (5)
IA (4)
IL (7)
KS (5)
MA(3)
MD (4)MO(2)
NJ(3)
NY (5)
OR (3)
PA (5)
SC (4)
TN (5)
CO (2)
WA (2)
WI (5)
VA (7)
ME(2)
MN(3)
MI (3)
NC (7)
TX (6)
KY (4)WV (3)
RI(2)
NE (2)
VT(2)
NV (2)
OH (2)
SD (1)
AR (4)
IN (2)
NH(2)
MT (2)
ID (3)
WY (2)
ND (1)
NM (3)OK (2)
LA (1)
MS (2)
AL (2)
DE(2)
HI (2)
AKAK (2)
DC(3)
PR (0)
1-2
3-4
5-6
7-8
Number of PSOs
excluding PSOs
operating nationally
Number of Patient Safety Organizations by area served 2014
Source Agency for Healthcare Research and Quality Patient Safety Organization Information Form Calendar Year 2014 and PSO-PPC
Contact Database
Note PSOs included in this map were AHRQ-listed during any part of 2014 and submitted the PSO Profile to the PSO Privacy Protection
Center (PSO-PPC) in early 2015 A PSO may have members in one or more States regardless of headquarters location Each State shows the
number of PSOs that serve that State map excludes 38 PSOs that are available to providers in all States
Importance All patient safety organizations (PSOs) have authority to operate in all 50
States and US territories but not all do In 2014 38 PSOs self-reported being available to
providers nationally PSOs not available nationally serve specific States
Geographic Variation
Nearly all States have at least 2 PSOs available to providers in their State in addition to
the 38 national PSOs that serve all States
Florida has the most PSOs available with 8 in addition to the 38 nationally available
PSOs The States with the largest number of PSOs available are generally on the East
Coast (eg North Carolina Virginia New York Pennsylvania Tennessee Georgia) or
have large populations (eg Texas Illinois)
North Dakota South Dakota and Louisiana are the only states with just one PSO serving
their State in addition to the 38 national PSOs
Puerto Rico is served by one national PSO only
36 | National Healthcare Quality and Disparities Report
Patient Safety
Compounded Liquid Medications for Children
Compounded liquid medications for children in Michigan 2012
Source Levy S Buckley B Safe Table Success The MI Pediatric Safety Collaboration Presentation presented at the 7th Annual
Meeting of Patient Safety Organizations (PSOs) Rockville MD 2015 April and Rood JM Engels MJ Ciarkowski SL et al Variability in
compounding of oral liquids for pediatric patients a patient safety concern J Am Pharm Assn 201454(4)383-9
Note Information represents 244 responses to online survey of approximately 2000 Michigan pharmacies conducted in June 2012 by
The University of Michigan College of Pharmacy in collaboration with the Michigan Pharmacists Association
0
10
20
30
40
50
1 2 3 4 5 6 7 8 9
Nu
mb
er o
f D
rugs
Number of Unique Concentrations
Number of Different Compounded Concentrations per Drug
0
10
20
30
40
50
No Harm No Harm ButMonitoring
TemporaryHarm
Pe
rce
nt
Compounding Errors by Related Harm and Pharmacy Setting
Inpatient Outpatient
Compounded liquid medications for children in Michigan 2012
Source Levy S Buckley B Safe Table Success The MI Pediatric Safety Collaboration Presentation presented at the 7th Annual
Meeting of Patient Safety Organizations (PSOs) Rockville MD 2015 April and Rood JM Engels MJ Ciarkowski SL et al Variability in
compounding of oral liquids for pediatric patients a patient safety concern J Am Pharm Assn 201454(4)383-9
Note Information represents 244 responses to online survey of approximately 2000 Michigan pharmacies conducted in June 2012 by
The University of Michigan College of Pharmacy in collaboration with the Michigan Pharmacists Association
0
10
20
30
40
50
1 2 3 4 5 6 7 8 9
Nu
mb
er o
f D
rugs
Number of Unique Concentrations
Number of Different Compounded Concentrations per Drug
0
10
20
30
40
50
No Harm No Harm ButMonitoring
TemporaryHarm
Per
cen
t
Compounding Errors by Related Harm and Pharmacy Setting
Inpatient Outpatient
Importance
Liquid medications are widely used in pediatrics because many children find it difficult
to swallow tablets or capsules If not commercially manufactured these liquid
medications require a pharmacist to compound them to the correct dosage for the patient
This practice of compounding has led to a variety of medication concentrations in use In
the absence of standard concentrations for compounded medications there is a risk that
children may accidentally receive medications that are too potent and can be dangerous
or are too weak to be effective
The Michigan Health amp Hospital Association Keystone Center Patient Safety
Organization hosts five Pediatric Safe Tables each year Safe Tables provided a
confidential and legally protected environment to discuss challenges and improvement
strategies regarding inconsistent medication concentrations for compounded oral liquids
without fear of punitive action against them
National Healthcare Quality and Disparities Report | 37
Patient Safety
Overall Percentage
More than half (527) of drugs identified in the 2012 survey had 3 or more unique
concentrations dispensed to children across Michigan For example Rifampin used to
treat bacterial infections was reported to have 8 different concentrations dispensed to
patients
Nearly one-third (313) of reported errors caused temporary harm or required additional
monitoring despite no harm
Standardization of Compounded Liquid Medications
Source Michigan Health amp Hospital Association Keystone Center Patient Safety Organization and University of Michigan College of Pharmacy
State-Wide Initiative to Standardize the Compounding of Oral Liquids in Pediatrics
Standardization of compounded liquid medications for children in Michigan 2011
Issue identificationbull Hospitals attending PSO Pediatrics Safe
Table raise compounded medication concentrations as a major safety issue
bull Small focus group determines extent of problem
bull Michigan pharmacies are surveyed about baseline concentrations
Develop Interventionbull PSO Quarterly Safe Tables are held to
discuss cases and practicesbull Team develops recommendations for
standard concentrationsbull Consensus is achieved for frequently
compounded pediatric medications 470 formulations for 147 drug entities are reduced to 104 concentrations for 100 drugs
Practice changebull Toolkit is createdbull Standards are disseminated to Michigan
prescribers and pharmacies bull Standards are disseminated to PSO
members and Safe Table participants
Source Michigan Health amp Hospital Association Keystone Center Patient Safety Organization and University of Michigan College of Pharmacy
State-Wide Initiative to Standardize the Compounding of Oral Liquids in Pediatrics
Standardization of compounded liquid medications for children in Michigan 2011
Issue identificationbull Hospitals attending PSO Pediatrics Safe
Table raise compounded medication concentrations as a major safety issue
bull Small focus group determines extent of problem
bull Michigan pharmacies are surveyed about baseline concentrations
Develop Interventionbull PSO Quarterly Safe Tables are held to
discuss cases and practicesbull Team develops recommendations for
standard concentrationsbull Consensus is achieved for frequently
compounded pediatric medications 470 formulations for 147 drug entities are reduced to 104 concentrations for 100 drugs
Practice changebull Toolkit is createdbull Standards are disseminated to Michigan
prescribers and pharmacies bull Standards are disseminated to PSO
members and Safe Table participants
The Role of PSO Safe Tables Based on adverse medication events discussed in the
Michigan Health amp Hospital Association (MHA) Keystone Center Patient Safety
Organization (PSO) Safe Tables in July 2011 the Michigan Pediatric Safety Collaboration
was developed to further assess the scope of the problem and formulate a solution
The Collaborative The Michigan Pediatric Safety Collaboration includes individuals from
the University of Michigan College of Pharmacy the Michigan Pharmacists Association
(MPA) the Food and Drug Administration (FDA) and the MHA Keystone PSO
38 | National Healthcare Quality and Disparities Report
Patient Safety
Practice Change
As a result of the standardization effort 470 unique formulations for 147 drug entities
were reduced to 104 different concentrations for 100 drugs
The Michigan Pediatric Safety Collaboration developed a multistep process to implement
standards for compounding medications The MPA surveyed pharmacies in Michigan to
better define the nature and scope of the problem The PSO continued to act as convener
The result was the creation and dissemination of statewide standards for 120 frequently
compounded pediatric medications
Veterans Health Administration
The National Center for Patient Safety is part of the Veterans Health Administration the
Nationrsquos largest integrated health care system
Patient safety-related system improvement initiatives include
The Daily Planreg
Purchasing for Safety Initiative
Patient Safety Improvement Initiative
Patient safety improvement initiative The Daily Planreg at Veterans Affairs Medical Centers 2009
Source King BJ Mills PD Fore A et al The Daily Planreg including patients for safetys sake Nurs Manage 201243(3)15-8
0
10
20
30
40
50
Identified atleast one
error
Identifiederror
of omission
Identifiederror
ofcommission
Nurses Who Identified Errors in Patient Treatment Plan by Type
0
10
20
30
40
50
Patient founddiscrepancy inplanned care
Family founddiscrepancy inplanned care
Nursing Stafffound
discrepancyin plannedtreatment
Respondents Who Identified Errors or Discrepancies Through The Daily Plan reg
Patient safety improvement initiative The Daily Planreg at Veterans Affairs Medical Centers 2009
Source King BJ Mills PD Fore A et al The Daily Planreg including patients for safetys sake Nurs Manage 201243(3)15-8
0
10
20
30
40
50
Identified atleast one
error
Identifiederror
of omission
Identifiederror
ofcommission
Nurses Who Identified Errors in Patient Treatment Plan by Type
0
10
20
30
40
50
Patient founddiscrepancy inplanned care
Family founddiscrepancy inplanned care
Nursing Stafffound
discrepancyin plannedtreatment
Respondents Who Identified Errors or Discrepancies Through The Daily Plan reg
National Healthcare Quality and Disparities Report | 39
Patient Safety
Importance The Daily Planreg
is a two-page printed summary that acts as a schedule for
patients and providers each day It shows the procedures laboratory tests and medications
scheduled for that day and lists essential health information such as patientrsquos name allergies
and current medications It can be tailored for a patientrsquos needs by extracting orders from the
electronic medical record (EMR) The Daily Planreg
is intended to facilitate patient and family
engagement throughout the course of care The Daily Planreg
shows promise for improving
patient safety Since 2009 the VA has implemented The Daily Planreg
in more than 65
hospitals both inpatient and outpatient care settings The Daily Planreg
is shared more than
75000 times a month and the VA plans to continue the spread of The Daily Planreg
at
additional sites in 2016
Findings
As part of a pilot test in 2009 a total of 198 patients and 85 nurses responded to a survey
across 10 facilities Nurses had an average of 34 patients per shift who received The
Daily Planreg Patients responded about their own experiences whereas nurses reported
about all of their patients who received The Daily Planreg
Nearly half (475) of patients reported finding a discrepancy in planned care through
The Daily Planreg In addition 30 of patients reported that their family members found a
discrepancy Although not every discrepancy will be a potential medical error having a
shared understanding of the plan of care decreases the risk of error
More than one in six nurses (176) identified a discrepancy in treatment among their
patients through The Daily Planreg Most of these nurses (153) found one or more errors
of omission and a smaller share (106) of nurses found one or more errors of
commission some found both
40 | National Healthcare Quality and Disparities Report
Patient Safety
Issues Related to Ventilators
Common use-issues related to ventilators at the Veterans Health Administration 2006-2014 (combined)
Source Veterans Health Administration National Center for Patient Safety data collected October 2006 to October 2014
Note Examples of equipment failures include ventilator shutdown and other ventilator problems Ventilator settings include setup problems and
incorrect settings Support activities include space utilities and supplies Transport includes accidental extubation other transportation issues
and vehicle-related issues Alarms include alarm settings and alarm connection Training includes unknown ventilator model and other training
concerns
0
20
40
60
80
100
120
140
160
EquipmentFailure
VentilatorSettings
SupportActivities
Transport Alarms Training
Nu
mb
er o
f R
epo
rts
Common use-issues related to ventilators at the Veterans Health Administration 2006-2014 (combined)
Source Veterans Health Administration National Center for Patient Safety data collected October 2006 to October 2014
Note Examples of equipment failures include ventilator shutdown and other ventilator problems Ventilator settings include setup problems and
incorrect settings Support activities include space utilities and supplies Transport includes accidental extubation other transportation issues
and vehicle-related issues Alarms include alarm settings and alarm connection Training includes unknown ventilator model and other training
concerns
0
20
40
60
80
100
120
140
160
EquipmentFailure
VentilatorSettings
SupportActivities
Transport Alarms Training
Nu
mb
er o
f R
epo
rts
Importance Beginning with a focus on ventilators the Veterans Health Administrationrsquos
human factors-based Purchasing for Safety Initiative communicates the most common use-
issues associated with medical devices in order to ultimately remove or contain identified
vulnerabilities and prevent further harm
Event Reporting Patient safety managers report events and close calls from more than 150
VA facilities to a national database The largest number of use issues related to ventilators
involved equipment failure and issues such as spontaneous ventilator shutdown compressor
failure and broken or missing parts Other categories of ventilator use issues involved the
physical space where the ventilator was used challenges of transporting patients on
ventilators and problems with ventilator settings and alarms Root cause analyses on reports
are conducted and Patient Safety Alerts are issued to share the learning internally
Other Key Components
Data on ventilator issues from the VA and the Food and Drug Administrationrsquos Medical
Product Safety Network are the basis for a ldquogovernment-industry dayrdquo to work with
manufacturers This information is used to help the device manufacturers better
understand the limits of human use of their products
National Healthcare Quality and Disparities Report | 41
Patient Safety
The VA also trains noncliniciansmdashsuch as biomedical engineers across the
organizationmdashto understand the devices consider the situation for their use and identify
what can go wrong (ldquofailure modesrdquo) in advance
The VA encourages discussions among clinicians about their experience in using devices
In the Applied Patient Safety Challenge hundreds of staff participate in brainstorming
about solutions and strategies for dealing with unexpected scenarios involving devices
National Practitioner Data Bank
Medical malpractice actions are one way to flag potential medical errors
Medical Malpractice Payment Reports are submitted to the National Practitioner Data Bank
by medical malpractice payers
Report of a monetary exchange made for the benefit of a physician dentist or other
health care provider
Result of a settlement or judgment of a written complaint or claim based on that
providerrsquos delivery of or failure to deliver health care services
Number of Medical Malpractice Payment Reports by Setting
Number of Medical Malpractice Payment Reports by health care setting 2004-2014
Source National Practitioner Data Bank (NPDB) Public Use Data File Health Resources and Services Administration Bureau of Health
Professions Division of Practitioner Data Banks 2004-2014
Note Health care setting was not collected by the NPDB for 2104 reports in 2004 ldquoOtherrdquo includes Medical Malpractice Payment Reports
related to unknown settings as well as those for a combination of inpatient and outpatient settings Reports pertain to patients of any age
0
2000
4000
6000
8000
10000
12000
14000
16000
18000
20000
2004 2005 2006 2007 2008 2009 2010 2011 2012 2013 2014
Nu
mb
er o
f R
epo
rts
Total Inpatient Outpatient Other
Number of Medical Malpractice Payment Reports by health care setting 2004-2014
Source National Practitioner Data Bank (NPDB) Public Use Data File Health Resources and Services Administration Bureau of Health
Professions Division of Practitioner Data Banks 2004-2014
Note Health care setting was not collected by the NPDB for 2104 reports in 2004 ldquoOtherrdquo includes Medical Malpractice Payment Reports
related to unknown settings as well as those for a combination of inpatient and outpatient settings Reports pertain to patients of any age
0
2000
4000
6000
8000
10000
12000
14000
16000
18000
20000
2004 2005 2006 2007 2008 2009 2010 2011 2012 2013 2014
Nu
mb
er o
f R
epo
rts
Total Inpatient Outpatient Other
42 | National Healthcare Quality and Disparities Report
Patient Safety
Trends The total number of medical malpractice payment reports (MMPRs) per year
decreased from 17641 in 2004 to 12699 in 2014
Variation Across Reports
Of 157022 MMPRs from 2004 through 2014 more reports related to care in the
outpatient setting (71937) than in the inpatient setting (60391)
Diagnosis-related and treatment-related payments were the most frequent types of
reports each accounting for about 27 of cases Reports of payments for medication-
related cases accounted for only 5 of MMPRs (data not shown)
Number of Medical Malpractice Payment Reports by Allegation and Harm
Number of Medical Malpractice Payment Reports by type of allegation and harm severity 2004-2014
Key Temporary injury = Minor temporary injury and Major temporary injury Permanent significant injury = Significant Permanent Injury
Major Permanent Injury Quadriplegia Brain Damage Lifelong care
Source National Practitioner Data Bank Public Use Data File Health Resources and Services Administration Bureau of Health Professions
Division of Practitioner Data Banks 2004-2014
Note Reports pertain to patients of any age
0
20
40
60
80
100
Treatment(n=42913)
Diagnosis(n=42507)
Surgery(n=36845)
Obstetrics(n=10555)
Medication(n=8287)
Monitoring(n=5329)
Anesthesia(n=4276)
Equipment(n=1161)
BehavioralHealth
(n=879)
Blood(n=379)
EmotionalInjury Only
InsignificantInjury
TemporaryInjury
PermanentMinor Injury
PermanentSignificant Injury
Death Unknown
Number of Medical Malpractice Payment Reports by type of allegation and harm severity 2004-2014
Key Temporary injury = Minor temporary injury and Major temporary injury Permanent significant injury = Significant Permanent Injury
Major Permanent Injury Quadriplegia Brain Damage Lifelong care
Source National Practitioner Data Bank Public Use Data File Health Resources and Services Administration Bureau of Health Professions
Division of Practitioner Data Banks 2004-2014
Note Reports pertain to patients of any age
0
20
40
60
80
100
Treatment(n=42913)
Diagnosis(n=42507)
Surgery(n=36845)
Obstetrics(n=10555)
Medication(n=8287)
Monitoring(n=5329)
Anesthesia(n=4276)
Equipment(n=1161)
BehavioralHealth
(n=879)
Blood(n=379)
EmotionalInjury Only
InsignificantInjury
TemporaryInjury
PermanentMinor Injury
PermanentSignificant Injury
Death Unknown
Overall Percentage From 2004 to 2014 medical malpractice payments were made for
allegations related to
Treatment (42913)
Diagnosis (42507)
Surgery (36845)
Obstetrics (10555)
Medication (8287)
Monitoring (5329)
National Healthcare Quality and Disparities Report | 43
Patient Safety
Anesthesia (4276)
Equipment or products (1161)
Behavioral health (879) and
IV and blood products (379)
Variation Across Reports
Death accounted for more than one-third of harm in payments related to monitoring
(499) diagnosis (393) medication (383) and anesthesia (363) allegations
More than half of all obstetric payments were for allegations of permanent severe harm
(570)
Temporary harm accounted for more than one-third of payments related to equipment
(485) and surgery (360)
Most of the behavioral health-related payments were for emotional harm (457) or
death (338)
References
Agency for Healthcare Research and Quality Making Health Care Safer II An Updated Critical Analysis of the
Evidence for Patient Safety Practices Comparative Effectiveness Review No 211 Rockville MD Agency for
Healthcare Research and Quality March 2013 AHRQ Publication No 13-E001-EF
httpwwwahrqgovsitesdefaultfileswysiwygresearchfindingsevidence-basedshy
reportsservicesqualityptsafetyII-fullpdf
Arriaga AF Lancaster RT Berry RW et al The better colectomy project association of evidence-based best-
practice adherence rates to outcomes in colorectal surgery Ann Surg 2009 Oct250(4)507-13
httpwwwncbinlmnihgovpubmed19734778
Centers for Disease Control and Prevention HAI Prevalence Survey
httpwwwcdcgovHAIsurveillanceindexhtml Last updated March 2016 Accessed March 4 2016
Centers for Disease Control and Prevention Nursing Homes and Assisted Living (Long-Term Care Facilities)
httpwwwcdcgovlongtermcare Last updated September 2015 Accessed March 4 2016
Chassin MR Loeb JM High-reliability health care getting there from here Milbank Q 201391(3)459-90
httpwwwncbinlmnihgovpmcarticlesPMC3790522 Accessed September 23 2015
Chiu Y Bero L Hessol NA et al A literature review of clinical outcomes associated with antipsychotic medication
use in North American nursing home residents Health Policy 2015 Jun119(6)802-813 Epub 2015 Feb 28 PMID
25791166 httpwwwsciencedirectcomsciencearticlepiiS0168851015000652 Accessed June 17 2015
Huybrechts KF Gerhard Crystal S et al Differential risk of death in older residents in nursing homes prescribed
specific antipsychotic drugs Population based cohort study BMJ 2012 Feb 23344e977 PMID 22362541
httpwwwncbinlmnihgovpmcarticlesPMC3285717 Accessed June 17 2015
Institute of Medicine Preventing Medication Errors Quality Chasm Series 2007
httpwwwnapeducatalog11623preventing-medication-errors-quality-chasm-series
National Association for Home Care amp Hospice Basic Statistics About Home Care Updated 2010
httpwwwnahcorgassets1710hc_statspdf Accessed August 31 2015
44 | National Healthcare Quality and Disparities Report
Patient Safety
People in poor households received worse care than people in high-income households for
about 45 of patient safety measures
Blacks received worse care than Whites for about 20 of patient safety measures and
Asians received worse care than Whites for about 30 of patient safety measures
Patient Safety Measures With Disparities That Were Getting Smaller Over Time
Note Bold indicates disparities that were eliminated
Black vs White Gap
Admissions with central venous catheter-related bloodstream infection per 1000 medical
and surgical discharges of length 2 or more days
Postoperative pulmonary embolism or deep vein thrombosis per 1000 surgical admissions
Postoperative respiratory failure per 1000 elective-surgery admissions
Admissions with iatrogenic pneumothorax per 1000 discharges
Poor vs High Income Gap
Admissions with accidental puncture or laceration during procedure per 1000 medical
and surgical admissions age less than 18 years
Hispanic vs Non-Hispanic White Gap
Adult surgery patients with postoperative catheter-associated urinary tract infection
Asian vs White Gap
Deaths per 1000 elective-surgery admissions having developed specified complications
of care during hospitalization
Patient Safety Measures That Developed New Disparities
Asian vs White Gap
Accidental puncture or laceration during procedure per 1000 medical and surgical
admissions age 18 and over
Home health care patients who get better at taking their medication correctly
Obstetric trauma per 1000 instrument-assisted vaginal deliveries
Hispanic vs Non-Hispanic White Gap
Postoperative physiologic and metabolic derangements per 1000 elective-surgery admissions
4 | National Healthcare Quality and Disparities Report
Patient Safety
Measures of Patient Safety
Summary of information on patient safety from the National Healthcare Quality and
Disparities Report
Individual measures of patient safety overall and by age sex race ethnicity income
education insurance birth weight health status and presence of various health conditions
Measures of patient safety by setting
Hospitals
Nursing homes
Home health
Ambulatory care
All settings Infrastructure
Patient Safety in the Hospital Setting
Hospitals are a common setting for patient safety events
Many patients admitted to the hospital are in a clinically compromised state
Care often includes the use of invasive devices and procedures increasing patientsrsquo risk
for infection and harm
Measures include
Overall hospital-acquired conditions (HACs)
Healthcare-associated infections (HAIs)
Procedure-related events
National Healthcare Quality and Disparities Report | 5
Patient Safety
6 | National Healthcare Quality and Disparities Report
Distribution of Hospital-Acquired Conditions
Importance Hospital-acquired conditions (HACs) are conditions that patients did not have upon hospital admission but which developed during the patientrsquos hospital stay They can lead to poor patient outcomes and increased spending on health care HACs are often preventable
Overall Rate
In 2014 the overall HAC rate was 121 per 1000 hospital discharges Adverse drug events (414 per 1000 hospital discharges) accounted for 342 of total HACs and pressure ulcers (309 per 1000 hospital discharges) accounted for 255 of the total
Trends
From 2010 through 2014 the overall rate of hospital-acquired conditions declined 17 from 145 to 121 per 1000 hospital discharges
Among the most frequent HACs between 2010 and 2014 the rate of pressure ulcers decreased the most from 403 per 1000 discharges (more than 13 million events) to 309 per 1000 discharges (about 1 million events)
403 404 394 325 309
495 487 419403 414
122 113106
88 76
79 7872
72 79
81 7374
69 67
273 267257
251 266
0
20
40
60
80
100
120
140
160
2010 2011 2012 2013 2014
Rat
e p
er 1
00
0 D
isch
arge
s
Pressure Ulcers Adverse DrugEvents
Catheter-AssociatedUrinary Tract Infections
Falls Lower FrequencyHACs
All Other HACs
145 142132
121 121
Source Agency for Healthcare Research and Quality (AHRQ) Medicare Patient Safety Monitoring System 2010-2014 Healthcare Cost and
Utilization Project Nationwide Inpatient Sample 2010-2013 Centers for Disease Control and Prevention National Healthcare Safety Network
2010-2013
Denominator Adult hospital discharges age 18 and over
Note Lower Frequency HACs (lt31000 discharges) include central line-associated bloodstream infections venous thromboembolisms surgical
site infections obstetric adverse events and ventilator-associated pneumonia All Other Hospital-Acquired Conditions includes inadvertent femoral
artery puncture for catheter angiographic procedures adverse event associated with hip joint replacement adverse event associated with knee
joint replacement contrast nephropathy associated with catheter angiography methicillin-resistant Staphylococcus aureus (MRSA) vancomycin-
resistant Enterococcus (VRE) C difficile mechanical complications associated with central venous catheters postoperative cardiac events for
cardiac and noncardiac surgeries postoperative pneumonia iatrogenic pneumothorax postoperative hemorrhage or hematoma postoperative
respiratory failure and accidental puncture or laceration For more information on methods see httpwwwahrqgovprofessionalsquality-patient-
safetypfpinterimhacrate2014html
Distribution of hospital-acquired conditions based on national rates per 1000 adult hospital discharges 2010-2014
403 404 394 325 309
495 487 419403 414
122 113106
88 76
79 7872
72 79
81 7374
69 67
273 267257
251 266
0
20
40
60
80
100
120
140
160
2010 2011 2012 2013 2014
Rat
e p
er 1
00
0 D
isch
arge
s
Pressure Ulcers Adverse DrugEvents
Catheter-AssociatedUrinary Tract Infections
Falls Lower FrequencyHACs
All Other HACs
145 142132
121 121
Source Agency for Healthcare Research and Quality (AHRQ) Medicare Patient Safety Monitoring System 2010-2014 Healthcare Cost and
Utilization Project Nationwide Inpatient Sample 2010-2013 Centers for Disease Control and Prevention National Healthcare Safety Network
2010-2013
Denominator Adult hospital discharges age 18 and over
Note Lower Frequency HACs (lt31000 discharges) include central line-associated bloodstream infections venous thromboembolisms surgical
site infections obstetric adverse events and ventilator-associated pneumonia All Other Hospital-Acquired Conditions includes inadvertent femoral
artery puncture for catheter angiographic procedures adverse event associated with hip joint replacement adverse event associated with knee
joint replacement contrast nephropathy associated with catheter angiography methicillin-resistant Staphylococcus aureus (MRSA) vancomycin-
resistant Enterococcus (VRE) C difficile mechanical complications associated with central venous catheters postoperative cardiac events for
cardiac and noncardiac surgeries postoperative pneumonia iatrogenic pneumothorax postoperative hemorrhage or hematoma postoperative
respiratory failure and accidental puncture or laceration For more information on methods see httpwwwahrqgovprofessionalsquality-patient-
safetypfpinterimhacrate2014html
Distribution of hospital-acquired conditions based on national rates per 1000 adult hospital discharges 2010-2014
Patient Safety
During that same period adverse drug events decreased from a rate of 495 per 1000
discharges (more than 16 million events) to 414 per 1000 discharges (fewer than 14
million events) The catheter-associated urinary tract infection rate decreased from 122
to 76 per 1000 discharges (400000 and 250000 events respectively)
Among the less frequent HACs central line-associated bloodstream infections had the
greatest percentage decrease in rate (67) between 2010 and 2014 The rates of venous
thromboembolism (44) surgical site infections (17) and obstetric events (4) also
decreased
Healthcare-Associated Infections
Infections acquired during a hospital stay are among the most common complications of
hospital care
On any given day about 1 in 25 hospital patients has at least one healthcare-associated
infection (HAI) (CDC 2016)
HAIs often increase the patientrsquos length of stay in the hospital risk of mortality and hospital
costs
New infections in critically ill infants children and other patients generally reduce their
chances for recovery
For more information see the PSNet link to Patient Safety Primer Health Care-Associated
Infections at httpspsnetahrqgovprimersprimer7
Measures of Patient Safety in the Hospital Setting HAIs
Postoperative sepsis per 1000 adult discharges with an elective operating room procedure
Standardized infection ratios (SIRs) for central line-associated bloodstream infections
surgical site infections and catheter-associated urinary tract infections (CAUTIs)
SIRs compare the observed number of infections reported to the National Healthcare
Safety Network (NHSN) during a year to the predicted number of infections based on the
January 2006 to December 2008 referent period for central line-associated bloodstream
infections (CLABSIs) and surgical site infections (SSIs) and the calendar year 2009
referent period for CAUTIs
Change in SIRs for CAUTIs
Bloodstream infections per 1000 central-line days
In neonatal intensive care units (NICUs)
In adult intensive care units
National Healthcare Quality and Disparities Report | 7
Patient Safety
Postoperative Sepsis
Postoperative sepsis per 1000 adult discharges with an elective operating room procedure by sex and insurance status 2008-2013
Source Agency for Healthcare Research and Quality (AHRQ) Healthcare Cost and Utilization Project Nationwide Inpatient Sample 2008-
2013 and AHRQ Quality Indicators version 44
Denominator All elective hospital surgical discharges for patients age 18 years and over with length of stay of 4 or more days excluding
patients admitted for infection those with cancer or immunocompromised states those with obstetric conditions and admissions specifically for
sepsis
Note For this measure lower rates are better Acute care hospitalizations only Rates are adjusted by age sex age-sex interactions
comorbidities major diagnostic category diagnosis-related group and transfers into the hospital
0
5
10
15
20
25
2008 2009 2010 2011 2012 2013
Rat
e p
er
10
00
Dis
char
ges
Total Male Female
0
5
10
15
20
25
2008 2009 2010 2011 2012 2013
Rat
e p
er
10
00
Dis
char
ges
Private MedicareMedicaid Uninsured
Postoperative sepsis per 1000 adult discharges with an elective operating room procedure by sex and insurance status 2008-2013
Source Agency for Healthcare Research and Quality (AHRQ) Healthcare Cost and Utilization Project Nationwide Inpatient Sample 2008-
2013 and AHRQ Quality Indicators version 44
Denominator All elective hospital surgical discharges for patients age 18 years and over with length of stay of 4 or more days excluding
patients admitted for infection those with cancer or immunocompromised states those with obstetric conditions and admissions specifically for
sepsis
Note For this measure lower rates are better Acute care hospitalizations only Rates are adjusted by age sex age-sex interactions
comorbidities major diagnostic category diagnosis-related group and transfers into the hospital
0
5
10
15
20
25
2008 2009 2010 2011 2012 2013
Rat
e p
er
10
00
Dis
char
ges
Total Male Female
0
5
10
15
20
25
2008 2009 2010 2011 2012 2013
Rat
e p
er
10
00
Dis
char
ges
Private MedicareMedicaid Uninsured
Overall Rate In 2013 the postoperative sepsis rate was 143 per 1000 adult discharges with
an elective operating room procedure
Groups With Disparities
In 2013 female patients had a lower rate of postoperative sepsis than male patients
Also in 2013 patients with Medicaid and those with Medicare had worse sepsis rates
than privately insured patients
From 2008 to 2013 there were no statistically significant changes in the gap between
males and females
From 2008 to 2013 there were no statistically significant changes in the gap between
privately insured patients and other insurance groups
8 | National Healthcare Quality and Disparities Report
Patient Safety
Standardized Infection Ratios
Standardized infection ratios for central line-associated bloodstream infections and surgical site infections 2009-2013 and catheter-associated
urinary tract infections 2010-2013
Key CLABSI = central line-associated bloodstream infection SSI = surgical site infection SCIP = Surgical Care Improvement Project CAUTI =
catheter-associated urinary tract infection
Source Centers for Disease Control and Prevention National Center for Emerging and Zoonotic Infectious Diseases 2013 National and State
Healthcare Associated Infections Progress Report and National Healthcare Safety Network 2009ndash2013
Note For this measure lower numbers are better Acute care hospitalizations only CAUTI excludes neonatal intensive care units
00
02
04
06
08
10
12
14
2009 2010 2011 2012 2013
Stan
dar
diz
ed
Infe
ctio
n R
atio
CLABSI All SSI Combined SCIP Procedures CAUTI All
Standardized infection ratios for central line-associated bloodstream infections and surgical site infections 2009-2013 and catheter-associated
urinary tract infections 2010-2013
Key CLABSI = central line-associated bloodstream infection SSI = surgical site infection SCIP = Surgical Care Improvement Project CAUTI =
catheter-associated urinary tract infection
Source Centers for Disease Control and Prevention National Center for Emerging and Zoonotic Infectious Diseases 2013 National and State
Healthcare Associated Infections Progress Report and National Healthcare Safety Network 2009ndash2013
Note For this measure lower numbers are better Acute care hospitalizations only CAUTI excludes neonatal intensive care units
00
02
04
06
08
10
12
14
2009 2010 2011 2012 2013
Stan
dar
diz
ed
Infe
ctio
n R
atio
CLABSI All SSI Combined SCIP Procedures CAUTI All
Background SIRs compare the observed number of infections reported to the NHSN during
a year to the predicted number of infections based on the January 2006 to December 2008
referent period for CLABSIs and SSIs and the calendar year 2009 referent period for
CAUTIs For example a ratio of 81 for SSIs in 2013 indicates that 19 fewer SSIs were
observed in 2013 than predicted based on the 2006-2008 baseline period Data are from all
intensive care units wards and other non-critical care locations CLABSI data also include
neonatal intensive care units but exclude long-term acute care hospitals and inpatient
rehabilitation facilities SCIP procedures are those performed on adults Number of facilities
reporting to NHSN roughly tripled from 2009 to 2013 Procedures include abdominal aortic
aneurysm repair peripheral vascular bypass surgery coronary artery bypass graft with both
chest and donor site incisions or with chest incision only other cardiac surgery colon
surgery rectal surgery hip arthroplasty abdominal hysterectomy knee arthroplasty and
vaginal hysterectomy
Overall Rate In 2013 the overall SIR for CLABSIs among intensive care units in the 50
States District of Columbia and Puerto Rico was 054 and the overall SIR for CAUTIs was
106 The overall SIR for SSIs following 10 common procedures in adults was 081
Trends From 2009 to 2013 the SIR for CLABSIs improved and from 2010 to 2013 the
SIR for CAUTIs worsened for facilities reporting to NHSN
National Healthcare Quality and Disparities Report | 9
Patient Safety
Change in Statewide SIRs
Change from 2012 to 2013 in Statewide SIRs for CAUTI
Key CAUTI = catheter-associated urinary tract infection NHSN = National Healthcare Safety Network
Source Centers for Disease Control and Prevention National Center for Emerging and Zoonotic Infectious Diseases 2013 National and State
Healthcare Associated Infections Progress Report
Note For this measure lower numbers are better Changes in SIRs are categorized as ldquono changerdquo if they are not statistically significant Acute
care hospitalizations only Excludes neonatal intensive care units For this measure District of Columbia and Puerto Rico are treated as States
No Change
Increase
Indicates State mandate
in 2013 to report CAUTI
to NHSN
Decrease
AKAK
HI PR
AZ
CA
UT
CT
FL
GA
IA
IL
KS
MA
MDMO
NJ
NY
OR
PA
SCTN
CO
WA
WI
VA
ME
MN
MI
NC
TX
KY
WV
RI
NE
VT
NVOH
SD
AR
IN
NH
MT
ID
WY
ND
NM
OK
LA
MS AL
DE
DC
Change from 2012 to 2013 in Statewide SIRs for CAUTI
Key CAUTI = catheter-associated urinary tract infection NHSN = National Healthcare Safety Network
Source Centers for Disease Control and Prevention National Center for Emerging and Zoonotic Infectious Diseases 2013 National and State
Healthcare Associated Infections Progress Report
Note For this measure lower numbers are better Changes in SIRs are categorized as ldquono changerdquo if they are not statistically significant Acute
care hospitalizations only Excludes neonatal intensive care units For this measure District of Columbia and Puerto Rico are treated as States
No Change
Increase
Indicates State mandate
in 2013 to report CAUTI
to NHSN
Decrease
AKAK
HI PR
AZ
CA
UT
CT
FL
GA
IA
IL
KS
MA
MDMO
NJ
NY
OR
PA
SCTN
CO
WA
WI
VA
ME
MN
MI
NC
TX
KY
WV
RI
NE
VT
NVOH
SD
AR
IN
NH
MT
ID
WY
ND
NM
OK
LA
MS AL
DE
DC
Geographic Variation In 2013 31 States had SIRs greater than 1 indicating that on average
their hospitals had more CAUTIs than hospitals of similar type and size during the 2009
referent period The States were Alaska Arkansas Arizona Connecticut District of Columbia
Delaware Georgia Idaho Indiana Kansas Kentucky Massachusetts Maryland Maine
Michigan Minnesota Missouri Mississippi North Carolina New Jersey Nevada New York
Oregon Pennsylvania Rhode Island South Carolina Tennessee Texas Utah Virginia and
Washington
Trends Of 52 reporting States 33 had no change from 2012 to 2013 in CAUTI SIRs 9
decreased and 10 increased
Toolkit for Reducing Catheter-Associated Urinary Tract Infections in Hospitals
Purpose To help hospitals prevent catheter-associated urinary tract infections (CAUTIs) and
improve safety culture
Method Implementing evidence-based practical resources and concepts from the
Comprehensive Unit-based Safety Program
Intended User Hospital facilities
Available Tools Guides checklists webinars learning modules data interpretation guides
10 | National Healthcare Quality and Disparities Report
Patient Safety
Potential Measures of Effectiveness
Number of symptomatic CAUTIs attributable to each unit by month
Days since last CAUTI
Link httpwwwahrqgovprofessionalsquality-patient-safetyhaistoolscautishy
hospitalsIndexhtml
Central Line-Associated Bloodstream Infections in Neonatal Intensive Care Units
Central line-associated bloodstream infections per 1000 central-line days by birth weight of child in Level III neonatal intensive care units and by type
of pediatric ICU 2009-2013
Source Centers for Disease Control and Prevention National Healthcare Safety Network 2009-2013
Denominator Infections per 1000 central-line days
Note For this measure lower rates are better Acute care hospitalizations only
00
05
10
15
20
25
30
35
40
2009 2010 2011 2012 2013
Rat
e p
er
10
00
Ce
ntr
al-
Lin
e D
ays
le750 g 751-1000 g1001-1500 g 1501-2500 ggt2500 g
Level III Neonatal ICUs
00
05
10
15
20
25
30
35
40
2009 2010 2011 2012 2013
Rat
e p
er
10
00
Ce
ntr
al-
Lin
e D
ays
Pediatric Cardiothoracic ICUPediatric Medical ICUPediatric MedicalSurgical ICU
Pediatric ICUs
Central line-associated bloodstream infections per 1000 central-line days by birth weight of child in Level III neonatal intensive care units and by type
of pediatric ICU 2009-2013
Source Centers for Disease Control and Prevention National Healthcare Safety Network 2009-2013
Denominator Infections per 1000 central-line days
Note For this measure lower rates are better Acute care hospitalizations only
00
05
10
15
20
25
30
35
40
2009 2010 2011 2012 2013
Rat
e p
er
10
00
Ce
ntr
al-
Lin
e D
ays
le750 g 751-1000 g1001-1500 g 1501-2500 ggt2500 g
Level III Neonatal ICUs
00
05
10
15
20
25
30
35
40
2009 2010 2011 2012 2013
Rat
e p
er 1
000
Cen
tral
-Lin
e D
ays
Pediatric Cardiothoracic ICUPediatric Medical ICUPediatric MedicalSurgical ICU
Pediatric ICUs
Overall Rates
In 2013 among patients in Level III NICUs pooled mean CLABSI rates ranged from a
low of 06 infections per 1000 central-line days among neonates born at 1501 to 2500
grams to a high of 21 infections per 1000 central-line days among neonates born at less
than or equal to 750 grams
Trends
The rate of CLABSI among pediatric cardiothoracic ICUs was 25 in 2009 and 13 in
2013 among pediatric medical ICUs 26 in 2009 and 08 in 2013 and among pediatric
medicalsurgical ICUs 22 in 2009 and 12 in 2013
National Healthcare Quality and Disparities Report | 11
Patient Safety
Central Line-Associated Bloodstream Infections in Adult Intensive Care Units
Central linendashassociated bloodstream infections per 1000 central-line days in adult medical vs medicalsurgical intensive care units by hospital teaching
status 2006ndash2013
Source Centers for Disease Control and Prevention National Healthcare Safety Network 2006-2013
Denominator Infections per 1000 central-line days
Note For this measure lower rates are better Acute care hospitalizations only Major teaching facilities are defined as facilities with a program
for medical students and postgraduate medical training All other medical facilities include graduate facilities with programs for postgraduate
medical training only (ie residency andor fellowships) and undergraduate facilities with programs for medical students only
00
05
10
15
20
25
30
2006-2008 2009 2010 2011 2012 2013
Rat
e p
er
10
00
Ce
ntr
al-L
ine
Day
s
Major Teaching Medical ICU All Others Medical ICU
Major Teaching MedicalSurgical ICU All Others MedicalSurgical ICU
Central linendashassociated bloodstream infections per 1000 central-line days in adult medical vs medicalsurgical intensive care units by hospital teaching
status 2006ndash2013
Source Centers for Disease Control and Prevention National Healthcare Safety Network 2006-2013
Denominator Infections per 1000 central-line days
Note For this measure lower rates are better Acute care hospitalizations only Major teaching facilities are defined as facilities with a program
for medical students and postgraduate medical training All other medical facilities include graduate facilities with programs for postgraduate
medical training only (ie residency andor fellowships) and undergraduate facilities with programs for medical students only
00
05
10
15
20
25
30
2006-2008 2009 2010 2011 2012 2013
Rat
e p
er
10
00
Ce
ntr
al-L
ine
Day
s
Major Teaching Medical ICU All Others Medical ICU
Major Teaching MedicalSurgical ICU All Others MedicalSurgical ICU
Trends
Between 2006-2008 (combined) and 2013 there was a 46 decrease in CLABSIs (data
not shown)
From 2006-2008 (combined) to 2013 rates of CLABSIs in hospitals decreased 538
among adult medical ICU patients in hospitals with major teaching programs 476
among adult medicalsurgical ICU patients in hospitals with major teaching programs
421 among adult medical ICU patients in all other hospitals and 467 among adult
medicalsurgical ICU patients in all other hospitals
Tools for Reducing Central Line-Associated Bloodstream Infections
Purpose To help hospitals prevent central line-associated bloodstream infections (CLABSIs)
and improve safety culture
Methods Implementing evidence-based practical resources and concepts from the
Comprehensive Unit-based Safety Program (CUSP)
Intended user Hospital facilities
Available tools Checklists preventable incidence calculator audit form event report
template
12 | National Healthcare Quality and Disparities Report
Patient Safety
Impact
Through use of the CUSP toolkit and CLABSI tools more than 100 intensive care units
in Michigan have nearly eliminated CLABSIs
Nationwide the use of this toolkit has helped more than 1000 hospitals reduce rates of
CLABSI by 41 in aggregate See httpwwwahrqgovworkingforqualitypias
mhhakcpiahtm and httpwwwahrqgovprofessionalseducationcurriculumshy
toolsclabsitoolsindexhtmlpurpose
Procedure-Related Events
More than 40 million operative procedures are performed in the United States each year
Postoperative adverse events are not uncommon and increase both hospitalization length and
cost (AHRQ 2013)
Measures include
Risk-adjusted mortality at 30 days postoperation for colorectal surgery performed in
adults
Percentage of adult patients receiving hip joint replacement (because of fracture or
degenerative conditions) who experienced adverse events
Percentage of adults with mechanical adverse events associated with central venous
catheter placement
Postoperative Mortality
Risk-adjusted mortality rate within 30 days postoperation for adults undergoing colorectal surgery in ACS NSQIP participating hospitals in the United States by
raceethnicity and hospital teaching status 2008-2014
0
1
2
3
4
5
6
Pe
rce
nt
Teaching Nonteaching
Source American College of Surgeons (ACS) National Surgical Quality Improvement Program (NSQIP) 2008-2014
Denominator Adults age 18 years and over
Note For this measure lower percentages are better The participation in the ACS NSQIP is voluntary and current participation is weighted
when calculating rates Participating hospitals have changed over time 203 hospitals participated in 2008 and 531 hospitals participated in
2014 Other includes Asian American Indian or Alaska Native and Native Hawaiian or Other Pacific Islander White Black and Other are non-
Hispanic Hispanic includes all races
0
1
2
3
4
5
6
Pe
rce
nt
Total White Black Hispanic Other
Risk-adjusted mortality rate within 30 days postoperation for adults undergoing colorectal surgery in ACS NSQIP participating hospitals in the United States by
raceethnicity and hospital teaching status 2008-2014
0
1
2
3
4
5
6
Pe
rce
nt
Teaching Nonteaching
Source American College of Surgeons (ACS) National Surgical Quality Improvement Program (NSQIP) 2008-2014
Denominator Adults age 18 years and over
Note For this measure lower percentages are better The participation in the ACS NSQIP is voluntary and current participation is weighted
when calculating rates Participating hospitals have changed over time 203 hospitals participated in 2008 and 531 hospitals participated in
2014 Other includes Asian American Indian or Alaska Native and Native Hawaiian or Other Pacific Islander White Black and Other are non-
Hispanic Hispanic includes all races
0
1
2
3
4
5
6
Pe
rce
nt
Total White Black Hispanic Other
National Healthcare Quality and Disparities Report | 13
Patient Safety
Importance Colorectal procedures have high rates of postoperative complications
Nonadherence to evidence-based best practices is associated with an increased risk of these
complications (Arriaga et al 2009)
Overall Rate In 2014 the risk-adjusted mortality rate was 31 among patients undergoing
colorectal surgeries at ACS NSQIP participating hospitals
Trends From 2008 to 2014 30-day postoperative mortality after colorectal surgery
improved
Groups With Disparities
In 2014 the percentage of patients with 30-day postoperative mortality was worse for
Blacks (36) compared with Whites (30)
From 2008 to 2014 there were no statistically significant changes in the gap between
minority groups and Whites in the percentage of patients with 30-day postoperative
mortality
Adverse Events After Hip Joint Replacement
Adult patients receiving hip joint replacement due to fracture or degenerative conditions who experienced adverse events by age and chronic obstructive
pulmonary disease 2009-2013
02468
101214161820
2009 2010 2011 2012 2013
Pe
rce
nt
Total 65-74 75-84 85+
02468
101214161820
2009 2010 2011 2012 2013
Pe
rce
nt
COPD No COPD
Key COPD = chronic obstructive pulmonary disease
Source Agency for Healthcare Research and Quality (AHRQ) and Centers for Medicare amp Medicaid Services (CMS) Medicare Patient Safety
Monitoring System (MPSMS) 2009-2013
Denominator All patients age 18 years and over in the MPSMS sample who had a surgical procedure performed to replace a hip joint due to
degenerative conditions or a fractured hip
Note For this measure lower percentages are better Hospitals in Puerto Rico the Virgin Islands and Maryland were not included in the
annual samples Samples were drawn from the CMS Hospital Inpatient Quality Reporting program and consist of medical records for
discharges following hip arthroplasty procedures as defined by the Surgical Care Improvement Project Rates for patients age 85 years and
over in 2013 and for ages 18-64 years old for all years are not shown because the data did not meet the criteria for statistical reliability data
quality or confidentiality COPD status relates to patients with a principal or secondary discharge diagnosis of COPD
Adult patients receiving hip joint replacement due to fracture or degenerative conditions who experienced adverse events by age and chronic obstructive
pulmonary disease 2009-2013
02468
101214161820
2009 2010 2011 2012 2013
Pe
rce
nt
Total 65-74 75-84 85+
02
4
68
10
12
1416
18
20
2009 2010 2011 2012 2013
Pe
rce
nt
COPD No COPD
Key COPD = chronic obstructive pulmonary disease
Source Agency for Healthcare Research and Quality (AHRQ) and Centers for Medicare amp Medicaid Services (CMS) Medicare Patient Safety
Monitoring System (MPSMS) 2009-2013
Denominator All patients age 18 years and over in the MPSMS sample who had a surgical procedure performed to replace a hip joint due to
degenerative conditions or a fractured hip
Note For this measure lower percentages are better Hospitals in Puerto Rico the Virgin Islands and Maryland were not included in the
annual samples Samples were drawn from the CMS Hospital Inpatient Quality Reporting program and consist of medical records for
discharges following hip arthroplasty procedures as defined by the Surgical Care Improvement Project Rates for patients age 85 years and
over in 2013 and for ages 18-64 years old for all years are not shown because the data did not meet the criteria for statistical reliability data
quality or confidentiality COPD status relates to patients with a principal or secondary discharge diagnosis of COPD
Importance Hip replacement is most common among older adults who have an increased
risk of adverse events after these surgeries
14 | National Healthcare Quality and Disparities Report
Patient Safety
Overall Percentage In 2013 49 of patients receiving a hip joint replacement experienced
an adverse event
Trends From 2009 to 2013 the overall percentage of adverse events improved for patients
who had a hip joint replacement due to fracture or degenerative conditions
Groups With Disparities
In 2013 there were no statistically significant differences by age or COPD status in the
percentage of hip replacement patients who had adverse events
From 2009 to 2013 there were no statistically significant changes in the gap between
patients age 75 and over and those ages 65-74 in adverse event frequencies Similarly
there were no statistically significant changes in disparities between patients with COPD
and those without COPD
Adverse Events Associated With Central Venous Catheter Placement
Adults with mechanical adverse events associated with central venous catheter placement by race and obesity status 2009-2013
Source Agency for Healthcare Research and Quality and Centers for Medicare amp Medicaid Services Medicare Patient Safety Monitoring
System 2009-2013
Denominator Selected discharges of hospitalized patients age 18 years and over with central venous catheter placement
Note For this measure lower percentages are better Mechanical adverse events include allergic reaction to the catheter tamponade
perforation pneumothorax hematoma shearing off of the catheter air embolism misplaced catheter thrombosisembolism knotting of the
pulmonary artery catheter and certain other events
0
2
4
6
8
10
2009 2010 2011 2012 2013
Pe
rce
nt
Total White Black
0
2
4
6
8
10
2009 2010 2011 2012 2013
Pe
rce
nt
Obese Not Obese
Adults with mechanical adverse events associated with central venous catheter placement by race and obesity status 2009-2013
Source Agency for Healthcare Research and Quality and Centers for Medicare amp Medicaid Services Medicare Patient Safety Monitoring
System 2009-2013
Denominator Selected discharges of hospitalized patients age 18 years and over with central venous catheter placement
Note For this measure lower percentages are better Mechanical adverse events include allergic reaction to the catheter tamponade
perforation pneumothorax hematoma shearing off of the catheter air embolism misplaced catheter thrombosisembolism knotting of the
pulmonary artery catheter and certain other events
0
2
4
6
8
10
2009 2010 2011 2012 2013
Pe
rce
nt
Total White Black
0
2
4
6
8
10
2009 2010 2011 2012 2013
Pe
rce
nt
Obese Not Obese
Importance Central venous catheterization (CVC) allows medical personnel quick access to
a patientrsquos bloodstream This ease of access is important when a patient requires life-saving
medications or when a physician needs to measure central venous pressure Mechanical
adverse events are most likely to occur while medical personnel are placing or maintaining
the central venous catheter
National Healthcare Quality and Disparities Report | 15
Patient Safety
Overall Percentage In 2013 32 of adults with central venous catheter placements
experienced an associated mechanical adverse event
Trends From 2009 to 2013 there were no statistically significant changes in the overall
percentage of adults with mechanical adverse events associated with central venous catheter
placement
Groups With Disparities
In 2013 the percentage of adults with mechanical adverse events associated with CVC
was worse for Blacks (67) compared with Whites (27) There were no statistically
significant differences by obesity status
From 2009 to 2013 there were no statistically significant changes in the gap between
Blacks and Whites in the percentage of adults with mechanical adverse events associated
with CVC
Adverse Drug Events
An estimated 400000 preventable ADEs occur each year in US hospitals generating
additional costs of $35 billion in 2006 dollars (IOM 2007)
An ADE is an injurymdashincluding physical harm mental harm or loss of functionmdash
resulting from medical intervention involving a drug
For more information see the PSNet link to Patient Safety Primer Medication Errors
httpspsnetahrqgovprimersprimer23medication-errors
The three initial targets of the HHS National Action Plan for Adverse Drug Event Prevention are
Anticoagulants and related bleeding
Diabetes agents and related hypoglycemia
Opioids and accidental overdose oversedation and respiratory depression
Measures of Patient Safety in the Hospital Setting Adverse Drug Events
Percentage of hospitalized adult patients who received a hypoglycemic agent and had an
adverse drug event
Percentage of hospitalized adult patients who had an anticoagulant-related adverse drug
event to warfarin
Number of opioid-related medication errors in patients of all ages
16 | National Healthcare Quality and Disparities Report
Patient Safety
Adverse Drug Events With Hypoglycemic Agents
Hospitalized adult patients who received a hypoglycemic agent who had adverse drug events with hypoglycemic agents by
raceethnicity 2010-2013 and renal disease 2009-2013
Source Agency for Healthcare Research and Quality and Centers for Medicare amp Medicaid Services Medicare Patient Safety Monitoring
System 2009-2013
Note For this measure lower percentages are better Hypoglycemic agents received by patients age 18 and over during a hospital stay include
insulin oral hypoglycemic or a combination of both The 2009 data for races did not meet the criteria for statistical reliability data quality or confidentiality
0
2
4
6
8
10
12
14
16
18
20
2009 2010 2011 2012 2013
Pe
rce
nt
Total Renal DiseaseNo Renal Disease
0
2
4
6
8
10
12
14
16
18
20
2010 2011 2012 2013
Pe
rce
nt
Total White BlackAsian Hispanic
Hospitalized adult patients who received a hypoglycemic agent who had adverse drug events with hypoglycemic agents by
raceethnicity 2010-2013 and renal disease 2009-2013
Source Agency for Healthcare Research and Quality and Centers for Medicare amp Medicaid Services Medicare Patient Safety Monitoring
System 2009-2013
Note For this measure lower percentages are better Hypoglycemic agents received by patients age 18 and over during a hospital stay include
insulin oral hypoglycemic or a combination of both The 2009 data for races did not meet the criteria for statistical reliability data quality or confidentiality
0
2
4
6
8
10
12
14
16
18
20
2009 2010 2011 2012 2013
Pe
rce
nt
Total Renal DiseaseNo Renal Disease
0
2
4
6
8
10
12
14
16
18
20
2010 2011 2012 2013
Pe
rce
nt
Total White BlackAsian Hispanic
Importance Hypoglycemic agents which are ingested orally are typically used in patients
with type II diabetes to control blood sugar levels In some cases diabetic patients use
hypoglycemic agents together with insulin The risk of chronic kidney disease increases
twofold for people with diabetes and renal impairment can increase the risk for adverse
events related to hypoglycemic agents
Overall Percentage In 2013 85 of hospital patients receiving hypoglycemic agents had
an adverse drug event
Trends The overall percentage of adverse drug events associated with hypoglycemic agents
improved from 2009 to 2013
Groups With Disparities
In 2013 the percentage of hospital patients who had adverse drug events with hypoglycemic agents was higher for Blacks (111) than for Whites (8)
Also in 2013 the percentage of hospital patients who had adverse drug events with
hypoglycemic agents was higher for those with renal disease (122) than for those
without renal disease (56)
From 2010 to 2013 there were no statistically significant changes in the gap between
minority groups and Whites in the percentage of patients who had adverse drug events
associated with hypoglycemic agents Similarly there were no statistically significant
changes in the gap between those with renal disease and those without
National Healthcare Quality and Disparities Report | 17
Patient Safety
Adverse Drug Events With Warfarin
Hospitalized adult patients with an anticoagulant-related adverse drug event with warfarin by age and corticosteroid use 2009-2013
Source Agency for Healthcare Research and Quality and Centers for Medicare amp Medicaid Services Medicare Patient Safety Monitoring
System 2009ndash2013
Denominator Patients 18 and over who received warfarin and had their international normalized ratio (INR) measured during their hospital
stay
Note For this measure lower percentages are better Adverse events occurring the day of hospital arrival were excluded
0
2
4
6
8
10
12
2009 2010 2011 2012 2013
Pe
rce
nt
TotalCorticosteroid UseNo Corticosteroid Use
0
2
4
6
8
10
12
2009 2010 2011 2012 2013
Pe
rce
nt
lt65 65-74 75-84 85+
Hospitalized adult patients with an anticoagulant-related adverse drug event with warfarin by age and corticosteroid use 2009-2013
Source Agency for Healthcare Research and Quality and Centers for Medicare amp Medicaid Services Medicare Patient Safety Monitoring
System 2009ndash2013
Denominator Patients 18 and over who received warfarin and had their international normalized ratio (INR) measured during their hospital
stay
Note For this measure lower percentages are better Adverse events occurring the day of hospital arrival were excluded
0
2
4
6
8
10
12
2009 2010 2011 2012 2013
Pe
rce
nt
TotalCorticosteroid UseNo Corticosteroid Use
0
2
4
6
8
10
12
2009 2010 2011 2012 2013
Pe
rce
nt
lt65 65-74 75-84 85+
Importance Blood clots in arteries and veins can cause a blockage of blood flow and lead to
strokes and heart attacks Anticoagulants such as warfarin reduce this risk but pose an
increased risk of bleeding Corticosteroids can interact with anticoagulants to raise the risk of
potential bleeding complications
Overall Percentage In 2013 50 of adults using warfarin experienced an anticoagulant-
related adverse drug event
Trends From 2009 to 2013 there were no statistically significant changes in the overall
percentage of hospital patients with an adverse drug event related to warfarin
Groups With Disparities
In 2013 the percentage of hospital patients who had an adverse drug event to warfarin
was the same regardless of corticosteroid use status
From 2009 to 2013 there were no statistically significant changes in the gap between
older age groups and those under age 65 in the percentage of patients who had adverse
events associated with warfarin Similarly there were no statistically significant changes
in the gap between those using corticosteroids and those not using corticosteroids
18 | National Healthcare Quality and Disparities Report
Patient Safety
Opioid-Related Medication Errors
Number of opioid-related medication errors reported in Pennsylvania by AHRQ eventharm category and age 2006 2008 2010 2012 2014
30 53 44 27 23
2947 2798 2714 27082408
9531014
984 969
910
175 245251 398
330
0
500
1000
1500
2000
2500
3000
3500
4000
4500
2006 2008 2010 2012 2014
Nu
mb
er o
f Ev
ents
Unsafe Condition Near Miss
Patient Event No Harm Patient Event Harm
Source Institute of Safe Medication Practices on behalf of the Pennsylvania Patient Safety Authority 2006-2014
Note Pennsylvania Patient Safety Reporting System reports of medication errors are from acute-level facilities that consist of hospitals
ambulatory surgical facilities birthing centers and abortion facilities Medication errors do not include adverse drug reactions Eventharm
categories refer to those in the Agency for Healthcare Research and Quality Common Formats Unsafe condition is defined as any
circumstance that increases the probability of a patient safety event A near miss is defined as a patient safety event that did not reach the
patient Deaths are included in the total but not shown on the chart because there were too few to render graphically
192 166 336530 662
2287 24842385
2364 1955
16271461 1272
1208
1055
0
500
1000
1500
2000
2500
3000
3500
4000
4500
2006 2008 2010 2012 2014
Nu
mb
er o
f Ev
en
ts
lt18 18-64 65+
Number of opioid-related medication errors reported in Pennsylvania by AHRQ eventharm category and age 2006 2008 2010 2012 2014
30 53 44 27 23
2947 2798 2714 27082408
9531014
984 969
910
175 245251 398
330
0
500
1000
1500
2000
2500
3000
3500
4000
4500
2006 2008 2010 2012 2014
Nu
mb
er o
f Ev
ents
Unsafe Condition Near Miss
Patient Event No Harm Patient Event Harm
Source Institute of Safe Medication Practices on behalf of the Pennsylvania Patient Safety Authority 2006-2014
Note Pennsylvania Patient Safety Reporting System reports of medication errors are from acute-level facilities that consist of hospitals
ambulatory surgical facilities birthing centers and abortion facilities Medication errors do not include adverse drug reac tions Eventharm
categories refer to those in the Agency for Healthcare Research and Quality Common Formats Unsafe condition is defined as any
circumstance that increases the probability of a patient safety event A near miss is defined as a patient safety event that did not reach the
patient Deaths are included in the total but not shown on the chart because there were too few to render graphically
192 166 336530 662
2287 24842385
2364 1955
16271461 1272
1208
1055
0
500
1000
1500
2000
2500
3000
3500
4000
4500
2006 2008 2010 2012 2014
Nu
mb
er o
f Ev
ents
lt18 18-64 65+
Importance Acute malignant andmdashincreasinglymdashchronic pain often is treated or managed
with prescription opioids Reducing patient harm from the use of opioids in both inpatient
and outpatient settings is a main area of focus because opioid-related adverse drug events are
often preventable
Trends
In Pennsylvania the total number of medication error reports related to opioids decreased
106 between 2006 (4106) and 2014 (3672)
Between 24 and 54 opioid-related medication errors resulting in patient harm or death
were reported from 2006 through 2014 accounting for approximately 1 of all reported
opioid medication errors each year
The largest share of opioid-related medication errors reported each year in Pennsylvania
related to those that reached the patient but did not result in harm Of these no-harm
events reaching the patient about one in four required monitoring andor intervention to
preclude the harm
National Healthcare Quality and Disparities Report | 19
Patient Safety
20 | National Healthcare Quality and Disparities Report
Although small in number reports of unsafe conditions increased from 43 (175) of
total opioid-related medication error reports in 2006 to 9 (330) in 2014 Reports of
unsafe conditions and near misses can provide important learning opportunities for
preventing patient harm
Differences Between Groups Reports of opioid-related medication errors involving
pediatric patients increased nearly fourfold from 192 (47) in 2006 to 662 (18) in 2014
During the same period reports of opioid-related medication errors involving older adult
patients decreased from nearly 40 of the total to less than 30
Patient Safety in the Nursing Home Setting
More than 3 million people receive care in US nursing homes and skilled nursing facilities
each year (CDC 2015)
For nursing home residents optimal care seeks to maximize quality of life and minimize
unintended complications
Measures tracked for patients of various age ranges include
Nursing home residents with urinary tract infections
Nursing home residents experiencing use of restraints
Nursing home residents who have pressure ulcers
Nursing home residents who had a fall with major injury
Nursing home residents who received antipsychotic medication
Urinary Tract Infections
Long-stay nursing home residents experiencing urinary tract infections by sex and raceethnicity 2011-2013
Source Centers for Medicare amp Medicaid Services Minimum Data Set 2011-2013
DenominatorNursing home residents of any age w ho have at least 101 cumulative days in the facility
Note For this measure low er percentages are better The measure w as calculated as follows Percentage of long-stay residents with a urinary
tract infection w ithin the 30 days prior to assessment White Black and Asian are non-Hispanic Hispanic includes all races
0
2
4
6
8
10
2011 2012 2013
Pe
rce
nt
Total Male Female
2011 Achievable
Benchmark 61
0
2
4
6
8
10
2011 2012 2013
Pe
rce
nt
White Black Asian Hispanic
2011 Achievable
Benchmark 61
Long-stay nursing home residents experiencing urinary tract infections by sex and raceethnicity 2011-2013
Source Centers for Medicare amp Medicaid Services Minimum Data Set 2011-2013
DenominatorNursing home residents of any age w ho have at least 101 cumulative days in the facilityNote For this measure low er percentages are better The measure w as calculated as follows Percentage of long-stay residents with a urinary
tract infection w ithin the 30 days prior to assessment White Black and Asian are non-Hispanic Hispanic includes all races
0
2
4
6
8
10
2011 2012 2013
Pe
rce
nt
Total Male Female
2011 Achievable
Benchmark 61
0
2
4
6
8
10
2011 2012 2013
Pe
rce
nt
White Black Asian Hispanic
2011 Achievable
Benchmark 61
Patient Safety
Importance Bacteria that cause urinary tract infections (UTIs) can spread to other body
parts and become more serious or contribute to further complications such as delirium
Overall Percentage In 2013 the percentage of long-stay nursing home residents with a UTI
was 64
Groups With Disparities
In 2013 compared with males (51) the percentage with UTIs was worse for females
(7)
In 2013 compared with White residents (68) the percentage of residents with UTIs
was lower for Blacks and Asians (47) as well as Hispanics (54)
Achievable Benchmark
In 2011 the top 5 State achievable benchmark for UTIs was 61 The States that
contributed to the achievable benchmark are Connecticut Hawaii Minnesota North
Dakota and Pennsylvania
Males Blacks Asians and Hispanics have achieved the benchmark
Use of Restraints
00
05
10
15
20
25
30
35
40
2011 2012 2013
Pe
rce
nt
White Black Asian Hispanic
00
05
10
15
20
25
30
35
40
2011 2012 2013
Pe
rce
nt
Total 0-64 65-74 75-84 85+
2011 Achievable
Benchmark 07
Long-stay nursing home residents experiencing use of restraints by age and raceethnicity 2011-2013
Source Centers for Medicare amp Medicaid Services Minimum Data Set 2011-2013
Denominator Nursing home residents of any age who have at least 101 cumulative days in the facility
Note For this measure lower percentages are better The measure was calculated as follows Percentage of long-stay residents who are
physically restrained on a daily basis
2011 Achievable
Benchmark 07
00
05
10
15
20
25
30
35
40
2011 2012 2013
Pe
rce
nt
White Black Asian Hispanic
00
05
10
15
20
25
30
35
40
2011 2012 2013
Pe
rce
nt
Total 0-64 65-74 75-84 85+
2011 Achievable
Benchmark 07
Long-stay nursing home residents experiencing use of restraints by age and raceethnicity 2011-2013
Source Centers for Medicare amp Medicaid Services Minimum Data Set 2011-2013
Denominator Nursing home residents of any age who have at least 101 cumulative days in the facility
Note For this measure lower percentages are better The measure was calculated as follows Percentage of long-stay residents who are
physically restrained on a daily basis
2011 Achievable
Benchmark 07
National Healthcare Quality and Disparities Report | 21
Patient Safety
Importance Residents who are restrained daily can become weak lose their ability to go to
the bathroom by themselves and develop pressure ulcers or other medical conditions
Overall Percentage In 2013 the percentage of long-stay nursing home residents who were
physically restrained on a daily basis was 14
Groups With Disparities
In 2011 2012 and 2013 the percentage of residents with restraint use on a daily basis
was lower for those ages 65-74 years compared with those under age 65 In 2013 the
percentage of residents ages 65-74 years experiencing use of restraints was 12
compared with 16 for residents younger than 65
In 2013 compared with Whites (14) Asians (2) and Hispanics (18) had worse
percentages of daily restraint use and Blacks (12) had a better percentage of daily
restraint use
Achievable Benchmark
In 2011 the top 5 State achievable benchmark for restraint use was 07 The States that
contributed to the achievable benchmark are Kansas Maine Nebraska New Hampshire
and Vermont
No group achieved the benchmark from 2011 to 2013
Pressure Ulcers
Low-risk short-stay and high-risk long-stay nursing home residents who have pressure ulcers by sex 2011-2013
Source Centers for Medicare amp Medicaid Services Minimum Data Set 2011-2013
Denominator Low-risk short-stay Nursing home residents of any age who have 100 or fewer cumulative days in the facility and are active can
change positions and are getting the nutrients they need to maintain good skin health High-risk long-stay Nursing home residents of any age
who have at least 101 cumulative days in the facility and are in a coma do not get the nutrients needed to maintain good skin health or cannot
change position on their own
Note For this measure lower percentages are better
0
2
4
6
8
10
12
2011 2012 2013
Pe
rce
nt
Low-Risk Short StayTotal Male Female
2011 Achievable Benchmark10
0
2
4
6
8
10
12
2011 2012 2013
Pe
rce
nt
High-Risk Long StayTotal Male Female
2008 Achievable Benchmark 71
Low-risk short-stay and high-risk long-stay nursing home residents who have pressure ulcers by sex 2011-2013
Source Centers for Medicare amp Medicaid Services Minimum Data Set 2011-2013
Denominator Low-risk short-stay Nursing home residents of any age who have 100 or fewer cumulative days in the facility and are active can
change positions and are getting the nutrients they need to maintain good skin health High-risk long-stay Nursing home residents of any age
who have at least 101 cumulative days in the facility and are in a coma do not get the nutrients needed to maintain good skin health or cannot
change position on their own
Note For this measure lower percentages are better
0
2
4
6
8
10
12
2011 2012 2013
Pe
rce
nt
Low-Risk Short StayTotal Male Female
2011 Achievable Benchmark10
0
2
4
6
8
10
12
2011 2012 2013
Pe
rce
nt
High-Risk Long StayTotal Male Female
2008 Achievable Benchmark 71
22 | National Healthcare Quality and Disparities Report
Patient Safety
Importance Pressure ulcers are serious medical conditions They typically result from
prolonged periods of uninterrupted pressure on the skin soft tissue muscle and bone
Vulnerable patients include older adults stroke and diabetic patients patients with dementia
circulatory diseases dehydration and malnutrition and people who use wheelchairs or are
bedriddenmdashthat is any patient with impaired mobility or sensation
Overall Percentage In 2013 the percentage of low-risk short-stay residents with pressure
ulcers was 13 and the percentage of high-risk long-stay residents with pressure ulcers was
77
Groups with Disparities
As in 2011 and 2012 male low-risk short-stay nursing home residents had a worse
percentage with pressure ulcers (15) compared with female residents (12) in 2013
As in 2011 and 2012 male high-risk long-stay nursing home residents had a worse
percentage with pressure ulcers (94) compared with female residents (70) in 2013
Achievable Benchmark
The 2011 top 5 State achievable benchmark for low-risk short-stay nursing home residents was 10 The States that contributed to the benchmark were Alabama Arizona Colorado Connecticut and Idaho
The 2008 top 5 State achievable benchmark for high-risk long-stay nursing home residents was 71 The States that contributed to the benchmark were Hawaii Minnesota Nebraska New Hampshire and North Dakota
No low-risk short-stay residents achieved the benchmark from 2011 to 2013 Among
high-risk long-stay residents only females achieved the benchmark by 2013
National Healthcare Quality and Disparities Report | 23
Patient Safety
Falls
00
05
10
15
20
25
30
35
40
45
50
Pe
rce
nt
2012 2013
Long-stay nursing home residents who had a fall with major injury by sex age and raceethnicity 2012-2013
Source Centers for Medicare amp Medicaid Services Minimum Data Set 2012-2013
Denominator Nursing home residents of any age who have at least 101 cumulative days in the facility with one or more look-back scan
assessments except when the occurrence of falls or number of falls with major injury was not assessed in the look-back scan assessment
Note For this measure lower percentages are better White Black and Other are non-Hispanic Hispanic includes all races
2012 Achievable
Benchmark 22
00
05
10
15
20
25
30
35
40
45
50
Pe
rce
nt
2012 2013
Long-stay nursing home residents who had a fall with major injury by sex age and raceethnicity 2012-2013
Source Centers for Medicare amp Medicaid Services Minimum Data Set 2012-2013
Denominator Nursing home residents of any age who have at least 101 cumulative days in the facility with one or more look-back scan
assessments except when the occurrence of falls or number of falls with major injury was not assessed in the look-back scan assessment
Note For this measure lower percentages are better White Black and Other are non-Hispanic Hispanic includes all races
2012 Achievable
Benchmark 22
Importance Nursing home residents who experience falls resulting in major injuries are at
higher risk of death and disability as well as emotional trauma that can affect functional
abilities and social well-being
Overall Percentage In 2013 the percentage of long-stay nursing home residents who had a
fall with a major injury was 34
Groups With Disparities
In 2013 female nursing home residents had a worse percentage of falls (38) compared
with male residents (25)
In 2013 the percentage of falls with major injury was worse for all subgroups of
residents age 65 years and over compared with their younger counterparts The
percentage for residents under 65 years old was 17 compared with 26 for ages 65shy
74 years 34 for ages 75-84 years and 41 for 85 years and over
Also in 2013 compared with Whites (38) the percentage of falls with major injury
was better for Black (13) Other (22) and Hispanic (24) residents
24 | National Healthcare Quality and Disparities Report
Patient Safety
National Healthcare Quality and Disparities Report | 25
Achievable Benchmark
The 2012 top 5 State achievable benchmark for falls with major injury was 22 The
States that contributed to the achievable benchmark are Alaska California District of
Columbia Hawaii and New Jersey The benchmark was achieved by Black residents and those ages 0-64 years
Antipsychotic Medication Among Nursing Home Residents
Importance The high use of antipsychotic medications among nursing home residents for
indications other than those for which the drug was approved has been noted by the Federal
Government These drugs are often used for too long at too high a dose or when
unnecessary In the past inappropriate prescribing of antipsychotics in nursing homes has
primarily been considered a marker of suboptimal care Recent studies have shown
antipsychotic use is also a drug safety issue (Huybrechts et al 2012) Antipsychotic
medication use is associated with increased risks of adverse events such as movement
disorders falls hip fractures and cerebrovascular events Their use in older adults with
dementia carries an increased risk of death Safety concerns with antipsychotic medication
use in older adults also include the risks of hyperprolactinemia pneumonia
0
5
10
15
20
25
30
Percent
2012 2013
Adult long-stay nursing home residents who received antipsychotic medication by raceethnicity and number of chronic conditions 2012-2013
Key NHOPI = Native Hawaiian or Other Pacific Islander AIAN = American Indian or Alaska Native
Source Centers for Medicare amp Medicaid Services Minimum Data Set 2012-2013
Denominator Nursing home residents of any age who have at least 101 cumulative days in the facility excluding residents with schizophrenia
Tourettersquos syndrome and Huntingtonrsquos disease
Numerator Subset of denominator that receives an antipsychotic medication
Note For this measure lower percentages are better
2012 Achievable
Benchmark 150
0
5
10
15
20
25
30
Percent
2012 2013
Adult long-stay nursing home residents who received antipsychotic medication by raceethnicity and number of chronic conditions 2012-2013
Key NHOPI = Native Hawaiian or Other Pacific Islander AIAN = American Indian or Alaska Native
Source Centers for Medicare amp Medicaid Services Minimum Data Set 2012-2013
Denominator Nursing home residents of any age who have at least 101 cumulative days in the facility excluding residents with schizophrenia
Tourettersquos syndrome and Huntingtonrsquos disease
Numerator Subset of denominator that receives an antipsychotic medication
Note For this measure lower percentages are better
2012 Achievable
Benchmark 150
Patient Safety
26 | National Healthcare Quality and Disparities Report
thromboembolism cerebrovascular events and other cardiovascular adverse events (Chiu et
al 2015)
Overall Percentage The percentage of long-stay nursing home residents who had
antipsychotic medications was 176 in 2013
Groups With Disparities
In 2013 the percentage of residents receiving antipsychotic medication was higher for
Hispanic residents (201) than for White residents (180)
In 2012 and 2013 the percentage of long-stay residents who received antipsychotic
medications was worse for residents with one or more chronic conditions than for
residents with no chronic conditions
Achievable Benchmark
The 2012 top 6 State achievable benchmark was 150 The States that contributed to the
achievable benchmark are Alaska California Hawaii Michigan New Jersey and
Wyoming Asians NHOPIs residents with no chronic conditions and residents with one chronic
condition achieved the benchmark
Antipsychotic Medication Among Nursing Home Residents by State
Long-stay nursing home residents who received antipsychotic medication by State 2013
Source Centers for Medicare amp Medicaid Services Minimum Data Set 2013
Denominator Nursing home residents of any age who have at least 101 cumulative days in the facility
Note For this measure lower percentages are better
AZ
CA
UT
CT
FL
GA
IA
IL
KS
MA
MDMO
NJ
NY
OR
PA
SC
TN
CO
WA
WI
VA
ME
MN
MI
NC
TX
KY
WV
RI
NE
VT
NV OH
SD
AR
IN
NH
MT
ID
WY
ND
NMOK
LA
MS AL
DE
AKAK
HI
DC
85-153 (1st Quartile)
154-173 (2nd Quartile)
No Data
174-192 (3rd Quartile)
PR193-234 (4th Quartile)
Long-stay nursing home residents who received antipsychotic medication by State 2013
Source Centers for Medicare amp Medicaid Services Minimum Data Set 2013
Denominator Nursing home residents of any age who have at least 101 cumulative days in the facility
Note For this measure lower percentages are better
AZ
CA
UT
CT
FL
GA
IA
IL
KS
MA
MDMO
NJ
NY
OR
PA
SC
TN
CO
WA
WI
VA
ME
MN
MI
NC
TX
KY
WV
RI
NE
VT
NV OH
SD
AR
IN
NH
MT
ID
WY
ND
NMOK
LA
MS AL
DE
AKAK
HI
DC
85-153 (1st Quartile)
154-173 (2nd Quartile)
No Data
174-192 (3rd Quartile)
PR193-234 (4th Quartile)
Patient Safety
Overall This map shows overall rankings of States (by quartiles) in the percentage of long-
stay nursing home residents who received antipsychotic medication in 2013 Values ranged
from 85 to 234
Differences by State Interquartile ranges follow
First quartile (lowest) 85-153 (AK CA DC DE HI MD MI MN NJ NC SC
WI WV)
Second quartile (second lowest) 153 -173 (CO ID MT NM NY ND OR PA
RI SD VT WA WY)
Third quartile (second highest) 174-192 (AZ CT GA IN IA KS ME MA MO
NV OH OK VA)
Fourth quartile (highest) 193-234 (AL AR FL IL KY LA MS NE NH TN
TX UT)
Eight of the 12 States in the quartile with the highest percentage of long-stay nursing
home residents who received antipsychotic medication were in the South
Patient Safety in the Home Health Setting
Home health agencies provide services to beneficiaries who are homebound and need skilled
nursing care or therapy
Approximately 12 million individuals receive home health care from more than 33000
providers for causes including acute illness long-term health conditions permanent
disability or terminal illness (NAHCH 2010)
Improvements among home health patients can reflect the quality of care from home health
agencies
Measures include
Home health patients with improvement in surgical wounds
Home health patients with improvements in their ability to take medications orally
National Healthcare Quality and Disparities Report | 27
Patient Safety
Improvement in Surgical Wounds
75
80
85
90
95
100
2010 2011 2012 2013
Pe
rce
nt
White Black Asian Hispanic
75
80
85
90
95
100
2010 2011 2012 2013
Pe
rce
nt
Total 0-64 65-74
75-84 85+
2011 Achievable
Benchmark 913
Home health patients with improvement in surgical wounds by age and raceethnicity 2010-2013
Source Centers for Medicare amp Medicaid Services Outcome and Assessment Information Set 2010-2013
Denominator Number of home health episodes during the measurement period in which the patient of any age had a surgical wound and the
episode ended with the patient discharged from home health care
Note White Black and Asian are non-Hispanic Hispanic includes all races
2011 Achievable
Benchmark 913
75
80
85
90
95
100
2010 2011 2012 2013
Per
cen
t
White Black Asian Hispanic
75
80
85
90
95
100
2010 2011 2012 2013
Per
cen
t
Total 0-64 65-74
75-84 85+
2011 Achievable
Benchmark 913
Home health patients with improvement in surgical wounds by age and raceethnicity 2010-2013
Source Centers for Medicare amp Medicaid Services Outcome and Assessment Information Set 2010-2013
Denominator Number of home health episodes during the measurement period in which the patient of any age had a surgical wound and the
episode ended with the patient discharged from home health care
Note White Black and Asian are non-Hispanic Hispanic includes all races
2011 Achievable
Benchmark 913
Importance Normal wound healing after an operation is an important marker of good care
The home health team should regularly change wound dressing and teach the patient about
wound care
Overall Percentage In 2013 the percentage of home health patients with improvement in
their surgical wounds was 890
Trends The percentage of health home patients with surgical wound improvement increased
between 2010 and 2013
Groups With Disparities
In 2013 compared with residents under age 65 years (856) all other age groups had
better percentages of improvement in surgical wounds The percentage was 893 for
ages 65-74 905 for ages 75-84 and 917 for ages 85 and over
In 2013 compared with Whites (893) Blacks (878) Asians (882) and Hispanics
(874) had worse percentages of improvement in surgical wounds
The 2010 through 2013 trend in the percent of home health patients with surgical wound
improvement did not change for those over age 65 relative to persons under age 65 years
28 | National Healthcare Quality and Disparities Report
Patient Safety
Achievable Benchmark
The 2011 top 5 State achievable benchmark was 913 The States that contributed to the
benchmark are Alabama Mississippi Nevada Oklahoma and South Carolina
Home health patients age 85 years and over achieved the benchmark for surgical wound
improvement in 2013
At the current rate of progress patients ages 75-84 years could reach the benchmark
within a year Patients ages 65-74 years could achieve the benchmark in approximately 2
years
White home health patients could achieve the benchmark in approximately 2 years
Improvement in Ability To Take Medication Orally
0
20
40
60
80
100
2010 2011 2012 2013
Per
cen
t
White Black Asian Hispanic
0
20
40
60
80
100
2010 2011 2012 2013
Per
cen
t
Total 0-64 65-74
75-84 85+
2008 Achievable
Benchmark 516
Home health patients with improvement in their ability to take medications orally by age and raceethnicity 2010-2013
Source Centers for Medicare amp Medicaid Services Outcome and Assessment Information Set 2010-2013
Denominator Number of home health care episodes in which a patient of any age was unable to take oral medications independently at the
start of the episode that ended during the measurement period
Note White Black and Asian are non-Hispanic Hispanic includes all races
2008 Achievable
Benchmark 516
0
20
40
60
80
100
2010 2011 2012 2013
Per
cen
t
White Black Asian Hispanic
0
20
40
60
80
100
2010 2011 2012 2013
Per
cen
t
Total 0-64 65-74
75-84 85+
2008 Achievable
Benchmark 516
Home health patients with improvement in their ability to take medications orally by age and raceethnicity 2010-2013
Source Centers for Medicare amp Medicaid Services Outcome and Assessment Information Set 2010-2013
Denominator Number of home health care episodes in which a patient of any age was unable to take oral medications independently at the
start of the episode that ended during the measurement period
Note White Black and Asian are non-Hispanic Hispanic includes all races
2008 Achievable
Benchmark 516
Importance Taking medications correctly is important to the health status and quality of life
of individuals living in the community The home health team can help teach a patient ways
to organize drugs and take them properly
Overall Percentage In 2013 the percentage of home health patients with improvement in
their ability to take medications orally was 513
Trends Between 2010 and 2013 there was improvement in the overall percentage of home
health patients with improved ability to take medications orally
National Healthcare Quality and Disparities Report | 29
Patient Safety
Groups With Disparities
In 2013 the percentage of home health patients with improvement in their ability to take
medications orally was worse for those age 85 years and over (398) compared with
those under age 65 years (577)
The percentage of patients with improvement in their ability to take medications orally
was worse among Hispanic home health patients (400) than among White patients
(526) in 2013
From 2010 to 2013 the gap between Blacks and Whites decreased and the gap between
Asians and Whites and Hispanics and Whites increased
Achievable Benchmark
The 2008 top 5 State achievable benchmark was 516 The States that contributed to the
achievable benchmark are Iowa Massachusetts New Jersey North Dakota and South
Carolina
The benchmark was achieved among age groups under 85 years and by White and Black
home health patients
The total population is estimated to reach the benchmark in less than a year Hispanic
patients and patients age 85 years and over are farthest from the benchmark
Improvement in Ability To Take Medication Orally by State
Home health patients with improvement in their ability to take medications orally by raceethnicity by State 2013
Source Centers for Medicare amp Medicaid Services Outcome and Assessment Information Set 2013
Denominator Number of home health care episodes in which a patient of any age was unable to take oral medications independently at the
start of the episode that ended during the measurement period
AZ
CA
UT
CT
FL
GA
IA
IL
KS
MA
MDMO
NJ
NY
OR
PA
SC
TN
CO
WA
WI
VA
ME
MN
MI
NC
TX
KY
WV
RI
NE
VT
NV OH
SD
AR
IN
NH
MT
ID
WY
ND
NMOK
LA
MS AL
DE
AKAK
HI
No significant difference between rates
of Hispanics and non-Hispanic Whites
Non-Hispanic Whites have significantly
worse rate than Hispanics
States do not have data that meet the
criteria for statistical reliability data
quality or confidentiality
Hispanics have significantly worse rate
than non-Hispanic Whites
DC
Home health patients with improvement in their ability to take medications orally by raceethnicity by State 2013
Source Centers for Medicare amp Medicaid Services Outcome and Assessment Information Set 2013
Denominator Number of home health care episodes in which a patient of any age was unable to take oral medications independently at the
start of the episode that ended during the measurement period
AZ
CA
UT
CT
FL
GA
IA
IL
KS
MA
MDMO
NJ
NY
OR
PA
SC
TN
CO
WA
WI
VA
ME
MN
MI
NC
TX
KY
WV
RI
NE
VT
NV OH
SD
AR
IN
NH
MT
ID
WY
ND
NMOK
LA
MS AL
DE
AKAK
HI
No significant difference between rates
of Hispanics and non-Hispanic Whites
Non-Hispanic Whites have significantly
worse rate than Hispanics
States do not have data that meet the
criteria for statistical reliability data
quality or confidentiality
Hispanics have significantly worse rate
than non-Hispanic Whites
DC
30 | National Healthcare Quality and Disparities Report
Patient Safety
Geographic Variation
In 2013 Hispanic home health patients had worse rates of improvement in taking oral
medications than non-Hispanic White patients in 11 States (Arizona California
Connecticut Florida Illinois Indiana Massachusetts Nevada New York North
Carolina and Texas
Non-Hispanic White patients had worse rates of improvement than Hispanic patients in
five States (Hawaii Idaho Iowa Michigan and Pennsylvania)
Patient Safety in the Ambulatory Setting
Although patient safety initiatives frequently focus on inpatient hospital events adverse
effects of medical care may be identified and treated in outpatient settings
Adverse effects of medical care can follow care or procedures in hospitals emergency
departments physician offices or other settings
Measures include
Patient safety and quality issues by frequency of occurrence in outpatient medical offices
Adults age 65 years and over who received potentially inappropriate prescription medications during the calendar year
Percentage of hemodialysis patients with vascular catheter in use for 90 days or longer
For more information see the PSNet link to Patient Safety Primer Patient Safety in
Ambulatory Care httpspsnetahrqgovprimersprimer16patient-safety-in-ambulatory-care
National Healthcare Quality and Disparities Report | 31
Patient Safety
Patient Safety and Quality Issues
Patient safety and quality issues by frequency of occurrence in outpatient medical offices 2014
Source Westat analysis of the AHRQ 2014 Medical Office Survey on Patient Safety Culture Comparative Database (N=935)
Note For this measure less frequent occurrences during the year are better
0
20
40
60
80
100
A pharmacy contactedour office to clarify orcorrect a prescription
A patient was unableto get an appointmentwithin 48 hours for anacuteserious problem
A patients medicationlist was not updatedduring his or her visit
The results from a labor imaging test were notavailable when needed
A patients chartmedicalrecord was not available
when needed
Occurred DailyWeekly
Occurred Monthly
Occurred Not at All to Several Times Over the Past Year
Patient safety and quality issues by frequency of occurrence in outpatient medical offices 2014
Source Westat analysis of the AHRQ 2014 Medical Office Survey on Patient Safety Culture Comparative Database (N=935)
Note For this measure less frequent occurrences during the year are better
0
20
40
60
80
100
A pharmacy contactedour office to clarify orcorrect a prescription
A patient was unableto get an appointmentwithin 48 hours for anacuteserious problem
A patients medicationlist was not updatedduring his or her visit
The results from a labor imaging test were notavailable when needed
A patients chartmedicalrecord was not available
when needed
Occurred DailyWeekly
Occurred Monthly
Occurred Not at All to Several Times Over the Past Year
Importance Most health care takes place in the outpatient or ambulatory care setting Lack
of access to care and lack of access to timely and accurate medical information and test
results may contribute to patient safety events such as missed or delayed diagnoses
medication errors failure to order appropriate diagnostic or laboratory tests incorrect
interpretation of tests and inadequate followup on results
Overall Percentage
Almost 30 of medical offices participating in the survey reported daily or weekly
occurrences of being contacted by the pharmacist for clarification or correction on a
prescription
After prescription clarifications or corrections by the pharmacy medical offices were
next most likely to report daily or weekly issues with patients being unable to get an
appointment within 48 hours for an acute or serious problem (14) or the patientrsquos
medication list not getting updated during their visit (11)
The share of medical offices reporting that lab or imaging tests were not available when
needed reached nearly 20 when considering monthly occurrences as well as those that
occurred more frequently
32 | National Healthcare Quality and Disparities Report
Patient Safety
Potentially Inappropriate Prescriptions for Older Adults
Adults age 65 years and over who received potentially inappropriate prescription medications during the calendar year by sex and
perceived health status 2003ndash2013
Source Agency for Healthcare Research and Quality Medical Expenditure Panel Survey 2003-2013
Note For this measure lower percentages are better Prescription medications received include all prescribed medications initiall y purchased
or otherwise obtained as well as any refills For more information on inappropriate medications see the American Geriatrics Society 2012 Beers
Criteria Update Expert Panel American Geriatrics Society updated Beers Criteria for potentially inappropriate medication use in older adults J
Am Geriatr Soc 2012 Apr60(4)616-31
0
5
10
15
20
25
30
Per
cen
t
Total Male Female
0
5
10
15
20
25
30
Per
cen
t
ExcellentVery GoodGood FairPoor
Adults age 65 years and over who received potentially inappropriate prescription medications during the calendar year by sex and
perceived health status 2003ndash2013
Source Agency for Healthcare Research and Quality Medical Expenditure Panel Survey 2003-2013
Note For this measure lower percentages are better Prescription medications received include all prescribed medications initially purchased
or otherwise obtained as well as any refills For more information on inappropriate medications see the American Geriatrics Society 2012 Beers
Criteria Update Expert Panel American Geriatrics Society updated Beers Criteria for potentially inappropriate medication use in older adults J
Am Geriatr Soc 2012 Apr60(4)616-31
0
5
10
15
20
25
30
Per
cen
t
Total Male Female
0
5
10
15
20
25
30
Per
cen
t
ExcellentVery GoodGood FairPoor
Importance Some drugs that are prescribed for older patients are known to be potentially
harmful for this age group
Overall Percentage In 2013 the percentage of adults age 65 years and over who received
potentially inappropriate prescription medications was 114
Trends From 2003 to 2013 the percentage of adults age 65 years and over who received
potentially inappropriate prescription medications improved overall for both sexes and for
people with excellentvery goodgood health status and people with fairpoor health status
Groups With Disparities
In all years the percentage of patients receiving potentially inappropriate medications
was higher among females compared with males This gap was not changing over time
In all years from 2003 to 2013 the percentage of patients receiving potentially
inappropriate medications was higher among people with fairpoor health status
compared with people with excellentgood health status This gap was not changing over
time
National Healthcare Quality and Disparities Report | 33
Patient Safety
Long-Term Catheter Use in Dialysis Patients
HI
AKAK
AZ
CA
UT
CT
FL
GA
IA
IL
KS
MA
MDMO
NJ
NY
OR
PA
SC
TN
CO
WA
WI
VA
ME
MN
MI
NC
TX
KY
WV
RI
NE
VT
NV OH
SD
AR
IN
NH
MT
ID
WY
ND
NMOK
LA
MSAL
DE
DC
10-12
13-18
7-9
PR
Source Centers for Medicare and Medicaid Services Dialysis Facility Compare 2014
Denominator At-risk adult Medicare patients with a central venous catheter who were receiving regular hemodialysis treatments at dialysis
facilities
Note For this measure lower percentages are better
Percentage of hemodialysis patients with central venous catheters used for vascular access for 90 days or longer by State 2014
HI
AKAK
AZ
CA
UT
CT
FL
GA
IA
IL
KS
MA
MDMO
NJ
NY
OR
PA
SC
TN
CO
WA
WI
VA
ME
MN
MI
NC
TX
KY
WV
RI
NE
VT
NV OH
SD
AR
IN
NH
MT
ID
WY
ND
NMOK
LA
MSAL
DE
DC
10-12
13-18
7-9
PR
Source Centers for Medicare and Medicaid Services Dialysis Facility Compare 2014
Denominator At-risk adult Medicare patients with a central venous catheter who were receiving regular hemodialysis treatments at dialysis
facilities
Note For this measure lower percentages are better
Percentage of hemodialysis patients with central venous catheters used for vascular access for 90 days or longer by State 2014
Importance Central venous catheters are frequently used for vascular access to dialysis
patients until a fistula or graft is formed Central venous catheters have higher rates of
infection and adverse events among patients receiving dialysis treatment compared with
other forms of vascular access To decrease the likelihood of adverse events catheters should
be used for less than 90 days
Overall Percentage Nationally an average of 10 of dialysis patients used central venous
catheters for 90 days or longer in 2014
Geographic Variation In 2014 Alabama and Kansas had the lowest percentages of dialysis
patients using central venous catheters for 90 days or longer (7) and Puerto Rico had the
highest percentage (18) of long-term catheter use
Patient Safety Infrastructure
Efforts to improve patient safety have been accompanied by various infrastructure
enhancements
Growth in patient safety organizations which assist providers in detecting and reducing
risks and hazards from care delivery that may lead to patient harm
System improvement initiatives at the Veterans Health Administration (VHA)
34 | National Healthcare Quality and Disparities Report
Patient Safety
Development of the National Practitioner Data Bank a clearinghouse for information on
medical malpractice payments
Patient Safety Organizations
Patient safety organizations (PSOs) aim to reduce preventable adverse events near misses
and unsafe conditions in all health care settings
PSOs provide an environment for health care providers to voluntarily report discuss and
learn from patient safety events and quality analyses on a privileged and confidential basis
Measures include
Number of PSOs serving each State
Variation in concentrations of compounded liquid medications for children
Patient Safety Organizations AHRQ Common Formats
AHRQ Common Formats provide a standardized method for PSOs health care providers
and other organizations to collect and report patient safety events
Data element standards are important for aggregating and analyzing events across
providers
AHRQ Common Formats have been developed for a variety of settings of care
Acute care hospitals
Skilled nursing facilities
Retail pharmacy
More information is available at httpspsoahrqgovcommon
National Healthcare Quality and Disparities Report | 35
Patient Safety
Number of Patient Safety Organizations
AZ (2)
CA (3)
UT (2)
CT(3)
FL (8)
GA (5)
IA (4)
IL (7)
KS (5)
MA(3)
MD (4)MO(2)
NJ(3)
NY (5)
OR (3)
PA (5)
SC (4)
TN (5)
CO (2)
WA (2)
WI (5)
VA (7)
ME(2)
MN(3)
MI (3)
NC (7)
TX (6)
KY (4)WV (3)
RI(2)
NE (2)
VT(2)
NV (2)
OH (2)
SD (1)
AR (4)
IN (2)
NH(2)
MT (2)
ID (3)
WY (2)
ND (1)
NM (3)OK (2)
LA (1)
MS (2)
AL (2)
DE(2)
HI (2)
AKAK (2)
DC(3)
PR (0)
1-2
3-4
5-6
7-8
Number of PSOs
excluding PSOs
operating nationally
Number of Patient Safety Organizations by area served 2014
Source Agency for Healthcare Research and Quality Patient Safety Organization Information Form Calendar Year 2014 and PSO-PPC
Contact Database
Note PSOs included in this map were AHRQ-listed during any part of 2014 and submitted the PSO Profile to the PSO Privacy Protection
Center (PSO-PPC) in early 2015 A PSO may have members in one or more States regardless of headquarters location Each State shows the
number of PSOs that serve that State map excludes 38 PSOs that are available to providers in all States
AZ (2)
CA (3)
UT (2)
CT(3)
FL (8)
GA (5)
IA (4)
IL (7)
KS (5)
MA(3)
MD (4)MO(2)
NJ(3)
NY (5)
OR (3)
PA (5)
SC (4)
TN (5)
CO (2)
WA (2)
WI (5)
VA (7)
ME(2)
MN(3)
MI (3)
NC (7)
TX (6)
KY (4)WV (3)
RI(2)
NE (2)
VT(2)
NV (2)
OH (2)
SD (1)
AR (4)
IN (2)
NH(2)
MT (2)
ID (3)
WY (2)
ND (1)
NM (3)OK (2)
LA (1)
MS (2)
AL (2)
DE(2)
HI (2)
AKAK (2)
DC(3)
PR (0)
1-2
3-4
5-6
7-8
Number of PSOs
excluding PSOs
operating nationally
Number of Patient Safety Organizations by area served 2014
Source Agency for Healthcare Research and Quality Patient Safety Organization Information Form Calendar Year 2014 and PSO-PPC
Contact Database
Note PSOs included in this map were AHRQ-listed during any part of 2014 and submitted the PSO Profile to the PSO Privacy Protection
Center (PSO-PPC) in early 2015 A PSO may have members in one or more States regardless of headquarters location Each State shows the
number of PSOs that serve that State map excludes 38 PSOs that are available to providers in all States
Importance All patient safety organizations (PSOs) have authority to operate in all 50
States and US territories but not all do In 2014 38 PSOs self-reported being available to
providers nationally PSOs not available nationally serve specific States
Geographic Variation
Nearly all States have at least 2 PSOs available to providers in their State in addition to
the 38 national PSOs that serve all States
Florida has the most PSOs available with 8 in addition to the 38 nationally available
PSOs The States with the largest number of PSOs available are generally on the East
Coast (eg North Carolina Virginia New York Pennsylvania Tennessee Georgia) or
have large populations (eg Texas Illinois)
North Dakota South Dakota and Louisiana are the only states with just one PSO serving
their State in addition to the 38 national PSOs
Puerto Rico is served by one national PSO only
36 | National Healthcare Quality and Disparities Report
Patient Safety
Compounded Liquid Medications for Children
Compounded liquid medications for children in Michigan 2012
Source Levy S Buckley B Safe Table Success The MI Pediatric Safety Collaboration Presentation presented at the 7th Annual
Meeting of Patient Safety Organizations (PSOs) Rockville MD 2015 April and Rood JM Engels MJ Ciarkowski SL et al Variability in
compounding of oral liquids for pediatric patients a patient safety concern J Am Pharm Assn 201454(4)383-9
Note Information represents 244 responses to online survey of approximately 2000 Michigan pharmacies conducted in June 2012 by
The University of Michigan College of Pharmacy in collaboration with the Michigan Pharmacists Association
0
10
20
30
40
50
1 2 3 4 5 6 7 8 9
Nu
mb
er o
f D
rugs
Number of Unique Concentrations
Number of Different Compounded Concentrations per Drug
0
10
20
30
40
50
No Harm No Harm ButMonitoring
TemporaryHarm
Pe
rce
nt
Compounding Errors by Related Harm and Pharmacy Setting
Inpatient Outpatient
Compounded liquid medications for children in Michigan 2012
Source Levy S Buckley B Safe Table Success The MI Pediatric Safety Collaboration Presentation presented at the 7th Annual
Meeting of Patient Safety Organizations (PSOs) Rockville MD 2015 April and Rood JM Engels MJ Ciarkowski SL et al Variability in
compounding of oral liquids for pediatric patients a patient safety concern J Am Pharm Assn 201454(4)383-9
Note Information represents 244 responses to online survey of approximately 2000 Michigan pharmacies conducted in June 2012 by
The University of Michigan College of Pharmacy in collaboration with the Michigan Pharmacists Association
0
10
20
30
40
50
1 2 3 4 5 6 7 8 9
Nu
mb
er o
f D
rugs
Number of Unique Concentrations
Number of Different Compounded Concentrations per Drug
0
10
20
30
40
50
No Harm No Harm ButMonitoring
TemporaryHarm
Per
cen
t
Compounding Errors by Related Harm and Pharmacy Setting
Inpatient Outpatient
Importance
Liquid medications are widely used in pediatrics because many children find it difficult
to swallow tablets or capsules If not commercially manufactured these liquid
medications require a pharmacist to compound them to the correct dosage for the patient
This practice of compounding has led to a variety of medication concentrations in use In
the absence of standard concentrations for compounded medications there is a risk that
children may accidentally receive medications that are too potent and can be dangerous
or are too weak to be effective
The Michigan Health amp Hospital Association Keystone Center Patient Safety
Organization hosts five Pediatric Safe Tables each year Safe Tables provided a
confidential and legally protected environment to discuss challenges and improvement
strategies regarding inconsistent medication concentrations for compounded oral liquids
without fear of punitive action against them
National Healthcare Quality and Disparities Report | 37
Patient Safety
Overall Percentage
More than half (527) of drugs identified in the 2012 survey had 3 or more unique
concentrations dispensed to children across Michigan For example Rifampin used to
treat bacterial infections was reported to have 8 different concentrations dispensed to
patients
Nearly one-third (313) of reported errors caused temporary harm or required additional
monitoring despite no harm
Standardization of Compounded Liquid Medications
Source Michigan Health amp Hospital Association Keystone Center Patient Safety Organization and University of Michigan College of Pharmacy
State-Wide Initiative to Standardize the Compounding of Oral Liquids in Pediatrics
Standardization of compounded liquid medications for children in Michigan 2011
Issue identificationbull Hospitals attending PSO Pediatrics Safe
Table raise compounded medication concentrations as a major safety issue
bull Small focus group determines extent of problem
bull Michigan pharmacies are surveyed about baseline concentrations
Develop Interventionbull PSO Quarterly Safe Tables are held to
discuss cases and practicesbull Team develops recommendations for
standard concentrationsbull Consensus is achieved for frequently
compounded pediatric medications 470 formulations for 147 drug entities are reduced to 104 concentrations for 100 drugs
Practice changebull Toolkit is createdbull Standards are disseminated to Michigan
prescribers and pharmacies bull Standards are disseminated to PSO
members and Safe Table participants
Source Michigan Health amp Hospital Association Keystone Center Patient Safety Organization and University of Michigan College of Pharmacy
State-Wide Initiative to Standardize the Compounding of Oral Liquids in Pediatrics
Standardization of compounded liquid medications for children in Michigan 2011
Issue identificationbull Hospitals attending PSO Pediatrics Safe
Table raise compounded medication concentrations as a major safety issue
bull Small focus group determines extent of problem
bull Michigan pharmacies are surveyed about baseline concentrations
Develop Interventionbull PSO Quarterly Safe Tables are held to
discuss cases and practicesbull Team develops recommendations for
standard concentrationsbull Consensus is achieved for frequently
compounded pediatric medications 470 formulations for 147 drug entities are reduced to 104 concentrations for 100 drugs
Practice changebull Toolkit is createdbull Standards are disseminated to Michigan
prescribers and pharmacies bull Standards are disseminated to PSO
members and Safe Table participants
The Role of PSO Safe Tables Based on adverse medication events discussed in the
Michigan Health amp Hospital Association (MHA) Keystone Center Patient Safety
Organization (PSO) Safe Tables in July 2011 the Michigan Pediatric Safety Collaboration
was developed to further assess the scope of the problem and formulate a solution
The Collaborative The Michigan Pediatric Safety Collaboration includes individuals from
the University of Michigan College of Pharmacy the Michigan Pharmacists Association
(MPA) the Food and Drug Administration (FDA) and the MHA Keystone PSO
38 | National Healthcare Quality and Disparities Report
Patient Safety
Practice Change
As a result of the standardization effort 470 unique formulations for 147 drug entities
were reduced to 104 different concentrations for 100 drugs
The Michigan Pediatric Safety Collaboration developed a multistep process to implement
standards for compounding medications The MPA surveyed pharmacies in Michigan to
better define the nature and scope of the problem The PSO continued to act as convener
The result was the creation and dissemination of statewide standards for 120 frequently
compounded pediatric medications
Veterans Health Administration
The National Center for Patient Safety is part of the Veterans Health Administration the
Nationrsquos largest integrated health care system
Patient safety-related system improvement initiatives include
The Daily Planreg
Purchasing for Safety Initiative
Patient Safety Improvement Initiative
Patient safety improvement initiative The Daily Planreg at Veterans Affairs Medical Centers 2009
Source King BJ Mills PD Fore A et al The Daily Planreg including patients for safetys sake Nurs Manage 201243(3)15-8
0
10
20
30
40
50
Identified atleast one
error
Identifiederror
of omission
Identifiederror
ofcommission
Nurses Who Identified Errors in Patient Treatment Plan by Type
0
10
20
30
40
50
Patient founddiscrepancy inplanned care
Family founddiscrepancy inplanned care
Nursing Stafffound
discrepancyin plannedtreatment
Respondents Who Identified Errors or Discrepancies Through The Daily Plan reg
Patient safety improvement initiative The Daily Planreg at Veterans Affairs Medical Centers 2009
Source King BJ Mills PD Fore A et al The Daily Planreg including patients for safetys sake Nurs Manage 201243(3)15-8
0
10
20
30
40
50
Identified atleast one
error
Identifiederror
of omission
Identifiederror
ofcommission
Nurses Who Identified Errors in Patient Treatment Plan by Type
0
10
20
30
40
50
Patient founddiscrepancy inplanned care
Family founddiscrepancy inplanned care
Nursing Stafffound
discrepancyin plannedtreatment
Respondents Who Identified Errors or Discrepancies Through The Daily Plan reg
National Healthcare Quality and Disparities Report | 39
Patient Safety
Importance The Daily Planreg
is a two-page printed summary that acts as a schedule for
patients and providers each day It shows the procedures laboratory tests and medications
scheduled for that day and lists essential health information such as patientrsquos name allergies
and current medications It can be tailored for a patientrsquos needs by extracting orders from the
electronic medical record (EMR) The Daily Planreg
is intended to facilitate patient and family
engagement throughout the course of care The Daily Planreg
shows promise for improving
patient safety Since 2009 the VA has implemented The Daily Planreg
in more than 65
hospitals both inpatient and outpatient care settings The Daily Planreg
is shared more than
75000 times a month and the VA plans to continue the spread of The Daily Planreg
at
additional sites in 2016
Findings
As part of a pilot test in 2009 a total of 198 patients and 85 nurses responded to a survey
across 10 facilities Nurses had an average of 34 patients per shift who received The
Daily Planreg Patients responded about their own experiences whereas nurses reported
about all of their patients who received The Daily Planreg
Nearly half (475) of patients reported finding a discrepancy in planned care through
The Daily Planreg In addition 30 of patients reported that their family members found a
discrepancy Although not every discrepancy will be a potential medical error having a
shared understanding of the plan of care decreases the risk of error
More than one in six nurses (176) identified a discrepancy in treatment among their
patients through The Daily Planreg Most of these nurses (153) found one or more errors
of omission and a smaller share (106) of nurses found one or more errors of
commission some found both
40 | National Healthcare Quality and Disparities Report
Patient Safety
Issues Related to Ventilators
Common use-issues related to ventilators at the Veterans Health Administration 2006-2014 (combined)
Source Veterans Health Administration National Center for Patient Safety data collected October 2006 to October 2014
Note Examples of equipment failures include ventilator shutdown and other ventilator problems Ventilator settings include setup problems and
incorrect settings Support activities include space utilities and supplies Transport includes accidental extubation other transportation issues
and vehicle-related issues Alarms include alarm settings and alarm connection Training includes unknown ventilator model and other training
concerns
0
20
40
60
80
100
120
140
160
EquipmentFailure
VentilatorSettings
SupportActivities
Transport Alarms Training
Nu
mb
er o
f R
epo
rts
Common use-issues related to ventilators at the Veterans Health Administration 2006-2014 (combined)
Source Veterans Health Administration National Center for Patient Safety data collected October 2006 to October 2014
Note Examples of equipment failures include ventilator shutdown and other ventilator problems Ventilator settings include setup problems and
incorrect settings Support activities include space utilities and supplies Transport includes accidental extubation other transportation issues
and vehicle-related issues Alarms include alarm settings and alarm connection Training includes unknown ventilator model and other training
concerns
0
20
40
60
80
100
120
140
160
EquipmentFailure
VentilatorSettings
SupportActivities
Transport Alarms Training
Nu
mb
er o
f R
epo
rts
Importance Beginning with a focus on ventilators the Veterans Health Administrationrsquos
human factors-based Purchasing for Safety Initiative communicates the most common use-
issues associated with medical devices in order to ultimately remove or contain identified
vulnerabilities and prevent further harm
Event Reporting Patient safety managers report events and close calls from more than 150
VA facilities to a national database The largest number of use issues related to ventilators
involved equipment failure and issues such as spontaneous ventilator shutdown compressor
failure and broken or missing parts Other categories of ventilator use issues involved the
physical space where the ventilator was used challenges of transporting patients on
ventilators and problems with ventilator settings and alarms Root cause analyses on reports
are conducted and Patient Safety Alerts are issued to share the learning internally
Other Key Components
Data on ventilator issues from the VA and the Food and Drug Administrationrsquos Medical
Product Safety Network are the basis for a ldquogovernment-industry dayrdquo to work with
manufacturers This information is used to help the device manufacturers better
understand the limits of human use of their products
National Healthcare Quality and Disparities Report | 41
Patient Safety
The VA also trains noncliniciansmdashsuch as biomedical engineers across the
organizationmdashto understand the devices consider the situation for their use and identify
what can go wrong (ldquofailure modesrdquo) in advance
The VA encourages discussions among clinicians about their experience in using devices
In the Applied Patient Safety Challenge hundreds of staff participate in brainstorming
about solutions and strategies for dealing with unexpected scenarios involving devices
National Practitioner Data Bank
Medical malpractice actions are one way to flag potential medical errors
Medical Malpractice Payment Reports are submitted to the National Practitioner Data Bank
by medical malpractice payers
Report of a monetary exchange made for the benefit of a physician dentist or other
health care provider
Result of a settlement or judgment of a written complaint or claim based on that
providerrsquos delivery of or failure to deliver health care services
Number of Medical Malpractice Payment Reports by Setting
Number of Medical Malpractice Payment Reports by health care setting 2004-2014
Source National Practitioner Data Bank (NPDB) Public Use Data File Health Resources and Services Administration Bureau of Health
Professions Division of Practitioner Data Banks 2004-2014
Note Health care setting was not collected by the NPDB for 2104 reports in 2004 ldquoOtherrdquo includes Medical Malpractice Payment Reports
related to unknown settings as well as those for a combination of inpatient and outpatient settings Reports pertain to patients of any age
0
2000
4000
6000
8000
10000
12000
14000
16000
18000
20000
2004 2005 2006 2007 2008 2009 2010 2011 2012 2013 2014
Nu
mb
er o
f R
epo
rts
Total Inpatient Outpatient Other
Number of Medical Malpractice Payment Reports by health care setting 2004-2014
Source National Practitioner Data Bank (NPDB) Public Use Data File Health Resources and Services Administration Bureau of Health
Professions Division of Practitioner Data Banks 2004-2014
Note Health care setting was not collected by the NPDB for 2104 reports in 2004 ldquoOtherrdquo includes Medical Malpractice Payment Reports
related to unknown settings as well as those for a combination of inpatient and outpatient settings Reports pertain to patients of any age
0
2000
4000
6000
8000
10000
12000
14000
16000
18000
20000
2004 2005 2006 2007 2008 2009 2010 2011 2012 2013 2014
Nu
mb
er o
f R
epo
rts
Total Inpatient Outpatient Other
42 | National Healthcare Quality and Disparities Report
Patient Safety
Trends The total number of medical malpractice payment reports (MMPRs) per year
decreased from 17641 in 2004 to 12699 in 2014
Variation Across Reports
Of 157022 MMPRs from 2004 through 2014 more reports related to care in the
outpatient setting (71937) than in the inpatient setting (60391)
Diagnosis-related and treatment-related payments were the most frequent types of
reports each accounting for about 27 of cases Reports of payments for medication-
related cases accounted for only 5 of MMPRs (data not shown)
Number of Medical Malpractice Payment Reports by Allegation and Harm
Number of Medical Malpractice Payment Reports by type of allegation and harm severity 2004-2014
Key Temporary injury = Minor temporary injury and Major temporary injury Permanent significant injury = Significant Permanent Injury
Major Permanent Injury Quadriplegia Brain Damage Lifelong care
Source National Practitioner Data Bank Public Use Data File Health Resources and Services Administration Bureau of Health Professions
Division of Practitioner Data Banks 2004-2014
Note Reports pertain to patients of any age
0
20
40
60
80
100
Treatment(n=42913)
Diagnosis(n=42507)
Surgery(n=36845)
Obstetrics(n=10555)
Medication(n=8287)
Monitoring(n=5329)
Anesthesia(n=4276)
Equipment(n=1161)
BehavioralHealth
(n=879)
Blood(n=379)
EmotionalInjury Only
InsignificantInjury
TemporaryInjury
PermanentMinor Injury
PermanentSignificant Injury
Death Unknown
Number of Medical Malpractice Payment Reports by type of allegation and harm severity 2004-2014
Key Temporary injury = Minor temporary injury and Major temporary injury Permanent significant injury = Significant Permanent Injury
Major Permanent Injury Quadriplegia Brain Damage Lifelong care
Source National Practitioner Data Bank Public Use Data File Health Resources and Services Administration Bureau of Health Professions
Division of Practitioner Data Banks 2004-2014
Note Reports pertain to patients of any age
0
20
40
60
80
100
Treatment(n=42913)
Diagnosis(n=42507)
Surgery(n=36845)
Obstetrics(n=10555)
Medication(n=8287)
Monitoring(n=5329)
Anesthesia(n=4276)
Equipment(n=1161)
BehavioralHealth
(n=879)
Blood(n=379)
EmotionalInjury Only
InsignificantInjury
TemporaryInjury
PermanentMinor Injury
PermanentSignificant Injury
Death Unknown
Overall Percentage From 2004 to 2014 medical malpractice payments were made for
allegations related to
Treatment (42913)
Diagnosis (42507)
Surgery (36845)
Obstetrics (10555)
Medication (8287)
Monitoring (5329)
National Healthcare Quality and Disparities Report | 43
Patient Safety
Anesthesia (4276)
Equipment or products (1161)
Behavioral health (879) and
IV and blood products (379)
Variation Across Reports
Death accounted for more than one-third of harm in payments related to monitoring
(499) diagnosis (393) medication (383) and anesthesia (363) allegations
More than half of all obstetric payments were for allegations of permanent severe harm
(570)
Temporary harm accounted for more than one-third of payments related to equipment
(485) and surgery (360)
Most of the behavioral health-related payments were for emotional harm (457) or
death (338)
References
Agency for Healthcare Research and Quality Making Health Care Safer II An Updated Critical Analysis of the
Evidence for Patient Safety Practices Comparative Effectiveness Review No 211 Rockville MD Agency for
Healthcare Research and Quality March 2013 AHRQ Publication No 13-E001-EF
httpwwwahrqgovsitesdefaultfileswysiwygresearchfindingsevidence-basedshy
reportsservicesqualityptsafetyII-fullpdf
Arriaga AF Lancaster RT Berry RW et al The better colectomy project association of evidence-based best-
practice adherence rates to outcomes in colorectal surgery Ann Surg 2009 Oct250(4)507-13
httpwwwncbinlmnihgovpubmed19734778
Centers for Disease Control and Prevention HAI Prevalence Survey
httpwwwcdcgovHAIsurveillanceindexhtml Last updated March 2016 Accessed March 4 2016
Centers for Disease Control and Prevention Nursing Homes and Assisted Living (Long-Term Care Facilities)
httpwwwcdcgovlongtermcare Last updated September 2015 Accessed March 4 2016
Chassin MR Loeb JM High-reliability health care getting there from here Milbank Q 201391(3)459-90
httpwwwncbinlmnihgovpmcarticlesPMC3790522 Accessed September 23 2015
Chiu Y Bero L Hessol NA et al A literature review of clinical outcomes associated with antipsychotic medication
use in North American nursing home residents Health Policy 2015 Jun119(6)802-813 Epub 2015 Feb 28 PMID
25791166 httpwwwsciencedirectcomsciencearticlepiiS0168851015000652 Accessed June 17 2015
Huybrechts KF Gerhard Crystal S et al Differential risk of death in older residents in nursing homes prescribed
specific antipsychotic drugs Population based cohort study BMJ 2012 Feb 23344e977 PMID 22362541
httpwwwncbinlmnihgovpmcarticlesPMC3285717 Accessed June 17 2015
Institute of Medicine Preventing Medication Errors Quality Chasm Series 2007
httpwwwnapeducatalog11623preventing-medication-errors-quality-chasm-series
National Association for Home Care amp Hospice Basic Statistics About Home Care Updated 2010
httpwwwnahcorgassets1710hc_statspdf Accessed August 31 2015
44 | National Healthcare Quality and Disparities Report

Patient Safety
Measures of Patient Safety
Summary of information on patient safety from the National Healthcare Quality and
Disparities Report
Individual measures of patient safety overall and by age sex race ethnicity income
education insurance birth weight health status and presence of various health conditions
Measures of patient safety by setting
Hospitals
Nursing homes
Home health
Ambulatory care
All settings Infrastructure
Patient Safety in the Hospital Setting
Hospitals are a common setting for patient safety events
Many patients admitted to the hospital are in a clinically compromised state
Care often includes the use of invasive devices and procedures increasing patientsrsquo risk
for infection and harm
Measures include
Overall hospital-acquired conditions (HACs)
Healthcare-associated infections (HAIs)
Procedure-related events
National Healthcare Quality and Disparities Report | 5
Patient Safety
6 | National Healthcare Quality and Disparities Report
Distribution of Hospital-Acquired Conditions
Importance Hospital-acquired conditions (HACs) are conditions that patients did not have upon hospital admission but which developed during the patientrsquos hospital stay They can lead to poor patient outcomes and increased spending on health care HACs are often preventable
Overall Rate
In 2014 the overall HAC rate was 121 per 1000 hospital discharges Adverse drug events (414 per 1000 hospital discharges) accounted for 342 of total HACs and pressure ulcers (309 per 1000 hospital discharges) accounted for 255 of the total
Trends
From 2010 through 2014 the overall rate of hospital-acquired conditions declined 17 from 145 to 121 per 1000 hospital discharges
Among the most frequent HACs between 2010 and 2014 the rate of pressure ulcers decreased the most from 403 per 1000 discharges (more than 13 million events) to 309 per 1000 discharges (about 1 million events)
403 404 394 325 309
495 487 419403 414
122 113106
88 76
79 7872
72 79
81 7374
69 67
273 267257
251 266
0
20
40
60
80
100
120
140
160
2010 2011 2012 2013 2014
Rat
e p
er 1
00
0 D
isch
arge
s
Pressure Ulcers Adverse DrugEvents
Catheter-AssociatedUrinary Tract Infections
Falls Lower FrequencyHACs
All Other HACs
145 142132
121 121
Source Agency for Healthcare Research and Quality (AHRQ) Medicare Patient Safety Monitoring System 2010-2014 Healthcare Cost and
Utilization Project Nationwide Inpatient Sample 2010-2013 Centers for Disease Control and Prevention National Healthcare Safety Network
2010-2013
Denominator Adult hospital discharges age 18 and over
Note Lower Frequency HACs (lt31000 discharges) include central line-associated bloodstream infections venous thromboembolisms surgical
site infections obstetric adverse events and ventilator-associated pneumonia All Other Hospital-Acquired Conditions includes inadvertent femoral
artery puncture for catheter angiographic procedures adverse event associated with hip joint replacement adverse event associated with knee
joint replacement contrast nephropathy associated with catheter angiography methicillin-resistant Staphylococcus aureus (MRSA) vancomycin-
resistant Enterococcus (VRE) C difficile mechanical complications associated with central venous catheters postoperative cardiac events for
cardiac and noncardiac surgeries postoperative pneumonia iatrogenic pneumothorax postoperative hemorrhage or hematoma postoperative
respiratory failure and accidental puncture or laceration For more information on methods see httpwwwahrqgovprofessionalsquality-patient-
safetypfpinterimhacrate2014html
Distribution of hospital-acquired conditions based on national rates per 1000 adult hospital discharges 2010-2014
403 404 394 325 309
495 487 419403 414
122 113106
88 76
79 7872
72 79
81 7374
69 67
273 267257
251 266
0
20
40
60
80
100
120
140
160
2010 2011 2012 2013 2014
Rat
e p
er 1
00
0 D
isch
arge
s
Pressure Ulcers Adverse DrugEvents
Catheter-AssociatedUrinary Tract Infections
Falls Lower FrequencyHACs
All Other HACs
145 142132
121 121
Source Agency for Healthcare Research and Quality (AHRQ) Medicare Patient Safety Monitoring System 2010-2014 Healthcare Cost and
Utilization Project Nationwide Inpatient Sample 2010-2013 Centers for Disease Control and Prevention National Healthcare Safety Network
2010-2013
Denominator Adult hospital discharges age 18 and over
Note Lower Frequency HACs (lt31000 discharges) include central line-associated bloodstream infections venous thromboembolisms surgical
site infections obstetric adverse events and ventilator-associated pneumonia All Other Hospital-Acquired Conditions includes inadvertent femoral
artery puncture for catheter angiographic procedures adverse event associated with hip joint replacement adverse event associated with knee
joint replacement contrast nephropathy associated with catheter angiography methicillin-resistant Staphylococcus aureus (MRSA) vancomycin-
resistant Enterococcus (VRE) C difficile mechanical complications associated with central venous catheters postoperative cardiac events for
cardiac and noncardiac surgeries postoperative pneumonia iatrogenic pneumothorax postoperative hemorrhage or hematoma postoperative
respiratory failure and accidental puncture or laceration For more information on methods see httpwwwahrqgovprofessionalsquality-patient-
safetypfpinterimhacrate2014html
Distribution of hospital-acquired conditions based on national rates per 1000 adult hospital discharges 2010-2014
Patient Safety
During that same period adverse drug events decreased from a rate of 495 per 1000
discharges (more than 16 million events) to 414 per 1000 discharges (fewer than 14
million events) The catheter-associated urinary tract infection rate decreased from 122
to 76 per 1000 discharges (400000 and 250000 events respectively)
Among the less frequent HACs central line-associated bloodstream infections had the
greatest percentage decrease in rate (67) between 2010 and 2014 The rates of venous
thromboembolism (44) surgical site infections (17) and obstetric events (4) also
decreased
Healthcare-Associated Infections
Infections acquired during a hospital stay are among the most common complications of
hospital care
On any given day about 1 in 25 hospital patients has at least one healthcare-associated
infection (HAI) (CDC 2016)
HAIs often increase the patientrsquos length of stay in the hospital risk of mortality and hospital
costs
New infections in critically ill infants children and other patients generally reduce their
chances for recovery
For more information see the PSNet link to Patient Safety Primer Health Care-Associated
Infections at httpspsnetahrqgovprimersprimer7
Measures of Patient Safety in the Hospital Setting HAIs
Postoperative sepsis per 1000 adult discharges with an elective operating room procedure
Standardized infection ratios (SIRs) for central line-associated bloodstream infections
surgical site infections and catheter-associated urinary tract infections (CAUTIs)
SIRs compare the observed number of infections reported to the National Healthcare
Safety Network (NHSN) during a year to the predicted number of infections based on the
January 2006 to December 2008 referent period for central line-associated bloodstream
infections (CLABSIs) and surgical site infections (SSIs) and the calendar year 2009
referent period for CAUTIs
Change in SIRs for CAUTIs
Bloodstream infections per 1000 central-line days
In neonatal intensive care units (NICUs)
In adult intensive care units
National Healthcare Quality and Disparities Report | 7
Patient Safety
Postoperative Sepsis
Postoperative sepsis per 1000 adult discharges with an elective operating room procedure by sex and insurance status 2008-2013
Source Agency for Healthcare Research and Quality (AHRQ) Healthcare Cost and Utilization Project Nationwide Inpatient Sample 2008-
2013 and AHRQ Quality Indicators version 44
Denominator All elective hospital surgical discharges for patients age 18 years and over with length of stay of 4 or more days excluding
patients admitted for infection those with cancer or immunocompromised states those with obstetric conditions and admissions specifically for
sepsis
Note For this measure lower rates are better Acute care hospitalizations only Rates are adjusted by age sex age-sex interactions
comorbidities major diagnostic category diagnosis-related group and transfers into the hospital
0
5
10
15
20
25
2008 2009 2010 2011 2012 2013
Rat
e p
er
10
00
Dis
char
ges
Total Male Female
0
5
10
15
20
25
2008 2009 2010 2011 2012 2013
Rat
e p
er
10
00
Dis
char
ges
Private MedicareMedicaid Uninsured
Postoperative sepsis per 1000 adult discharges with an elective operating room procedure by sex and insurance status 2008-2013
Source Agency for Healthcare Research and Quality (AHRQ) Healthcare Cost and Utilization Project Nationwide Inpatient Sample 2008-
2013 and AHRQ Quality Indicators version 44
Denominator All elective hospital surgical discharges for patients age 18 years and over with length of stay of 4 or more days excluding
patients admitted for infection those with cancer or immunocompromised states those with obstetric conditions and admissions specifically for
sepsis
Note For this measure lower rates are better Acute care hospitalizations only Rates are adjusted by age sex age-sex interactions
comorbidities major diagnostic category diagnosis-related group and transfers into the hospital
0
5
10
15
20
25
2008 2009 2010 2011 2012 2013
Rat
e p
er
10
00
Dis
char
ges
Total Male Female
0
5
10
15
20
25
2008 2009 2010 2011 2012 2013
Rat
e p
er
10
00
Dis
char
ges
Private MedicareMedicaid Uninsured
Overall Rate In 2013 the postoperative sepsis rate was 143 per 1000 adult discharges with
an elective operating room procedure
Groups With Disparities
In 2013 female patients had a lower rate of postoperative sepsis than male patients
Also in 2013 patients with Medicaid and those with Medicare had worse sepsis rates
than privately insured patients
From 2008 to 2013 there were no statistically significant changes in the gap between
males and females
From 2008 to 2013 there were no statistically significant changes in the gap between
privately insured patients and other insurance groups
8 | National Healthcare Quality and Disparities Report
Patient Safety
Standardized Infection Ratios
Standardized infection ratios for central line-associated bloodstream infections and surgical site infections 2009-2013 and catheter-associated
urinary tract infections 2010-2013
Key CLABSI = central line-associated bloodstream infection SSI = surgical site infection SCIP = Surgical Care Improvement Project CAUTI =
catheter-associated urinary tract infection
Source Centers for Disease Control and Prevention National Center for Emerging and Zoonotic Infectious Diseases 2013 National and State
Healthcare Associated Infections Progress Report and National Healthcare Safety Network 2009ndash2013
Note For this measure lower numbers are better Acute care hospitalizations only CAUTI excludes neonatal intensive care units
00
02
04
06
08
10
12
14
2009 2010 2011 2012 2013
Stan
dar
diz
ed
Infe
ctio
n R
atio
CLABSI All SSI Combined SCIP Procedures CAUTI All
Standardized infection ratios for central line-associated bloodstream infections and surgical site infections 2009-2013 and catheter-associated
urinary tract infections 2010-2013
Key CLABSI = central line-associated bloodstream infection SSI = surgical site infection SCIP = Surgical Care Improvement Project CAUTI =
catheter-associated urinary tract infection
Source Centers for Disease Control and Prevention National Center for Emerging and Zoonotic Infectious Diseases 2013 National and State
Healthcare Associated Infections Progress Report and National Healthcare Safety Network 2009ndash2013
Note For this measure lower numbers are better Acute care hospitalizations only CAUTI excludes neonatal intensive care units
00
02
04
06
08
10
12
14
2009 2010 2011 2012 2013
Stan
dar
diz
ed
Infe
ctio
n R
atio
CLABSI All SSI Combined SCIP Procedures CAUTI All
Background SIRs compare the observed number of infections reported to the NHSN during
a year to the predicted number of infections based on the January 2006 to December 2008
referent period for CLABSIs and SSIs and the calendar year 2009 referent period for
CAUTIs For example a ratio of 81 for SSIs in 2013 indicates that 19 fewer SSIs were
observed in 2013 than predicted based on the 2006-2008 baseline period Data are from all
intensive care units wards and other non-critical care locations CLABSI data also include
neonatal intensive care units but exclude long-term acute care hospitals and inpatient
rehabilitation facilities SCIP procedures are those performed on adults Number of facilities
reporting to NHSN roughly tripled from 2009 to 2013 Procedures include abdominal aortic
aneurysm repair peripheral vascular bypass surgery coronary artery bypass graft with both
chest and donor site incisions or with chest incision only other cardiac surgery colon
surgery rectal surgery hip arthroplasty abdominal hysterectomy knee arthroplasty and
vaginal hysterectomy
Overall Rate In 2013 the overall SIR for CLABSIs among intensive care units in the 50
States District of Columbia and Puerto Rico was 054 and the overall SIR for CAUTIs was
106 The overall SIR for SSIs following 10 common procedures in adults was 081
Trends From 2009 to 2013 the SIR for CLABSIs improved and from 2010 to 2013 the
SIR for CAUTIs worsened for facilities reporting to NHSN
National Healthcare Quality and Disparities Report | 9
Patient Safety
Change in Statewide SIRs
Change from 2012 to 2013 in Statewide SIRs for CAUTI
Key CAUTI = catheter-associated urinary tract infection NHSN = National Healthcare Safety Network
Source Centers for Disease Control and Prevention National Center for Emerging and Zoonotic Infectious Diseases 2013 National and State
Healthcare Associated Infections Progress Report
Note For this measure lower numbers are better Changes in SIRs are categorized as ldquono changerdquo if they are not statistically significant Acute
care hospitalizations only Excludes neonatal intensive care units For this measure District of Columbia and Puerto Rico are treated as States
No Change
Increase
Indicates State mandate
in 2013 to report CAUTI
to NHSN
Decrease
AKAK
HI PR
AZ
CA
UT
CT
FL
GA
IA
IL
KS
MA
MDMO
NJ
NY
OR
PA
SCTN
CO
WA
WI
VA
ME
MN
MI
NC
TX
KY
WV
RI
NE
VT
NVOH
SD
AR
IN
NH
MT
ID
WY
ND
NM
OK
LA
MS AL
DE
DC
Change from 2012 to 2013 in Statewide SIRs for CAUTI
Key CAUTI = catheter-associated urinary tract infection NHSN = National Healthcare Safety Network
Source Centers for Disease Control and Prevention National Center for Emerging and Zoonotic Infectious Diseases 2013 National and State
Healthcare Associated Infections Progress Report
Note For this measure lower numbers are better Changes in SIRs are categorized as ldquono changerdquo if they are not statistically significant Acute
care hospitalizations only Excludes neonatal intensive care units For this measure District of Columbia and Puerto Rico are treated as States
No Change
Increase
Indicates State mandate
in 2013 to report CAUTI
to NHSN
Decrease
AKAK
HI PR
AZ
CA
UT
CT
FL
GA
IA
IL
KS
MA
MDMO
NJ
NY
OR
PA
SCTN
CO
WA
WI
VA
ME
MN
MI
NC
TX
KY
WV
RI
NE
VT
NVOH
SD
AR
IN
NH
MT
ID
WY
ND
NM
OK
LA
MS AL
DE
DC
Geographic Variation In 2013 31 States had SIRs greater than 1 indicating that on average
their hospitals had more CAUTIs than hospitals of similar type and size during the 2009
referent period The States were Alaska Arkansas Arizona Connecticut District of Columbia
Delaware Georgia Idaho Indiana Kansas Kentucky Massachusetts Maryland Maine
Michigan Minnesota Missouri Mississippi North Carolina New Jersey Nevada New York
Oregon Pennsylvania Rhode Island South Carolina Tennessee Texas Utah Virginia and
Washington
Trends Of 52 reporting States 33 had no change from 2012 to 2013 in CAUTI SIRs 9
decreased and 10 increased
Toolkit for Reducing Catheter-Associated Urinary Tract Infections in Hospitals
Purpose To help hospitals prevent catheter-associated urinary tract infections (CAUTIs) and
improve safety culture
Method Implementing evidence-based practical resources and concepts from the
Comprehensive Unit-based Safety Program
Intended User Hospital facilities
Available Tools Guides checklists webinars learning modules data interpretation guides
10 | National Healthcare Quality and Disparities Report
Patient Safety
Potential Measures of Effectiveness
Number of symptomatic CAUTIs attributable to each unit by month
Days since last CAUTI
Link httpwwwahrqgovprofessionalsquality-patient-safetyhaistoolscautishy
hospitalsIndexhtml
Central Line-Associated Bloodstream Infections in Neonatal Intensive Care Units
Central line-associated bloodstream infections per 1000 central-line days by birth weight of child in Level III neonatal intensive care units and by type
of pediatric ICU 2009-2013
Source Centers for Disease Control and Prevention National Healthcare Safety Network 2009-2013
Denominator Infections per 1000 central-line days
Note For this measure lower rates are better Acute care hospitalizations only
00
05
10
15
20
25
30
35
40
2009 2010 2011 2012 2013
Rat
e p
er
10
00
Ce
ntr
al-
Lin
e D
ays
le750 g 751-1000 g1001-1500 g 1501-2500 ggt2500 g
Level III Neonatal ICUs
00
05
10
15
20
25
30
35
40
2009 2010 2011 2012 2013
Rat
e p
er
10
00
Ce
ntr
al-
Lin
e D
ays
Pediatric Cardiothoracic ICUPediatric Medical ICUPediatric MedicalSurgical ICU
Pediatric ICUs
Central line-associated bloodstream infections per 1000 central-line days by birth weight of child in Level III neonatal intensive care units and by type
of pediatric ICU 2009-2013
Source Centers for Disease Control and Prevention National Healthcare Safety Network 2009-2013
Denominator Infections per 1000 central-line days
Note For this measure lower rates are better Acute care hospitalizations only
00
05
10
15
20
25
30
35
40
2009 2010 2011 2012 2013
Rat
e p
er
10
00
Ce
ntr
al-
Lin
e D
ays
le750 g 751-1000 g1001-1500 g 1501-2500 ggt2500 g
Level III Neonatal ICUs
00
05
10
15
20
25
30
35
40
2009 2010 2011 2012 2013
Rat
e p
er 1
000
Cen
tral
-Lin
e D
ays
Pediatric Cardiothoracic ICUPediatric Medical ICUPediatric MedicalSurgical ICU
Pediatric ICUs
Overall Rates
In 2013 among patients in Level III NICUs pooled mean CLABSI rates ranged from a
low of 06 infections per 1000 central-line days among neonates born at 1501 to 2500
grams to a high of 21 infections per 1000 central-line days among neonates born at less
than or equal to 750 grams
Trends
The rate of CLABSI among pediatric cardiothoracic ICUs was 25 in 2009 and 13 in
2013 among pediatric medical ICUs 26 in 2009 and 08 in 2013 and among pediatric
medicalsurgical ICUs 22 in 2009 and 12 in 2013
National Healthcare Quality and Disparities Report | 11
Patient Safety
Central Line-Associated Bloodstream Infections in Adult Intensive Care Units
Central linendashassociated bloodstream infections per 1000 central-line days in adult medical vs medicalsurgical intensive care units by hospital teaching
status 2006ndash2013
Source Centers for Disease Control and Prevention National Healthcare Safety Network 2006-2013
Denominator Infections per 1000 central-line days
Note For this measure lower rates are better Acute care hospitalizations only Major teaching facilities are defined as facilities with a program
for medical students and postgraduate medical training All other medical facilities include graduate facilities with programs for postgraduate
medical training only (ie residency andor fellowships) and undergraduate facilities with programs for medical students only
00
05
10
15
20
25
30
2006-2008 2009 2010 2011 2012 2013
Rat
e p
er
10
00
Ce
ntr
al-L
ine
Day
s
Major Teaching Medical ICU All Others Medical ICU
Major Teaching MedicalSurgical ICU All Others MedicalSurgical ICU
Central linendashassociated bloodstream infections per 1000 central-line days in adult medical vs medicalsurgical intensive care units by hospital teaching
status 2006ndash2013
Source Centers for Disease Control and Prevention National Healthcare Safety Network 2006-2013
Denominator Infections per 1000 central-line days
Note For this measure lower rates are better Acute care hospitalizations only Major teaching facilities are defined as facilities with a program
for medical students and postgraduate medical training All other medical facilities include graduate facilities with programs for postgraduate
medical training only (ie residency andor fellowships) and undergraduate facilities with programs for medical students only
00
05
10
15
20
25
30
2006-2008 2009 2010 2011 2012 2013
Rat
e p
er
10
00
Ce
ntr
al-L
ine
Day
s
Major Teaching Medical ICU All Others Medical ICU
Major Teaching MedicalSurgical ICU All Others MedicalSurgical ICU
Trends
Between 2006-2008 (combined) and 2013 there was a 46 decrease in CLABSIs (data
not shown)
From 2006-2008 (combined) to 2013 rates of CLABSIs in hospitals decreased 538
among adult medical ICU patients in hospitals with major teaching programs 476
among adult medicalsurgical ICU patients in hospitals with major teaching programs
421 among adult medical ICU patients in all other hospitals and 467 among adult
medicalsurgical ICU patients in all other hospitals
Tools for Reducing Central Line-Associated Bloodstream Infections
Purpose To help hospitals prevent central line-associated bloodstream infections (CLABSIs)
and improve safety culture
Methods Implementing evidence-based practical resources and concepts from the
Comprehensive Unit-based Safety Program (CUSP)
Intended user Hospital facilities
Available tools Checklists preventable incidence calculator audit form event report
template
12 | National Healthcare Quality and Disparities Report
Patient Safety
Impact
Through use of the CUSP toolkit and CLABSI tools more than 100 intensive care units
in Michigan have nearly eliminated CLABSIs
Nationwide the use of this toolkit has helped more than 1000 hospitals reduce rates of
CLABSI by 41 in aggregate See httpwwwahrqgovworkingforqualitypias
mhhakcpiahtm and httpwwwahrqgovprofessionalseducationcurriculumshy
toolsclabsitoolsindexhtmlpurpose
Procedure-Related Events
More than 40 million operative procedures are performed in the United States each year
Postoperative adverse events are not uncommon and increase both hospitalization length and
cost (AHRQ 2013)
Measures include
Risk-adjusted mortality at 30 days postoperation for colorectal surgery performed in
adults
Percentage of adult patients receiving hip joint replacement (because of fracture or
degenerative conditions) who experienced adverse events
Percentage of adults with mechanical adverse events associated with central venous
catheter placement
Postoperative Mortality
Risk-adjusted mortality rate within 30 days postoperation for adults undergoing colorectal surgery in ACS NSQIP participating hospitals in the United States by
raceethnicity and hospital teaching status 2008-2014
0
1
2
3
4
5
6
Pe
rce
nt
Teaching Nonteaching
Source American College of Surgeons (ACS) National Surgical Quality Improvement Program (NSQIP) 2008-2014
Denominator Adults age 18 years and over
Note For this measure lower percentages are better The participation in the ACS NSQIP is voluntary and current participation is weighted
when calculating rates Participating hospitals have changed over time 203 hospitals participated in 2008 and 531 hospitals participated in
2014 Other includes Asian American Indian or Alaska Native and Native Hawaiian or Other Pacific Islander White Black and Other are non-
Hispanic Hispanic includes all races
0
1
2
3
4
5
6
Pe
rce
nt
Total White Black Hispanic Other
Risk-adjusted mortality rate within 30 days postoperation for adults undergoing colorectal surgery in ACS NSQIP participating hospitals in the United States by
raceethnicity and hospital teaching status 2008-2014
0
1
2
3
4
5
6
Pe
rce
nt
Teaching Nonteaching
Source American College of Surgeons (ACS) National Surgical Quality Improvement Program (NSQIP) 2008-2014
Denominator Adults age 18 years and over
Note For this measure lower percentages are better The participation in the ACS NSQIP is voluntary and current participation is weighted
when calculating rates Participating hospitals have changed over time 203 hospitals participated in 2008 and 531 hospitals participated in
2014 Other includes Asian American Indian or Alaska Native and Native Hawaiian or Other Pacific Islander White Black and Other are non-
Hispanic Hispanic includes all races
0
1
2
3
4
5
6
Pe
rce
nt
Total White Black Hispanic Other
National Healthcare Quality and Disparities Report | 13
Patient Safety
Importance Colorectal procedures have high rates of postoperative complications
Nonadherence to evidence-based best practices is associated with an increased risk of these
complications (Arriaga et al 2009)
Overall Rate In 2014 the risk-adjusted mortality rate was 31 among patients undergoing
colorectal surgeries at ACS NSQIP participating hospitals
Trends From 2008 to 2014 30-day postoperative mortality after colorectal surgery
improved
Groups With Disparities
In 2014 the percentage of patients with 30-day postoperative mortality was worse for
Blacks (36) compared with Whites (30)
From 2008 to 2014 there were no statistically significant changes in the gap between
minority groups and Whites in the percentage of patients with 30-day postoperative
mortality
Adverse Events After Hip Joint Replacement
Adult patients receiving hip joint replacement due to fracture or degenerative conditions who experienced adverse events by age and chronic obstructive
pulmonary disease 2009-2013
02468
101214161820
2009 2010 2011 2012 2013
Pe
rce
nt
Total 65-74 75-84 85+
02468
101214161820
2009 2010 2011 2012 2013
Pe
rce
nt
COPD No COPD
Key COPD = chronic obstructive pulmonary disease
Source Agency for Healthcare Research and Quality (AHRQ) and Centers for Medicare amp Medicaid Services (CMS) Medicare Patient Safety
Monitoring System (MPSMS) 2009-2013
Denominator All patients age 18 years and over in the MPSMS sample who had a surgical procedure performed to replace a hip joint due to
degenerative conditions or a fractured hip
Note For this measure lower percentages are better Hospitals in Puerto Rico the Virgin Islands and Maryland were not included in the
annual samples Samples were drawn from the CMS Hospital Inpatient Quality Reporting program and consist of medical records for
discharges following hip arthroplasty procedures as defined by the Surgical Care Improvement Project Rates for patients age 85 years and
over in 2013 and for ages 18-64 years old for all years are not shown because the data did not meet the criteria for statistical reliability data
quality or confidentiality COPD status relates to patients with a principal or secondary discharge diagnosis of COPD
Adult patients receiving hip joint replacement due to fracture or degenerative conditions who experienced adverse events by age and chronic obstructive
pulmonary disease 2009-2013
02468
101214161820
2009 2010 2011 2012 2013
Pe
rce
nt
Total 65-74 75-84 85+
02
4
68
10
12
1416
18
20
2009 2010 2011 2012 2013
Pe
rce
nt
COPD No COPD
Key COPD = chronic obstructive pulmonary disease
Source Agency for Healthcare Research and Quality (AHRQ) and Centers for Medicare amp Medicaid Services (CMS) Medicare Patient Safety
Monitoring System (MPSMS) 2009-2013
Denominator All patients age 18 years and over in the MPSMS sample who had a surgical procedure performed to replace a hip joint due to
degenerative conditions or a fractured hip
Note For this measure lower percentages are better Hospitals in Puerto Rico the Virgin Islands and Maryland were not included in the
annual samples Samples were drawn from the CMS Hospital Inpatient Quality Reporting program and consist of medical records for
discharges following hip arthroplasty procedures as defined by the Surgical Care Improvement Project Rates for patients age 85 years and
over in 2013 and for ages 18-64 years old for all years are not shown because the data did not meet the criteria for statistical reliability data
quality or confidentiality COPD status relates to patients with a principal or secondary discharge diagnosis of COPD
Importance Hip replacement is most common among older adults who have an increased
risk of adverse events after these surgeries
14 | National Healthcare Quality and Disparities Report
Patient Safety
Overall Percentage In 2013 49 of patients receiving a hip joint replacement experienced
an adverse event
Trends From 2009 to 2013 the overall percentage of adverse events improved for patients
who had a hip joint replacement due to fracture or degenerative conditions
Groups With Disparities
In 2013 there were no statistically significant differences by age or COPD status in the
percentage of hip replacement patients who had adverse events
From 2009 to 2013 there were no statistically significant changes in the gap between
patients age 75 and over and those ages 65-74 in adverse event frequencies Similarly
there were no statistically significant changes in disparities between patients with COPD
and those without COPD
Adverse Events Associated With Central Venous Catheter Placement
Adults with mechanical adverse events associated with central venous catheter placement by race and obesity status 2009-2013
Source Agency for Healthcare Research and Quality and Centers for Medicare amp Medicaid Services Medicare Patient Safety Monitoring
System 2009-2013
Denominator Selected discharges of hospitalized patients age 18 years and over with central venous catheter placement
Note For this measure lower percentages are better Mechanical adverse events include allergic reaction to the catheter tamponade
perforation pneumothorax hematoma shearing off of the catheter air embolism misplaced catheter thrombosisembolism knotting of the
pulmonary artery catheter and certain other events
0
2
4
6
8
10
2009 2010 2011 2012 2013
Pe
rce
nt
Total White Black
0
2
4
6
8
10
2009 2010 2011 2012 2013
Pe
rce
nt
Obese Not Obese
Adults with mechanical adverse events associated with central venous catheter placement by race and obesity status 2009-2013
Source Agency for Healthcare Research and Quality and Centers for Medicare amp Medicaid Services Medicare Patient Safety Monitoring
System 2009-2013
Denominator Selected discharges of hospitalized patients age 18 years and over with central venous catheter placement
Note For this measure lower percentages are better Mechanical adverse events include allergic reaction to the catheter tamponade
perforation pneumothorax hematoma shearing off of the catheter air embolism misplaced catheter thrombosisembolism knotting of the
pulmonary artery catheter and certain other events
0
2
4
6
8
10
2009 2010 2011 2012 2013
Pe
rce
nt
Total White Black
0
2
4
6
8
10
2009 2010 2011 2012 2013
Pe
rce
nt
Obese Not Obese
Importance Central venous catheterization (CVC) allows medical personnel quick access to
a patientrsquos bloodstream This ease of access is important when a patient requires life-saving
medications or when a physician needs to measure central venous pressure Mechanical
adverse events are most likely to occur while medical personnel are placing or maintaining
the central venous catheter
National Healthcare Quality and Disparities Report | 15
Patient Safety
Overall Percentage In 2013 32 of adults with central venous catheter placements
experienced an associated mechanical adverse event
Trends From 2009 to 2013 there were no statistically significant changes in the overall
percentage of adults with mechanical adverse events associated with central venous catheter
placement
Groups With Disparities
In 2013 the percentage of adults with mechanical adverse events associated with CVC
was worse for Blacks (67) compared with Whites (27) There were no statistically
significant differences by obesity status
From 2009 to 2013 there were no statistically significant changes in the gap between
Blacks and Whites in the percentage of adults with mechanical adverse events associated
with CVC
Adverse Drug Events
An estimated 400000 preventable ADEs occur each year in US hospitals generating
additional costs of $35 billion in 2006 dollars (IOM 2007)
An ADE is an injurymdashincluding physical harm mental harm or loss of functionmdash
resulting from medical intervention involving a drug
For more information see the PSNet link to Patient Safety Primer Medication Errors
httpspsnetahrqgovprimersprimer23medication-errors
The three initial targets of the HHS National Action Plan for Adverse Drug Event Prevention are
Anticoagulants and related bleeding
Diabetes agents and related hypoglycemia
Opioids and accidental overdose oversedation and respiratory depression
Measures of Patient Safety in the Hospital Setting Adverse Drug Events
Percentage of hospitalized adult patients who received a hypoglycemic agent and had an
adverse drug event
Percentage of hospitalized adult patients who had an anticoagulant-related adverse drug
event to warfarin
Number of opioid-related medication errors in patients of all ages
16 | National Healthcare Quality and Disparities Report
Patient Safety
Adverse Drug Events With Hypoglycemic Agents
Hospitalized adult patients who received a hypoglycemic agent who had adverse drug events with hypoglycemic agents by
raceethnicity 2010-2013 and renal disease 2009-2013
Source Agency for Healthcare Research and Quality and Centers for Medicare amp Medicaid Services Medicare Patient Safety Monitoring
System 2009-2013
Note For this measure lower percentages are better Hypoglycemic agents received by patients age 18 and over during a hospital stay include
insulin oral hypoglycemic or a combination of both The 2009 data for races did not meet the criteria for statistical reliability data quality or confidentiality
0
2
4
6
8
10
12
14
16
18
20
2009 2010 2011 2012 2013
Pe
rce
nt
Total Renal DiseaseNo Renal Disease
0
2
4
6
8
10
12
14
16
18
20
2010 2011 2012 2013
Pe
rce
nt
Total White BlackAsian Hispanic
Hospitalized adult patients who received a hypoglycemic agent who had adverse drug events with hypoglycemic agents by
raceethnicity 2010-2013 and renal disease 2009-2013
Source Agency for Healthcare Research and Quality and Centers for Medicare amp Medicaid Services Medicare Patient Safety Monitoring
System 2009-2013
Note For this measure lower percentages are better Hypoglycemic agents received by patients age 18 and over during a hospital stay include
insulin oral hypoglycemic or a combination of both The 2009 data for races did not meet the criteria for statistical reliability data quality or confidentiality
0
2
4
6
8
10
12
14
16
18
20
2009 2010 2011 2012 2013
Pe
rce
nt
Total Renal DiseaseNo Renal Disease
0
2
4
6
8
10
12
14
16
18
20
2010 2011 2012 2013
Pe
rce
nt
Total White BlackAsian Hispanic
Importance Hypoglycemic agents which are ingested orally are typically used in patients
with type II diabetes to control blood sugar levels In some cases diabetic patients use
hypoglycemic agents together with insulin The risk of chronic kidney disease increases
twofold for people with diabetes and renal impairment can increase the risk for adverse
events related to hypoglycemic agents
Overall Percentage In 2013 85 of hospital patients receiving hypoglycemic agents had
an adverse drug event
Trends The overall percentage of adverse drug events associated with hypoglycemic agents
improved from 2009 to 2013
Groups With Disparities
In 2013 the percentage of hospital patients who had adverse drug events with hypoglycemic agents was higher for Blacks (111) than for Whites (8)
Also in 2013 the percentage of hospital patients who had adverse drug events with
hypoglycemic agents was higher for those with renal disease (122) than for those
without renal disease (56)
From 2010 to 2013 there were no statistically significant changes in the gap between
minority groups and Whites in the percentage of patients who had adverse drug events
associated with hypoglycemic agents Similarly there were no statistically significant
changes in the gap between those with renal disease and those without
National Healthcare Quality and Disparities Report | 17
Patient Safety
Adverse Drug Events With Warfarin
Hospitalized adult patients with an anticoagulant-related adverse drug event with warfarin by age and corticosteroid use 2009-2013
Source Agency for Healthcare Research and Quality and Centers for Medicare amp Medicaid Services Medicare Patient Safety Monitoring
System 2009ndash2013
Denominator Patients 18 and over who received warfarin and had their international normalized ratio (INR) measured during their hospital
stay
Note For this measure lower percentages are better Adverse events occurring the day of hospital arrival were excluded
0
2
4
6
8
10
12
2009 2010 2011 2012 2013
Pe
rce
nt
TotalCorticosteroid UseNo Corticosteroid Use
0
2
4
6
8
10
12
2009 2010 2011 2012 2013
Pe
rce
nt
lt65 65-74 75-84 85+
Hospitalized adult patients with an anticoagulant-related adverse drug event with warfarin by age and corticosteroid use 2009-2013
Source Agency for Healthcare Research and Quality and Centers for Medicare amp Medicaid Services Medicare Patient Safety Monitoring
System 2009ndash2013
Denominator Patients 18 and over who received warfarin and had their international normalized ratio (INR) measured during their hospital
stay
Note For this measure lower percentages are better Adverse events occurring the day of hospital arrival were excluded
0
2
4
6
8
10
12
2009 2010 2011 2012 2013
Pe
rce
nt
TotalCorticosteroid UseNo Corticosteroid Use
0
2
4
6
8
10
12
2009 2010 2011 2012 2013
Pe
rce
nt
lt65 65-74 75-84 85+
Importance Blood clots in arteries and veins can cause a blockage of blood flow and lead to
strokes and heart attacks Anticoagulants such as warfarin reduce this risk but pose an
increased risk of bleeding Corticosteroids can interact with anticoagulants to raise the risk of
potential bleeding complications
Overall Percentage In 2013 50 of adults using warfarin experienced an anticoagulant-
related adverse drug event
Trends From 2009 to 2013 there were no statistically significant changes in the overall
percentage of hospital patients with an adverse drug event related to warfarin
Groups With Disparities
In 2013 the percentage of hospital patients who had an adverse drug event to warfarin
was the same regardless of corticosteroid use status
From 2009 to 2013 there were no statistically significant changes in the gap between
older age groups and those under age 65 in the percentage of patients who had adverse
events associated with warfarin Similarly there were no statistically significant changes
in the gap between those using corticosteroids and those not using corticosteroids
18 | National Healthcare Quality and Disparities Report
Patient Safety
Opioid-Related Medication Errors
Number of opioid-related medication errors reported in Pennsylvania by AHRQ eventharm category and age 2006 2008 2010 2012 2014
30 53 44 27 23
2947 2798 2714 27082408
9531014
984 969
910
175 245251 398
330
0
500
1000
1500
2000
2500
3000
3500
4000
4500
2006 2008 2010 2012 2014
Nu
mb
er o
f Ev
ents
Unsafe Condition Near Miss
Patient Event No Harm Patient Event Harm
Source Institute of Safe Medication Practices on behalf of the Pennsylvania Patient Safety Authority 2006-2014
Note Pennsylvania Patient Safety Reporting System reports of medication errors are from acute-level facilities that consist of hospitals
ambulatory surgical facilities birthing centers and abortion facilities Medication errors do not include adverse drug reactions Eventharm
categories refer to those in the Agency for Healthcare Research and Quality Common Formats Unsafe condition is defined as any
circumstance that increases the probability of a patient safety event A near miss is defined as a patient safety event that did not reach the
patient Deaths are included in the total but not shown on the chart because there were too few to render graphically
192 166 336530 662
2287 24842385
2364 1955
16271461 1272
1208
1055
0
500
1000
1500
2000
2500
3000
3500
4000
4500
2006 2008 2010 2012 2014
Nu
mb
er o
f Ev
en
ts
lt18 18-64 65+
Number of opioid-related medication errors reported in Pennsylvania by AHRQ eventharm category and age 2006 2008 2010 2012 2014
30 53 44 27 23
2947 2798 2714 27082408
9531014
984 969
910
175 245251 398
330
0
500
1000
1500
2000
2500
3000
3500
4000
4500
2006 2008 2010 2012 2014
Nu
mb
er o
f Ev
ents
Unsafe Condition Near Miss
Patient Event No Harm Patient Event Harm
Source Institute of Safe Medication Practices on behalf of the Pennsylvania Patient Safety Authority 2006-2014
Note Pennsylvania Patient Safety Reporting System reports of medication errors are from acute-level facilities that consist of hospitals
ambulatory surgical facilities birthing centers and abortion facilities Medication errors do not include adverse drug reac tions Eventharm
categories refer to those in the Agency for Healthcare Research and Quality Common Formats Unsafe condition is defined as any
circumstance that increases the probability of a patient safety event A near miss is defined as a patient safety event that did not reach the
patient Deaths are included in the total but not shown on the chart because there were too few to render graphically
192 166 336530 662
2287 24842385
2364 1955
16271461 1272
1208
1055
0
500
1000
1500
2000
2500
3000
3500
4000
4500
2006 2008 2010 2012 2014
Nu
mb
er o
f Ev
ents
lt18 18-64 65+
Importance Acute malignant andmdashincreasinglymdashchronic pain often is treated or managed
with prescription opioids Reducing patient harm from the use of opioids in both inpatient
and outpatient settings is a main area of focus because opioid-related adverse drug events are
often preventable
Trends
In Pennsylvania the total number of medication error reports related to opioids decreased
106 between 2006 (4106) and 2014 (3672)
Between 24 and 54 opioid-related medication errors resulting in patient harm or death
were reported from 2006 through 2014 accounting for approximately 1 of all reported
opioid medication errors each year
The largest share of opioid-related medication errors reported each year in Pennsylvania
related to those that reached the patient but did not result in harm Of these no-harm
events reaching the patient about one in four required monitoring andor intervention to
preclude the harm
National Healthcare Quality and Disparities Report | 19
Patient Safety
20 | National Healthcare Quality and Disparities Report
Although small in number reports of unsafe conditions increased from 43 (175) of
total opioid-related medication error reports in 2006 to 9 (330) in 2014 Reports of
unsafe conditions and near misses can provide important learning opportunities for
preventing patient harm
Differences Between Groups Reports of opioid-related medication errors involving
pediatric patients increased nearly fourfold from 192 (47) in 2006 to 662 (18) in 2014
During the same period reports of opioid-related medication errors involving older adult
patients decreased from nearly 40 of the total to less than 30
Patient Safety in the Nursing Home Setting
More than 3 million people receive care in US nursing homes and skilled nursing facilities
each year (CDC 2015)
For nursing home residents optimal care seeks to maximize quality of life and minimize
unintended complications
Measures tracked for patients of various age ranges include
Nursing home residents with urinary tract infections
Nursing home residents experiencing use of restraints
Nursing home residents who have pressure ulcers
Nursing home residents who had a fall with major injury
Nursing home residents who received antipsychotic medication
Urinary Tract Infections
Long-stay nursing home residents experiencing urinary tract infections by sex and raceethnicity 2011-2013
Source Centers for Medicare amp Medicaid Services Minimum Data Set 2011-2013
DenominatorNursing home residents of any age w ho have at least 101 cumulative days in the facility
Note For this measure low er percentages are better The measure w as calculated as follows Percentage of long-stay residents with a urinary
tract infection w ithin the 30 days prior to assessment White Black and Asian are non-Hispanic Hispanic includes all races
0
2
4
6
8
10
2011 2012 2013
Pe
rce
nt
Total Male Female
2011 Achievable
Benchmark 61
0
2
4
6
8
10
2011 2012 2013
Pe
rce
nt
White Black Asian Hispanic
2011 Achievable
Benchmark 61
Long-stay nursing home residents experiencing urinary tract infections by sex and raceethnicity 2011-2013
Source Centers for Medicare amp Medicaid Services Minimum Data Set 2011-2013
DenominatorNursing home residents of any age w ho have at least 101 cumulative days in the facilityNote For this measure low er percentages are better The measure w as calculated as follows Percentage of long-stay residents with a urinary
tract infection w ithin the 30 days prior to assessment White Black and Asian are non-Hispanic Hispanic includes all races
0
2
4
6
8
10
2011 2012 2013
Pe
rce
nt
Total Male Female
2011 Achievable
Benchmark 61
0
2
4
6
8
10
2011 2012 2013
Pe
rce
nt
White Black Asian Hispanic
2011 Achievable
Benchmark 61
Patient Safety
Importance Bacteria that cause urinary tract infections (UTIs) can spread to other body
parts and become more serious or contribute to further complications such as delirium
Overall Percentage In 2013 the percentage of long-stay nursing home residents with a UTI
was 64
Groups With Disparities
In 2013 compared with males (51) the percentage with UTIs was worse for females
(7)
In 2013 compared with White residents (68) the percentage of residents with UTIs
was lower for Blacks and Asians (47) as well as Hispanics (54)
Achievable Benchmark
In 2011 the top 5 State achievable benchmark for UTIs was 61 The States that
contributed to the achievable benchmark are Connecticut Hawaii Minnesota North
Dakota and Pennsylvania
Males Blacks Asians and Hispanics have achieved the benchmark
Use of Restraints
00
05
10
15
20
25
30
35
40
2011 2012 2013
Pe
rce
nt
White Black Asian Hispanic
00
05
10
15
20
25
30
35
40
2011 2012 2013
Pe
rce
nt
Total 0-64 65-74 75-84 85+
2011 Achievable
Benchmark 07
Long-stay nursing home residents experiencing use of restraints by age and raceethnicity 2011-2013
Source Centers for Medicare amp Medicaid Services Minimum Data Set 2011-2013
Denominator Nursing home residents of any age who have at least 101 cumulative days in the facility
Note For this measure lower percentages are better The measure was calculated as follows Percentage of long-stay residents who are
physically restrained on a daily basis
2011 Achievable
Benchmark 07
00
05
10
15
20
25
30
35
40
2011 2012 2013
Pe
rce
nt
White Black Asian Hispanic
00
05
10
15
20
25
30
35
40
2011 2012 2013
Pe
rce
nt
Total 0-64 65-74 75-84 85+
2011 Achievable
Benchmark 07
Long-stay nursing home residents experiencing use of restraints by age and raceethnicity 2011-2013
Source Centers for Medicare amp Medicaid Services Minimum Data Set 2011-2013
Denominator Nursing home residents of any age who have at least 101 cumulative days in the facility
Note For this measure lower percentages are better The measure was calculated as follows Percentage of long-stay residents who are
physically restrained on a daily basis
2011 Achievable
Benchmark 07
National Healthcare Quality and Disparities Report | 21
Patient Safety
Importance Residents who are restrained daily can become weak lose their ability to go to
the bathroom by themselves and develop pressure ulcers or other medical conditions
Overall Percentage In 2013 the percentage of long-stay nursing home residents who were
physically restrained on a daily basis was 14
Groups With Disparities
In 2011 2012 and 2013 the percentage of residents with restraint use on a daily basis
was lower for those ages 65-74 years compared with those under age 65 In 2013 the
percentage of residents ages 65-74 years experiencing use of restraints was 12
compared with 16 for residents younger than 65
In 2013 compared with Whites (14) Asians (2) and Hispanics (18) had worse
percentages of daily restraint use and Blacks (12) had a better percentage of daily
restraint use
Achievable Benchmark
In 2011 the top 5 State achievable benchmark for restraint use was 07 The States that
contributed to the achievable benchmark are Kansas Maine Nebraska New Hampshire
and Vermont
No group achieved the benchmark from 2011 to 2013
Pressure Ulcers
Low-risk short-stay and high-risk long-stay nursing home residents who have pressure ulcers by sex 2011-2013
Source Centers for Medicare amp Medicaid Services Minimum Data Set 2011-2013
Denominator Low-risk short-stay Nursing home residents of any age who have 100 or fewer cumulative days in the facility and are active can
change positions and are getting the nutrients they need to maintain good skin health High-risk long-stay Nursing home residents of any age
who have at least 101 cumulative days in the facility and are in a coma do not get the nutrients needed to maintain good skin health or cannot
change position on their own
Note For this measure lower percentages are better
0
2
4
6
8
10
12
2011 2012 2013
Pe
rce
nt
Low-Risk Short StayTotal Male Female
2011 Achievable Benchmark10
0
2
4
6
8
10
12
2011 2012 2013
Pe
rce
nt
High-Risk Long StayTotal Male Female
2008 Achievable Benchmark 71
Low-risk short-stay and high-risk long-stay nursing home residents who have pressure ulcers by sex 2011-2013
Source Centers for Medicare amp Medicaid Services Minimum Data Set 2011-2013
Denominator Low-risk short-stay Nursing home residents of any age who have 100 or fewer cumulative days in the facility and are active can
change positions and are getting the nutrients they need to maintain good skin health High-risk long-stay Nursing home residents of any age
who have at least 101 cumulative days in the facility and are in a coma do not get the nutrients needed to maintain good skin health or cannot
change position on their own
Note For this measure lower percentages are better
0
2
4
6
8
10
12
2011 2012 2013
Pe
rce
nt
Low-Risk Short StayTotal Male Female
2011 Achievable Benchmark10
0
2
4
6
8
10
12
2011 2012 2013
Pe
rce
nt
High-Risk Long StayTotal Male Female
2008 Achievable Benchmark 71
22 | National Healthcare Quality and Disparities Report
Patient Safety
Importance Pressure ulcers are serious medical conditions They typically result from
prolonged periods of uninterrupted pressure on the skin soft tissue muscle and bone
Vulnerable patients include older adults stroke and diabetic patients patients with dementia
circulatory diseases dehydration and malnutrition and people who use wheelchairs or are
bedriddenmdashthat is any patient with impaired mobility or sensation
Overall Percentage In 2013 the percentage of low-risk short-stay residents with pressure
ulcers was 13 and the percentage of high-risk long-stay residents with pressure ulcers was
77
Groups with Disparities
As in 2011 and 2012 male low-risk short-stay nursing home residents had a worse
percentage with pressure ulcers (15) compared with female residents (12) in 2013
As in 2011 and 2012 male high-risk long-stay nursing home residents had a worse
percentage with pressure ulcers (94) compared with female residents (70) in 2013
Achievable Benchmark
The 2011 top 5 State achievable benchmark for low-risk short-stay nursing home residents was 10 The States that contributed to the benchmark were Alabama Arizona Colorado Connecticut and Idaho
The 2008 top 5 State achievable benchmark for high-risk long-stay nursing home residents was 71 The States that contributed to the benchmark were Hawaii Minnesota Nebraska New Hampshire and North Dakota
No low-risk short-stay residents achieved the benchmark from 2011 to 2013 Among
high-risk long-stay residents only females achieved the benchmark by 2013
National Healthcare Quality and Disparities Report | 23
Patient Safety
Falls
00
05
10
15
20
25
30
35
40
45
50
Pe
rce
nt
2012 2013
Long-stay nursing home residents who had a fall with major injury by sex age and raceethnicity 2012-2013
Source Centers for Medicare amp Medicaid Services Minimum Data Set 2012-2013
Denominator Nursing home residents of any age who have at least 101 cumulative days in the facility with one or more look-back scan
assessments except when the occurrence of falls or number of falls with major injury was not assessed in the look-back scan assessment
Note For this measure lower percentages are better White Black and Other are non-Hispanic Hispanic includes all races
2012 Achievable
Benchmark 22
00
05
10
15
20
25
30
35
40
45
50
Pe
rce
nt
2012 2013
Long-stay nursing home residents who had a fall with major injury by sex age and raceethnicity 2012-2013
Source Centers for Medicare amp Medicaid Services Minimum Data Set 2012-2013
Denominator Nursing home residents of any age who have at least 101 cumulative days in the facility with one or more look-back scan
assessments except when the occurrence of falls or number of falls with major injury was not assessed in the look-back scan assessment
Note For this measure lower percentages are better White Black and Other are non-Hispanic Hispanic includes all races
2012 Achievable
Benchmark 22
Importance Nursing home residents who experience falls resulting in major injuries are at
higher risk of death and disability as well as emotional trauma that can affect functional
abilities and social well-being
Overall Percentage In 2013 the percentage of long-stay nursing home residents who had a
fall with a major injury was 34
Groups With Disparities
In 2013 female nursing home residents had a worse percentage of falls (38) compared
with male residents (25)
In 2013 the percentage of falls with major injury was worse for all subgroups of
residents age 65 years and over compared with their younger counterparts The
percentage for residents under 65 years old was 17 compared with 26 for ages 65shy
74 years 34 for ages 75-84 years and 41 for 85 years and over
Also in 2013 compared with Whites (38) the percentage of falls with major injury
was better for Black (13) Other (22) and Hispanic (24) residents
24 | National Healthcare Quality and Disparities Report
Patient Safety
National Healthcare Quality and Disparities Report | 25
Achievable Benchmark
The 2012 top 5 State achievable benchmark for falls with major injury was 22 The
States that contributed to the achievable benchmark are Alaska California District of
Columbia Hawaii and New Jersey The benchmark was achieved by Black residents and those ages 0-64 years
Antipsychotic Medication Among Nursing Home Residents
Importance The high use of antipsychotic medications among nursing home residents for
indications other than those for which the drug was approved has been noted by the Federal
Government These drugs are often used for too long at too high a dose or when
unnecessary In the past inappropriate prescribing of antipsychotics in nursing homes has
primarily been considered a marker of suboptimal care Recent studies have shown
antipsychotic use is also a drug safety issue (Huybrechts et al 2012) Antipsychotic
medication use is associated with increased risks of adverse events such as movement
disorders falls hip fractures and cerebrovascular events Their use in older adults with
dementia carries an increased risk of death Safety concerns with antipsychotic medication
use in older adults also include the risks of hyperprolactinemia pneumonia
0
5
10
15
20
25
30
Percent
2012 2013
Adult long-stay nursing home residents who received antipsychotic medication by raceethnicity and number of chronic conditions 2012-2013
Key NHOPI = Native Hawaiian or Other Pacific Islander AIAN = American Indian or Alaska Native
Source Centers for Medicare amp Medicaid Services Minimum Data Set 2012-2013
Denominator Nursing home residents of any age who have at least 101 cumulative days in the facility excluding residents with schizophrenia
Tourettersquos syndrome and Huntingtonrsquos disease
Numerator Subset of denominator that receives an antipsychotic medication
Note For this measure lower percentages are better
2012 Achievable
Benchmark 150
0
5
10
15
20
25
30
Percent
2012 2013
Adult long-stay nursing home residents who received antipsychotic medication by raceethnicity and number of chronic conditions 2012-2013
Key NHOPI = Native Hawaiian or Other Pacific Islander AIAN = American Indian or Alaska Native
Source Centers for Medicare amp Medicaid Services Minimum Data Set 2012-2013
Denominator Nursing home residents of any age who have at least 101 cumulative days in the facility excluding residents with schizophrenia
Tourettersquos syndrome and Huntingtonrsquos disease
Numerator Subset of denominator that receives an antipsychotic medication
Note For this measure lower percentages are better
2012 Achievable
Benchmark 150
Patient Safety
26 | National Healthcare Quality and Disparities Report
thromboembolism cerebrovascular events and other cardiovascular adverse events (Chiu et
al 2015)
Overall Percentage The percentage of long-stay nursing home residents who had
antipsychotic medications was 176 in 2013
Groups With Disparities
In 2013 the percentage of residents receiving antipsychotic medication was higher for
Hispanic residents (201) than for White residents (180)
In 2012 and 2013 the percentage of long-stay residents who received antipsychotic
medications was worse for residents with one or more chronic conditions than for
residents with no chronic conditions
Achievable Benchmark
The 2012 top 6 State achievable benchmark was 150 The States that contributed to the
achievable benchmark are Alaska California Hawaii Michigan New Jersey and
Wyoming Asians NHOPIs residents with no chronic conditions and residents with one chronic
condition achieved the benchmark
Antipsychotic Medication Among Nursing Home Residents by State
Long-stay nursing home residents who received antipsychotic medication by State 2013
Source Centers for Medicare amp Medicaid Services Minimum Data Set 2013
Denominator Nursing home residents of any age who have at least 101 cumulative days in the facility
Note For this measure lower percentages are better
AZ
CA
UT
CT
FL
GA
IA
IL
KS
MA
MDMO
NJ
NY
OR
PA
SC
TN
CO
WA
WI
VA
ME
MN
MI
NC
TX
KY
WV
RI
NE
VT
NV OH
SD
AR
IN
NH
MT
ID
WY
ND
NMOK
LA
MS AL
DE
AKAK
HI
DC
85-153 (1st Quartile)
154-173 (2nd Quartile)
No Data
174-192 (3rd Quartile)
PR193-234 (4th Quartile)
Long-stay nursing home residents who received antipsychotic medication by State 2013
Source Centers for Medicare amp Medicaid Services Minimum Data Set 2013
Denominator Nursing home residents of any age who have at least 101 cumulative days in the facility
Note For this measure lower percentages are better
AZ
CA
UT
CT
FL
GA
IA
IL
KS
MA
MDMO
NJ
NY
OR
PA
SC
TN
CO
WA
WI
VA
ME
MN
MI
NC
TX
KY
WV
RI
NE
VT
NV OH
SD
AR
IN
NH
MT
ID
WY
ND
NMOK
LA
MS AL
DE
AKAK
HI
DC
85-153 (1st Quartile)
154-173 (2nd Quartile)
No Data
174-192 (3rd Quartile)
PR193-234 (4th Quartile)
Patient Safety
Overall This map shows overall rankings of States (by quartiles) in the percentage of long-
stay nursing home residents who received antipsychotic medication in 2013 Values ranged
from 85 to 234
Differences by State Interquartile ranges follow
First quartile (lowest) 85-153 (AK CA DC DE HI MD MI MN NJ NC SC
WI WV)
Second quartile (second lowest) 153 -173 (CO ID MT NM NY ND OR PA
RI SD VT WA WY)
Third quartile (second highest) 174-192 (AZ CT GA IN IA KS ME MA MO
NV OH OK VA)
Fourth quartile (highest) 193-234 (AL AR FL IL KY LA MS NE NH TN
TX UT)
Eight of the 12 States in the quartile with the highest percentage of long-stay nursing
home residents who received antipsychotic medication were in the South
Patient Safety in the Home Health Setting
Home health agencies provide services to beneficiaries who are homebound and need skilled
nursing care or therapy
Approximately 12 million individuals receive home health care from more than 33000
providers for causes including acute illness long-term health conditions permanent
disability or terminal illness (NAHCH 2010)
Improvements among home health patients can reflect the quality of care from home health
agencies
Measures include
Home health patients with improvement in surgical wounds
Home health patients with improvements in their ability to take medications orally
National Healthcare Quality and Disparities Report | 27
Patient Safety
Improvement in Surgical Wounds
75
80
85
90
95
100
2010 2011 2012 2013
Pe
rce
nt
White Black Asian Hispanic
75
80
85
90
95
100
2010 2011 2012 2013
Pe
rce
nt
Total 0-64 65-74
75-84 85+
2011 Achievable
Benchmark 913
Home health patients with improvement in surgical wounds by age and raceethnicity 2010-2013
Source Centers for Medicare amp Medicaid Services Outcome and Assessment Information Set 2010-2013
Denominator Number of home health episodes during the measurement period in which the patient of any age had a surgical wound and the
episode ended with the patient discharged from home health care
Note White Black and Asian are non-Hispanic Hispanic includes all races
2011 Achievable
Benchmark 913
75
80
85
90
95
100
2010 2011 2012 2013
Per
cen
t
White Black Asian Hispanic
75
80
85
90
95
100
2010 2011 2012 2013
Per
cen
t
Total 0-64 65-74
75-84 85+
2011 Achievable
Benchmark 913
Home health patients with improvement in surgical wounds by age and raceethnicity 2010-2013
Source Centers for Medicare amp Medicaid Services Outcome and Assessment Information Set 2010-2013
Denominator Number of home health episodes during the measurement period in which the patient of any age had a surgical wound and the
episode ended with the patient discharged from home health care
Note White Black and Asian are non-Hispanic Hispanic includes all races
2011 Achievable
Benchmark 913
Importance Normal wound healing after an operation is an important marker of good care
The home health team should regularly change wound dressing and teach the patient about
wound care
Overall Percentage In 2013 the percentage of home health patients with improvement in
their surgical wounds was 890
Trends The percentage of health home patients with surgical wound improvement increased
between 2010 and 2013
Groups With Disparities
In 2013 compared with residents under age 65 years (856) all other age groups had
better percentages of improvement in surgical wounds The percentage was 893 for
ages 65-74 905 for ages 75-84 and 917 for ages 85 and over
In 2013 compared with Whites (893) Blacks (878) Asians (882) and Hispanics
(874) had worse percentages of improvement in surgical wounds
The 2010 through 2013 trend in the percent of home health patients with surgical wound
improvement did not change for those over age 65 relative to persons under age 65 years
28 | National Healthcare Quality and Disparities Report
Patient Safety
Achievable Benchmark
The 2011 top 5 State achievable benchmark was 913 The States that contributed to the
benchmark are Alabama Mississippi Nevada Oklahoma and South Carolina
Home health patients age 85 years and over achieved the benchmark for surgical wound
improvement in 2013
At the current rate of progress patients ages 75-84 years could reach the benchmark
within a year Patients ages 65-74 years could achieve the benchmark in approximately 2
years
White home health patients could achieve the benchmark in approximately 2 years
Improvement in Ability To Take Medication Orally
0
20
40
60
80
100
2010 2011 2012 2013
Per
cen
t
White Black Asian Hispanic
0
20
40
60
80
100
2010 2011 2012 2013
Per
cen
t
Total 0-64 65-74
75-84 85+
2008 Achievable
Benchmark 516
Home health patients with improvement in their ability to take medications orally by age and raceethnicity 2010-2013
Source Centers for Medicare amp Medicaid Services Outcome and Assessment Information Set 2010-2013
Denominator Number of home health care episodes in which a patient of any age was unable to take oral medications independently at the
start of the episode that ended during the measurement period
Note White Black and Asian are non-Hispanic Hispanic includes all races
2008 Achievable
Benchmark 516
0
20
40
60
80
100
2010 2011 2012 2013
Per
cen
t
White Black Asian Hispanic
0
20
40
60
80
100
2010 2011 2012 2013
Per
cen
t
Total 0-64 65-74
75-84 85+
2008 Achievable
Benchmark 516
Home health patients with improvement in their ability to take medications orally by age and raceethnicity 2010-2013
Source Centers for Medicare amp Medicaid Services Outcome and Assessment Information Set 2010-2013
Denominator Number of home health care episodes in which a patient of any age was unable to take oral medications independently at the
start of the episode that ended during the measurement period
Note White Black and Asian are non-Hispanic Hispanic includes all races
2008 Achievable
Benchmark 516
Importance Taking medications correctly is important to the health status and quality of life
of individuals living in the community The home health team can help teach a patient ways
to organize drugs and take them properly
Overall Percentage In 2013 the percentage of home health patients with improvement in
their ability to take medications orally was 513
Trends Between 2010 and 2013 there was improvement in the overall percentage of home
health patients with improved ability to take medications orally
National Healthcare Quality and Disparities Report | 29
Patient Safety
Groups With Disparities
In 2013 the percentage of home health patients with improvement in their ability to take
medications orally was worse for those age 85 years and over (398) compared with
those under age 65 years (577)
The percentage of patients with improvement in their ability to take medications orally
was worse among Hispanic home health patients (400) than among White patients
(526) in 2013
From 2010 to 2013 the gap between Blacks and Whites decreased and the gap between
Asians and Whites and Hispanics and Whites increased
Achievable Benchmark
The 2008 top 5 State achievable benchmark was 516 The States that contributed to the
achievable benchmark are Iowa Massachusetts New Jersey North Dakota and South
Carolina
The benchmark was achieved among age groups under 85 years and by White and Black
home health patients
The total population is estimated to reach the benchmark in less than a year Hispanic
patients and patients age 85 years and over are farthest from the benchmark
Improvement in Ability To Take Medication Orally by State
Home health patients with improvement in their ability to take medications orally by raceethnicity by State 2013
Source Centers for Medicare amp Medicaid Services Outcome and Assessment Information Set 2013
Denominator Number of home health care episodes in which a patient of any age was unable to take oral medications independently at the
start of the episode that ended during the measurement period
AZ
CA
UT
CT
FL
GA
IA
IL
KS
MA
MDMO
NJ
NY
OR
PA
SC
TN
CO
WA
WI
VA
ME
MN
MI
NC
TX
KY
WV
RI
NE
VT
NV OH
SD
AR
IN
NH
MT
ID
WY
ND
NMOK
LA
MS AL
DE
AKAK
HI
No significant difference between rates
of Hispanics and non-Hispanic Whites
Non-Hispanic Whites have significantly
worse rate than Hispanics
States do not have data that meet the
criteria for statistical reliability data
quality or confidentiality
Hispanics have significantly worse rate
than non-Hispanic Whites
DC
Home health patients with improvement in their ability to take medications orally by raceethnicity by State 2013
Source Centers for Medicare amp Medicaid Services Outcome and Assessment Information Set 2013
Denominator Number of home health care episodes in which a patient of any age was unable to take oral medications independently at the
start of the episode that ended during the measurement period
AZ
CA
UT
CT
FL
GA
IA
IL
KS
MA
MDMO
NJ
NY
OR
PA
SC
TN
CO
WA
WI
VA
ME
MN
MI
NC
TX
KY
WV
RI
NE
VT
NV OH
SD
AR
IN
NH
MT
ID
WY
ND
NMOK
LA
MS AL
DE
AKAK
HI
No significant difference between rates
of Hispanics and non-Hispanic Whites
Non-Hispanic Whites have significantly
worse rate than Hispanics
States do not have data that meet the
criteria for statistical reliability data
quality or confidentiality
Hispanics have significantly worse rate
than non-Hispanic Whites
DC
30 | National Healthcare Quality and Disparities Report
Patient Safety
Geographic Variation
In 2013 Hispanic home health patients had worse rates of improvement in taking oral
medications than non-Hispanic White patients in 11 States (Arizona California
Connecticut Florida Illinois Indiana Massachusetts Nevada New York North
Carolina and Texas
Non-Hispanic White patients had worse rates of improvement than Hispanic patients in
five States (Hawaii Idaho Iowa Michigan and Pennsylvania)
Patient Safety in the Ambulatory Setting
Although patient safety initiatives frequently focus on inpatient hospital events adverse
effects of medical care may be identified and treated in outpatient settings
Adverse effects of medical care can follow care or procedures in hospitals emergency
departments physician offices or other settings
Measures include
Patient safety and quality issues by frequency of occurrence in outpatient medical offices
Adults age 65 years and over who received potentially inappropriate prescription medications during the calendar year
Percentage of hemodialysis patients with vascular catheter in use for 90 days or longer
For more information see the PSNet link to Patient Safety Primer Patient Safety in
Ambulatory Care httpspsnetahrqgovprimersprimer16patient-safety-in-ambulatory-care
National Healthcare Quality and Disparities Report | 31
Patient Safety
Patient Safety and Quality Issues
Patient safety and quality issues by frequency of occurrence in outpatient medical offices 2014
Source Westat analysis of the AHRQ 2014 Medical Office Survey on Patient Safety Culture Comparative Database (N=935)
Note For this measure less frequent occurrences during the year are better
0
20
40
60
80
100
A pharmacy contactedour office to clarify orcorrect a prescription
A patient was unableto get an appointmentwithin 48 hours for anacuteserious problem
A patients medicationlist was not updatedduring his or her visit
The results from a labor imaging test were notavailable when needed
A patients chartmedicalrecord was not available
when needed
Occurred DailyWeekly
Occurred Monthly
Occurred Not at All to Several Times Over the Past Year
Patient safety and quality issues by frequency of occurrence in outpatient medical offices 2014
Source Westat analysis of the AHRQ 2014 Medical Office Survey on Patient Safety Culture Comparative Database (N=935)
Note For this measure less frequent occurrences during the year are better
0
20
40
60
80
100
A pharmacy contactedour office to clarify orcorrect a prescription
A patient was unableto get an appointmentwithin 48 hours for anacuteserious problem
A patients medicationlist was not updatedduring his or her visit
The results from a labor imaging test were notavailable when needed
A patients chartmedicalrecord was not available
when needed
Occurred DailyWeekly
Occurred Monthly
Occurred Not at All to Several Times Over the Past Year
Importance Most health care takes place in the outpatient or ambulatory care setting Lack
of access to care and lack of access to timely and accurate medical information and test
results may contribute to patient safety events such as missed or delayed diagnoses
medication errors failure to order appropriate diagnostic or laboratory tests incorrect
interpretation of tests and inadequate followup on results
Overall Percentage
Almost 30 of medical offices participating in the survey reported daily or weekly
occurrences of being contacted by the pharmacist for clarification or correction on a
prescription
After prescription clarifications or corrections by the pharmacy medical offices were
next most likely to report daily or weekly issues with patients being unable to get an
appointment within 48 hours for an acute or serious problem (14) or the patientrsquos
medication list not getting updated during their visit (11)
The share of medical offices reporting that lab or imaging tests were not available when
needed reached nearly 20 when considering monthly occurrences as well as those that
occurred more frequently
32 | National Healthcare Quality and Disparities Report
Patient Safety
Potentially Inappropriate Prescriptions for Older Adults
Adults age 65 years and over who received potentially inappropriate prescription medications during the calendar year by sex and
perceived health status 2003ndash2013
Source Agency for Healthcare Research and Quality Medical Expenditure Panel Survey 2003-2013
Note For this measure lower percentages are better Prescription medications received include all prescribed medications initiall y purchased
or otherwise obtained as well as any refills For more information on inappropriate medications see the American Geriatrics Society 2012 Beers
Criteria Update Expert Panel American Geriatrics Society updated Beers Criteria for potentially inappropriate medication use in older adults J
Am Geriatr Soc 2012 Apr60(4)616-31
0
5
10
15
20
25
30
Per
cen
t
Total Male Female
0
5
10
15
20
25
30
Per
cen
t
ExcellentVery GoodGood FairPoor
Adults age 65 years and over who received potentially inappropriate prescription medications during the calendar year by sex and
perceived health status 2003ndash2013
Source Agency for Healthcare Research and Quality Medical Expenditure Panel Survey 2003-2013
Note For this measure lower percentages are better Prescription medications received include all prescribed medications initially purchased
or otherwise obtained as well as any refills For more information on inappropriate medications see the American Geriatrics Society 2012 Beers
Criteria Update Expert Panel American Geriatrics Society updated Beers Criteria for potentially inappropriate medication use in older adults J
Am Geriatr Soc 2012 Apr60(4)616-31
0
5
10
15
20
25
30
Per
cen
t
Total Male Female
0
5
10
15
20
25
30
Per
cen
t
ExcellentVery GoodGood FairPoor
Importance Some drugs that are prescribed for older patients are known to be potentially
harmful for this age group
Overall Percentage In 2013 the percentage of adults age 65 years and over who received
potentially inappropriate prescription medications was 114
Trends From 2003 to 2013 the percentage of adults age 65 years and over who received
potentially inappropriate prescription medications improved overall for both sexes and for
people with excellentvery goodgood health status and people with fairpoor health status
Groups With Disparities
In all years the percentage of patients receiving potentially inappropriate medications
was higher among females compared with males This gap was not changing over time
In all years from 2003 to 2013 the percentage of patients receiving potentially
inappropriate medications was higher among people with fairpoor health status
compared with people with excellentgood health status This gap was not changing over
time
National Healthcare Quality and Disparities Report | 33
Patient Safety
Long-Term Catheter Use in Dialysis Patients
HI
AKAK
AZ
CA
UT
CT
FL
GA
IA
IL
KS
MA
MDMO
NJ
NY
OR
PA
SC
TN
CO
WA
WI
VA
ME
MN
MI
NC
TX
KY
WV
RI
NE
VT
NV OH
SD
AR
IN
NH
MT
ID
WY
ND
NMOK
LA
MSAL
DE
DC
10-12
13-18
7-9
PR
Source Centers for Medicare and Medicaid Services Dialysis Facility Compare 2014
Denominator At-risk adult Medicare patients with a central venous catheter who were receiving regular hemodialysis treatments at dialysis
facilities
Note For this measure lower percentages are better
Percentage of hemodialysis patients with central venous catheters used for vascular access for 90 days or longer by State 2014
HI
AKAK
AZ
CA
UT
CT
FL
GA
IA
IL
KS
MA
MDMO
NJ
NY
OR
PA
SC
TN
CO
WA
WI
VA
ME
MN
MI
NC
TX
KY
WV
RI
NE
VT
NV OH
SD
AR
IN
NH
MT
ID
WY
ND
NMOK
LA
MSAL
DE
DC
10-12
13-18
7-9
PR
Source Centers for Medicare and Medicaid Services Dialysis Facility Compare 2014
Denominator At-risk adult Medicare patients with a central venous catheter who were receiving regular hemodialysis treatments at dialysis
facilities
Note For this measure lower percentages are better
Percentage of hemodialysis patients with central venous catheters used for vascular access for 90 days or longer by State 2014
Importance Central venous catheters are frequently used for vascular access to dialysis
patients until a fistula or graft is formed Central venous catheters have higher rates of
infection and adverse events among patients receiving dialysis treatment compared with
other forms of vascular access To decrease the likelihood of adverse events catheters should
be used for less than 90 days
Overall Percentage Nationally an average of 10 of dialysis patients used central venous
catheters for 90 days or longer in 2014
Geographic Variation In 2014 Alabama and Kansas had the lowest percentages of dialysis
patients using central venous catheters for 90 days or longer (7) and Puerto Rico had the
highest percentage (18) of long-term catheter use
Patient Safety Infrastructure
Efforts to improve patient safety have been accompanied by various infrastructure
enhancements
Growth in patient safety organizations which assist providers in detecting and reducing
risks and hazards from care delivery that may lead to patient harm
System improvement initiatives at the Veterans Health Administration (VHA)
34 | National Healthcare Quality and Disparities Report
Patient Safety
Development of the National Practitioner Data Bank a clearinghouse for information on
medical malpractice payments
Patient Safety Organizations
Patient safety organizations (PSOs) aim to reduce preventable adverse events near misses
and unsafe conditions in all health care settings
PSOs provide an environment for health care providers to voluntarily report discuss and
learn from patient safety events and quality analyses on a privileged and confidential basis
Measures include
Number of PSOs serving each State
Variation in concentrations of compounded liquid medications for children
Patient Safety Organizations AHRQ Common Formats
AHRQ Common Formats provide a standardized method for PSOs health care providers
and other organizations to collect and report patient safety events
Data element standards are important for aggregating and analyzing events across
providers
AHRQ Common Formats have been developed for a variety of settings of care
Acute care hospitals
Skilled nursing facilities
Retail pharmacy
More information is available at httpspsoahrqgovcommon
National Healthcare Quality and Disparities Report | 35
Patient Safety
Number of Patient Safety Organizations
AZ (2)
CA (3)
UT (2)
CT(3)
FL (8)
GA (5)
IA (4)
IL (7)
KS (5)
MA(3)
MD (4)MO(2)
NJ(3)
NY (5)
OR (3)
PA (5)
SC (4)
TN (5)
CO (2)
WA (2)
WI (5)
VA (7)
ME(2)
MN(3)
MI (3)
NC (7)
TX (6)
KY (4)WV (3)
RI(2)
NE (2)
VT(2)
NV (2)
OH (2)
SD (1)
AR (4)
IN (2)
NH(2)
MT (2)
ID (3)
WY (2)
ND (1)
NM (3)OK (2)
LA (1)
MS (2)
AL (2)
DE(2)
HI (2)
AKAK (2)
DC(3)
PR (0)
1-2
3-4
5-6
7-8
Number of PSOs
excluding PSOs
operating nationally
Number of Patient Safety Organizations by area served 2014
Source Agency for Healthcare Research and Quality Patient Safety Organization Information Form Calendar Year 2014 and PSO-PPC
Contact Database
Note PSOs included in this map were AHRQ-listed during any part of 2014 and submitted the PSO Profile to the PSO Privacy Protection
Center (PSO-PPC) in early 2015 A PSO may have members in one or more States regardless of headquarters location Each State shows the
number of PSOs that serve that State map excludes 38 PSOs that are available to providers in all States
AZ (2)
CA (3)
UT (2)
CT(3)
FL (8)
GA (5)
IA (4)
IL (7)
KS (5)
MA(3)
MD (4)MO(2)
NJ(3)
NY (5)
OR (3)
PA (5)
SC (4)
TN (5)
CO (2)
WA (2)
WI (5)
VA (7)
ME(2)
MN(3)
MI (3)
NC (7)
TX (6)
KY (4)WV (3)
RI(2)
NE (2)
VT(2)
NV (2)
OH (2)
SD (1)
AR (4)
IN (2)
NH(2)
MT (2)
ID (3)
WY (2)
ND (1)
NM (3)OK (2)
LA (1)
MS (2)
AL (2)
DE(2)
HI (2)
AKAK (2)
DC(3)
PR (0)
1-2
3-4
5-6
7-8
Number of PSOs
excluding PSOs
operating nationally
Number of Patient Safety Organizations by area served 2014
Source Agency for Healthcare Research and Quality Patient Safety Organization Information Form Calendar Year 2014 and PSO-PPC
Contact Database
Note PSOs included in this map were AHRQ-listed during any part of 2014 and submitted the PSO Profile to the PSO Privacy Protection
Center (PSO-PPC) in early 2015 A PSO may have members in one or more States regardless of headquarters location Each State shows the
number of PSOs that serve that State map excludes 38 PSOs that are available to providers in all States
Importance All patient safety organizations (PSOs) have authority to operate in all 50
States and US territories but not all do In 2014 38 PSOs self-reported being available to
providers nationally PSOs not available nationally serve specific States
Geographic Variation
Nearly all States have at least 2 PSOs available to providers in their State in addition to
the 38 national PSOs that serve all States
Florida has the most PSOs available with 8 in addition to the 38 nationally available
PSOs The States with the largest number of PSOs available are generally on the East
Coast (eg North Carolina Virginia New York Pennsylvania Tennessee Georgia) or
have large populations (eg Texas Illinois)
North Dakota South Dakota and Louisiana are the only states with just one PSO serving
their State in addition to the 38 national PSOs
Puerto Rico is served by one national PSO only
36 | National Healthcare Quality and Disparities Report
Patient Safety
Compounded Liquid Medications for Children
Compounded liquid medications for children in Michigan 2012
Source Levy S Buckley B Safe Table Success The MI Pediatric Safety Collaboration Presentation presented at the 7th Annual
Meeting of Patient Safety Organizations (PSOs) Rockville MD 2015 April and Rood JM Engels MJ Ciarkowski SL et al Variability in
compounding of oral liquids for pediatric patients a patient safety concern J Am Pharm Assn 201454(4)383-9
Note Information represents 244 responses to online survey of approximately 2000 Michigan pharmacies conducted in June 2012 by
The University of Michigan College of Pharmacy in collaboration with the Michigan Pharmacists Association
0
10
20
30
40
50
1 2 3 4 5 6 7 8 9
Nu
mb
er o
f D
rugs
Number of Unique Concentrations
Number of Different Compounded Concentrations per Drug
0
10
20
30
40
50
No Harm No Harm ButMonitoring
TemporaryHarm
Pe
rce
nt
Compounding Errors by Related Harm and Pharmacy Setting
Inpatient Outpatient
Compounded liquid medications for children in Michigan 2012
Source Levy S Buckley B Safe Table Success The MI Pediatric Safety Collaboration Presentation presented at the 7th Annual
Meeting of Patient Safety Organizations (PSOs) Rockville MD 2015 April and Rood JM Engels MJ Ciarkowski SL et al Variability in
compounding of oral liquids for pediatric patients a patient safety concern J Am Pharm Assn 201454(4)383-9
Note Information represents 244 responses to online survey of approximately 2000 Michigan pharmacies conducted in June 2012 by
The University of Michigan College of Pharmacy in collaboration with the Michigan Pharmacists Association
0
10
20
30
40
50
1 2 3 4 5 6 7 8 9
Nu
mb
er o
f D
rugs
Number of Unique Concentrations
Number of Different Compounded Concentrations per Drug
0
10
20
30
40
50
No Harm No Harm ButMonitoring
TemporaryHarm
Per
cen
t
Compounding Errors by Related Harm and Pharmacy Setting
Inpatient Outpatient
Importance
Liquid medications are widely used in pediatrics because many children find it difficult
to swallow tablets or capsules If not commercially manufactured these liquid
medications require a pharmacist to compound them to the correct dosage for the patient
This practice of compounding has led to a variety of medication concentrations in use In
the absence of standard concentrations for compounded medications there is a risk that
children may accidentally receive medications that are too potent and can be dangerous
or are too weak to be effective
The Michigan Health amp Hospital Association Keystone Center Patient Safety
Organization hosts five Pediatric Safe Tables each year Safe Tables provided a
confidential and legally protected environment to discuss challenges and improvement
strategies regarding inconsistent medication concentrations for compounded oral liquids
without fear of punitive action against them
National Healthcare Quality and Disparities Report | 37
Patient Safety
Overall Percentage
More than half (527) of drugs identified in the 2012 survey had 3 or more unique
concentrations dispensed to children across Michigan For example Rifampin used to
treat bacterial infections was reported to have 8 different concentrations dispensed to
patients
Nearly one-third (313) of reported errors caused temporary harm or required additional
monitoring despite no harm
Standardization of Compounded Liquid Medications
Source Michigan Health amp Hospital Association Keystone Center Patient Safety Organization and University of Michigan College of Pharmacy
State-Wide Initiative to Standardize the Compounding of Oral Liquids in Pediatrics
Standardization of compounded liquid medications for children in Michigan 2011
Issue identificationbull Hospitals attending PSO Pediatrics Safe
Table raise compounded medication concentrations as a major safety issue
bull Small focus group determines extent of problem
bull Michigan pharmacies are surveyed about baseline concentrations
Develop Interventionbull PSO Quarterly Safe Tables are held to
discuss cases and practicesbull Team develops recommendations for
standard concentrationsbull Consensus is achieved for frequently
compounded pediatric medications 470 formulations for 147 drug entities are reduced to 104 concentrations for 100 drugs
Practice changebull Toolkit is createdbull Standards are disseminated to Michigan
prescribers and pharmacies bull Standards are disseminated to PSO
members and Safe Table participants
Source Michigan Health amp Hospital Association Keystone Center Patient Safety Organization and University of Michigan College of Pharmacy
State-Wide Initiative to Standardize the Compounding of Oral Liquids in Pediatrics
Standardization of compounded liquid medications for children in Michigan 2011
Issue identificationbull Hospitals attending PSO Pediatrics Safe
Table raise compounded medication concentrations as a major safety issue
bull Small focus group determines extent of problem
bull Michigan pharmacies are surveyed about baseline concentrations
Develop Interventionbull PSO Quarterly Safe Tables are held to
discuss cases and practicesbull Team develops recommendations for
standard concentrationsbull Consensus is achieved for frequently
compounded pediatric medications 470 formulations for 147 drug entities are reduced to 104 concentrations for 100 drugs
Practice changebull Toolkit is createdbull Standards are disseminated to Michigan
prescribers and pharmacies bull Standards are disseminated to PSO
members and Safe Table participants
The Role of PSO Safe Tables Based on adverse medication events discussed in the
Michigan Health amp Hospital Association (MHA) Keystone Center Patient Safety
Organization (PSO) Safe Tables in July 2011 the Michigan Pediatric Safety Collaboration
was developed to further assess the scope of the problem and formulate a solution
The Collaborative The Michigan Pediatric Safety Collaboration includes individuals from
the University of Michigan College of Pharmacy the Michigan Pharmacists Association
(MPA) the Food and Drug Administration (FDA) and the MHA Keystone PSO
38 | National Healthcare Quality and Disparities Report
Patient Safety
Practice Change
As a result of the standardization effort 470 unique formulations for 147 drug entities
were reduced to 104 different concentrations for 100 drugs
The Michigan Pediatric Safety Collaboration developed a multistep process to implement
standards for compounding medications The MPA surveyed pharmacies in Michigan to
better define the nature and scope of the problem The PSO continued to act as convener
The result was the creation and dissemination of statewide standards for 120 frequently
compounded pediatric medications
Veterans Health Administration
The National Center for Patient Safety is part of the Veterans Health Administration the
Nationrsquos largest integrated health care system
Patient safety-related system improvement initiatives include
The Daily Planreg
Purchasing for Safety Initiative
Patient Safety Improvement Initiative
Patient safety improvement initiative The Daily Planreg at Veterans Affairs Medical Centers 2009
Source King BJ Mills PD Fore A et al The Daily Planreg including patients for safetys sake Nurs Manage 201243(3)15-8
0
10
20
30
40
50
Identified atleast one
error
Identifiederror
of omission
Identifiederror
ofcommission
Nurses Who Identified Errors in Patient Treatment Plan by Type
0
10
20
30
40
50
Patient founddiscrepancy inplanned care
Family founddiscrepancy inplanned care
Nursing Stafffound
discrepancyin plannedtreatment
Respondents Who Identified Errors or Discrepancies Through The Daily Plan reg
Patient safety improvement initiative The Daily Planreg at Veterans Affairs Medical Centers 2009
Source King BJ Mills PD Fore A et al The Daily Planreg including patients for safetys sake Nurs Manage 201243(3)15-8
0
10
20
30
40
50
Identified atleast one
error
Identifiederror
of omission
Identifiederror
ofcommission
Nurses Who Identified Errors in Patient Treatment Plan by Type
0
10
20
30
40
50
Patient founddiscrepancy inplanned care
Family founddiscrepancy inplanned care
Nursing Stafffound
discrepancyin plannedtreatment
Respondents Who Identified Errors or Discrepancies Through The Daily Plan reg
National Healthcare Quality and Disparities Report | 39
Patient Safety
Importance The Daily Planreg
is a two-page printed summary that acts as a schedule for
patients and providers each day It shows the procedures laboratory tests and medications
scheduled for that day and lists essential health information such as patientrsquos name allergies
and current medications It can be tailored for a patientrsquos needs by extracting orders from the
electronic medical record (EMR) The Daily Planreg
is intended to facilitate patient and family
engagement throughout the course of care The Daily Planreg
shows promise for improving
patient safety Since 2009 the VA has implemented The Daily Planreg
in more than 65
hospitals both inpatient and outpatient care settings The Daily Planreg
is shared more than
75000 times a month and the VA plans to continue the spread of The Daily Planreg
at
additional sites in 2016
Findings
As part of a pilot test in 2009 a total of 198 patients and 85 nurses responded to a survey
across 10 facilities Nurses had an average of 34 patients per shift who received The
Daily Planreg Patients responded about their own experiences whereas nurses reported
about all of their patients who received The Daily Planreg
Nearly half (475) of patients reported finding a discrepancy in planned care through
The Daily Planreg In addition 30 of patients reported that their family members found a
discrepancy Although not every discrepancy will be a potential medical error having a
shared understanding of the plan of care decreases the risk of error
More than one in six nurses (176) identified a discrepancy in treatment among their
patients through The Daily Planreg Most of these nurses (153) found one or more errors
of omission and a smaller share (106) of nurses found one or more errors of
commission some found both
40 | National Healthcare Quality and Disparities Report
Patient Safety
Issues Related to Ventilators
Common use-issues related to ventilators at the Veterans Health Administration 2006-2014 (combined)
Source Veterans Health Administration National Center for Patient Safety data collected October 2006 to October 2014
Note Examples of equipment failures include ventilator shutdown and other ventilator problems Ventilator settings include setup problems and
incorrect settings Support activities include space utilities and supplies Transport includes accidental extubation other transportation issues
and vehicle-related issues Alarms include alarm settings and alarm connection Training includes unknown ventilator model and other training
concerns
0
20
40
60
80
100
120
140
160
EquipmentFailure
VentilatorSettings
SupportActivities
Transport Alarms Training
Nu
mb
er o
f R
epo
rts
Common use-issues related to ventilators at the Veterans Health Administration 2006-2014 (combined)
Source Veterans Health Administration National Center for Patient Safety data collected October 2006 to October 2014
Note Examples of equipment failures include ventilator shutdown and other ventilator problems Ventilator settings include setup problems and
incorrect settings Support activities include space utilities and supplies Transport includes accidental extubation other transportation issues
and vehicle-related issues Alarms include alarm settings and alarm connection Training includes unknown ventilator model and other training
concerns
0
20
40
60
80
100
120
140
160
EquipmentFailure
VentilatorSettings
SupportActivities
Transport Alarms Training
Nu
mb
er o
f R
epo
rts
Importance Beginning with a focus on ventilators the Veterans Health Administrationrsquos
human factors-based Purchasing for Safety Initiative communicates the most common use-
issues associated with medical devices in order to ultimately remove or contain identified
vulnerabilities and prevent further harm
Event Reporting Patient safety managers report events and close calls from more than 150
VA facilities to a national database The largest number of use issues related to ventilators
involved equipment failure and issues such as spontaneous ventilator shutdown compressor
failure and broken or missing parts Other categories of ventilator use issues involved the
physical space where the ventilator was used challenges of transporting patients on
ventilators and problems with ventilator settings and alarms Root cause analyses on reports
are conducted and Patient Safety Alerts are issued to share the learning internally
Other Key Components
Data on ventilator issues from the VA and the Food and Drug Administrationrsquos Medical
Product Safety Network are the basis for a ldquogovernment-industry dayrdquo to work with
manufacturers This information is used to help the device manufacturers better
understand the limits of human use of their products
National Healthcare Quality and Disparities Report | 41
Patient Safety
The VA also trains noncliniciansmdashsuch as biomedical engineers across the
organizationmdashto understand the devices consider the situation for their use and identify
what can go wrong (ldquofailure modesrdquo) in advance
The VA encourages discussions among clinicians about their experience in using devices
In the Applied Patient Safety Challenge hundreds of staff participate in brainstorming
about solutions and strategies for dealing with unexpected scenarios involving devices
National Practitioner Data Bank
Medical malpractice actions are one way to flag potential medical errors
Medical Malpractice Payment Reports are submitted to the National Practitioner Data Bank
by medical malpractice payers
Report of a monetary exchange made for the benefit of a physician dentist or other
health care provider
Result of a settlement or judgment of a written complaint or claim based on that
providerrsquos delivery of or failure to deliver health care services
Number of Medical Malpractice Payment Reports by Setting
Number of Medical Malpractice Payment Reports by health care setting 2004-2014
Source National Practitioner Data Bank (NPDB) Public Use Data File Health Resources and Services Administration Bureau of Health
Professions Division of Practitioner Data Banks 2004-2014
Note Health care setting was not collected by the NPDB for 2104 reports in 2004 ldquoOtherrdquo includes Medical Malpractice Payment Reports
related to unknown settings as well as those for a combination of inpatient and outpatient settings Reports pertain to patients of any age
0
2000
4000
6000
8000
10000
12000
14000
16000
18000
20000
2004 2005 2006 2007 2008 2009 2010 2011 2012 2013 2014
Nu
mb
er o
f R
epo
rts
Total Inpatient Outpatient Other
Number of Medical Malpractice Payment Reports by health care setting 2004-2014
Source National Practitioner Data Bank (NPDB) Public Use Data File Health Resources and Services Administration Bureau of Health
Professions Division of Practitioner Data Banks 2004-2014
Note Health care setting was not collected by the NPDB for 2104 reports in 2004 ldquoOtherrdquo includes Medical Malpractice Payment Reports
related to unknown settings as well as those for a combination of inpatient and outpatient settings Reports pertain to patients of any age
0
2000
4000
6000
8000
10000
12000
14000
16000
18000
20000
2004 2005 2006 2007 2008 2009 2010 2011 2012 2013 2014
Nu
mb
er o
f R
epo
rts
Total Inpatient Outpatient Other
42 | National Healthcare Quality and Disparities Report
Patient Safety
Trends The total number of medical malpractice payment reports (MMPRs) per year
decreased from 17641 in 2004 to 12699 in 2014
Variation Across Reports
Of 157022 MMPRs from 2004 through 2014 more reports related to care in the
outpatient setting (71937) than in the inpatient setting (60391)
Diagnosis-related and treatment-related payments were the most frequent types of
reports each accounting for about 27 of cases Reports of payments for medication-
related cases accounted for only 5 of MMPRs (data not shown)
Number of Medical Malpractice Payment Reports by Allegation and Harm
Number of Medical Malpractice Payment Reports by type of allegation and harm severity 2004-2014
Key Temporary injury = Minor temporary injury and Major temporary injury Permanent significant injury = Significant Permanent Injury
Major Permanent Injury Quadriplegia Brain Damage Lifelong care
Source National Practitioner Data Bank Public Use Data File Health Resources and Services Administration Bureau of Health Professions
Division of Practitioner Data Banks 2004-2014
Note Reports pertain to patients of any age
0
20
40
60
80
100
Treatment(n=42913)
Diagnosis(n=42507)
Surgery(n=36845)
Obstetrics(n=10555)
Medication(n=8287)
Monitoring(n=5329)
Anesthesia(n=4276)
Equipment(n=1161)
BehavioralHealth
(n=879)
Blood(n=379)
EmotionalInjury Only
InsignificantInjury
TemporaryInjury
PermanentMinor Injury
PermanentSignificant Injury
Death Unknown
Number of Medical Malpractice Payment Reports by type of allegation and harm severity 2004-2014
Key Temporary injury = Minor temporary injury and Major temporary injury Permanent significant injury = Significant Permanent Injury
Major Permanent Injury Quadriplegia Brain Damage Lifelong care
Source National Practitioner Data Bank Public Use Data File Health Resources and Services Administration Bureau of Health Professions
Division of Practitioner Data Banks 2004-2014
Note Reports pertain to patients of any age
0
20
40
60
80
100
Treatment(n=42913)
Diagnosis(n=42507)
Surgery(n=36845)
Obstetrics(n=10555)
Medication(n=8287)
Monitoring(n=5329)
Anesthesia(n=4276)
Equipment(n=1161)
BehavioralHealth
(n=879)
Blood(n=379)
EmotionalInjury Only
InsignificantInjury
TemporaryInjury
PermanentMinor Injury
PermanentSignificant Injury
Death Unknown
Overall Percentage From 2004 to 2014 medical malpractice payments were made for
allegations related to
Treatment (42913)
Diagnosis (42507)
Surgery (36845)
Obstetrics (10555)
Medication (8287)
Monitoring (5329)
National Healthcare Quality and Disparities Report | 43
Patient Safety
Anesthesia (4276)
Equipment or products (1161)
Behavioral health (879) and
IV and blood products (379)
Variation Across Reports
Death accounted for more than one-third of harm in payments related to monitoring
(499) diagnosis (393) medication (383) and anesthesia (363) allegations
More than half of all obstetric payments were for allegations of permanent severe harm
(570)
Temporary harm accounted for more than one-third of payments related to equipment
(485) and surgery (360)
Most of the behavioral health-related payments were for emotional harm (457) or
death (338)
References
Agency for Healthcare Research and Quality Making Health Care Safer II An Updated Critical Analysis of the
Evidence for Patient Safety Practices Comparative Effectiveness Review No 211 Rockville MD Agency for
Healthcare Research and Quality March 2013 AHRQ Publication No 13-E001-EF
httpwwwahrqgovsitesdefaultfileswysiwygresearchfindingsevidence-basedshy
reportsservicesqualityptsafetyII-fullpdf
Arriaga AF Lancaster RT Berry RW et al The better colectomy project association of evidence-based best-
practice adherence rates to outcomes in colorectal surgery Ann Surg 2009 Oct250(4)507-13
httpwwwncbinlmnihgovpubmed19734778
Centers for Disease Control and Prevention HAI Prevalence Survey
httpwwwcdcgovHAIsurveillanceindexhtml Last updated March 2016 Accessed March 4 2016
Centers for Disease Control and Prevention Nursing Homes and Assisted Living (Long-Term Care Facilities)
httpwwwcdcgovlongtermcare Last updated September 2015 Accessed March 4 2016
Chassin MR Loeb JM High-reliability health care getting there from here Milbank Q 201391(3)459-90
httpwwwncbinlmnihgovpmcarticlesPMC3790522 Accessed September 23 2015
Chiu Y Bero L Hessol NA et al A literature review of clinical outcomes associated with antipsychotic medication
use in North American nursing home residents Health Policy 2015 Jun119(6)802-813 Epub 2015 Feb 28 PMID
25791166 httpwwwsciencedirectcomsciencearticlepiiS0168851015000652 Accessed June 17 2015
Huybrechts KF Gerhard Crystal S et al Differential risk of death in older residents in nursing homes prescribed
specific antipsychotic drugs Population based cohort study BMJ 2012 Feb 23344e977 PMID 22362541
httpwwwncbinlmnihgovpmcarticlesPMC3285717 Accessed June 17 2015
Institute of Medicine Preventing Medication Errors Quality Chasm Series 2007
httpwwwnapeducatalog11623preventing-medication-errors-quality-chasm-series
National Association for Home Care amp Hospice Basic Statistics About Home Care Updated 2010
httpwwwnahcorgassets1710hc_statspdf Accessed August 31 2015
44 | National Healthcare Quality and Disparities Report
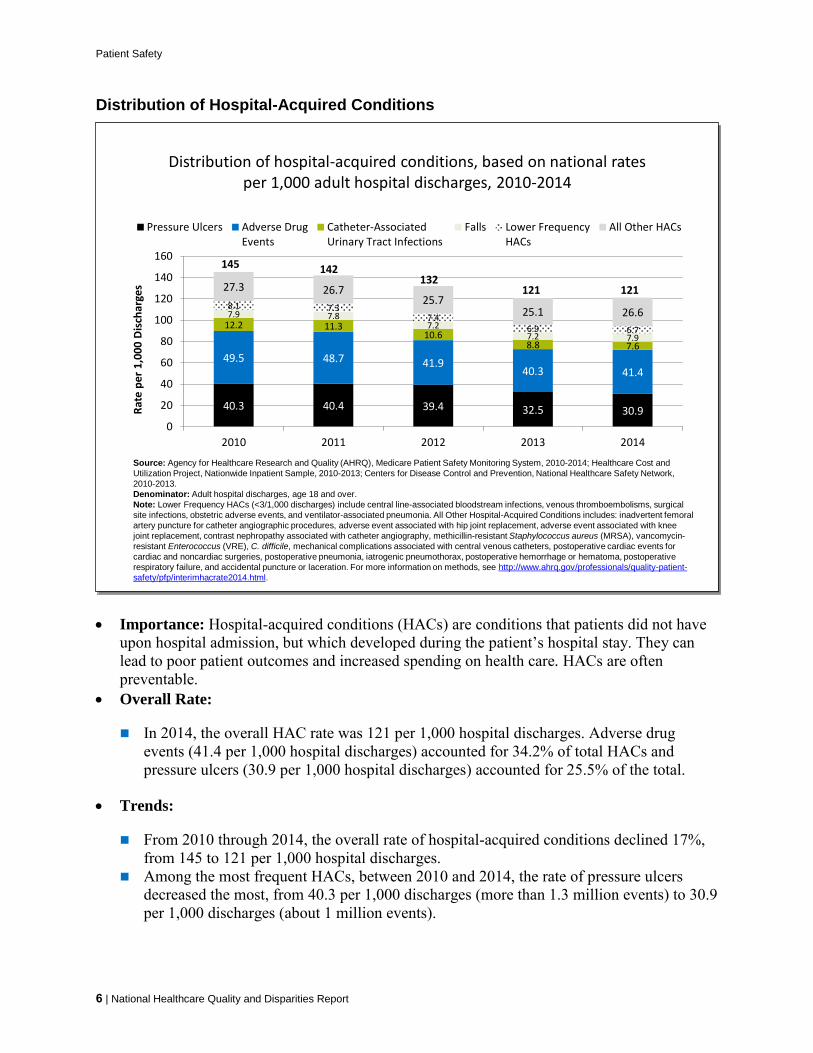
Patient Safety
Postoperative Sepsis
Postoperative sepsis per 1000 adult discharges with an elective operating room procedure by sex and insurance status 2008-2013
Source Agency for Healthcare Research and Quality (AHRQ) Healthcare Cost and Utilization Project Nationwide Inpatient Sample 2008-
2013 and AHRQ Quality Indicators version 44
Denominator All elective hospital surgical discharges for patients age 18 years and over with length of stay of 4 or more days excluding
patients admitted for infection those with cancer or immunocompromised states those with obstetric conditions and admissions specifically for
sepsis
Note For this measure lower rates are better Acute care hospitalizations only Rates are adjusted by age sex age-sex interactions
comorbidities major diagnostic category diagnosis-related group and transfers into the hospital
0
5
10
15
20
25
2008 2009 2010 2011 2012 2013
Rat
e p
er
10
00
Dis
char
ges
Total Male Female
0
5
10
15
20
25
2008 2009 2010 2011 2012 2013
Rat
e p
er
10
00
Dis
char
ges
Private MedicareMedicaid Uninsured
Postoperative sepsis per 1000 adult discharges with an elective operating room procedure by sex and insurance status 2008-2013
Source Agency for Healthcare Research and Quality (AHRQ) Healthcare Cost and Utilization Project Nationwide Inpatient Sample 2008-
2013 and AHRQ Quality Indicators version 44
Denominator All elective hospital surgical discharges for patients age 18 years and over with length of stay of 4 or more days excluding
patients admitted for infection those with cancer or immunocompromised states those with obstetric conditions and admissions specifically for
sepsis
Note For this measure lower rates are better Acute care hospitalizations only Rates are adjusted by age sex age-sex interactions
comorbidities major diagnostic category diagnosis-related group and transfers into the hospital
0
5
10
15
20
25
2008 2009 2010 2011 2012 2013
Rat
e p
er
10
00
Dis
char
ges
Total Male Female
0
5
10
15
20
25
2008 2009 2010 2011 2012 2013
Rat
e p
er
10
00
Dis
char
ges
Private MedicareMedicaid Uninsured
Overall Rate In 2013 the postoperative sepsis rate was 143 per 1000 adult discharges with
an elective operating room procedure
Groups With Disparities
In 2013 female patients had a lower rate of postoperative sepsis than male patients
Also in 2013 patients with Medicaid and those with Medicare had worse sepsis rates
than privately insured patients
From 2008 to 2013 there were no statistically significant changes in the gap between
males and females
From 2008 to 2013 there were no statistically significant changes in the gap between
privately insured patients and other insurance groups
8 | National Healthcare Quality and Disparities Report
Patient Safety
Standardized Infection Ratios
Standardized infection ratios for central line-associated bloodstream infections and surgical site infections 2009-2013 and catheter-associated
urinary tract infections 2010-2013
Key CLABSI = central line-associated bloodstream infection SSI = surgical site infection SCIP = Surgical Care Improvement Project CAUTI =
catheter-associated urinary tract infection
Source Centers for Disease Control and Prevention National Center for Emerging and Zoonotic Infectious Diseases 2013 National and State
Healthcare Associated Infections Progress Report and National Healthcare Safety Network 2009ndash2013
Note For this measure lower numbers are better Acute care hospitalizations only CAUTI excludes neonatal intensive care units
00
02
04
06
08
10
12
14
2009 2010 2011 2012 2013
Stan
dar
diz
ed
Infe
ctio
n R
atio
CLABSI All SSI Combined SCIP Procedures CAUTI All
Standardized infection ratios for central line-associated bloodstream infections and surgical site infections 2009-2013 and catheter-associated
urinary tract infections 2010-2013
Key CLABSI = central line-associated bloodstream infection SSI = surgical site infection SCIP = Surgical Care Improvement Project CAUTI =
catheter-associated urinary tract infection
Source Centers for Disease Control and Prevention National Center for Emerging and Zoonotic Infectious Diseases 2013 National and State
Healthcare Associated Infections Progress Report and National Healthcare Safety Network 2009ndash2013
Note For this measure lower numbers are better Acute care hospitalizations only CAUTI excludes neonatal intensive care units
00
02
04
06
08
10
12
14
2009 2010 2011 2012 2013
Stan
dar
diz
ed
Infe
ctio
n R
atio
CLABSI All SSI Combined SCIP Procedures CAUTI All
Background SIRs compare the observed number of infections reported to the NHSN during
a year to the predicted number of infections based on the January 2006 to December 2008
referent period for CLABSIs and SSIs and the calendar year 2009 referent period for
CAUTIs For example a ratio of 81 for SSIs in 2013 indicates that 19 fewer SSIs were
observed in 2013 than predicted based on the 2006-2008 baseline period Data are from all
intensive care units wards and other non-critical care locations CLABSI data also include
neonatal intensive care units but exclude long-term acute care hospitals and inpatient
rehabilitation facilities SCIP procedures are those performed on adults Number of facilities
reporting to NHSN roughly tripled from 2009 to 2013 Procedures include abdominal aortic
aneurysm repair peripheral vascular bypass surgery coronary artery bypass graft with both
chest and donor site incisions or with chest incision only other cardiac surgery colon
surgery rectal surgery hip arthroplasty abdominal hysterectomy knee arthroplasty and
vaginal hysterectomy
Overall Rate In 2013 the overall SIR for CLABSIs among intensive care units in the 50
States District of Columbia and Puerto Rico was 054 and the overall SIR for CAUTIs was
106 The overall SIR for SSIs following 10 common procedures in adults was 081
Trends From 2009 to 2013 the SIR for CLABSIs improved and from 2010 to 2013 the
SIR for CAUTIs worsened for facilities reporting to NHSN
National Healthcare Quality and Disparities Report | 9
Patient Safety
Change in Statewide SIRs
Change from 2012 to 2013 in Statewide SIRs for CAUTI
Key CAUTI = catheter-associated urinary tract infection NHSN = National Healthcare Safety Network
Source Centers for Disease Control and Prevention National Center for Emerging and Zoonotic Infectious Diseases 2013 National and State
Healthcare Associated Infections Progress Report
Note For this measure lower numbers are better Changes in SIRs are categorized as ldquono changerdquo if they are not statistically significant Acute
care hospitalizations only Excludes neonatal intensive care units For this measure District of Columbia and Puerto Rico are treated as States
No Change
Increase
Indicates State mandate
in 2013 to report CAUTI
to NHSN
Decrease
AKAK
HI PR
AZ
CA
UT
CT
FL
GA
IA
IL
KS
MA
MDMO
NJ
NY
OR
PA
SCTN
CO
WA
WI
VA
ME
MN
MI
NC
TX
KY
WV
RI
NE
VT
NVOH
SD
AR
IN
NH
MT
ID
WY
ND
NM
OK
LA
MS AL
DE
DC
Change from 2012 to 2013 in Statewide SIRs for CAUTI
Key CAUTI = catheter-associated urinary tract infection NHSN = National Healthcare Safety Network
Source Centers for Disease Control and Prevention National Center for Emerging and Zoonotic Infectious Diseases 2013 National and State
Healthcare Associated Infections Progress Report
Note For this measure lower numbers are better Changes in SIRs are categorized as ldquono changerdquo if they are not statistically significant Acute
care hospitalizations only Excludes neonatal intensive care units For this measure District of Columbia and Puerto Rico are treated as States
No Change
Increase
Indicates State mandate
in 2013 to report CAUTI
to NHSN
Decrease
AKAK
HI PR
AZ
CA
UT
CT
FL
GA
IA
IL
KS
MA
MDMO
NJ
NY
OR
PA
SCTN
CO
WA
WI
VA
ME
MN
MI
NC
TX
KY
WV
RI
NE
VT
NVOH
SD
AR
IN
NH
MT
ID
WY
ND
NM
OK
LA
MS AL
DE
DC
Geographic Variation In 2013 31 States had SIRs greater than 1 indicating that on average
their hospitals had more CAUTIs than hospitals of similar type and size during the 2009
referent period The States were Alaska Arkansas Arizona Connecticut District of Columbia
Delaware Georgia Idaho Indiana Kansas Kentucky Massachusetts Maryland Maine
Michigan Minnesota Missouri Mississippi North Carolina New Jersey Nevada New York
Oregon Pennsylvania Rhode Island South Carolina Tennessee Texas Utah Virginia and
Washington
Trends Of 52 reporting States 33 had no change from 2012 to 2013 in CAUTI SIRs 9
decreased and 10 increased
Toolkit for Reducing Catheter-Associated Urinary Tract Infections in Hospitals
Purpose To help hospitals prevent catheter-associated urinary tract infections (CAUTIs) and
improve safety culture
Method Implementing evidence-based practical resources and concepts from the
Comprehensive Unit-based Safety Program
Intended User Hospital facilities
Available Tools Guides checklists webinars learning modules data interpretation guides
10 | National Healthcare Quality and Disparities Report
Patient Safety
Potential Measures of Effectiveness
Number of symptomatic CAUTIs attributable to each unit by month
Days since last CAUTI
Link httpwwwahrqgovprofessionalsquality-patient-safetyhaistoolscautishy
hospitalsIndexhtml
Central Line-Associated Bloodstream Infections in Neonatal Intensive Care Units
Central line-associated bloodstream infections per 1000 central-line days by birth weight of child in Level III neonatal intensive care units and by type
of pediatric ICU 2009-2013
Source Centers for Disease Control and Prevention National Healthcare Safety Network 2009-2013
Denominator Infections per 1000 central-line days
Note For this measure lower rates are better Acute care hospitalizations only
00
05
10
15
20
25
30
35
40
2009 2010 2011 2012 2013
Rat
e p
er
10
00
Ce
ntr
al-
Lin
e D
ays
le750 g 751-1000 g1001-1500 g 1501-2500 ggt2500 g
Level III Neonatal ICUs
00
05
10
15
20
25
30
35
40
2009 2010 2011 2012 2013
Rat
e p
er
10
00
Ce
ntr
al-
Lin
e D
ays
Pediatric Cardiothoracic ICUPediatric Medical ICUPediatric MedicalSurgical ICU
Pediatric ICUs
Central line-associated bloodstream infections per 1000 central-line days by birth weight of child in Level III neonatal intensive care units and by type
of pediatric ICU 2009-2013
Source Centers for Disease Control and Prevention National Healthcare Safety Network 2009-2013
Denominator Infections per 1000 central-line days
Note For this measure lower rates are better Acute care hospitalizations only
00
05
10
15
20
25
30
35
40
2009 2010 2011 2012 2013
Rat
e p
er
10
00
Ce
ntr
al-
Lin
e D
ays
le750 g 751-1000 g1001-1500 g 1501-2500 ggt2500 g
Level III Neonatal ICUs
00
05
10
15
20
25
30
35
40
2009 2010 2011 2012 2013
Rat
e p
er 1
000
Cen
tral
-Lin
e D
ays
Pediatric Cardiothoracic ICUPediatric Medical ICUPediatric MedicalSurgical ICU
Pediatric ICUs
Overall Rates
In 2013 among patients in Level III NICUs pooled mean CLABSI rates ranged from a
low of 06 infections per 1000 central-line days among neonates born at 1501 to 2500
grams to a high of 21 infections per 1000 central-line days among neonates born at less
than or equal to 750 grams
Trends
The rate of CLABSI among pediatric cardiothoracic ICUs was 25 in 2009 and 13 in
2013 among pediatric medical ICUs 26 in 2009 and 08 in 2013 and among pediatric
medicalsurgical ICUs 22 in 2009 and 12 in 2013
National Healthcare Quality and Disparities Report | 11
Patient Safety
Central Line-Associated Bloodstream Infections in Adult Intensive Care Units
Central linendashassociated bloodstream infections per 1000 central-line days in adult medical vs medicalsurgical intensive care units by hospital teaching
status 2006ndash2013
Source Centers for Disease Control and Prevention National Healthcare Safety Network 2006-2013
Denominator Infections per 1000 central-line days
Note For this measure lower rates are better Acute care hospitalizations only Major teaching facilities are defined as facilities with a program
for medical students and postgraduate medical training All other medical facilities include graduate facilities with programs for postgraduate
medical training only (ie residency andor fellowships) and undergraduate facilities with programs for medical students only
00
05
10
15
20
25
30
2006-2008 2009 2010 2011 2012 2013
Rat
e p
er
10
00
Ce
ntr
al-L
ine
Day
s
Major Teaching Medical ICU All Others Medical ICU
Major Teaching MedicalSurgical ICU All Others MedicalSurgical ICU
Central linendashassociated bloodstream infections per 1000 central-line days in adult medical vs medicalsurgical intensive care units by hospital teaching
status 2006ndash2013
Source Centers for Disease Control and Prevention National Healthcare Safety Network 2006-2013
Denominator Infections per 1000 central-line days
Note For this measure lower rates are better Acute care hospitalizations only Major teaching facilities are defined as facilities with a program
for medical students and postgraduate medical training All other medical facilities include graduate facilities with programs for postgraduate
medical training only (ie residency andor fellowships) and undergraduate facilities with programs for medical students only
00
05
10
15
20
25
30
2006-2008 2009 2010 2011 2012 2013
Rat
e p
er
10
00
Ce
ntr
al-L
ine
Day
s
Major Teaching Medical ICU All Others Medical ICU
Major Teaching MedicalSurgical ICU All Others MedicalSurgical ICU
Trends
Between 2006-2008 (combined) and 2013 there was a 46 decrease in CLABSIs (data
not shown)
From 2006-2008 (combined) to 2013 rates of CLABSIs in hospitals decreased 538
among adult medical ICU patients in hospitals with major teaching programs 476
among adult medicalsurgical ICU patients in hospitals with major teaching programs
421 among adult medical ICU patients in all other hospitals and 467 among adult
medicalsurgical ICU patients in all other hospitals
Tools for Reducing Central Line-Associated Bloodstream Infections
Purpose To help hospitals prevent central line-associated bloodstream infections (CLABSIs)
and improve safety culture
Methods Implementing evidence-based practical resources and concepts from the
Comprehensive Unit-based Safety Program (CUSP)
Intended user Hospital facilities
Available tools Checklists preventable incidence calculator audit form event report
template
12 | National Healthcare Quality and Disparities Report
Patient Safety
Impact
Through use of the CUSP toolkit and CLABSI tools more than 100 intensive care units
in Michigan have nearly eliminated CLABSIs
Nationwide the use of this toolkit has helped more than 1000 hospitals reduce rates of
CLABSI by 41 in aggregate See httpwwwahrqgovworkingforqualitypias
mhhakcpiahtm and httpwwwahrqgovprofessionalseducationcurriculumshy
toolsclabsitoolsindexhtmlpurpose
Procedure-Related Events
More than 40 million operative procedures are performed in the United States each year
Postoperative adverse events are not uncommon and increase both hospitalization length and
cost (AHRQ 2013)
Measures include
Risk-adjusted mortality at 30 days postoperation for colorectal surgery performed in
adults
Percentage of adult patients receiving hip joint replacement (because of fracture or
degenerative conditions) who experienced adverse events
Percentage of adults with mechanical adverse events associated with central venous
catheter placement
Postoperative Mortality
Risk-adjusted mortality rate within 30 days postoperation for adults undergoing colorectal surgery in ACS NSQIP participating hospitals in the United States by
raceethnicity and hospital teaching status 2008-2014
0
1
2
3
4
5
6
Pe
rce
nt
Teaching Nonteaching
Source American College of Surgeons (ACS) National Surgical Quality Improvement Program (NSQIP) 2008-2014
Denominator Adults age 18 years and over
Note For this measure lower percentages are better The participation in the ACS NSQIP is voluntary and current participation is weighted
when calculating rates Participating hospitals have changed over time 203 hospitals participated in 2008 and 531 hospitals participated in
2014 Other includes Asian American Indian or Alaska Native and Native Hawaiian or Other Pacific Islander White Black and Other are non-
Hispanic Hispanic includes all races
0
1
2
3
4
5
6
Pe
rce
nt
Total White Black Hispanic Other
Risk-adjusted mortality rate within 30 days postoperation for adults undergoing colorectal surgery in ACS NSQIP participating hospitals in the United States by
raceethnicity and hospital teaching status 2008-2014
0
1
2
3
4
5
6
Pe
rce
nt
Teaching Nonteaching
Source American College of Surgeons (ACS) National Surgical Quality Improvement Program (NSQIP) 2008-2014
Denominator Adults age 18 years and over
Note For this measure lower percentages are better The participation in the ACS NSQIP is voluntary and current participation is weighted
when calculating rates Participating hospitals have changed over time 203 hospitals participated in 2008 and 531 hospitals participated in
2014 Other includes Asian American Indian or Alaska Native and Native Hawaiian or Other Pacific Islander White Black and Other are non-
Hispanic Hispanic includes all races
0
1
2
3
4
5
6
Pe
rce
nt
Total White Black Hispanic Other
National Healthcare Quality and Disparities Report | 13
Patient Safety
Importance Colorectal procedures have high rates of postoperative complications
Nonadherence to evidence-based best practices is associated with an increased risk of these
complications (Arriaga et al 2009)
Overall Rate In 2014 the risk-adjusted mortality rate was 31 among patients undergoing
colorectal surgeries at ACS NSQIP participating hospitals
Trends From 2008 to 2014 30-day postoperative mortality after colorectal surgery
improved
Groups With Disparities
In 2014 the percentage of patients with 30-day postoperative mortality was worse for
Blacks (36) compared with Whites (30)
From 2008 to 2014 there were no statistically significant changes in the gap between
minority groups and Whites in the percentage of patients with 30-day postoperative
mortality
Adverse Events After Hip Joint Replacement
Adult patients receiving hip joint replacement due to fracture or degenerative conditions who experienced adverse events by age and chronic obstructive
pulmonary disease 2009-2013
02468
101214161820
2009 2010 2011 2012 2013
Pe
rce
nt
Total 65-74 75-84 85+
02468
101214161820
2009 2010 2011 2012 2013
Pe
rce
nt
COPD No COPD
Key COPD = chronic obstructive pulmonary disease
Source Agency for Healthcare Research and Quality (AHRQ) and Centers for Medicare amp Medicaid Services (CMS) Medicare Patient Safety
Monitoring System (MPSMS) 2009-2013
Denominator All patients age 18 years and over in the MPSMS sample who had a surgical procedure performed to replace a hip joint due to
degenerative conditions or a fractured hip
Note For this measure lower percentages are better Hospitals in Puerto Rico the Virgin Islands and Maryland were not included in the
annual samples Samples were drawn from the CMS Hospital Inpatient Quality Reporting program and consist of medical records for
discharges following hip arthroplasty procedures as defined by the Surgical Care Improvement Project Rates for patients age 85 years and
over in 2013 and for ages 18-64 years old for all years are not shown because the data did not meet the criteria for statistical reliability data
quality or confidentiality COPD status relates to patients with a principal or secondary discharge diagnosis of COPD
Adult patients receiving hip joint replacement due to fracture or degenerative conditions who experienced adverse events by age and chronic obstructive
pulmonary disease 2009-2013
02468
101214161820
2009 2010 2011 2012 2013
Pe
rce
nt
Total 65-74 75-84 85+
02
4
68
10
12
1416
18
20
2009 2010 2011 2012 2013
Pe
rce
nt
COPD No COPD
Key COPD = chronic obstructive pulmonary disease
Source Agency for Healthcare Research and Quality (AHRQ) and Centers for Medicare amp Medicaid Services (CMS) Medicare Patient Safety
Monitoring System (MPSMS) 2009-2013
Denominator All patients age 18 years and over in the MPSMS sample who had a surgical procedure performed to replace a hip joint due to
degenerative conditions or a fractured hip
Note For this measure lower percentages are better Hospitals in Puerto Rico the Virgin Islands and Maryland were not included in the
annual samples Samples were drawn from the CMS Hospital Inpatient Quality Reporting program and consist of medical records for
discharges following hip arthroplasty procedures as defined by the Surgical Care Improvement Project Rates for patients age 85 years and
over in 2013 and for ages 18-64 years old for all years are not shown because the data did not meet the criteria for statistical reliability data
quality or confidentiality COPD status relates to patients with a principal or secondary discharge diagnosis of COPD
Importance Hip replacement is most common among older adults who have an increased
risk of adverse events after these surgeries
14 | National Healthcare Quality and Disparities Report
Patient Safety
Overall Percentage In 2013 49 of patients receiving a hip joint replacement experienced
an adverse event
Trends From 2009 to 2013 the overall percentage of adverse events improved for patients
who had a hip joint replacement due to fracture or degenerative conditions
Groups With Disparities
In 2013 there were no statistically significant differences by age or COPD status in the
percentage of hip replacement patients who had adverse events
From 2009 to 2013 there were no statistically significant changes in the gap between
patients age 75 and over and those ages 65-74 in adverse event frequencies Similarly
there were no statistically significant changes in disparities between patients with COPD
and those without COPD
Adverse Events Associated With Central Venous Catheter Placement
Adults with mechanical adverse events associated with central venous catheter placement by race and obesity status 2009-2013
Source Agency for Healthcare Research and Quality and Centers for Medicare amp Medicaid Services Medicare Patient Safety Monitoring
System 2009-2013
Denominator Selected discharges of hospitalized patients age 18 years and over with central venous catheter placement
Note For this measure lower percentages are better Mechanical adverse events include allergic reaction to the catheter tamponade
perforation pneumothorax hematoma shearing off of the catheter air embolism misplaced catheter thrombosisembolism knotting of the
pulmonary artery catheter and certain other events
0
2
4
6
8
10
2009 2010 2011 2012 2013
Pe
rce
nt
Total White Black
0
2
4
6
8
10
2009 2010 2011 2012 2013
Pe
rce
nt
Obese Not Obese
Adults with mechanical adverse events associated with central venous catheter placement by race and obesity status 2009-2013
Source Agency for Healthcare Research and Quality and Centers for Medicare amp Medicaid Services Medicare Patient Safety Monitoring
System 2009-2013
Denominator Selected discharges of hospitalized patients age 18 years and over with central venous catheter placement
Note For this measure lower percentages are better Mechanical adverse events include allergic reaction to the catheter tamponade
perforation pneumothorax hematoma shearing off of the catheter air embolism misplaced catheter thrombosisembolism knotting of the
pulmonary artery catheter and certain other events
0
2
4
6
8
10
2009 2010 2011 2012 2013
Pe
rce
nt
Total White Black
0
2
4
6
8
10
2009 2010 2011 2012 2013
Pe
rce
nt
Obese Not Obese
Importance Central venous catheterization (CVC) allows medical personnel quick access to
a patientrsquos bloodstream This ease of access is important when a patient requires life-saving
medications or when a physician needs to measure central venous pressure Mechanical
adverse events are most likely to occur while medical personnel are placing or maintaining
the central venous catheter
National Healthcare Quality and Disparities Report | 15
Patient Safety
Overall Percentage In 2013 32 of adults with central venous catheter placements
experienced an associated mechanical adverse event
Trends From 2009 to 2013 there were no statistically significant changes in the overall
percentage of adults with mechanical adverse events associated with central venous catheter
placement
Groups With Disparities
In 2013 the percentage of adults with mechanical adverse events associated with CVC
was worse for Blacks (67) compared with Whites (27) There were no statistically
significant differences by obesity status
From 2009 to 2013 there were no statistically significant changes in the gap between
Blacks and Whites in the percentage of adults with mechanical adverse events associated
with CVC
Adverse Drug Events
An estimated 400000 preventable ADEs occur each year in US hospitals generating
additional costs of $35 billion in 2006 dollars (IOM 2007)
An ADE is an injurymdashincluding physical harm mental harm or loss of functionmdash
resulting from medical intervention involving a drug
For more information see the PSNet link to Patient Safety Primer Medication Errors
httpspsnetahrqgovprimersprimer23medication-errors
The three initial targets of the HHS National Action Plan for Adverse Drug Event Prevention are
Anticoagulants and related bleeding
Diabetes agents and related hypoglycemia
Opioids and accidental overdose oversedation and respiratory depression
Measures of Patient Safety in the Hospital Setting Adverse Drug Events
Percentage of hospitalized adult patients who received a hypoglycemic agent and had an
adverse drug event
Percentage of hospitalized adult patients who had an anticoagulant-related adverse drug
event to warfarin
Number of opioid-related medication errors in patients of all ages
16 | National Healthcare Quality and Disparities Report
Patient Safety
Adverse Drug Events With Hypoglycemic Agents
Hospitalized adult patients who received a hypoglycemic agent who had adverse drug events with hypoglycemic agents by
raceethnicity 2010-2013 and renal disease 2009-2013
Source Agency for Healthcare Research and Quality and Centers for Medicare amp Medicaid Services Medicare Patient Safety Monitoring
System 2009-2013
Note For this measure lower percentages are better Hypoglycemic agents received by patients age 18 and over during a hospital stay include
insulin oral hypoglycemic or a combination of both The 2009 data for races did not meet the criteria for statistical reliability data quality or confidentiality
0
2
4
6
8
10
12
14
16
18
20
2009 2010 2011 2012 2013
Pe
rce
nt
Total Renal DiseaseNo Renal Disease
0
2
4
6
8
10
12
14
16
18
20
2010 2011 2012 2013
Pe
rce
nt
Total White BlackAsian Hispanic
Hospitalized adult patients who received a hypoglycemic agent who had adverse drug events with hypoglycemic agents by
raceethnicity 2010-2013 and renal disease 2009-2013
Source Agency for Healthcare Research and Quality and Centers for Medicare amp Medicaid Services Medicare Patient Safety Monitoring
System 2009-2013
Note For this measure lower percentages are better Hypoglycemic agents received by patients age 18 and over during a hospital stay include
insulin oral hypoglycemic or a combination of both The 2009 data for races did not meet the criteria for statistical reliability data quality or confidentiality
0
2
4
6
8
10
12
14
16
18
20
2009 2010 2011 2012 2013
Pe
rce
nt
Total Renal DiseaseNo Renal Disease
0
2
4
6
8
10
12
14
16
18
20
2010 2011 2012 2013
Pe
rce
nt
Total White BlackAsian Hispanic
Importance Hypoglycemic agents which are ingested orally are typically used in patients
with type II diabetes to control blood sugar levels In some cases diabetic patients use
hypoglycemic agents together with insulin The risk of chronic kidney disease increases
twofold for people with diabetes and renal impairment can increase the risk for adverse
events related to hypoglycemic agents
Overall Percentage In 2013 85 of hospital patients receiving hypoglycemic agents had
an adverse drug event
Trends The overall percentage of adverse drug events associated with hypoglycemic agents
improved from 2009 to 2013
Groups With Disparities
In 2013 the percentage of hospital patients who had adverse drug events with hypoglycemic agents was higher for Blacks (111) than for Whites (8)
Also in 2013 the percentage of hospital patients who had adverse drug events with
hypoglycemic agents was higher for those with renal disease (122) than for those
without renal disease (56)
From 2010 to 2013 there were no statistically significant changes in the gap between
minority groups and Whites in the percentage of patients who had adverse drug events
associated with hypoglycemic agents Similarly there were no statistically significant
changes in the gap between those with renal disease and those without
National Healthcare Quality and Disparities Report | 17
Patient Safety
Adverse Drug Events With Warfarin
Hospitalized adult patients with an anticoagulant-related adverse drug event with warfarin by age and corticosteroid use 2009-2013
Source Agency for Healthcare Research and Quality and Centers for Medicare amp Medicaid Services Medicare Patient Safety Monitoring
System 2009ndash2013
Denominator Patients 18 and over who received warfarin and had their international normalized ratio (INR) measured during their hospital
stay
Note For this measure lower percentages are better Adverse events occurring the day of hospital arrival were excluded
0
2
4
6
8
10
12
2009 2010 2011 2012 2013
Pe
rce
nt
TotalCorticosteroid UseNo Corticosteroid Use
0
2
4
6
8
10
12
2009 2010 2011 2012 2013
Pe
rce
nt
lt65 65-74 75-84 85+
Hospitalized adult patients with an anticoagulant-related adverse drug event with warfarin by age and corticosteroid use 2009-2013
Source Agency for Healthcare Research and Quality and Centers for Medicare amp Medicaid Services Medicare Patient Safety Monitoring
System 2009ndash2013
Denominator Patients 18 and over who received warfarin and had their international normalized ratio (INR) measured during their hospital
stay
Note For this measure lower percentages are better Adverse events occurring the day of hospital arrival were excluded
0
2
4
6
8
10
12
2009 2010 2011 2012 2013
Pe
rce
nt
TotalCorticosteroid UseNo Corticosteroid Use
0
2
4
6
8
10
12
2009 2010 2011 2012 2013
Pe
rce
nt
lt65 65-74 75-84 85+
Importance Blood clots in arteries and veins can cause a blockage of blood flow and lead to
strokes and heart attacks Anticoagulants such as warfarin reduce this risk but pose an
increased risk of bleeding Corticosteroids can interact with anticoagulants to raise the risk of
potential bleeding complications
Overall Percentage In 2013 50 of adults using warfarin experienced an anticoagulant-
related adverse drug event
Trends From 2009 to 2013 there were no statistically significant changes in the overall
percentage of hospital patients with an adverse drug event related to warfarin
Groups With Disparities
In 2013 the percentage of hospital patients who had an adverse drug event to warfarin
was the same regardless of corticosteroid use status
From 2009 to 2013 there were no statistically significant changes in the gap between
older age groups and those under age 65 in the percentage of patients who had adverse
events associated with warfarin Similarly there were no statistically significant changes
in the gap between those using corticosteroids and those not using corticosteroids
18 | National Healthcare Quality and Disparities Report
Patient Safety
Opioid-Related Medication Errors
Number of opioid-related medication errors reported in Pennsylvania by AHRQ eventharm category and age 2006 2008 2010 2012 2014
30 53 44 27 23
2947 2798 2714 27082408
9531014
984 969
910
175 245251 398
330
0
500
1000
1500
2000
2500
3000
3500
4000
4500
2006 2008 2010 2012 2014
Nu
mb
er o
f Ev
ents
Unsafe Condition Near Miss
Patient Event No Harm Patient Event Harm
Source Institute of Safe Medication Practices on behalf of the Pennsylvania Patient Safety Authority 2006-2014
Note Pennsylvania Patient Safety Reporting System reports of medication errors are from acute-level facilities that consist of hospitals
ambulatory surgical facilities birthing centers and abortion facilities Medication errors do not include adverse drug reactions Eventharm
categories refer to those in the Agency for Healthcare Research and Quality Common Formats Unsafe condition is defined as any
circumstance that increases the probability of a patient safety event A near miss is defined as a patient safety event that did not reach the
patient Deaths are included in the total but not shown on the chart because there were too few to render graphically
192 166 336530 662
2287 24842385
2364 1955
16271461 1272
1208
1055
0
500
1000
1500
2000
2500
3000
3500
4000
4500
2006 2008 2010 2012 2014
Nu
mb
er o
f Ev
en
ts
lt18 18-64 65+
Number of opioid-related medication errors reported in Pennsylvania by AHRQ eventharm category and age 2006 2008 2010 2012 2014
30 53 44 27 23
2947 2798 2714 27082408
9531014
984 969
910
175 245251 398
330
0
500
1000
1500
2000
2500
3000
3500
4000
4500
2006 2008 2010 2012 2014
Nu
mb
er o
f Ev
ents
Unsafe Condition Near Miss
Patient Event No Harm Patient Event Harm
Source Institute of Safe Medication Practices on behalf of the Pennsylvania Patient Safety Authority 2006-2014
Note Pennsylvania Patient Safety Reporting System reports of medication errors are from acute-level facilities that consist of hospitals
ambulatory surgical facilities birthing centers and abortion facilities Medication errors do not include adverse drug reac tions Eventharm
categories refer to those in the Agency for Healthcare Research and Quality Common Formats Unsafe condition is defined as any
circumstance that increases the probability of a patient safety event A near miss is defined as a patient safety event that did not reach the
patient Deaths are included in the total but not shown on the chart because there were too few to render graphically
192 166 336530 662
2287 24842385
2364 1955
16271461 1272
1208
1055
0
500
1000
1500
2000
2500
3000
3500
4000
4500
2006 2008 2010 2012 2014
Nu
mb
er o
f Ev
ents
lt18 18-64 65+
Importance Acute malignant andmdashincreasinglymdashchronic pain often is treated or managed
with prescription opioids Reducing patient harm from the use of opioids in both inpatient
and outpatient settings is a main area of focus because opioid-related adverse drug events are
often preventable
Trends
In Pennsylvania the total number of medication error reports related to opioids decreased
106 between 2006 (4106) and 2014 (3672)
Between 24 and 54 opioid-related medication errors resulting in patient harm or death
were reported from 2006 through 2014 accounting for approximately 1 of all reported
opioid medication errors each year
The largest share of opioid-related medication errors reported each year in Pennsylvania
related to those that reached the patient but did not result in harm Of these no-harm
events reaching the patient about one in four required monitoring andor intervention to
preclude the harm
National Healthcare Quality and Disparities Report | 19
Patient Safety
20 | National Healthcare Quality and Disparities Report
Although small in number reports of unsafe conditions increased from 43 (175) of
total opioid-related medication error reports in 2006 to 9 (330) in 2014 Reports of
unsafe conditions and near misses can provide important learning opportunities for
preventing patient harm
Differences Between Groups Reports of opioid-related medication errors involving
pediatric patients increased nearly fourfold from 192 (47) in 2006 to 662 (18) in 2014
During the same period reports of opioid-related medication errors involving older adult
patients decreased from nearly 40 of the total to less than 30
Patient Safety in the Nursing Home Setting
More than 3 million people receive care in US nursing homes and skilled nursing facilities
each year (CDC 2015)
For nursing home residents optimal care seeks to maximize quality of life and minimize
unintended complications
Measures tracked for patients of various age ranges include
Nursing home residents with urinary tract infections
Nursing home residents experiencing use of restraints
Nursing home residents who have pressure ulcers
Nursing home residents who had a fall with major injury
Nursing home residents who received antipsychotic medication
Urinary Tract Infections
Long-stay nursing home residents experiencing urinary tract infections by sex and raceethnicity 2011-2013
Source Centers for Medicare amp Medicaid Services Minimum Data Set 2011-2013
DenominatorNursing home residents of any age w ho have at least 101 cumulative days in the facility
Note For this measure low er percentages are better The measure w as calculated as follows Percentage of long-stay residents with a urinary
tract infection w ithin the 30 days prior to assessment White Black and Asian are non-Hispanic Hispanic includes all races
0
2
4
6
8
10
2011 2012 2013
Pe
rce
nt
Total Male Female
2011 Achievable
Benchmark 61
0
2
4
6
8
10
2011 2012 2013
Pe
rce
nt
White Black Asian Hispanic
2011 Achievable
Benchmark 61
Long-stay nursing home residents experiencing urinary tract infections by sex and raceethnicity 2011-2013
Source Centers for Medicare amp Medicaid Services Minimum Data Set 2011-2013
DenominatorNursing home residents of any age w ho have at least 101 cumulative days in the facilityNote For this measure low er percentages are better The measure w as calculated as follows Percentage of long-stay residents with a urinary
tract infection w ithin the 30 days prior to assessment White Black and Asian are non-Hispanic Hispanic includes all races
0
2
4
6
8
10
2011 2012 2013
Pe
rce
nt
Total Male Female
2011 Achievable
Benchmark 61
0
2
4
6
8
10
2011 2012 2013
Pe
rce
nt
White Black Asian Hispanic
2011 Achievable
Benchmark 61
Patient Safety
Importance Bacteria that cause urinary tract infections (UTIs) can spread to other body
parts and become more serious or contribute to further complications such as delirium
Overall Percentage In 2013 the percentage of long-stay nursing home residents with a UTI
was 64
Groups With Disparities
In 2013 compared with males (51) the percentage with UTIs was worse for females
(7)
In 2013 compared with White residents (68) the percentage of residents with UTIs
was lower for Blacks and Asians (47) as well as Hispanics (54)
Achievable Benchmark
In 2011 the top 5 State achievable benchmark for UTIs was 61 The States that
contributed to the achievable benchmark are Connecticut Hawaii Minnesota North
Dakota and Pennsylvania
Males Blacks Asians and Hispanics have achieved the benchmark
Use of Restraints
00
05
10
15
20
25
30
35
40
2011 2012 2013
Pe
rce
nt
White Black Asian Hispanic
00
05
10
15
20
25
30
35
40
2011 2012 2013
Pe
rce
nt
Total 0-64 65-74 75-84 85+
2011 Achievable
Benchmark 07
Long-stay nursing home residents experiencing use of restraints by age and raceethnicity 2011-2013
Source Centers for Medicare amp Medicaid Services Minimum Data Set 2011-2013
Denominator Nursing home residents of any age who have at least 101 cumulative days in the facility
Note For this measure lower percentages are better The measure was calculated as follows Percentage of long-stay residents who are
physically restrained on a daily basis
2011 Achievable
Benchmark 07
00
05
10
15
20
25
30
35
40
2011 2012 2013
Pe
rce
nt
White Black Asian Hispanic
00
05
10
15
20
25
30
35
40
2011 2012 2013
Pe
rce
nt
Total 0-64 65-74 75-84 85+
2011 Achievable
Benchmark 07
Long-stay nursing home residents experiencing use of restraints by age and raceethnicity 2011-2013
Source Centers for Medicare amp Medicaid Services Minimum Data Set 2011-2013
Denominator Nursing home residents of any age who have at least 101 cumulative days in the facility
Note For this measure lower percentages are better The measure was calculated as follows Percentage of long-stay residents who are
physically restrained on a daily basis
2011 Achievable
Benchmark 07
National Healthcare Quality and Disparities Report | 21
Patient Safety
Importance Residents who are restrained daily can become weak lose their ability to go to
the bathroom by themselves and develop pressure ulcers or other medical conditions
Overall Percentage In 2013 the percentage of long-stay nursing home residents who were
physically restrained on a daily basis was 14
Groups With Disparities
In 2011 2012 and 2013 the percentage of residents with restraint use on a daily basis
was lower for those ages 65-74 years compared with those under age 65 In 2013 the
percentage of residents ages 65-74 years experiencing use of restraints was 12
compared with 16 for residents younger than 65
In 2013 compared with Whites (14) Asians (2) and Hispanics (18) had worse
percentages of daily restraint use and Blacks (12) had a better percentage of daily
restraint use
Achievable Benchmark
In 2011 the top 5 State achievable benchmark for restraint use was 07 The States that
contributed to the achievable benchmark are Kansas Maine Nebraska New Hampshire
and Vermont
No group achieved the benchmark from 2011 to 2013
Pressure Ulcers
Low-risk short-stay and high-risk long-stay nursing home residents who have pressure ulcers by sex 2011-2013
Source Centers for Medicare amp Medicaid Services Minimum Data Set 2011-2013
Denominator Low-risk short-stay Nursing home residents of any age who have 100 or fewer cumulative days in the facility and are active can
change positions and are getting the nutrients they need to maintain good skin health High-risk long-stay Nursing home residents of any age
who have at least 101 cumulative days in the facility and are in a coma do not get the nutrients needed to maintain good skin health or cannot
change position on their own
Note For this measure lower percentages are better
0
2
4
6
8
10
12
2011 2012 2013
Pe
rce
nt
Low-Risk Short StayTotal Male Female
2011 Achievable Benchmark10
0
2
4
6
8
10
12
2011 2012 2013
Pe
rce
nt
High-Risk Long StayTotal Male Female
2008 Achievable Benchmark 71
Low-risk short-stay and high-risk long-stay nursing home residents who have pressure ulcers by sex 2011-2013
Source Centers for Medicare amp Medicaid Services Minimum Data Set 2011-2013
Denominator Low-risk short-stay Nursing home residents of any age who have 100 or fewer cumulative days in the facility and are active can
change positions and are getting the nutrients they need to maintain good skin health High-risk long-stay Nursing home residents of any age
who have at least 101 cumulative days in the facility and are in a coma do not get the nutrients needed to maintain good skin health or cannot
change position on their own
Note For this measure lower percentages are better
0
2
4
6
8
10
12
2011 2012 2013
Pe
rce
nt
Low-Risk Short StayTotal Male Female
2011 Achievable Benchmark10
0
2
4
6
8
10
12
2011 2012 2013
Pe
rce
nt
High-Risk Long StayTotal Male Female
2008 Achievable Benchmark 71
22 | National Healthcare Quality and Disparities Report
Patient Safety
Importance Pressure ulcers are serious medical conditions They typically result from
prolonged periods of uninterrupted pressure on the skin soft tissue muscle and bone
Vulnerable patients include older adults stroke and diabetic patients patients with dementia
circulatory diseases dehydration and malnutrition and people who use wheelchairs or are
bedriddenmdashthat is any patient with impaired mobility or sensation
Overall Percentage In 2013 the percentage of low-risk short-stay residents with pressure
ulcers was 13 and the percentage of high-risk long-stay residents with pressure ulcers was
77
Groups with Disparities
As in 2011 and 2012 male low-risk short-stay nursing home residents had a worse
percentage with pressure ulcers (15) compared with female residents (12) in 2013
As in 2011 and 2012 male high-risk long-stay nursing home residents had a worse
percentage with pressure ulcers (94) compared with female residents (70) in 2013
Achievable Benchmark
The 2011 top 5 State achievable benchmark for low-risk short-stay nursing home residents was 10 The States that contributed to the benchmark were Alabama Arizona Colorado Connecticut and Idaho
The 2008 top 5 State achievable benchmark for high-risk long-stay nursing home residents was 71 The States that contributed to the benchmark were Hawaii Minnesota Nebraska New Hampshire and North Dakota
No low-risk short-stay residents achieved the benchmark from 2011 to 2013 Among
high-risk long-stay residents only females achieved the benchmark by 2013
National Healthcare Quality and Disparities Report | 23
Patient Safety
Falls
00
05
10
15
20
25
30
35
40
45
50
Pe
rce
nt
2012 2013
Long-stay nursing home residents who had a fall with major injury by sex age and raceethnicity 2012-2013
Source Centers for Medicare amp Medicaid Services Minimum Data Set 2012-2013
Denominator Nursing home residents of any age who have at least 101 cumulative days in the facility with one or more look-back scan
assessments except when the occurrence of falls or number of falls with major injury was not assessed in the look-back scan assessment
Note For this measure lower percentages are better White Black and Other are non-Hispanic Hispanic includes all races
2012 Achievable
Benchmark 22
00
05
10
15
20
25
30
35
40
45
50
Pe
rce
nt
2012 2013
Long-stay nursing home residents who had a fall with major injury by sex age and raceethnicity 2012-2013
Source Centers for Medicare amp Medicaid Services Minimum Data Set 2012-2013
Denominator Nursing home residents of any age who have at least 101 cumulative days in the facility with one or more look-back scan
assessments except when the occurrence of falls or number of falls with major injury was not assessed in the look-back scan assessment
Note For this measure lower percentages are better White Black and Other are non-Hispanic Hispanic includes all races
2012 Achievable
Benchmark 22
Importance Nursing home residents who experience falls resulting in major injuries are at
higher risk of death and disability as well as emotional trauma that can affect functional
abilities and social well-being
Overall Percentage In 2013 the percentage of long-stay nursing home residents who had a
fall with a major injury was 34
Groups With Disparities
In 2013 female nursing home residents had a worse percentage of falls (38) compared
with male residents (25)
In 2013 the percentage of falls with major injury was worse for all subgroups of
residents age 65 years and over compared with their younger counterparts The
percentage for residents under 65 years old was 17 compared with 26 for ages 65shy
74 years 34 for ages 75-84 years and 41 for 85 years and over
Also in 2013 compared with Whites (38) the percentage of falls with major injury
was better for Black (13) Other (22) and Hispanic (24) residents
24 | National Healthcare Quality and Disparities Report
Patient Safety
National Healthcare Quality and Disparities Report | 25
Achievable Benchmark
The 2012 top 5 State achievable benchmark for falls with major injury was 22 The
States that contributed to the achievable benchmark are Alaska California District of
Columbia Hawaii and New Jersey The benchmark was achieved by Black residents and those ages 0-64 years
Antipsychotic Medication Among Nursing Home Residents
Importance The high use of antipsychotic medications among nursing home residents for
indications other than those for which the drug was approved has been noted by the Federal
Government These drugs are often used for too long at too high a dose or when
unnecessary In the past inappropriate prescribing of antipsychotics in nursing homes has
primarily been considered a marker of suboptimal care Recent studies have shown
antipsychotic use is also a drug safety issue (Huybrechts et al 2012) Antipsychotic
medication use is associated with increased risks of adverse events such as movement
disorders falls hip fractures and cerebrovascular events Their use in older adults with
dementia carries an increased risk of death Safety concerns with antipsychotic medication
use in older adults also include the risks of hyperprolactinemia pneumonia
0
5
10
15
20
25
30
Percent
2012 2013
Adult long-stay nursing home residents who received antipsychotic medication by raceethnicity and number of chronic conditions 2012-2013
Key NHOPI = Native Hawaiian or Other Pacific Islander AIAN = American Indian or Alaska Native
Source Centers for Medicare amp Medicaid Services Minimum Data Set 2012-2013
Denominator Nursing home residents of any age who have at least 101 cumulative days in the facility excluding residents with schizophrenia
Tourettersquos syndrome and Huntingtonrsquos disease
Numerator Subset of denominator that receives an antipsychotic medication
Note For this measure lower percentages are better
2012 Achievable
Benchmark 150
0
5
10
15
20
25
30
Percent
2012 2013
Adult long-stay nursing home residents who received antipsychotic medication by raceethnicity and number of chronic conditions 2012-2013
Key NHOPI = Native Hawaiian or Other Pacific Islander AIAN = American Indian or Alaska Native
Source Centers for Medicare amp Medicaid Services Minimum Data Set 2012-2013
Denominator Nursing home residents of any age who have at least 101 cumulative days in the facility excluding residents with schizophrenia
Tourettersquos syndrome and Huntingtonrsquos disease
Numerator Subset of denominator that receives an antipsychotic medication
Note For this measure lower percentages are better
2012 Achievable
Benchmark 150
Patient Safety
26 | National Healthcare Quality and Disparities Report
thromboembolism cerebrovascular events and other cardiovascular adverse events (Chiu et
al 2015)
Overall Percentage The percentage of long-stay nursing home residents who had
antipsychotic medications was 176 in 2013
Groups With Disparities
In 2013 the percentage of residents receiving antipsychotic medication was higher for
Hispanic residents (201) than for White residents (180)
In 2012 and 2013 the percentage of long-stay residents who received antipsychotic
medications was worse for residents with one or more chronic conditions than for
residents with no chronic conditions
Achievable Benchmark
The 2012 top 6 State achievable benchmark was 150 The States that contributed to the
achievable benchmark are Alaska California Hawaii Michigan New Jersey and
Wyoming Asians NHOPIs residents with no chronic conditions and residents with one chronic
condition achieved the benchmark
Antipsychotic Medication Among Nursing Home Residents by State
Long-stay nursing home residents who received antipsychotic medication by State 2013
Source Centers for Medicare amp Medicaid Services Minimum Data Set 2013
Denominator Nursing home residents of any age who have at least 101 cumulative days in the facility
Note For this measure lower percentages are better
AZ
CA
UT
CT
FL
GA
IA
IL
KS
MA
MDMO
NJ
NY
OR
PA
SC
TN
CO
WA
WI
VA
ME
MN
MI
NC
TX
KY
WV
RI
NE
VT
NV OH
SD
AR
IN
NH
MT
ID
WY
ND
NMOK
LA
MS AL
DE
AKAK
HI
DC
85-153 (1st Quartile)
154-173 (2nd Quartile)
No Data
174-192 (3rd Quartile)
PR193-234 (4th Quartile)
Long-stay nursing home residents who received antipsychotic medication by State 2013
Source Centers for Medicare amp Medicaid Services Minimum Data Set 2013
Denominator Nursing home residents of any age who have at least 101 cumulative days in the facility
Note For this measure lower percentages are better
AZ
CA
UT
CT
FL
GA
IA
IL
KS
MA
MDMO
NJ
NY
OR
PA
SC
TN
CO
WA
WI
VA
ME
MN
MI
NC
TX
KY
WV
RI
NE
VT
NV OH
SD
AR
IN
NH
MT
ID
WY
ND
NMOK
LA
MS AL
DE
AKAK
HI
DC
85-153 (1st Quartile)
154-173 (2nd Quartile)
No Data
174-192 (3rd Quartile)
PR193-234 (4th Quartile)
Patient Safety
Overall This map shows overall rankings of States (by quartiles) in the percentage of long-
stay nursing home residents who received antipsychotic medication in 2013 Values ranged
from 85 to 234
Differences by State Interquartile ranges follow
First quartile (lowest) 85-153 (AK CA DC DE HI MD MI MN NJ NC SC
WI WV)
Second quartile (second lowest) 153 -173 (CO ID MT NM NY ND OR PA
RI SD VT WA WY)
Third quartile (second highest) 174-192 (AZ CT GA IN IA KS ME MA MO
NV OH OK VA)
Fourth quartile (highest) 193-234 (AL AR FL IL KY LA MS NE NH TN
TX UT)
Eight of the 12 States in the quartile with the highest percentage of long-stay nursing
home residents who received antipsychotic medication were in the South
Patient Safety in the Home Health Setting
Home health agencies provide services to beneficiaries who are homebound and need skilled
nursing care or therapy
Approximately 12 million individuals receive home health care from more than 33000
providers for causes including acute illness long-term health conditions permanent
disability or terminal illness (NAHCH 2010)
Improvements among home health patients can reflect the quality of care from home health
agencies
Measures include
Home health patients with improvement in surgical wounds
Home health patients with improvements in their ability to take medications orally
National Healthcare Quality and Disparities Report | 27
Patient Safety
Improvement in Surgical Wounds
75
80
85
90
95
100
2010 2011 2012 2013
Pe
rce
nt
White Black Asian Hispanic
75
80
85
90
95
100
2010 2011 2012 2013
Pe
rce
nt
Total 0-64 65-74
75-84 85+
2011 Achievable
Benchmark 913
Home health patients with improvement in surgical wounds by age and raceethnicity 2010-2013
Source Centers for Medicare amp Medicaid Services Outcome and Assessment Information Set 2010-2013
Denominator Number of home health episodes during the measurement period in which the patient of any age had a surgical wound and the
episode ended with the patient discharged from home health care
Note White Black and Asian are non-Hispanic Hispanic includes all races
2011 Achievable
Benchmark 913
75
80
85
90
95
100
2010 2011 2012 2013
Per
cen
t
White Black Asian Hispanic
75
80
85
90
95
100
2010 2011 2012 2013
Per
cen
t
Total 0-64 65-74
75-84 85+
2011 Achievable
Benchmark 913
Home health patients with improvement in surgical wounds by age and raceethnicity 2010-2013
Source Centers for Medicare amp Medicaid Services Outcome and Assessment Information Set 2010-2013
Denominator Number of home health episodes during the measurement period in which the patient of any age had a surgical wound and the
episode ended with the patient discharged from home health care
Note White Black and Asian are non-Hispanic Hispanic includes all races
2011 Achievable
Benchmark 913
Importance Normal wound healing after an operation is an important marker of good care
The home health team should regularly change wound dressing and teach the patient about
wound care
Overall Percentage In 2013 the percentage of home health patients with improvement in
their surgical wounds was 890
Trends The percentage of health home patients with surgical wound improvement increased
between 2010 and 2013
Groups With Disparities
In 2013 compared with residents under age 65 years (856) all other age groups had
better percentages of improvement in surgical wounds The percentage was 893 for
ages 65-74 905 for ages 75-84 and 917 for ages 85 and over
In 2013 compared with Whites (893) Blacks (878) Asians (882) and Hispanics
(874) had worse percentages of improvement in surgical wounds
The 2010 through 2013 trend in the percent of home health patients with surgical wound
improvement did not change for those over age 65 relative to persons under age 65 years
28 | National Healthcare Quality and Disparities Report
Patient Safety
Achievable Benchmark
The 2011 top 5 State achievable benchmark was 913 The States that contributed to the
benchmark are Alabama Mississippi Nevada Oklahoma and South Carolina
Home health patients age 85 years and over achieved the benchmark for surgical wound
improvement in 2013
At the current rate of progress patients ages 75-84 years could reach the benchmark
within a year Patients ages 65-74 years could achieve the benchmark in approximately 2
years
White home health patients could achieve the benchmark in approximately 2 years
Improvement in Ability To Take Medication Orally
0
20
40
60
80
100
2010 2011 2012 2013
Per
cen
t
White Black Asian Hispanic
0
20
40
60
80
100
2010 2011 2012 2013
Per
cen
t
Total 0-64 65-74
75-84 85+
2008 Achievable
Benchmark 516
Home health patients with improvement in their ability to take medications orally by age and raceethnicity 2010-2013
Source Centers for Medicare amp Medicaid Services Outcome and Assessment Information Set 2010-2013
Denominator Number of home health care episodes in which a patient of any age was unable to take oral medications independently at the
start of the episode that ended during the measurement period
Note White Black and Asian are non-Hispanic Hispanic includes all races
2008 Achievable
Benchmark 516
0
20
40
60
80
100
2010 2011 2012 2013
Per
cen
t
White Black Asian Hispanic
0
20
40
60
80
100
2010 2011 2012 2013
Per
cen
t
Total 0-64 65-74
75-84 85+
2008 Achievable
Benchmark 516
Home health patients with improvement in their ability to take medications orally by age and raceethnicity 2010-2013
Source Centers for Medicare amp Medicaid Services Outcome and Assessment Information Set 2010-2013
Denominator Number of home health care episodes in which a patient of any age was unable to take oral medications independently at the
start of the episode that ended during the measurement period
Note White Black and Asian are non-Hispanic Hispanic includes all races
2008 Achievable
Benchmark 516
Importance Taking medications correctly is important to the health status and quality of life
of individuals living in the community The home health team can help teach a patient ways
to organize drugs and take them properly
Overall Percentage In 2013 the percentage of home health patients with improvement in
their ability to take medications orally was 513
Trends Between 2010 and 2013 there was improvement in the overall percentage of home
health patients with improved ability to take medications orally
National Healthcare Quality and Disparities Report | 29
Patient Safety
Groups With Disparities
In 2013 the percentage of home health patients with improvement in their ability to take
medications orally was worse for those age 85 years and over (398) compared with
those under age 65 years (577)
The percentage of patients with improvement in their ability to take medications orally
was worse among Hispanic home health patients (400) than among White patients
(526) in 2013
From 2010 to 2013 the gap between Blacks and Whites decreased and the gap between
Asians and Whites and Hispanics and Whites increased
Achievable Benchmark
The 2008 top 5 State achievable benchmark was 516 The States that contributed to the
achievable benchmark are Iowa Massachusetts New Jersey North Dakota and South
Carolina
The benchmark was achieved among age groups under 85 years and by White and Black
home health patients
The total population is estimated to reach the benchmark in less than a year Hispanic
patients and patients age 85 years and over are farthest from the benchmark
Improvement in Ability To Take Medication Orally by State
Home health patients with improvement in their ability to take medications orally by raceethnicity by State 2013
Source Centers for Medicare amp Medicaid Services Outcome and Assessment Information Set 2013
Denominator Number of home health care episodes in which a patient of any age was unable to take oral medications independently at the
start of the episode that ended during the measurement period
AZ
CA
UT
CT
FL
GA
IA
IL
KS
MA
MDMO
NJ
NY
OR
PA
SC
TN
CO
WA
WI
VA
ME
MN
MI
NC
TX
KY
WV
RI
NE
VT
NV OH
SD
AR
IN
NH
MT
ID
WY
ND
NMOK
LA
MS AL
DE
AKAK
HI
No significant difference between rates
of Hispanics and non-Hispanic Whites
Non-Hispanic Whites have significantly
worse rate than Hispanics
States do not have data that meet the
criteria for statistical reliability data
quality or confidentiality
Hispanics have significantly worse rate
than non-Hispanic Whites
DC
Home health patients with improvement in their ability to take medications orally by raceethnicity by State 2013
Source Centers for Medicare amp Medicaid Services Outcome and Assessment Information Set 2013
Denominator Number of home health care episodes in which a patient of any age was unable to take oral medications independently at the
start of the episode that ended during the measurement period
AZ
CA
UT
CT
FL
GA
IA
IL
KS
MA
MDMO
NJ
NY
OR
PA
SC
TN
CO
WA
WI
VA
ME
MN
MI
NC
TX
KY
WV
RI
NE
VT
NV OH
SD
AR
IN
NH
MT
ID
WY
ND
NMOK
LA
MS AL
DE
AKAK
HI
No significant difference between rates
of Hispanics and non-Hispanic Whites
Non-Hispanic Whites have significantly
worse rate than Hispanics
States do not have data that meet the
criteria for statistical reliability data
quality or confidentiality
Hispanics have significantly worse rate
than non-Hispanic Whites
DC
30 | National Healthcare Quality and Disparities Report
Patient Safety
Geographic Variation
In 2013 Hispanic home health patients had worse rates of improvement in taking oral
medications than non-Hispanic White patients in 11 States (Arizona California
Connecticut Florida Illinois Indiana Massachusetts Nevada New York North
Carolina and Texas
Non-Hispanic White patients had worse rates of improvement than Hispanic patients in
five States (Hawaii Idaho Iowa Michigan and Pennsylvania)
Patient Safety in the Ambulatory Setting
Although patient safety initiatives frequently focus on inpatient hospital events adverse
effects of medical care may be identified and treated in outpatient settings
Adverse effects of medical care can follow care or procedures in hospitals emergency
departments physician offices or other settings
Measures include
Patient safety and quality issues by frequency of occurrence in outpatient medical offices
Adults age 65 years and over who received potentially inappropriate prescription medications during the calendar year
Percentage of hemodialysis patients with vascular catheter in use for 90 days or longer
For more information see the PSNet link to Patient Safety Primer Patient Safety in
Ambulatory Care httpspsnetahrqgovprimersprimer16patient-safety-in-ambulatory-care
National Healthcare Quality and Disparities Report | 31
Patient Safety
Patient Safety and Quality Issues
Patient safety and quality issues by frequency of occurrence in outpatient medical offices 2014
Source Westat analysis of the AHRQ 2014 Medical Office Survey on Patient Safety Culture Comparative Database (N=935)
Note For this measure less frequent occurrences during the year are better
0
20
40
60
80
100
A pharmacy contactedour office to clarify orcorrect a prescription
A patient was unableto get an appointmentwithin 48 hours for anacuteserious problem
A patients medicationlist was not updatedduring his or her visit
The results from a labor imaging test were notavailable when needed
A patients chartmedicalrecord was not available
when needed
Occurred DailyWeekly
Occurred Monthly
Occurred Not at All to Several Times Over the Past Year
Patient safety and quality issues by frequency of occurrence in outpatient medical offices 2014
Source Westat analysis of the AHRQ 2014 Medical Office Survey on Patient Safety Culture Comparative Database (N=935)
Note For this measure less frequent occurrences during the year are better
0
20
40
60
80
100
A pharmacy contactedour office to clarify orcorrect a prescription
A patient was unableto get an appointmentwithin 48 hours for anacuteserious problem
A patients medicationlist was not updatedduring his or her visit
The results from a labor imaging test were notavailable when needed
A patients chartmedicalrecord was not available
when needed
Occurred DailyWeekly
Occurred Monthly
Occurred Not at All to Several Times Over the Past Year
Importance Most health care takes place in the outpatient or ambulatory care setting Lack
of access to care and lack of access to timely and accurate medical information and test
results may contribute to patient safety events such as missed or delayed diagnoses
medication errors failure to order appropriate diagnostic or laboratory tests incorrect
interpretation of tests and inadequate followup on results
Overall Percentage
Almost 30 of medical offices participating in the survey reported daily or weekly
occurrences of being contacted by the pharmacist for clarification or correction on a
prescription
After prescription clarifications or corrections by the pharmacy medical offices were
next most likely to report daily or weekly issues with patients being unable to get an
appointment within 48 hours for an acute or serious problem (14) or the patientrsquos
medication list not getting updated during their visit (11)
The share of medical offices reporting that lab or imaging tests were not available when
needed reached nearly 20 when considering monthly occurrences as well as those that
occurred more frequently
32 | National Healthcare Quality and Disparities Report
Patient Safety
Potentially Inappropriate Prescriptions for Older Adults
Adults age 65 years and over who received potentially inappropriate prescription medications during the calendar year by sex and
perceived health status 2003ndash2013
Source Agency for Healthcare Research and Quality Medical Expenditure Panel Survey 2003-2013
Note For this measure lower percentages are better Prescription medications received include all prescribed medications initiall y purchased
or otherwise obtained as well as any refills For more information on inappropriate medications see the American Geriatrics Society 2012 Beers
Criteria Update Expert Panel American Geriatrics Society updated Beers Criteria for potentially inappropriate medication use in older adults J
Am Geriatr Soc 2012 Apr60(4)616-31
0
5
10
15
20
25
30
Per
cen
t
Total Male Female
0
5
10
15
20
25
30
Per
cen
t
ExcellentVery GoodGood FairPoor
Adults age 65 years and over who received potentially inappropriate prescription medications during the calendar year by sex and
perceived health status 2003ndash2013
Source Agency for Healthcare Research and Quality Medical Expenditure Panel Survey 2003-2013
Note For this measure lower percentages are better Prescription medications received include all prescribed medications initially purchased
or otherwise obtained as well as any refills For more information on inappropriate medications see the American Geriatrics Society 2012 Beers
Criteria Update Expert Panel American Geriatrics Society updated Beers Criteria for potentially inappropriate medication use in older adults J
Am Geriatr Soc 2012 Apr60(4)616-31
0
5
10
15
20
25
30
Per
cen
t
Total Male Female
0
5
10
15
20
25
30
Per
cen
t
ExcellentVery GoodGood FairPoor
Importance Some drugs that are prescribed for older patients are known to be potentially
harmful for this age group
Overall Percentage In 2013 the percentage of adults age 65 years and over who received
potentially inappropriate prescription medications was 114
Trends From 2003 to 2013 the percentage of adults age 65 years and over who received
potentially inappropriate prescription medications improved overall for both sexes and for
people with excellentvery goodgood health status and people with fairpoor health status
Groups With Disparities
In all years the percentage of patients receiving potentially inappropriate medications
was higher among females compared with males This gap was not changing over time
In all years from 2003 to 2013 the percentage of patients receiving potentially
inappropriate medications was higher among people with fairpoor health status
compared with people with excellentgood health status This gap was not changing over
time
National Healthcare Quality and Disparities Report | 33
Patient Safety
Long-Term Catheter Use in Dialysis Patients
HI
AKAK
AZ
CA
UT
CT
FL
GA
IA
IL
KS
MA
MDMO
NJ
NY
OR
PA
SC
TN
CO
WA
WI
VA
ME
MN
MI
NC
TX
KY
WV
RI
NE
VT
NV OH
SD
AR
IN
NH
MT
ID
WY
ND
NMOK
LA
MSAL
DE
DC
10-12
13-18
7-9
PR
Source Centers for Medicare and Medicaid Services Dialysis Facility Compare 2014
Denominator At-risk adult Medicare patients with a central venous catheter who were receiving regular hemodialysis treatments at dialysis
facilities
Note For this measure lower percentages are better
Percentage of hemodialysis patients with central venous catheters used for vascular access for 90 days or longer by State 2014
HI
AKAK
AZ
CA
UT
CT
FL
GA
IA
IL
KS
MA
MDMO
NJ
NY
OR
PA
SC
TN
CO
WA
WI
VA
ME
MN
MI
NC
TX
KY
WV
RI
NE
VT
NV OH
SD
AR
IN
NH
MT
ID
WY
ND
NMOK
LA
MSAL
DE
DC
10-12
13-18
7-9
PR
Source Centers for Medicare and Medicaid Services Dialysis Facility Compare 2014
Denominator At-risk adult Medicare patients with a central venous catheter who were receiving regular hemodialysis treatments at dialysis
facilities
Note For this measure lower percentages are better
Percentage of hemodialysis patients with central venous catheters used for vascular access for 90 days or longer by State 2014
Importance Central venous catheters are frequently used for vascular access to dialysis
patients until a fistula or graft is formed Central venous catheters have higher rates of
infection and adverse events among patients receiving dialysis treatment compared with
other forms of vascular access To decrease the likelihood of adverse events catheters should
be used for less than 90 days
Overall Percentage Nationally an average of 10 of dialysis patients used central venous
catheters for 90 days or longer in 2014
Geographic Variation In 2014 Alabama and Kansas had the lowest percentages of dialysis
patients using central venous catheters for 90 days or longer (7) and Puerto Rico had the
highest percentage (18) of long-term catheter use
Patient Safety Infrastructure
Efforts to improve patient safety have been accompanied by various infrastructure
enhancements
Growth in patient safety organizations which assist providers in detecting and reducing
risks and hazards from care delivery that may lead to patient harm
System improvement initiatives at the Veterans Health Administration (VHA)
34 | National Healthcare Quality and Disparities Report
Patient Safety
Development of the National Practitioner Data Bank a clearinghouse for information on
medical malpractice payments
Patient Safety Organizations
Patient safety organizations (PSOs) aim to reduce preventable adverse events near misses
and unsafe conditions in all health care settings
PSOs provide an environment for health care providers to voluntarily report discuss and
learn from patient safety events and quality analyses on a privileged and confidential basis
Measures include
Number of PSOs serving each State
Variation in concentrations of compounded liquid medications for children
Patient Safety Organizations AHRQ Common Formats
AHRQ Common Formats provide a standardized method for PSOs health care providers
and other organizations to collect and report patient safety events
Data element standards are important for aggregating and analyzing events across
providers
AHRQ Common Formats have been developed for a variety of settings of care
Acute care hospitals
Skilled nursing facilities
Retail pharmacy
More information is available at httpspsoahrqgovcommon
National Healthcare Quality and Disparities Report | 35
Patient Safety
Number of Patient Safety Organizations
AZ (2)
CA (3)
UT (2)
CT(3)
FL (8)
GA (5)
IA (4)
IL (7)
KS (5)
MA(3)
MD (4)MO(2)
NJ(3)
NY (5)
OR (3)
PA (5)
SC (4)
TN (5)
CO (2)
WA (2)
WI (5)
VA (7)
ME(2)
MN(3)
MI (3)
NC (7)
TX (6)
KY (4)WV (3)
RI(2)
NE (2)
VT(2)
NV (2)
OH (2)
SD (1)
AR (4)
IN (2)
NH(2)
MT (2)
ID (3)
WY (2)
ND (1)
NM (3)OK (2)
LA (1)
MS (2)
AL (2)
DE(2)
HI (2)
AKAK (2)
DC(3)
PR (0)
1-2
3-4
5-6
7-8
Number of PSOs
excluding PSOs
operating nationally
Number of Patient Safety Organizations by area served 2014
Source Agency for Healthcare Research and Quality Patient Safety Organization Information Form Calendar Year 2014 and PSO-PPC
Contact Database
Note PSOs included in this map were AHRQ-listed during any part of 2014 and submitted the PSO Profile to the PSO Privacy Protection
Center (PSO-PPC) in early 2015 A PSO may have members in one or more States regardless of headquarters location Each State shows the
number of PSOs that serve that State map excludes 38 PSOs that are available to providers in all States
AZ (2)
CA (3)
UT (2)
CT(3)
FL (8)
GA (5)
IA (4)
IL (7)
KS (5)
MA(3)
MD (4)MO(2)
NJ(3)
NY (5)
OR (3)
PA (5)
SC (4)
TN (5)
CO (2)
WA (2)
WI (5)
VA (7)
ME(2)
MN(3)
MI (3)
NC (7)
TX (6)
KY (4)WV (3)
RI(2)
NE (2)
VT(2)
NV (2)
OH (2)
SD (1)
AR (4)
IN (2)
NH(2)
MT (2)
ID (3)
WY (2)
ND (1)
NM (3)OK (2)
LA (1)
MS (2)
AL (2)
DE(2)
HI (2)
AKAK (2)
DC(3)
PR (0)
1-2
3-4
5-6
7-8
Number of PSOs
excluding PSOs
operating nationally
Number of Patient Safety Organizations by area served 2014
Source Agency for Healthcare Research and Quality Patient Safety Organization Information Form Calendar Year 2014 and PSO-PPC
Contact Database
Note PSOs included in this map were AHRQ-listed during any part of 2014 and submitted the PSO Profile to the PSO Privacy Protection
Center (PSO-PPC) in early 2015 A PSO may have members in one or more States regardless of headquarters location Each State shows the
number of PSOs that serve that State map excludes 38 PSOs that are available to providers in all States
Importance All patient safety organizations (PSOs) have authority to operate in all 50
States and US territories but not all do In 2014 38 PSOs self-reported being available to
providers nationally PSOs not available nationally serve specific States
Geographic Variation
Nearly all States have at least 2 PSOs available to providers in their State in addition to
the 38 national PSOs that serve all States
Florida has the most PSOs available with 8 in addition to the 38 nationally available
PSOs The States with the largest number of PSOs available are generally on the East
Coast (eg North Carolina Virginia New York Pennsylvania Tennessee Georgia) or
have large populations (eg Texas Illinois)
North Dakota South Dakota and Louisiana are the only states with just one PSO serving
their State in addition to the 38 national PSOs
Puerto Rico is served by one national PSO only
36 | National Healthcare Quality and Disparities Report
Patient Safety
Compounded Liquid Medications for Children
Compounded liquid medications for children in Michigan 2012
Source Levy S Buckley B Safe Table Success The MI Pediatric Safety Collaboration Presentation presented at the 7th Annual
Meeting of Patient Safety Organizations (PSOs) Rockville MD 2015 April and Rood JM Engels MJ Ciarkowski SL et al Variability in
compounding of oral liquids for pediatric patients a patient safety concern J Am Pharm Assn 201454(4)383-9
Note Information represents 244 responses to online survey of approximately 2000 Michigan pharmacies conducted in June 2012 by
The University of Michigan College of Pharmacy in collaboration with the Michigan Pharmacists Association
0
10
20
30
40
50
1 2 3 4 5 6 7 8 9
Nu
mb
er o
f D
rugs
Number of Unique Concentrations
Number of Different Compounded Concentrations per Drug
0
10
20
30
40
50
No Harm No Harm ButMonitoring
TemporaryHarm
Pe
rce
nt
Compounding Errors by Related Harm and Pharmacy Setting
Inpatient Outpatient
Compounded liquid medications for children in Michigan 2012
Source Levy S Buckley B Safe Table Success The MI Pediatric Safety Collaboration Presentation presented at the 7th Annual
Meeting of Patient Safety Organizations (PSOs) Rockville MD 2015 April and Rood JM Engels MJ Ciarkowski SL et al Variability in
compounding of oral liquids for pediatric patients a patient safety concern J Am Pharm Assn 201454(4)383-9
Note Information represents 244 responses to online survey of approximately 2000 Michigan pharmacies conducted in June 2012 by
The University of Michigan College of Pharmacy in collaboration with the Michigan Pharmacists Association
0
10
20
30
40
50
1 2 3 4 5 6 7 8 9
Nu
mb
er o
f D
rugs
Number of Unique Concentrations
Number of Different Compounded Concentrations per Drug
0
10
20
30
40
50
No Harm No Harm ButMonitoring
TemporaryHarm
Per
cen
t
Compounding Errors by Related Harm and Pharmacy Setting
Inpatient Outpatient
Importance
Liquid medications are widely used in pediatrics because many children find it difficult
to swallow tablets or capsules If not commercially manufactured these liquid
medications require a pharmacist to compound them to the correct dosage for the patient
This practice of compounding has led to a variety of medication concentrations in use In
the absence of standard concentrations for compounded medications there is a risk that
children may accidentally receive medications that are too potent and can be dangerous
or are too weak to be effective
The Michigan Health amp Hospital Association Keystone Center Patient Safety
Organization hosts five Pediatric Safe Tables each year Safe Tables provided a
confidential and legally protected environment to discuss challenges and improvement
strategies regarding inconsistent medication concentrations for compounded oral liquids
without fear of punitive action against them
National Healthcare Quality and Disparities Report | 37
Patient Safety
Overall Percentage
More than half (527) of drugs identified in the 2012 survey had 3 or more unique
concentrations dispensed to children across Michigan For example Rifampin used to
treat bacterial infections was reported to have 8 different concentrations dispensed to
patients
Nearly one-third (313) of reported errors caused temporary harm or required additional
monitoring despite no harm
Standardization of Compounded Liquid Medications
Source Michigan Health amp Hospital Association Keystone Center Patient Safety Organization and University of Michigan College of Pharmacy
State-Wide Initiative to Standardize the Compounding of Oral Liquids in Pediatrics
Standardization of compounded liquid medications for children in Michigan 2011
Issue identificationbull Hospitals attending PSO Pediatrics Safe
Table raise compounded medication concentrations as a major safety issue
bull Small focus group determines extent of problem
bull Michigan pharmacies are surveyed about baseline concentrations
Develop Interventionbull PSO Quarterly Safe Tables are held to
discuss cases and practicesbull Team develops recommendations for
standard concentrationsbull Consensus is achieved for frequently
compounded pediatric medications 470 formulations for 147 drug entities are reduced to 104 concentrations for 100 drugs
Practice changebull Toolkit is createdbull Standards are disseminated to Michigan
prescribers and pharmacies bull Standards are disseminated to PSO
members and Safe Table participants
Source Michigan Health amp Hospital Association Keystone Center Patient Safety Organization and University of Michigan College of Pharmacy
State-Wide Initiative to Standardize the Compounding of Oral Liquids in Pediatrics
Standardization of compounded liquid medications for children in Michigan 2011
Issue identificationbull Hospitals attending PSO Pediatrics Safe
Table raise compounded medication concentrations as a major safety issue
bull Small focus group determines extent of problem
bull Michigan pharmacies are surveyed about baseline concentrations
Develop Interventionbull PSO Quarterly Safe Tables are held to
discuss cases and practicesbull Team develops recommendations for
standard concentrationsbull Consensus is achieved for frequently
compounded pediatric medications 470 formulations for 147 drug entities are reduced to 104 concentrations for 100 drugs
Practice changebull Toolkit is createdbull Standards are disseminated to Michigan
prescribers and pharmacies bull Standards are disseminated to PSO
members and Safe Table participants
The Role of PSO Safe Tables Based on adverse medication events discussed in the
Michigan Health amp Hospital Association (MHA) Keystone Center Patient Safety
Organization (PSO) Safe Tables in July 2011 the Michigan Pediatric Safety Collaboration
was developed to further assess the scope of the problem and formulate a solution
The Collaborative The Michigan Pediatric Safety Collaboration includes individuals from
the University of Michigan College of Pharmacy the Michigan Pharmacists Association
(MPA) the Food and Drug Administration (FDA) and the MHA Keystone PSO
38 | National Healthcare Quality and Disparities Report
Patient Safety
Practice Change
As a result of the standardization effort 470 unique formulations for 147 drug entities
were reduced to 104 different concentrations for 100 drugs
The Michigan Pediatric Safety Collaboration developed a multistep process to implement
standards for compounding medications The MPA surveyed pharmacies in Michigan to
better define the nature and scope of the problem The PSO continued to act as convener
The result was the creation and dissemination of statewide standards for 120 frequently
compounded pediatric medications
Veterans Health Administration
The National Center for Patient Safety is part of the Veterans Health Administration the
Nationrsquos largest integrated health care system
Patient safety-related system improvement initiatives include
The Daily Planreg
Purchasing for Safety Initiative
Patient Safety Improvement Initiative
Patient safety improvement initiative The Daily Planreg at Veterans Affairs Medical Centers 2009
Source King BJ Mills PD Fore A et al The Daily Planreg including patients for safetys sake Nurs Manage 201243(3)15-8
0
10
20
30
40
50
Identified atleast one
error
Identifiederror
of omission
Identifiederror
ofcommission
Nurses Who Identified Errors in Patient Treatment Plan by Type
0
10
20
30
40
50
Patient founddiscrepancy inplanned care
Family founddiscrepancy inplanned care
Nursing Stafffound
discrepancyin plannedtreatment
Respondents Who Identified Errors or Discrepancies Through The Daily Plan reg
Patient safety improvement initiative The Daily Planreg at Veterans Affairs Medical Centers 2009
Source King BJ Mills PD Fore A et al The Daily Planreg including patients for safetys sake Nurs Manage 201243(3)15-8
0
10
20
30
40
50
Identified atleast one
error
Identifiederror
of omission
Identifiederror
ofcommission
Nurses Who Identified Errors in Patient Treatment Plan by Type
0
10
20
30
40
50
Patient founddiscrepancy inplanned care
Family founddiscrepancy inplanned care
Nursing Stafffound
discrepancyin plannedtreatment
Respondents Who Identified Errors or Discrepancies Through The Daily Plan reg
National Healthcare Quality and Disparities Report | 39
Patient Safety
Importance The Daily Planreg
is a two-page printed summary that acts as a schedule for
patients and providers each day It shows the procedures laboratory tests and medications
scheduled for that day and lists essential health information such as patientrsquos name allergies
and current medications It can be tailored for a patientrsquos needs by extracting orders from the
electronic medical record (EMR) The Daily Planreg
is intended to facilitate patient and family
engagement throughout the course of care The Daily Planreg
shows promise for improving
patient safety Since 2009 the VA has implemented The Daily Planreg
in more than 65
hospitals both inpatient and outpatient care settings The Daily Planreg
is shared more than
75000 times a month and the VA plans to continue the spread of The Daily Planreg
at
additional sites in 2016
Findings
As part of a pilot test in 2009 a total of 198 patients and 85 nurses responded to a survey
across 10 facilities Nurses had an average of 34 patients per shift who received The
Daily Planreg Patients responded about their own experiences whereas nurses reported
about all of their patients who received The Daily Planreg
Nearly half (475) of patients reported finding a discrepancy in planned care through
The Daily Planreg In addition 30 of patients reported that their family members found a
discrepancy Although not every discrepancy will be a potential medical error having a
shared understanding of the plan of care decreases the risk of error
More than one in six nurses (176) identified a discrepancy in treatment among their
patients through The Daily Planreg Most of these nurses (153) found one or more errors
of omission and a smaller share (106) of nurses found one or more errors of
commission some found both
40 | National Healthcare Quality and Disparities Report
Patient Safety
Issues Related to Ventilators
Common use-issues related to ventilators at the Veterans Health Administration 2006-2014 (combined)
Source Veterans Health Administration National Center for Patient Safety data collected October 2006 to October 2014
Note Examples of equipment failures include ventilator shutdown and other ventilator problems Ventilator settings include setup problems and
incorrect settings Support activities include space utilities and supplies Transport includes accidental extubation other transportation issues
and vehicle-related issues Alarms include alarm settings and alarm connection Training includes unknown ventilator model and other training
concerns
0
20
40
60
80
100
120
140
160
EquipmentFailure
VentilatorSettings
SupportActivities
Transport Alarms Training
Nu
mb
er o
f R
epo
rts
Common use-issues related to ventilators at the Veterans Health Administration 2006-2014 (combined)
Source Veterans Health Administration National Center for Patient Safety data collected October 2006 to October 2014
Note Examples of equipment failures include ventilator shutdown and other ventilator problems Ventilator settings include setup problems and
incorrect settings Support activities include space utilities and supplies Transport includes accidental extubation other transportation issues
and vehicle-related issues Alarms include alarm settings and alarm connection Training includes unknown ventilator model and other training
concerns
0
20
40
60
80
100
120
140
160
EquipmentFailure
VentilatorSettings
SupportActivities
Transport Alarms Training
Nu
mb
er o
f R
epo
rts
Importance Beginning with a focus on ventilators the Veterans Health Administrationrsquos
human factors-based Purchasing for Safety Initiative communicates the most common use-
issues associated with medical devices in order to ultimately remove or contain identified
vulnerabilities and prevent further harm
Event Reporting Patient safety managers report events and close calls from more than 150
VA facilities to a national database The largest number of use issues related to ventilators
involved equipment failure and issues such as spontaneous ventilator shutdown compressor
failure and broken or missing parts Other categories of ventilator use issues involved the
physical space where the ventilator was used challenges of transporting patients on
ventilators and problems with ventilator settings and alarms Root cause analyses on reports
are conducted and Patient Safety Alerts are issued to share the learning internally
Other Key Components
Data on ventilator issues from the VA and the Food and Drug Administrationrsquos Medical
Product Safety Network are the basis for a ldquogovernment-industry dayrdquo to work with
manufacturers This information is used to help the device manufacturers better
understand the limits of human use of their products
National Healthcare Quality and Disparities Report | 41
Patient Safety
The VA also trains noncliniciansmdashsuch as biomedical engineers across the
organizationmdashto understand the devices consider the situation for their use and identify
what can go wrong (ldquofailure modesrdquo) in advance
The VA encourages discussions among clinicians about their experience in using devices
In the Applied Patient Safety Challenge hundreds of staff participate in brainstorming
about solutions and strategies for dealing with unexpected scenarios involving devices
National Practitioner Data Bank
Medical malpractice actions are one way to flag potential medical errors
Medical Malpractice Payment Reports are submitted to the National Practitioner Data Bank
by medical malpractice payers
Report of a monetary exchange made for the benefit of a physician dentist or other
health care provider
Result of a settlement or judgment of a written complaint or claim based on that
providerrsquos delivery of or failure to deliver health care services
Number of Medical Malpractice Payment Reports by Setting
Number of Medical Malpractice Payment Reports by health care setting 2004-2014
Source National Practitioner Data Bank (NPDB) Public Use Data File Health Resources and Services Administration Bureau of Health
Professions Division of Practitioner Data Banks 2004-2014
Note Health care setting was not collected by the NPDB for 2104 reports in 2004 ldquoOtherrdquo includes Medical Malpractice Payment Reports
related to unknown settings as well as those for a combination of inpatient and outpatient settings Reports pertain to patients of any age
0
2000
4000
6000
8000
10000
12000
14000
16000
18000
20000
2004 2005 2006 2007 2008 2009 2010 2011 2012 2013 2014
Nu
mb
er o
f R
epo
rts
Total Inpatient Outpatient Other
Number of Medical Malpractice Payment Reports by health care setting 2004-2014
Source National Practitioner Data Bank (NPDB) Public Use Data File Health Resources and Services Administration Bureau of Health
Professions Division of Practitioner Data Banks 2004-2014
Note Health care setting was not collected by the NPDB for 2104 reports in 2004 ldquoOtherrdquo includes Medical Malpractice Payment Reports
related to unknown settings as well as those for a combination of inpatient and outpatient settings Reports pertain to patients of any age
0
2000
4000
6000
8000
10000
12000
14000
16000
18000
20000
2004 2005 2006 2007 2008 2009 2010 2011 2012 2013 2014
Nu
mb
er o
f R
epo
rts
Total Inpatient Outpatient Other
42 | National Healthcare Quality and Disparities Report
Patient Safety
Trends The total number of medical malpractice payment reports (MMPRs) per year
decreased from 17641 in 2004 to 12699 in 2014
Variation Across Reports
Of 157022 MMPRs from 2004 through 2014 more reports related to care in the
outpatient setting (71937) than in the inpatient setting (60391)
Diagnosis-related and treatment-related payments were the most frequent types of
reports each accounting for about 27 of cases Reports of payments for medication-
related cases accounted for only 5 of MMPRs (data not shown)
Number of Medical Malpractice Payment Reports by Allegation and Harm
Number of Medical Malpractice Payment Reports by type of allegation and harm severity 2004-2014
Key Temporary injury = Minor temporary injury and Major temporary injury Permanent significant injury = Significant Permanent Injury
Major Permanent Injury Quadriplegia Brain Damage Lifelong care
Source National Practitioner Data Bank Public Use Data File Health Resources and Services Administration Bureau of Health Professions
Division of Practitioner Data Banks 2004-2014
Note Reports pertain to patients of any age
0
20
40
60
80
100
Treatment(n=42913)
Diagnosis(n=42507)
Surgery(n=36845)
Obstetrics(n=10555)
Medication(n=8287)
Monitoring(n=5329)
Anesthesia(n=4276)
Equipment(n=1161)
BehavioralHealth
(n=879)
Blood(n=379)
EmotionalInjury Only
InsignificantInjury
TemporaryInjury
PermanentMinor Injury
PermanentSignificant Injury
Death Unknown
Number of Medical Malpractice Payment Reports by type of allegation and harm severity 2004-2014
Key Temporary injury = Minor temporary injury and Major temporary injury Permanent significant injury = Significant Permanent Injury
Major Permanent Injury Quadriplegia Brain Damage Lifelong care
Source National Practitioner Data Bank Public Use Data File Health Resources and Services Administration Bureau of Health Professions
Division of Practitioner Data Banks 2004-2014
Note Reports pertain to patients of any age
0
20
40
60
80
100
Treatment(n=42913)
Diagnosis(n=42507)
Surgery(n=36845)
Obstetrics(n=10555)
Medication(n=8287)
Monitoring(n=5329)
Anesthesia(n=4276)
Equipment(n=1161)
BehavioralHealth
(n=879)
Blood(n=379)
EmotionalInjury Only
InsignificantInjury
TemporaryInjury
PermanentMinor Injury
PermanentSignificant Injury
Death Unknown
Overall Percentage From 2004 to 2014 medical malpractice payments were made for
allegations related to
Treatment (42913)
Diagnosis (42507)
Surgery (36845)
Obstetrics (10555)
Medication (8287)
Monitoring (5329)
National Healthcare Quality and Disparities Report | 43
Patient Safety
Anesthesia (4276)
Equipment or products (1161)
Behavioral health (879) and
IV and blood products (379)
Variation Across Reports
Death accounted for more than one-third of harm in payments related to monitoring
(499) diagnosis (393) medication (383) and anesthesia (363) allegations
More than half of all obstetric payments were for allegations of permanent severe harm
(570)
Temporary harm accounted for more than one-third of payments related to equipment
(485) and surgery (360)
Most of the behavioral health-related payments were for emotional harm (457) or
death (338)
References
Agency for Healthcare Research and Quality Making Health Care Safer II An Updated Critical Analysis of the
Evidence for Patient Safety Practices Comparative Effectiveness Review No 211 Rockville MD Agency for
Healthcare Research and Quality March 2013 AHRQ Publication No 13-E001-EF
httpwwwahrqgovsitesdefaultfileswysiwygresearchfindingsevidence-basedshy
reportsservicesqualityptsafetyII-fullpdf
Arriaga AF Lancaster RT Berry RW et al The better colectomy project association of evidence-based best-
practice adherence rates to outcomes in colorectal surgery Ann Surg 2009 Oct250(4)507-13
httpwwwncbinlmnihgovpubmed19734778
Centers for Disease Control and Prevention HAI Prevalence Survey
httpwwwcdcgovHAIsurveillanceindexhtml Last updated March 2016 Accessed March 4 2016
Centers for Disease Control and Prevention Nursing Homes and Assisted Living (Long-Term Care Facilities)
httpwwwcdcgovlongtermcare Last updated September 2015 Accessed March 4 2016
Chassin MR Loeb JM High-reliability health care getting there from here Milbank Q 201391(3)459-90
httpwwwncbinlmnihgovpmcarticlesPMC3790522 Accessed September 23 2015
Chiu Y Bero L Hessol NA et al A literature review of clinical outcomes associated with antipsychotic medication
use in North American nursing home residents Health Policy 2015 Jun119(6)802-813 Epub 2015 Feb 28 PMID
25791166 httpwwwsciencedirectcomsciencearticlepiiS0168851015000652 Accessed June 17 2015
Huybrechts KF Gerhard Crystal S et al Differential risk of death in older residents in nursing homes prescribed
specific antipsychotic drugs Population based cohort study BMJ 2012 Feb 23344e977 PMID 22362541
httpwwwncbinlmnihgovpmcarticlesPMC3285717 Accessed June 17 2015
Institute of Medicine Preventing Medication Errors Quality Chasm Series 2007
httpwwwnapeducatalog11623preventing-medication-errors-quality-chasm-series
National Association for Home Care amp Hospice Basic Statistics About Home Care Updated 2010
httpwwwnahcorgassets1710hc_statspdf Accessed August 31 2015
44 | National Healthcare Quality and Disparities Report
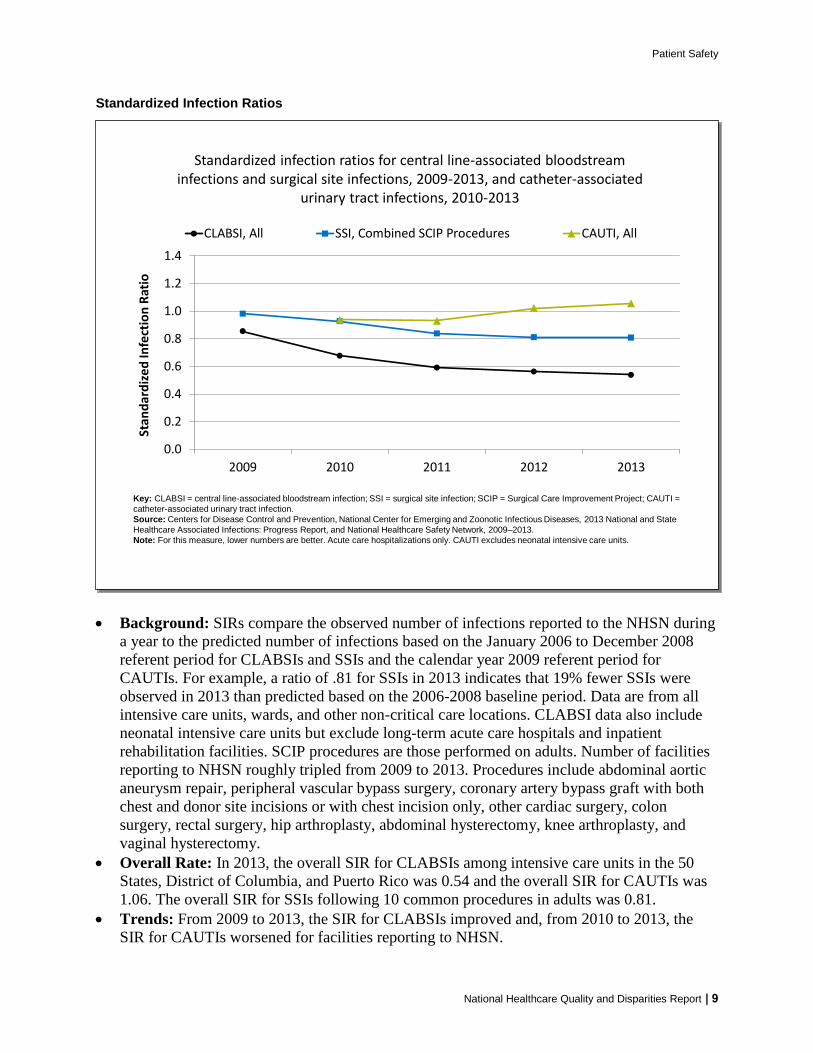
Patient Safety
Standardized Infection Ratios
Standardized infection ratios for central line-associated bloodstream infections and surgical site infections 2009-2013 and catheter-associated
urinary tract infections 2010-2013
Key CLABSI = central line-associated bloodstream infection SSI = surgical site infection SCIP = Surgical Care Improvement Project CAUTI =
catheter-associated urinary tract infection
Source Centers for Disease Control and Prevention National Center for Emerging and Zoonotic Infectious Diseases 2013 National and State
Healthcare Associated Infections Progress Report and National Healthcare Safety Network 2009ndash2013
Note For this measure lower numbers are better Acute care hospitalizations only CAUTI excludes neonatal intensive care units
00
02
04
06
08
10
12
14
2009 2010 2011 2012 2013
Stan
dar
diz
ed
Infe
ctio
n R
atio
CLABSI All SSI Combined SCIP Procedures CAUTI All
Standardized infection ratios for central line-associated bloodstream infections and surgical site infections 2009-2013 and catheter-associated
urinary tract infections 2010-2013
Key CLABSI = central line-associated bloodstream infection SSI = surgical site infection SCIP = Surgical Care Improvement Project CAUTI =
catheter-associated urinary tract infection
Source Centers for Disease Control and Prevention National Center for Emerging and Zoonotic Infectious Diseases 2013 National and State
Healthcare Associated Infections Progress Report and National Healthcare Safety Network 2009ndash2013
Note For this measure lower numbers are better Acute care hospitalizations only CAUTI excludes neonatal intensive care units
00
02
04
06
08
10
12
14
2009 2010 2011 2012 2013
Stan
dar
diz
ed
Infe
ctio
n R
atio
CLABSI All SSI Combined SCIP Procedures CAUTI All
Background SIRs compare the observed number of infections reported to the NHSN during
a year to the predicted number of infections based on the January 2006 to December 2008
referent period for CLABSIs and SSIs and the calendar year 2009 referent period for
CAUTIs For example a ratio of 81 for SSIs in 2013 indicates that 19 fewer SSIs were
observed in 2013 than predicted based on the 2006-2008 baseline period Data are from all
intensive care units wards and other non-critical care locations CLABSI data also include
neonatal intensive care units but exclude long-term acute care hospitals and inpatient
rehabilitation facilities SCIP procedures are those performed on adults Number of facilities
reporting to NHSN roughly tripled from 2009 to 2013 Procedures include abdominal aortic
aneurysm repair peripheral vascular bypass surgery coronary artery bypass graft with both
chest and donor site incisions or with chest incision only other cardiac surgery colon
surgery rectal surgery hip arthroplasty abdominal hysterectomy knee arthroplasty and
vaginal hysterectomy
Overall Rate In 2013 the overall SIR for CLABSIs among intensive care units in the 50
States District of Columbia and Puerto Rico was 054 and the overall SIR for CAUTIs was
106 The overall SIR for SSIs following 10 common procedures in adults was 081
Trends From 2009 to 2013 the SIR for CLABSIs improved and from 2010 to 2013 the
SIR for CAUTIs worsened for facilities reporting to NHSN
National Healthcare Quality and Disparities Report | 9
Patient Safety
Change in Statewide SIRs
Change from 2012 to 2013 in Statewide SIRs for CAUTI
Key CAUTI = catheter-associated urinary tract infection NHSN = National Healthcare Safety Network
Source Centers for Disease Control and Prevention National Center for Emerging and Zoonotic Infectious Diseases 2013 National and State
Healthcare Associated Infections Progress Report
Note For this measure lower numbers are better Changes in SIRs are categorized as ldquono changerdquo if they are not statistically significant Acute
care hospitalizations only Excludes neonatal intensive care units For this measure District of Columbia and Puerto Rico are treated as States
No Change
Increase
Indicates State mandate
in 2013 to report CAUTI
to NHSN
Decrease
AKAK
HI PR
AZ
CA
UT
CT
FL
GA
IA
IL
KS
MA
MDMO
NJ
NY
OR
PA
SCTN
CO
WA
WI
VA
ME
MN
MI
NC
TX
KY
WV
RI
NE
VT
NVOH
SD
AR
IN
NH
MT
ID
WY
ND
NM
OK
LA
MS AL
DE
DC
Change from 2012 to 2013 in Statewide SIRs for CAUTI
Key CAUTI = catheter-associated urinary tract infection NHSN = National Healthcare Safety Network
Source Centers for Disease Control and Prevention National Center for Emerging and Zoonotic Infectious Diseases 2013 National and State
Healthcare Associated Infections Progress Report
Note For this measure lower numbers are better Changes in SIRs are categorized as ldquono changerdquo if they are not statistically significant Acute
care hospitalizations only Excludes neonatal intensive care units For this measure District of Columbia and Puerto Rico are treated as States
No Change
Increase
Indicates State mandate
in 2013 to report CAUTI
to NHSN
Decrease
AKAK
HI PR
AZ
CA
UT
CT
FL
GA
IA
IL
KS
MA
MDMO
NJ
NY
OR
PA
SCTN
CO
WA
WI
VA
ME
MN
MI
NC
TX
KY
WV
RI
NE
VT
NVOH
SD
AR
IN
NH
MT
ID
WY
ND
NM
OK
LA
MS AL
DE
DC
Geographic Variation In 2013 31 States had SIRs greater than 1 indicating that on average
their hospitals had more CAUTIs than hospitals of similar type and size during the 2009
referent period The States were Alaska Arkansas Arizona Connecticut District of Columbia
Delaware Georgia Idaho Indiana Kansas Kentucky Massachusetts Maryland Maine
Michigan Minnesota Missouri Mississippi North Carolina New Jersey Nevada New York
Oregon Pennsylvania Rhode Island South Carolina Tennessee Texas Utah Virginia and
Washington
Trends Of 52 reporting States 33 had no change from 2012 to 2013 in CAUTI SIRs 9
decreased and 10 increased
Toolkit for Reducing Catheter-Associated Urinary Tract Infections in Hospitals
Purpose To help hospitals prevent catheter-associated urinary tract infections (CAUTIs) and
improve safety culture
Method Implementing evidence-based practical resources and concepts from the
Comprehensive Unit-based Safety Program
Intended User Hospital facilities
Available Tools Guides checklists webinars learning modules data interpretation guides
10 | National Healthcare Quality and Disparities Report
Patient Safety
Potential Measures of Effectiveness
Number of symptomatic CAUTIs attributable to each unit by month
Days since last CAUTI
Link httpwwwahrqgovprofessionalsquality-patient-safetyhaistoolscautishy
hospitalsIndexhtml
Central Line-Associated Bloodstream Infections in Neonatal Intensive Care Units
Central line-associated bloodstream infections per 1000 central-line days by birth weight of child in Level III neonatal intensive care units and by type
of pediatric ICU 2009-2013
Source Centers for Disease Control and Prevention National Healthcare Safety Network 2009-2013
Denominator Infections per 1000 central-line days
Note For this measure lower rates are better Acute care hospitalizations only
00
05
10
15
20
25
30
35
40
2009 2010 2011 2012 2013
Rat
e p
er
10
00
Ce
ntr
al-
Lin
e D
ays
le750 g 751-1000 g1001-1500 g 1501-2500 ggt2500 g
Level III Neonatal ICUs
00
05
10
15
20
25
30
35
40
2009 2010 2011 2012 2013
Rat
e p
er
10
00
Ce
ntr
al-
Lin
e D
ays
Pediatric Cardiothoracic ICUPediatric Medical ICUPediatric MedicalSurgical ICU
Pediatric ICUs
Central line-associated bloodstream infections per 1000 central-line days by birth weight of child in Level III neonatal intensive care units and by type
of pediatric ICU 2009-2013
Source Centers for Disease Control and Prevention National Healthcare Safety Network 2009-2013
Denominator Infections per 1000 central-line days
Note For this measure lower rates are better Acute care hospitalizations only
00
05
10
15
20
25
30
35
40
2009 2010 2011 2012 2013
Rat
e p
er
10
00
Ce
ntr
al-
Lin
e D
ays
le750 g 751-1000 g1001-1500 g 1501-2500 ggt2500 g
Level III Neonatal ICUs
00
05
10
15
20
25
30
35
40
2009 2010 2011 2012 2013
Rat
e p
er 1
000
Cen
tral
-Lin
e D
ays
Pediatric Cardiothoracic ICUPediatric Medical ICUPediatric MedicalSurgical ICU
Pediatric ICUs
Overall Rates
In 2013 among patients in Level III NICUs pooled mean CLABSI rates ranged from a
low of 06 infections per 1000 central-line days among neonates born at 1501 to 2500
grams to a high of 21 infections per 1000 central-line days among neonates born at less
than or equal to 750 grams
Trends
The rate of CLABSI among pediatric cardiothoracic ICUs was 25 in 2009 and 13 in
2013 among pediatric medical ICUs 26 in 2009 and 08 in 2013 and among pediatric
medicalsurgical ICUs 22 in 2009 and 12 in 2013
National Healthcare Quality and Disparities Report | 11
Patient Safety
Central Line-Associated Bloodstream Infections in Adult Intensive Care Units
Central linendashassociated bloodstream infections per 1000 central-line days in adult medical vs medicalsurgical intensive care units by hospital teaching
status 2006ndash2013
Source Centers for Disease Control and Prevention National Healthcare Safety Network 2006-2013
Denominator Infections per 1000 central-line days
Note For this measure lower rates are better Acute care hospitalizations only Major teaching facilities are defined as facilities with a program
for medical students and postgraduate medical training All other medical facilities include graduate facilities with programs for postgraduate
medical training only (ie residency andor fellowships) and undergraduate facilities with programs for medical students only
00
05
10
15
20
25
30
2006-2008 2009 2010 2011 2012 2013
Rat
e p
er
10
00
Ce
ntr
al-L
ine
Day
s
Major Teaching Medical ICU All Others Medical ICU
Major Teaching MedicalSurgical ICU All Others MedicalSurgical ICU
Central linendashassociated bloodstream infections per 1000 central-line days in adult medical vs medicalsurgical intensive care units by hospital teaching
status 2006ndash2013
Source Centers for Disease Control and Prevention National Healthcare Safety Network 2006-2013
Denominator Infections per 1000 central-line days
Note For this measure lower rates are better Acute care hospitalizations only Major teaching facilities are defined as facilities with a program
for medical students and postgraduate medical training All other medical facilities include graduate facilities with programs for postgraduate
medical training only (ie residency andor fellowships) and undergraduate facilities with programs for medical students only
00
05
10
15
20
25
30
2006-2008 2009 2010 2011 2012 2013
Rat
e p
er
10
00
Ce
ntr
al-L
ine
Day
s
Major Teaching Medical ICU All Others Medical ICU
Major Teaching MedicalSurgical ICU All Others MedicalSurgical ICU
Trends
Between 2006-2008 (combined) and 2013 there was a 46 decrease in CLABSIs (data
not shown)
From 2006-2008 (combined) to 2013 rates of CLABSIs in hospitals decreased 538
among adult medical ICU patients in hospitals with major teaching programs 476
among adult medicalsurgical ICU patients in hospitals with major teaching programs
421 among adult medical ICU patients in all other hospitals and 467 among adult
medicalsurgical ICU patients in all other hospitals
Tools for Reducing Central Line-Associated Bloodstream Infections
Purpose To help hospitals prevent central line-associated bloodstream infections (CLABSIs)
and improve safety culture
Methods Implementing evidence-based practical resources and concepts from the
Comprehensive Unit-based Safety Program (CUSP)
Intended user Hospital facilities
Available tools Checklists preventable incidence calculator audit form event report
template
12 | National Healthcare Quality and Disparities Report
Patient Safety
Impact
Through use of the CUSP toolkit and CLABSI tools more than 100 intensive care units
in Michigan have nearly eliminated CLABSIs
Nationwide the use of this toolkit has helped more than 1000 hospitals reduce rates of
CLABSI by 41 in aggregate See httpwwwahrqgovworkingforqualitypias
mhhakcpiahtm and httpwwwahrqgovprofessionalseducationcurriculumshy
toolsclabsitoolsindexhtmlpurpose
Procedure-Related Events
More than 40 million operative procedures are performed in the United States each year
Postoperative adverse events are not uncommon and increase both hospitalization length and
cost (AHRQ 2013)
Measures include
Risk-adjusted mortality at 30 days postoperation for colorectal surgery performed in
adults
Percentage of adult patients receiving hip joint replacement (because of fracture or
degenerative conditions) who experienced adverse events
Percentage of adults with mechanical adverse events associated with central venous
catheter placement
Postoperative Mortality
Risk-adjusted mortality rate within 30 days postoperation for adults undergoing colorectal surgery in ACS NSQIP participating hospitals in the United States by
raceethnicity and hospital teaching status 2008-2014
0
1
2
3
4
5
6
Pe
rce
nt
Teaching Nonteaching
Source American College of Surgeons (ACS) National Surgical Quality Improvement Program (NSQIP) 2008-2014
Denominator Adults age 18 years and over
Note For this measure lower percentages are better The participation in the ACS NSQIP is voluntary and current participation is weighted
when calculating rates Participating hospitals have changed over time 203 hospitals participated in 2008 and 531 hospitals participated in
2014 Other includes Asian American Indian or Alaska Native and Native Hawaiian or Other Pacific Islander White Black and Other are non-
Hispanic Hispanic includes all races
0
1
2
3
4
5
6
Pe
rce
nt
Total White Black Hispanic Other
Risk-adjusted mortality rate within 30 days postoperation for adults undergoing colorectal surgery in ACS NSQIP participating hospitals in the United States by
raceethnicity and hospital teaching status 2008-2014
0
1
2
3
4
5
6
Pe
rce
nt
Teaching Nonteaching
Source American College of Surgeons (ACS) National Surgical Quality Improvement Program (NSQIP) 2008-2014
Denominator Adults age 18 years and over
Note For this measure lower percentages are better The participation in the ACS NSQIP is voluntary and current participation is weighted
when calculating rates Participating hospitals have changed over time 203 hospitals participated in 2008 and 531 hospitals participated in
2014 Other includes Asian American Indian or Alaska Native and Native Hawaiian or Other Pacific Islander White Black and Other are non-
Hispanic Hispanic includes all races
0
1
2
3
4
5
6
Pe
rce
nt
Total White Black Hispanic Other
National Healthcare Quality and Disparities Report | 13
Patient Safety
Importance Colorectal procedures have high rates of postoperative complications
Nonadherence to evidence-based best practices is associated with an increased risk of these
complications (Arriaga et al 2009)
Overall Rate In 2014 the risk-adjusted mortality rate was 31 among patients undergoing
colorectal surgeries at ACS NSQIP participating hospitals
Trends From 2008 to 2014 30-day postoperative mortality after colorectal surgery
improved
Groups With Disparities
In 2014 the percentage of patients with 30-day postoperative mortality was worse for
Blacks (36) compared with Whites (30)
From 2008 to 2014 there were no statistically significant changes in the gap between
minority groups and Whites in the percentage of patients with 30-day postoperative
mortality
Adverse Events After Hip Joint Replacement
Adult patients receiving hip joint replacement due to fracture or degenerative conditions who experienced adverse events by age and chronic obstructive
pulmonary disease 2009-2013
02468
101214161820
2009 2010 2011 2012 2013
Pe
rce
nt
Total 65-74 75-84 85+
02468
101214161820
2009 2010 2011 2012 2013
Pe
rce
nt
COPD No COPD
Key COPD = chronic obstructive pulmonary disease
Source Agency for Healthcare Research and Quality (AHRQ) and Centers for Medicare amp Medicaid Services (CMS) Medicare Patient Safety
Monitoring System (MPSMS) 2009-2013
Denominator All patients age 18 years and over in the MPSMS sample who had a surgical procedure performed to replace a hip joint due to
degenerative conditions or a fractured hip
Note For this measure lower percentages are better Hospitals in Puerto Rico the Virgin Islands and Maryland were not included in the
annual samples Samples were drawn from the CMS Hospital Inpatient Quality Reporting program and consist of medical records for
discharges following hip arthroplasty procedures as defined by the Surgical Care Improvement Project Rates for patients age 85 years and
over in 2013 and for ages 18-64 years old for all years are not shown because the data did not meet the criteria for statistical reliability data
quality or confidentiality COPD status relates to patients with a principal or secondary discharge diagnosis of COPD
Adult patients receiving hip joint replacement due to fracture or degenerative conditions who experienced adverse events by age and chronic obstructive
pulmonary disease 2009-2013
02468
101214161820
2009 2010 2011 2012 2013
Pe
rce
nt
Total 65-74 75-84 85+
02
4
68
10
12
1416
18
20
2009 2010 2011 2012 2013
Pe
rce
nt
COPD No COPD
Key COPD = chronic obstructive pulmonary disease
Source Agency for Healthcare Research and Quality (AHRQ) and Centers for Medicare amp Medicaid Services (CMS) Medicare Patient Safety
Monitoring System (MPSMS) 2009-2013
Denominator All patients age 18 years and over in the MPSMS sample who had a surgical procedure performed to replace a hip joint due to
degenerative conditions or a fractured hip
Note For this measure lower percentages are better Hospitals in Puerto Rico the Virgin Islands and Maryland were not included in the
annual samples Samples were drawn from the CMS Hospital Inpatient Quality Reporting program and consist of medical records for
discharges following hip arthroplasty procedures as defined by the Surgical Care Improvement Project Rates for patients age 85 years and
over in 2013 and for ages 18-64 years old for all years are not shown because the data did not meet the criteria for statistical reliability data
quality or confidentiality COPD status relates to patients with a principal or secondary discharge diagnosis of COPD
Importance Hip replacement is most common among older adults who have an increased
risk of adverse events after these surgeries
14 | National Healthcare Quality and Disparities Report
Patient Safety
Overall Percentage In 2013 49 of patients receiving a hip joint replacement experienced
an adverse event
Trends From 2009 to 2013 the overall percentage of adverse events improved for patients
who had a hip joint replacement due to fracture or degenerative conditions
Groups With Disparities
In 2013 there were no statistically significant differences by age or COPD status in the
percentage of hip replacement patients who had adverse events
From 2009 to 2013 there were no statistically significant changes in the gap between
patients age 75 and over and those ages 65-74 in adverse event frequencies Similarly
there were no statistically significant changes in disparities between patients with COPD
and those without COPD
Adverse Events Associated With Central Venous Catheter Placement
Adults with mechanical adverse events associated with central venous catheter placement by race and obesity status 2009-2013
Source Agency for Healthcare Research and Quality and Centers for Medicare amp Medicaid Services Medicare Patient Safety Monitoring
System 2009-2013
Denominator Selected discharges of hospitalized patients age 18 years and over with central venous catheter placement
Note For this measure lower percentages are better Mechanical adverse events include allergic reaction to the catheter tamponade
perforation pneumothorax hematoma shearing off of the catheter air embolism misplaced catheter thrombosisembolism knotting of the
pulmonary artery catheter and certain other events
0
2
4
6
8
10
2009 2010 2011 2012 2013
Pe
rce
nt
Total White Black
0
2
4
6
8
10
2009 2010 2011 2012 2013
Pe
rce
nt
Obese Not Obese
Adults with mechanical adverse events associated with central venous catheter placement by race and obesity status 2009-2013
Source Agency for Healthcare Research and Quality and Centers for Medicare amp Medicaid Services Medicare Patient Safety Monitoring
System 2009-2013
Denominator Selected discharges of hospitalized patients age 18 years and over with central venous catheter placement
Note For this measure lower percentages are better Mechanical adverse events include allergic reaction to the catheter tamponade
perforation pneumothorax hematoma shearing off of the catheter air embolism misplaced catheter thrombosisembolism knotting of the
pulmonary artery catheter and certain other events
0
2
4
6
8
10
2009 2010 2011 2012 2013
Pe
rce
nt
Total White Black
0
2
4
6
8
10
2009 2010 2011 2012 2013
Pe
rce
nt
Obese Not Obese
Importance Central venous catheterization (CVC) allows medical personnel quick access to
a patientrsquos bloodstream This ease of access is important when a patient requires life-saving
medications or when a physician needs to measure central venous pressure Mechanical
adverse events are most likely to occur while medical personnel are placing or maintaining
the central venous catheter
National Healthcare Quality and Disparities Report | 15
Patient Safety
Overall Percentage In 2013 32 of adults with central venous catheter placements
experienced an associated mechanical adverse event
Trends From 2009 to 2013 there were no statistically significant changes in the overall
percentage of adults with mechanical adverse events associated with central venous catheter
placement
Groups With Disparities
In 2013 the percentage of adults with mechanical adverse events associated with CVC
was worse for Blacks (67) compared with Whites (27) There were no statistically
significant differences by obesity status
From 2009 to 2013 there were no statistically significant changes in the gap between
Blacks and Whites in the percentage of adults with mechanical adverse events associated
with CVC
Adverse Drug Events
An estimated 400000 preventable ADEs occur each year in US hospitals generating
additional costs of $35 billion in 2006 dollars (IOM 2007)
An ADE is an injurymdashincluding physical harm mental harm or loss of functionmdash
resulting from medical intervention involving a drug
For more information see the PSNet link to Patient Safety Primer Medication Errors
httpspsnetahrqgovprimersprimer23medication-errors
The three initial targets of the HHS National Action Plan for Adverse Drug Event Prevention are
Anticoagulants and related bleeding
Diabetes agents and related hypoglycemia
Opioids and accidental overdose oversedation and respiratory depression
Measures of Patient Safety in the Hospital Setting Adverse Drug Events
Percentage of hospitalized adult patients who received a hypoglycemic agent and had an
adverse drug event
Percentage of hospitalized adult patients who had an anticoagulant-related adverse drug
event to warfarin
Number of opioid-related medication errors in patients of all ages
16 | National Healthcare Quality and Disparities Report
Patient Safety
Adverse Drug Events With Hypoglycemic Agents
Hospitalized adult patients who received a hypoglycemic agent who had adverse drug events with hypoglycemic agents by
raceethnicity 2010-2013 and renal disease 2009-2013
Source Agency for Healthcare Research and Quality and Centers for Medicare amp Medicaid Services Medicare Patient Safety Monitoring
System 2009-2013
Note For this measure lower percentages are better Hypoglycemic agents received by patients age 18 and over during a hospital stay include
insulin oral hypoglycemic or a combination of both The 2009 data for races did not meet the criteria for statistical reliability data quality or confidentiality
0
2
4
6
8
10
12
14
16
18
20
2009 2010 2011 2012 2013
Pe
rce
nt
Total Renal DiseaseNo Renal Disease
0
2
4
6
8
10
12
14
16
18
20
2010 2011 2012 2013
Pe
rce
nt
Total White BlackAsian Hispanic
Hospitalized adult patients who received a hypoglycemic agent who had adverse drug events with hypoglycemic agents by
raceethnicity 2010-2013 and renal disease 2009-2013
Source Agency for Healthcare Research and Quality and Centers for Medicare amp Medicaid Services Medicare Patient Safety Monitoring
System 2009-2013
Note For this measure lower percentages are better Hypoglycemic agents received by patients age 18 and over during a hospital stay include
insulin oral hypoglycemic or a combination of both The 2009 data for races did not meet the criteria for statistical reliability data quality or confidentiality
0
2
4
6
8
10
12
14
16
18
20
2009 2010 2011 2012 2013
Pe
rce
nt
Total Renal DiseaseNo Renal Disease
0
2
4
6
8
10
12
14
16
18
20
2010 2011 2012 2013
Pe
rce
nt
Total White BlackAsian Hispanic
Importance Hypoglycemic agents which are ingested orally are typically used in patients
with type II diabetes to control blood sugar levels In some cases diabetic patients use
hypoglycemic agents together with insulin The risk of chronic kidney disease increases
twofold for people with diabetes and renal impairment can increase the risk for adverse
events related to hypoglycemic agents
Overall Percentage In 2013 85 of hospital patients receiving hypoglycemic agents had
an adverse drug event
Trends The overall percentage of adverse drug events associated with hypoglycemic agents
improved from 2009 to 2013
Groups With Disparities
In 2013 the percentage of hospital patients who had adverse drug events with hypoglycemic agents was higher for Blacks (111) than for Whites (8)
Also in 2013 the percentage of hospital patients who had adverse drug events with
hypoglycemic agents was higher for those with renal disease (122) than for those
without renal disease (56)
From 2010 to 2013 there were no statistically significant changes in the gap between
minority groups and Whites in the percentage of patients who had adverse drug events
associated with hypoglycemic agents Similarly there were no statistically significant
changes in the gap between those with renal disease and those without
National Healthcare Quality and Disparities Report | 17
Patient Safety
Adverse Drug Events With Warfarin
Hospitalized adult patients with an anticoagulant-related adverse drug event with warfarin by age and corticosteroid use 2009-2013
Source Agency for Healthcare Research and Quality and Centers for Medicare amp Medicaid Services Medicare Patient Safety Monitoring
System 2009ndash2013
Denominator Patients 18 and over who received warfarin and had their international normalized ratio (INR) measured during their hospital
stay
Note For this measure lower percentages are better Adverse events occurring the day of hospital arrival were excluded
0
2
4
6
8
10
12
2009 2010 2011 2012 2013
Pe
rce
nt
TotalCorticosteroid UseNo Corticosteroid Use
0
2
4
6
8
10
12
2009 2010 2011 2012 2013
Pe
rce
nt
lt65 65-74 75-84 85+
Hospitalized adult patients with an anticoagulant-related adverse drug event with warfarin by age and corticosteroid use 2009-2013
Source Agency for Healthcare Research and Quality and Centers for Medicare amp Medicaid Services Medicare Patient Safety Monitoring
System 2009ndash2013
Denominator Patients 18 and over who received warfarin and had their international normalized ratio (INR) measured during their hospital
stay
Note For this measure lower percentages are better Adverse events occurring the day of hospital arrival were excluded
0
2
4
6
8
10
12
2009 2010 2011 2012 2013
Pe
rce
nt
TotalCorticosteroid UseNo Corticosteroid Use
0
2
4
6
8
10
12
2009 2010 2011 2012 2013
Pe
rce
nt
lt65 65-74 75-84 85+
Importance Blood clots in arteries and veins can cause a blockage of blood flow and lead to
strokes and heart attacks Anticoagulants such as warfarin reduce this risk but pose an
increased risk of bleeding Corticosteroids can interact with anticoagulants to raise the risk of
potential bleeding complications
Overall Percentage In 2013 50 of adults using warfarin experienced an anticoagulant-
related adverse drug event
Trends From 2009 to 2013 there were no statistically significant changes in the overall
percentage of hospital patients with an adverse drug event related to warfarin
Groups With Disparities
In 2013 the percentage of hospital patients who had an adverse drug event to warfarin
was the same regardless of corticosteroid use status
From 2009 to 2013 there were no statistically significant changes in the gap between
older age groups and those under age 65 in the percentage of patients who had adverse
events associated with warfarin Similarly there were no statistically significant changes
in the gap between those using corticosteroids and those not using corticosteroids
18 | National Healthcare Quality and Disparities Report
Patient Safety
Opioid-Related Medication Errors
Number of opioid-related medication errors reported in Pennsylvania by AHRQ eventharm category and age 2006 2008 2010 2012 2014
30 53 44 27 23
2947 2798 2714 27082408
9531014
984 969
910
175 245251 398
330
0
500
1000
1500
2000
2500
3000
3500
4000
4500
2006 2008 2010 2012 2014
Nu
mb
er o
f Ev
ents
Unsafe Condition Near Miss
Patient Event No Harm Patient Event Harm
Source Institute of Safe Medication Practices on behalf of the Pennsylvania Patient Safety Authority 2006-2014
Note Pennsylvania Patient Safety Reporting System reports of medication errors are from acute-level facilities that consist of hospitals
ambulatory surgical facilities birthing centers and abortion facilities Medication errors do not include adverse drug reactions Eventharm
categories refer to those in the Agency for Healthcare Research and Quality Common Formats Unsafe condition is defined as any
circumstance that increases the probability of a patient safety event A near miss is defined as a patient safety event that did not reach the
patient Deaths are included in the total but not shown on the chart because there were too few to render graphically
192 166 336530 662
2287 24842385
2364 1955
16271461 1272
1208
1055
0
500
1000
1500
2000
2500
3000
3500
4000
4500
2006 2008 2010 2012 2014
Nu
mb
er o
f Ev
en
ts
lt18 18-64 65+
Number of opioid-related medication errors reported in Pennsylvania by AHRQ eventharm category and age 2006 2008 2010 2012 2014
30 53 44 27 23
2947 2798 2714 27082408
9531014
984 969
910
175 245251 398
330
0
500
1000
1500
2000
2500
3000
3500
4000
4500
2006 2008 2010 2012 2014
Nu
mb
er o
f Ev
ents
Unsafe Condition Near Miss
Patient Event No Harm Patient Event Harm
Source Institute of Safe Medication Practices on behalf of the Pennsylvania Patient Safety Authority 2006-2014
Note Pennsylvania Patient Safety Reporting System reports of medication errors are from acute-level facilities that consist of hospitals
ambulatory surgical facilities birthing centers and abortion facilities Medication errors do not include adverse drug reac tions Eventharm
categories refer to those in the Agency for Healthcare Research and Quality Common Formats Unsafe condition is defined as any
circumstance that increases the probability of a patient safety event A near miss is defined as a patient safety event that did not reach the
patient Deaths are included in the total but not shown on the chart because there were too few to render graphically
192 166 336530 662
2287 24842385
2364 1955
16271461 1272
1208
1055
0
500
1000
1500
2000
2500
3000
3500
4000
4500
2006 2008 2010 2012 2014
Nu
mb
er o
f Ev
ents
lt18 18-64 65+
Importance Acute malignant andmdashincreasinglymdashchronic pain often is treated or managed
with prescription opioids Reducing patient harm from the use of opioids in both inpatient
and outpatient settings is a main area of focus because opioid-related adverse drug events are
often preventable
Trends
In Pennsylvania the total number of medication error reports related to opioids decreased
106 between 2006 (4106) and 2014 (3672)
Between 24 and 54 opioid-related medication errors resulting in patient harm or death
were reported from 2006 through 2014 accounting for approximately 1 of all reported
opioid medication errors each year
The largest share of opioid-related medication errors reported each year in Pennsylvania
related to those that reached the patient but did not result in harm Of these no-harm
events reaching the patient about one in four required monitoring andor intervention to
preclude the harm
National Healthcare Quality and Disparities Report | 19
Patient Safety
20 | National Healthcare Quality and Disparities Report
Although small in number reports of unsafe conditions increased from 43 (175) of
total opioid-related medication error reports in 2006 to 9 (330) in 2014 Reports of
unsafe conditions and near misses can provide important learning opportunities for
preventing patient harm
Differences Between Groups Reports of opioid-related medication errors involving
pediatric patients increased nearly fourfold from 192 (47) in 2006 to 662 (18) in 2014
During the same period reports of opioid-related medication errors involving older adult
patients decreased from nearly 40 of the total to less than 30
Patient Safety in the Nursing Home Setting
More than 3 million people receive care in US nursing homes and skilled nursing facilities
each year (CDC 2015)
For nursing home residents optimal care seeks to maximize quality of life and minimize
unintended complications
Measures tracked for patients of various age ranges include
Nursing home residents with urinary tract infections
Nursing home residents experiencing use of restraints
Nursing home residents who have pressure ulcers
Nursing home residents who had a fall with major injury
Nursing home residents who received antipsychotic medication
Urinary Tract Infections
Long-stay nursing home residents experiencing urinary tract infections by sex and raceethnicity 2011-2013
Source Centers for Medicare amp Medicaid Services Minimum Data Set 2011-2013
DenominatorNursing home residents of any age w ho have at least 101 cumulative days in the facility
Note For this measure low er percentages are better The measure w as calculated as follows Percentage of long-stay residents with a urinary
tract infection w ithin the 30 days prior to assessment White Black and Asian are non-Hispanic Hispanic includes all races
0
2
4
6
8
10
2011 2012 2013
Pe
rce
nt
Total Male Female
2011 Achievable
Benchmark 61
0
2
4
6
8
10
2011 2012 2013
Pe
rce
nt
White Black Asian Hispanic
2011 Achievable
Benchmark 61
Long-stay nursing home residents experiencing urinary tract infections by sex and raceethnicity 2011-2013
Source Centers for Medicare amp Medicaid Services Minimum Data Set 2011-2013
DenominatorNursing home residents of any age w ho have at least 101 cumulative days in the facilityNote For this measure low er percentages are better The measure w as calculated as follows Percentage of long-stay residents with a urinary
tract infection w ithin the 30 days prior to assessment White Black and Asian are non-Hispanic Hispanic includes all races
0
2
4
6
8
10
2011 2012 2013
Pe
rce
nt
Total Male Female
2011 Achievable
Benchmark 61
0
2
4
6
8
10
2011 2012 2013
Pe
rce
nt
White Black Asian Hispanic
2011 Achievable
Benchmark 61
Patient Safety
Importance Bacteria that cause urinary tract infections (UTIs) can spread to other body
parts and become more serious or contribute to further complications such as delirium
Overall Percentage In 2013 the percentage of long-stay nursing home residents with a UTI
was 64
Groups With Disparities
In 2013 compared with males (51) the percentage with UTIs was worse for females
(7)
In 2013 compared with White residents (68) the percentage of residents with UTIs
was lower for Blacks and Asians (47) as well as Hispanics (54)
Achievable Benchmark
In 2011 the top 5 State achievable benchmark for UTIs was 61 The States that
contributed to the achievable benchmark are Connecticut Hawaii Minnesota North
Dakota and Pennsylvania
Males Blacks Asians and Hispanics have achieved the benchmark
Use of Restraints
00
05
10
15
20
25
30
35
40
2011 2012 2013
Pe
rce
nt
White Black Asian Hispanic
00
05
10
15
20
25
30
35
40
2011 2012 2013
Pe
rce
nt
Total 0-64 65-74 75-84 85+
2011 Achievable
Benchmark 07
Long-stay nursing home residents experiencing use of restraints by age and raceethnicity 2011-2013
Source Centers for Medicare amp Medicaid Services Minimum Data Set 2011-2013
Denominator Nursing home residents of any age who have at least 101 cumulative days in the facility
Note For this measure lower percentages are better The measure was calculated as follows Percentage of long-stay residents who are
physically restrained on a daily basis
2011 Achievable
Benchmark 07
00
05
10
15
20
25
30
35
40
2011 2012 2013
Pe
rce
nt
White Black Asian Hispanic
00
05
10
15
20
25
30
35
40
2011 2012 2013
Pe
rce
nt
Total 0-64 65-74 75-84 85+
2011 Achievable
Benchmark 07
Long-stay nursing home residents experiencing use of restraints by age and raceethnicity 2011-2013
Source Centers for Medicare amp Medicaid Services Minimum Data Set 2011-2013
Denominator Nursing home residents of any age who have at least 101 cumulative days in the facility
Note For this measure lower percentages are better The measure was calculated as follows Percentage of long-stay residents who are
physically restrained on a daily basis
2011 Achievable
Benchmark 07
National Healthcare Quality and Disparities Report | 21
Patient Safety
Importance Residents who are restrained daily can become weak lose their ability to go to
the bathroom by themselves and develop pressure ulcers or other medical conditions
Overall Percentage In 2013 the percentage of long-stay nursing home residents who were
physically restrained on a daily basis was 14
Groups With Disparities
In 2011 2012 and 2013 the percentage of residents with restraint use on a daily basis
was lower for those ages 65-74 years compared with those under age 65 In 2013 the
percentage of residents ages 65-74 years experiencing use of restraints was 12
compared with 16 for residents younger than 65
In 2013 compared with Whites (14) Asians (2) and Hispanics (18) had worse
percentages of daily restraint use and Blacks (12) had a better percentage of daily
restraint use
Achievable Benchmark
In 2011 the top 5 State achievable benchmark for restraint use was 07 The States that
contributed to the achievable benchmark are Kansas Maine Nebraska New Hampshire
and Vermont
No group achieved the benchmark from 2011 to 2013
Pressure Ulcers
Low-risk short-stay and high-risk long-stay nursing home residents who have pressure ulcers by sex 2011-2013
Source Centers for Medicare amp Medicaid Services Minimum Data Set 2011-2013
Denominator Low-risk short-stay Nursing home residents of any age who have 100 or fewer cumulative days in the facility and are active can
change positions and are getting the nutrients they need to maintain good skin health High-risk long-stay Nursing home residents of any age
who have at least 101 cumulative days in the facility and are in a coma do not get the nutrients needed to maintain good skin health or cannot
change position on their own
Note For this measure lower percentages are better
0
2
4
6
8
10
12
2011 2012 2013
Pe
rce
nt
Low-Risk Short StayTotal Male Female
2011 Achievable Benchmark10
0
2
4
6
8
10
12
2011 2012 2013
Pe
rce
nt
High-Risk Long StayTotal Male Female
2008 Achievable Benchmark 71
Low-risk short-stay and high-risk long-stay nursing home residents who have pressure ulcers by sex 2011-2013
Source Centers for Medicare amp Medicaid Services Minimum Data Set 2011-2013
Denominator Low-risk short-stay Nursing home residents of any age who have 100 or fewer cumulative days in the facility and are active can
change positions and are getting the nutrients they need to maintain good skin health High-risk long-stay Nursing home residents of any age
who have at least 101 cumulative days in the facility and are in a coma do not get the nutrients needed to maintain good skin health or cannot
change position on their own
Note For this measure lower percentages are better
0
2
4
6
8
10
12
2011 2012 2013
Pe
rce
nt
Low-Risk Short StayTotal Male Female
2011 Achievable Benchmark10
0
2
4
6
8
10
12
2011 2012 2013
Pe
rce
nt
High-Risk Long StayTotal Male Female
2008 Achievable Benchmark 71
22 | National Healthcare Quality and Disparities Report
Patient Safety
Importance Pressure ulcers are serious medical conditions They typically result from
prolonged periods of uninterrupted pressure on the skin soft tissue muscle and bone
Vulnerable patients include older adults stroke and diabetic patients patients with dementia
circulatory diseases dehydration and malnutrition and people who use wheelchairs or are
bedriddenmdashthat is any patient with impaired mobility or sensation
Overall Percentage In 2013 the percentage of low-risk short-stay residents with pressure
ulcers was 13 and the percentage of high-risk long-stay residents with pressure ulcers was
77
Groups with Disparities
As in 2011 and 2012 male low-risk short-stay nursing home residents had a worse
percentage with pressure ulcers (15) compared with female residents (12) in 2013
As in 2011 and 2012 male high-risk long-stay nursing home residents had a worse
percentage with pressure ulcers (94) compared with female residents (70) in 2013
Achievable Benchmark
The 2011 top 5 State achievable benchmark for low-risk short-stay nursing home residents was 10 The States that contributed to the benchmark were Alabama Arizona Colorado Connecticut and Idaho
The 2008 top 5 State achievable benchmark for high-risk long-stay nursing home residents was 71 The States that contributed to the benchmark were Hawaii Minnesota Nebraska New Hampshire and North Dakota
No low-risk short-stay residents achieved the benchmark from 2011 to 2013 Among
high-risk long-stay residents only females achieved the benchmark by 2013
National Healthcare Quality and Disparities Report | 23
Patient Safety
Falls
00
05
10
15
20
25
30
35
40
45
50
Pe
rce
nt
2012 2013
Long-stay nursing home residents who had a fall with major injury by sex age and raceethnicity 2012-2013
Source Centers for Medicare amp Medicaid Services Minimum Data Set 2012-2013
Denominator Nursing home residents of any age who have at least 101 cumulative days in the facility with one or more look-back scan
assessments except when the occurrence of falls or number of falls with major injury was not assessed in the look-back scan assessment
Note For this measure lower percentages are better White Black and Other are non-Hispanic Hispanic includes all races
2012 Achievable
Benchmark 22
00
05
10
15
20
25
30
35
40
45
50
Pe
rce
nt
2012 2013
Long-stay nursing home residents who had a fall with major injury by sex age and raceethnicity 2012-2013
Source Centers for Medicare amp Medicaid Services Minimum Data Set 2012-2013
Denominator Nursing home residents of any age who have at least 101 cumulative days in the facility with one or more look-back scan
assessments except when the occurrence of falls or number of falls with major injury was not assessed in the look-back scan assessment
Note For this measure lower percentages are better White Black and Other are non-Hispanic Hispanic includes all races
2012 Achievable
Benchmark 22
Importance Nursing home residents who experience falls resulting in major injuries are at
higher risk of death and disability as well as emotional trauma that can affect functional
abilities and social well-being
Overall Percentage In 2013 the percentage of long-stay nursing home residents who had a
fall with a major injury was 34
Groups With Disparities
In 2013 female nursing home residents had a worse percentage of falls (38) compared
with male residents (25)
In 2013 the percentage of falls with major injury was worse for all subgroups of
residents age 65 years and over compared with their younger counterparts The
percentage for residents under 65 years old was 17 compared with 26 for ages 65shy
74 years 34 for ages 75-84 years and 41 for 85 years and over
Also in 2013 compared with Whites (38) the percentage of falls with major injury
was better for Black (13) Other (22) and Hispanic (24) residents
24 | National Healthcare Quality and Disparities Report
Patient Safety
National Healthcare Quality and Disparities Report | 25
Achievable Benchmark
The 2012 top 5 State achievable benchmark for falls with major injury was 22 The
States that contributed to the achievable benchmark are Alaska California District of
Columbia Hawaii and New Jersey The benchmark was achieved by Black residents and those ages 0-64 years
Antipsychotic Medication Among Nursing Home Residents
Importance The high use of antipsychotic medications among nursing home residents for
indications other than those for which the drug was approved has been noted by the Federal
Government These drugs are often used for too long at too high a dose or when
unnecessary In the past inappropriate prescribing of antipsychotics in nursing homes has
primarily been considered a marker of suboptimal care Recent studies have shown
antipsychotic use is also a drug safety issue (Huybrechts et al 2012) Antipsychotic
medication use is associated with increased risks of adverse events such as movement
disorders falls hip fractures and cerebrovascular events Their use in older adults with
dementia carries an increased risk of death Safety concerns with antipsychotic medication
use in older adults also include the risks of hyperprolactinemia pneumonia
0
5
10
15
20
25
30
Percent
2012 2013
Adult long-stay nursing home residents who received antipsychotic medication by raceethnicity and number of chronic conditions 2012-2013
Key NHOPI = Native Hawaiian or Other Pacific Islander AIAN = American Indian or Alaska Native
Source Centers for Medicare amp Medicaid Services Minimum Data Set 2012-2013
Denominator Nursing home residents of any age who have at least 101 cumulative days in the facility excluding residents with schizophrenia
Tourettersquos syndrome and Huntingtonrsquos disease
Numerator Subset of denominator that receives an antipsychotic medication
Note For this measure lower percentages are better
2012 Achievable
Benchmark 150
0
5
10
15
20
25
30
Percent
2012 2013
Adult long-stay nursing home residents who received antipsychotic medication by raceethnicity and number of chronic conditions 2012-2013
Key NHOPI = Native Hawaiian or Other Pacific Islander AIAN = American Indian or Alaska Native
Source Centers for Medicare amp Medicaid Services Minimum Data Set 2012-2013
Denominator Nursing home residents of any age who have at least 101 cumulative days in the facility excluding residents with schizophrenia
Tourettersquos syndrome and Huntingtonrsquos disease
Numerator Subset of denominator that receives an antipsychotic medication
Note For this measure lower percentages are better
2012 Achievable
Benchmark 150
Patient Safety
26 | National Healthcare Quality and Disparities Report
thromboembolism cerebrovascular events and other cardiovascular adverse events (Chiu et
al 2015)
Overall Percentage The percentage of long-stay nursing home residents who had
antipsychotic medications was 176 in 2013
Groups With Disparities
In 2013 the percentage of residents receiving antipsychotic medication was higher for
Hispanic residents (201) than for White residents (180)
In 2012 and 2013 the percentage of long-stay residents who received antipsychotic
medications was worse for residents with one or more chronic conditions than for
residents with no chronic conditions
Achievable Benchmark
The 2012 top 6 State achievable benchmark was 150 The States that contributed to the
achievable benchmark are Alaska California Hawaii Michigan New Jersey and
Wyoming Asians NHOPIs residents with no chronic conditions and residents with one chronic
condition achieved the benchmark
Antipsychotic Medication Among Nursing Home Residents by State
Long-stay nursing home residents who received antipsychotic medication by State 2013
Source Centers for Medicare amp Medicaid Services Minimum Data Set 2013
Denominator Nursing home residents of any age who have at least 101 cumulative days in the facility
Note For this measure lower percentages are better
AZ
CA
UT
CT
FL
GA
IA
IL
KS
MA
MDMO
NJ
NY
OR
PA
SC
TN
CO
WA
WI
VA
ME
MN
MI
NC
TX
KY
WV
RI
NE
VT
NV OH
SD
AR
IN
NH
MT
ID
WY
ND
NMOK
LA
MS AL
DE
AKAK
HI
DC
85-153 (1st Quartile)
154-173 (2nd Quartile)
No Data
174-192 (3rd Quartile)
PR193-234 (4th Quartile)
Long-stay nursing home residents who received antipsychotic medication by State 2013
Source Centers for Medicare amp Medicaid Services Minimum Data Set 2013
Denominator Nursing home residents of any age who have at least 101 cumulative days in the facility
Note For this measure lower percentages are better
AZ
CA
UT
CT
FL
GA
IA
IL
KS
MA
MDMO
NJ
NY
OR
PA
SC
TN
CO
WA
WI
VA
ME
MN
MI
NC
TX
KY
WV
RI
NE
VT
NV OH
SD
AR
IN
NH
MT
ID
WY
ND
NMOK
LA
MS AL
DE
AKAK
HI
DC
85-153 (1st Quartile)
154-173 (2nd Quartile)
No Data
174-192 (3rd Quartile)
PR193-234 (4th Quartile)
Patient Safety
Overall This map shows overall rankings of States (by quartiles) in the percentage of long-
stay nursing home residents who received antipsychotic medication in 2013 Values ranged
from 85 to 234
Differences by State Interquartile ranges follow
First quartile (lowest) 85-153 (AK CA DC DE HI MD MI MN NJ NC SC
WI WV)
Second quartile (second lowest) 153 -173 (CO ID MT NM NY ND OR PA
RI SD VT WA WY)
Third quartile (second highest) 174-192 (AZ CT GA IN IA KS ME MA MO
NV OH OK VA)
Fourth quartile (highest) 193-234 (AL AR FL IL KY LA MS NE NH TN
TX UT)
Eight of the 12 States in the quartile with the highest percentage of long-stay nursing
home residents who received antipsychotic medication were in the South
Patient Safety in the Home Health Setting
Home health agencies provide services to beneficiaries who are homebound and need skilled
nursing care or therapy
Approximately 12 million individuals receive home health care from more than 33000
providers for causes including acute illness long-term health conditions permanent
disability or terminal illness (NAHCH 2010)
Improvements among home health patients can reflect the quality of care from home health
agencies
Measures include
Home health patients with improvement in surgical wounds
Home health patients with improvements in their ability to take medications orally
National Healthcare Quality and Disparities Report | 27
Patient Safety
Improvement in Surgical Wounds
75
80
85
90
95
100
2010 2011 2012 2013
Pe
rce
nt
White Black Asian Hispanic
75
80
85
90
95
100
2010 2011 2012 2013
Pe
rce
nt
Total 0-64 65-74
75-84 85+
2011 Achievable
Benchmark 913
Home health patients with improvement in surgical wounds by age and raceethnicity 2010-2013
Source Centers for Medicare amp Medicaid Services Outcome and Assessment Information Set 2010-2013
Denominator Number of home health episodes during the measurement period in which the patient of any age had a surgical wound and the
episode ended with the patient discharged from home health care
Note White Black and Asian are non-Hispanic Hispanic includes all races
2011 Achievable
Benchmark 913
75
80
85
90
95
100
2010 2011 2012 2013
Per
cen
t
White Black Asian Hispanic
75
80
85
90
95
100
2010 2011 2012 2013
Per
cen
t
Total 0-64 65-74
75-84 85+
2011 Achievable
Benchmark 913
Home health patients with improvement in surgical wounds by age and raceethnicity 2010-2013
Source Centers for Medicare amp Medicaid Services Outcome and Assessment Information Set 2010-2013
Denominator Number of home health episodes during the measurement period in which the patient of any age had a surgical wound and the
episode ended with the patient discharged from home health care
Note White Black and Asian are non-Hispanic Hispanic includes all races
2011 Achievable
Benchmark 913
Importance Normal wound healing after an operation is an important marker of good care
The home health team should regularly change wound dressing and teach the patient about
wound care
Overall Percentage In 2013 the percentage of home health patients with improvement in
their surgical wounds was 890
Trends The percentage of health home patients with surgical wound improvement increased
between 2010 and 2013
Groups With Disparities
In 2013 compared with residents under age 65 years (856) all other age groups had
better percentages of improvement in surgical wounds The percentage was 893 for
ages 65-74 905 for ages 75-84 and 917 for ages 85 and over
In 2013 compared with Whites (893) Blacks (878) Asians (882) and Hispanics
(874) had worse percentages of improvement in surgical wounds
The 2010 through 2013 trend in the percent of home health patients with surgical wound
improvement did not change for those over age 65 relative to persons under age 65 years
28 | National Healthcare Quality and Disparities Report
Patient Safety
Achievable Benchmark
The 2011 top 5 State achievable benchmark was 913 The States that contributed to the
benchmark are Alabama Mississippi Nevada Oklahoma and South Carolina
Home health patients age 85 years and over achieved the benchmark for surgical wound
improvement in 2013
At the current rate of progress patients ages 75-84 years could reach the benchmark
within a year Patients ages 65-74 years could achieve the benchmark in approximately 2
years
White home health patients could achieve the benchmark in approximately 2 years
Improvement in Ability To Take Medication Orally
0
20
40
60
80
100
2010 2011 2012 2013
Per
cen
t
White Black Asian Hispanic
0
20
40
60
80
100
2010 2011 2012 2013
Per
cen
t
Total 0-64 65-74
75-84 85+
2008 Achievable
Benchmark 516
Home health patients with improvement in their ability to take medications orally by age and raceethnicity 2010-2013
Source Centers for Medicare amp Medicaid Services Outcome and Assessment Information Set 2010-2013
Denominator Number of home health care episodes in which a patient of any age was unable to take oral medications independently at the
start of the episode that ended during the measurement period
Note White Black and Asian are non-Hispanic Hispanic includes all races
2008 Achievable
Benchmark 516
0
20
40
60
80
100
2010 2011 2012 2013
Per
cen
t
White Black Asian Hispanic
0
20
40
60
80
100
2010 2011 2012 2013
Per
cen
t
Total 0-64 65-74
75-84 85+
2008 Achievable
Benchmark 516
Home health patients with improvement in their ability to take medications orally by age and raceethnicity 2010-2013
Source Centers for Medicare amp Medicaid Services Outcome and Assessment Information Set 2010-2013
Denominator Number of home health care episodes in which a patient of any age was unable to take oral medications independently at the
start of the episode that ended during the measurement period
Note White Black and Asian are non-Hispanic Hispanic includes all races
2008 Achievable
Benchmark 516
Importance Taking medications correctly is important to the health status and quality of life
of individuals living in the community The home health team can help teach a patient ways
to organize drugs and take them properly
Overall Percentage In 2013 the percentage of home health patients with improvement in
their ability to take medications orally was 513
Trends Between 2010 and 2013 there was improvement in the overall percentage of home
health patients with improved ability to take medications orally
National Healthcare Quality and Disparities Report | 29
Patient Safety
Groups With Disparities
In 2013 the percentage of home health patients with improvement in their ability to take
medications orally was worse for those age 85 years and over (398) compared with
those under age 65 years (577)
The percentage of patients with improvement in their ability to take medications orally
was worse among Hispanic home health patients (400) than among White patients
(526) in 2013
From 2010 to 2013 the gap between Blacks and Whites decreased and the gap between
Asians and Whites and Hispanics and Whites increased
Achievable Benchmark
The 2008 top 5 State achievable benchmark was 516 The States that contributed to the
achievable benchmark are Iowa Massachusetts New Jersey North Dakota and South
Carolina
The benchmark was achieved among age groups under 85 years and by White and Black
home health patients
The total population is estimated to reach the benchmark in less than a year Hispanic
patients and patients age 85 years and over are farthest from the benchmark
Improvement in Ability To Take Medication Orally by State
Home health patients with improvement in their ability to take medications orally by raceethnicity by State 2013
Source Centers for Medicare amp Medicaid Services Outcome and Assessment Information Set 2013
Denominator Number of home health care episodes in which a patient of any age was unable to take oral medications independently at the
start of the episode that ended during the measurement period
AZ
CA
UT
CT
FL
GA
IA
IL
KS
MA
MDMO
NJ
NY
OR
PA
SC
TN
CO
WA
WI
VA
ME
MN
MI
NC
TX
KY
WV
RI
NE
VT
NV OH
SD
AR
IN
NH
MT
ID
WY
ND
NMOK
LA
MS AL
DE
AKAK
HI
No significant difference between rates
of Hispanics and non-Hispanic Whites
Non-Hispanic Whites have significantly
worse rate than Hispanics
States do not have data that meet the
criteria for statistical reliability data
quality or confidentiality
Hispanics have significantly worse rate
than non-Hispanic Whites
DC
Home health patients with improvement in their ability to take medications orally by raceethnicity by State 2013
Source Centers for Medicare amp Medicaid Services Outcome and Assessment Information Set 2013
Denominator Number of home health care episodes in which a patient of any age was unable to take oral medications independently at the
start of the episode that ended during the measurement period
AZ
CA
UT
CT
FL
GA
IA
IL
KS
MA
MDMO
NJ
NY
OR
PA
SC
TN
CO
WA
WI
VA
ME
MN
MI
NC
TX
KY
WV
RI
NE
VT
NV OH
SD
AR
IN
NH
MT
ID
WY
ND
NMOK
LA
MS AL
DE
AKAK
HI
No significant difference between rates
of Hispanics and non-Hispanic Whites
Non-Hispanic Whites have significantly
worse rate than Hispanics
States do not have data that meet the
criteria for statistical reliability data
quality or confidentiality
Hispanics have significantly worse rate
than non-Hispanic Whites
DC
30 | National Healthcare Quality and Disparities Report
Patient Safety
Geographic Variation
In 2013 Hispanic home health patients had worse rates of improvement in taking oral
medications than non-Hispanic White patients in 11 States (Arizona California
Connecticut Florida Illinois Indiana Massachusetts Nevada New York North
Carolina and Texas
Non-Hispanic White patients had worse rates of improvement than Hispanic patients in
five States (Hawaii Idaho Iowa Michigan and Pennsylvania)
Patient Safety in the Ambulatory Setting
Although patient safety initiatives frequently focus on inpatient hospital events adverse
effects of medical care may be identified and treated in outpatient settings
Adverse effects of medical care can follow care or procedures in hospitals emergency
departments physician offices or other settings
Measures include
Patient safety and quality issues by frequency of occurrence in outpatient medical offices
Adults age 65 years and over who received potentially inappropriate prescription medications during the calendar year
Percentage of hemodialysis patients with vascular catheter in use for 90 days or longer
For more information see the PSNet link to Patient Safety Primer Patient Safety in
Ambulatory Care httpspsnetahrqgovprimersprimer16patient-safety-in-ambulatory-care
National Healthcare Quality and Disparities Report | 31
Patient Safety
Patient Safety and Quality Issues
Patient safety and quality issues by frequency of occurrence in outpatient medical offices 2014
Source Westat analysis of the AHRQ 2014 Medical Office Survey on Patient Safety Culture Comparative Database (N=935)
Note For this measure less frequent occurrences during the year are better
0
20
40
60
80
100
A pharmacy contactedour office to clarify orcorrect a prescription
A patient was unableto get an appointmentwithin 48 hours for anacuteserious problem
A patients medicationlist was not updatedduring his or her visit
The results from a labor imaging test were notavailable when needed
A patients chartmedicalrecord was not available
when needed
Occurred DailyWeekly
Occurred Monthly
Occurred Not at All to Several Times Over the Past Year
Patient safety and quality issues by frequency of occurrence in outpatient medical offices 2014
Source Westat analysis of the AHRQ 2014 Medical Office Survey on Patient Safety Culture Comparative Database (N=935)
Note For this measure less frequent occurrences during the year are better
0
20
40
60
80
100
A pharmacy contactedour office to clarify orcorrect a prescription
A patient was unableto get an appointmentwithin 48 hours for anacuteserious problem
A patients medicationlist was not updatedduring his or her visit
The results from a labor imaging test were notavailable when needed
A patients chartmedicalrecord was not available
when needed
Occurred DailyWeekly
Occurred Monthly
Occurred Not at All to Several Times Over the Past Year
Importance Most health care takes place in the outpatient or ambulatory care setting Lack
of access to care and lack of access to timely and accurate medical information and test
results may contribute to patient safety events such as missed or delayed diagnoses
medication errors failure to order appropriate diagnostic or laboratory tests incorrect
interpretation of tests and inadequate followup on results
Overall Percentage
Almost 30 of medical offices participating in the survey reported daily or weekly
occurrences of being contacted by the pharmacist for clarification or correction on a
prescription
After prescription clarifications or corrections by the pharmacy medical offices were
next most likely to report daily or weekly issues with patients being unable to get an
appointment within 48 hours for an acute or serious problem (14) or the patientrsquos
medication list not getting updated during their visit (11)
The share of medical offices reporting that lab or imaging tests were not available when
needed reached nearly 20 when considering monthly occurrences as well as those that
occurred more frequently
32 | National Healthcare Quality and Disparities Report
Patient Safety
Potentially Inappropriate Prescriptions for Older Adults
Adults age 65 years and over who received potentially inappropriate prescription medications during the calendar year by sex and
perceived health status 2003ndash2013
Source Agency for Healthcare Research and Quality Medical Expenditure Panel Survey 2003-2013
Note For this measure lower percentages are better Prescription medications received include all prescribed medications initiall y purchased
or otherwise obtained as well as any refills For more information on inappropriate medications see the American Geriatrics Society 2012 Beers
Criteria Update Expert Panel American Geriatrics Society updated Beers Criteria for potentially inappropriate medication use in older adults J
Am Geriatr Soc 2012 Apr60(4)616-31
0
5
10
15
20
25
30
Per
cen
t
Total Male Female
0
5
10
15
20
25
30
Per
cen
t
ExcellentVery GoodGood FairPoor
Adults age 65 years and over who received potentially inappropriate prescription medications during the calendar year by sex and
perceived health status 2003ndash2013
Source Agency for Healthcare Research and Quality Medical Expenditure Panel Survey 2003-2013
Note For this measure lower percentages are better Prescription medications received include all prescribed medications initially purchased
or otherwise obtained as well as any refills For more information on inappropriate medications see the American Geriatrics Society 2012 Beers
Criteria Update Expert Panel American Geriatrics Society updated Beers Criteria for potentially inappropriate medication use in older adults J
Am Geriatr Soc 2012 Apr60(4)616-31
0
5
10
15
20
25
30
Per
cen
t
Total Male Female
0
5
10
15
20
25
30
Per
cen
t
ExcellentVery GoodGood FairPoor
Importance Some drugs that are prescribed for older patients are known to be potentially
harmful for this age group
Overall Percentage In 2013 the percentage of adults age 65 years and over who received
potentially inappropriate prescription medications was 114
Trends From 2003 to 2013 the percentage of adults age 65 years and over who received
potentially inappropriate prescription medications improved overall for both sexes and for
people with excellentvery goodgood health status and people with fairpoor health status
Groups With Disparities
In all years the percentage of patients receiving potentially inappropriate medications
was higher among females compared with males This gap was not changing over time
In all years from 2003 to 2013 the percentage of patients receiving potentially
inappropriate medications was higher among people with fairpoor health status
compared with people with excellentgood health status This gap was not changing over
time
National Healthcare Quality and Disparities Report | 33
Patient Safety
Long-Term Catheter Use in Dialysis Patients
HI
AKAK
AZ
CA
UT
CT
FL
GA
IA
IL
KS
MA
MDMO
NJ
NY
OR
PA
SC
TN
CO
WA
WI
VA
ME
MN
MI
NC
TX
KY
WV
RI
NE
VT
NV OH
SD
AR
IN
NH
MT
ID
WY
ND
NMOK
LA
MSAL
DE
DC
10-12
13-18
7-9
PR
Source Centers for Medicare and Medicaid Services Dialysis Facility Compare 2014
Denominator At-risk adult Medicare patients with a central venous catheter who were receiving regular hemodialysis treatments at dialysis
facilities
Note For this measure lower percentages are better
Percentage of hemodialysis patients with central venous catheters used for vascular access for 90 days or longer by State 2014
HI
AKAK
AZ
CA
UT
CT
FL
GA
IA
IL
KS
MA
MDMO
NJ
NY
OR
PA
SC
TN
CO
WA
WI
VA
ME
MN
MI
NC
TX
KY
WV
RI
NE
VT
NV OH
SD
AR
IN
NH
MT
ID
WY
ND
NMOK
LA
MSAL
DE
DC
10-12
13-18
7-9
PR
Source Centers for Medicare and Medicaid Services Dialysis Facility Compare 2014
Denominator At-risk adult Medicare patients with a central venous catheter who were receiving regular hemodialysis treatments at dialysis
facilities
Note For this measure lower percentages are better
Percentage of hemodialysis patients with central venous catheters used for vascular access for 90 days or longer by State 2014
Importance Central venous catheters are frequently used for vascular access to dialysis
patients until a fistula or graft is formed Central venous catheters have higher rates of
infection and adverse events among patients receiving dialysis treatment compared with
other forms of vascular access To decrease the likelihood of adverse events catheters should
be used for less than 90 days
Overall Percentage Nationally an average of 10 of dialysis patients used central venous
catheters for 90 days or longer in 2014
Geographic Variation In 2014 Alabama and Kansas had the lowest percentages of dialysis
patients using central venous catheters for 90 days or longer (7) and Puerto Rico had the
highest percentage (18) of long-term catheter use
Patient Safety Infrastructure
Efforts to improve patient safety have been accompanied by various infrastructure
enhancements
Growth in patient safety organizations which assist providers in detecting and reducing
risks and hazards from care delivery that may lead to patient harm
System improvement initiatives at the Veterans Health Administration (VHA)
34 | National Healthcare Quality and Disparities Report
Patient Safety
Development of the National Practitioner Data Bank a clearinghouse for information on
medical malpractice payments
Patient Safety Organizations
Patient safety organizations (PSOs) aim to reduce preventable adverse events near misses
and unsafe conditions in all health care settings
PSOs provide an environment for health care providers to voluntarily report discuss and
learn from patient safety events and quality analyses on a privileged and confidential basis
Measures include
Number of PSOs serving each State
Variation in concentrations of compounded liquid medications for children
Patient Safety Organizations AHRQ Common Formats
AHRQ Common Formats provide a standardized method for PSOs health care providers
and other organizations to collect and report patient safety events
Data element standards are important for aggregating and analyzing events across
providers
AHRQ Common Formats have been developed for a variety of settings of care
Acute care hospitals
Skilled nursing facilities
Retail pharmacy
More information is available at httpspsoahrqgovcommon
National Healthcare Quality and Disparities Report | 35
Patient Safety
Number of Patient Safety Organizations
AZ (2)
CA (3)
UT (2)
CT(3)
FL (8)
GA (5)
IA (4)
IL (7)
KS (5)
MA(3)
MD (4)MO(2)
NJ(3)
NY (5)
OR (3)
PA (5)
SC (4)
TN (5)
CO (2)
WA (2)
WI (5)
VA (7)
ME(2)
MN(3)
MI (3)
NC (7)
TX (6)
KY (4)WV (3)
RI(2)
NE (2)
VT(2)
NV (2)
OH (2)
SD (1)
AR (4)
IN (2)
NH(2)
MT (2)
ID (3)
WY (2)
ND (1)
NM (3)OK (2)
LA (1)
MS (2)
AL (2)
DE(2)
HI (2)
AKAK (2)
DC(3)
PR (0)
1-2
3-4
5-6
7-8
Number of PSOs
excluding PSOs
operating nationally
Number of Patient Safety Organizations by area served 2014
Source Agency for Healthcare Research and Quality Patient Safety Organization Information Form Calendar Year 2014 and PSO-PPC
Contact Database
Note PSOs included in this map were AHRQ-listed during any part of 2014 and submitted the PSO Profile to the PSO Privacy Protection
Center (PSO-PPC) in early 2015 A PSO may have members in one or more States regardless of headquarters location Each State shows the
number of PSOs that serve that State map excludes 38 PSOs that are available to providers in all States
AZ (2)
CA (3)
UT (2)
CT(3)
FL (8)
GA (5)
IA (4)
IL (7)
KS (5)
MA(3)
MD (4)MO(2)
NJ(3)
NY (5)
OR (3)
PA (5)
SC (4)
TN (5)
CO (2)
WA (2)
WI (5)
VA (7)
ME(2)
MN(3)
MI (3)
NC (7)
TX (6)
KY (4)WV (3)
RI(2)
NE (2)
VT(2)
NV (2)
OH (2)
SD (1)
AR (4)
IN (2)
NH(2)
MT (2)
ID (3)
WY (2)
ND (1)
NM (3)OK (2)
LA (1)
MS (2)
AL (2)
DE(2)
HI (2)
AKAK (2)
DC(3)
PR (0)
1-2
3-4
5-6
7-8
Number of PSOs
excluding PSOs
operating nationally
Number of Patient Safety Organizations by area served 2014
Source Agency for Healthcare Research and Quality Patient Safety Organization Information Form Calendar Year 2014 and PSO-PPC
Contact Database
Note PSOs included in this map were AHRQ-listed during any part of 2014 and submitted the PSO Profile to the PSO Privacy Protection
Center (PSO-PPC) in early 2015 A PSO may have members in one or more States regardless of headquarters location Each State shows the
number of PSOs that serve that State map excludes 38 PSOs that are available to providers in all States
Importance All patient safety organizations (PSOs) have authority to operate in all 50
States and US territories but not all do In 2014 38 PSOs self-reported being available to
providers nationally PSOs not available nationally serve specific States
Geographic Variation
Nearly all States have at least 2 PSOs available to providers in their State in addition to
the 38 national PSOs that serve all States
Florida has the most PSOs available with 8 in addition to the 38 nationally available
PSOs The States with the largest number of PSOs available are generally on the East
Coast (eg North Carolina Virginia New York Pennsylvania Tennessee Georgia) or
have large populations (eg Texas Illinois)
North Dakota South Dakota and Louisiana are the only states with just one PSO serving
their State in addition to the 38 national PSOs
Puerto Rico is served by one national PSO only
36 | National Healthcare Quality and Disparities Report
Patient Safety
Compounded Liquid Medications for Children
Compounded liquid medications for children in Michigan 2012
Source Levy S Buckley B Safe Table Success The MI Pediatric Safety Collaboration Presentation presented at the 7th Annual
Meeting of Patient Safety Organizations (PSOs) Rockville MD 2015 April and Rood JM Engels MJ Ciarkowski SL et al Variability in
compounding of oral liquids for pediatric patients a patient safety concern J Am Pharm Assn 201454(4)383-9
Note Information represents 244 responses to online survey of approximately 2000 Michigan pharmacies conducted in June 2012 by
The University of Michigan College of Pharmacy in collaboration with the Michigan Pharmacists Association
0
10
20
30
40
50
1 2 3 4 5 6 7 8 9
Nu
mb
er o
f D
rugs
Number of Unique Concentrations
Number of Different Compounded Concentrations per Drug
0
10
20
30
40
50
No Harm No Harm ButMonitoring
TemporaryHarm
Pe
rce
nt
Compounding Errors by Related Harm and Pharmacy Setting
Inpatient Outpatient
Compounded liquid medications for children in Michigan 2012
Source Levy S Buckley B Safe Table Success The MI Pediatric Safety Collaboration Presentation presented at the 7th Annual
Meeting of Patient Safety Organizations (PSOs) Rockville MD 2015 April and Rood JM Engels MJ Ciarkowski SL et al Variability in
compounding of oral liquids for pediatric patients a patient safety concern J Am Pharm Assn 201454(4)383-9
Note Information represents 244 responses to online survey of approximately 2000 Michigan pharmacies conducted in June 2012 by
The University of Michigan College of Pharmacy in collaboration with the Michigan Pharmacists Association
0
10
20
30
40
50
1 2 3 4 5 6 7 8 9
Nu
mb
er o
f D
rugs
Number of Unique Concentrations
Number of Different Compounded Concentrations per Drug
0
10
20
30
40
50
No Harm No Harm ButMonitoring
TemporaryHarm
Per
cen
t
Compounding Errors by Related Harm and Pharmacy Setting
Inpatient Outpatient
Importance
Liquid medications are widely used in pediatrics because many children find it difficult
to swallow tablets or capsules If not commercially manufactured these liquid
medications require a pharmacist to compound them to the correct dosage for the patient
This practice of compounding has led to a variety of medication concentrations in use In
the absence of standard concentrations for compounded medications there is a risk that
children may accidentally receive medications that are too potent and can be dangerous
or are too weak to be effective
The Michigan Health amp Hospital Association Keystone Center Patient Safety
Organization hosts five Pediatric Safe Tables each year Safe Tables provided a
confidential and legally protected environment to discuss challenges and improvement
strategies regarding inconsistent medication concentrations for compounded oral liquids
without fear of punitive action against them
National Healthcare Quality and Disparities Report | 37
Patient Safety
Overall Percentage
More than half (527) of drugs identified in the 2012 survey had 3 or more unique
concentrations dispensed to children across Michigan For example Rifampin used to
treat bacterial infections was reported to have 8 different concentrations dispensed to
patients
Nearly one-third (313) of reported errors caused temporary harm or required additional
monitoring despite no harm
Standardization of Compounded Liquid Medications
Source Michigan Health amp Hospital Association Keystone Center Patient Safety Organization and University of Michigan College of Pharmacy
State-Wide Initiative to Standardize the Compounding of Oral Liquids in Pediatrics
Standardization of compounded liquid medications for children in Michigan 2011
Issue identificationbull Hospitals attending PSO Pediatrics Safe
Table raise compounded medication concentrations as a major safety issue
bull Small focus group determines extent of problem
bull Michigan pharmacies are surveyed about baseline concentrations
Develop Interventionbull PSO Quarterly Safe Tables are held to
discuss cases and practicesbull Team develops recommendations for
standard concentrationsbull Consensus is achieved for frequently
compounded pediatric medications 470 formulations for 147 drug entities are reduced to 104 concentrations for 100 drugs
Practice changebull Toolkit is createdbull Standards are disseminated to Michigan
prescribers and pharmacies bull Standards are disseminated to PSO
members and Safe Table participants
Source Michigan Health amp Hospital Association Keystone Center Patient Safety Organization and University of Michigan College of Pharmacy
State-Wide Initiative to Standardize the Compounding of Oral Liquids in Pediatrics
Standardization of compounded liquid medications for children in Michigan 2011
Issue identificationbull Hospitals attending PSO Pediatrics Safe
Table raise compounded medication concentrations as a major safety issue
bull Small focus group determines extent of problem
bull Michigan pharmacies are surveyed about baseline concentrations
Develop Interventionbull PSO Quarterly Safe Tables are held to
discuss cases and practicesbull Team develops recommendations for
standard concentrationsbull Consensus is achieved for frequently
compounded pediatric medications 470 formulations for 147 drug entities are reduced to 104 concentrations for 100 drugs
Practice changebull Toolkit is createdbull Standards are disseminated to Michigan
prescribers and pharmacies bull Standards are disseminated to PSO
members and Safe Table participants
The Role of PSO Safe Tables Based on adverse medication events discussed in the
Michigan Health amp Hospital Association (MHA) Keystone Center Patient Safety
Organization (PSO) Safe Tables in July 2011 the Michigan Pediatric Safety Collaboration
was developed to further assess the scope of the problem and formulate a solution
The Collaborative The Michigan Pediatric Safety Collaboration includes individuals from
the University of Michigan College of Pharmacy the Michigan Pharmacists Association
(MPA) the Food and Drug Administration (FDA) and the MHA Keystone PSO
38 | National Healthcare Quality and Disparities Report
Patient Safety
Practice Change
As a result of the standardization effort 470 unique formulations for 147 drug entities
were reduced to 104 different concentrations for 100 drugs
The Michigan Pediatric Safety Collaboration developed a multistep process to implement
standards for compounding medications The MPA surveyed pharmacies in Michigan to
better define the nature and scope of the problem The PSO continued to act as convener
The result was the creation and dissemination of statewide standards for 120 frequently
compounded pediatric medications
Veterans Health Administration
The National Center for Patient Safety is part of the Veterans Health Administration the
Nationrsquos largest integrated health care system
Patient safety-related system improvement initiatives include
The Daily Planreg
Purchasing for Safety Initiative
Patient Safety Improvement Initiative
Patient safety improvement initiative The Daily Planreg at Veterans Affairs Medical Centers 2009
Source King BJ Mills PD Fore A et al The Daily Planreg including patients for safetys sake Nurs Manage 201243(3)15-8
0
10
20
30
40
50
Identified atleast one
error
Identifiederror
of omission
Identifiederror
ofcommission
Nurses Who Identified Errors in Patient Treatment Plan by Type
0
10
20
30
40
50
Patient founddiscrepancy inplanned care
Family founddiscrepancy inplanned care
Nursing Stafffound
discrepancyin plannedtreatment
Respondents Who Identified Errors or Discrepancies Through The Daily Plan reg
Patient safety improvement initiative The Daily Planreg at Veterans Affairs Medical Centers 2009
Source King BJ Mills PD Fore A et al The Daily Planreg including patients for safetys sake Nurs Manage 201243(3)15-8
0
10
20
30
40
50
Identified atleast one
error
Identifiederror
of omission
Identifiederror
ofcommission
Nurses Who Identified Errors in Patient Treatment Plan by Type
0
10
20
30
40
50
Patient founddiscrepancy inplanned care
Family founddiscrepancy inplanned care
Nursing Stafffound
discrepancyin plannedtreatment
Respondents Who Identified Errors or Discrepancies Through The Daily Plan reg
National Healthcare Quality and Disparities Report | 39
Patient Safety
Importance The Daily Planreg
is a two-page printed summary that acts as a schedule for
patients and providers each day It shows the procedures laboratory tests and medications
scheduled for that day and lists essential health information such as patientrsquos name allergies
and current medications It can be tailored for a patientrsquos needs by extracting orders from the
electronic medical record (EMR) The Daily Planreg
is intended to facilitate patient and family
engagement throughout the course of care The Daily Planreg
shows promise for improving
patient safety Since 2009 the VA has implemented The Daily Planreg
in more than 65
hospitals both inpatient and outpatient care settings The Daily Planreg
is shared more than
75000 times a month and the VA plans to continue the spread of The Daily Planreg
at
additional sites in 2016
Findings
As part of a pilot test in 2009 a total of 198 patients and 85 nurses responded to a survey
across 10 facilities Nurses had an average of 34 patients per shift who received The
Daily Planreg Patients responded about their own experiences whereas nurses reported
about all of their patients who received The Daily Planreg
Nearly half (475) of patients reported finding a discrepancy in planned care through
The Daily Planreg In addition 30 of patients reported that their family members found a
discrepancy Although not every discrepancy will be a potential medical error having a
shared understanding of the plan of care decreases the risk of error
More than one in six nurses (176) identified a discrepancy in treatment among their
patients through The Daily Planreg Most of these nurses (153) found one or more errors
of omission and a smaller share (106) of nurses found one or more errors of
commission some found both
40 | National Healthcare Quality and Disparities Report
Patient Safety
Issues Related to Ventilators
Common use-issues related to ventilators at the Veterans Health Administration 2006-2014 (combined)
Source Veterans Health Administration National Center for Patient Safety data collected October 2006 to October 2014
Note Examples of equipment failures include ventilator shutdown and other ventilator problems Ventilator settings include setup problems and
incorrect settings Support activities include space utilities and supplies Transport includes accidental extubation other transportation issues
and vehicle-related issues Alarms include alarm settings and alarm connection Training includes unknown ventilator model and other training
concerns
0
20
40
60
80
100
120
140
160
EquipmentFailure
VentilatorSettings
SupportActivities
Transport Alarms Training
Nu
mb
er o
f R
epo
rts
Common use-issues related to ventilators at the Veterans Health Administration 2006-2014 (combined)
Source Veterans Health Administration National Center for Patient Safety data collected October 2006 to October 2014
Note Examples of equipment failures include ventilator shutdown and other ventilator problems Ventilator settings include setup problems and
incorrect settings Support activities include space utilities and supplies Transport includes accidental extubation other transportation issues
and vehicle-related issues Alarms include alarm settings and alarm connection Training includes unknown ventilator model and other training
concerns
0
20
40
60
80
100
120
140
160
EquipmentFailure
VentilatorSettings
SupportActivities
Transport Alarms Training
Nu
mb
er o
f R
epo
rts
Importance Beginning with a focus on ventilators the Veterans Health Administrationrsquos
human factors-based Purchasing for Safety Initiative communicates the most common use-
issues associated with medical devices in order to ultimately remove or contain identified
vulnerabilities and prevent further harm
Event Reporting Patient safety managers report events and close calls from more than 150
VA facilities to a national database The largest number of use issues related to ventilators
involved equipment failure and issues such as spontaneous ventilator shutdown compressor
failure and broken or missing parts Other categories of ventilator use issues involved the
physical space where the ventilator was used challenges of transporting patients on
ventilators and problems with ventilator settings and alarms Root cause analyses on reports
are conducted and Patient Safety Alerts are issued to share the learning internally
Other Key Components
Data on ventilator issues from the VA and the Food and Drug Administrationrsquos Medical
Product Safety Network are the basis for a ldquogovernment-industry dayrdquo to work with
manufacturers This information is used to help the device manufacturers better
understand the limits of human use of their products
National Healthcare Quality and Disparities Report | 41
Patient Safety
The VA also trains noncliniciansmdashsuch as biomedical engineers across the
organizationmdashto understand the devices consider the situation for their use and identify
what can go wrong (ldquofailure modesrdquo) in advance
The VA encourages discussions among clinicians about their experience in using devices
In the Applied Patient Safety Challenge hundreds of staff participate in brainstorming
about solutions and strategies for dealing with unexpected scenarios involving devices
National Practitioner Data Bank
Medical malpractice actions are one way to flag potential medical errors
Medical Malpractice Payment Reports are submitted to the National Practitioner Data Bank
by medical malpractice payers
Report of a monetary exchange made for the benefit of a physician dentist or other
health care provider
Result of a settlement or judgment of a written complaint or claim based on that
providerrsquos delivery of or failure to deliver health care services
Number of Medical Malpractice Payment Reports by Setting
Number of Medical Malpractice Payment Reports by health care setting 2004-2014
Source National Practitioner Data Bank (NPDB) Public Use Data File Health Resources and Services Administration Bureau of Health
Professions Division of Practitioner Data Banks 2004-2014
Note Health care setting was not collected by the NPDB for 2104 reports in 2004 ldquoOtherrdquo includes Medical Malpractice Payment Reports
related to unknown settings as well as those for a combination of inpatient and outpatient settings Reports pertain to patients of any age
0
2000
4000
6000
8000
10000
12000
14000
16000
18000
20000
2004 2005 2006 2007 2008 2009 2010 2011 2012 2013 2014
Nu
mb
er o
f R
epo
rts
Total Inpatient Outpatient Other
Number of Medical Malpractice Payment Reports by health care setting 2004-2014
Source National Practitioner Data Bank (NPDB) Public Use Data File Health Resources and Services Administration Bureau of Health
Professions Division of Practitioner Data Banks 2004-2014
Note Health care setting was not collected by the NPDB for 2104 reports in 2004 ldquoOtherrdquo includes Medical Malpractice Payment Reports
related to unknown settings as well as those for a combination of inpatient and outpatient settings Reports pertain to patients of any age
0
2000
4000
6000
8000
10000
12000
14000
16000
18000
20000
2004 2005 2006 2007 2008 2009 2010 2011 2012 2013 2014
Nu
mb
er o
f R
epo
rts
Total Inpatient Outpatient Other
42 | National Healthcare Quality and Disparities Report
Patient Safety
Trends The total number of medical malpractice payment reports (MMPRs) per year
decreased from 17641 in 2004 to 12699 in 2014
Variation Across Reports
Of 157022 MMPRs from 2004 through 2014 more reports related to care in the
outpatient setting (71937) than in the inpatient setting (60391)
Diagnosis-related and treatment-related payments were the most frequent types of
reports each accounting for about 27 of cases Reports of payments for medication-
related cases accounted for only 5 of MMPRs (data not shown)
Number of Medical Malpractice Payment Reports by Allegation and Harm
Number of Medical Malpractice Payment Reports by type of allegation and harm severity 2004-2014
Key Temporary injury = Minor temporary injury and Major temporary injury Permanent significant injury = Significant Permanent Injury
Major Permanent Injury Quadriplegia Brain Damage Lifelong care
Source National Practitioner Data Bank Public Use Data File Health Resources and Services Administration Bureau of Health Professions
Division of Practitioner Data Banks 2004-2014
Note Reports pertain to patients of any age
0
20
40
60
80
100
Treatment(n=42913)
Diagnosis(n=42507)
Surgery(n=36845)
Obstetrics(n=10555)
Medication(n=8287)
Monitoring(n=5329)
Anesthesia(n=4276)
Equipment(n=1161)
BehavioralHealth
(n=879)
Blood(n=379)
EmotionalInjury Only
InsignificantInjury
TemporaryInjury
PermanentMinor Injury
PermanentSignificant Injury
Death Unknown
Number of Medical Malpractice Payment Reports by type of allegation and harm severity 2004-2014
Key Temporary injury = Minor temporary injury and Major temporary injury Permanent significant injury = Significant Permanent Injury
Major Permanent Injury Quadriplegia Brain Damage Lifelong care
Source National Practitioner Data Bank Public Use Data File Health Resources and Services Administration Bureau of Health Professions
Division of Practitioner Data Banks 2004-2014
Note Reports pertain to patients of any age
0
20
40
60
80
100
Treatment(n=42913)
Diagnosis(n=42507)
Surgery(n=36845)
Obstetrics(n=10555)
Medication(n=8287)
Monitoring(n=5329)
Anesthesia(n=4276)
Equipment(n=1161)
BehavioralHealth
(n=879)
Blood(n=379)
EmotionalInjury Only
InsignificantInjury
TemporaryInjury
PermanentMinor Injury
PermanentSignificant Injury
Death Unknown
Overall Percentage From 2004 to 2014 medical malpractice payments were made for
allegations related to
Treatment (42913)
Diagnosis (42507)
Surgery (36845)
Obstetrics (10555)
Medication (8287)
Monitoring (5329)
National Healthcare Quality and Disparities Report | 43
Patient Safety
Anesthesia (4276)
Equipment or products (1161)
Behavioral health (879) and
IV and blood products (379)
Variation Across Reports
Death accounted for more than one-third of harm in payments related to monitoring
(499) diagnosis (393) medication (383) and anesthesia (363) allegations
More than half of all obstetric payments were for allegations of permanent severe harm
(570)
Temporary harm accounted for more than one-third of payments related to equipment
(485) and surgery (360)
Most of the behavioral health-related payments were for emotional harm (457) or
death (338)
References
Agency for Healthcare Research and Quality Making Health Care Safer II An Updated Critical Analysis of the
Evidence for Patient Safety Practices Comparative Effectiveness Review No 211 Rockville MD Agency for
Healthcare Research and Quality March 2013 AHRQ Publication No 13-E001-EF
httpwwwahrqgovsitesdefaultfileswysiwygresearchfindingsevidence-basedshy
reportsservicesqualityptsafetyII-fullpdf
Arriaga AF Lancaster RT Berry RW et al The better colectomy project association of evidence-based best-
practice adherence rates to outcomes in colorectal surgery Ann Surg 2009 Oct250(4)507-13
httpwwwncbinlmnihgovpubmed19734778
Centers for Disease Control and Prevention HAI Prevalence Survey
httpwwwcdcgovHAIsurveillanceindexhtml Last updated March 2016 Accessed March 4 2016
Centers for Disease Control and Prevention Nursing Homes and Assisted Living (Long-Term Care Facilities)
httpwwwcdcgovlongtermcare Last updated September 2015 Accessed March 4 2016
Chassin MR Loeb JM High-reliability health care getting there from here Milbank Q 201391(3)459-90
httpwwwncbinlmnihgovpmcarticlesPMC3790522 Accessed September 23 2015
Chiu Y Bero L Hessol NA et al A literature review of clinical outcomes associated with antipsychotic medication
use in North American nursing home residents Health Policy 2015 Jun119(6)802-813 Epub 2015 Feb 28 PMID
25791166 httpwwwsciencedirectcomsciencearticlepiiS0168851015000652 Accessed June 17 2015
Huybrechts KF Gerhard Crystal S et al Differential risk of death in older residents in nursing homes prescribed
specific antipsychotic drugs Population based cohort study BMJ 2012 Feb 23344e977 PMID 22362541
httpwwwncbinlmnihgovpmcarticlesPMC3285717 Accessed June 17 2015
Institute of Medicine Preventing Medication Errors Quality Chasm Series 2007
httpwwwnapeducatalog11623preventing-medication-errors-quality-chasm-series
National Association for Home Care amp Hospice Basic Statistics About Home Care Updated 2010
httpwwwnahcorgassets1710hc_statspdf Accessed August 31 2015
44 | National Healthcare Quality and Disparities Report
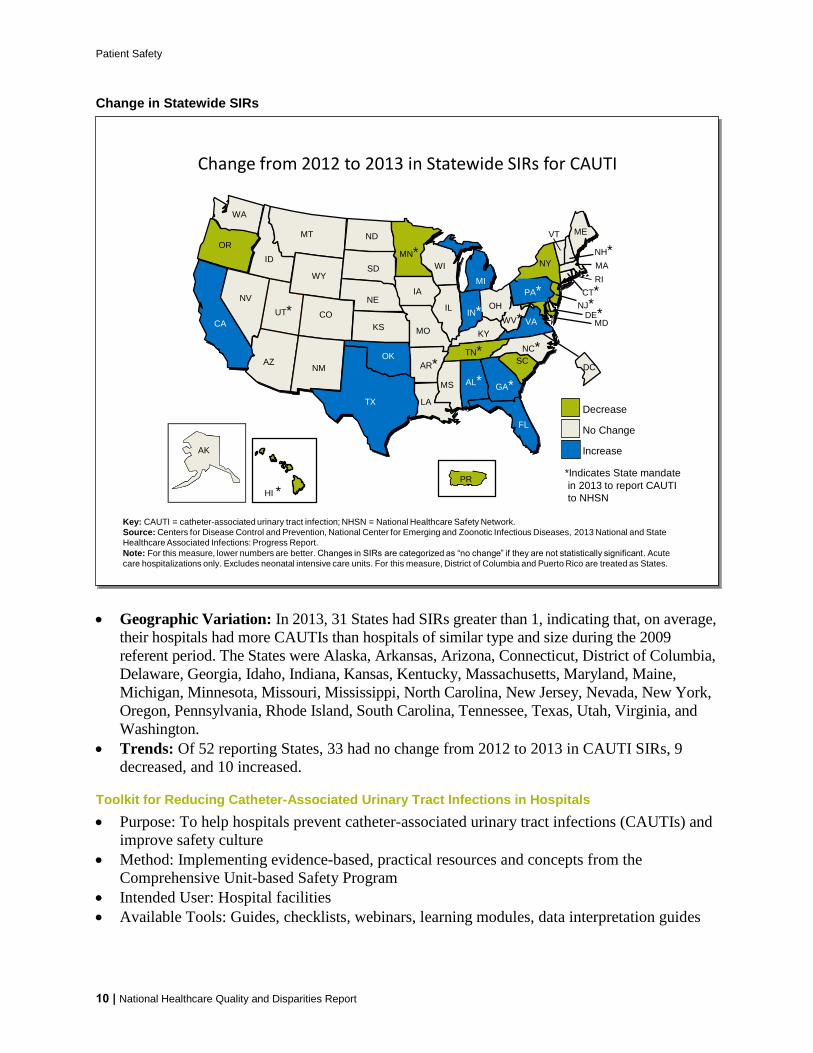
Patient Safety
Potential Measures of Effectiveness
Number of symptomatic CAUTIs attributable to each unit by month
Days since last CAUTI
Link httpwwwahrqgovprofessionalsquality-patient-safetyhaistoolscautishy
hospitalsIndexhtml
Central Line-Associated Bloodstream Infections in Neonatal Intensive Care Units
Central line-associated bloodstream infections per 1000 central-line days by birth weight of child in Level III neonatal intensive care units and by type
of pediatric ICU 2009-2013
Source Centers for Disease Control and Prevention National Healthcare Safety Network 2009-2013
Denominator Infections per 1000 central-line days
Note For this measure lower rates are better Acute care hospitalizations only
00
05
10
15
20
25
30
35
40
2009 2010 2011 2012 2013
Rat
e p
er
10
00
Ce
ntr
al-
Lin
e D
ays
le750 g 751-1000 g1001-1500 g 1501-2500 ggt2500 g
Level III Neonatal ICUs
00
05
10
15
20
25
30
35
40
2009 2010 2011 2012 2013
Rat
e p
er
10
00
Ce
ntr
al-
Lin
e D
ays
Pediatric Cardiothoracic ICUPediatric Medical ICUPediatric MedicalSurgical ICU
Pediatric ICUs
Central line-associated bloodstream infections per 1000 central-line days by birth weight of child in Level III neonatal intensive care units and by type
of pediatric ICU 2009-2013
Source Centers for Disease Control and Prevention National Healthcare Safety Network 2009-2013
Denominator Infections per 1000 central-line days
Note For this measure lower rates are better Acute care hospitalizations only
00
05
10
15
20
25
30
35
40
2009 2010 2011 2012 2013
Rat
e p
er
10
00
Ce
ntr
al-
Lin
e D
ays
le750 g 751-1000 g1001-1500 g 1501-2500 ggt2500 g
Level III Neonatal ICUs
00
05
10
15
20
25
30
35
40
2009 2010 2011 2012 2013
Rat
e p
er 1
000
Cen
tral
-Lin
e D
ays
Pediatric Cardiothoracic ICUPediatric Medical ICUPediatric MedicalSurgical ICU
Pediatric ICUs
Overall Rates
In 2013 among patients in Level III NICUs pooled mean CLABSI rates ranged from a
low of 06 infections per 1000 central-line days among neonates born at 1501 to 2500
grams to a high of 21 infections per 1000 central-line days among neonates born at less
than or equal to 750 grams
Trends
The rate of CLABSI among pediatric cardiothoracic ICUs was 25 in 2009 and 13 in
2013 among pediatric medical ICUs 26 in 2009 and 08 in 2013 and among pediatric
medicalsurgical ICUs 22 in 2009 and 12 in 2013
National Healthcare Quality and Disparities Report | 11
Patient Safety
Central Line-Associated Bloodstream Infections in Adult Intensive Care Units
Central linendashassociated bloodstream infections per 1000 central-line days in adult medical vs medicalsurgical intensive care units by hospital teaching
status 2006ndash2013
Source Centers for Disease Control and Prevention National Healthcare Safety Network 2006-2013
Denominator Infections per 1000 central-line days
Note For this measure lower rates are better Acute care hospitalizations only Major teaching facilities are defined as facilities with a program
for medical students and postgraduate medical training All other medical facilities include graduate facilities with programs for postgraduate
medical training only (ie residency andor fellowships) and undergraduate facilities with programs for medical students only
00
05
10
15
20
25
30
2006-2008 2009 2010 2011 2012 2013
Rat
e p
er
10
00
Ce
ntr
al-L
ine
Day
s
Major Teaching Medical ICU All Others Medical ICU
Major Teaching MedicalSurgical ICU All Others MedicalSurgical ICU
Central linendashassociated bloodstream infections per 1000 central-line days in adult medical vs medicalsurgical intensive care units by hospital teaching
status 2006ndash2013
Source Centers for Disease Control and Prevention National Healthcare Safety Network 2006-2013
Denominator Infections per 1000 central-line days
Note For this measure lower rates are better Acute care hospitalizations only Major teaching facilities are defined as facilities with a program
for medical students and postgraduate medical training All other medical facilities include graduate facilities with programs for postgraduate
medical training only (ie residency andor fellowships) and undergraduate facilities with programs for medical students only
00
05
10
15
20
25
30
2006-2008 2009 2010 2011 2012 2013
Rat
e p
er
10
00
Ce
ntr
al-L
ine
Day
s
Major Teaching Medical ICU All Others Medical ICU
Major Teaching MedicalSurgical ICU All Others MedicalSurgical ICU
Trends
Between 2006-2008 (combined) and 2013 there was a 46 decrease in CLABSIs (data
not shown)
From 2006-2008 (combined) to 2013 rates of CLABSIs in hospitals decreased 538
among adult medical ICU patients in hospitals with major teaching programs 476
among adult medicalsurgical ICU patients in hospitals with major teaching programs
421 among adult medical ICU patients in all other hospitals and 467 among adult
medicalsurgical ICU patients in all other hospitals
Tools for Reducing Central Line-Associated Bloodstream Infections
Purpose To help hospitals prevent central line-associated bloodstream infections (CLABSIs)
and improve safety culture
Methods Implementing evidence-based practical resources and concepts from the
Comprehensive Unit-based Safety Program (CUSP)
Intended user Hospital facilities
Available tools Checklists preventable incidence calculator audit form event report
template
12 | National Healthcare Quality and Disparities Report
Patient Safety
Impact
Through use of the CUSP toolkit and CLABSI tools more than 100 intensive care units
in Michigan have nearly eliminated CLABSIs
Nationwide the use of this toolkit has helped more than 1000 hospitals reduce rates of
CLABSI by 41 in aggregate See httpwwwahrqgovworkingforqualitypias
mhhakcpiahtm and httpwwwahrqgovprofessionalseducationcurriculumshy
toolsclabsitoolsindexhtmlpurpose
Procedure-Related Events
More than 40 million operative procedures are performed in the United States each year
Postoperative adverse events are not uncommon and increase both hospitalization length and
cost (AHRQ 2013)
Measures include
Risk-adjusted mortality at 30 days postoperation for colorectal surgery performed in
adults
Percentage of adult patients receiving hip joint replacement (because of fracture or
degenerative conditions) who experienced adverse events
Percentage of adults with mechanical adverse events associated with central venous
catheter placement
Postoperative Mortality
Risk-adjusted mortality rate within 30 days postoperation for adults undergoing colorectal surgery in ACS NSQIP participating hospitals in the United States by
raceethnicity and hospital teaching status 2008-2014
0
1
2
3
4
5
6
Pe
rce
nt
Teaching Nonteaching
Source American College of Surgeons (ACS) National Surgical Quality Improvement Program (NSQIP) 2008-2014
Denominator Adults age 18 years and over
Note For this measure lower percentages are better The participation in the ACS NSQIP is voluntary and current participation is weighted
when calculating rates Participating hospitals have changed over time 203 hospitals participated in 2008 and 531 hospitals participated in
2014 Other includes Asian American Indian or Alaska Native and Native Hawaiian or Other Pacific Islander White Black and Other are non-
Hispanic Hispanic includes all races
0
1
2
3
4
5
6
Pe
rce
nt
Total White Black Hispanic Other
Risk-adjusted mortality rate within 30 days postoperation for adults undergoing colorectal surgery in ACS NSQIP participating hospitals in the United States by
raceethnicity and hospital teaching status 2008-2014
0
1
2
3
4
5
6
Pe
rce
nt
Teaching Nonteaching
Source American College of Surgeons (ACS) National Surgical Quality Improvement Program (NSQIP) 2008-2014
Denominator Adults age 18 years and over
Note For this measure lower percentages are better The participation in the ACS NSQIP is voluntary and current participation is weighted
when calculating rates Participating hospitals have changed over time 203 hospitals participated in 2008 and 531 hospitals participated in
2014 Other includes Asian American Indian or Alaska Native and Native Hawaiian or Other Pacific Islander White Black and Other are non-
Hispanic Hispanic includes all races
0
1
2
3
4
5
6
Pe
rce
nt
Total White Black Hispanic Other
National Healthcare Quality and Disparities Report | 13
Patient Safety
Importance Colorectal procedures have high rates of postoperative complications
Nonadherence to evidence-based best practices is associated with an increased risk of these
complications (Arriaga et al 2009)
Overall Rate In 2014 the risk-adjusted mortality rate was 31 among patients undergoing
colorectal surgeries at ACS NSQIP participating hospitals
Trends From 2008 to 2014 30-day postoperative mortality after colorectal surgery
improved
Groups With Disparities
In 2014 the percentage of patients with 30-day postoperative mortality was worse for
Blacks (36) compared with Whites (30)
From 2008 to 2014 there were no statistically significant changes in the gap between
minority groups and Whites in the percentage of patients with 30-day postoperative
mortality
Adverse Events After Hip Joint Replacement
Adult patients receiving hip joint replacement due to fracture or degenerative conditions who experienced adverse events by age and chronic obstructive
pulmonary disease 2009-2013
02468
101214161820
2009 2010 2011 2012 2013
Pe
rce
nt
Total 65-74 75-84 85+
02468
101214161820
2009 2010 2011 2012 2013
Pe
rce
nt
COPD No COPD
Key COPD = chronic obstructive pulmonary disease
Source Agency for Healthcare Research and Quality (AHRQ) and Centers for Medicare amp Medicaid Services (CMS) Medicare Patient Safety
Monitoring System (MPSMS) 2009-2013
Denominator All patients age 18 years and over in the MPSMS sample who had a surgical procedure performed to replace a hip joint due to
degenerative conditions or a fractured hip
Note For this measure lower percentages are better Hospitals in Puerto Rico the Virgin Islands and Maryland were not included in the
annual samples Samples were drawn from the CMS Hospital Inpatient Quality Reporting program and consist of medical records for
discharges following hip arthroplasty procedures as defined by the Surgical Care Improvement Project Rates for patients age 85 years and
over in 2013 and for ages 18-64 years old for all years are not shown because the data did not meet the criteria for statistical reliability data
quality or confidentiality COPD status relates to patients with a principal or secondary discharge diagnosis of COPD
Adult patients receiving hip joint replacement due to fracture or degenerative conditions who experienced adverse events by age and chronic obstructive
pulmonary disease 2009-2013
02468
101214161820
2009 2010 2011 2012 2013
Pe
rce
nt
Total 65-74 75-84 85+
02
4
68
10
12
1416
18
20
2009 2010 2011 2012 2013
Pe
rce
nt
COPD No COPD
Key COPD = chronic obstructive pulmonary disease
Source Agency for Healthcare Research and Quality (AHRQ) and Centers for Medicare amp Medicaid Services (CMS) Medicare Patient Safety
Monitoring System (MPSMS) 2009-2013
Denominator All patients age 18 years and over in the MPSMS sample who had a surgical procedure performed to replace a hip joint due to
degenerative conditions or a fractured hip
Note For this measure lower percentages are better Hospitals in Puerto Rico the Virgin Islands and Maryland were not included in the
annual samples Samples were drawn from the CMS Hospital Inpatient Quality Reporting program and consist of medical records for
discharges following hip arthroplasty procedures as defined by the Surgical Care Improvement Project Rates for patients age 85 years and
over in 2013 and for ages 18-64 years old for all years are not shown because the data did not meet the criteria for statistical reliability data
quality or confidentiality COPD status relates to patients with a principal or secondary discharge diagnosis of COPD
Importance Hip replacement is most common among older adults who have an increased
risk of adverse events after these surgeries
14 | National Healthcare Quality and Disparities Report
Patient Safety
Overall Percentage In 2013 49 of patients receiving a hip joint replacement experienced
an adverse event
Trends From 2009 to 2013 the overall percentage of adverse events improved for patients
who had a hip joint replacement due to fracture or degenerative conditions
Groups With Disparities
In 2013 there were no statistically significant differences by age or COPD status in the
percentage of hip replacement patients who had adverse events
From 2009 to 2013 there were no statistically significant changes in the gap between
patients age 75 and over and those ages 65-74 in adverse event frequencies Similarly
there were no statistically significant changes in disparities between patients with COPD
and those without COPD
Adverse Events Associated With Central Venous Catheter Placement
Adults with mechanical adverse events associated with central venous catheter placement by race and obesity status 2009-2013
Source Agency for Healthcare Research and Quality and Centers for Medicare amp Medicaid Services Medicare Patient Safety Monitoring
System 2009-2013
Denominator Selected discharges of hospitalized patients age 18 years and over with central venous catheter placement
Note For this measure lower percentages are better Mechanical adverse events include allergic reaction to the catheter tamponade
perforation pneumothorax hematoma shearing off of the catheter air embolism misplaced catheter thrombosisembolism knotting of the
pulmonary artery catheter and certain other events
0
2
4
6
8
10
2009 2010 2011 2012 2013
Pe
rce
nt
Total White Black
0
2
4
6
8
10
2009 2010 2011 2012 2013
Pe
rce
nt
Obese Not Obese
Adults with mechanical adverse events associated with central venous catheter placement by race and obesity status 2009-2013
Source Agency for Healthcare Research and Quality and Centers for Medicare amp Medicaid Services Medicare Patient Safety Monitoring
System 2009-2013
Denominator Selected discharges of hospitalized patients age 18 years and over with central venous catheter placement
Note For this measure lower percentages are better Mechanical adverse events include allergic reaction to the catheter tamponade
perforation pneumothorax hematoma shearing off of the catheter air embolism misplaced catheter thrombosisembolism knotting of the
pulmonary artery catheter and certain other events
0
2
4
6
8
10
2009 2010 2011 2012 2013
Pe
rce
nt
Total White Black
0
2
4
6
8
10
2009 2010 2011 2012 2013
Pe
rce
nt
Obese Not Obese
Importance Central venous catheterization (CVC) allows medical personnel quick access to
a patientrsquos bloodstream This ease of access is important when a patient requires life-saving
medications or when a physician needs to measure central venous pressure Mechanical
adverse events are most likely to occur while medical personnel are placing or maintaining
the central venous catheter
National Healthcare Quality and Disparities Report | 15
Patient Safety
Overall Percentage In 2013 32 of adults with central venous catheter placements
experienced an associated mechanical adverse event
Trends From 2009 to 2013 there were no statistically significant changes in the overall
percentage of adults with mechanical adverse events associated with central venous catheter
placement
Groups With Disparities
In 2013 the percentage of adults with mechanical adverse events associated with CVC
was worse for Blacks (67) compared with Whites (27) There were no statistically
significant differences by obesity status
From 2009 to 2013 there were no statistically significant changes in the gap between
Blacks and Whites in the percentage of adults with mechanical adverse events associated
with CVC
Adverse Drug Events
An estimated 400000 preventable ADEs occur each year in US hospitals generating
additional costs of $35 billion in 2006 dollars (IOM 2007)
An ADE is an injurymdashincluding physical harm mental harm or loss of functionmdash
resulting from medical intervention involving a drug
For more information see the PSNet link to Patient Safety Primer Medication Errors
httpspsnetahrqgovprimersprimer23medication-errors
The three initial targets of the HHS National Action Plan for Adverse Drug Event Prevention are
Anticoagulants and related bleeding
Diabetes agents and related hypoglycemia
Opioids and accidental overdose oversedation and respiratory depression
Measures of Patient Safety in the Hospital Setting Adverse Drug Events
Percentage of hospitalized adult patients who received a hypoglycemic agent and had an
adverse drug event
Percentage of hospitalized adult patients who had an anticoagulant-related adverse drug
event to warfarin
Number of opioid-related medication errors in patients of all ages
16 | National Healthcare Quality and Disparities Report
Patient Safety
Adverse Drug Events With Hypoglycemic Agents
Hospitalized adult patients who received a hypoglycemic agent who had adverse drug events with hypoglycemic agents by
raceethnicity 2010-2013 and renal disease 2009-2013
Source Agency for Healthcare Research and Quality and Centers for Medicare amp Medicaid Services Medicare Patient Safety Monitoring
System 2009-2013
Note For this measure lower percentages are better Hypoglycemic agents received by patients age 18 and over during a hospital stay include
insulin oral hypoglycemic or a combination of both The 2009 data for races did not meet the criteria for statistical reliability data quality or confidentiality
0
2
4
6
8
10
12
14
16
18
20
2009 2010 2011 2012 2013
Pe
rce
nt
Total Renal DiseaseNo Renal Disease
0
2
4
6
8
10
12
14
16
18
20
2010 2011 2012 2013
Pe
rce
nt
Total White BlackAsian Hispanic
Hospitalized adult patients who received a hypoglycemic agent who had adverse drug events with hypoglycemic agents by
raceethnicity 2010-2013 and renal disease 2009-2013
Source Agency for Healthcare Research and Quality and Centers for Medicare amp Medicaid Services Medicare Patient Safety Monitoring
System 2009-2013
Note For this measure lower percentages are better Hypoglycemic agents received by patients age 18 and over during a hospital stay include
insulin oral hypoglycemic or a combination of both The 2009 data for races did not meet the criteria for statistical reliability data quality or confidentiality
0
2
4
6
8
10
12
14
16
18
20
2009 2010 2011 2012 2013
Pe
rce
nt
Total Renal DiseaseNo Renal Disease
0
2
4
6
8
10
12
14
16
18
20
2010 2011 2012 2013
Pe
rce
nt
Total White BlackAsian Hispanic
Importance Hypoglycemic agents which are ingested orally are typically used in patients
with type II diabetes to control blood sugar levels In some cases diabetic patients use
hypoglycemic agents together with insulin The risk of chronic kidney disease increases
twofold for people with diabetes and renal impairment can increase the risk for adverse
events related to hypoglycemic agents
Overall Percentage In 2013 85 of hospital patients receiving hypoglycemic agents had
an adverse drug event
Trends The overall percentage of adverse drug events associated with hypoglycemic agents
improved from 2009 to 2013
Groups With Disparities
In 2013 the percentage of hospital patients who had adverse drug events with hypoglycemic agents was higher for Blacks (111) than for Whites (8)
Also in 2013 the percentage of hospital patients who had adverse drug events with
hypoglycemic agents was higher for those with renal disease (122) than for those
without renal disease (56)
From 2010 to 2013 there were no statistically significant changes in the gap between
minority groups and Whites in the percentage of patients who had adverse drug events
associated with hypoglycemic agents Similarly there were no statistically significant
changes in the gap between those with renal disease and those without
National Healthcare Quality and Disparities Report | 17
Patient Safety
Adverse Drug Events With Warfarin
Hospitalized adult patients with an anticoagulant-related adverse drug event with warfarin by age and corticosteroid use 2009-2013
Source Agency for Healthcare Research and Quality and Centers for Medicare amp Medicaid Services Medicare Patient Safety Monitoring
System 2009ndash2013
Denominator Patients 18 and over who received warfarin and had their international normalized ratio (INR) measured during their hospital
stay
Note For this measure lower percentages are better Adverse events occurring the day of hospital arrival were excluded
0
2
4
6
8
10
12
2009 2010 2011 2012 2013
Pe
rce
nt
TotalCorticosteroid UseNo Corticosteroid Use
0
2
4
6
8
10
12
2009 2010 2011 2012 2013
Pe
rce
nt
lt65 65-74 75-84 85+
Hospitalized adult patients with an anticoagulant-related adverse drug event with warfarin by age and corticosteroid use 2009-2013
Source Agency for Healthcare Research and Quality and Centers for Medicare amp Medicaid Services Medicare Patient Safety Monitoring
System 2009ndash2013
Denominator Patients 18 and over who received warfarin and had their international normalized ratio (INR) measured during their hospital
stay
Note For this measure lower percentages are better Adverse events occurring the day of hospital arrival were excluded
0
2
4
6
8
10
12
2009 2010 2011 2012 2013
Pe
rce
nt
TotalCorticosteroid UseNo Corticosteroid Use
0
2
4
6
8
10
12
2009 2010 2011 2012 2013
Pe
rce
nt
lt65 65-74 75-84 85+
Importance Blood clots in arteries and veins can cause a blockage of blood flow and lead to
strokes and heart attacks Anticoagulants such as warfarin reduce this risk but pose an
increased risk of bleeding Corticosteroids can interact with anticoagulants to raise the risk of
potential bleeding complications
Overall Percentage In 2013 50 of adults using warfarin experienced an anticoagulant-
related adverse drug event
Trends From 2009 to 2013 there were no statistically significant changes in the overall
percentage of hospital patients with an adverse drug event related to warfarin
Groups With Disparities
In 2013 the percentage of hospital patients who had an adverse drug event to warfarin
was the same regardless of corticosteroid use status
From 2009 to 2013 there were no statistically significant changes in the gap between
older age groups and those under age 65 in the percentage of patients who had adverse
events associated with warfarin Similarly there were no statistically significant changes
in the gap between those using corticosteroids and those not using corticosteroids
18 | National Healthcare Quality and Disparities Report
Patient Safety
Opioid-Related Medication Errors
Number of opioid-related medication errors reported in Pennsylvania by AHRQ eventharm category and age 2006 2008 2010 2012 2014
30 53 44 27 23
2947 2798 2714 27082408
9531014
984 969
910
175 245251 398
330
0
500
1000
1500
2000
2500
3000
3500
4000
4500
2006 2008 2010 2012 2014
Nu
mb
er o
f Ev
ents
Unsafe Condition Near Miss
Patient Event No Harm Patient Event Harm
Source Institute of Safe Medication Practices on behalf of the Pennsylvania Patient Safety Authority 2006-2014
Note Pennsylvania Patient Safety Reporting System reports of medication errors are from acute-level facilities that consist of hospitals
ambulatory surgical facilities birthing centers and abortion facilities Medication errors do not include adverse drug reactions Eventharm
categories refer to those in the Agency for Healthcare Research and Quality Common Formats Unsafe condition is defined as any
circumstance that increases the probability of a patient safety event A near miss is defined as a patient safety event that did not reach the
patient Deaths are included in the total but not shown on the chart because there were too few to render graphically
192 166 336530 662
2287 24842385
2364 1955
16271461 1272
1208
1055
0
500
1000
1500
2000
2500
3000
3500
4000
4500
2006 2008 2010 2012 2014
Nu
mb
er o
f Ev
en
ts
lt18 18-64 65+
Number of opioid-related medication errors reported in Pennsylvania by AHRQ eventharm category and age 2006 2008 2010 2012 2014
30 53 44 27 23
2947 2798 2714 27082408
9531014
984 969
910
175 245251 398
330
0
500
1000
1500
2000
2500
3000
3500
4000
4500
2006 2008 2010 2012 2014
Nu
mb
er o
f Ev
ents
Unsafe Condition Near Miss
Patient Event No Harm Patient Event Harm
Source Institute of Safe Medication Practices on behalf of the Pennsylvania Patient Safety Authority 2006-2014
Note Pennsylvania Patient Safety Reporting System reports of medication errors are from acute-level facilities that consist of hospitals
ambulatory surgical facilities birthing centers and abortion facilities Medication errors do not include adverse drug reac tions Eventharm
categories refer to those in the Agency for Healthcare Research and Quality Common Formats Unsafe condition is defined as any
circumstance that increases the probability of a patient safety event A near miss is defined as a patient safety event that did not reach the
patient Deaths are included in the total but not shown on the chart because there were too few to render graphically
192 166 336530 662
2287 24842385
2364 1955
16271461 1272
1208
1055
0
500
1000
1500
2000
2500
3000
3500
4000
4500
2006 2008 2010 2012 2014
Nu
mb
er o
f Ev
ents
lt18 18-64 65+
Importance Acute malignant andmdashincreasinglymdashchronic pain often is treated or managed
with prescription opioids Reducing patient harm from the use of opioids in both inpatient
and outpatient settings is a main area of focus because opioid-related adverse drug events are
often preventable
Trends
In Pennsylvania the total number of medication error reports related to opioids decreased
106 between 2006 (4106) and 2014 (3672)
Between 24 and 54 opioid-related medication errors resulting in patient harm or death
were reported from 2006 through 2014 accounting for approximately 1 of all reported
opioid medication errors each year
The largest share of opioid-related medication errors reported each year in Pennsylvania
related to those that reached the patient but did not result in harm Of these no-harm
events reaching the patient about one in four required monitoring andor intervention to
preclude the harm
National Healthcare Quality and Disparities Report | 19
Patient Safety
20 | National Healthcare Quality and Disparities Report
Although small in number reports of unsafe conditions increased from 43 (175) of
total opioid-related medication error reports in 2006 to 9 (330) in 2014 Reports of
unsafe conditions and near misses can provide important learning opportunities for
preventing patient harm
Differences Between Groups Reports of opioid-related medication errors involving
pediatric patients increased nearly fourfold from 192 (47) in 2006 to 662 (18) in 2014
During the same period reports of opioid-related medication errors involving older adult
patients decreased from nearly 40 of the total to less than 30
Patient Safety in the Nursing Home Setting
More than 3 million people receive care in US nursing homes and skilled nursing facilities
each year (CDC 2015)
For nursing home residents optimal care seeks to maximize quality of life and minimize
unintended complications
Measures tracked for patients of various age ranges include
Nursing home residents with urinary tract infections
Nursing home residents experiencing use of restraints
Nursing home residents who have pressure ulcers
Nursing home residents who had a fall with major injury
Nursing home residents who received antipsychotic medication
Urinary Tract Infections
Long-stay nursing home residents experiencing urinary tract infections by sex and raceethnicity 2011-2013
Source Centers for Medicare amp Medicaid Services Minimum Data Set 2011-2013
DenominatorNursing home residents of any age w ho have at least 101 cumulative days in the facility
Note For this measure low er percentages are better The measure w as calculated as follows Percentage of long-stay residents with a urinary
tract infection w ithin the 30 days prior to assessment White Black and Asian are non-Hispanic Hispanic includes all races
0
2
4
6
8
10
2011 2012 2013
Pe
rce
nt
Total Male Female
2011 Achievable
Benchmark 61
0
2
4
6
8
10
2011 2012 2013
Pe
rce
nt
White Black Asian Hispanic
2011 Achievable
Benchmark 61
Long-stay nursing home residents experiencing urinary tract infections by sex and raceethnicity 2011-2013
Source Centers for Medicare amp Medicaid Services Minimum Data Set 2011-2013
DenominatorNursing home residents of any age w ho have at least 101 cumulative days in the facilityNote For this measure low er percentages are better The measure w as calculated as follows Percentage of long-stay residents with a urinary
tract infection w ithin the 30 days prior to assessment White Black and Asian are non-Hispanic Hispanic includes all races
0
2
4
6
8
10
2011 2012 2013
Pe
rce
nt
Total Male Female
2011 Achievable
Benchmark 61
0
2
4
6
8
10
2011 2012 2013
Pe
rce
nt
White Black Asian Hispanic
2011 Achievable
Benchmark 61
Patient Safety
Importance Bacteria that cause urinary tract infections (UTIs) can spread to other body
parts and become more serious or contribute to further complications such as delirium
Overall Percentage In 2013 the percentage of long-stay nursing home residents with a UTI
was 64
Groups With Disparities
In 2013 compared with males (51) the percentage with UTIs was worse for females
(7)
In 2013 compared with White residents (68) the percentage of residents with UTIs
was lower for Blacks and Asians (47) as well as Hispanics (54)
Achievable Benchmark
In 2011 the top 5 State achievable benchmark for UTIs was 61 The States that
contributed to the achievable benchmark are Connecticut Hawaii Minnesota North
Dakota and Pennsylvania
Males Blacks Asians and Hispanics have achieved the benchmark
Use of Restraints
00
05
10
15
20
25
30
35
40
2011 2012 2013
Pe
rce
nt
White Black Asian Hispanic
00
05
10
15
20
25
30
35
40
2011 2012 2013
Pe
rce
nt
Total 0-64 65-74 75-84 85+
2011 Achievable
Benchmark 07
Long-stay nursing home residents experiencing use of restraints by age and raceethnicity 2011-2013
Source Centers for Medicare amp Medicaid Services Minimum Data Set 2011-2013
Denominator Nursing home residents of any age who have at least 101 cumulative days in the facility
Note For this measure lower percentages are better The measure was calculated as follows Percentage of long-stay residents who are
physically restrained on a daily basis
2011 Achievable
Benchmark 07
00
05
10
15
20
25
30
35
40
2011 2012 2013
Pe
rce
nt
White Black Asian Hispanic
00
05
10
15
20
25
30
35
40
2011 2012 2013
Pe
rce
nt
Total 0-64 65-74 75-84 85+
2011 Achievable
Benchmark 07
Long-stay nursing home residents experiencing use of restraints by age and raceethnicity 2011-2013
Source Centers for Medicare amp Medicaid Services Minimum Data Set 2011-2013
Denominator Nursing home residents of any age who have at least 101 cumulative days in the facility
Note For this measure lower percentages are better The measure was calculated as follows Percentage of long-stay residents who are
physically restrained on a daily basis
2011 Achievable
Benchmark 07
National Healthcare Quality and Disparities Report | 21
Patient Safety
Importance Residents who are restrained daily can become weak lose their ability to go to
the bathroom by themselves and develop pressure ulcers or other medical conditions
Overall Percentage In 2013 the percentage of long-stay nursing home residents who were
physically restrained on a daily basis was 14
Groups With Disparities
In 2011 2012 and 2013 the percentage of residents with restraint use on a daily basis
was lower for those ages 65-74 years compared with those under age 65 In 2013 the
percentage of residents ages 65-74 years experiencing use of restraints was 12
compared with 16 for residents younger than 65
In 2013 compared with Whites (14) Asians (2) and Hispanics (18) had worse
percentages of daily restraint use and Blacks (12) had a better percentage of daily
restraint use
Achievable Benchmark
In 2011 the top 5 State achievable benchmark for restraint use was 07 The States that
contributed to the achievable benchmark are Kansas Maine Nebraska New Hampshire
and Vermont
No group achieved the benchmark from 2011 to 2013
Pressure Ulcers
Low-risk short-stay and high-risk long-stay nursing home residents who have pressure ulcers by sex 2011-2013
Source Centers for Medicare amp Medicaid Services Minimum Data Set 2011-2013
Denominator Low-risk short-stay Nursing home residents of any age who have 100 or fewer cumulative days in the facility and are active can
change positions and are getting the nutrients they need to maintain good skin health High-risk long-stay Nursing home residents of any age
who have at least 101 cumulative days in the facility and are in a coma do not get the nutrients needed to maintain good skin health or cannot
change position on their own
Note For this measure lower percentages are better
0
2
4
6
8
10
12
2011 2012 2013
Pe
rce
nt
Low-Risk Short StayTotal Male Female
2011 Achievable Benchmark10
0
2
4
6
8
10
12
2011 2012 2013
Pe
rce
nt
High-Risk Long StayTotal Male Female
2008 Achievable Benchmark 71
Low-risk short-stay and high-risk long-stay nursing home residents who have pressure ulcers by sex 2011-2013
Source Centers for Medicare amp Medicaid Services Minimum Data Set 2011-2013
Denominator Low-risk short-stay Nursing home residents of any age who have 100 or fewer cumulative days in the facility and are active can
change positions and are getting the nutrients they need to maintain good skin health High-risk long-stay Nursing home residents of any age
who have at least 101 cumulative days in the facility and are in a coma do not get the nutrients needed to maintain good skin health or cannot
change position on their own
Note For this measure lower percentages are better
0
2
4
6
8
10
12
2011 2012 2013
Pe
rce
nt
Low-Risk Short StayTotal Male Female
2011 Achievable Benchmark10
0
2
4
6
8
10
12
2011 2012 2013
Pe
rce
nt
High-Risk Long StayTotal Male Female
2008 Achievable Benchmark 71
22 | National Healthcare Quality and Disparities Report
Patient Safety
Importance Pressure ulcers are serious medical conditions They typically result from
prolonged periods of uninterrupted pressure on the skin soft tissue muscle and bone
Vulnerable patients include older adults stroke and diabetic patients patients with dementia
circulatory diseases dehydration and malnutrition and people who use wheelchairs or are
bedriddenmdashthat is any patient with impaired mobility or sensation
Overall Percentage In 2013 the percentage of low-risk short-stay residents with pressure
ulcers was 13 and the percentage of high-risk long-stay residents with pressure ulcers was
77
Groups with Disparities
As in 2011 and 2012 male low-risk short-stay nursing home residents had a worse
percentage with pressure ulcers (15) compared with female residents (12) in 2013
As in 2011 and 2012 male high-risk long-stay nursing home residents had a worse
percentage with pressure ulcers (94) compared with female residents (70) in 2013
Achievable Benchmark
The 2011 top 5 State achievable benchmark for low-risk short-stay nursing home residents was 10 The States that contributed to the benchmark were Alabama Arizona Colorado Connecticut and Idaho
The 2008 top 5 State achievable benchmark for high-risk long-stay nursing home residents was 71 The States that contributed to the benchmark were Hawaii Minnesota Nebraska New Hampshire and North Dakota
No low-risk short-stay residents achieved the benchmark from 2011 to 2013 Among
high-risk long-stay residents only females achieved the benchmark by 2013
National Healthcare Quality and Disparities Report | 23
Patient Safety
Falls
00
05
10
15
20
25
30
35
40
45
50
Pe
rce
nt
2012 2013
Long-stay nursing home residents who had a fall with major injury by sex age and raceethnicity 2012-2013
Source Centers for Medicare amp Medicaid Services Minimum Data Set 2012-2013
Denominator Nursing home residents of any age who have at least 101 cumulative days in the facility with one or more look-back scan
assessments except when the occurrence of falls or number of falls with major injury was not assessed in the look-back scan assessment
Note For this measure lower percentages are better White Black and Other are non-Hispanic Hispanic includes all races
2012 Achievable
Benchmark 22
00
05
10
15
20
25
30
35
40
45
50
Pe
rce
nt
2012 2013
Long-stay nursing home residents who had a fall with major injury by sex age and raceethnicity 2012-2013
Source Centers for Medicare amp Medicaid Services Minimum Data Set 2012-2013
Denominator Nursing home residents of any age who have at least 101 cumulative days in the facility with one or more look-back scan
assessments except when the occurrence of falls or number of falls with major injury was not assessed in the look-back scan assessment
Note For this measure lower percentages are better White Black and Other are non-Hispanic Hispanic includes all races
2012 Achievable
Benchmark 22
Importance Nursing home residents who experience falls resulting in major injuries are at
higher risk of death and disability as well as emotional trauma that can affect functional
abilities and social well-being
Overall Percentage In 2013 the percentage of long-stay nursing home residents who had a
fall with a major injury was 34
Groups With Disparities
In 2013 female nursing home residents had a worse percentage of falls (38) compared
with male residents (25)
In 2013 the percentage of falls with major injury was worse for all subgroups of
residents age 65 years and over compared with their younger counterparts The
percentage for residents under 65 years old was 17 compared with 26 for ages 65shy
74 years 34 for ages 75-84 years and 41 for 85 years and over
Also in 2013 compared with Whites (38) the percentage of falls with major injury
was better for Black (13) Other (22) and Hispanic (24) residents
24 | National Healthcare Quality and Disparities Report
Patient Safety
National Healthcare Quality and Disparities Report | 25
Achievable Benchmark
The 2012 top 5 State achievable benchmark for falls with major injury was 22 The
States that contributed to the achievable benchmark are Alaska California District of
Columbia Hawaii and New Jersey The benchmark was achieved by Black residents and those ages 0-64 years
Antipsychotic Medication Among Nursing Home Residents
Importance The high use of antipsychotic medications among nursing home residents for
indications other than those for which the drug was approved has been noted by the Federal
Government These drugs are often used for too long at too high a dose or when
unnecessary In the past inappropriate prescribing of antipsychotics in nursing homes has
primarily been considered a marker of suboptimal care Recent studies have shown
antipsychotic use is also a drug safety issue (Huybrechts et al 2012) Antipsychotic
medication use is associated with increased risks of adverse events such as movement
disorders falls hip fractures and cerebrovascular events Their use in older adults with
dementia carries an increased risk of death Safety concerns with antipsychotic medication
use in older adults also include the risks of hyperprolactinemia pneumonia
0
5
10
15
20
25
30
Percent
2012 2013
Adult long-stay nursing home residents who received antipsychotic medication by raceethnicity and number of chronic conditions 2012-2013
Key NHOPI = Native Hawaiian or Other Pacific Islander AIAN = American Indian or Alaska Native
Source Centers for Medicare amp Medicaid Services Minimum Data Set 2012-2013
Denominator Nursing home residents of any age who have at least 101 cumulative days in the facility excluding residents with schizophrenia
Tourettersquos syndrome and Huntingtonrsquos disease
Numerator Subset of denominator that receives an antipsychotic medication
Note For this measure lower percentages are better
2012 Achievable
Benchmark 150
0
5
10
15
20
25
30
Percent
2012 2013
Adult long-stay nursing home residents who received antipsychotic medication by raceethnicity and number of chronic conditions 2012-2013
Key NHOPI = Native Hawaiian or Other Pacific Islander AIAN = American Indian or Alaska Native
Source Centers for Medicare amp Medicaid Services Minimum Data Set 2012-2013
Denominator Nursing home residents of any age who have at least 101 cumulative days in the facility excluding residents with schizophrenia
Tourettersquos syndrome and Huntingtonrsquos disease
Numerator Subset of denominator that receives an antipsychotic medication
Note For this measure lower percentages are better
2012 Achievable
Benchmark 150
Patient Safety
26 | National Healthcare Quality and Disparities Report
thromboembolism cerebrovascular events and other cardiovascular adverse events (Chiu et
al 2015)
Overall Percentage The percentage of long-stay nursing home residents who had
antipsychotic medications was 176 in 2013
Groups With Disparities
In 2013 the percentage of residents receiving antipsychotic medication was higher for
Hispanic residents (201) than for White residents (180)
In 2012 and 2013 the percentage of long-stay residents who received antipsychotic
medications was worse for residents with one or more chronic conditions than for
residents with no chronic conditions
Achievable Benchmark
The 2012 top 6 State achievable benchmark was 150 The States that contributed to the
achievable benchmark are Alaska California Hawaii Michigan New Jersey and
Wyoming Asians NHOPIs residents with no chronic conditions and residents with one chronic
condition achieved the benchmark
Antipsychotic Medication Among Nursing Home Residents by State
Long-stay nursing home residents who received antipsychotic medication by State 2013
Source Centers for Medicare amp Medicaid Services Minimum Data Set 2013
Denominator Nursing home residents of any age who have at least 101 cumulative days in the facility
Note For this measure lower percentages are better
AZ
CA
UT
CT
FL
GA
IA
IL
KS
MA
MDMO
NJ
NY
OR
PA
SC
TN
CO
WA
WI
VA
ME
MN
MI
NC
TX
KY
WV
RI
NE
VT
NV OH
SD
AR
IN
NH
MT
ID
WY
ND
NMOK
LA
MS AL
DE
AKAK
HI
DC
85-153 (1st Quartile)
154-173 (2nd Quartile)
No Data
174-192 (3rd Quartile)
PR193-234 (4th Quartile)
Long-stay nursing home residents who received antipsychotic medication by State 2013
Source Centers for Medicare amp Medicaid Services Minimum Data Set 2013
Denominator Nursing home residents of any age who have at least 101 cumulative days in the facility
Note For this measure lower percentages are better
AZ
CA
UT
CT
FL
GA
IA
IL
KS
MA
MDMO
NJ
NY
OR
PA
SC
TN
CO
WA
WI
VA
ME
MN
MI
NC
TX
KY
WV
RI
NE
VT
NV OH
SD
AR
IN
NH
MT
ID
WY
ND
NMOK
LA
MS AL
DE
AKAK
HI
DC
85-153 (1st Quartile)
154-173 (2nd Quartile)
No Data
174-192 (3rd Quartile)
PR193-234 (4th Quartile)
Patient Safety
Overall This map shows overall rankings of States (by quartiles) in the percentage of long-
stay nursing home residents who received antipsychotic medication in 2013 Values ranged
from 85 to 234
Differences by State Interquartile ranges follow
First quartile (lowest) 85-153 (AK CA DC DE HI MD MI MN NJ NC SC
WI WV)
Second quartile (second lowest) 153 -173 (CO ID MT NM NY ND OR PA
RI SD VT WA WY)
Third quartile (second highest) 174-192 (AZ CT GA IN IA KS ME MA MO
NV OH OK VA)
Fourth quartile (highest) 193-234 (AL AR FL IL KY LA MS NE NH TN
TX UT)
Eight of the 12 States in the quartile with the highest percentage of long-stay nursing
home residents who received antipsychotic medication were in the South
Patient Safety in the Home Health Setting
Home health agencies provide services to beneficiaries who are homebound and need skilled
nursing care or therapy
Approximately 12 million individuals receive home health care from more than 33000
providers for causes including acute illness long-term health conditions permanent
disability or terminal illness (NAHCH 2010)
Improvements among home health patients can reflect the quality of care from home health
agencies
Measures include
Home health patients with improvement in surgical wounds
Home health patients with improvements in their ability to take medications orally
National Healthcare Quality and Disparities Report | 27
Patient Safety
Improvement in Surgical Wounds
75
80
85
90
95
100
2010 2011 2012 2013
Pe
rce
nt
White Black Asian Hispanic
75
80
85
90
95
100
2010 2011 2012 2013
Pe
rce
nt
Total 0-64 65-74
75-84 85+
2011 Achievable
Benchmark 913
Home health patients with improvement in surgical wounds by age and raceethnicity 2010-2013
Source Centers for Medicare amp Medicaid Services Outcome and Assessment Information Set 2010-2013
Denominator Number of home health episodes during the measurement period in which the patient of any age had a surgical wound and the
episode ended with the patient discharged from home health care
Note White Black and Asian are non-Hispanic Hispanic includes all races
2011 Achievable
Benchmark 913
75
80
85
90
95
100
2010 2011 2012 2013
Per
cen
t
White Black Asian Hispanic
75
80
85
90
95
100
2010 2011 2012 2013
Per
cen
t
Total 0-64 65-74
75-84 85+
2011 Achievable
Benchmark 913
Home health patients with improvement in surgical wounds by age and raceethnicity 2010-2013
Source Centers for Medicare amp Medicaid Services Outcome and Assessment Information Set 2010-2013
Denominator Number of home health episodes during the measurement period in which the patient of any age had a surgical wound and the
episode ended with the patient discharged from home health care
Note White Black and Asian are non-Hispanic Hispanic includes all races
2011 Achievable
Benchmark 913
Importance Normal wound healing after an operation is an important marker of good care
The home health team should regularly change wound dressing and teach the patient about
wound care
Overall Percentage In 2013 the percentage of home health patients with improvement in
their surgical wounds was 890
Trends The percentage of health home patients with surgical wound improvement increased
between 2010 and 2013
Groups With Disparities
In 2013 compared with residents under age 65 years (856) all other age groups had
better percentages of improvement in surgical wounds The percentage was 893 for
ages 65-74 905 for ages 75-84 and 917 for ages 85 and over
In 2013 compared with Whites (893) Blacks (878) Asians (882) and Hispanics
(874) had worse percentages of improvement in surgical wounds
The 2010 through 2013 trend in the percent of home health patients with surgical wound
improvement did not change for those over age 65 relative to persons under age 65 years
28 | National Healthcare Quality and Disparities Report
Patient Safety
Achievable Benchmark
The 2011 top 5 State achievable benchmark was 913 The States that contributed to the
benchmark are Alabama Mississippi Nevada Oklahoma and South Carolina
Home health patients age 85 years and over achieved the benchmark for surgical wound
improvement in 2013
At the current rate of progress patients ages 75-84 years could reach the benchmark
within a year Patients ages 65-74 years could achieve the benchmark in approximately 2
years
White home health patients could achieve the benchmark in approximately 2 years
Improvement in Ability To Take Medication Orally
0
20
40
60
80
100
2010 2011 2012 2013
Per
cen
t
White Black Asian Hispanic
0
20
40
60
80
100
2010 2011 2012 2013
Per
cen
t
Total 0-64 65-74
75-84 85+
2008 Achievable
Benchmark 516
Home health patients with improvement in their ability to take medications orally by age and raceethnicity 2010-2013
Source Centers for Medicare amp Medicaid Services Outcome and Assessment Information Set 2010-2013
Denominator Number of home health care episodes in which a patient of any age was unable to take oral medications independently at the
start of the episode that ended during the measurement period
Note White Black and Asian are non-Hispanic Hispanic includes all races
2008 Achievable
Benchmark 516
0
20
40
60
80
100
2010 2011 2012 2013
Per
cen
t
White Black Asian Hispanic
0
20
40
60
80
100
2010 2011 2012 2013
Per
cen
t
Total 0-64 65-74
75-84 85+
2008 Achievable
Benchmark 516
Home health patients with improvement in their ability to take medications orally by age and raceethnicity 2010-2013
Source Centers for Medicare amp Medicaid Services Outcome and Assessment Information Set 2010-2013
Denominator Number of home health care episodes in which a patient of any age was unable to take oral medications independently at the
start of the episode that ended during the measurement period
Note White Black and Asian are non-Hispanic Hispanic includes all races
2008 Achievable
Benchmark 516
Importance Taking medications correctly is important to the health status and quality of life
of individuals living in the community The home health team can help teach a patient ways
to organize drugs and take them properly
Overall Percentage In 2013 the percentage of home health patients with improvement in
their ability to take medications orally was 513
Trends Between 2010 and 2013 there was improvement in the overall percentage of home
health patients with improved ability to take medications orally
National Healthcare Quality and Disparities Report | 29
Patient Safety
Groups With Disparities
In 2013 the percentage of home health patients with improvement in their ability to take
medications orally was worse for those age 85 years and over (398) compared with
those under age 65 years (577)
The percentage of patients with improvement in their ability to take medications orally
was worse among Hispanic home health patients (400) than among White patients
(526) in 2013
From 2010 to 2013 the gap between Blacks and Whites decreased and the gap between
Asians and Whites and Hispanics and Whites increased
Achievable Benchmark
The 2008 top 5 State achievable benchmark was 516 The States that contributed to the
achievable benchmark are Iowa Massachusetts New Jersey North Dakota and South
Carolina
The benchmark was achieved among age groups under 85 years and by White and Black
home health patients
The total population is estimated to reach the benchmark in less than a year Hispanic
patients and patients age 85 years and over are farthest from the benchmark
Improvement in Ability To Take Medication Orally by State
Home health patients with improvement in their ability to take medications orally by raceethnicity by State 2013
Source Centers for Medicare amp Medicaid Services Outcome and Assessment Information Set 2013
Denominator Number of home health care episodes in which a patient of any age was unable to take oral medications independently at the
start of the episode that ended during the measurement period
AZ
CA
UT
CT
FL
GA
IA
IL
KS
MA
MDMO
NJ
NY
OR
PA
SC
TN
CO
WA
WI
VA
ME
MN
MI
NC
TX
KY
WV
RI
NE
VT
NV OH
SD
AR
IN
NH
MT
ID
WY
ND
NMOK
LA
MS AL
DE
AKAK
HI
No significant difference between rates
of Hispanics and non-Hispanic Whites
Non-Hispanic Whites have significantly
worse rate than Hispanics
States do not have data that meet the
criteria for statistical reliability data
quality or confidentiality
Hispanics have significantly worse rate
than non-Hispanic Whites
DC
Home health patients with improvement in their ability to take medications orally by raceethnicity by State 2013
Source Centers for Medicare amp Medicaid Services Outcome and Assessment Information Set 2013
Denominator Number of home health care episodes in which a patient of any age was unable to take oral medications independently at the
start of the episode that ended during the measurement period
AZ
CA
UT
CT
FL
GA
IA
IL
KS
MA
MDMO
NJ
NY
OR
PA
SC
TN
CO
WA
WI
VA
ME
MN
MI
NC
TX
KY
WV
RI
NE
VT
NV OH
SD
AR
IN
NH
MT
ID
WY
ND
NMOK
LA
MS AL
DE
AKAK
HI
No significant difference between rates
of Hispanics and non-Hispanic Whites
Non-Hispanic Whites have significantly
worse rate than Hispanics
States do not have data that meet the
criteria for statistical reliability data
quality or confidentiality
Hispanics have significantly worse rate
than non-Hispanic Whites
DC
30 | National Healthcare Quality and Disparities Report
Patient Safety
Geographic Variation
In 2013 Hispanic home health patients had worse rates of improvement in taking oral
medications than non-Hispanic White patients in 11 States (Arizona California
Connecticut Florida Illinois Indiana Massachusetts Nevada New York North
Carolina and Texas
Non-Hispanic White patients had worse rates of improvement than Hispanic patients in
five States (Hawaii Idaho Iowa Michigan and Pennsylvania)
Patient Safety in the Ambulatory Setting
Although patient safety initiatives frequently focus on inpatient hospital events adverse
effects of medical care may be identified and treated in outpatient settings
Adverse effects of medical care can follow care or procedures in hospitals emergency
departments physician offices or other settings
Measures include
Patient safety and quality issues by frequency of occurrence in outpatient medical offices
Adults age 65 years and over who received potentially inappropriate prescription medications during the calendar year
Percentage of hemodialysis patients with vascular catheter in use for 90 days or longer
For more information see the PSNet link to Patient Safety Primer Patient Safety in
Ambulatory Care httpspsnetahrqgovprimersprimer16patient-safety-in-ambulatory-care
National Healthcare Quality and Disparities Report | 31
Patient Safety
Patient Safety and Quality Issues
Patient safety and quality issues by frequency of occurrence in outpatient medical offices 2014
Source Westat analysis of the AHRQ 2014 Medical Office Survey on Patient Safety Culture Comparative Database (N=935)
Note For this measure less frequent occurrences during the year are better
0
20
40
60
80
100
A pharmacy contactedour office to clarify orcorrect a prescription
A patient was unableto get an appointmentwithin 48 hours for anacuteserious problem
A patients medicationlist was not updatedduring his or her visit
The results from a labor imaging test were notavailable when needed
A patients chartmedicalrecord was not available
when needed
Occurred DailyWeekly
Occurred Monthly
Occurred Not at All to Several Times Over the Past Year
Patient safety and quality issues by frequency of occurrence in outpatient medical offices 2014
Source Westat analysis of the AHRQ 2014 Medical Office Survey on Patient Safety Culture Comparative Database (N=935)
Note For this measure less frequent occurrences during the year are better
0
20
40
60
80
100
A pharmacy contactedour office to clarify orcorrect a prescription
A patient was unableto get an appointmentwithin 48 hours for anacuteserious problem
A patients medicationlist was not updatedduring his or her visit
The results from a labor imaging test were notavailable when needed
A patients chartmedicalrecord was not available
when needed
Occurred DailyWeekly
Occurred Monthly
Occurred Not at All to Several Times Over the Past Year
Importance Most health care takes place in the outpatient or ambulatory care setting Lack
of access to care and lack of access to timely and accurate medical information and test
results may contribute to patient safety events such as missed or delayed diagnoses
medication errors failure to order appropriate diagnostic or laboratory tests incorrect
interpretation of tests and inadequate followup on results
Overall Percentage
Almost 30 of medical offices participating in the survey reported daily or weekly
occurrences of being contacted by the pharmacist for clarification or correction on a
prescription
After prescription clarifications or corrections by the pharmacy medical offices were
next most likely to report daily or weekly issues with patients being unable to get an
appointment within 48 hours for an acute or serious problem (14) or the patientrsquos
medication list not getting updated during their visit (11)
The share of medical offices reporting that lab or imaging tests were not available when
needed reached nearly 20 when considering monthly occurrences as well as those that
occurred more frequently
32 | National Healthcare Quality and Disparities Report
Patient Safety
Potentially Inappropriate Prescriptions for Older Adults
Adults age 65 years and over who received potentially inappropriate prescription medications during the calendar year by sex and
perceived health status 2003ndash2013
Source Agency for Healthcare Research and Quality Medical Expenditure Panel Survey 2003-2013
Note For this measure lower percentages are better Prescription medications received include all prescribed medications initiall y purchased
or otherwise obtained as well as any refills For more information on inappropriate medications see the American Geriatrics Society 2012 Beers
Criteria Update Expert Panel American Geriatrics Society updated Beers Criteria for potentially inappropriate medication use in older adults J
Am Geriatr Soc 2012 Apr60(4)616-31
0
5
10
15
20
25
30
Per
cen
t
Total Male Female
0
5
10
15
20
25
30
Per
cen
t
ExcellentVery GoodGood FairPoor
Adults age 65 years and over who received potentially inappropriate prescription medications during the calendar year by sex and
perceived health status 2003ndash2013
Source Agency for Healthcare Research and Quality Medical Expenditure Panel Survey 2003-2013
Note For this measure lower percentages are better Prescription medications received include all prescribed medications initially purchased
or otherwise obtained as well as any refills For more information on inappropriate medications see the American Geriatrics Society 2012 Beers
Criteria Update Expert Panel American Geriatrics Society updated Beers Criteria for potentially inappropriate medication use in older adults J
Am Geriatr Soc 2012 Apr60(4)616-31
0
5
10
15
20
25
30
Per
cen
t
Total Male Female
0
5
10
15
20
25
30
Per
cen
t
ExcellentVery GoodGood FairPoor
Importance Some drugs that are prescribed for older patients are known to be potentially
harmful for this age group
Overall Percentage In 2013 the percentage of adults age 65 years and over who received
potentially inappropriate prescription medications was 114
Trends From 2003 to 2013 the percentage of adults age 65 years and over who received
potentially inappropriate prescription medications improved overall for both sexes and for
people with excellentvery goodgood health status and people with fairpoor health status
Groups With Disparities
In all years the percentage of patients receiving potentially inappropriate medications
was higher among females compared with males This gap was not changing over time
In all years from 2003 to 2013 the percentage of patients receiving potentially
inappropriate medications was higher among people with fairpoor health status
compared with people with excellentgood health status This gap was not changing over
time
National Healthcare Quality and Disparities Report | 33
Patient Safety
Long-Term Catheter Use in Dialysis Patients
HI
AKAK
AZ
CA
UT
CT
FL
GA
IA
IL
KS
MA
MDMO
NJ
NY
OR
PA
SC
TN
CO
WA
WI
VA
ME
MN
MI
NC
TX
KY
WV
RI
NE
VT
NV OH
SD
AR
IN
NH
MT
ID
WY
ND
NMOK
LA
MSAL
DE
DC
10-12
13-18
7-9
PR
Source Centers for Medicare and Medicaid Services Dialysis Facility Compare 2014
Denominator At-risk adult Medicare patients with a central venous catheter who were receiving regular hemodialysis treatments at dialysis
facilities
Note For this measure lower percentages are better
Percentage of hemodialysis patients with central venous catheters used for vascular access for 90 days or longer by State 2014
HI
AKAK
AZ
CA
UT
CT
FL
GA
IA
IL
KS
MA
MDMO
NJ
NY
OR
PA
SC
TN
CO
WA
WI
VA
ME
MN
MI
NC
TX
KY
WV
RI
NE
VT
NV OH
SD
AR
IN
NH
MT
ID
WY
ND
NMOK
LA
MSAL
DE
DC
10-12
13-18
7-9
PR
Source Centers for Medicare and Medicaid Services Dialysis Facility Compare 2014
Denominator At-risk adult Medicare patients with a central venous catheter who were receiving regular hemodialysis treatments at dialysis
facilities
Note For this measure lower percentages are better
Percentage of hemodialysis patients with central venous catheters used for vascular access for 90 days or longer by State 2014
Importance Central venous catheters are frequently used for vascular access to dialysis
patients until a fistula or graft is formed Central venous catheters have higher rates of
infection and adverse events among patients receiving dialysis treatment compared with
other forms of vascular access To decrease the likelihood of adverse events catheters should
be used for less than 90 days
Overall Percentage Nationally an average of 10 of dialysis patients used central venous
catheters for 90 days or longer in 2014
Geographic Variation In 2014 Alabama and Kansas had the lowest percentages of dialysis
patients using central venous catheters for 90 days or longer (7) and Puerto Rico had the
highest percentage (18) of long-term catheter use
Patient Safety Infrastructure
Efforts to improve patient safety have been accompanied by various infrastructure
enhancements
Growth in patient safety organizations which assist providers in detecting and reducing
risks and hazards from care delivery that may lead to patient harm
System improvement initiatives at the Veterans Health Administration (VHA)
34 | National Healthcare Quality and Disparities Report
Patient Safety
Development of the National Practitioner Data Bank a clearinghouse for information on
medical malpractice payments
Patient Safety Organizations
Patient safety organizations (PSOs) aim to reduce preventable adverse events near misses
and unsafe conditions in all health care settings
PSOs provide an environment for health care providers to voluntarily report discuss and
learn from patient safety events and quality analyses on a privileged and confidential basis
Measures include
Number of PSOs serving each State
Variation in concentrations of compounded liquid medications for children
Patient Safety Organizations AHRQ Common Formats
AHRQ Common Formats provide a standardized method for PSOs health care providers
and other organizations to collect and report patient safety events
Data element standards are important for aggregating and analyzing events across
providers
AHRQ Common Formats have been developed for a variety of settings of care
Acute care hospitals
Skilled nursing facilities
Retail pharmacy
More information is available at httpspsoahrqgovcommon
National Healthcare Quality and Disparities Report | 35
Patient Safety
Number of Patient Safety Organizations
AZ (2)
CA (3)
UT (2)
CT(3)
FL (8)
GA (5)
IA (4)
IL (7)
KS (5)
MA(3)
MD (4)MO(2)
NJ(3)
NY (5)
OR (3)
PA (5)
SC (4)
TN (5)
CO (2)
WA (2)
WI (5)
VA (7)
ME(2)
MN(3)
MI (3)
NC (7)
TX (6)
KY (4)WV (3)
RI(2)
NE (2)
VT(2)
NV (2)
OH (2)
SD (1)
AR (4)
IN (2)
NH(2)
MT (2)
ID (3)
WY (2)
ND (1)
NM (3)OK (2)
LA (1)
MS (2)
AL (2)
DE(2)
HI (2)
AKAK (2)
DC(3)
PR (0)
1-2
3-4
5-6
7-8
Number of PSOs
excluding PSOs
operating nationally
Number of Patient Safety Organizations by area served 2014
Source Agency for Healthcare Research and Quality Patient Safety Organization Information Form Calendar Year 2014 and PSO-PPC
Contact Database
Note PSOs included in this map were AHRQ-listed during any part of 2014 and submitted the PSO Profile to the PSO Privacy Protection
Center (PSO-PPC) in early 2015 A PSO may have members in one or more States regardless of headquarters location Each State shows the
number of PSOs that serve that State map excludes 38 PSOs that are available to providers in all States
AZ (2)
CA (3)
UT (2)
CT(3)
FL (8)
GA (5)
IA (4)
IL (7)
KS (5)
MA(3)
MD (4)MO(2)
NJ(3)
NY (5)
OR (3)
PA (5)
SC (4)
TN (5)
CO (2)
WA (2)
WI (5)
VA (7)
ME(2)
MN(3)
MI (3)
NC (7)
TX (6)
KY (4)WV (3)
RI(2)
NE (2)
VT(2)
NV (2)
OH (2)
SD (1)
AR (4)
IN (2)
NH(2)
MT (2)
ID (3)
WY (2)
ND (1)
NM (3)OK (2)
LA (1)
MS (2)
AL (2)
DE(2)
HI (2)
AKAK (2)
DC(3)
PR (0)
1-2
3-4
5-6
7-8
Number of PSOs
excluding PSOs
operating nationally
Number of Patient Safety Organizations by area served 2014
Source Agency for Healthcare Research and Quality Patient Safety Organization Information Form Calendar Year 2014 and PSO-PPC
Contact Database
Note PSOs included in this map were AHRQ-listed during any part of 2014 and submitted the PSO Profile to the PSO Privacy Protection
Center (PSO-PPC) in early 2015 A PSO may have members in one or more States regardless of headquarters location Each State shows the
number of PSOs that serve that State map excludes 38 PSOs that are available to providers in all States
Importance All patient safety organizations (PSOs) have authority to operate in all 50
States and US territories but not all do In 2014 38 PSOs self-reported being available to
providers nationally PSOs not available nationally serve specific States
Geographic Variation
Nearly all States have at least 2 PSOs available to providers in their State in addition to
the 38 national PSOs that serve all States
Florida has the most PSOs available with 8 in addition to the 38 nationally available
PSOs The States with the largest number of PSOs available are generally on the East
Coast (eg North Carolina Virginia New York Pennsylvania Tennessee Georgia) or
have large populations (eg Texas Illinois)
North Dakota South Dakota and Louisiana are the only states with just one PSO serving
their State in addition to the 38 national PSOs
Puerto Rico is served by one national PSO only
36 | National Healthcare Quality and Disparities Report
Patient Safety
Compounded Liquid Medications for Children
Compounded liquid medications for children in Michigan 2012
Source Levy S Buckley B Safe Table Success The MI Pediatric Safety Collaboration Presentation presented at the 7th Annual
Meeting of Patient Safety Organizations (PSOs) Rockville MD 2015 April and Rood JM Engels MJ Ciarkowski SL et al Variability in
compounding of oral liquids for pediatric patients a patient safety concern J Am Pharm Assn 201454(4)383-9
Note Information represents 244 responses to online survey of approximately 2000 Michigan pharmacies conducted in June 2012 by
The University of Michigan College of Pharmacy in collaboration with the Michigan Pharmacists Association
0
10
20
30
40
50
1 2 3 4 5 6 7 8 9
Nu
mb
er o
f D
rugs
Number of Unique Concentrations
Number of Different Compounded Concentrations per Drug
0
10
20
30
40
50
No Harm No Harm ButMonitoring
TemporaryHarm
Pe
rce
nt
Compounding Errors by Related Harm and Pharmacy Setting
Inpatient Outpatient
Compounded liquid medications for children in Michigan 2012
Source Levy S Buckley B Safe Table Success The MI Pediatric Safety Collaboration Presentation presented at the 7th Annual
Meeting of Patient Safety Organizations (PSOs) Rockville MD 2015 April and Rood JM Engels MJ Ciarkowski SL et al Variability in
compounding of oral liquids for pediatric patients a patient safety concern J Am Pharm Assn 201454(4)383-9
Note Information represents 244 responses to online survey of approximately 2000 Michigan pharmacies conducted in June 2012 by
The University of Michigan College of Pharmacy in collaboration with the Michigan Pharmacists Association
0
10
20
30
40
50
1 2 3 4 5 6 7 8 9
Nu
mb
er o
f D
rugs
Number of Unique Concentrations
Number of Different Compounded Concentrations per Drug
0
10
20
30
40
50
No Harm No Harm ButMonitoring
TemporaryHarm
Per
cen
t
Compounding Errors by Related Harm and Pharmacy Setting
Inpatient Outpatient
Importance
Liquid medications are widely used in pediatrics because many children find it difficult
to swallow tablets or capsules If not commercially manufactured these liquid
medications require a pharmacist to compound them to the correct dosage for the patient
This practice of compounding has led to a variety of medication concentrations in use In
the absence of standard concentrations for compounded medications there is a risk that
children may accidentally receive medications that are too potent and can be dangerous
or are too weak to be effective
The Michigan Health amp Hospital Association Keystone Center Patient Safety
Organization hosts five Pediatric Safe Tables each year Safe Tables provided a
confidential and legally protected environment to discuss challenges and improvement
strategies regarding inconsistent medication concentrations for compounded oral liquids
without fear of punitive action against them
National Healthcare Quality and Disparities Report | 37
Patient Safety
Overall Percentage
More than half (527) of drugs identified in the 2012 survey had 3 or more unique
concentrations dispensed to children across Michigan For example Rifampin used to
treat bacterial infections was reported to have 8 different concentrations dispensed to
patients
Nearly one-third (313) of reported errors caused temporary harm or required additional
monitoring despite no harm
Standardization of Compounded Liquid Medications
Source Michigan Health amp Hospital Association Keystone Center Patient Safety Organization and University of Michigan College of Pharmacy
State-Wide Initiative to Standardize the Compounding of Oral Liquids in Pediatrics
Standardization of compounded liquid medications for children in Michigan 2011
Issue identificationbull Hospitals attending PSO Pediatrics Safe
Table raise compounded medication concentrations as a major safety issue
bull Small focus group determines extent of problem
bull Michigan pharmacies are surveyed about baseline concentrations
Develop Interventionbull PSO Quarterly Safe Tables are held to
discuss cases and practicesbull Team develops recommendations for
standard concentrationsbull Consensus is achieved for frequently
compounded pediatric medications 470 formulations for 147 drug entities are reduced to 104 concentrations for 100 drugs
Practice changebull Toolkit is createdbull Standards are disseminated to Michigan
prescribers and pharmacies bull Standards are disseminated to PSO
members and Safe Table participants
Source Michigan Health amp Hospital Association Keystone Center Patient Safety Organization and University of Michigan College of Pharmacy
State-Wide Initiative to Standardize the Compounding of Oral Liquids in Pediatrics
Standardization of compounded liquid medications for children in Michigan 2011
Issue identificationbull Hospitals attending PSO Pediatrics Safe
Table raise compounded medication concentrations as a major safety issue
bull Small focus group determines extent of problem
bull Michigan pharmacies are surveyed about baseline concentrations
Develop Interventionbull PSO Quarterly Safe Tables are held to
discuss cases and practicesbull Team develops recommendations for
standard concentrationsbull Consensus is achieved for frequently
compounded pediatric medications 470 formulations for 147 drug entities are reduced to 104 concentrations for 100 drugs
Practice changebull Toolkit is createdbull Standards are disseminated to Michigan
prescribers and pharmacies bull Standards are disseminated to PSO
members and Safe Table participants
The Role of PSO Safe Tables Based on adverse medication events discussed in the
Michigan Health amp Hospital Association (MHA) Keystone Center Patient Safety
Organization (PSO) Safe Tables in July 2011 the Michigan Pediatric Safety Collaboration
was developed to further assess the scope of the problem and formulate a solution
The Collaborative The Michigan Pediatric Safety Collaboration includes individuals from
the University of Michigan College of Pharmacy the Michigan Pharmacists Association
(MPA) the Food and Drug Administration (FDA) and the MHA Keystone PSO
38 | National Healthcare Quality and Disparities Report
Patient Safety
Practice Change
As a result of the standardization effort 470 unique formulations for 147 drug entities
were reduced to 104 different concentrations for 100 drugs
The Michigan Pediatric Safety Collaboration developed a multistep process to implement
standards for compounding medications The MPA surveyed pharmacies in Michigan to
better define the nature and scope of the problem The PSO continued to act as convener
The result was the creation and dissemination of statewide standards for 120 frequently
compounded pediatric medications
Veterans Health Administration
The National Center for Patient Safety is part of the Veterans Health Administration the
Nationrsquos largest integrated health care system
Patient safety-related system improvement initiatives include
The Daily Planreg
Purchasing for Safety Initiative
Patient Safety Improvement Initiative
Patient safety improvement initiative The Daily Planreg at Veterans Affairs Medical Centers 2009
Source King BJ Mills PD Fore A et al The Daily Planreg including patients for safetys sake Nurs Manage 201243(3)15-8
0
10
20
30
40
50
Identified atleast one
error
Identifiederror
of omission
Identifiederror
ofcommission
Nurses Who Identified Errors in Patient Treatment Plan by Type
0
10
20
30
40
50
Patient founddiscrepancy inplanned care
Family founddiscrepancy inplanned care
Nursing Stafffound
discrepancyin plannedtreatment
Respondents Who Identified Errors or Discrepancies Through The Daily Plan reg
Patient safety improvement initiative The Daily Planreg at Veterans Affairs Medical Centers 2009
Source King BJ Mills PD Fore A et al The Daily Planreg including patients for safetys sake Nurs Manage 201243(3)15-8
0
10
20
30
40
50
Identified atleast one
error
Identifiederror
of omission
Identifiederror
ofcommission
Nurses Who Identified Errors in Patient Treatment Plan by Type
0
10
20
30
40
50
Patient founddiscrepancy inplanned care
Family founddiscrepancy inplanned care
Nursing Stafffound
discrepancyin plannedtreatment
Respondents Who Identified Errors or Discrepancies Through The Daily Plan reg
National Healthcare Quality and Disparities Report | 39
Patient Safety
Importance The Daily Planreg
is a two-page printed summary that acts as a schedule for
patients and providers each day It shows the procedures laboratory tests and medications
scheduled for that day and lists essential health information such as patientrsquos name allergies
and current medications It can be tailored for a patientrsquos needs by extracting orders from the
electronic medical record (EMR) The Daily Planreg
is intended to facilitate patient and family
engagement throughout the course of care The Daily Planreg
shows promise for improving
patient safety Since 2009 the VA has implemented The Daily Planreg
in more than 65
hospitals both inpatient and outpatient care settings The Daily Planreg
is shared more than
75000 times a month and the VA plans to continue the spread of The Daily Planreg
at
additional sites in 2016
Findings
As part of a pilot test in 2009 a total of 198 patients and 85 nurses responded to a survey
across 10 facilities Nurses had an average of 34 patients per shift who received The
Daily Planreg Patients responded about their own experiences whereas nurses reported
about all of their patients who received The Daily Planreg
Nearly half (475) of patients reported finding a discrepancy in planned care through
The Daily Planreg In addition 30 of patients reported that their family members found a
discrepancy Although not every discrepancy will be a potential medical error having a
shared understanding of the plan of care decreases the risk of error
More than one in six nurses (176) identified a discrepancy in treatment among their
patients through The Daily Planreg Most of these nurses (153) found one or more errors
of omission and a smaller share (106) of nurses found one or more errors of
commission some found both
40 | National Healthcare Quality and Disparities Report
Patient Safety
Issues Related to Ventilators
Common use-issues related to ventilators at the Veterans Health Administration 2006-2014 (combined)
Source Veterans Health Administration National Center for Patient Safety data collected October 2006 to October 2014
Note Examples of equipment failures include ventilator shutdown and other ventilator problems Ventilator settings include setup problems and
incorrect settings Support activities include space utilities and supplies Transport includes accidental extubation other transportation issues
and vehicle-related issues Alarms include alarm settings and alarm connection Training includes unknown ventilator model and other training
concerns
0
20
40
60
80
100
120
140
160
EquipmentFailure
VentilatorSettings
SupportActivities
Transport Alarms Training
Nu
mb
er o
f R
epo
rts
Common use-issues related to ventilators at the Veterans Health Administration 2006-2014 (combined)
Source Veterans Health Administration National Center for Patient Safety data collected October 2006 to October 2014
Note Examples of equipment failures include ventilator shutdown and other ventilator problems Ventilator settings include setup problems and
incorrect settings Support activities include space utilities and supplies Transport includes accidental extubation other transportation issues
and vehicle-related issues Alarms include alarm settings and alarm connection Training includes unknown ventilator model and other training
concerns
0
20
40
60
80
100
120
140
160
EquipmentFailure
VentilatorSettings
SupportActivities
Transport Alarms Training
Nu
mb
er o
f R
epo
rts
Importance Beginning with a focus on ventilators the Veterans Health Administrationrsquos
human factors-based Purchasing for Safety Initiative communicates the most common use-
issues associated with medical devices in order to ultimately remove or contain identified
vulnerabilities and prevent further harm
Event Reporting Patient safety managers report events and close calls from more than 150
VA facilities to a national database The largest number of use issues related to ventilators
involved equipment failure and issues such as spontaneous ventilator shutdown compressor
failure and broken or missing parts Other categories of ventilator use issues involved the
physical space where the ventilator was used challenges of transporting patients on
ventilators and problems with ventilator settings and alarms Root cause analyses on reports
are conducted and Patient Safety Alerts are issued to share the learning internally
Other Key Components
Data on ventilator issues from the VA and the Food and Drug Administrationrsquos Medical
Product Safety Network are the basis for a ldquogovernment-industry dayrdquo to work with
manufacturers This information is used to help the device manufacturers better
understand the limits of human use of their products
National Healthcare Quality and Disparities Report | 41
Patient Safety
The VA also trains noncliniciansmdashsuch as biomedical engineers across the
organizationmdashto understand the devices consider the situation for their use and identify
what can go wrong (ldquofailure modesrdquo) in advance
The VA encourages discussions among clinicians about their experience in using devices
In the Applied Patient Safety Challenge hundreds of staff participate in brainstorming
about solutions and strategies for dealing with unexpected scenarios involving devices
National Practitioner Data Bank
Medical malpractice actions are one way to flag potential medical errors
Medical Malpractice Payment Reports are submitted to the National Practitioner Data Bank
by medical malpractice payers
Report of a monetary exchange made for the benefit of a physician dentist or other
health care provider
Result of a settlement or judgment of a written complaint or claim based on that
providerrsquos delivery of or failure to deliver health care services
Number of Medical Malpractice Payment Reports by Setting
Number of Medical Malpractice Payment Reports by health care setting 2004-2014
Source National Practitioner Data Bank (NPDB) Public Use Data File Health Resources and Services Administration Bureau of Health
Professions Division of Practitioner Data Banks 2004-2014
Note Health care setting was not collected by the NPDB for 2104 reports in 2004 ldquoOtherrdquo includes Medical Malpractice Payment Reports
related to unknown settings as well as those for a combination of inpatient and outpatient settings Reports pertain to patients of any age
0
2000
4000
6000
8000
10000
12000
14000
16000
18000
20000
2004 2005 2006 2007 2008 2009 2010 2011 2012 2013 2014
Nu
mb
er o
f R
epo
rts
Total Inpatient Outpatient Other
Number of Medical Malpractice Payment Reports by health care setting 2004-2014
Source National Practitioner Data Bank (NPDB) Public Use Data File Health Resources and Services Administration Bureau of Health
Professions Division of Practitioner Data Banks 2004-2014
Note Health care setting was not collected by the NPDB for 2104 reports in 2004 ldquoOtherrdquo includes Medical Malpractice Payment Reports
related to unknown settings as well as those for a combination of inpatient and outpatient settings Reports pertain to patients of any age
0
2000
4000
6000
8000
10000
12000
14000
16000
18000
20000
2004 2005 2006 2007 2008 2009 2010 2011 2012 2013 2014
Nu
mb
er o
f R
epo
rts
Total Inpatient Outpatient Other
42 | National Healthcare Quality and Disparities Report
Patient Safety
Trends The total number of medical malpractice payment reports (MMPRs) per year
decreased from 17641 in 2004 to 12699 in 2014
Variation Across Reports
Of 157022 MMPRs from 2004 through 2014 more reports related to care in the
outpatient setting (71937) than in the inpatient setting (60391)
Diagnosis-related and treatment-related payments were the most frequent types of
reports each accounting for about 27 of cases Reports of payments for medication-
related cases accounted for only 5 of MMPRs (data not shown)
Number of Medical Malpractice Payment Reports by Allegation and Harm
Number of Medical Malpractice Payment Reports by type of allegation and harm severity 2004-2014
Key Temporary injury = Minor temporary injury and Major temporary injury Permanent significant injury = Significant Permanent Injury
Major Permanent Injury Quadriplegia Brain Damage Lifelong care
Source National Practitioner Data Bank Public Use Data File Health Resources and Services Administration Bureau of Health Professions
Division of Practitioner Data Banks 2004-2014
Note Reports pertain to patients of any age
0
20
40
60
80
100
Treatment(n=42913)
Diagnosis(n=42507)
Surgery(n=36845)
Obstetrics(n=10555)
Medication(n=8287)
Monitoring(n=5329)
Anesthesia(n=4276)
Equipment(n=1161)
BehavioralHealth
(n=879)
Blood(n=379)
EmotionalInjury Only
InsignificantInjury
TemporaryInjury
PermanentMinor Injury
PermanentSignificant Injury
Death Unknown
Number of Medical Malpractice Payment Reports by type of allegation and harm severity 2004-2014
Key Temporary injury = Minor temporary injury and Major temporary injury Permanent significant injury = Significant Permanent Injury
Major Permanent Injury Quadriplegia Brain Damage Lifelong care
Source National Practitioner Data Bank Public Use Data File Health Resources and Services Administration Bureau of Health Professions
Division of Practitioner Data Banks 2004-2014
Note Reports pertain to patients of any age
0
20
40
60
80
100
Treatment(n=42913)
Diagnosis(n=42507)
Surgery(n=36845)
Obstetrics(n=10555)
Medication(n=8287)
Monitoring(n=5329)
Anesthesia(n=4276)
Equipment(n=1161)
BehavioralHealth
(n=879)
Blood(n=379)
EmotionalInjury Only
InsignificantInjury
TemporaryInjury
PermanentMinor Injury
PermanentSignificant Injury
Death Unknown
Overall Percentage From 2004 to 2014 medical malpractice payments were made for
allegations related to
Treatment (42913)
Diagnosis (42507)
Surgery (36845)
Obstetrics (10555)
Medication (8287)
Monitoring (5329)
National Healthcare Quality and Disparities Report | 43
Patient Safety
Anesthesia (4276)
Equipment or products (1161)
Behavioral health (879) and
IV and blood products (379)
Variation Across Reports
Death accounted for more than one-third of harm in payments related to monitoring
(499) diagnosis (393) medication (383) and anesthesia (363) allegations
More than half of all obstetric payments were for allegations of permanent severe harm
(570)
Temporary harm accounted for more than one-third of payments related to equipment
(485) and surgery (360)
Most of the behavioral health-related payments were for emotional harm (457) or
death (338)
References
Agency for Healthcare Research and Quality Making Health Care Safer II An Updated Critical Analysis of the
Evidence for Patient Safety Practices Comparative Effectiveness Review No 211 Rockville MD Agency for
Healthcare Research and Quality March 2013 AHRQ Publication No 13-E001-EF
httpwwwahrqgovsitesdefaultfileswysiwygresearchfindingsevidence-basedshy
reportsservicesqualityptsafetyII-fullpdf
Arriaga AF Lancaster RT Berry RW et al The better colectomy project association of evidence-based best-
practice adherence rates to outcomes in colorectal surgery Ann Surg 2009 Oct250(4)507-13
httpwwwncbinlmnihgovpubmed19734778
Centers for Disease Control and Prevention HAI Prevalence Survey
httpwwwcdcgovHAIsurveillanceindexhtml Last updated March 2016 Accessed March 4 2016
Centers for Disease Control and Prevention Nursing Homes and Assisted Living (Long-Term Care Facilities)
httpwwwcdcgovlongtermcare Last updated September 2015 Accessed March 4 2016
Chassin MR Loeb JM High-reliability health care getting there from here Milbank Q 201391(3)459-90
httpwwwncbinlmnihgovpmcarticlesPMC3790522 Accessed September 23 2015
Chiu Y Bero L Hessol NA et al A literature review of clinical outcomes associated with antipsychotic medication
use in North American nursing home residents Health Policy 2015 Jun119(6)802-813 Epub 2015 Feb 28 PMID
25791166 httpwwwsciencedirectcomsciencearticlepiiS0168851015000652 Accessed June 17 2015
Huybrechts KF Gerhard Crystal S et al Differential risk of death in older residents in nursing homes prescribed
specific antipsychotic drugs Population based cohort study BMJ 2012 Feb 23344e977 PMID 22362541
httpwwwncbinlmnihgovpmcarticlesPMC3285717 Accessed June 17 2015
Institute of Medicine Preventing Medication Errors Quality Chasm Series 2007
httpwwwnapeducatalog11623preventing-medication-errors-quality-chasm-series
National Association for Home Care amp Hospice Basic Statistics About Home Care Updated 2010
httpwwwnahcorgassets1710hc_statspdf Accessed August 31 2015
44 | National Healthcare Quality and Disparities Report
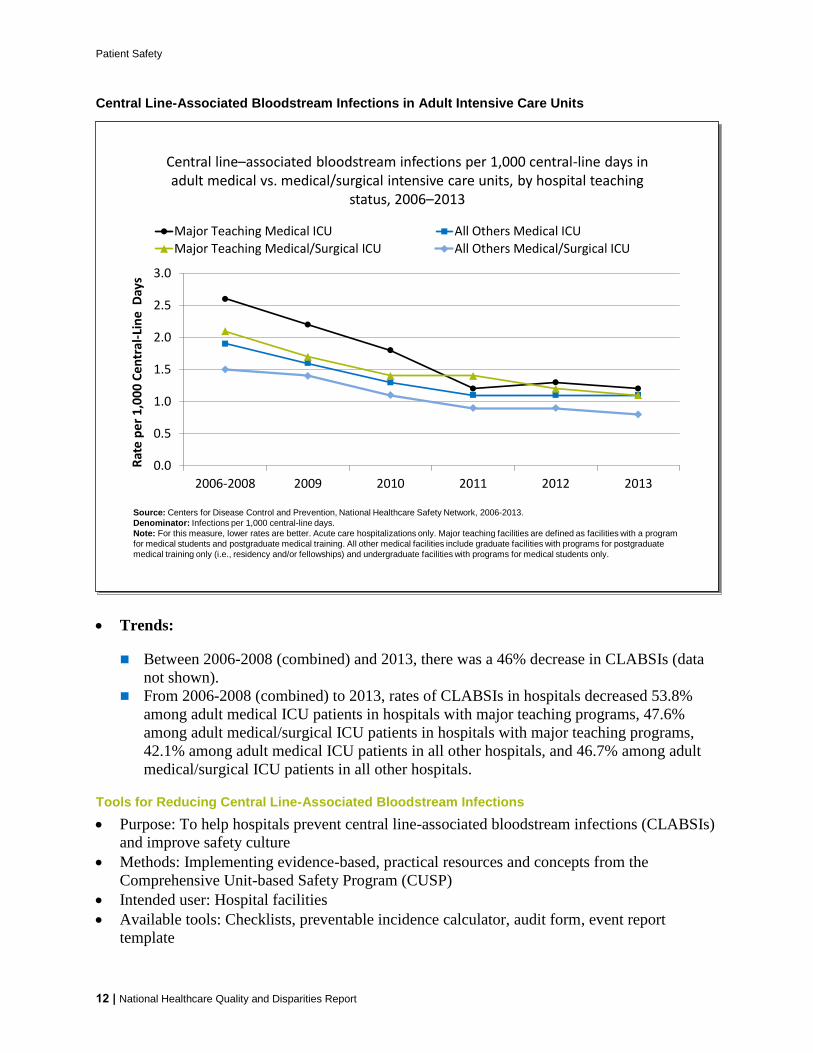
Patient Safety
Central Line-Associated Bloodstream Infections in Adult Intensive Care Units
Central linendashassociated bloodstream infections per 1000 central-line days in adult medical vs medicalsurgical intensive care units by hospital teaching
status 2006ndash2013
Source Centers for Disease Control and Prevention National Healthcare Safety Network 2006-2013
Denominator Infections per 1000 central-line days
Note For this measure lower rates are better Acute care hospitalizations only Major teaching facilities are defined as facilities with a program
for medical students and postgraduate medical training All other medical facilities include graduate facilities with programs for postgraduate
medical training only (ie residency andor fellowships) and undergraduate facilities with programs for medical students only
00
05
10
15
20
25
30
2006-2008 2009 2010 2011 2012 2013
Rat
e p
er
10
00
Ce
ntr
al-L
ine
Day
s
Major Teaching Medical ICU All Others Medical ICU
Major Teaching MedicalSurgical ICU All Others MedicalSurgical ICU
Central linendashassociated bloodstream infections per 1000 central-line days in adult medical vs medicalsurgical intensive care units by hospital teaching
status 2006ndash2013
Source Centers for Disease Control and Prevention National Healthcare Safety Network 2006-2013
Denominator Infections per 1000 central-line days
Note For this measure lower rates are better Acute care hospitalizations only Major teaching facilities are defined as facilities with a program
for medical students and postgraduate medical training All other medical facilities include graduate facilities with programs for postgraduate
medical training only (ie residency andor fellowships) and undergraduate facilities with programs for medical students only
00
05
10
15
20
25
30
2006-2008 2009 2010 2011 2012 2013
Rat
e p
er
10
00
Ce
ntr
al-L
ine
Day
s
Major Teaching Medical ICU All Others Medical ICU
Major Teaching MedicalSurgical ICU All Others MedicalSurgical ICU
Trends
Between 2006-2008 (combined) and 2013 there was a 46 decrease in CLABSIs (data
not shown)
From 2006-2008 (combined) to 2013 rates of CLABSIs in hospitals decreased 538
among adult medical ICU patients in hospitals with major teaching programs 476
among adult medicalsurgical ICU patients in hospitals with major teaching programs
421 among adult medical ICU patients in all other hospitals and 467 among adult
medicalsurgical ICU patients in all other hospitals
Tools for Reducing Central Line-Associated Bloodstream Infections
Purpose To help hospitals prevent central line-associated bloodstream infections (CLABSIs)
and improve safety culture
Methods Implementing evidence-based practical resources and concepts from the
Comprehensive Unit-based Safety Program (CUSP)
Intended user Hospital facilities
Available tools Checklists preventable incidence calculator audit form event report
template
12 | National Healthcare Quality and Disparities Report
Patient Safety
Impact
Through use of the CUSP toolkit and CLABSI tools more than 100 intensive care units
in Michigan have nearly eliminated CLABSIs
Nationwide the use of this toolkit has helped more than 1000 hospitals reduce rates of
CLABSI by 41 in aggregate See httpwwwahrqgovworkingforqualitypias
mhhakcpiahtm and httpwwwahrqgovprofessionalseducationcurriculumshy
toolsclabsitoolsindexhtmlpurpose
Procedure-Related Events
More than 40 million operative procedures are performed in the United States each year
Postoperative adverse events are not uncommon and increase both hospitalization length and
cost (AHRQ 2013)
Measures include
Risk-adjusted mortality at 30 days postoperation for colorectal surgery performed in
adults
Percentage of adult patients receiving hip joint replacement (because of fracture or
degenerative conditions) who experienced adverse events
Percentage of adults with mechanical adverse events associated with central venous
catheter placement
Postoperative Mortality
Risk-adjusted mortality rate within 30 days postoperation for adults undergoing colorectal surgery in ACS NSQIP participating hospitals in the United States by
raceethnicity and hospital teaching status 2008-2014
0
1
2
3
4
5
6
Pe
rce
nt
Teaching Nonteaching
Source American College of Surgeons (ACS) National Surgical Quality Improvement Program (NSQIP) 2008-2014
Denominator Adults age 18 years and over
Note For this measure lower percentages are better The participation in the ACS NSQIP is voluntary and current participation is weighted
when calculating rates Participating hospitals have changed over time 203 hospitals participated in 2008 and 531 hospitals participated in
2014 Other includes Asian American Indian or Alaska Native and Native Hawaiian or Other Pacific Islander White Black and Other are non-
Hispanic Hispanic includes all races
0
1
2
3
4
5
6
Pe
rce
nt
Total White Black Hispanic Other
Risk-adjusted mortality rate within 30 days postoperation for adults undergoing colorectal surgery in ACS NSQIP participating hospitals in the United States by
raceethnicity and hospital teaching status 2008-2014
0
1
2
3
4
5
6
Pe
rce
nt
Teaching Nonteaching
Source American College of Surgeons (ACS) National Surgical Quality Improvement Program (NSQIP) 2008-2014
Denominator Adults age 18 years and over
Note For this measure lower percentages are better The participation in the ACS NSQIP is voluntary and current participation is weighted
when calculating rates Participating hospitals have changed over time 203 hospitals participated in 2008 and 531 hospitals participated in
2014 Other includes Asian American Indian or Alaska Native and Native Hawaiian or Other Pacific Islander White Black and Other are non-
Hispanic Hispanic includes all races
0
1
2
3
4
5
6
Pe
rce
nt
Total White Black Hispanic Other
National Healthcare Quality and Disparities Report | 13
Patient Safety
Importance Colorectal procedures have high rates of postoperative complications
Nonadherence to evidence-based best practices is associated with an increased risk of these
complications (Arriaga et al 2009)
Overall Rate In 2014 the risk-adjusted mortality rate was 31 among patients undergoing
colorectal surgeries at ACS NSQIP participating hospitals
Trends From 2008 to 2014 30-day postoperative mortality after colorectal surgery
improved
Groups With Disparities
In 2014 the percentage of patients with 30-day postoperative mortality was worse for
Blacks (36) compared with Whites (30)
From 2008 to 2014 there were no statistically significant changes in the gap between
minority groups and Whites in the percentage of patients with 30-day postoperative
mortality
Adverse Events After Hip Joint Replacement
Adult patients receiving hip joint replacement due to fracture or degenerative conditions who experienced adverse events by age and chronic obstructive
pulmonary disease 2009-2013
02468
101214161820
2009 2010 2011 2012 2013
Pe
rce
nt
Total 65-74 75-84 85+
02468
101214161820
2009 2010 2011 2012 2013
Pe
rce
nt
COPD No COPD
Key COPD = chronic obstructive pulmonary disease
Source Agency for Healthcare Research and Quality (AHRQ) and Centers for Medicare amp Medicaid Services (CMS) Medicare Patient Safety
Monitoring System (MPSMS) 2009-2013
Denominator All patients age 18 years and over in the MPSMS sample who had a surgical procedure performed to replace a hip joint due to
degenerative conditions or a fractured hip
Note For this measure lower percentages are better Hospitals in Puerto Rico the Virgin Islands and Maryland were not included in the
annual samples Samples were drawn from the CMS Hospital Inpatient Quality Reporting program and consist of medical records for
discharges following hip arthroplasty procedures as defined by the Surgical Care Improvement Project Rates for patients age 85 years and
over in 2013 and for ages 18-64 years old for all years are not shown because the data did not meet the criteria for statistical reliability data
quality or confidentiality COPD status relates to patients with a principal or secondary discharge diagnosis of COPD
Adult patients receiving hip joint replacement due to fracture or degenerative conditions who experienced adverse events by age and chronic obstructive
pulmonary disease 2009-2013
02468
101214161820
2009 2010 2011 2012 2013
Pe
rce
nt
Total 65-74 75-84 85+
02
4
68
10
12
1416
18
20
2009 2010 2011 2012 2013
Pe
rce
nt
COPD No COPD
Key COPD = chronic obstructive pulmonary disease
Source Agency for Healthcare Research and Quality (AHRQ) and Centers for Medicare amp Medicaid Services (CMS) Medicare Patient Safety
Monitoring System (MPSMS) 2009-2013
Denominator All patients age 18 years and over in the MPSMS sample who had a surgical procedure performed to replace a hip joint due to
degenerative conditions or a fractured hip
Note For this measure lower percentages are better Hospitals in Puerto Rico the Virgin Islands and Maryland were not included in the
annual samples Samples were drawn from the CMS Hospital Inpatient Quality Reporting program and consist of medical records for
discharges following hip arthroplasty procedures as defined by the Surgical Care Improvement Project Rates for patients age 85 years and
over in 2013 and for ages 18-64 years old for all years are not shown because the data did not meet the criteria for statistical reliability data
quality or confidentiality COPD status relates to patients with a principal or secondary discharge diagnosis of COPD
Importance Hip replacement is most common among older adults who have an increased
risk of adverse events after these surgeries
14 | National Healthcare Quality and Disparities Report
Patient Safety
Overall Percentage In 2013 49 of patients receiving a hip joint replacement experienced
an adverse event
Trends From 2009 to 2013 the overall percentage of adverse events improved for patients
who had a hip joint replacement due to fracture or degenerative conditions
Groups With Disparities
In 2013 there were no statistically significant differences by age or COPD status in the
percentage of hip replacement patients who had adverse events
From 2009 to 2013 there were no statistically significant changes in the gap between
patients age 75 and over and those ages 65-74 in adverse event frequencies Similarly
there were no statistically significant changes in disparities between patients with COPD
and those without COPD
Adverse Events Associated With Central Venous Catheter Placement
Adults with mechanical adverse events associated with central venous catheter placement by race and obesity status 2009-2013
Source Agency for Healthcare Research and Quality and Centers for Medicare amp Medicaid Services Medicare Patient Safety Monitoring
System 2009-2013
Denominator Selected discharges of hospitalized patients age 18 years and over with central venous catheter placement
Note For this measure lower percentages are better Mechanical adverse events include allergic reaction to the catheter tamponade
perforation pneumothorax hematoma shearing off of the catheter air embolism misplaced catheter thrombosisembolism knotting of the
pulmonary artery catheter and certain other events
0
2
4
6
8
10
2009 2010 2011 2012 2013
Pe
rce
nt
Total White Black
0
2
4
6
8
10
2009 2010 2011 2012 2013
Pe
rce
nt
Obese Not Obese
Adults with mechanical adverse events associated with central venous catheter placement by race and obesity status 2009-2013
Source Agency for Healthcare Research and Quality and Centers for Medicare amp Medicaid Services Medicare Patient Safety Monitoring
System 2009-2013
Denominator Selected discharges of hospitalized patients age 18 years and over with central venous catheter placement
Note For this measure lower percentages are better Mechanical adverse events include allergic reaction to the catheter tamponade
perforation pneumothorax hematoma shearing off of the catheter air embolism misplaced catheter thrombosisembolism knotting of the
pulmonary artery catheter and certain other events
0
2
4
6
8
10
2009 2010 2011 2012 2013
Pe
rce
nt
Total White Black
0
2
4
6
8
10
2009 2010 2011 2012 2013
Pe
rce
nt
Obese Not Obese
Importance Central venous catheterization (CVC) allows medical personnel quick access to
a patientrsquos bloodstream This ease of access is important when a patient requires life-saving
medications or when a physician needs to measure central venous pressure Mechanical
adverse events are most likely to occur while medical personnel are placing or maintaining
the central venous catheter
National Healthcare Quality and Disparities Report | 15
Patient Safety
Overall Percentage In 2013 32 of adults with central venous catheter placements
experienced an associated mechanical adverse event
Trends From 2009 to 2013 there were no statistically significant changes in the overall
percentage of adults with mechanical adverse events associated with central venous catheter
placement
Groups With Disparities
In 2013 the percentage of adults with mechanical adverse events associated with CVC
was worse for Blacks (67) compared with Whites (27) There were no statistically
significant differences by obesity status
From 2009 to 2013 there were no statistically significant changes in the gap between
Blacks and Whites in the percentage of adults with mechanical adverse events associated
with CVC
Adverse Drug Events
An estimated 400000 preventable ADEs occur each year in US hospitals generating
additional costs of $35 billion in 2006 dollars (IOM 2007)
An ADE is an injurymdashincluding physical harm mental harm or loss of functionmdash
resulting from medical intervention involving a drug
For more information see the PSNet link to Patient Safety Primer Medication Errors
httpspsnetahrqgovprimersprimer23medication-errors
The three initial targets of the HHS National Action Plan for Adverse Drug Event Prevention are
Anticoagulants and related bleeding
Diabetes agents and related hypoglycemia
Opioids and accidental overdose oversedation and respiratory depression
Measures of Patient Safety in the Hospital Setting Adverse Drug Events
Percentage of hospitalized adult patients who received a hypoglycemic agent and had an
adverse drug event
Percentage of hospitalized adult patients who had an anticoagulant-related adverse drug
event to warfarin
Number of opioid-related medication errors in patients of all ages
16 | National Healthcare Quality and Disparities Report
Patient Safety
Adverse Drug Events With Hypoglycemic Agents
Hospitalized adult patients who received a hypoglycemic agent who had adverse drug events with hypoglycemic agents by
raceethnicity 2010-2013 and renal disease 2009-2013
Source Agency for Healthcare Research and Quality and Centers for Medicare amp Medicaid Services Medicare Patient Safety Monitoring
System 2009-2013
Note For this measure lower percentages are better Hypoglycemic agents received by patients age 18 and over during a hospital stay include
insulin oral hypoglycemic or a combination of both The 2009 data for races did not meet the criteria for statistical reliability data quality or confidentiality
0
2
4
6
8
10
12
14
16
18
20
2009 2010 2011 2012 2013
Pe
rce
nt
Total Renal DiseaseNo Renal Disease
0
2
4
6
8
10
12
14
16
18
20
2010 2011 2012 2013
Pe
rce
nt
Total White BlackAsian Hispanic
Hospitalized adult patients who received a hypoglycemic agent who had adverse drug events with hypoglycemic agents by
raceethnicity 2010-2013 and renal disease 2009-2013
Source Agency for Healthcare Research and Quality and Centers for Medicare amp Medicaid Services Medicare Patient Safety Monitoring
System 2009-2013
Note For this measure lower percentages are better Hypoglycemic agents received by patients age 18 and over during a hospital stay include
insulin oral hypoglycemic or a combination of both The 2009 data for races did not meet the criteria for statistical reliability data quality or confidentiality
0
2
4
6
8
10
12
14
16
18
20
2009 2010 2011 2012 2013
Pe
rce
nt
Total Renal DiseaseNo Renal Disease
0
2
4
6
8
10
12
14
16
18
20
2010 2011 2012 2013
Pe
rce
nt
Total White BlackAsian Hispanic
Importance Hypoglycemic agents which are ingested orally are typically used in patients
with type II diabetes to control blood sugar levels In some cases diabetic patients use
hypoglycemic agents together with insulin The risk of chronic kidney disease increases
twofold for people with diabetes and renal impairment can increase the risk for adverse
events related to hypoglycemic agents
Overall Percentage In 2013 85 of hospital patients receiving hypoglycemic agents had
an adverse drug event
Trends The overall percentage of adverse drug events associated with hypoglycemic agents
improved from 2009 to 2013
Groups With Disparities
In 2013 the percentage of hospital patients who had adverse drug events with hypoglycemic agents was higher for Blacks (111) than for Whites (8)
Also in 2013 the percentage of hospital patients who had adverse drug events with
hypoglycemic agents was higher for those with renal disease (122) than for those
without renal disease (56)
From 2010 to 2013 there were no statistically significant changes in the gap between
minority groups and Whites in the percentage of patients who had adverse drug events
associated with hypoglycemic agents Similarly there were no statistically significant
changes in the gap between those with renal disease and those without
National Healthcare Quality and Disparities Report | 17
Patient Safety
Adverse Drug Events With Warfarin
Hospitalized adult patients with an anticoagulant-related adverse drug event with warfarin by age and corticosteroid use 2009-2013
Source Agency for Healthcare Research and Quality and Centers for Medicare amp Medicaid Services Medicare Patient Safety Monitoring
System 2009ndash2013
Denominator Patients 18 and over who received warfarin and had their international normalized ratio (INR) measured during their hospital
stay
Note For this measure lower percentages are better Adverse events occurring the day of hospital arrival were excluded
0
2
4
6
8
10
12
2009 2010 2011 2012 2013
Pe
rce
nt
TotalCorticosteroid UseNo Corticosteroid Use
0
2
4
6
8
10
12
2009 2010 2011 2012 2013
Pe
rce
nt
lt65 65-74 75-84 85+
Hospitalized adult patients with an anticoagulant-related adverse drug event with warfarin by age and corticosteroid use 2009-2013
Source Agency for Healthcare Research and Quality and Centers for Medicare amp Medicaid Services Medicare Patient Safety Monitoring
System 2009ndash2013
Denominator Patients 18 and over who received warfarin and had their international normalized ratio (INR) measured during their hospital
stay
Note For this measure lower percentages are better Adverse events occurring the day of hospital arrival were excluded
0
2
4
6
8
10
12
2009 2010 2011 2012 2013
Pe
rce
nt
TotalCorticosteroid UseNo Corticosteroid Use
0
2
4
6
8
10
12
2009 2010 2011 2012 2013
Pe
rce
nt
lt65 65-74 75-84 85+
Importance Blood clots in arteries and veins can cause a blockage of blood flow and lead to
strokes and heart attacks Anticoagulants such as warfarin reduce this risk but pose an
increased risk of bleeding Corticosteroids can interact with anticoagulants to raise the risk of
potential bleeding complications
Overall Percentage In 2013 50 of adults using warfarin experienced an anticoagulant-
related adverse drug event
Trends From 2009 to 2013 there were no statistically significant changes in the overall
percentage of hospital patients with an adverse drug event related to warfarin
Groups With Disparities
In 2013 the percentage of hospital patients who had an adverse drug event to warfarin
was the same regardless of corticosteroid use status
From 2009 to 2013 there were no statistically significant changes in the gap between
older age groups and those under age 65 in the percentage of patients who had adverse
events associated with warfarin Similarly there were no statistically significant changes
in the gap between those using corticosteroids and those not using corticosteroids
18 | National Healthcare Quality and Disparities Report
Patient Safety
Opioid-Related Medication Errors
Number of opioid-related medication errors reported in Pennsylvania by AHRQ eventharm category and age 2006 2008 2010 2012 2014
30 53 44 27 23
2947 2798 2714 27082408
9531014
984 969
910
175 245251 398
330
0
500
1000
1500
2000
2500
3000
3500
4000
4500
2006 2008 2010 2012 2014
Nu
mb
er o
f Ev
ents
Unsafe Condition Near Miss
Patient Event No Harm Patient Event Harm
Source Institute of Safe Medication Practices on behalf of the Pennsylvania Patient Safety Authority 2006-2014
Note Pennsylvania Patient Safety Reporting System reports of medication errors are from acute-level facilities that consist of hospitals
ambulatory surgical facilities birthing centers and abortion facilities Medication errors do not include adverse drug reactions Eventharm
categories refer to those in the Agency for Healthcare Research and Quality Common Formats Unsafe condition is defined as any
circumstance that increases the probability of a patient safety event A near miss is defined as a patient safety event that did not reach the
patient Deaths are included in the total but not shown on the chart because there were too few to render graphically
192 166 336530 662
2287 24842385
2364 1955
16271461 1272
1208
1055
0
500
1000
1500
2000
2500
3000
3500
4000
4500
2006 2008 2010 2012 2014
Nu
mb
er o
f Ev
en
ts
lt18 18-64 65+
Number of opioid-related medication errors reported in Pennsylvania by AHRQ eventharm category and age 2006 2008 2010 2012 2014
30 53 44 27 23
2947 2798 2714 27082408
9531014
984 969
910
175 245251 398
330
0
500
1000
1500
2000
2500
3000
3500
4000
4500
2006 2008 2010 2012 2014
Nu
mb
er o
f Ev
ents
Unsafe Condition Near Miss
Patient Event No Harm Patient Event Harm
Source Institute of Safe Medication Practices on behalf of the Pennsylvania Patient Safety Authority 2006-2014
Note Pennsylvania Patient Safety Reporting System reports of medication errors are from acute-level facilities that consist of hospitals
ambulatory surgical facilities birthing centers and abortion facilities Medication errors do not include adverse drug reac tions Eventharm
categories refer to those in the Agency for Healthcare Research and Quality Common Formats Unsafe condition is defined as any
circumstance that increases the probability of a patient safety event A near miss is defined as a patient safety event that did not reach the
patient Deaths are included in the total but not shown on the chart because there were too few to render graphically
192 166 336530 662
2287 24842385
2364 1955
16271461 1272
1208
1055
0
500
1000
1500
2000
2500
3000
3500
4000
4500
2006 2008 2010 2012 2014
Nu
mb
er o
f Ev
ents
lt18 18-64 65+
Importance Acute malignant andmdashincreasinglymdashchronic pain often is treated or managed
with prescription opioids Reducing patient harm from the use of opioids in both inpatient
and outpatient settings is a main area of focus because opioid-related adverse drug events are
often preventable
Trends
In Pennsylvania the total number of medication error reports related to opioids decreased
106 between 2006 (4106) and 2014 (3672)
Between 24 and 54 opioid-related medication errors resulting in patient harm or death
were reported from 2006 through 2014 accounting for approximately 1 of all reported
opioid medication errors each year
The largest share of opioid-related medication errors reported each year in Pennsylvania
related to those that reached the patient but did not result in harm Of these no-harm
events reaching the patient about one in four required monitoring andor intervention to
preclude the harm
National Healthcare Quality and Disparities Report | 19
Patient Safety
20 | National Healthcare Quality and Disparities Report
Although small in number reports of unsafe conditions increased from 43 (175) of
total opioid-related medication error reports in 2006 to 9 (330) in 2014 Reports of
unsafe conditions and near misses can provide important learning opportunities for
preventing patient harm
Differences Between Groups Reports of opioid-related medication errors involving
pediatric patients increased nearly fourfold from 192 (47) in 2006 to 662 (18) in 2014
During the same period reports of opioid-related medication errors involving older adult
patients decreased from nearly 40 of the total to less than 30
Patient Safety in the Nursing Home Setting
More than 3 million people receive care in US nursing homes and skilled nursing facilities
each year (CDC 2015)
For nursing home residents optimal care seeks to maximize quality of life and minimize
unintended complications
Measures tracked for patients of various age ranges include
Nursing home residents with urinary tract infections
Nursing home residents experiencing use of restraints
Nursing home residents who have pressure ulcers
Nursing home residents who had a fall with major injury
Nursing home residents who received antipsychotic medication
Urinary Tract Infections
Long-stay nursing home residents experiencing urinary tract infections by sex and raceethnicity 2011-2013
Source Centers for Medicare amp Medicaid Services Minimum Data Set 2011-2013
DenominatorNursing home residents of any age w ho have at least 101 cumulative days in the facility
Note For this measure low er percentages are better The measure w as calculated as follows Percentage of long-stay residents with a urinary
tract infection w ithin the 30 days prior to assessment White Black and Asian are non-Hispanic Hispanic includes all races
0
2
4
6
8
10
2011 2012 2013
Pe
rce
nt
Total Male Female
2011 Achievable
Benchmark 61
0
2
4
6
8
10
2011 2012 2013
Pe
rce
nt
White Black Asian Hispanic
2011 Achievable
Benchmark 61
Long-stay nursing home residents experiencing urinary tract infections by sex and raceethnicity 2011-2013
Source Centers for Medicare amp Medicaid Services Minimum Data Set 2011-2013
DenominatorNursing home residents of any age w ho have at least 101 cumulative days in the facilityNote For this measure low er percentages are better The measure w as calculated as follows Percentage of long-stay residents with a urinary
tract infection w ithin the 30 days prior to assessment White Black and Asian are non-Hispanic Hispanic includes all races
0
2
4
6
8
10
2011 2012 2013
Pe
rce
nt
Total Male Female
2011 Achievable
Benchmark 61
0
2
4
6
8
10
2011 2012 2013
Pe
rce
nt
White Black Asian Hispanic
2011 Achievable
Benchmark 61
Patient Safety
Importance Bacteria that cause urinary tract infections (UTIs) can spread to other body
parts and become more serious or contribute to further complications such as delirium
Overall Percentage In 2013 the percentage of long-stay nursing home residents with a UTI
was 64
Groups With Disparities
In 2013 compared with males (51) the percentage with UTIs was worse for females
(7)
In 2013 compared with White residents (68) the percentage of residents with UTIs
was lower for Blacks and Asians (47) as well as Hispanics (54)
Achievable Benchmark
In 2011 the top 5 State achievable benchmark for UTIs was 61 The States that
contributed to the achievable benchmark are Connecticut Hawaii Minnesota North
Dakota and Pennsylvania
Males Blacks Asians and Hispanics have achieved the benchmark
Use of Restraints
00
05
10
15
20
25
30
35
40
2011 2012 2013
Pe
rce
nt
White Black Asian Hispanic
00
05
10
15
20
25
30
35
40
2011 2012 2013
Pe
rce
nt
Total 0-64 65-74 75-84 85+
2011 Achievable
Benchmark 07
Long-stay nursing home residents experiencing use of restraints by age and raceethnicity 2011-2013
Source Centers for Medicare amp Medicaid Services Minimum Data Set 2011-2013
Denominator Nursing home residents of any age who have at least 101 cumulative days in the facility
Note For this measure lower percentages are better The measure was calculated as follows Percentage of long-stay residents who are
physically restrained on a daily basis
2011 Achievable
Benchmark 07
00
05
10
15
20
25
30
35
40
2011 2012 2013
Pe
rce
nt
White Black Asian Hispanic
00
05
10
15
20
25
30
35
40
2011 2012 2013
Pe
rce
nt
Total 0-64 65-74 75-84 85+
2011 Achievable
Benchmark 07
Long-stay nursing home residents experiencing use of restraints by age and raceethnicity 2011-2013
Source Centers for Medicare amp Medicaid Services Minimum Data Set 2011-2013
Denominator Nursing home residents of any age who have at least 101 cumulative days in the facility
Note For this measure lower percentages are better The measure was calculated as follows Percentage of long-stay residents who are
physically restrained on a daily basis
2011 Achievable
Benchmark 07
National Healthcare Quality and Disparities Report | 21
Patient Safety
Importance Residents who are restrained daily can become weak lose their ability to go to
the bathroom by themselves and develop pressure ulcers or other medical conditions
Overall Percentage In 2013 the percentage of long-stay nursing home residents who were
physically restrained on a daily basis was 14
Groups With Disparities
In 2011 2012 and 2013 the percentage of residents with restraint use on a daily basis
was lower for those ages 65-74 years compared with those under age 65 In 2013 the
percentage of residents ages 65-74 years experiencing use of restraints was 12
compared with 16 for residents younger than 65
In 2013 compared with Whites (14) Asians (2) and Hispanics (18) had worse
percentages of daily restraint use and Blacks (12) had a better percentage of daily
restraint use
Achievable Benchmark
In 2011 the top 5 State achievable benchmark for restraint use was 07 The States that
contributed to the achievable benchmark are Kansas Maine Nebraska New Hampshire
and Vermont
No group achieved the benchmark from 2011 to 2013
Pressure Ulcers
Low-risk short-stay and high-risk long-stay nursing home residents who have pressure ulcers by sex 2011-2013
Source Centers for Medicare amp Medicaid Services Minimum Data Set 2011-2013
Denominator Low-risk short-stay Nursing home residents of any age who have 100 or fewer cumulative days in the facility and are active can
change positions and are getting the nutrients they need to maintain good skin health High-risk long-stay Nursing home residents of any age
who have at least 101 cumulative days in the facility and are in a coma do not get the nutrients needed to maintain good skin health or cannot
change position on their own
Note For this measure lower percentages are better
0
2
4
6
8
10
12
2011 2012 2013
Pe
rce
nt
Low-Risk Short StayTotal Male Female
2011 Achievable Benchmark10
0
2
4
6
8
10
12
2011 2012 2013
Pe
rce
nt
High-Risk Long StayTotal Male Female
2008 Achievable Benchmark 71
Low-risk short-stay and high-risk long-stay nursing home residents who have pressure ulcers by sex 2011-2013
Source Centers for Medicare amp Medicaid Services Minimum Data Set 2011-2013
Denominator Low-risk short-stay Nursing home residents of any age who have 100 or fewer cumulative days in the facility and are active can
change positions and are getting the nutrients they need to maintain good skin health High-risk long-stay Nursing home residents of any age
who have at least 101 cumulative days in the facility and are in a coma do not get the nutrients needed to maintain good skin health or cannot
change position on their own
Note For this measure lower percentages are better
0
2
4
6
8
10
12
2011 2012 2013
Pe
rce
nt
Low-Risk Short StayTotal Male Female
2011 Achievable Benchmark10
0
2
4
6
8
10
12
2011 2012 2013
Pe
rce
nt
High-Risk Long StayTotal Male Female
2008 Achievable Benchmark 71
22 | National Healthcare Quality and Disparities Report
Patient Safety
Importance Pressure ulcers are serious medical conditions They typically result from
prolonged periods of uninterrupted pressure on the skin soft tissue muscle and bone
Vulnerable patients include older adults stroke and diabetic patients patients with dementia
circulatory diseases dehydration and malnutrition and people who use wheelchairs or are
bedriddenmdashthat is any patient with impaired mobility or sensation
Overall Percentage In 2013 the percentage of low-risk short-stay residents with pressure
ulcers was 13 and the percentage of high-risk long-stay residents with pressure ulcers was
77
Groups with Disparities
As in 2011 and 2012 male low-risk short-stay nursing home residents had a worse
percentage with pressure ulcers (15) compared with female residents (12) in 2013
As in 2011 and 2012 male high-risk long-stay nursing home residents had a worse
percentage with pressure ulcers (94) compared with female residents (70) in 2013
Achievable Benchmark
The 2011 top 5 State achievable benchmark for low-risk short-stay nursing home residents was 10 The States that contributed to the benchmark were Alabama Arizona Colorado Connecticut and Idaho
The 2008 top 5 State achievable benchmark for high-risk long-stay nursing home residents was 71 The States that contributed to the benchmark were Hawaii Minnesota Nebraska New Hampshire and North Dakota
No low-risk short-stay residents achieved the benchmark from 2011 to 2013 Among
high-risk long-stay residents only females achieved the benchmark by 2013
National Healthcare Quality and Disparities Report | 23
Patient Safety
Falls
00
05
10
15
20
25
30
35
40
45
50
Pe
rce
nt
2012 2013
Long-stay nursing home residents who had a fall with major injury by sex age and raceethnicity 2012-2013
Source Centers for Medicare amp Medicaid Services Minimum Data Set 2012-2013
Denominator Nursing home residents of any age who have at least 101 cumulative days in the facility with one or more look-back scan
assessments except when the occurrence of falls or number of falls with major injury was not assessed in the look-back scan assessment
Note For this measure lower percentages are better White Black and Other are non-Hispanic Hispanic includes all races
2012 Achievable
Benchmark 22
00
05
10
15
20
25
30
35
40
45
50
Pe
rce
nt
2012 2013
Long-stay nursing home residents who had a fall with major injury by sex age and raceethnicity 2012-2013
Source Centers for Medicare amp Medicaid Services Minimum Data Set 2012-2013
Denominator Nursing home residents of any age who have at least 101 cumulative days in the facility with one or more look-back scan
assessments except when the occurrence of falls or number of falls with major injury was not assessed in the look-back scan assessment
Note For this measure lower percentages are better White Black and Other are non-Hispanic Hispanic includes all races
2012 Achievable
Benchmark 22
Importance Nursing home residents who experience falls resulting in major injuries are at
higher risk of death and disability as well as emotional trauma that can affect functional
abilities and social well-being
Overall Percentage In 2013 the percentage of long-stay nursing home residents who had a
fall with a major injury was 34
Groups With Disparities
In 2013 female nursing home residents had a worse percentage of falls (38) compared
with male residents (25)
In 2013 the percentage of falls with major injury was worse for all subgroups of
residents age 65 years and over compared with their younger counterparts The
percentage for residents under 65 years old was 17 compared with 26 for ages 65shy
74 years 34 for ages 75-84 years and 41 for 85 years and over
Also in 2013 compared with Whites (38) the percentage of falls with major injury
was better for Black (13) Other (22) and Hispanic (24) residents
24 | National Healthcare Quality and Disparities Report
Patient Safety
National Healthcare Quality and Disparities Report | 25
Achievable Benchmark
The 2012 top 5 State achievable benchmark for falls with major injury was 22 The
States that contributed to the achievable benchmark are Alaska California District of
Columbia Hawaii and New Jersey The benchmark was achieved by Black residents and those ages 0-64 years
Antipsychotic Medication Among Nursing Home Residents
Importance The high use of antipsychotic medications among nursing home residents for
indications other than those for which the drug was approved has been noted by the Federal
Government These drugs are often used for too long at too high a dose or when
unnecessary In the past inappropriate prescribing of antipsychotics in nursing homes has
primarily been considered a marker of suboptimal care Recent studies have shown
antipsychotic use is also a drug safety issue (Huybrechts et al 2012) Antipsychotic
medication use is associated with increased risks of adverse events such as movement
disorders falls hip fractures and cerebrovascular events Their use in older adults with
dementia carries an increased risk of death Safety concerns with antipsychotic medication
use in older adults also include the risks of hyperprolactinemia pneumonia
0
5
10
15
20
25
30
Percent
2012 2013
Adult long-stay nursing home residents who received antipsychotic medication by raceethnicity and number of chronic conditions 2012-2013
Key NHOPI = Native Hawaiian or Other Pacific Islander AIAN = American Indian or Alaska Native
Source Centers for Medicare amp Medicaid Services Minimum Data Set 2012-2013
Denominator Nursing home residents of any age who have at least 101 cumulative days in the facility excluding residents with schizophrenia
Tourettersquos syndrome and Huntingtonrsquos disease
Numerator Subset of denominator that receives an antipsychotic medication
Note For this measure lower percentages are better
2012 Achievable
Benchmark 150
0
5
10
15
20
25
30
Percent
2012 2013
Adult long-stay nursing home residents who received antipsychotic medication by raceethnicity and number of chronic conditions 2012-2013
Key NHOPI = Native Hawaiian or Other Pacific Islander AIAN = American Indian or Alaska Native
Source Centers for Medicare amp Medicaid Services Minimum Data Set 2012-2013
Denominator Nursing home residents of any age who have at least 101 cumulative days in the facility excluding residents with schizophrenia
Tourettersquos syndrome and Huntingtonrsquos disease
Numerator Subset of denominator that receives an antipsychotic medication
Note For this measure lower percentages are better
2012 Achievable
Benchmark 150
Patient Safety
26 | National Healthcare Quality and Disparities Report
thromboembolism cerebrovascular events and other cardiovascular adverse events (Chiu et
al 2015)
Overall Percentage The percentage of long-stay nursing home residents who had
antipsychotic medications was 176 in 2013
Groups With Disparities
In 2013 the percentage of residents receiving antipsychotic medication was higher for
Hispanic residents (201) than for White residents (180)
In 2012 and 2013 the percentage of long-stay residents who received antipsychotic
medications was worse for residents with one or more chronic conditions than for
residents with no chronic conditions
Achievable Benchmark
The 2012 top 6 State achievable benchmark was 150 The States that contributed to the
achievable benchmark are Alaska California Hawaii Michigan New Jersey and
Wyoming Asians NHOPIs residents with no chronic conditions and residents with one chronic
condition achieved the benchmark
Antipsychotic Medication Among Nursing Home Residents by State
Long-stay nursing home residents who received antipsychotic medication by State 2013
Source Centers for Medicare amp Medicaid Services Minimum Data Set 2013
Denominator Nursing home residents of any age who have at least 101 cumulative days in the facility
Note For this measure lower percentages are better
AZ
CA
UT
CT
FL
GA
IA
IL
KS
MA
MDMO
NJ
NY
OR
PA
SC
TN
CO
WA
WI
VA
ME
MN
MI
NC
TX
KY
WV
RI
NE
VT
NV OH
SD
AR
IN
NH
MT
ID
WY
ND
NMOK
LA
MS AL
DE
AKAK
HI
DC
85-153 (1st Quartile)
154-173 (2nd Quartile)
No Data
174-192 (3rd Quartile)
PR193-234 (4th Quartile)
Long-stay nursing home residents who received antipsychotic medication by State 2013
Source Centers for Medicare amp Medicaid Services Minimum Data Set 2013
Denominator Nursing home residents of any age who have at least 101 cumulative days in the facility
Note For this measure lower percentages are better
AZ
CA
UT
CT
FL
GA
IA
IL
KS
MA
MDMO
NJ
NY
OR
PA
SC
TN
CO
WA
WI
VA
ME
MN
MI
NC
TX
KY
WV
RI
NE
VT
NV OH
SD
AR
IN
NH
MT
ID
WY
ND
NMOK
LA
MS AL
DE
AKAK
HI
DC
85-153 (1st Quartile)
154-173 (2nd Quartile)
No Data
174-192 (3rd Quartile)
PR193-234 (4th Quartile)
Patient Safety
Overall This map shows overall rankings of States (by quartiles) in the percentage of long-
stay nursing home residents who received antipsychotic medication in 2013 Values ranged
from 85 to 234
Differences by State Interquartile ranges follow
First quartile (lowest) 85-153 (AK CA DC DE HI MD MI MN NJ NC SC
WI WV)
Second quartile (second lowest) 153 -173 (CO ID MT NM NY ND OR PA
RI SD VT WA WY)
Third quartile (second highest) 174-192 (AZ CT GA IN IA KS ME MA MO
NV OH OK VA)
Fourth quartile (highest) 193-234 (AL AR FL IL KY LA MS NE NH TN
TX UT)
Eight of the 12 States in the quartile with the highest percentage of long-stay nursing
home residents who received antipsychotic medication were in the South
Patient Safety in the Home Health Setting
Home health agencies provide services to beneficiaries who are homebound and need skilled
nursing care or therapy
Approximately 12 million individuals receive home health care from more than 33000
providers for causes including acute illness long-term health conditions permanent
disability or terminal illness (NAHCH 2010)
Improvements among home health patients can reflect the quality of care from home health
agencies
Measures include
Home health patients with improvement in surgical wounds
Home health patients with improvements in their ability to take medications orally
National Healthcare Quality and Disparities Report | 27
Patient Safety
Improvement in Surgical Wounds
75
80
85
90
95
100
2010 2011 2012 2013
Pe
rce
nt
White Black Asian Hispanic
75
80
85
90
95
100
2010 2011 2012 2013
Pe
rce
nt
Total 0-64 65-74
75-84 85+
2011 Achievable
Benchmark 913
Home health patients with improvement in surgical wounds by age and raceethnicity 2010-2013
Source Centers for Medicare amp Medicaid Services Outcome and Assessment Information Set 2010-2013
Denominator Number of home health episodes during the measurement period in which the patient of any age had a surgical wound and the
episode ended with the patient discharged from home health care
Note White Black and Asian are non-Hispanic Hispanic includes all races
2011 Achievable
Benchmark 913
75
80
85
90
95
100
2010 2011 2012 2013
Per
cen
t
White Black Asian Hispanic
75
80
85
90
95
100
2010 2011 2012 2013
Per
cen
t
Total 0-64 65-74
75-84 85+
2011 Achievable
Benchmark 913
Home health patients with improvement in surgical wounds by age and raceethnicity 2010-2013
Source Centers for Medicare amp Medicaid Services Outcome and Assessment Information Set 2010-2013
Denominator Number of home health episodes during the measurement period in which the patient of any age had a surgical wound and the
episode ended with the patient discharged from home health care
Note White Black and Asian are non-Hispanic Hispanic includes all races
2011 Achievable
Benchmark 913
Importance Normal wound healing after an operation is an important marker of good care
The home health team should regularly change wound dressing and teach the patient about
wound care
Overall Percentage In 2013 the percentage of home health patients with improvement in
their surgical wounds was 890
Trends The percentage of health home patients with surgical wound improvement increased
between 2010 and 2013
Groups With Disparities
In 2013 compared with residents under age 65 years (856) all other age groups had
better percentages of improvement in surgical wounds The percentage was 893 for
ages 65-74 905 for ages 75-84 and 917 for ages 85 and over
In 2013 compared with Whites (893) Blacks (878) Asians (882) and Hispanics
(874) had worse percentages of improvement in surgical wounds
The 2010 through 2013 trend in the percent of home health patients with surgical wound
improvement did not change for those over age 65 relative to persons under age 65 years
28 | National Healthcare Quality and Disparities Report
Patient Safety
Achievable Benchmark
The 2011 top 5 State achievable benchmark was 913 The States that contributed to the
benchmark are Alabama Mississippi Nevada Oklahoma and South Carolina
Home health patients age 85 years and over achieved the benchmark for surgical wound
improvement in 2013
At the current rate of progress patients ages 75-84 years could reach the benchmark
within a year Patients ages 65-74 years could achieve the benchmark in approximately 2
years
White home health patients could achieve the benchmark in approximately 2 years
Improvement in Ability To Take Medication Orally
0
20
40
60
80
100
2010 2011 2012 2013
Per
cen
t
White Black Asian Hispanic
0
20
40
60
80
100
2010 2011 2012 2013
Per
cen
t
Total 0-64 65-74
75-84 85+
2008 Achievable
Benchmark 516
Home health patients with improvement in their ability to take medications orally by age and raceethnicity 2010-2013
Source Centers for Medicare amp Medicaid Services Outcome and Assessment Information Set 2010-2013
Denominator Number of home health care episodes in which a patient of any age was unable to take oral medications independently at the
start of the episode that ended during the measurement period
Note White Black and Asian are non-Hispanic Hispanic includes all races
2008 Achievable
Benchmark 516
0
20
40
60
80
100
2010 2011 2012 2013
Per
cen
t
White Black Asian Hispanic
0
20
40
60
80
100
2010 2011 2012 2013
Per
cen
t
Total 0-64 65-74
75-84 85+
2008 Achievable
Benchmark 516
Home health patients with improvement in their ability to take medications orally by age and raceethnicity 2010-2013
Source Centers for Medicare amp Medicaid Services Outcome and Assessment Information Set 2010-2013
Denominator Number of home health care episodes in which a patient of any age was unable to take oral medications independently at the
start of the episode that ended during the measurement period
Note White Black and Asian are non-Hispanic Hispanic includes all races
2008 Achievable
Benchmark 516
Importance Taking medications correctly is important to the health status and quality of life
of individuals living in the community The home health team can help teach a patient ways
to organize drugs and take them properly
Overall Percentage In 2013 the percentage of home health patients with improvement in
their ability to take medications orally was 513
Trends Between 2010 and 2013 there was improvement in the overall percentage of home
health patients with improved ability to take medications orally
National Healthcare Quality and Disparities Report | 29
Patient Safety
Groups With Disparities
In 2013 the percentage of home health patients with improvement in their ability to take
medications orally was worse for those age 85 years and over (398) compared with
those under age 65 years (577)
The percentage of patients with improvement in their ability to take medications orally
was worse among Hispanic home health patients (400) than among White patients
(526) in 2013
From 2010 to 2013 the gap between Blacks and Whites decreased and the gap between
Asians and Whites and Hispanics and Whites increased
Achievable Benchmark
The 2008 top 5 State achievable benchmark was 516 The States that contributed to the
achievable benchmark are Iowa Massachusetts New Jersey North Dakota and South
Carolina
The benchmark was achieved among age groups under 85 years and by White and Black
home health patients
The total population is estimated to reach the benchmark in less than a year Hispanic
patients and patients age 85 years and over are farthest from the benchmark
Improvement in Ability To Take Medication Orally by State
Home health patients with improvement in their ability to take medications orally by raceethnicity by State 2013
Source Centers for Medicare amp Medicaid Services Outcome and Assessment Information Set 2013
Denominator Number of home health care episodes in which a patient of any age was unable to take oral medications independently at the
start of the episode that ended during the measurement period
AZ
CA
UT
CT
FL
GA
IA
IL
KS
MA
MDMO
NJ
NY
OR
PA
SC
TN
CO
WA
WI
VA
ME
MN
MI
NC
TX
KY
WV
RI
NE
VT
NV OH
SD
AR
IN
NH
MT
ID
WY
ND
NMOK
LA
MS AL
DE
AKAK
HI
No significant difference between rates
of Hispanics and non-Hispanic Whites
Non-Hispanic Whites have significantly
worse rate than Hispanics
States do not have data that meet the
criteria for statistical reliability data
quality or confidentiality
Hispanics have significantly worse rate
than non-Hispanic Whites
DC
Home health patients with improvement in their ability to take medications orally by raceethnicity by State 2013
Source Centers for Medicare amp Medicaid Services Outcome and Assessment Information Set 2013
Denominator Number of home health care episodes in which a patient of any age was unable to take oral medications independently at the
start of the episode that ended during the measurement period
AZ
CA
UT
CT
FL
GA
IA
IL
KS
MA
MDMO
NJ
NY
OR
PA
SC
TN
CO
WA
WI
VA
ME
MN
MI
NC
TX
KY
WV
RI
NE
VT
NV OH
SD
AR
IN
NH
MT
ID
WY
ND
NMOK
LA
MS AL
DE
AKAK
HI
No significant difference between rates
of Hispanics and non-Hispanic Whites
Non-Hispanic Whites have significantly
worse rate than Hispanics
States do not have data that meet the
criteria for statistical reliability data
quality or confidentiality
Hispanics have significantly worse rate
than non-Hispanic Whites
DC
30 | National Healthcare Quality and Disparities Report
Patient Safety
Geographic Variation
In 2013 Hispanic home health patients had worse rates of improvement in taking oral
medications than non-Hispanic White patients in 11 States (Arizona California
Connecticut Florida Illinois Indiana Massachusetts Nevada New York North
Carolina and Texas
Non-Hispanic White patients had worse rates of improvement than Hispanic patients in
five States (Hawaii Idaho Iowa Michigan and Pennsylvania)
Patient Safety in the Ambulatory Setting
Although patient safety initiatives frequently focus on inpatient hospital events adverse
effects of medical care may be identified and treated in outpatient settings
Adverse effects of medical care can follow care or procedures in hospitals emergency
departments physician offices or other settings
Measures include
Patient safety and quality issues by frequency of occurrence in outpatient medical offices
Adults age 65 years and over who received potentially inappropriate prescription medications during the calendar year
Percentage of hemodialysis patients with vascular catheter in use for 90 days or longer
For more information see the PSNet link to Patient Safety Primer Patient Safety in
Ambulatory Care httpspsnetahrqgovprimersprimer16patient-safety-in-ambulatory-care
National Healthcare Quality and Disparities Report | 31
Patient Safety
Patient Safety and Quality Issues
Patient safety and quality issues by frequency of occurrence in outpatient medical offices 2014
Source Westat analysis of the AHRQ 2014 Medical Office Survey on Patient Safety Culture Comparative Database (N=935)
Note For this measure less frequent occurrences during the year are better
0
20
40
60
80
100
A pharmacy contactedour office to clarify orcorrect a prescription
A patient was unableto get an appointmentwithin 48 hours for anacuteserious problem
A patients medicationlist was not updatedduring his or her visit
The results from a labor imaging test were notavailable when needed
A patients chartmedicalrecord was not available
when needed
Occurred DailyWeekly
Occurred Monthly
Occurred Not at All to Several Times Over the Past Year
Patient safety and quality issues by frequency of occurrence in outpatient medical offices 2014
Source Westat analysis of the AHRQ 2014 Medical Office Survey on Patient Safety Culture Comparative Database (N=935)
Note For this measure less frequent occurrences during the year are better
0
20
40
60
80
100
A pharmacy contactedour office to clarify orcorrect a prescription
A patient was unableto get an appointmentwithin 48 hours for anacuteserious problem
A patients medicationlist was not updatedduring his or her visit
The results from a labor imaging test were notavailable when needed
A patients chartmedicalrecord was not available
when needed
Occurred DailyWeekly
Occurred Monthly
Occurred Not at All to Several Times Over the Past Year
Importance Most health care takes place in the outpatient or ambulatory care setting Lack
of access to care and lack of access to timely and accurate medical information and test
results may contribute to patient safety events such as missed or delayed diagnoses
medication errors failure to order appropriate diagnostic or laboratory tests incorrect
interpretation of tests and inadequate followup on results
Overall Percentage
Almost 30 of medical offices participating in the survey reported daily or weekly
occurrences of being contacted by the pharmacist for clarification or correction on a
prescription
After prescription clarifications or corrections by the pharmacy medical offices were
next most likely to report daily or weekly issues with patients being unable to get an
appointment within 48 hours for an acute or serious problem (14) or the patientrsquos
medication list not getting updated during their visit (11)
The share of medical offices reporting that lab or imaging tests were not available when
needed reached nearly 20 when considering monthly occurrences as well as those that
occurred more frequently
32 | National Healthcare Quality and Disparities Report
Patient Safety
Potentially Inappropriate Prescriptions for Older Adults
Adults age 65 years and over who received potentially inappropriate prescription medications during the calendar year by sex and
perceived health status 2003ndash2013
Source Agency for Healthcare Research and Quality Medical Expenditure Panel Survey 2003-2013
Note For this measure lower percentages are better Prescription medications received include all prescribed medications initiall y purchased
or otherwise obtained as well as any refills For more information on inappropriate medications see the American Geriatrics Society 2012 Beers
Criteria Update Expert Panel American Geriatrics Society updated Beers Criteria for potentially inappropriate medication use in older adults J
Am Geriatr Soc 2012 Apr60(4)616-31
0
5
10
15
20
25
30
Per
cen
t
Total Male Female
0
5
10
15
20
25
30
Per
cen
t
ExcellentVery GoodGood FairPoor
Adults age 65 years and over who received potentially inappropriate prescription medications during the calendar year by sex and
perceived health status 2003ndash2013
Source Agency for Healthcare Research and Quality Medical Expenditure Panel Survey 2003-2013
Note For this measure lower percentages are better Prescription medications received include all prescribed medications initially purchased
or otherwise obtained as well as any refills For more information on inappropriate medications see the American Geriatrics Society 2012 Beers
Criteria Update Expert Panel American Geriatrics Society updated Beers Criteria for potentially inappropriate medication use in older adults J
Am Geriatr Soc 2012 Apr60(4)616-31
0
5
10
15
20
25
30
Per
cen
t
Total Male Female
0
5
10
15
20
25
30
Per
cen
t
ExcellentVery GoodGood FairPoor
Importance Some drugs that are prescribed for older patients are known to be potentially
harmful for this age group
Overall Percentage In 2013 the percentage of adults age 65 years and over who received
potentially inappropriate prescription medications was 114
Trends From 2003 to 2013 the percentage of adults age 65 years and over who received
potentially inappropriate prescription medications improved overall for both sexes and for
people with excellentvery goodgood health status and people with fairpoor health status
Groups With Disparities
In all years the percentage of patients receiving potentially inappropriate medications
was higher among females compared with males This gap was not changing over time
In all years from 2003 to 2013 the percentage of patients receiving potentially
inappropriate medications was higher among people with fairpoor health status
compared with people with excellentgood health status This gap was not changing over
time
National Healthcare Quality and Disparities Report | 33
Patient Safety
Long-Term Catheter Use in Dialysis Patients
HI
AKAK
AZ
CA
UT
CT
FL
GA
IA
IL
KS
MA
MDMO
NJ
NY
OR
PA
SC
TN
CO
WA
WI
VA
ME
MN
MI
NC
TX
KY
WV
RI
NE
VT
NV OH
SD
AR
IN
NH
MT
ID
WY
ND
NMOK
LA
MSAL
DE
DC
10-12
13-18
7-9
PR
Source Centers for Medicare and Medicaid Services Dialysis Facility Compare 2014
Denominator At-risk adult Medicare patients with a central venous catheter who were receiving regular hemodialysis treatments at dialysis
facilities
Note For this measure lower percentages are better
Percentage of hemodialysis patients with central venous catheters used for vascular access for 90 days or longer by State 2014
HI
AKAK
AZ
CA
UT
CT
FL
GA
IA
IL
KS
MA
MDMO
NJ
NY
OR
PA
SC
TN
CO
WA
WI
VA
ME
MN
MI
NC
TX
KY
WV
RI
NE
VT
NV OH
SD
AR
IN
NH
MT
ID
WY
ND
NMOK
LA
MSAL
DE
DC
10-12
13-18
7-9
PR
Source Centers for Medicare and Medicaid Services Dialysis Facility Compare 2014
Denominator At-risk adult Medicare patients with a central venous catheter who were receiving regular hemodialysis treatments at dialysis
facilities
Note For this measure lower percentages are better
Percentage of hemodialysis patients with central venous catheters used for vascular access for 90 days or longer by State 2014
Importance Central venous catheters are frequently used for vascular access to dialysis
patients until a fistula or graft is formed Central venous catheters have higher rates of
infection and adverse events among patients receiving dialysis treatment compared with
other forms of vascular access To decrease the likelihood of adverse events catheters should
be used for less than 90 days
Overall Percentage Nationally an average of 10 of dialysis patients used central venous
catheters for 90 days or longer in 2014
Geographic Variation In 2014 Alabama and Kansas had the lowest percentages of dialysis
patients using central venous catheters for 90 days or longer (7) and Puerto Rico had the
highest percentage (18) of long-term catheter use
Patient Safety Infrastructure
Efforts to improve patient safety have been accompanied by various infrastructure
enhancements
Growth in patient safety organizations which assist providers in detecting and reducing
risks and hazards from care delivery that may lead to patient harm
System improvement initiatives at the Veterans Health Administration (VHA)
34 | National Healthcare Quality and Disparities Report
Patient Safety
Development of the National Practitioner Data Bank a clearinghouse for information on
medical malpractice payments
Patient Safety Organizations
Patient safety organizations (PSOs) aim to reduce preventable adverse events near misses
and unsafe conditions in all health care settings
PSOs provide an environment for health care providers to voluntarily report discuss and
learn from patient safety events and quality analyses on a privileged and confidential basis
Measures include
Number of PSOs serving each State
Variation in concentrations of compounded liquid medications for children
Patient Safety Organizations AHRQ Common Formats
AHRQ Common Formats provide a standardized method for PSOs health care providers
and other organizations to collect and report patient safety events
Data element standards are important for aggregating and analyzing events across
providers
AHRQ Common Formats have been developed for a variety of settings of care
Acute care hospitals
Skilled nursing facilities
Retail pharmacy
More information is available at httpspsoahrqgovcommon
National Healthcare Quality and Disparities Report | 35
Patient Safety
Number of Patient Safety Organizations
AZ (2)
CA (3)
UT (2)
CT(3)
FL (8)
GA (5)
IA (4)
IL (7)
KS (5)
MA(3)
MD (4)MO(2)
NJ(3)
NY (5)
OR (3)
PA (5)
SC (4)
TN (5)
CO (2)
WA (2)
WI (5)
VA (7)
ME(2)
MN(3)
MI (3)
NC (7)
TX (6)
KY (4)WV (3)
RI(2)
NE (2)
VT(2)
NV (2)
OH (2)
SD (1)
AR (4)
IN (2)
NH(2)
MT (2)
ID (3)
WY (2)
ND (1)
NM (3)OK (2)
LA (1)
MS (2)
AL (2)
DE(2)
HI (2)
AKAK (2)
DC(3)
PR (0)
1-2
3-4
5-6
7-8
Number of PSOs
excluding PSOs
operating nationally
Number of Patient Safety Organizations by area served 2014
Source Agency for Healthcare Research and Quality Patient Safety Organization Information Form Calendar Year 2014 and PSO-PPC
Contact Database
Note PSOs included in this map were AHRQ-listed during any part of 2014 and submitted the PSO Profile to the PSO Privacy Protection
Center (PSO-PPC) in early 2015 A PSO may have members in one or more States regardless of headquarters location Each State shows the
number of PSOs that serve that State map excludes 38 PSOs that are available to providers in all States
AZ (2)
CA (3)
UT (2)
CT(3)
FL (8)
GA (5)
IA (4)
IL (7)
KS (5)
MA(3)
MD (4)MO(2)
NJ(3)
NY (5)
OR (3)
PA (5)
SC (4)
TN (5)
CO (2)
WA (2)
WI (5)
VA (7)
ME(2)
MN(3)
MI (3)
NC (7)
TX (6)
KY (4)WV (3)
RI(2)
NE (2)
VT(2)
NV (2)
OH (2)
SD (1)
AR (4)
IN (2)
NH(2)
MT (2)
ID (3)
WY (2)
ND (1)
NM (3)OK (2)
LA (1)
MS (2)
AL (2)
DE(2)
HI (2)
AKAK (2)
DC(3)
PR (0)
1-2
3-4
5-6
7-8
Number of PSOs
excluding PSOs
operating nationally
Number of Patient Safety Organizations by area served 2014
Source Agency for Healthcare Research and Quality Patient Safety Organization Information Form Calendar Year 2014 and PSO-PPC
Contact Database
Note PSOs included in this map were AHRQ-listed during any part of 2014 and submitted the PSO Profile to the PSO Privacy Protection
Center (PSO-PPC) in early 2015 A PSO may have members in one or more States regardless of headquarters location Each State shows the
number of PSOs that serve that State map excludes 38 PSOs that are available to providers in all States
Importance All patient safety organizations (PSOs) have authority to operate in all 50
States and US territories but not all do In 2014 38 PSOs self-reported being available to
providers nationally PSOs not available nationally serve specific States
Geographic Variation
Nearly all States have at least 2 PSOs available to providers in their State in addition to
the 38 national PSOs that serve all States
Florida has the most PSOs available with 8 in addition to the 38 nationally available
PSOs The States with the largest number of PSOs available are generally on the East
Coast (eg North Carolina Virginia New York Pennsylvania Tennessee Georgia) or
have large populations (eg Texas Illinois)
North Dakota South Dakota and Louisiana are the only states with just one PSO serving
their State in addition to the 38 national PSOs
Puerto Rico is served by one national PSO only
36 | National Healthcare Quality and Disparities Report
Patient Safety
Compounded Liquid Medications for Children
Compounded liquid medications for children in Michigan 2012
Source Levy S Buckley B Safe Table Success The MI Pediatric Safety Collaboration Presentation presented at the 7th Annual
Meeting of Patient Safety Organizations (PSOs) Rockville MD 2015 April and Rood JM Engels MJ Ciarkowski SL et al Variability in
compounding of oral liquids for pediatric patients a patient safety concern J Am Pharm Assn 201454(4)383-9
Note Information represents 244 responses to online survey of approximately 2000 Michigan pharmacies conducted in June 2012 by
The University of Michigan College of Pharmacy in collaboration with the Michigan Pharmacists Association
0
10
20
30
40
50
1 2 3 4 5 6 7 8 9
Nu
mb
er o
f D
rugs
Number of Unique Concentrations
Number of Different Compounded Concentrations per Drug
0
10
20
30
40
50
No Harm No Harm ButMonitoring
TemporaryHarm
Pe
rce
nt
Compounding Errors by Related Harm and Pharmacy Setting
Inpatient Outpatient
Compounded liquid medications for children in Michigan 2012
Source Levy S Buckley B Safe Table Success The MI Pediatric Safety Collaboration Presentation presented at the 7th Annual
Meeting of Patient Safety Organizations (PSOs) Rockville MD 2015 April and Rood JM Engels MJ Ciarkowski SL et al Variability in
compounding of oral liquids for pediatric patients a patient safety concern J Am Pharm Assn 201454(4)383-9
Note Information represents 244 responses to online survey of approximately 2000 Michigan pharmacies conducted in June 2012 by
The University of Michigan College of Pharmacy in collaboration with the Michigan Pharmacists Association
0
10
20
30
40
50
1 2 3 4 5 6 7 8 9
Nu
mb
er o
f D
rugs
Number of Unique Concentrations
Number of Different Compounded Concentrations per Drug
0
10
20
30
40
50
No Harm No Harm ButMonitoring
TemporaryHarm
Per
cen
t
Compounding Errors by Related Harm and Pharmacy Setting
Inpatient Outpatient
Importance
Liquid medications are widely used in pediatrics because many children find it difficult
to swallow tablets or capsules If not commercially manufactured these liquid
medications require a pharmacist to compound them to the correct dosage for the patient
This practice of compounding has led to a variety of medication concentrations in use In
the absence of standard concentrations for compounded medications there is a risk that
children may accidentally receive medications that are too potent and can be dangerous
or are too weak to be effective
The Michigan Health amp Hospital Association Keystone Center Patient Safety
Organization hosts five Pediatric Safe Tables each year Safe Tables provided a
confidential and legally protected environment to discuss challenges and improvement
strategies regarding inconsistent medication concentrations for compounded oral liquids
without fear of punitive action against them
National Healthcare Quality and Disparities Report | 37
Patient Safety
Overall Percentage
More than half (527) of drugs identified in the 2012 survey had 3 or more unique
concentrations dispensed to children across Michigan For example Rifampin used to
treat bacterial infections was reported to have 8 different concentrations dispensed to
patients
Nearly one-third (313) of reported errors caused temporary harm or required additional
monitoring despite no harm
Standardization of Compounded Liquid Medications
Source Michigan Health amp Hospital Association Keystone Center Patient Safety Organization and University of Michigan College of Pharmacy
State-Wide Initiative to Standardize the Compounding of Oral Liquids in Pediatrics
Standardization of compounded liquid medications for children in Michigan 2011
Issue identificationbull Hospitals attending PSO Pediatrics Safe
Table raise compounded medication concentrations as a major safety issue
bull Small focus group determines extent of problem
bull Michigan pharmacies are surveyed about baseline concentrations
Develop Interventionbull PSO Quarterly Safe Tables are held to
discuss cases and practicesbull Team develops recommendations for
standard concentrationsbull Consensus is achieved for frequently
compounded pediatric medications 470 formulations for 147 drug entities are reduced to 104 concentrations for 100 drugs
Practice changebull Toolkit is createdbull Standards are disseminated to Michigan
prescribers and pharmacies bull Standards are disseminated to PSO
members and Safe Table participants
Source Michigan Health amp Hospital Association Keystone Center Patient Safety Organization and University of Michigan College of Pharmacy
State-Wide Initiative to Standardize the Compounding of Oral Liquids in Pediatrics
Standardization of compounded liquid medications for children in Michigan 2011
Issue identificationbull Hospitals attending PSO Pediatrics Safe
Table raise compounded medication concentrations as a major safety issue
bull Small focus group determines extent of problem
bull Michigan pharmacies are surveyed about baseline concentrations
Develop Interventionbull PSO Quarterly Safe Tables are held to
discuss cases and practicesbull Team develops recommendations for
standard concentrationsbull Consensus is achieved for frequently
compounded pediatric medications 470 formulations for 147 drug entities are reduced to 104 concentrations for 100 drugs
Practice changebull Toolkit is createdbull Standards are disseminated to Michigan
prescribers and pharmacies bull Standards are disseminated to PSO
members and Safe Table participants
The Role of PSO Safe Tables Based on adverse medication events discussed in the
Michigan Health amp Hospital Association (MHA) Keystone Center Patient Safety
Organization (PSO) Safe Tables in July 2011 the Michigan Pediatric Safety Collaboration
was developed to further assess the scope of the problem and formulate a solution
The Collaborative The Michigan Pediatric Safety Collaboration includes individuals from
the University of Michigan College of Pharmacy the Michigan Pharmacists Association
(MPA) the Food and Drug Administration (FDA) and the MHA Keystone PSO
38 | National Healthcare Quality and Disparities Report
Patient Safety
Practice Change
As a result of the standardization effort 470 unique formulations for 147 drug entities
were reduced to 104 different concentrations for 100 drugs
The Michigan Pediatric Safety Collaboration developed a multistep process to implement
standards for compounding medications The MPA surveyed pharmacies in Michigan to
better define the nature and scope of the problem The PSO continued to act as convener
The result was the creation and dissemination of statewide standards for 120 frequently
compounded pediatric medications
Veterans Health Administration
The National Center for Patient Safety is part of the Veterans Health Administration the
Nationrsquos largest integrated health care system
Patient safety-related system improvement initiatives include
The Daily Planreg
Purchasing for Safety Initiative
Patient Safety Improvement Initiative
Patient safety improvement initiative The Daily Planreg at Veterans Affairs Medical Centers 2009
Source King BJ Mills PD Fore A et al The Daily Planreg including patients for safetys sake Nurs Manage 201243(3)15-8
0
10
20
30
40
50
Identified atleast one
error
Identifiederror
of omission
Identifiederror
ofcommission
Nurses Who Identified Errors in Patient Treatment Plan by Type
0
10
20
30
40
50
Patient founddiscrepancy inplanned care
Family founddiscrepancy inplanned care
Nursing Stafffound
discrepancyin plannedtreatment
Respondents Who Identified Errors or Discrepancies Through The Daily Plan reg
Patient safety improvement initiative The Daily Planreg at Veterans Affairs Medical Centers 2009
Source King BJ Mills PD Fore A et al The Daily Planreg including patients for safetys sake Nurs Manage 201243(3)15-8
0
10
20
30
40
50
Identified atleast one
error
Identifiederror
of omission
Identifiederror
ofcommission
Nurses Who Identified Errors in Patient Treatment Plan by Type
0
10
20
30
40
50
Patient founddiscrepancy inplanned care
Family founddiscrepancy inplanned care
Nursing Stafffound
discrepancyin plannedtreatment
Respondents Who Identified Errors or Discrepancies Through The Daily Plan reg
National Healthcare Quality and Disparities Report | 39
Patient Safety
Importance The Daily Planreg
is a two-page printed summary that acts as a schedule for
patients and providers each day It shows the procedures laboratory tests and medications
scheduled for that day and lists essential health information such as patientrsquos name allergies
and current medications It can be tailored for a patientrsquos needs by extracting orders from the
electronic medical record (EMR) The Daily Planreg
is intended to facilitate patient and family
engagement throughout the course of care The Daily Planreg
shows promise for improving
patient safety Since 2009 the VA has implemented The Daily Planreg
in more than 65
hospitals both inpatient and outpatient care settings The Daily Planreg
is shared more than
75000 times a month and the VA plans to continue the spread of The Daily Planreg
at
additional sites in 2016
Findings
As part of a pilot test in 2009 a total of 198 patients and 85 nurses responded to a survey
across 10 facilities Nurses had an average of 34 patients per shift who received The
Daily Planreg Patients responded about their own experiences whereas nurses reported
about all of their patients who received The Daily Planreg
Nearly half (475) of patients reported finding a discrepancy in planned care through
The Daily Planreg In addition 30 of patients reported that their family members found a
discrepancy Although not every discrepancy will be a potential medical error having a
shared understanding of the plan of care decreases the risk of error
More than one in six nurses (176) identified a discrepancy in treatment among their
patients through The Daily Planreg Most of these nurses (153) found one or more errors
of omission and a smaller share (106) of nurses found one or more errors of
commission some found both
40 | National Healthcare Quality and Disparities Report
Patient Safety
Issues Related to Ventilators
Common use-issues related to ventilators at the Veterans Health Administration 2006-2014 (combined)
Source Veterans Health Administration National Center for Patient Safety data collected October 2006 to October 2014
Note Examples of equipment failures include ventilator shutdown and other ventilator problems Ventilator settings include setup problems and
incorrect settings Support activities include space utilities and supplies Transport includes accidental extubation other transportation issues
and vehicle-related issues Alarms include alarm settings and alarm connection Training includes unknown ventilator model and other training
concerns
0
20
40
60
80
100
120
140
160
EquipmentFailure
VentilatorSettings
SupportActivities
Transport Alarms Training
Nu
mb
er o
f R
epo
rts
Common use-issues related to ventilators at the Veterans Health Administration 2006-2014 (combined)
Source Veterans Health Administration National Center for Patient Safety data collected October 2006 to October 2014
Note Examples of equipment failures include ventilator shutdown and other ventilator problems Ventilator settings include setup problems and
incorrect settings Support activities include space utilities and supplies Transport includes accidental extubation other transportation issues
and vehicle-related issues Alarms include alarm settings and alarm connection Training includes unknown ventilator model and other training
concerns
0
20
40
60
80
100
120
140
160
EquipmentFailure
VentilatorSettings
SupportActivities
Transport Alarms Training
Nu
mb
er o
f R
epo
rts
Importance Beginning with a focus on ventilators the Veterans Health Administrationrsquos
human factors-based Purchasing for Safety Initiative communicates the most common use-
issues associated with medical devices in order to ultimately remove or contain identified
vulnerabilities and prevent further harm
Event Reporting Patient safety managers report events and close calls from more than 150
VA facilities to a national database The largest number of use issues related to ventilators
involved equipment failure and issues such as spontaneous ventilator shutdown compressor
failure and broken or missing parts Other categories of ventilator use issues involved the
physical space where the ventilator was used challenges of transporting patients on
ventilators and problems with ventilator settings and alarms Root cause analyses on reports
are conducted and Patient Safety Alerts are issued to share the learning internally
Other Key Components
Data on ventilator issues from the VA and the Food and Drug Administrationrsquos Medical
Product Safety Network are the basis for a ldquogovernment-industry dayrdquo to work with
manufacturers This information is used to help the device manufacturers better
understand the limits of human use of their products
National Healthcare Quality and Disparities Report | 41
Patient Safety
The VA also trains noncliniciansmdashsuch as biomedical engineers across the
organizationmdashto understand the devices consider the situation for their use and identify
what can go wrong (ldquofailure modesrdquo) in advance
The VA encourages discussions among clinicians about their experience in using devices
In the Applied Patient Safety Challenge hundreds of staff participate in brainstorming
about solutions and strategies for dealing with unexpected scenarios involving devices
National Practitioner Data Bank
Medical malpractice actions are one way to flag potential medical errors
Medical Malpractice Payment Reports are submitted to the National Practitioner Data Bank
by medical malpractice payers
Report of a monetary exchange made for the benefit of a physician dentist or other
health care provider
Result of a settlement or judgment of a written complaint or claim based on that
providerrsquos delivery of or failure to deliver health care services
Number of Medical Malpractice Payment Reports by Setting
Number of Medical Malpractice Payment Reports by health care setting 2004-2014
Source National Practitioner Data Bank (NPDB) Public Use Data File Health Resources and Services Administration Bureau of Health
Professions Division of Practitioner Data Banks 2004-2014
Note Health care setting was not collected by the NPDB for 2104 reports in 2004 ldquoOtherrdquo includes Medical Malpractice Payment Reports
related to unknown settings as well as those for a combination of inpatient and outpatient settings Reports pertain to patients of any age
0
2000
4000
6000
8000
10000
12000
14000
16000
18000
20000
2004 2005 2006 2007 2008 2009 2010 2011 2012 2013 2014
Nu
mb
er o
f R
epo
rts
Total Inpatient Outpatient Other
Number of Medical Malpractice Payment Reports by health care setting 2004-2014
Source National Practitioner Data Bank (NPDB) Public Use Data File Health Resources and Services Administration Bureau of Health
Professions Division of Practitioner Data Banks 2004-2014
Note Health care setting was not collected by the NPDB for 2104 reports in 2004 ldquoOtherrdquo includes Medical Malpractice Payment Reports
related to unknown settings as well as those for a combination of inpatient and outpatient settings Reports pertain to patients of any age
0
2000
4000
6000
8000
10000
12000
14000
16000
18000
20000
2004 2005 2006 2007 2008 2009 2010 2011 2012 2013 2014
Nu
mb
er o
f R
epo
rts
Total Inpatient Outpatient Other
42 | National Healthcare Quality and Disparities Report
Patient Safety
Trends The total number of medical malpractice payment reports (MMPRs) per year
decreased from 17641 in 2004 to 12699 in 2014
Variation Across Reports
Of 157022 MMPRs from 2004 through 2014 more reports related to care in the
outpatient setting (71937) than in the inpatient setting (60391)
Diagnosis-related and treatment-related payments were the most frequent types of
reports each accounting for about 27 of cases Reports of payments for medication-
related cases accounted for only 5 of MMPRs (data not shown)
Number of Medical Malpractice Payment Reports by Allegation and Harm
Number of Medical Malpractice Payment Reports by type of allegation and harm severity 2004-2014
Key Temporary injury = Minor temporary injury and Major temporary injury Permanent significant injury = Significant Permanent Injury
Major Permanent Injury Quadriplegia Brain Damage Lifelong care
Source National Practitioner Data Bank Public Use Data File Health Resources and Services Administration Bureau of Health Professions
Division of Practitioner Data Banks 2004-2014
Note Reports pertain to patients of any age
0
20
40
60
80
100
Treatment(n=42913)
Diagnosis(n=42507)
Surgery(n=36845)
Obstetrics(n=10555)
Medication(n=8287)
Monitoring(n=5329)
Anesthesia(n=4276)
Equipment(n=1161)
BehavioralHealth
(n=879)
Blood(n=379)
EmotionalInjury Only
InsignificantInjury
TemporaryInjury
PermanentMinor Injury
PermanentSignificant Injury
Death Unknown
Number of Medical Malpractice Payment Reports by type of allegation and harm severity 2004-2014
Key Temporary injury = Minor temporary injury and Major temporary injury Permanent significant injury = Significant Permanent Injury
Major Permanent Injury Quadriplegia Brain Damage Lifelong care
Source National Practitioner Data Bank Public Use Data File Health Resources and Services Administration Bureau of Health Professions
Division of Practitioner Data Banks 2004-2014
Note Reports pertain to patients of any age
0
20
40
60
80
100
Treatment(n=42913)
Diagnosis(n=42507)
Surgery(n=36845)
Obstetrics(n=10555)
Medication(n=8287)
Monitoring(n=5329)
Anesthesia(n=4276)
Equipment(n=1161)
BehavioralHealth
(n=879)
Blood(n=379)
EmotionalInjury Only
InsignificantInjury
TemporaryInjury
PermanentMinor Injury
PermanentSignificant Injury
Death Unknown
Overall Percentage From 2004 to 2014 medical malpractice payments were made for
allegations related to
Treatment (42913)
Diagnosis (42507)
Surgery (36845)
Obstetrics (10555)
Medication (8287)
Monitoring (5329)
National Healthcare Quality and Disparities Report | 43
Patient Safety
Anesthesia (4276)
Equipment or products (1161)
Behavioral health (879) and
IV and blood products (379)
Variation Across Reports
Death accounted for more than one-third of harm in payments related to monitoring
(499) diagnosis (393) medication (383) and anesthesia (363) allegations
More than half of all obstetric payments were for allegations of permanent severe harm
(570)
Temporary harm accounted for more than one-third of payments related to equipment
(485) and surgery (360)
Most of the behavioral health-related payments were for emotional harm (457) or
death (338)
References
Agency for Healthcare Research and Quality Making Health Care Safer II An Updated Critical Analysis of the
Evidence for Patient Safety Practices Comparative Effectiveness Review No 211 Rockville MD Agency for
Healthcare Research and Quality March 2013 AHRQ Publication No 13-E001-EF
httpwwwahrqgovsitesdefaultfileswysiwygresearchfindingsevidence-basedshy
reportsservicesqualityptsafetyII-fullpdf
Arriaga AF Lancaster RT Berry RW et al The better colectomy project association of evidence-based best-
practice adherence rates to outcomes in colorectal surgery Ann Surg 2009 Oct250(4)507-13
httpwwwncbinlmnihgovpubmed19734778
Centers for Disease Control and Prevention HAI Prevalence Survey
httpwwwcdcgovHAIsurveillanceindexhtml Last updated March 2016 Accessed March 4 2016
Centers for Disease Control and Prevention Nursing Homes and Assisted Living (Long-Term Care Facilities)
httpwwwcdcgovlongtermcare Last updated September 2015 Accessed March 4 2016
Chassin MR Loeb JM High-reliability health care getting there from here Milbank Q 201391(3)459-90
httpwwwncbinlmnihgovpmcarticlesPMC3790522 Accessed September 23 2015
Chiu Y Bero L Hessol NA et al A literature review of clinical outcomes associated with antipsychotic medication
use in North American nursing home residents Health Policy 2015 Jun119(6)802-813 Epub 2015 Feb 28 PMID
25791166 httpwwwsciencedirectcomsciencearticlepiiS0168851015000652 Accessed June 17 2015
Huybrechts KF Gerhard Crystal S et al Differential risk of death in older residents in nursing homes prescribed
specific antipsychotic drugs Population based cohort study BMJ 2012 Feb 23344e977 PMID 22362541
httpwwwncbinlmnihgovpmcarticlesPMC3285717 Accessed June 17 2015
Institute of Medicine Preventing Medication Errors Quality Chasm Series 2007
httpwwwnapeducatalog11623preventing-medication-errors-quality-chasm-series
National Association for Home Care amp Hospice Basic Statistics About Home Care Updated 2010
httpwwwnahcorgassets1710hc_statspdf Accessed August 31 2015
44 | National Healthcare Quality and Disparities Report
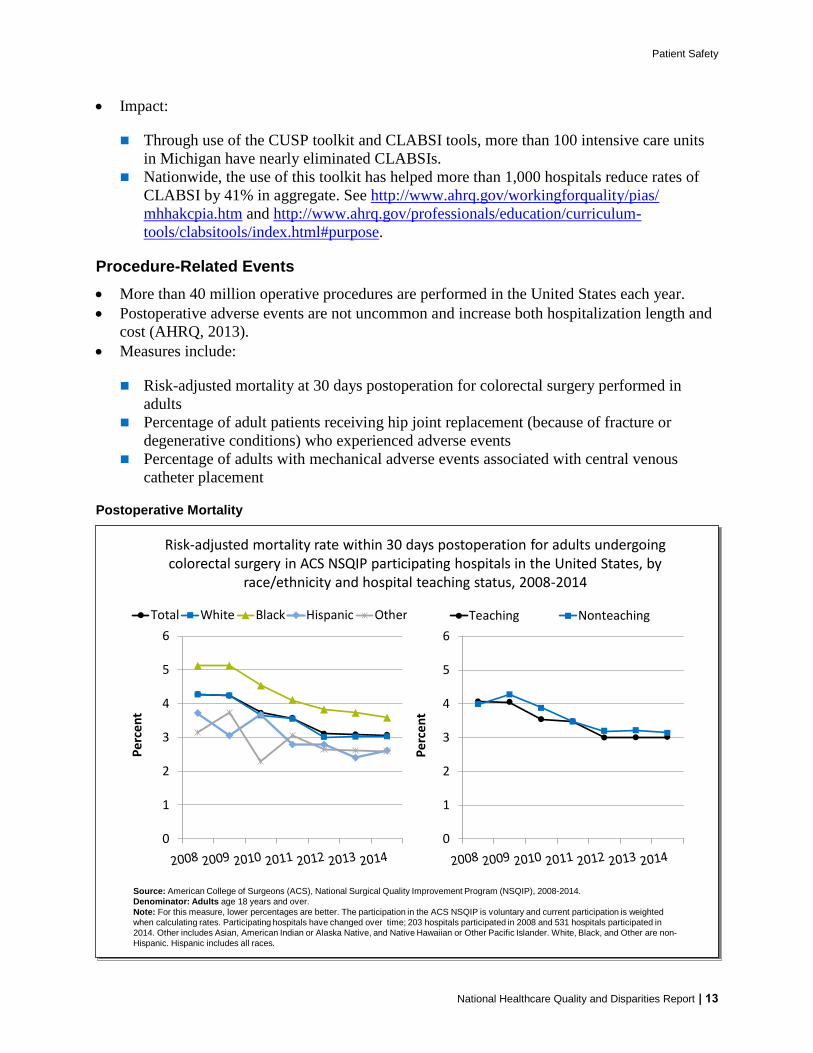
Patient Safety
Importance Colorectal procedures have high rates of postoperative complications
Nonadherence to evidence-based best practices is associated with an increased risk of these
complications (Arriaga et al 2009)
Overall Rate In 2014 the risk-adjusted mortality rate was 31 among patients undergoing
colorectal surgeries at ACS NSQIP participating hospitals
Trends From 2008 to 2014 30-day postoperative mortality after colorectal surgery
improved
Groups With Disparities
In 2014 the percentage of patients with 30-day postoperative mortality was worse for
Blacks (36) compared with Whites (30)
From 2008 to 2014 there were no statistically significant changes in the gap between
minority groups and Whites in the percentage of patients with 30-day postoperative
mortality
Adverse Events After Hip Joint Replacement
Adult patients receiving hip joint replacement due to fracture or degenerative conditions who experienced adverse events by age and chronic obstructive
pulmonary disease 2009-2013
02468
101214161820
2009 2010 2011 2012 2013
Pe
rce
nt
Total 65-74 75-84 85+
02468
101214161820
2009 2010 2011 2012 2013
Pe
rce
nt
COPD No COPD
Key COPD = chronic obstructive pulmonary disease
Source Agency for Healthcare Research and Quality (AHRQ) and Centers for Medicare amp Medicaid Services (CMS) Medicare Patient Safety
Monitoring System (MPSMS) 2009-2013
Denominator All patients age 18 years and over in the MPSMS sample who had a surgical procedure performed to replace a hip joint due to
degenerative conditions or a fractured hip
Note For this measure lower percentages are better Hospitals in Puerto Rico the Virgin Islands and Maryland were not included in the
annual samples Samples were drawn from the CMS Hospital Inpatient Quality Reporting program and consist of medical records for
discharges following hip arthroplasty procedures as defined by the Surgical Care Improvement Project Rates for patients age 85 years and
over in 2013 and for ages 18-64 years old for all years are not shown because the data did not meet the criteria for statistical reliability data
quality or confidentiality COPD status relates to patients with a principal or secondary discharge diagnosis of COPD
Adult patients receiving hip joint replacement due to fracture or degenerative conditions who experienced adverse events by age and chronic obstructive
pulmonary disease 2009-2013
02468
101214161820
2009 2010 2011 2012 2013
Pe
rce
nt
Total 65-74 75-84 85+
02
4
68
10
12
1416
18
20
2009 2010 2011 2012 2013
Pe
rce
nt
COPD No COPD
Key COPD = chronic obstructive pulmonary disease
Source Agency for Healthcare Research and Quality (AHRQ) and Centers for Medicare amp Medicaid Services (CMS) Medicare Patient Safety
Monitoring System (MPSMS) 2009-2013
Denominator All patients age 18 years and over in the MPSMS sample who had a surgical procedure performed to replace a hip joint due to
degenerative conditions or a fractured hip
Note For this measure lower percentages are better Hospitals in Puerto Rico the Virgin Islands and Maryland were not included in the
annual samples Samples were drawn from the CMS Hospital Inpatient Quality Reporting program and consist of medical records for
discharges following hip arthroplasty procedures as defined by the Surgical Care Improvement Project Rates for patients age 85 years and
over in 2013 and for ages 18-64 years old for all years are not shown because the data did not meet the criteria for statistical reliability data
quality or confidentiality COPD status relates to patients with a principal or secondary discharge diagnosis of COPD
Importance Hip replacement is most common among older adults who have an increased
risk of adverse events after these surgeries
14 | National Healthcare Quality and Disparities Report
Patient Safety
Overall Percentage In 2013 49 of patients receiving a hip joint replacement experienced
an adverse event
Trends From 2009 to 2013 the overall percentage of adverse events improved for patients
who had a hip joint replacement due to fracture or degenerative conditions
Groups With Disparities
In 2013 there were no statistically significant differences by age or COPD status in the
percentage of hip replacement patients who had adverse events
From 2009 to 2013 there were no statistically significant changes in the gap between
patients age 75 and over and those ages 65-74 in adverse event frequencies Similarly
there were no statistically significant changes in disparities between patients with COPD
and those without COPD
Adverse Events Associated With Central Venous Catheter Placement
Adults with mechanical adverse events associated with central venous catheter placement by race and obesity status 2009-2013
Source Agency for Healthcare Research and Quality and Centers for Medicare amp Medicaid Services Medicare Patient Safety Monitoring
System 2009-2013
Denominator Selected discharges of hospitalized patients age 18 years and over with central venous catheter placement
Note For this measure lower percentages are better Mechanical adverse events include allergic reaction to the catheter tamponade
perforation pneumothorax hematoma shearing off of the catheter air embolism misplaced catheter thrombosisembolism knotting of the
pulmonary artery catheter and certain other events
0
2
4
6
8
10
2009 2010 2011 2012 2013
Pe
rce
nt
Total White Black
0
2
4
6
8
10
2009 2010 2011 2012 2013
Pe
rce
nt
Obese Not Obese
Adults with mechanical adverse events associated with central venous catheter placement by race and obesity status 2009-2013
Source Agency for Healthcare Research and Quality and Centers for Medicare amp Medicaid Services Medicare Patient Safety Monitoring
System 2009-2013
Denominator Selected discharges of hospitalized patients age 18 years and over with central venous catheter placement
Note For this measure lower percentages are better Mechanical adverse events include allergic reaction to the catheter tamponade
perforation pneumothorax hematoma shearing off of the catheter air embolism misplaced catheter thrombosisembolism knotting of the
pulmonary artery catheter and certain other events
0
2
4
6
8
10
2009 2010 2011 2012 2013
Pe
rce
nt
Total White Black
0
2
4
6
8
10
2009 2010 2011 2012 2013
Pe
rce
nt
Obese Not Obese
Importance Central venous catheterization (CVC) allows medical personnel quick access to
a patientrsquos bloodstream This ease of access is important when a patient requires life-saving
medications or when a physician needs to measure central venous pressure Mechanical
adverse events are most likely to occur while medical personnel are placing or maintaining
the central venous catheter
National Healthcare Quality and Disparities Report | 15
Patient Safety
Overall Percentage In 2013 32 of adults with central venous catheter placements
experienced an associated mechanical adverse event
Trends From 2009 to 2013 there were no statistically significant changes in the overall
percentage of adults with mechanical adverse events associated with central venous catheter
placement
Groups With Disparities
In 2013 the percentage of adults with mechanical adverse events associated with CVC
was worse for Blacks (67) compared with Whites (27) There were no statistically
significant differences by obesity status
From 2009 to 2013 there were no statistically significant changes in the gap between
Blacks and Whites in the percentage of adults with mechanical adverse events associated
with CVC
Adverse Drug Events
An estimated 400000 preventable ADEs occur each year in US hospitals generating
additional costs of $35 billion in 2006 dollars (IOM 2007)
An ADE is an injurymdashincluding physical harm mental harm or loss of functionmdash
resulting from medical intervention involving a drug
For more information see the PSNet link to Patient Safety Primer Medication Errors
httpspsnetahrqgovprimersprimer23medication-errors
The three initial targets of the HHS National Action Plan for Adverse Drug Event Prevention are
Anticoagulants and related bleeding
Diabetes agents and related hypoglycemia
Opioids and accidental overdose oversedation and respiratory depression
Measures of Patient Safety in the Hospital Setting Adverse Drug Events
Percentage of hospitalized adult patients who received a hypoglycemic agent and had an
adverse drug event
Percentage of hospitalized adult patients who had an anticoagulant-related adverse drug
event to warfarin
Number of opioid-related medication errors in patients of all ages
16 | National Healthcare Quality and Disparities Report
Patient Safety
Adverse Drug Events With Hypoglycemic Agents
Hospitalized adult patients who received a hypoglycemic agent who had adverse drug events with hypoglycemic agents by
raceethnicity 2010-2013 and renal disease 2009-2013
Source Agency for Healthcare Research and Quality and Centers for Medicare amp Medicaid Services Medicare Patient Safety Monitoring
System 2009-2013
Note For this measure lower percentages are better Hypoglycemic agents received by patients age 18 and over during a hospital stay include
insulin oral hypoglycemic or a combination of both The 2009 data for races did not meet the criteria for statistical reliability data quality or confidentiality
0
2
4
6
8
10
12
14
16
18
20
2009 2010 2011 2012 2013
Pe
rce
nt
Total Renal DiseaseNo Renal Disease
0
2
4
6
8
10
12
14
16
18
20
2010 2011 2012 2013
Pe
rce
nt
Total White BlackAsian Hispanic
Hospitalized adult patients who received a hypoglycemic agent who had adverse drug events with hypoglycemic agents by
raceethnicity 2010-2013 and renal disease 2009-2013
Source Agency for Healthcare Research and Quality and Centers for Medicare amp Medicaid Services Medicare Patient Safety Monitoring
System 2009-2013
Note For this measure lower percentages are better Hypoglycemic agents received by patients age 18 and over during a hospital stay include
insulin oral hypoglycemic or a combination of both The 2009 data for races did not meet the criteria for statistical reliability data quality or confidentiality
0
2
4
6
8
10
12
14
16
18
20
2009 2010 2011 2012 2013
Pe
rce
nt
Total Renal DiseaseNo Renal Disease
0
2
4
6
8
10
12
14
16
18
20
2010 2011 2012 2013
Pe
rce
nt
Total White BlackAsian Hispanic
Importance Hypoglycemic agents which are ingested orally are typically used in patients
with type II diabetes to control blood sugar levels In some cases diabetic patients use
hypoglycemic agents together with insulin The risk of chronic kidney disease increases
twofold for people with diabetes and renal impairment can increase the risk for adverse
events related to hypoglycemic agents
Overall Percentage In 2013 85 of hospital patients receiving hypoglycemic agents had
an adverse drug event
Trends The overall percentage of adverse drug events associated with hypoglycemic agents
improved from 2009 to 2013
Groups With Disparities
In 2013 the percentage of hospital patients who had adverse drug events with hypoglycemic agents was higher for Blacks (111) than for Whites (8)
Also in 2013 the percentage of hospital patients who had adverse drug events with
hypoglycemic agents was higher for those with renal disease (122) than for those
without renal disease (56)
From 2010 to 2013 there were no statistically significant changes in the gap between
minority groups and Whites in the percentage of patients who had adverse drug events
associated with hypoglycemic agents Similarly there were no statistically significant
changes in the gap between those with renal disease and those without
National Healthcare Quality and Disparities Report | 17
Patient Safety
Adverse Drug Events With Warfarin
Hospitalized adult patients with an anticoagulant-related adverse drug event with warfarin by age and corticosteroid use 2009-2013
Source Agency for Healthcare Research and Quality and Centers for Medicare amp Medicaid Services Medicare Patient Safety Monitoring
System 2009ndash2013
Denominator Patients 18 and over who received warfarin and had their international normalized ratio (INR) measured during their hospital
stay
Note For this measure lower percentages are better Adverse events occurring the day of hospital arrival were excluded
0
2
4
6
8
10
12
2009 2010 2011 2012 2013
Pe
rce
nt
TotalCorticosteroid UseNo Corticosteroid Use
0
2
4
6
8
10
12
2009 2010 2011 2012 2013
Pe
rce
nt
lt65 65-74 75-84 85+
Hospitalized adult patients with an anticoagulant-related adverse drug event with warfarin by age and corticosteroid use 2009-2013
Source Agency for Healthcare Research and Quality and Centers for Medicare amp Medicaid Services Medicare Patient Safety Monitoring
System 2009ndash2013
Denominator Patients 18 and over who received warfarin and had their international normalized ratio (INR) measured during their hospital
stay
Note For this measure lower percentages are better Adverse events occurring the day of hospital arrival were excluded
0
2
4
6
8
10
12
2009 2010 2011 2012 2013
Pe
rce
nt
TotalCorticosteroid UseNo Corticosteroid Use
0
2
4
6
8
10
12
2009 2010 2011 2012 2013
Pe
rce
nt
lt65 65-74 75-84 85+
Importance Blood clots in arteries and veins can cause a blockage of blood flow and lead to
strokes and heart attacks Anticoagulants such as warfarin reduce this risk but pose an
increased risk of bleeding Corticosteroids can interact with anticoagulants to raise the risk of
potential bleeding complications
Overall Percentage In 2013 50 of adults using warfarin experienced an anticoagulant-
related adverse drug event
Trends From 2009 to 2013 there were no statistically significant changes in the overall
percentage of hospital patients with an adverse drug event related to warfarin
Groups With Disparities
In 2013 the percentage of hospital patients who had an adverse drug event to warfarin
was the same regardless of corticosteroid use status
From 2009 to 2013 there were no statistically significant changes in the gap between
older age groups and those under age 65 in the percentage of patients who had adverse
events associated with warfarin Similarly there were no statistically significant changes
in the gap between those using corticosteroids and those not using corticosteroids
18 | National Healthcare Quality and Disparities Report
Patient Safety
Opioid-Related Medication Errors
Number of opioid-related medication errors reported in Pennsylvania by AHRQ eventharm category and age 2006 2008 2010 2012 2014
30 53 44 27 23
2947 2798 2714 27082408
9531014
984 969
910
175 245251 398
330
0
500
1000
1500
2000
2500
3000
3500
4000
4500
2006 2008 2010 2012 2014
Nu
mb
er o
f Ev
ents
Unsafe Condition Near Miss
Patient Event No Harm Patient Event Harm
Source Institute of Safe Medication Practices on behalf of the Pennsylvania Patient Safety Authority 2006-2014
Note Pennsylvania Patient Safety Reporting System reports of medication errors are from acute-level facilities that consist of hospitals
ambulatory surgical facilities birthing centers and abortion facilities Medication errors do not include adverse drug reactions Eventharm
categories refer to those in the Agency for Healthcare Research and Quality Common Formats Unsafe condition is defined as any
circumstance that increases the probability of a patient safety event A near miss is defined as a patient safety event that did not reach the
patient Deaths are included in the total but not shown on the chart because there were too few to render graphically
192 166 336530 662
2287 24842385
2364 1955
16271461 1272
1208
1055
0
500
1000
1500
2000
2500
3000
3500
4000
4500
2006 2008 2010 2012 2014
Nu
mb
er o
f Ev
en
ts
lt18 18-64 65+
Number of opioid-related medication errors reported in Pennsylvania by AHRQ eventharm category and age 2006 2008 2010 2012 2014
30 53 44 27 23
2947 2798 2714 27082408
9531014
984 969
910
175 245251 398
330
0
500
1000
1500
2000
2500
3000
3500
4000
4500
2006 2008 2010 2012 2014
Nu
mb
er o
f Ev
ents
Unsafe Condition Near Miss
Patient Event No Harm Patient Event Harm
Source Institute of Safe Medication Practices on behalf of the Pennsylvania Patient Safety Authority 2006-2014
Note Pennsylvania Patient Safety Reporting System reports of medication errors are from acute-level facilities that consist of hospitals
ambulatory surgical facilities birthing centers and abortion facilities Medication errors do not include adverse drug reac tions Eventharm
categories refer to those in the Agency for Healthcare Research and Quality Common Formats Unsafe condition is defined as any
circumstance that increases the probability of a patient safety event A near miss is defined as a patient safety event that did not reach the
patient Deaths are included in the total but not shown on the chart because there were too few to render graphically
192 166 336530 662
2287 24842385
2364 1955
16271461 1272
1208
1055
0
500
1000
1500
2000
2500
3000
3500
4000
4500
2006 2008 2010 2012 2014
Nu
mb
er o
f Ev
ents
lt18 18-64 65+
Importance Acute malignant andmdashincreasinglymdashchronic pain often is treated or managed
with prescription opioids Reducing patient harm from the use of opioids in both inpatient
and outpatient settings is a main area of focus because opioid-related adverse drug events are
often preventable
Trends
In Pennsylvania the total number of medication error reports related to opioids decreased
106 between 2006 (4106) and 2014 (3672)
Between 24 and 54 opioid-related medication errors resulting in patient harm or death
were reported from 2006 through 2014 accounting for approximately 1 of all reported
opioid medication errors each year
The largest share of opioid-related medication errors reported each year in Pennsylvania
related to those that reached the patient but did not result in harm Of these no-harm
events reaching the patient about one in four required monitoring andor intervention to
preclude the harm
National Healthcare Quality and Disparities Report | 19
Patient Safety
20 | National Healthcare Quality and Disparities Report
Although small in number reports of unsafe conditions increased from 43 (175) of
total opioid-related medication error reports in 2006 to 9 (330) in 2014 Reports of
unsafe conditions and near misses can provide important learning opportunities for
preventing patient harm
Differences Between Groups Reports of opioid-related medication errors involving
pediatric patients increased nearly fourfold from 192 (47) in 2006 to 662 (18) in 2014
During the same period reports of opioid-related medication errors involving older adult
patients decreased from nearly 40 of the total to less than 30
Patient Safety in the Nursing Home Setting
More than 3 million people receive care in US nursing homes and skilled nursing facilities
each year (CDC 2015)
For nursing home residents optimal care seeks to maximize quality of life and minimize
unintended complications
Measures tracked for patients of various age ranges include
Nursing home residents with urinary tract infections
Nursing home residents experiencing use of restraints
Nursing home residents who have pressure ulcers
Nursing home residents who had a fall with major injury
Nursing home residents who received antipsychotic medication
Urinary Tract Infections
Long-stay nursing home residents experiencing urinary tract infections by sex and raceethnicity 2011-2013
Source Centers for Medicare amp Medicaid Services Minimum Data Set 2011-2013
DenominatorNursing home residents of any age w ho have at least 101 cumulative days in the facility
Note For this measure low er percentages are better The measure w as calculated as follows Percentage of long-stay residents with a urinary
tract infection w ithin the 30 days prior to assessment White Black and Asian are non-Hispanic Hispanic includes all races
0
2
4
6
8
10
2011 2012 2013
Pe
rce
nt
Total Male Female
2011 Achievable
Benchmark 61
0
2
4
6
8
10
2011 2012 2013
Pe
rce
nt
White Black Asian Hispanic
2011 Achievable
Benchmark 61
Long-stay nursing home residents experiencing urinary tract infections by sex and raceethnicity 2011-2013
Source Centers for Medicare amp Medicaid Services Minimum Data Set 2011-2013
DenominatorNursing home residents of any age w ho have at least 101 cumulative days in the facilityNote For this measure low er percentages are better The measure w as calculated as follows Percentage of long-stay residents with a urinary
tract infection w ithin the 30 days prior to assessment White Black and Asian are non-Hispanic Hispanic includes all races
0
2
4
6
8
10
2011 2012 2013
Pe
rce
nt
Total Male Female
2011 Achievable
Benchmark 61
0
2
4
6
8
10
2011 2012 2013
Pe
rce
nt
White Black Asian Hispanic
2011 Achievable
Benchmark 61
Patient Safety
Importance Bacteria that cause urinary tract infections (UTIs) can spread to other body
parts and become more serious or contribute to further complications such as delirium
Overall Percentage In 2013 the percentage of long-stay nursing home residents with a UTI
was 64
Groups With Disparities
In 2013 compared with males (51) the percentage with UTIs was worse for females
(7)
In 2013 compared with White residents (68) the percentage of residents with UTIs
was lower for Blacks and Asians (47) as well as Hispanics (54)
Achievable Benchmark
In 2011 the top 5 State achievable benchmark for UTIs was 61 The States that
contributed to the achievable benchmark are Connecticut Hawaii Minnesota North
Dakota and Pennsylvania
Males Blacks Asians and Hispanics have achieved the benchmark
Use of Restraints
00
05
10
15
20
25
30
35
40
2011 2012 2013
Pe
rce
nt
White Black Asian Hispanic
00
05
10
15
20
25
30
35
40
2011 2012 2013
Pe
rce
nt
Total 0-64 65-74 75-84 85+
2011 Achievable
Benchmark 07
Long-stay nursing home residents experiencing use of restraints by age and raceethnicity 2011-2013
Source Centers for Medicare amp Medicaid Services Minimum Data Set 2011-2013
Denominator Nursing home residents of any age who have at least 101 cumulative days in the facility
Note For this measure lower percentages are better The measure was calculated as follows Percentage of long-stay residents who are
physically restrained on a daily basis
2011 Achievable
Benchmark 07
00
05
10
15
20
25
30
35
40
2011 2012 2013
Pe
rce
nt
White Black Asian Hispanic
00
05
10
15
20
25
30
35
40
2011 2012 2013
Pe
rce
nt
Total 0-64 65-74 75-84 85+
2011 Achievable
Benchmark 07
Long-stay nursing home residents experiencing use of restraints by age and raceethnicity 2011-2013
Source Centers for Medicare amp Medicaid Services Minimum Data Set 2011-2013
Denominator Nursing home residents of any age who have at least 101 cumulative days in the facility
Note For this measure lower percentages are better The measure was calculated as follows Percentage of long-stay residents who are
physically restrained on a daily basis
2011 Achievable
Benchmark 07
National Healthcare Quality and Disparities Report | 21
Patient Safety
Importance Residents who are restrained daily can become weak lose their ability to go to
the bathroom by themselves and develop pressure ulcers or other medical conditions
Overall Percentage In 2013 the percentage of long-stay nursing home residents who were
physically restrained on a daily basis was 14
Groups With Disparities
In 2011 2012 and 2013 the percentage of residents with restraint use on a daily basis
was lower for those ages 65-74 years compared with those under age 65 In 2013 the
percentage of residents ages 65-74 years experiencing use of restraints was 12
compared with 16 for residents younger than 65
In 2013 compared with Whites (14) Asians (2) and Hispanics (18) had worse
percentages of daily restraint use and Blacks (12) had a better percentage of daily
restraint use
Achievable Benchmark
In 2011 the top 5 State achievable benchmark for restraint use was 07 The States that
contributed to the achievable benchmark are Kansas Maine Nebraska New Hampshire
and Vermont
No group achieved the benchmark from 2011 to 2013
Pressure Ulcers
Low-risk short-stay and high-risk long-stay nursing home residents who have pressure ulcers by sex 2011-2013
Source Centers for Medicare amp Medicaid Services Minimum Data Set 2011-2013
Denominator Low-risk short-stay Nursing home residents of any age who have 100 or fewer cumulative days in the facility and are active can
change positions and are getting the nutrients they need to maintain good skin health High-risk long-stay Nursing home residents of any age
who have at least 101 cumulative days in the facility and are in a coma do not get the nutrients needed to maintain good skin health or cannot
change position on their own
Note For this measure lower percentages are better
0
2
4
6
8
10
12
2011 2012 2013
Pe
rce
nt
Low-Risk Short StayTotal Male Female
2011 Achievable Benchmark10
0
2
4
6
8
10
12
2011 2012 2013
Pe
rce
nt
High-Risk Long StayTotal Male Female
2008 Achievable Benchmark 71
Low-risk short-stay and high-risk long-stay nursing home residents who have pressure ulcers by sex 2011-2013
Source Centers for Medicare amp Medicaid Services Minimum Data Set 2011-2013
Denominator Low-risk short-stay Nursing home residents of any age who have 100 or fewer cumulative days in the facility and are active can
change positions and are getting the nutrients they need to maintain good skin health High-risk long-stay Nursing home residents of any age
who have at least 101 cumulative days in the facility and are in a coma do not get the nutrients needed to maintain good skin health or cannot
change position on their own
Note For this measure lower percentages are better
0
2
4
6
8
10
12
2011 2012 2013
Pe
rce
nt
Low-Risk Short StayTotal Male Female
2011 Achievable Benchmark10
0
2
4
6
8
10
12
2011 2012 2013
Pe
rce
nt
High-Risk Long StayTotal Male Female
2008 Achievable Benchmark 71
22 | National Healthcare Quality and Disparities Report
Patient Safety
Importance Pressure ulcers are serious medical conditions They typically result from
prolonged periods of uninterrupted pressure on the skin soft tissue muscle and bone
Vulnerable patients include older adults stroke and diabetic patients patients with dementia
circulatory diseases dehydration and malnutrition and people who use wheelchairs or are
bedriddenmdashthat is any patient with impaired mobility or sensation
Overall Percentage In 2013 the percentage of low-risk short-stay residents with pressure
ulcers was 13 and the percentage of high-risk long-stay residents with pressure ulcers was
77
Groups with Disparities
As in 2011 and 2012 male low-risk short-stay nursing home residents had a worse
percentage with pressure ulcers (15) compared with female residents (12) in 2013
As in 2011 and 2012 male high-risk long-stay nursing home residents had a worse
percentage with pressure ulcers (94) compared with female residents (70) in 2013
Achievable Benchmark
The 2011 top 5 State achievable benchmark for low-risk short-stay nursing home residents was 10 The States that contributed to the benchmark were Alabama Arizona Colorado Connecticut and Idaho
The 2008 top 5 State achievable benchmark for high-risk long-stay nursing home residents was 71 The States that contributed to the benchmark were Hawaii Minnesota Nebraska New Hampshire and North Dakota
No low-risk short-stay residents achieved the benchmark from 2011 to 2013 Among
high-risk long-stay residents only females achieved the benchmark by 2013
National Healthcare Quality and Disparities Report | 23
Patient Safety
Falls
00
05
10
15
20
25
30
35
40
45
50
Pe
rce
nt
2012 2013
Long-stay nursing home residents who had a fall with major injury by sex age and raceethnicity 2012-2013
Source Centers for Medicare amp Medicaid Services Minimum Data Set 2012-2013
Denominator Nursing home residents of any age who have at least 101 cumulative days in the facility with one or more look-back scan
assessments except when the occurrence of falls or number of falls with major injury was not assessed in the look-back scan assessment
Note For this measure lower percentages are better White Black and Other are non-Hispanic Hispanic includes all races
2012 Achievable
Benchmark 22
00
05
10
15
20
25
30
35
40
45
50
Pe
rce
nt
2012 2013
Long-stay nursing home residents who had a fall with major injury by sex age and raceethnicity 2012-2013
Source Centers for Medicare amp Medicaid Services Minimum Data Set 2012-2013
Denominator Nursing home residents of any age who have at least 101 cumulative days in the facility with one or more look-back scan
assessments except when the occurrence of falls or number of falls with major injury was not assessed in the look-back scan assessment
Note For this measure lower percentages are better White Black and Other are non-Hispanic Hispanic includes all races
2012 Achievable
Benchmark 22
Importance Nursing home residents who experience falls resulting in major injuries are at
higher risk of death and disability as well as emotional trauma that can affect functional
abilities and social well-being
Overall Percentage In 2013 the percentage of long-stay nursing home residents who had a
fall with a major injury was 34
Groups With Disparities
In 2013 female nursing home residents had a worse percentage of falls (38) compared
with male residents (25)
In 2013 the percentage of falls with major injury was worse for all subgroups of
residents age 65 years and over compared with their younger counterparts The
percentage for residents under 65 years old was 17 compared with 26 for ages 65shy
74 years 34 for ages 75-84 years and 41 for 85 years and over
Also in 2013 compared with Whites (38) the percentage of falls with major injury
was better for Black (13) Other (22) and Hispanic (24) residents
24 | National Healthcare Quality and Disparities Report
Patient Safety
National Healthcare Quality and Disparities Report | 25
Achievable Benchmark
The 2012 top 5 State achievable benchmark for falls with major injury was 22 The
States that contributed to the achievable benchmark are Alaska California District of
Columbia Hawaii and New Jersey The benchmark was achieved by Black residents and those ages 0-64 years
Antipsychotic Medication Among Nursing Home Residents
Importance The high use of antipsychotic medications among nursing home residents for
indications other than those for which the drug was approved has been noted by the Federal
Government These drugs are often used for too long at too high a dose or when
unnecessary In the past inappropriate prescribing of antipsychotics in nursing homes has
primarily been considered a marker of suboptimal care Recent studies have shown
antipsychotic use is also a drug safety issue (Huybrechts et al 2012) Antipsychotic
medication use is associated with increased risks of adverse events such as movement
disorders falls hip fractures and cerebrovascular events Their use in older adults with
dementia carries an increased risk of death Safety concerns with antipsychotic medication
use in older adults also include the risks of hyperprolactinemia pneumonia
0
5
10
15
20
25
30
Percent
2012 2013
Adult long-stay nursing home residents who received antipsychotic medication by raceethnicity and number of chronic conditions 2012-2013
Key NHOPI = Native Hawaiian or Other Pacific Islander AIAN = American Indian or Alaska Native
Source Centers for Medicare amp Medicaid Services Minimum Data Set 2012-2013
Denominator Nursing home residents of any age who have at least 101 cumulative days in the facility excluding residents with schizophrenia
Tourettersquos syndrome and Huntingtonrsquos disease
Numerator Subset of denominator that receives an antipsychotic medication
Note For this measure lower percentages are better
2012 Achievable
Benchmark 150
0
5
10
15
20
25
30
Percent
2012 2013
Adult long-stay nursing home residents who received antipsychotic medication by raceethnicity and number of chronic conditions 2012-2013
Key NHOPI = Native Hawaiian or Other Pacific Islander AIAN = American Indian or Alaska Native
Source Centers for Medicare amp Medicaid Services Minimum Data Set 2012-2013
Denominator Nursing home residents of any age who have at least 101 cumulative days in the facility excluding residents with schizophrenia
Tourettersquos syndrome and Huntingtonrsquos disease
Numerator Subset of denominator that receives an antipsychotic medication
Note For this measure lower percentages are better
2012 Achievable
Benchmark 150
Patient Safety
26 | National Healthcare Quality and Disparities Report
thromboembolism cerebrovascular events and other cardiovascular adverse events (Chiu et
al 2015)
Overall Percentage The percentage of long-stay nursing home residents who had
antipsychotic medications was 176 in 2013
Groups With Disparities
In 2013 the percentage of residents receiving antipsychotic medication was higher for
Hispanic residents (201) than for White residents (180)
In 2012 and 2013 the percentage of long-stay residents who received antipsychotic
medications was worse for residents with one or more chronic conditions than for
residents with no chronic conditions
Achievable Benchmark
The 2012 top 6 State achievable benchmark was 150 The States that contributed to the
achievable benchmark are Alaska California Hawaii Michigan New Jersey and
Wyoming Asians NHOPIs residents with no chronic conditions and residents with one chronic
condition achieved the benchmark
Antipsychotic Medication Among Nursing Home Residents by State
Long-stay nursing home residents who received antipsychotic medication by State 2013
Source Centers for Medicare amp Medicaid Services Minimum Data Set 2013
Denominator Nursing home residents of any age who have at least 101 cumulative days in the facility
Note For this measure lower percentages are better
AZ
CA
UT
CT
FL
GA
IA
IL
KS
MA
MDMO
NJ
NY
OR
PA
SC
TN
CO
WA
WI
VA
ME
MN
MI
NC
TX
KY
WV
RI
NE
VT
NV OH
SD
AR
IN
NH
MT
ID
WY
ND
NMOK
LA
MS AL
DE
AKAK
HI
DC
85-153 (1st Quartile)
154-173 (2nd Quartile)
No Data
174-192 (3rd Quartile)
PR193-234 (4th Quartile)
Long-stay nursing home residents who received antipsychotic medication by State 2013
Source Centers for Medicare amp Medicaid Services Minimum Data Set 2013
Denominator Nursing home residents of any age who have at least 101 cumulative days in the facility
Note For this measure lower percentages are better
AZ
CA
UT
CT
FL
GA
IA
IL
KS
MA
MDMO
NJ
NY
OR
PA
SC
TN
CO
WA
WI
VA
ME
MN
MI
NC
TX
KY
WV
RI
NE
VT
NV OH
SD
AR
IN
NH
MT
ID
WY
ND
NMOK
LA
MS AL
DE
AKAK
HI
DC
85-153 (1st Quartile)
154-173 (2nd Quartile)
No Data
174-192 (3rd Quartile)
PR193-234 (4th Quartile)
Patient Safety
Overall This map shows overall rankings of States (by quartiles) in the percentage of long-
stay nursing home residents who received antipsychotic medication in 2013 Values ranged
from 85 to 234
Differences by State Interquartile ranges follow
First quartile (lowest) 85-153 (AK CA DC DE HI MD MI MN NJ NC SC
WI WV)
Second quartile (second lowest) 153 -173 (CO ID MT NM NY ND OR PA
RI SD VT WA WY)
Third quartile (second highest) 174-192 (AZ CT GA IN IA KS ME MA MO
NV OH OK VA)
Fourth quartile (highest) 193-234 (AL AR FL IL KY LA MS NE NH TN
TX UT)
Eight of the 12 States in the quartile with the highest percentage of long-stay nursing
home residents who received antipsychotic medication were in the South
Patient Safety in the Home Health Setting
Home health agencies provide services to beneficiaries who are homebound and need skilled
nursing care or therapy
Approximately 12 million individuals receive home health care from more than 33000
providers for causes including acute illness long-term health conditions permanent
disability or terminal illness (NAHCH 2010)
Improvements among home health patients can reflect the quality of care from home health
agencies
Measures include
Home health patients with improvement in surgical wounds
Home health patients with improvements in their ability to take medications orally
National Healthcare Quality and Disparities Report | 27
Patient Safety
Improvement in Surgical Wounds
75
80
85
90
95
100
2010 2011 2012 2013
Pe
rce
nt
White Black Asian Hispanic
75
80
85
90
95
100
2010 2011 2012 2013
Pe
rce
nt
Total 0-64 65-74
75-84 85+
2011 Achievable
Benchmark 913
Home health patients with improvement in surgical wounds by age and raceethnicity 2010-2013
Source Centers for Medicare amp Medicaid Services Outcome and Assessment Information Set 2010-2013
Denominator Number of home health episodes during the measurement period in which the patient of any age had a surgical wound and the
episode ended with the patient discharged from home health care
Note White Black and Asian are non-Hispanic Hispanic includes all races
2011 Achievable
Benchmark 913
75
80
85
90
95
100
2010 2011 2012 2013
Per
cen
t
White Black Asian Hispanic
75
80
85
90
95
100
2010 2011 2012 2013
Per
cen
t
Total 0-64 65-74
75-84 85+
2011 Achievable
Benchmark 913
Home health patients with improvement in surgical wounds by age and raceethnicity 2010-2013
Source Centers for Medicare amp Medicaid Services Outcome and Assessment Information Set 2010-2013
Denominator Number of home health episodes during the measurement period in which the patient of any age had a surgical wound and the
episode ended with the patient discharged from home health care
Note White Black and Asian are non-Hispanic Hispanic includes all races
2011 Achievable
Benchmark 913
Importance Normal wound healing after an operation is an important marker of good care
The home health team should regularly change wound dressing and teach the patient about
wound care
Overall Percentage In 2013 the percentage of home health patients with improvement in
their surgical wounds was 890
Trends The percentage of health home patients with surgical wound improvement increased
between 2010 and 2013
Groups With Disparities
In 2013 compared with residents under age 65 years (856) all other age groups had
better percentages of improvement in surgical wounds The percentage was 893 for
ages 65-74 905 for ages 75-84 and 917 for ages 85 and over
In 2013 compared with Whites (893) Blacks (878) Asians (882) and Hispanics
(874) had worse percentages of improvement in surgical wounds
The 2010 through 2013 trend in the percent of home health patients with surgical wound
improvement did not change for those over age 65 relative to persons under age 65 years
28 | National Healthcare Quality and Disparities Report
Patient Safety
Achievable Benchmark
The 2011 top 5 State achievable benchmark was 913 The States that contributed to the
benchmark are Alabama Mississippi Nevada Oklahoma and South Carolina
Home health patients age 85 years and over achieved the benchmark for surgical wound
improvement in 2013
At the current rate of progress patients ages 75-84 years could reach the benchmark
within a year Patients ages 65-74 years could achieve the benchmark in approximately 2
years
White home health patients could achieve the benchmark in approximately 2 years
Improvement in Ability To Take Medication Orally
0
20
40
60
80
100
2010 2011 2012 2013
Per
cen
t
White Black Asian Hispanic
0
20
40
60
80
100
2010 2011 2012 2013
Per
cen
t
Total 0-64 65-74
75-84 85+
2008 Achievable
Benchmark 516
Home health patients with improvement in their ability to take medications orally by age and raceethnicity 2010-2013
Source Centers for Medicare amp Medicaid Services Outcome and Assessment Information Set 2010-2013
Denominator Number of home health care episodes in which a patient of any age was unable to take oral medications independently at the
start of the episode that ended during the measurement period
Note White Black and Asian are non-Hispanic Hispanic includes all races
2008 Achievable
Benchmark 516
0
20
40
60
80
100
2010 2011 2012 2013
Per
cen
t
White Black Asian Hispanic
0
20
40
60
80
100
2010 2011 2012 2013
Per
cen
t
Total 0-64 65-74
75-84 85+
2008 Achievable
Benchmark 516
Home health patients with improvement in their ability to take medications orally by age and raceethnicity 2010-2013
Source Centers for Medicare amp Medicaid Services Outcome and Assessment Information Set 2010-2013
Denominator Number of home health care episodes in which a patient of any age was unable to take oral medications independently at the
start of the episode that ended during the measurement period
Note White Black and Asian are non-Hispanic Hispanic includes all races
2008 Achievable
Benchmark 516
Importance Taking medications correctly is important to the health status and quality of life
of individuals living in the community The home health team can help teach a patient ways
to organize drugs and take them properly
Overall Percentage In 2013 the percentage of home health patients with improvement in
their ability to take medications orally was 513
Trends Between 2010 and 2013 there was improvement in the overall percentage of home
health patients with improved ability to take medications orally
National Healthcare Quality and Disparities Report | 29
Patient Safety
Groups With Disparities
In 2013 the percentage of home health patients with improvement in their ability to take
medications orally was worse for those age 85 years and over (398) compared with
those under age 65 years (577)
The percentage of patients with improvement in their ability to take medications orally
was worse among Hispanic home health patients (400) than among White patients
(526) in 2013
From 2010 to 2013 the gap between Blacks and Whites decreased and the gap between
Asians and Whites and Hispanics and Whites increased
Achievable Benchmark
The 2008 top 5 State achievable benchmark was 516 The States that contributed to the
achievable benchmark are Iowa Massachusetts New Jersey North Dakota and South
Carolina
The benchmark was achieved among age groups under 85 years and by White and Black
home health patients
The total population is estimated to reach the benchmark in less than a year Hispanic
patients and patients age 85 years and over are farthest from the benchmark
Improvement in Ability To Take Medication Orally by State
Home health patients with improvement in their ability to take medications orally by raceethnicity by State 2013
Source Centers for Medicare amp Medicaid Services Outcome and Assessment Information Set 2013
Denominator Number of home health care episodes in which a patient of any age was unable to take oral medications independently at the
start of the episode that ended during the measurement period
AZ
CA
UT
CT
FL
GA
IA
IL
KS
MA
MDMO
NJ
NY
OR
PA
SC
TN
CO
WA
WI
VA
ME
MN
MI
NC
TX
KY
WV
RI
NE
VT
NV OH
SD
AR
IN
NH
MT
ID
WY
ND
NMOK
LA
MS AL
DE
AKAK
HI
No significant difference between rates
of Hispanics and non-Hispanic Whites
Non-Hispanic Whites have significantly
worse rate than Hispanics
States do not have data that meet the
criteria for statistical reliability data
quality or confidentiality
Hispanics have significantly worse rate
than non-Hispanic Whites
DC
Home health patients with improvement in their ability to take medications orally by raceethnicity by State 2013
Source Centers for Medicare amp Medicaid Services Outcome and Assessment Information Set 2013
Denominator Number of home health care episodes in which a patient of any age was unable to take oral medications independently at the
start of the episode that ended during the measurement period
AZ
CA
UT
CT
FL
GA
IA
IL
KS
MA
MDMO
NJ
NY
OR
PA
SC
TN
CO
WA
WI
VA
ME
MN
MI
NC
TX
KY
WV
RI
NE
VT
NV OH
SD
AR
IN
NH
MT
ID
WY
ND
NMOK
LA
MS AL
DE
AKAK
HI
No significant difference between rates
of Hispanics and non-Hispanic Whites
Non-Hispanic Whites have significantly
worse rate than Hispanics
States do not have data that meet the
criteria for statistical reliability data
quality or confidentiality
Hispanics have significantly worse rate
than non-Hispanic Whites
DC
30 | National Healthcare Quality and Disparities Report
Patient Safety
Geographic Variation
In 2013 Hispanic home health patients had worse rates of improvement in taking oral
medications than non-Hispanic White patients in 11 States (Arizona California
Connecticut Florida Illinois Indiana Massachusetts Nevada New York North
Carolina and Texas
Non-Hispanic White patients had worse rates of improvement than Hispanic patients in
five States (Hawaii Idaho Iowa Michigan and Pennsylvania)
Patient Safety in the Ambulatory Setting
Although patient safety initiatives frequently focus on inpatient hospital events adverse
effects of medical care may be identified and treated in outpatient settings
Adverse effects of medical care can follow care or procedures in hospitals emergency
departments physician offices or other settings
Measures include
Patient safety and quality issues by frequency of occurrence in outpatient medical offices
Adults age 65 years and over who received potentially inappropriate prescription medications during the calendar year
Percentage of hemodialysis patients with vascular catheter in use for 90 days or longer
For more information see the PSNet link to Patient Safety Primer Patient Safety in
Ambulatory Care httpspsnetahrqgovprimersprimer16patient-safety-in-ambulatory-care
National Healthcare Quality and Disparities Report | 31
Patient Safety
Patient Safety and Quality Issues
Patient safety and quality issues by frequency of occurrence in outpatient medical offices 2014
Source Westat analysis of the AHRQ 2014 Medical Office Survey on Patient Safety Culture Comparative Database (N=935)
Note For this measure less frequent occurrences during the year are better
0
20
40
60
80
100
A pharmacy contactedour office to clarify orcorrect a prescription
A patient was unableto get an appointmentwithin 48 hours for anacuteserious problem
A patients medicationlist was not updatedduring his or her visit
The results from a labor imaging test were notavailable when needed
A patients chartmedicalrecord was not available
when needed
Occurred DailyWeekly
Occurred Monthly
Occurred Not at All to Several Times Over the Past Year
Patient safety and quality issues by frequency of occurrence in outpatient medical offices 2014
Source Westat analysis of the AHRQ 2014 Medical Office Survey on Patient Safety Culture Comparative Database (N=935)
Note For this measure less frequent occurrences during the year are better
0
20
40
60
80
100
A pharmacy contactedour office to clarify orcorrect a prescription
A patient was unableto get an appointmentwithin 48 hours for anacuteserious problem
A patients medicationlist was not updatedduring his or her visit
The results from a labor imaging test were notavailable when needed
A patients chartmedicalrecord was not available
when needed
Occurred DailyWeekly
Occurred Monthly
Occurred Not at All to Several Times Over the Past Year
Importance Most health care takes place in the outpatient or ambulatory care setting Lack
of access to care and lack of access to timely and accurate medical information and test
results may contribute to patient safety events such as missed or delayed diagnoses
medication errors failure to order appropriate diagnostic or laboratory tests incorrect
interpretation of tests and inadequate followup on results
Overall Percentage
Almost 30 of medical offices participating in the survey reported daily or weekly
occurrences of being contacted by the pharmacist for clarification or correction on a
prescription
After prescription clarifications or corrections by the pharmacy medical offices were
next most likely to report daily or weekly issues with patients being unable to get an
appointment within 48 hours for an acute or serious problem (14) or the patientrsquos
medication list not getting updated during their visit (11)
The share of medical offices reporting that lab or imaging tests were not available when
needed reached nearly 20 when considering monthly occurrences as well as those that
occurred more frequently
32 | National Healthcare Quality and Disparities Report
Patient Safety
Potentially Inappropriate Prescriptions for Older Adults
Adults age 65 years and over who received potentially inappropriate prescription medications during the calendar year by sex and
perceived health status 2003ndash2013
Source Agency for Healthcare Research and Quality Medical Expenditure Panel Survey 2003-2013
Note For this measure lower percentages are better Prescription medications received include all prescribed medications initiall y purchased
or otherwise obtained as well as any refills For more information on inappropriate medications see the American Geriatrics Society 2012 Beers
Criteria Update Expert Panel American Geriatrics Society updated Beers Criteria for potentially inappropriate medication use in older adults J
Am Geriatr Soc 2012 Apr60(4)616-31
0
5
10
15
20
25
30
Per
cen
t
Total Male Female
0
5
10
15
20
25
30
Per
cen
t
ExcellentVery GoodGood FairPoor
Adults age 65 years and over who received potentially inappropriate prescription medications during the calendar year by sex and
perceived health status 2003ndash2013
Source Agency for Healthcare Research and Quality Medical Expenditure Panel Survey 2003-2013
Note For this measure lower percentages are better Prescription medications received include all prescribed medications initially purchased
or otherwise obtained as well as any refills For more information on inappropriate medications see the American Geriatrics Society 2012 Beers
Criteria Update Expert Panel American Geriatrics Society updated Beers Criteria for potentially inappropriate medication use in older adults J
Am Geriatr Soc 2012 Apr60(4)616-31
0
5
10
15
20
25
30
Per
cen
t
Total Male Female
0
5
10
15
20
25
30
Per
cen
t
ExcellentVery GoodGood FairPoor
Importance Some drugs that are prescribed for older patients are known to be potentially
harmful for this age group
Overall Percentage In 2013 the percentage of adults age 65 years and over who received
potentially inappropriate prescription medications was 114
Trends From 2003 to 2013 the percentage of adults age 65 years and over who received
potentially inappropriate prescription medications improved overall for both sexes and for
people with excellentvery goodgood health status and people with fairpoor health status
Groups With Disparities
In all years the percentage of patients receiving potentially inappropriate medications
was higher among females compared with males This gap was not changing over time
In all years from 2003 to 2013 the percentage of patients receiving potentially
inappropriate medications was higher among people with fairpoor health status
compared with people with excellentgood health status This gap was not changing over
time
National Healthcare Quality and Disparities Report | 33
Patient Safety
Long-Term Catheter Use in Dialysis Patients
HI
AKAK
AZ
CA
UT
CT
FL
GA
IA
IL
KS
MA
MDMO
NJ
NY
OR
PA
SC
TN
CO
WA
WI
VA
ME
MN
MI
NC
TX
KY
WV
RI
NE
VT
NV OH
SD
AR
IN
NH
MT
ID
WY
ND
NMOK
LA
MSAL
DE
DC
10-12
13-18
7-9
PR
Source Centers for Medicare and Medicaid Services Dialysis Facility Compare 2014
Denominator At-risk adult Medicare patients with a central venous catheter who were receiving regular hemodialysis treatments at dialysis
facilities
Note For this measure lower percentages are better
Percentage of hemodialysis patients with central venous catheters used for vascular access for 90 days or longer by State 2014
HI
AKAK
AZ
CA
UT
CT
FL
GA
IA
IL
KS
MA
MDMO
NJ
NY
OR
PA
SC
TN
CO
WA
WI
VA
ME
MN
MI
NC
TX
KY
WV
RI
NE
VT
NV OH
SD
AR
IN
NH
MT
ID
WY
ND
NMOK
LA
MSAL
DE
DC
10-12
13-18
7-9
PR
Source Centers for Medicare and Medicaid Services Dialysis Facility Compare 2014
Denominator At-risk adult Medicare patients with a central venous catheter who were receiving regular hemodialysis treatments at dialysis
facilities
Note For this measure lower percentages are better
Percentage of hemodialysis patients with central venous catheters used for vascular access for 90 days or longer by State 2014
Importance Central venous catheters are frequently used for vascular access to dialysis
patients until a fistula or graft is formed Central venous catheters have higher rates of
infection and adverse events among patients receiving dialysis treatment compared with
other forms of vascular access To decrease the likelihood of adverse events catheters should
be used for less than 90 days
Overall Percentage Nationally an average of 10 of dialysis patients used central venous
catheters for 90 days or longer in 2014
Geographic Variation In 2014 Alabama and Kansas had the lowest percentages of dialysis
patients using central venous catheters for 90 days or longer (7) and Puerto Rico had the
highest percentage (18) of long-term catheter use
Patient Safety Infrastructure
Efforts to improve patient safety have been accompanied by various infrastructure
enhancements
Growth in patient safety organizations which assist providers in detecting and reducing
risks and hazards from care delivery that may lead to patient harm
System improvement initiatives at the Veterans Health Administration (VHA)
34 | National Healthcare Quality and Disparities Report
Patient Safety
Development of the National Practitioner Data Bank a clearinghouse for information on
medical malpractice payments
Patient Safety Organizations
Patient safety organizations (PSOs) aim to reduce preventable adverse events near misses
and unsafe conditions in all health care settings
PSOs provide an environment for health care providers to voluntarily report discuss and
learn from patient safety events and quality analyses on a privileged and confidential basis
Measures include
Number of PSOs serving each State
Variation in concentrations of compounded liquid medications for children
Patient Safety Organizations AHRQ Common Formats
AHRQ Common Formats provide a standardized method for PSOs health care providers
and other organizations to collect and report patient safety events
Data element standards are important for aggregating and analyzing events across
providers
AHRQ Common Formats have been developed for a variety of settings of care
Acute care hospitals
Skilled nursing facilities
Retail pharmacy
More information is available at httpspsoahrqgovcommon
National Healthcare Quality and Disparities Report | 35
Patient Safety
Number of Patient Safety Organizations
AZ (2)
CA (3)
UT (2)
CT(3)
FL (8)
GA (5)
IA (4)
IL (7)
KS (5)
MA(3)
MD (4)MO(2)
NJ(3)
NY (5)
OR (3)
PA (5)
SC (4)
TN (5)
CO (2)
WA (2)
WI (5)
VA (7)
ME(2)
MN(3)
MI (3)
NC (7)
TX (6)
KY (4)WV (3)
RI(2)
NE (2)
VT(2)
NV (2)
OH (2)
SD (1)
AR (4)
IN (2)
NH(2)
MT (2)
ID (3)
WY (2)
ND (1)
NM (3)OK (2)
LA (1)
MS (2)
AL (2)
DE(2)
HI (2)
AKAK (2)
DC(3)
PR (0)
1-2
3-4
5-6
7-8
Number of PSOs
excluding PSOs
operating nationally
Number of Patient Safety Organizations by area served 2014
Source Agency for Healthcare Research and Quality Patient Safety Organization Information Form Calendar Year 2014 and PSO-PPC
Contact Database
Note PSOs included in this map were AHRQ-listed during any part of 2014 and submitted the PSO Profile to the PSO Privacy Protection
Center (PSO-PPC) in early 2015 A PSO may have members in one or more States regardless of headquarters location Each State shows the
number of PSOs that serve that State map excludes 38 PSOs that are available to providers in all States
AZ (2)
CA (3)
UT (2)
CT(3)
FL (8)
GA (5)
IA (4)
IL (7)
KS (5)
MA(3)
MD (4)MO(2)
NJ(3)
NY (5)
OR (3)
PA (5)
SC (4)
TN (5)
CO (2)
WA (2)
WI (5)
VA (7)
ME(2)
MN(3)
MI (3)
NC (7)
TX (6)
KY (4)WV (3)
RI(2)
NE (2)
VT(2)
NV (2)
OH (2)
SD (1)
AR (4)
IN (2)
NH(2)
MT (2)
ID (3)
WY (2)
ND (1)
NM (3)OK (2)
LA (1)
MS (2)
AL (2)
DE(2)
HI (2)
AKAK (2)
DC(3)
PR (0)
1-2
3-4
5-6
7-8
Number of PSOs
excluding PSOs
operating nationally
Number of Patient Safety Organizations by area served 2014
Source Agency for Healthcare Research and Quality Patient Safety Organization Information Form Calendar Year 2014 and PSO-PPC
Contact Database
Note PSOs included in this map were AHRQ-listed during any part of 2014 and submitted the PSO Profile to the PSO Privacy Protection
Center (PSO-PPC) in early 2015 A PSO may have members in one or more States regardless of headquarters location Each State shows the
number of PSOs that serve that State map excludes 38 PSOs that are available to providers in all States
Importance All patient safety organizations (PSOs) have authority to operate in all 50
States and US territories but not all do In 2014 38 PSOs self-reported being available to
providers nationally PSOs not available nationally serve specific States
Geographic Variation
Nearly all States have at least 2 PSOs available to providers in their State in addition to
the 38 national PSOs that serve all States
Florida has the most PSOs available with 8 in addition to the 38 nationally available
PSOs The States with the largest number of PSOs available are generally on the East
Coast (eg North Carolina Virginia New York Pennsylvania Tennessee Georgia) or
have large populations (eg Texas Illinois)
North Dakota South Dakota and Louisiana are the only states with just one PSO serving
their State in addition to the 38 national PSOs
Puerto Rico is served by one national PSO only
36 | National Healthcare Quality and Disparities Report
Patient Safety
Compounded Liquid Medications for Children
Compounded liquid medications for children in Michigan 2012
Source Levy S Buckley B Safe Table Success The MI Pediatric Safety Collaboration Presentation presented at the 7th Annual
Meeting of Patient Safety Organizations (PSOs) Rockville MD 2015 April and Rood JM Engels MJ Ciarkowski SL et al Variability in
compounding of oral liquids for pediatric patients a patient safety concern J Am Pharm Assn 201454(4)383-9
Note Information represents 244 responses to online survey of approximately 2000 Michigan pharmacies conducted in June 2012 by
The University of Michigan College of Pharmacy in collaboration with the Michigan Pharmacists Association
0
10
20
30
40
50
1 2 3 4 5 6 7 8 9
Nu
mb
er o
f D
rugs
Number of Unique Concentrations
Number of Different Compounded Concentrations per Drug
0
10
20
30
40
50
No Harm No Harm ButMonitoring
TemporaryHarm
Pe
rce
nt
Compounding Errors by Related Harm and Pharmacy Setting
Inpatient Outpatient
Compounded liquid medications for children in Michigan 2012
Source Levy S Buckley B Safe Table Success The MI Pediatric Safety Collaboration Presentation presented at the 7th Annual
Meeting of Patient Safety Organizations (PSOs) Rockville MD 2015 April and Rood JM Engels MJ Ciarkowski SL et al Variability in
compounding of oral liquids for pediatric patients a patient safety concern J Am Pharm Assn 201454(4)383-9
Note Information represents 244 responses to online survey of approximately 2000 Michigan pharmacies conducted in June 2012 by
The University of Michigan College of Pharmacy in collaboration with the Michigan Pharmacists Association
0
10
20
30
40
50
1 2 3 4 5 6 7 8 9
Nu
mb
er o
f D
rugs
Number of Unique Concentrations
Number of Different Compounded Concentrations per Drug
0
10
20
30
40
50
No Harm No Harm ButMonitoring
TemporaryHarm
Per
cen
t
Compounding Errors by Related Harm and Pharmacy Setting
Inpatient Outpatient
Importance
Liquid medications are widely used in pediatrics because many children find it difficult
to swallow tablets or capsules If not commercially manufactured these liquid
medications require a pharmacist to compound them to the correct dosage for the patient
This practice of compounding has led to a variety of medication concentrations in use In
the absence of standard concentrations for compounded medications there is a risk that
children may accidentally receive medications that are too potent and can be dangerous
or are too weak to be effective
The Michigan Health amp Hospital Association Keystone Center Patient Safety
Organization hosts five Pediatric Safe Tables each year Safe Tables provided a
confidential and legally protected environment to discuss challenges and improvement
strategies regarding inconsistent medication concentrations for compounded oral liquids
without fear of punitive action against them
National Healthcare Quality and Disparities Report | 37
Patient Safety
Overall Percentage
More than half (527) of drugs identified in the 2012 survey had 3 or more unique
concentrations dispensed to children across Michigan For example Rifampin used to
treat bacterial infections was reported to have 8 different concentrations dispensed to
patients
Nearly one-third (313) of reported errors caused temporary harm or required additional
monitoring despite no harm
Standardization of Compounded Liquid Medications
Source Michigan Health amp Hospital Association Keystone Center Patient Safety Organization and University of Michigan College of Pharmacy
State-Wide Initiative to Standardize the Compounding of Oral Liquids in Pediatrics
Standardization of compounded liquid medications for children in Michigan 2011
Issue identificationbull Hospitals attending PSO Pediatrics Safe
Table raise compounded medication concentrations as a major safety issue
bull Small focus group determines extent of problem
bull Michigan pharmacies are surveyed about baseline concentrations
Develop Interventionbull PSO Quarterly Safe Tables are held to
discuss cases and practicesbull Team develops recommendations for
standard concentrationsbull Consensus is achieved for frequently
compounded pediatric medications 470 formulations for 147 drug entities are reduced to 104 concentrations for 100 drugs
Practice changebull Toolkit is createdbull Standards are disseminated to Michigan
prescribers and pharmacies bull Standards are disseminated to PSO
members and Safe Table participants
Source Michigan Health amp Hospital Association Keystone Center Patient Safety Organization and University of Michigan College of Pharmacy
State-Wide Initiative to Standardize the Compounding of Oral Liquids in Pediatrics
Standardization of compounded liquid medications for children in Michigan 2011
Issue identificationbull Hospitals attending PSO Pediatrics Safe
Table raise compounded medication concentrations as a major safety issue
bull Small focus group determines extent of problem
bull Michigan pharmacies are surveyed about baseline concentrations
Develop Interventionbull PSO Quarterly Safe Tables are held to
discuss cases and practicesbull Team develops recommendations for
standard concentrationsbull Consensus is achieved for frequently
compounded pediatric medications 470 formulations for 147 drug entities are reduced to 104 concentrations for 100 drugs
Practice changebull Toolkit is createdbull Standards are disseminated to Michigan
prescribers and pharmacies bull Standards are disseminated to PSO
members and Safe Table participants
The Role of PSO Safe Tables Based on adverse medication events discussed in the
Michigan Health amp Hospital Association (MHA) Keystone Center Patient Safety
Organization (PSO) Safe Tables in July 2011 the Michigan Pediatric Safety Collaboration
was developed to further assess the scope of the problem and formulate a solution
The Collaborative The Michigan Pediatric Safety Collaboration includes individuals from
the University of Michigan College of Pharmacy the Michigan Pharmacists Association
(MPA) the Food and Drug Administration (FDA) and the MHA Keystone PSO
38 | National Healthcare Quality and Disparities Report
Patient Safety
Practice Change
As a result of the standardization effort 470 unique formulations for 147 drug entities
were reduced to 104 different concentrations for 100 drugs
The Michigan Pediatric Safety Collaboration developed a multistep process to implement
standards for compounding medications The MPA surveyed pharmacies in Michigan to
better define the nature and scope of the problem The PSO continued to act as convener
The result was the creation and dissemination of statewide standards for 120 frequently
compounded pediatric medications
Veterans Health Administration
The National Center for Patient Safety is part of the Veterans Health Administration the
Nationrsquos largest integrated health care system
Patient safety-related system improvement initiatives include
The Daily Planreg
Purchasing for Safety Initiative
Patient Safety Improvement Initiative
Patient safety improvement initiative The Daily Planreg at Veterans Affairs Medical Centers 2009
Source King BJ Mills PD Fore A et al The Daily Planreg including patients for safetys sake Nurs Manage 201243(3)15-8
0
10
20
30
40
50
Identified atleast one
error
Identifiederror
of omission
Identifiederror
ofcommission
Nurses Who Identified Errors in Patient Treatment Plan by Type
0
10
20
30
40
50
Patient founddiscrepancy inplanned care
Family founddiscrepancy inplanned care
Nursing Stafffound
discrepancyin plannedtreatment
Respondents Who Identified Errors or Discrepancies Through The Daily Plan reg
Patient safety improvement initiative The Daily Planreg at Veterans Affairs Medical Centers 2009
Source King BJ Mills PD Fore A et al The Daily Planreg including patients for safetys sake Nurs Manage 201243(3)15-8
0
10
20
30
40
50
Identified atleast one
error
Identifiederror
of omission
Identifiederror
ofcommission
Nurses Who Identified Errors in Patient Treatment Plan by Type
0
10
20
30
40
50
Patient founddiscrepancy inplanned care
Family founddiscrepancy inplanned care
Nursing Stafffound
discrepancyin plannedtreatment
Respondents Who Identified Errors or Discrepancies Through The Daily Plan reg
National Healthcare Quality and Disparities Report | 39
Patient Safety
Importance The Daily Planreg
is a two-page printed summary that acts as a schedule for
patients and providers each day It shows the procedures laboratory tests and medications
scheduled for that day and lists essential health information such as patientrsquos name allergies
and current medications It can be tailored for a patientrsquos needs by extracting orders from the
electronic medical record (EMR) The Daily Planreg
is intended to facilitate patient and family
engagement throughout the course of care The Daily Planreg
shows promise for improving
patient safety Since 2009 the VA has implemented The Daily Planreg
in more than 65
hospitals both inpatient and outpatient care settings The Daily Planreg
is shared more than
75000 times a month and the VA plans to continue the spread of The Daily Planreg
at
additional sites in 2016
Findings
As part of a pilot test in 2009 a total of 198 patients and 85 nurses responded to a survey
across 10 facilities Nurses had an average of 34 patients per shift who received The
Daily Planreg Patients responded about their own experiences whereas nurses reported
about all of their patients who received The Daily Planreg
Nearly half (475) of patients reported finding a discrepancy in planned care through
The Daily Planreg In addition 30 of patients reported that their family members found a
discrepancy Although not every discrepancy will be a potential medical error having a
shared understanding of the plan of care decreases the risk of error
More than one in six nurses (176) identified a discrepancy in treatment among their
patients through The Daily Planreg Most of these nurses (153) found one or more errors
of omission and a smaller share (106) of nurses found one or more errors of
commission some found both
40 | National Healthcare Quality and Disparities Report
Patient Safety
Issues Related to Ventilators
Common use-issues related to ventilators at the Veterans Health Administration 2006-2014 (combined)
Source Veterans Health Administration National Center for Patient Safety data collected October 2006 to October 2014
Note Examples of equipment failures include ventilator shutdown and other ventilator problems Ventilator settings include setup problems and
incorrect settings Support activities include space utilities and supplies Transport includes accidental extubation other transportation issues
and vehicle-related issues Alarms include alarm settings and alarm connection Training includes unknown ventilator model and other training
concerns
0
20
40
60
80
100
120
140
160
EquipmentFailure
VentilatorSettings
SupportActivities
Transport Alarms Training
Nu
mb
er o
f R
epo
rts
Common use-issues related to ventilators at the Veterans Health Administration 2006-2014 (combined)
Source Veterans Health Administration National Center for Patient Safety data collected October 2006 to October 2014
Note Examples of equipment failures include ventilator shutdown and other ventilator problems Ventilator settings include setup problems and
incorrect settings Support activities include space utilities and supplies Transport includes accidental extubation other transportation issues
and vehicle-related issues Alarms include alarm settings and alarm connection Training includes unknown ventilator model and other training
concerns
0
20
40
60
80
100
120
140
160
EquipmentFailure
VentilatorSettings
SupportActivities
Transport Alarms Training
Nu
mb
er o
f R
epo
rts
Importance Beginning with a focus on ventilators the Veterans Health Administrationrsquos
human factors-based Purchasing for Safety Initiative communicates the most common use-
issues associated with medical devices in order to ultimately remove or contain identified
vulnerabilities and prevent further harm
Event Reporting Patient safety managers report events and close calls from more than 150
VA facilities to a national database The largest number of use issues related to ventilators
involved equipment failure and issues such as spontaneous ventilator shutdown compressor
failure and broken or missing parts Other categories of ventilator use issues involved the
physical space where the ventilator was used challenges of transporting patients on
ventilators and problems with ventilator settings and alarms Root cause analyses on reports
are conducted and Patient Safety Alerts are issued to share the learning internally
Other Key Components
Data on ventilator issues from the VA and the Food and Drug Administrationrsquos Medical
Product Safety Network are the basis for a ldquogovernment-industry dayrdquo to work with
manufacturers This information is used to help the device manufacturers better
understand the limits of human use of their products
National Healthcare Quality and Disparities Report | 41
Patient Safety
The VA also trains noncliniciansmdashsuch as biomedical engineers across the
organizationmdashto understand the devices consider the situation for their use and identify
what can go wrong (ldquofailure modesrdquo) in advance
The VA encourages discussions among clinicians about their experience in using devices
In the Applied Patient Safety Challenge hundreds of staff participate in brainstorming
about solutions and strategies for dealing with unexpected scenarios involving devices
National Practitioner Data Bank
Medical malpractice actions are one way to flag potential medical errors
Medical Malpractice Payment Reports are submitted to the National Practitioner Data Bank
by medical malpractice payers
Report of a monetary exchange made for the benefit of a physician dentist or other
health care provider
Result of a settlement or judgment of a written complaint or claim based on that
providerrsquos delivery of or failure to deliver health care services
Number of Medical Malpractice Payment Reports by Setting
Number of Medical Malpractice Payment Reports by health care setting 2004-2014
Source National Practitioner Data Bank (NPDB) Public Use Data File Health Resources and Services Administration Bureau of Health
Professions Division of Practitioner Data Banks 2004-2014
Note Health care setting was not collected by the NPDB for 2104 reports in 2004 ldquoOtherrdquo includes Medical Malpractice Payment Reports
related to unknown settings as well as those for a combination of inpatient and outpatient settings Reports pertain to patients of any age
0
2000
4000
6000
8000
10000
12000
14000
16000
18000
20000
2004 2005 2006 2007 2008 2009 2010 2011 2012 2013 2014
Nu
mb
er o
f R
epo
rts
Total Inpatient Outpatient Other
Number of Medical Malpractice Payment Reports by health care setting 2004-2014
Source National Practitioner Data Bank (NPDB) Public Use Data File Health Resources and Services Administration Bureau of Health
Professions Division of Practitioner Data Banks 2004-2014
Note Health care setting was not collected by the NPDB for 2104 reports in 2004 ldquoOtherrdquo includes Medical Malpractice Payment Reports
related to unknown settings as well as those for a combination of inpatient and outpatient settings Reports pertain to patients of any age
0
2000
4000
6000
8000
10000
12000
14000
16000
18000
20000
2004 2005 2006 2007 2008 2009 2010 2011 2012 2013 2014
Nu
mb
er o
f R
epo
rts
Total Inpatient Outpatient Other
42 | National Healthcare Quality and Disparities Report
Patient Safety
Trends The total number of medical malpractice payment reports (MMPRs) per year
decreased from 17641 in 2004 to 12699 in 2014
Variation Across Reports
Of 157022 MMPRs from 2004 through 2014 more reports related to care in the
outpatient setting (71937) than in the inpatient setting (60391)
Diagnosis-related and treatment-related payments were the most frequent types of
reports each accounting for about 27 of cases Reports of payments for medication-
related cases accounted for only 5 of MMPRs (data not shown)
Number of Medical Malpractice Payment Reports by Allegation and Harm
Number of Medical Malpractice Payment Reports by type of allegation and harm severity 2004-2014
Key Temporary injury = Minor temporary injury and Major temporary injury Permanent significant injury = Significant Permanent Injury
Major Permanent Injury Quadriplegia Brain Damage Lifelong care
Source National Practitioner Data Bank Public Use Data File Health Resources and Services Administration Bureau of Health Professions
Division of Practitioner Data Banks 2004-2014
Note Reports pertain to patients of any age
0
20
40
60
80
100
Treatment(n=42913)
Diagnosis(n=42507)
Surgery(n=36845)
Obstetrics(n=10555)
Medication(n=8287)
Monitoring(n=5329)
Anesthesia(n=4276)
Equipment(n=1161)
BehavioralHealth
(n=879)
Blood(n=379)
EmotionalInjury Only
InsignificantInjury
TemporaryInjury
PermanentMinor Injury
PermanentSignificant Injury
Death Unknown
Number of Medical Malpractice Payment Reports by type of allegation and harm severity 2004-2014
Key Temporary injury = Minor temporary injury and Major temporary injury Permanent significant injury = Significant Permanent Injury
Major Permanent Injury Quadriplegia Brain Damage Lifelong care
Source National Practitioner Data Bank Public Use Data File Health Resources and Services Administration Bureau of Health Professions
Division of Practitioner Data Banks 2004-2014
Note Reports pertain to patients of any age
0
20
40
60
80
100
Treatment(n=42913)
Diagnosis(n=42507)
Surgery(n=36845)
Obstetrics(n=10555)
Medication(n=8287)
Monitoring(n=5329)
Anesthesia(n=4276)
Equipment(n=1161)
BehavioralHealth
(n=879)
Blood(n=379)
EmotionalInjury Only
InsignificantInjury
TemporaryInjury
PermanentMinor Injury
PermanentSignificant Injury
Death Unknown
Overall Percentage From 2004 to 2014 medical malpractice payments were made for
allegations related to
Treatment (42913)
Diagnosis (42507)
Surgery (36845)
Obstetrics (10555)
Medication (8287)
Monitoring (5329)
National Healthcare Quality and Disparities Report | 43
Patient Safety
Anesthesia (4276)
Equipment or products (1161)
Behavioral health (879) and
IV and blood products (379)
Variation Across Reports
Death accounted for more than one-third of harm in payments related to monitoring
(499) diagnosis (393) medication (383) and anesthesia (363) allegations
More than half of all obstetric payments were for allegations of permanent severe harm
(570)
Temporary harm accounted for more than one-third of payments related to equipment
(485) and surgery (360)
Most of the behavioral health-related payments were for emotional harm (457) or
death (338)
References
Agency for Healthcare Research and Quality Making Health Care Safer II An Updated Critical Analysis of the
Evidence for Patient Safety Practices Comparative Effectiveness Review No 211 Rockville MD Agency for
Healthcare Research and Quality March 2013 AHRQ Publication No 13-E001-EF
httpwwwahrqgovsitesdefaultfileswysiwygresearchfindingsevidence-basedshy
reportsservicesqualityptsafetyII-fullpdf
Arriaga AF Lancaster RT Berry RW et al The better colectomy project association of evidence-based best-
practice adherence rates to outcomes in colorectal surgery Ann Surg 2009 Oct250(4)507-13
httpwwwncbinlmnihgovpubmed19734778
Centers for Disease Control and Prevention HAI Prevalence Survey
httpwwwcdcgovHAIsurveillanceindexhtml Last updated March 2016 Accessed March 4 2016
Centers for Disease Control and Prevention Nursing Homes and Assisted Living (Long-Term Care Facilities)
httpwwwcdcgovlongtermcare Last updated September 2015 Accessed March 4 2016
Chassin MR Loeb JM High-reliability health care getting there from here Milbank Q 201391(3)459-90
httpwwwncbinlmnihgovpmcarticlesPMC3790522 Accessed September 23 2015
Chiu Y Bero L Hessol NA et al A literature review of clinical outcomes associated with antipsychotic medication
use in North American nursing home residents Health Policy 2015 Jun119(6)802-813 Epub 2015 Feb 28 PMID
25791166 httpwwwsciencedirectcomsciencearticlepiiS0168851015000652 Accessed June 17 2015
Huybrechts KF Gerhard Crystal S et al Differential risk of death in older residents in nursing homes prescribed
specific antipsychotic drugs Population based cohort study BMJ 2012 Feb 23344e977 PMID 22362541
httpwwwncbinlmnihgovpmcarticlesPMC3285717 Accessed June 17 2015
Institute of Medicine Preventing Medication Errors Quality Chasm Series 2007
httpwwwnapeducatalog11623preventing-medication-errors-quality-chasm-series
National Association for Home Care amp Hospice Basic Statistics About Home Care Updated 2010
httpwwwnahcorgassets1710hc_statspdf Accessed August 31 2015
44 | National Healthcare Quality and Disparities Report
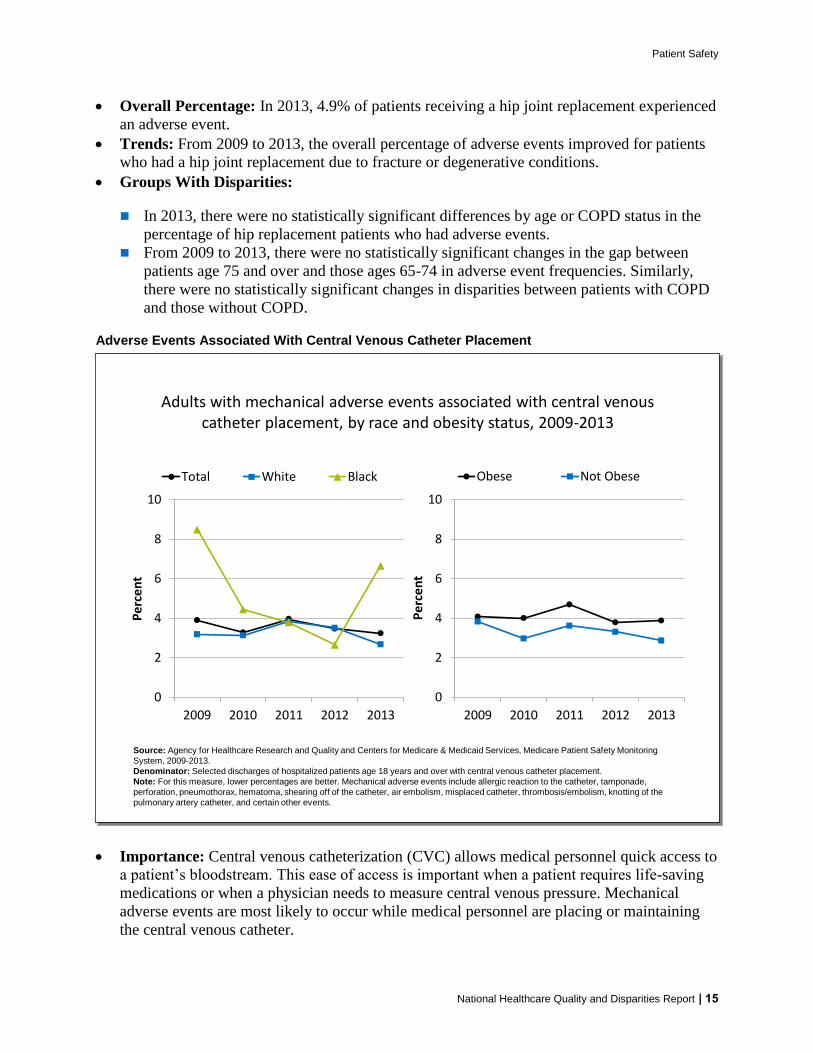
Patient Safety
Overall Percentage In 2013 49 of patients receiving a hip joint replacement experienced
an adverse event
Trends From 2009 to 2013 the overall percentage of adverse events improved for patients
who had a hip joint replacement due to fracture or degenerative conditions
Groups With Disparities
In 2013 there were no statistically significant differences by age or COPD status in the
percentage of hip replacement patients who had adverse events
From 2009 to 2013 there were no statistically significant changes in the gap between
patients age 75 and over and those ages 65-74 in adverse event frequencies Similarly
there were no statistically significant changes in disparities between patients with COPD
and those without COPD
Adverse Events Associated With Central Venous Catheter Placement
Adults with mechanical adverse events associated with central venous catheter placement by race and obesity status 2009-2013
Source Agency for Healthcare Research and Quality and Centers for Medicare amp Medicaid Services Medicare Patient Safety Monitoring
System 2009-2013
Denominator Selected discharges of hospitalized patients age 18 years and over with central venous catheter placement
Note For this measure lower percentages are better Mechanical adverse events include allergic reaction to the catheter tamponade
perforation pneumothorax hematoma shearing off of the catheter air embolism misplaced catheter thrombosisembolism knotting of the
pulmonary artery catheter and certain other events
0
2
4
6
8
10
2009 2010 2011 2012 2013
Pe
rce
nt
Total White Black
0
2
4
6
8
10
2009 2010 2011 2012 2013
Pe
rce
nt
Obese Not Obese
Adults with mechanical adverse events associated with central venous catheter placement by race and obesity status 2009-2013
Source Agency for Healthcare Research and Quality and Centers for Medicare amp Medicaid Services Medicare Patient Safety Monitoring
System 2009-2013
Denominator Selected discharges of hospitalized patients age 18 years and over with central venous catheter placement
Note For this measure lower percentages are better Mechanical adverse events include allergic reaction to the catheter tamponade
perforation pneumothorax hematoma shearing off of the catheter air embolism misplaced catheter thrombosisembolism knotting of the
pulmonary artery catheter and certain other events
0
2
4
6
8
10
2009 2010 2011 2012 2013
Pe
rce
nt
Total White Black
0
2
4
6
8
10
2009 2010 2011 2012 2013
Pe
rce
nt
Obese Not Obese
Importance Central venous catheterization (CVC) allows medical personnel quick access to
a patientrsquos bloodstream This ease of access is important when a patient requires life-saving
medications or when a physician needs to measure central venous pressure Mechanical
adverse events are most likely to occur while medical personnel are placing or maintaining
the central venous catheter
National Healthcare Quality and Disparities Report | 15
Patient Safety
Overall Percentage In 2013 32 of adults with central venous catheter placements
experienced an associated mechanical adverse event
Trends From 2009 to 2013 there were no statistically significant changes in the overall
percentage of adults with mechanical adverse events associated with central venous catheter
placement
Groups With Disparities
In 2013 the percentage of adults with mechanical adverse events associated with CVC
was worse for Blacks (67) compared with Whites (27) There were no statistically
significant differences by obesity status
From 2009 to 2013 there were no statistically significant changes in the gap between
Blacks and Whites in the percentage of adults with mechanical adverse events associated
with CVC
Adverse Drug Events
An estimated 400000 preventable ADEs occur each year in US hospitals generating
additional costs of $35 billion in 2006 dollars (IOM 2007)
An ADE is an injurymdashincluding physical harm mental harm or loss of functionmdash
resulting from medical intervention involving a drug
For more information see the PSNet link to Patient Safety Primer Medication Errors
httpspsnetahrqgovprimersprimer23medication-errors
The three initial targets of the HHS National Action Plan for Adverse Drug Event Prevention are
Anticoagulants and related bleeding
Diabetes agents and related hypoglycemia
Opioids and accidental overdose oversedation and respiratory depression
Measures of Patient Safety in the Hospital Setting Adverse Drug Events
Percentage of hospitalized adult patients who received a hypoglycemic agent and had an
adverse drug event
Percentage of hospitalized adult patients who had an anticoagulant-related adverse drug
event to warfarin
Number of opioid-related medication errors in patients of all ages
16 | National Healthcare Quality and Disparities Report
Patient Safety
Adverse Drug Events With Hypoglycemic Agents
Hospitalized adult patients who received a hypoglycemic agent who had adverse drug events with hypoglycemic agents by
raceethnicity 2010-2013 and renal disease 2009-2013
Source Agency for Healthcare Research and Quality and Centers for Medicare amp Medicaid Services Medicare Patient Safety Monitoring
System 2009-2013
Note For this measure lower percentages are better Hypoglycemic agents received by patients age 18 and over during a hospital stay include
insulin oral hypoglycemic or a combination of both The 2009 data for races did not meet the criteria for statistical reliability data quality or confidentiality
0
2
4
6
8
10
12
14
16
18
20
2009 2010 2011 2012 2013
Pe
rce
nt
Total Renal DiseaseNo Renal Disease
0
2
4
6
8
10
12
14
16
18
20
2010 2011 2012 2013
Pe
rce
nt
Total White BlackAsian Hispanic
Hospitalized adult patients who received a hypoglycemic agent who had adverse drug events with hypoglycemic agents by
raceethnicity 2010-2013 and renal disease 2009-2013
Source Agency for Healthcare Research and Quality and Centers for Medicare amp Medicaid Services Medicare Patient Safety Monitoring
System 2009-2013
Note For this measure lower percentages are better Hypoglycemic agents received by patients age 18 and over during a hospital stay include
insulin oral hypoglycemic or a combination of both The 2009 data for races did not meet the criteria for statistical reliability data quality or confidentiality
0
2
4
6
8
10
12
14
16
18
20
2009 2010 2011 2012 2013
Pe
rce
nt
Total Renal DiseaseNo Renal Disease
0
2
4
6
8
10
12
14
16
18
20
2010 2011 2012 2013
Pe
rce
nt
Total White BlackAsian Hispanic
Importance Hypoglycemic agents which are ingested orally are typically used in patients
with type II diabetes to control blood sugar levels In some cases diabetic patients use
hypoglycemic agents together with insulin The risk of chronic kidney disease increases
twofold for people with diabetes and renal impairment can increase the risk for adverse
events related to hypoglycemic agents
Overall Percentage In 2013 85 of hospital patients receiving hypoglycemic agents had
an adverse drug event
Trends The overall percentage of adverse drug events associated with hypoglycemic agents
improved from 2009 to 2013
Groups With Disparities
In 2013 the percentage of hospital patients who had adverse drug events with hypoglycemic agents was higher for Blacks (111) than for Whites (8)
Also in 2013 the percentage of hospital patients who had adverse drug events with
hypoglycemic agents was higher for those with renal disease (122) than for those
without renal disease (56)
From 2010 to 2013 there were no statistically significant changes in the gap between
minority groups and Whites in the percentage of patients who had adverse drug events
associated with hypoglycemic agents Similarly there were no statistically significant
changes in the gap between those with renal disease and those without
National Healthcare Quality and Disparities Report | 17
Patient Safety
Adverse Drug Events With Warfarin
Hospitalized adult patients with an anticoagulant-related adverse drug event with warfarin by age and corticosteroid use 2009-2013
Source Agency for Healthcare Research and Quality and Centers for Medicare amp Medicaid Services Medicare Patient Safety Monitoring
System 2009ndash2013
Denominator Patients 18 and over who received warfarin and had their international normalized ratio (INR) measured during their hospital
stay
Note For this measure lower percentages are better Adverse events occurring the day of hospital arrival were excluded
0
2
4
6
8
10
12
2009 2010 2011 2012 2013
Pe
rce
nt
TotalCorticosteroid UseNo Corticosteroid Use
0
2
4
6
8
10
12
2009 2010 2011 2012 2013
Pe
rce
nt
lt65 65-74 75-84 85+
Hospitalized adult patients with an anticoagulant-related adverse drug event with warfarin by age and corticosteroid use 2009-2013
Source Agency for Healthcare Research and Quality and Centers for Medicare amp Medicaid Services Medicare Patient Safety Monitoring
System 2009ndash2013
Denominator Patients 18 and over who received warfarin and had their international normalized ratio (INR) measured during their hospital
stay
Note For this measure lower percentages are better Adverse events occurring the day of hospital arrival were excluded
0
2
4
6
8
10
12
2009 2010 2011 2012 2013
Pe
rce
nt
TotalCorticosteroid UseNo Corticosteroid Use
0
2
4
6
8
10
12
2009 2010 2011 2012 2013
Pe
rce
nt
lt65 65-74 75-84 85+
Importance Blood clots in arteries and veins can cause a blockage of blood flow and lead to
strokes and heart attacks Anticoagulants such as warfarin reduce this risk but pose an
increased risk of bleeding Corticosteroids can interact with anticoagulants to raise the risk of
potential bleeding complications
Overall Percentage In 2013 50 of adults using warfarin experienced an anticoagulant-
related adverse drug event
Trends From 2009 to 2013 there were no statistically significant changes in the overall
percentage of hospital patients with an adverse drug event related to warfarin
Groups With Disparities
In 2013 the percentage of hospital patients who had an adverse drug event to warfarin
was the same regardless of corticosteroid use status
From 2009 to 2013 there were no statistically significant changes in the gap between
older age groups and those under age 65 in the percentage of patients who had adverse
events associated with warfarin Similarly there were no statistically significant changes
in the gap between those using corticosteroids and those not using corticosteroids
18 | National Healthcare Quality and Disparities Report
Patient Safety
Opioid-Related Medication Errors
Number of opioid-related medication errors reported in Pennsylvania by AHRQ eventharm category and age 2006 2008 2010 2012 2014
30 53 44 27 23
2947 2798 2714 27082408
9531014
984 969
910
175 245251 398
330
0
500
1000
1500
2000
2500
3000
3500
4000
4500
2006 2008 2010 2012 2014
Nu
mb
er o
f Ev
ents
Unsafe Condition Near Miss
Patient Event No Harm Patient Event Harm
Source Institute of Safe Medication Practices on behalf of the Pennsylvania Patient Safety Authority 2006-2014
Note Pennsylvania Patient Safety Reporting System reports of medication errors are from acute-level facilities that consist of hospitals
ambulatory surgical facilities birthing centers and abortion facilities Medication errors do not include adverse drug reactions Eventharm
categories refer to those in the Agency for Healthcare Research and Quality Common Formats Unsafe condition is defined as any
circumstance that increases the probability of a patient safety event A near miss is defined as a patient safety event that did not reach the
patient Deaths are included in the total but not shown on the chart because there were too few to render graphically
192 166 336530 662
2287 24842385
2364 1955
16271461 1272
1208
1055
0
500
1000
1500
2000
2500
3000
3500
4000
4500
2006 2008 2010 2012 2014
Nu
mb
er o
f Ev
en
ts
lt18 18-64 65+
Number of opioid-related medication errors reported in Pennsylvania by AHRQ eventharm category and age 2006 2008 2010 2012 2014
30 53 44 27 23
2947 2798 2714 27082408
9531014
984 969
910
175 245251 398
330
0
500
1000
1500
2000
2500
3000
3500
4000
4500
2006 2008 2010 2012 2014
Nu
mb
er o
f Ev
ents
Unsafe Condition Near Miss
Patient Event No Harm Patient Event Harm
Source Institute of Safe Medication Practices on behalf of the Pennsylvania Patient Safety Authority 2006-2014
Note Pennsylvania Patient Safety Reporting System reports of medication errors are from acute-level facilities that consist of hospitals
ambulatory surgical facilities birthing centers and abortion facilities Medication errors do not include adverse drug reac tions Eventharm
categories refer to those in the Agency for Healthcare Research and Quality Common Formats Unsafe condition is defined as any
circumstance that increases the probability of a patient safety event A near miss is defined as a patient safety event that did not reach the
patient Deaths are included in the total but not shown on the chart because there were too few to render graphically
192 166 336530 662
2287 24842385
2364 1955
16271461 1272
1208
1055
0
500
1000
1500
2000
2500
3000
3500
4000
4500
2006 2008 2010 2012 2014
Nu
mb
er o
f Ev
ents
lt18 18-64 65+
Importance Acute malignant andmdashincreasinglymdashchronic pain often is treated or managed
with prescription opioids Reducing patient harm from the use of opioids in both inpatient
and outpatient settings is a main area of focus because opioid-related adverse drug events are
often preventable
Trends
In Pennsylvania the total number of medication error reports related to opioids decreased
106 between 2006 (4106) and 2014 (3672)
Between 24 and 54 opioid-related medication errors resulting in patient harm or death
were reported from 2006 through 2014 accounting for approximately 1 of all reported
opioid medication errors each year
The largest share of opioid-related medication errors reported each year in Pennsylvania
related to those that reached the patient but did not result in harm Of these no-harm
events reaching the patient about one in four required monitoring andor intervention to
preclude the harm
National Healthcare Quality and Disparities Report | 19
Patient Safety
20 | National Healthcare Quality and Disparities Report
Although small in number reports of unsafe conditions increased from 43 (175) of
total opioid-related medication error reports in 2006 to 9 (330) in 2014 Reports of
unsafe conditions and near misses can provide important learning opportunities for
preventing patient harm
Differences Between Groups Reports of opioid-related medication errors involving
pediatric patients increased nearly fourfold from 192 (47) in 2006 to 662 (18) in 2014
During the same period reports of opioid-related medication errors involving older adult
patients decreased from nearly 40 of the total to less than 30
Patient Safety in the Nursing Home Setting
More than 3 million people receive care in US nursing homes and skilled nursing facilities
each year (CDC 2015)
For nursing home residents optimal care seeks to maximize quality of life and minimize
unintended complications
Measures tracked for patients of various age ranges include
Nursing home residents with urinary tract infections
Nursing home residents experiencing use of restraints
Nursing home residents who have pressure ulcers
Nursing home residents who had a fall with major injury
Nursing home residents who received antipsychotic medication
Urinary Tract Infections
Long-stay nursing home residents experiencing urinary tract infections by sex and raceethnicity 2011-2013
Source Centers for Medicare amp Medicaid Services Minimum Data Set 2011-2013
DenominatorNursing home residents of any age w ho have at least 101 cumulative days in the facility
Note For this measure low er percentages are better The measure w as calculated as follows Percentage of long-stay residents with a urinary
tract infection w ithin the 30 days prior to assessment White Black and Asian are non-Hispanic Hispanic includes all races
0
2
4
6
8
10
2011 2012 2013
Pe
rce
nt
Total Male Female
2011 Achievable
Benchmark 61
0
2
4
6
8
10
2011 2012 2013
Pe
rce
nt
White Black Asian Hispanic
2011 Achievable
Benchmark 61
Long-stay nursing home residents experiencing urinary tract infections by sex and raceethnicity 2011-2013
Source Centers for Medicare amp Medicaid Services Minimum Data Set 2011-2013
DenominatorNursing home residents of any age w ho have at least 101 cumulative days in the facilityNote For this measure low er percentages are better The measure w as calculated as follows Percentage of long-stay residents with a urinary
tract infection w ithin the 30 days prior to assessment White Black and Asian are non-Hispanic Hispanic includes all races
0
2
4
6
8
10
2011 2012 2013
Pe
rce
nt
Total Male Female
2011 Achievable
Benchmark 61
0
2
4
6
8
10
2011 2012 2013
Pe
rce
nt
White Black Asian Hispanic
2011 Achievable
Benchmark 61
Patient Safety
Importance Bacteria that cause urinary tract infections (UTIs) can spread to other body
parts and become more serious or contribute to further complications such as delirium
Overall Percentage In 2013 the percentage of long-stay nursing home residents with a UTI
was 64
Groups With Disparities
In 2013 compared with males (51) the percentage with UTIs was worse for females
(7)
In 2013 compared with White residents (68) the percentage of residents with UTIs
was lower for Blacks and Asians (47) as well as Hispanics (54)
Achievable Benchmark
In 2011 the top 5 State achievable benchmark for UTIs was 61 The States that
contributed to the achievable benchmark are Connecticut Hawaii Minnesota North
Dakota and Pennsylvania
Males Blacks Asians and Hispanics have achieved the benchmark
Use of Restraints
00
05
10
15
20
25
30
35
40
2011 2012 2013
Pe
rce
nt
White Black Asian Hispanic
00
05
10
15
20
25
30
35
40
2011 2012 2013
Pe
rce
nt
Total 0-64 65-74 75-84 85+
2011 Achievable
Benchmark 07
Long-stay nursing home residents experiencing use of restraints by age and raceethnicity 2011-2013
Source Centers for Medicare amp Medicaid Services Minimum Data Set 2011-2013
Denominator Nursing home residents of any age who have at least 101 cumulative days in the facility
Note For this measure lower percentages are better The measure was calculated as follows Percentage of long-stay residents who are
physically restrained on a daily basis
2011 Achievable
Benchmark 07
00
05
10
15
20
25
30
35
40
2011 2012 2013
Pe
rce
nt
White Black Asian Hispanic
00
05
10
15
20
25
30
35
40
2011 2012 2013
Pe
rce
nt
Total 0-64 65-74 75-84 85+
2011 Achievable
Benchmark 07
Long-stay nursing home residents experiencing use of restraints by age and raceethnicity 2011-2013
Source Centers for Medicare amp Medicaid Services Minimum Data Set 2011-2013
Denominator Nursing home residents of any age who have at least 101 cumulative days in the facility
Note For this measure lower percentages are better The measure was calculated as follows Percentage of long-stay residents who are
physically restrained on a daily basis
2011 Achievable
Benchmark 07
National Healthcare Quality and Disparities Report | 21
Patient Safety
Importance Residents who are restrained daily can become weak lose their ability to go to
the bathroom by themselves and develop pressure ulcers or other medical conditions
Overall Percentage In 2013 the percentage of long-stay nursing home residents who were
physically restrained on a daily basis was 14
Groups With Disparities
In 2011 2012 and 2013 the percentage of residents with restraint use on a daily basis
was lower for those ages 65-74 years compared with those under age 65 In 2013 the
percentage of residents ages 65-74 years experiencing use of restraints was 12
compared with 16 for residents younger than 65
In 2013 compared with Whites (14) Asians (2) and Hispanics (18) had worse
percentages of daily restraint use and Blacks (12) had a better percentage of daily
restraint use
Achievable Benchmark
In 2011 the top 5 State achievable benchmark for restraint use was 07 The States that
contributed to the achievable benchmark are Kansas Maine Nebraska New Hampshire
and Vermont
No group achieved the benchmark from 2011 to 2013
Pressure Ulcers
Low-risk short-stay and high-risk long-stay nursing home residents who have pressure ulcers by sex 2011-2013
Source Centers for Medicare amp Medicaid Services Minimum Data Set 2011-2013
Denominator Low-risk short-stay Nursing home residents of any age who have 100 or fewer cumulative days in the facility and are active can
change positions and are getting the nutrients they need to maintain good skin health High-risk long-stay Nursing home residents of any age
who have at least 101 cumulative days in the facility and are in a coma do not get the nutrients needed to maintain good skin health or cannot
change position on their own
Note For this measure lower percentages are better
0
2
4
6
8
10
12
2011 2012 2013
Pe
rce
nt
Low-Risk Short StayTotal Male Female
2011 Achievable Benchmark10
0
2
4
6
8
10
12
2011 2012 2013
Pe
rce
nt
High-Risk Long StayTotal Male Female
2008 Achievable Benchmark 71
Low-risk short-stay and high-risk long-stay nursing home residents who have pressure ulcers by sex 2011-2013
Source Centers for Medicare amp Medicaid Services Minimum Data Set 2011-2013
Denominator Low-risk short-stay Nursing home residents of any age who have 100 or fewer cumulative days in the facility and are active can
change positions and are getting the nutrients they need to maintain good skin health High-risk long-stay Nursing home residents of any age
who have at least 101 cumulative days in the facility and are in a coma do not get the nutrients needed to maintain good skin health or cannot
change position on their own
Note For this measure lower percentages are better
0
2
4
6
8
10
12
2011 2012 2013
Pe
rce
nt
Low-Risk Short StayTotal Male Female
2011 Achievable Benchmark10
0
2
4
6
8
10
12
2011 2012 2013
Pe
rce
nt
High-Risk Long StayTotal Male Female
2008 Achievable Benchmark 71
22 | National Healthcare Quality and Disparities Report
Patient Safety
Importance Pressure ulcers are serious medical conditions They typically result from
prolonged periods of uninterrupted pressure on the skin soft tissue muscle and bone
Vulnerable patients include older adults stroke and diabetic patients patients with dementia
circulatory diseases dehydration and malnutrition and people who use wheelchairs or are
bedriddenmdashthat is any patient with impaired mobility or sensation
Overall Percentage In 2013 the percentage of low-risk short-stay residents with pressure
ulcers was 13 and the percentage of high-risk long-stay residents with pressure ulcers was
77
Groups with Disparities
As in 2011 and 2012 male low-risk short-stay nursing home residents had a worse
percentage with pressure ulcers (15) compared with female residents (12) in 2013
As in 2011 and 2012 male high-risk long-stay nursing home residents had a worse
percentage with pressure ulcers (94) compared with female residents (70) in 2013
Achievable Benchmark
The 2011 top 5 State achievable benchmark for low-risk short-stay nursing home residents was 10 The States that contributed to the benchmark were Alabama Arizona Colorado Connecticut and Idaho
The 2008 top 5 State achievable benchmark for high-risk long-stay nursing home residents was 71 The States that contributed to the benchmark were Hawaii Minnesota Nebraska New Hampshire and North Dakota
No low-risk short-stay residents achieved the benchmark from 2011 to 2013 Among
high-risk long-stay residents only females achieved the benchmark by 2013
National Healthcare Quality and Disparities Report | 23
Patient Safety
Falls
00
05
10
15
20
25
30
35
40
45
50
Pe
rce
nt
2012 2013
Long-stay nursing home residents who had a fall with major injury by sex age and raceethnicity 2012-2013
Source Centers for Medicare amp Medicaid Services Minimum Data Set 2012-2013
Denominator Nursing home residents of any age who have at least 101 cumulative days in the facility with one or more look-back scan
assessments except when the occurrence of falls or number of falls with major injury was not assessed in the look-back scan assessment
Note For this measure lower percentages are better White Black and Other are non-Hispanic Hispanic includes all races
2012 Achievable
Benchmark 22
00
05
10
15
20
25
30
35
40
45
50
Pe
rce
nt
2012 2013
Long-stay nursing home residents who had a fall with major injury by sex age and raceethnicity 2012-2013
Source Centers for Medicare amp Medicaid Services Minimum Data Set 2012-2013
Denominator Nursing home residents of any age who have at least 101 cumulative days in the facility with one or more look-back scan
assessments except when the occurrence of falls or number of falls with major injury was not assessed in the look-back scan assessment
Note For this measure lower percentages are better White Black and Other are non-Hispanic Hispanic includes all races
2012 Achievable
Benchmark 22
Importance Nursing home residents who experience falls resulting in major injuries are at
higher risk of death and disability as well as emotional trauma that can affect functional
abilities and social well-being
Overall Percentage In 2013 the percentage of long-stay nursing home residents who had a
fall with a major injury was 34
Groups With Disparities
In 2013 female nursing home residents had a worse percentage of falls (38) compared
with male residents (25)
In 2013 the percentage of falls with major injury was worse for all subgroups of
residents age 65 years and over compared with their younger counterparts The
percentage for residents under 65 years old was 17 compared with 26 for ages 65shy
74 years 34 for ages 75-84 years and 41 for 85 years and over
Also in 2013 compared with Whites (38) the percentage of falls with major injury
was better for Black (13) Other (22) and Hispanic (24) residents
24 | National Healthcare Quality and Disparities Report
Patient Safety
National Healthcare Quality and Disparities Report | 25
Achievable Benchmark
The 2012 top 5 State achievable benchmark for falls with major injury was 22 The
States that contributed to the achievable benchmark are Alaska California District of
Columbia Hawaii and New Jersey The benchmark was achieved by Black residents and those ages 0-64 years
Antipsychotic Medication Among Nursing Home Residents
Importance The high use of antipsychotic medications among nursing home residents for
indications other than those for which the drug was approved has been noted by the Federal
Government These drugs are often used for too long at too high a dose or when
unnecessary In the past inappropriate prescribing of antipsychotics in nursing homes has
primarily been considered a marker of suboptimal care Recent studies have shown
antipsychotic use is also a drug safety issue (Huybrechts et al 2012) Antipsychotic
medication use is associated with increased risks of adverse events such as movement
disorders falls hip fractures and cerebrovascular events Their use in older adults with
dementia carries an increased risk of death Safety concerns with antipsychotic medication
use in older adults also include the risks of hyperprolactinemia pneumonia
0
5
10
15
20
25
30
Percent
2012 2013
Adult long-stay nursing home residents who received antipsychotic medication by raceethnicity and number of chronic conditions 2012-2013
Key NHOPI = Native Hawaiian or Other Pacific Islander AIAN = American Indian or Alaska Native
Source Centers for Medicare amp Medicaid Services Minimum Data Set 2012-2013
Denominator Nursing home residents of any age who have at least 101 cumulative days in the facility excluding residents with schizophrenia
Tourettersquos syndrome and Huntingtonrsquos disease
Numerator Subset of denominator that receives an antipsychotic medication
Note For this measure lower percentages are better
2012 Achievable
Benchmark 150
0
5
10
15
20
25
30
Percent
2012 2013
Adult long-stay nursing home residents who received antipsychotic medication by raceethnicity and number of chronic conditions 2012-2013
Key NHOPI = Native Hawaiian or Other Pacific Islander AIAN = American Indian or Alaska Native
Source Centers for Medicare amp Medicaid Services Minimum Data Set 2012-2013
Denominator Nursing home residents of any age who have at least 101 cumulative days in the facility excluding residents with schizophrenia
Tourettersquos syndrome and Huntingtonrsquos disease
Numerator Subset of denominator that receives an antipsychotic medication
Note For this measure lower percentages are better
2012 Achievable
Benchmark 150
Patient Safety
26 | National Healthcare Quality and Disparities Report
thromboembolism cerebrovascular events and other cardiovascular adverse events (Chiu et
al 2015)
Overall Percentage The percentage of long-stay nursing home residents who had
antipsychotic medications was 176 in 2013
Groups With Disparities
In 2013 the percentage of residents receiving antipsychotic medication was higher for
Hispanic residents (201) than for White residents (180)
In 2012 and 2013 the percentage of long-stay residents who received antipsychotic
medications was worse for residents with one or more chronic conditions than for
residents with no chronic conditions
Achievable Benchmark
The 2012 top 6 State achievable benchmark was 150 The States that contributed to the
achievable benchmark are Alaska California Hawaii Michigan New Jersey and
Wyoming Asians NHOPIs residents with no chronic conditions and residents with one chronic
condition achieved the benchmark
Antipsychotic Medication Among Nursing Home Residents by State
Long-stay nursing home residents who received antipsychotic medication by State 2013
Source Centers for Medicare amp Medicaid Services Minimum Data Set 2013
Denominator Nursing home residents of any age who have at least 101 cumulative days in the facility
Note For this measure lower percentages are better
AZ
CA
UT
CT
FL
GA
IA
IL
KS
MA
MDMO
NJ
NY
OR
PA
SC
TN
CO
WA
WI
VA
ME
MN
MI
NC
TX
KY
WV
RI
NE
VT
NV OH
SD
AR
IN
NH
MT
ID
WY
ND
NMOK
LA
MS AL
DE
AKAK
HI
DC
85-153 (1st Quartile)
154-173 (2nd Quartile)
No Data
174-192 (3rd Quartile)
PR193-234 (4th Quartile)
Long-stay nursing home residents who received antipsychotic medication by State 2013
Source Centers for Medicare amp Medicaid Services Minimum Data Set 2013
Denominator Nursing home residents of any age who have at least 101 cumulative days in the facility
Note For this measure lower percentages are better
AZ
CA
UT
CT
FL
GA
IA
IL
KS
MA
MDMO
NJ
NY
OR
PA
SC
TN
CO
WA
WI
VA
ME
MN
MI
NC
TX
KY
WV
RI
NE
VT
NV OH
SD
AR
IN
NH
MT
ID
WY
ND
NMOK
LA
MS AL
DE
AKAK
HI
DC
85-153 (1st Quartile)
154-173 (2nd Quartile)
No Data
174-192 (3rd Quartile)
PR193-234 (4th Quartile)
Patient Safety
Overall This map shows overall rankings of States (by quartiles) in the percentage of long-
stay nursing home residents who received antipsychotic medication in 2013 Values ranged
from 85 to 234
Differences by State Interquartile ranges follow
First quartile (lowest) 85-153 (AK CA DC DE HI MD MI MN NJ NC SC
WI WV)
Second quartile (second lowest) 153 -173 (CO ID MT NM NY ND OR PA
RI SD VT WA WY)
Third quartile (second highest) 174-192 (AZ CT GA IN IA KS ME MA MO
NV OH OK VA)
Fourth quartile (highest) 193-234 (AL AR FL IL KY LA MS NE NH TN
TX UT)
Eight of the 12 States in the quartile with the highest percentage of long-stay nursing
home residents who received antipsychotic medication were in the South
Patient Safety in the Home Health Setting
Home health agencies provide services to beneficiaries who are homebound and need skilled
nursing care or therapy
Approximately 12 million individuals receive home health care from more than 33000
providers for causes including acute illness long-term health conditions permanent
disability or terminal illness (NAHCH 2010)
Improvements among home health patients can reflect the quality of care from home health
agencies
Measures include
Home health patients with improvement in surgical wounds
Home health patients with improvements in their ability to take medications orally
National Healthcare Quality and Disparities Report | 27
Patient Safety
Improvement in Surgical Wounds
75
80
85
90
95
100
2010 2011 2012 2013
Pe
rce
nt
White Black Asian Hispanic
75
80
85
90
95
100
2010 2011 2012 2013
Pe
rce
nt
Total 0-64 65-74
75-84 85+
2011 Achievable
Benchmark 913
Home health patients with improvement in surgical wounds by age and raceethnicity 2010-2013
Source Centers for Medicare amp Medicaid Services Outcome and Assessment Information Set 2010-2013
Denominator Number of home health episodes during the measurement period in which the patient of any age had a surgical wound and the
episode ended with the patient discharged from home health care
Note White Black and Asian are non-Hispanic Hispanic includes all races
2011 Achievable
Benchmark 913
75
80
85
90
95
100
2010 2011 2012 2013
Per
cen
t
White Black Asian Hispanic
75
80
85
90
95
100
2010 2011 2012 2013
Per
cen
t
Total 0-64 65-74
75-84 85+
2011 Achievable
Benchmark 913
Home health patients with improvement in surgical wounds by age and raceethnicity 2010-2013
Source Centers for Medicare amp Medicaid Services Outcome and Assessment Information Set 2010-2013
Denominator Number of home health episodes during the measurement period in which the patient of any age had a surgical wound and the
episode ended with the patient discharged from home health care
Note White Black and Asian are non-Hispanic Hispanic includes all races
2011 Achievable
Benchmark 913
Importance Normal wound healing after an operation is an important marker of good care
The home health team should regularly change wound dressing and teach the patient about
wound care
Overall Percentage In 2013 the percentage of home health patients with improvement in
their surgical wounds was 890
Trends The percentage of health home patients with surgical wound improvement increased
between 2010 and 2013
Groups With Disparities
In 2013 compared with residents under age 65 years (856) all other age groups had
better percentages of improvement in surgical wounds The percentage was 893 for
ages 65-74 905 for ages 75-84 and 917 for ages 85 and over
In 2013 compared with Whites (893) Blacks (878) Asians (882) and Hispanics
(874) had worse percentages of improvement in surgical wounds
The 2010 through 2013 trend in the percent of home health patients with surgical wound
improvement did not change for those over age 65 relative to persons under age 65 years
28 | National Healthcare Quality and Disparities Report
Patient Safety
Achievable Benchmark
The 2011 top 5 State achievable benchmark was 913 The States that contributed to the
benchmark are Alabama Mississippi Nevada Oklahoma and South Carolina
Home health patients age 85 years and over achieved the benchmark for surgical wound
improvement in 2013
At the current rate of progress patients ages 75-84 years could reach the benchmark
within a year Patients ages 65-74 years could achieve the benchmark in approximately 2
years
White home health patients could achieve the benchmark in approximately 2 years
Improvement in Ability To Take Medication Orally
0
20
40
60
80
100
2010 2011 2012 2013
Per
cen
t
White Black Asian Hispanic
0
20
40
60
80
100
2010 2011 2012 2013
Per
cen
t
Total 0-64 65-74
75-84 85+
2008 Achievable
Benchmark 516
Home health patients with improvement in their ability to take medications orally by age and raceethnicity 2010-2013
Source Centers for Medicare amp Medicaid Services Outcome and Assessment Information Set 2010-2013
Denominator Number of home health care episodes in which a patient of any age was unable to take oral medications independently at the
start of the episode that ended during the measurement period
Note White Black and Asian are non-Hispanic Hispanic includes all races
2008 Achievable
Benchmark 516
0
20
40
60
80
100
2010 2011 2012 2013
Per
cen
t
White Black Asian Hispanic
0
20
40
60
80
100
2010 2011 2012 2013
Per
cen
t
Total 0-64 65-74
75-84 85+
2008 Achievable
Benchmark 516
Home health patients with improvement in their ability to take medications orally by age and raceethnicity 2010-2013
Source Centers for Medicare amp Medicaid Services Outcome and Assessment Information Set 2010-2013
Denominator Number of home health care episodes in which a patient of any age was unable to take oral medications independently at the
start of the episode that ended during the measurement period
Note White Black and Asian are non-Hispanic Hispanic includes all races
2008 Achievable
Benchmark 516
Importance Taking medications correctly is important to the health status and quality of life
of individuals living in the community The home health team can help teach a patient ways
to organize drugs and take them properly
Overall Percentage In 2013 the percentage of home health patients with improvement in
their ability to take medications orally was 513
Trends Between 2010 and 2013 there was improvement in the overall percentage of home
health patients with improved ability to take medications orally
National Healthcare Quality and Disparities Report | 29
Patient Safety
Groups With Disparities
In 2013 the percentage of home health patients with improvement in their ability to take
medications orally was worse for those age 85 years and over (398) compared with
those under age 65 years (577)
The percentage of patients with improvement in their ability to take medications orally
was worse among Hispanic home health patients (400) than among White patients
(526) in 2013
From 2010 to 2013 the gap between Blacks and Whites decreased and the gap between
Asians and Whites and Hispanics and Whites increased
Achievable Benchmark
The 2008 top 5 State achievable benchmark was 516 The States that contributed to the
achievable benchmark are Iowa Massachusetts New Jersey North Dakota and South
Carolina
The benchmark was achieved among age groups under 85 years and by White and Black
home health patients
The total population is estimated to reach the benchmark in less than a year Hispanic
patients and patients age 85 years and over are farthest from the benchmark
Improvement in Ability To Take Medication Orally by State
Home health patients with improvement in their ability to take medications orally by raceethnicity by State 2013
Source Centers for Medicare amp Medicaid Services Outcome and Assessment Information Set 2013
Denominator Number of home health care episodes in which a patient of any age was unable to take oral medications independently at the
start of the episode that ended during the measurement period
AZ
CA
UT
CT
FL
GA
IA
IL
KS
MA
MDMO
NJ
NY
OR
PA
SC
TN
CO
WA
WI
VA
ME
MN
MI
NC
TX
KY
WV
RI
NE
VT
NV OH
SD
AR
IN
NH
MT
ID
WY
ND
NMOK
LA
MS AL
DE
AKAK
HI
No significant difference between rates
of Hispanics and non-Hispanic Whites
Non-Hispanic Whites have significantly
worse rate than Hispanics
States do not have data that meet the
criteria for statistical reliability data
quality or confidentiality
Hispanics have significantly worse rate
than non-Hispanic Whites
DC
Home health patients with improvement in their ability to take medications orally by raceethnicity by State 2013
Source Centers for Medicare amp Medicaid Services Outcome and Assessment Information Set 2013
Denominator Number of home health care episodes in which a patient of any age was unable to take oral medications independently at the
start of the episode that ended during the measurement period
AZ
CA
UT
CT
FL
GA
IA
IL
KS
MA
MDMO
NJ
NY
OR
PA
SC
TN
CO
WA
WI
VA
ME
MN
MI
NC
TX
KY
WV
RI
NE
VT
NV OH
SD
AR
IN
NH
MT
ID
WY
ND
NMOK
LA
MS AL
DE
AKAK
HI
No significant difference between rates
of Hispanics and non-Hispanic Whites
Non-Hispanic Whites have significantly
worse rate than Hispanics
States do not have data that meet the
criteria for statistical reliability data
quality or confidentiality
Hispanics have significantly worse rate
than non-Hispanic Whites
DC
30 | National Healthcare Quality and Disparities Report
Patient Safety
Geographic Variation
In 2013 Hispanic home health patients had worse rates of improvement in taking oral
medications than non-Hispanic White patients in 11 States (Arizona California
Connecticut Florida Illinois Indiana Massachusetts Nevada New York North
Carolina and Texas
Non-Hispanic White patients had worse rates of improvement than Hispanic patients in
five States (Hawaii Idaho Iowa Michigan and Pennsylvania)
Patient Safety in the Ambulatory Setting
Although patient safety initiatives frequently focus on inpatient hospital events adverse
effects of medical care may be identified and treated in outpatient settings
Adverse effects of medical care can follow care or procedures in hospitals emergency
departments physician offices or other settings
Measures include
Patient safety and quality issues by frequency of occurrence in outpatient medical offices
Adults age 65 years and over who received potentially inappropriate prescription medications during the calendar year
Percentage of hemodialysis patients with vascular catheter in use for 90 days or longer
For more information see the PSNet link to Patient Safety Primer Patient Safety in
Ambulatory Care httpspsnetahrqgovprimersprimer16patient-safety-in-ambulatory-care
National Healthcare Quality and Disparities Report | 31
Patient Safety
Patient Safety and Quality Issues
Patient safety and quality issues by frequency of occurrence in outpatient medical offices 2014
Source Westat analysis of the AHRQ 2014 Medical Office Survey on Patient Safety Culture Comparative Database (N=935)
Note For this measure less frequent occurrences during the year are better
0
20
40
60
80
100
A pharmacy contactedour office to clarify orcorrect a prescription
A patient was unableto get an appointmentwithin 48 hours for anacuteserious problem
A patients medicationlist was not updatedduring his or her visit
The results from a labor imaging test were notavailable when needed
A patients chartmedicalrecord was not available
when needed
Occurred DailyWeekly
Occurred Monthly
Occurred Not at All to Several Times Over the Past Year
Patient safety and quality issues by frequency of occurrence in outpatient medical offices 2014
Source Westat analysis of the AHRQ 2014 Medical Office Survey on Patient Safety Culture Comparative Database (N=935)
Note For this measure less frequent occurrences during the year are better
0
20
40
60
80
100
A pharmacy contactedour office to clarify orcorrect a prescription
A patient was unableto get an appointmentwithin 48 hours for anacuteserious problem
A patients medicationlist was not updatedduring his or her visit
The results from a labor imaging test were notavailable when needed
A patients chartmedicalrecord was not available
when needed
Occurred DailyWeekly
Occurred Monthly
Occurred Not at All to Several Times Over the Past Year
Importance Most health care takes place in the outpatient or ambulatory care setting Lack
of access to care and lack of access to timely and accurate medical information and test
results may contribute to patient safety events such as missed or delayed diagnoses
medication errors failure to order appropriate diagnostic or laboratory tests incorrect
interpretation of tests and inadequate followup on results
Overall Percentage
Almost 30 of medical offices participating in the survey reported daily or weekly
occurrences of being contacted by the pharmacist for clarification or correction on a
prescription
After prescription clarifications or corrections by the pharmacy medical offices were
next most likely to report daily or weekly issues with patients being unable to get an
appointment within 48 hours for an acute or serious problem (14) or the patientrsquos
medication list not getting updated during their visit (11)
The share of medical offices reporting that lab or imaging tests were not available when
needed reached nearly 20 when considering monthly occurrences as well as those that
occurred more frequently
32 | National Healthcare Quality and Disparities Report
Patient Safety
Potentially Inappropriate Prescriptions for Older Adults
Adults age 65 years and over who received potentially inappropriate prescription medications during the calendar year by sex and
perceived health status 2003ndash2013
Source Agency for Healthcare Research and Quality Medical Expenditure Panel Survey 2003-2013
Note For this measure lower percentages are better Prescription medications received include all prescribed medications initiall y purchased
or otherwise obtained as well as any refills For more information on inappropriate medications see the American Geriatrics Society 2012 Beers
Criteria Update Expert Panel American Geriatrics Society updated Beers Criteria for potentially inappropriate medication use in older adults J
Am Geriatr Soc 2012 Apr60(4)616-31
0
5
10
15
20
25
30
Per
cen
t
Total Male Female
0
5
10
15
20
25
30
Per
cen
t
ExcellentVery GoodGood FairPoor
Adults age 65 years and over who received potentially inappropriate prescription medications during the calendar year by sex and
perceived health status 2003ndash2013
Source Agency for Healthcare Research and Quality Medical Expenditure Panel Survey 2003-2013
Note For this measure lower percentages are better Prescription medications received include all prescribed medications initially purchased
or otherwise obtained as well as any refills For more information on inappropriate medications see the American Geriatrics Society 2012 Beers
Criteria Update Expert Panel American Geriatrics Society updated Beers Criteria for potentially inappropriate medication use in older adults J
Am Geriatr Soc 2012 Apr60(4)616-31
0
5
10
15
20
25
30
Per
cen
t
Total Male Female
0
5
10
15
20
25
30
Per
cen
t
ExcellentVery GoodGood FairPoor
Importance Some drugs that are prescribed for older patients are known to be potentially
harmful for this age group
Overall Percentage In 2013 the percentage of adults age 65 years and over who received
potentially inappropriate prescription medications was 114
Trends From 2003 to 2013 the percentage of adults age 65 years and over who received
potentially inappropriate prescription medications improved overall for both sexes and for
people with excellentvery goodgood health status and people with fairpoor health status
Groups With Disparities
In all years the percentage of patients receiving potentially inappropriate medications
was higher among females compared with males This gap was not changing over time
In all years from 2003 to 2013 the percentage of patients receiving potentially
inappropriate medications was higher among people with fairpoor health status
compared with people with excellentgood health status This gap was not changing over
time
National Healthcare Quality and Disparities Report | 33
Patient Safety
Long-Term Catheter Use in Dialysis Patients
HI
AKAK
AZ
CA
UT
CT
FL
GA
IA
IL
KS
MA
MDMO
NJ
NY
OR
PA
SC
TN
CO
WA
WI
VA
ME
MN
MI
NC
TX
KY
WV
RI
NE
VT
NV OH
SD
AR
IN
NH
MT
ID
WY
ND
NMOK
LA
MSAL
DE
DC
10-12
13-18
7-9
PR
Source Centers for Medicare and Medicaid Services Dialysis Facility Compare 2014
Denominator At-risk adult Medicare patients with a central venous catheter who were receiving regular hemodialysis treatments at dialysis
facilities
Note For this measure lower percentages are better
Percentage of hemodialysis patients with central venous catheters used for vascular access for 90 days or longer by State 2014
HI
AKAK
AZ
CA
UT
CT
FL
GA
IA
IL
KS
MA
MDMO
NJ
NY
OR
PA
SC
TN
CO
WA
WI
VA
ME
MN
MI
NC
TX
KY
WV
RI
NE
VT
NV OH
SD
AR
IN
NH
MT
ID
WY
ND
NMOK
LA
MSAL
DE
DC
10-12
13-18
7-9
PR
Source Centers for Medicare and Medicaid Services Dialysis Facility Compare 2014
Denominator At-risk adult Medicare patients with a central venous catheter who were receiving regular hemodialysis treatments at dialysis
facilities
Note For this measure lower percentages are better
Percentage of hemodialysis patients with central venous catheters used for vascular access for 90 days or longer by State 2014
Importance Central venous catheters are frequently used for vascular access to dialysis
patients until a fistula or graft is formed Central venous catheters have higher rates of
infection and adverse events among patients receiving dialysis treatment compared with
other forms of vascular access To decrease the likelihood of adverse events catheters should
be used for less than 90 days
Overall Percentage Nationally an average of 10 of dialysis patients used central venous
catheters for 90 days or longer in 2014
Geographic Variation In 2014 Alabama and Kansas had the lowest percentages of dialysis
patients using central venous catheters for 90 days or longer (7) and Puerto Rico had the
highest percentage (18) of long-term catheter use
Patient Safety Infrastructure
Efforts to improve patient safety have been accompanied by various infrastructure
enhancements
Growth in patient safety organizations which assist providers in detecting and reducing
risks and hazards from care delivery that may lead to patient harm
System improvement initiatives at the Veterans Health Administration (VHA)
34 | National Healthcare Quality and Disparities Report
Patient Safety
Development of the National Practitioner Data Bank a clearinghouse for information on
medical malpractice payments
Patient Safety Organizations
Patient safety organizations (PSOs) aim to reduce preventable adverse events near misses
and unsafe conditions in all health care settings
PSOs provide an environment for health care providers to voluntarily report discuss and
learn from patient safety events and quality analyses on a privileged and confidential basis
Measures include
Number of PSOs serving each State
Variation in concentrations of compounded liquid medications for children
Patient Safety Organizations AHRQ Common Formats
AHRQ Common Formats provide a standardized method for PSOs health care providers
and other organizations to collect and report patient safety events
Data element standards are important for aggregating and analyzing events across
providers
AHRQ Common Formats have been developed for a variety of settings of care
Acute care hospitals
Skilled nursing facilities
Retail pharmacy
More information is available at httpspsoahrqgovcommon
National Healthcare Quality and Disparities Report | 35
Patient Safety
Number of Patient Safety Organizations
AZ (2)
CA (3)
UT (2)
CT(3)
FL (8)
GA (5)
IA (4)
IL (7)
KS (5)
MA(3)
MD (4)MO(2)
NJ(3)
NY (5)
OR (3)
PA (5)
SC (4)
TN (5)
CO (2)
WA (2)
WI (5)
VA (7)
ME(2)
MN(3)
MI (3)
NC (7)
TX (6)
KY (4)WV (3)
RI(2)
NE (2)
VT(2)
NV (2)
OH (2)
SD (1)
AR (4)
IN (2)
NH(2)
MT (2)
ID (3)
WY (2)
ND (1)
NM (3)OK (2)
LA (1)
MS (2)
AL (2)
DE(2)
HI (2)
AKAK (2)
DC(3)
PR (0)
1-2
3-4
5-6
7-8
Number of PSOs
excluding PSOs
operating nationally
Number of Patient Safety Organizations by area served 2014
Source Agency for Healthcare Research and Quality Patient Safety Organization Information Form Calendar Year 2014 and PSO-PPC
Contact Database
Note PSOs included in this map were AHRQ-listed during any part of 2014 and submitted the PSO Profile to the PSO Privacy Protection
Center (PSO-PPC) in early 2015 A PSO may have members in one or more States regardless of headquarters location Each State shows the
number of PSOs that serve that State map excludes 38 PSOs that are available to providers in all States
AZ (2)
CA (3)
UT (2)
CT(3)
FL (8)
GA (5)
IA (4)
IL (7)
KS (5)
MA(3)
MD (4)MO(2)
NJ(3)
NY (5)
OR (3)
PA (5)
SC (4)
TN (5)
CO (2)
WA (2)
WI (5)
VA (7)
ME(2)
MN(3)
MI (3)
NC (7)
TX (6)
KY (4)WV (3)
RI(2)
NE (2)
VT(2)
NV (2)
OH (2)
SD (1)
AR (4)
IN (2)
NH(2)
MT (2)
ID (3)
WY (2)
ND (1)
NM (3)OK (2)
LA (1)
MS (2)
AL (2)
DE(2)
HI (2)
AKAK (2)
DC(3)
PR (0)
1-2
3-4
5-6
7-8
Number of PSOs
excluding PSOs
operating nationally
Number of Patient Safety Organizations by area served 2014
Source Agency for Healthcare Research and Quality Patient Safety Organization Information Form Calendar Year 2014 and PSO-PPC
Contact Database
Note PSOs included in this map were AHRQ-listed during any part of 2014 and submitted the PSO Profile to the PSO Privacy Protection
Center (PSO-PPC) in early 2015 A PSO may have members in one or more States regardless of headquarters location Each State shows the
number of PSOs that serve that State map excludes 38 PSOs that are available to providers in all States
Importance All patient safety organizations (PSOs) have authority to operate in all 50
States and US territories but not all do In 2014 38 PSOs self-reported being available to
providers nationally PSOs not available nationally serve specific States
Geographic Variation
Nearly all States have at least 2 PSOs available to providers in their State in addition to
the 38 national PSOs that serve all States
Florida has the most PSOs available with 8 in addition to the 38 nationally available
PSOs The States with the largest number of PSOs available are generally on the East
Coast (eg North Carolina Virginia New York Pennsylvania Tennessee Georgia) or
have large populations (eg Texas Illinois)
North Dakota South Dakota and Louisiana are the only states with just one PSO serving
their State in addition to the 38 national PSOs
Puerto Rico is served by one national PSO only
36 | National Healthcare Quality and Disparities Report
Patient Safety
Compounded Liquid Medications for Children
Compounded liquid medications for children in Michigan 2012
Source Levy S Buckley B Safe Table Success The MI Pediatric Safety Collaboration Presentation presented at the 7th Annual
Meeting of Patient Safety Organizations (PSOs) Rockville MD 2015 April and Rood JM Engels MJ Ciarkowski SL et al Variability in
compounding of oral liquids for pediatric patients a patient safety concern J Am Pharm Assn 201454(4)383-9
Note Information represents 244 responses to online survey of approximately 2000 Michigan pharmacies conducted in June 2012 by
The University of Michigan College of Pharmacy in collaboration with the Michigan Pharmacists Association
0
10
20
30
40
50
1 2 3 4 5 6 7 8 9
Nu
mb
er o
f D
rugs
Number of Unique Concentrations
Number of Different Compounded Concentrations per Drug
0
10
20
30
40
50
No Harm No Harm ButMonitoring
TemporaryHarm
Pe
rce
nt
Compounding Errors by Related Harm and Pharmacy Setting
Inpatient Outpatient
Compounded liquid medications for children in Michigan 2012
Source Levy S Buckley B Safe Table Success The MI Pediatric Safety Collaboration Presentation presented at the 7th Annual
Meeting of Patient Safety Organizations (PSOs) Rockville MD 2015 April and Rood JM Engels MJ Ciarkowski SL et al Variability in
compounding of oral liquids for pediatric patients a patient safety concern J Am Pharm Assn 201454(4)383-9
Note Information represents 244 responses to online survey of approximately 2000 Michigan pharmacies conducted in June 2012 by
The University of Michigan College of Pharmacy in collaboration with the Michigan Pharmacists Association
0
10
20
30
40
50
1 2 3 4 5 6 7 8 9
Nu
mb
er o
f D
rugs
Number of Unique Concentrations
Number of Different Compounded Concentrations per Drug
0
10
20
30
40
50
No Harm No Harm ButMonitoring
TemporaryHarm
Per
cen
t
Compounding Errors by Related Harm and Pharmacy Setting
Inpatient Outpatient
Importance
Liquid medications are widely used in pediatrics because many children find it difficult
to swallow tablets or capsules If not commercially manufactured these liquid
medications require a pharmacist to compound them to the correct dosage for the patient
This practice of compounding has led to a variety of medication concentrations in use In
the absence of standard concentrations for compounded medications there is a risk that
children may accidentally receive medications that are too potent and can be dangerous
or are too weak to be effective
The Michigan Health amp Hospital Association Keystone Center Patient Safety
Organization hosts five Pediatric Safe Tables each year Safe Tables provided a
confidential and legally protected environment to discuss challenges and improvement
strategies regarding inconsistent medication concentrations for compounded oral liquids
without fear of punitive action against them
National Healthcare Quality and Disparities Report | 37
Patient Safety
Overall Percentage
More than half (527) of drugs identified in the 2012 survey had 3 or more unique
concentrations dispensed to children across Michigan For example Rifampin used to
treat bacterial infections was reported to have 8 different concentrations dispensed to
patients
Nearly one-third (313) of reported errors caused temporary harm or required additional
monitoring despite no harm
Standardization of Compounded Liquid Medications
Source Michigan Health amp Hospital Association Keystone Center Patient Safety Organization and University of Michigan College of Pharmacy
State-Wide Initiative to Standardize the Compounding of Oral Liquids in Pediatrics
Standardization of compounded liquid medications for children in Michigan 2011
Issue identificationbull Hospitals attending PSO Pediatrics Safe
Table raise compounded medication concentrations as a major safety issue
bull Small focus group determines extent of problem
bull Michigan pharmacies are surveyed about baseline concentrations
Develop Interventionbull PSO Quarterly Safe Tables are held to
discuss cases and practicesbull Team develops recommendations for
standard concentrationsbull Consensus is achieved for frequently
compounded pediatric medications 470 formulations for 147 drug entities are reduced to 104 concentrations for 100 drugs
Practice changebull Toolkit is createdbull Standards are disseminated to Michigan
prescribers and pharmacies bull Standards are disseminated to PSO
members and Safe Table participants
Source Michigan Health amp Hospital Association Keystone Center Patient Safety Organization and University of Michigan College of Pharmacy
State-Wide Initiative to Standardize the Compounding of Oral Liquids in Pediatrics
Standardization of compounded liquid medications for children in Michigan 2011
Issue identificationbull Hospitals attending PSO Pediatrics Safe
Table raise compounded medication concentrations as a major safety issue
bull Small focus group determines extent of problem
bull Michigan pharmacies are surveyed about baseline concentrations
Develop Interventionbull PSO Quarterly Safe Tables are held to
discuss cases and practicesbull Team develops recommendations for
standard concentrationsbull Consensus is achieved for frequently
compounded pediatric medications 470 formulations for 147 drug entities are reduced to 104 concentrations for 100 drugs
Practice changebull Toolkit is createdbull Standards are disseminated to Michigan
prescribers and pharmacies bull Standards are disseminated to PSO
members and Safe Table participants
The Role of PSO Safe Tables Based on adverse medication events discussed in the
Michigan Health amp Hospital Association (MHA) Keystone Center Patient Safety
Organization (PSO) Safe Tables in July 2011 the Michigan Pediatric Safety Collaboration
was developed to further assess the scope of the problem and formulate a solution
The Collaborative The Michigan Pediatric Safety Collaboration includes individuals from
the University of Michigan College of Pharmacy the Michigan Pharmacists Association
(MPA) the Food and Drug Administration (FDA) and the MHA Keystone PSO
38 | National Healthcare Quality and Disparities Report
Patient Safety
Practice Change
As a result of the standardization effort 470 unique formulations for 147 drug entities
were reduced to 104 different concentrations for 100 drugs
The Michigan Pediatric Safety Collaboration developed a multistep process to implement
standards for compounding medications The MPA surveyed pharmacies in Michigan to
better define the nature and scope of the problem The PSO continued to act as convener
The result was the creation and dissemination of statewide standards for 120 frequently
compounded pediatric medications
Veterans Health Administration
The National Center for Patient Safety is part of the Veterans Health Administration the
Nationrsquos largest integrated health care system
Patient safety-related system improvement initiatives include
The Daily Planreg
Purchasing for Safety Initiative
Patient Safety Improvement Initiative
Patient safety improvement initiative The Daily Planreg at Veterans Affairs Medical Centers 2009
Source King BJ Mills PD Fore A et al The Daily Planreg including patients for safetys sake Nurs Manage 201243(3)15-8
0
10
20
30
40
50
Identified atleast one
error
Identifiederror
of omission
Identifiederror
ofcommission
Nurses Who Identified Errors in Patient Treatment Plan by Type
0
10
20
30
40
50
Patient founddiscrepancy inplanned care
Family founddiscrepancy inplanned care
Nursing Stafffound
discrepancyin plannedtreatment
Respondents Who Identified Errors or Discrepancies Through The Daily Plan reg
Patient safety improvement initiative The Daily Planreg at Veterans Affairs Medical Centers 2009
Source King BJ Mills PD Fore A et al The Daily Planreg including patients for safetys sake Nurs Manage 201243(3)15-8
0
10
20
30
40
50
Identified atleast one
error
Identifiederror
of omission
Identifiederror
ofcommission
Nurses Who Identified Errors in Patient Treatment Plan by Type
0
10
20
30
40
50
Patient founddiscrepancy inplanned care
Family founddiscrepancy inplanned care
Nursing Stafffound
discrepancyin plannedtreatment
Respondents Who Identified Errors or Discrepancies Through The Daily Plan reg
National Healthcare Quality and Disparities Report | 39
Patient Safety
Importance The Daily Planreg
is a two-page printed summary that acts as a schedule for
patients and providers each day It shows the procedures laboratory tests and medications
scheduled for that day and lists essential health information such as patientrsquos name allergies
and current medications It can be tailored for a patientrsquos needs by extracting orders from the
electronic medical record (EMR) The Daily Planreg
is intended to facilitate patient and family
engagement throughout the course of care The Daily Planreg
shows promise for improving
patient safety Since 2009 the VA has implemented The Daily Planreg
in more than 65
hospitals both inpatient and outpatient care settings The Daily Planreg
is shared more than
75000 times a month and the VA plans to continue the spread of The Daily Planreg
at
additional sites in 2016
Findings
As part of a pilot test in 2009 a total of 198 patients and 85 nurses responded to a survey
across 10 facilities Nurses had an average of 34 patients per shift who received The
Daily Planreg Patients responded about their own experiences whereas nurses reported
about all of their patients who received The Daily Planreg
Nearly half (475) of patients reported finding a discrepancy in planned care through
The Daily Planreg In addition 30 of patients reported that their family members found a
discrepancy Although not every discrepancy will be a potential medical error having a
shared understanding of the plan of care decreases the risk of error
More than one in six nurses (176) identified a discrepancy in treatment among their
patients through The Daily Planreg Most of these nurses (153) found one or more errors
of omission and a smaller share (106) of nurses found one or more errors of
commission some found both
40 | National Healthcare Quality and Disparities Report
Patient Safety
Issues Related to Ventilators
Common use-issues related to ventilators at the Veterans Health Administration 2006-2014 (combined)
Source Veterans Health Administration National Center for Patient Safety data collected October 2006 to October 2014
Note Examples of equipment failures include ventilator shutdown and other ventilator problems Ventilator settings include setup problems and
incorrect settings Support activities include space utilities and supplies Transport includes accidental extubation other transportation issues
and vehicle-related issues Alarms include alarm settings and alarm connection Training includes unknown ventilator model and other training
concerns
0
20
40
60
80
100
120
140
160
EquipmentFailure
VentilatorSettings
SupportActivities
Transport Alarms Training
Nu
mb
er o
f R
epo
rts
Common use-issues related to ventilators at the Veterans Health Administration 2006-2014 (combined)
Source Veterans Health Administration National Center for Patient Safety data collected October 2006 to October 2014
Note Examples of equipment failures include ventilator shutdown and other ventilator problems Ventilator settings include setup problems and
incorrect settings Support activities include space utilities and supplies Transport includes accidental extubation other transportation issues
and vehicle-related issues Alarms include alarm settings and alarm connection Training includes unknown ventilator model and other training
concerns
0
20
40
60
80
100
120
140
160
EquipmentFailure
VentilatorSettings
SupportActivities
Transport Alarms Training
Nu
mb
er o
f R
epo
rts
Importance Beginning with a focus on ventilators the Veterans Health Administrationrsquos
human factors-based Purchasing for Safety Initiative communicates the most common use-
issues associated with medical devices in order to ultimately remove or contain identified
vulnerabilities and prevent further harm
Event Reporting Patient safety managers report events and close calls from more than 150
VA facilities to a national database The largest number of use issues related to ventilators
involved equipment failure and issues such as spontaneous ventilator shutdown compressor
failure and broken or missing parts Other categories of ventilator use issues involved the
physical space where the ventilator was used challenges of transporting patients on
ventilators and problems with ventilator settings and alarms Root cause analyses on reports
are conducted and Patient Safety Alerts are issued to share the learning internally
Other Key Components
Data on ventilator issues from the VA and the Food and Drug Administrationrsquos Medical
Product Safety Network are the basis for a ldquogovernment-industry dayrdquo to work with
manufacturers This information is used to help the device manufacturers better
understand the limits of human use of their products
National Healthcare Quality and Disparities Report | 41
Patient Safety
The VA also trains noncliniciansmdashsuch as biomedical engineers across the
organizationmdashto understand the devices consider the situation for their use and identify
what can go wrong (ldquofailure modesrdquo) in advance
The VA encourages discussions among clinicians about their experience in using devices
In the Applied Patient Safety Challenge hundreds of staff participate in brainstorming
about solutions and strategies for dealing with unexpected scenarios involving devices
National Practitioner Data Bank
Medical malpractice actions are one way to flag potential medical errors
Medical Malpractice Payment Reports are submitted to the National Practitioner Data Bank
by medical malpractice payers
Report of a monetary exchange made for the benefit of a physician dentist or other
health care provider
Result of a settlement or judgment of a written complaint or claim based on that
providerrsquos delivery of or failure to deliver health care services
Number of Medical Malpractice Payment Reports by Setting
Number of Medical Malpractice Payment Reports by health care setting 2004-2014
Source National Practitioner Data Bank (NPDB) Public Use Data File Health Resources and Services Administration Bureau of Health
Professions Division of Practitioner Data Banks 2004-2014
Note Health care setting was not collected by the NPDB for 2104 reports in 2004 ldquoOtherrdquo includes Medical Malpractice Payment Reports
related to unknown settings as well as those for a combination of inpatient and outpatient settings Reports pertain to patients of any age
0
2000
4000
6000
8000
10000
12000
14000
16000
18000
20000
2004 2005 2006 2007 2008 2009 2010 2011 2012 2013 2014
Nu
mb
er o
f R
epo
rts
Total Inpatient Outpatient Other
Number of Medical Malpractice Payment Reports by health care setting 2004-2014
Source National Practitioner Data Bank (NPDB) Public Use Data File Health Resources and Services Administration Bureau of Health
Professions Division of Practitioner Data Banks 2004-2014
Note Health care setting was not collected by the NPDB for 2104 reports in 2004 ldquoOtherrdquo includes Medical Malpractice Payment Reports
related to unknown settings as well as those for a combination of inpatient and outpatient settings Reports pertain to patients of any age
0
2000
4000
6000
8000
10000
12000
14000
16000
18000
20000
2004 2005 2006 2007 2008 2009 2010 2011 2012 2013 2014
Nu
mb
er o
f R
epo
rts
Total Inpatient Outpatient Other
42 | National Healthcare Quality and Disparities Report
Patient Safety
Trends The total number of medical malpractice payment reports (MMPRs) per year
decreased from 17641 in 2004 to 12699 in 2014
Variation Across Reports
Of 157022 MMPRs from 2004 through 2014 more reports related to care in the
outpatient setting (71937) than in the inpatient setting (60391)
Diagnosis-related and treatment-related payments were the most frequent types of
reports each accounting for about 27 of cases Reports of payments for medication-
related cases accounted for only 5 of MMPRs (data not shown)
Number of Medical Malpractice Payment Reports by Allegation and Harm
Number of Medical Malpractice Payment Reports by type of allegation and harm severity 2004-2014
Key Temporary injury = Minor temporary injury and Major temporary injury Permanent significant injury = Significant Permanent Injury
Major Permanent Injury Quadriplegia Brain Damage Lifelong care
Source National Practitioner Data Bank Public Use Data File Health Resources and Services Administration Bureau of Health Professions
Division of Practitioner Data Banks 2004-2014
Note Reports pertain to patients of any age
0
20
40
60
80
100
Treatment(n=42913)
Diagnosis(n=42507)
Surgery(n=36845)
Obstetrics(n=10555)
Medication(n=8287)
Monitoring(n=5329)
Anesthesia(n=4276)
Equipment(n=1161)
BehavioralHealth
(n=879)
Blood(n=379)
EmotionalInjury Only
InsignificantInjury
TemporaryInjury
PermanentMinor Injury
PermanentSignificant Injury
Death Unknown
Number of Medical Malpractice Payment Reports by type of allegation and harm severity 2004-2014
Key Temporary injury = Minor temporary injury and Major temporary injury Permanent significant injury = Significant Permanent Injury
Major Permanent Injury Quadriplegia Brain Damage Lifelong care
Source National Practitioner Data Bank Public Use Data File Health Resources and Services Administration Bureau of Health Professions
Division of Practitioner Data Banks 2004-2014
Note Reports pertain to patients of any age
0
20
40
60
80
100
Treatment(n=42913)
Diagnosis(n=42507)
Surgery(n=36845)
Obstetrics(n=10555)
Medication(n=8287)
Monitoring(n=5329)
Anesthesia(n=4276)
Equipment(n=1161)
BehavioralHealth
(n=879)
Blood(n=379)
EmotionalInjury Only
InsignificantInjury
TemporaryInjury
PermanentMinor Injury
PermanentSignificant Injury
Death Unknown
Overall Percentage From 2004 to 2014 medical malpractice payments were made for
allegations related to
Treatment (42913)
Diagnosis (42507)
Surgery (36845)
Obstetrics (10555)
Medication (8287)
Monitoring (5329)
National Healthcare Quality and Disparities Report | 43
Patient Safety
Anesthesia (4276)
Equipment or products (1161)
Behavioral health (879) and
IV and blood products (379)
Variation Across Reports
Death accounted for more than one-third of harm in payments related to monitoring
(499) diagnosis (393) medication (383) and anesthesia (363) allegations
More than half of all obstetric payments were for allegations of permanent severe harm
(570)
Temporary harm accounted for more than one-third of payments related to equipment
(485) and surgery (360)
Most of the behavioral health-related payments were for emotional harm (457) or
death (338)
References
Agency for Healthcare Research and Quality Making Health Care Safer II An Updated Critical Analysis of the
Evidence for Patient Safety Practices Comparative Effectiveness Review No 211 Rockville MD Agency for
Healthcare Research and Quality March 2013 AHRQ Publication No 13-E001-EF
httpwwwahrqgovsitesdefaultfileswysiwygresearchfindingsevidence-basedshy
reportsservicesqualityptsafetyII-fullpdf
Arriaga AF Lancaster RT Berry RW et al The better colectomy project association of evidence-based best-
practice adherence rates to outcomes in colorectal surgery Ann Surg 2009 Oct250(4)507-13
httpwwwncbinlmnihgovpubmed19734778
Centers for Disease Control and Prevention HAI Prevalence Survey
httpwwwcdcgovHAIsurveillanceindexhtml Last updated March 2016 Accessed March 4 2016
Centers for Disease Control and Prevention Nursing Homes and Assisted Living (Long-Term Care Facilities)
httpwwwcdcgovlongtermcare Last updated September 2015 Accessed March 4 2016
Chassin MR Loeb JM High-reliability health care getting there from here Milbank Q 201391(3)459-90
httpwwwncbinlmnihgovpmcarticlesPMC3790522 Accessed September 23 2015
Chiu Y Bero L Hessol NA et al A literature review of clinical outcomes associated with antipsychotic medication
use in North American nursing home residents Health Policy 2015 Jun119(6)802-813 Epub 2015 Feb 28 PMID
25791166 httpwwwsciencedirectcomsciencearticlepiiS0168851015000652 Accessed June 17 2015
Huybrechts KF Gerhard Crystal S et al Differential risk of death in older residents in nursing homes prescribed
specific antipsychotic drugs Population based cohort study BMJ 2012 Feb 23344e977 PMID 22362541
httpwwwncbinlmnihgovpmcarticlesPMC3285717 Accessed June 17 2015
Institute of Medicine Preventing Medication Errors Quality Chasm Series 2007
httpwwwnapeducatalog11623preventing-medication-errors-quality-chasm-series
National Association for Home Care amp Hospice Basic Statistics About Home Care Updated 2010
httpwwwnahcorgassets1710hc_statspdf Accessed August 31 2015
44 | National Healthcare Quality and Disparities Report
Patient Safety
Overall Percentage In 2013 32 of adults with central venous catheter placements
experienced an associated mechanical adverse event
Trends From 2009 to 2013 there were no statistically significant changes in the overall
percentage of adults with mechanical adverse events associated with central venous catheter
placement
Groups With Disparities
In 2013 the percentage of adults with mechanical adverse events associated with CVC
was worse for Blacks (67) compared with Whites (27) There were no statistically
significant differences by obesity status
From 2009 to 2013 there were no statistically significant changes in the gap between
Blacks and Whites in the percentage of adults with mechanical adverse events associated
with CVC
Adverse Drug Events
An estimated 400000 preventable ADEs occur each year in US hospitals generating
additional costs of $35 billion in 2006 dollars (IOM 2007)
An ADE is an injurymdashincluding physical harm mental harm or loss of functionmdash
resulting from medical intervention involving a drug
For more information see the PSNet link to Patient Safety Primer Medication Errors
httpspsnetahrqgovprimersprimer23medication-errors
The three initial targets of the HHS National Action Plan for Adverse Drug Event Prevention are
Anticoagulants and related bleeding
Diabetes agents and related hypoglycemia
Opioids and accidental overdose oversedation and respiratory depression
Measures of Patient Safety in the Hospital Setting Adverse Drug Events
Percentage of hospitalized adult patients who received a hypoglycemic agent and had an
adverse drug event
Percentage of hospitalized adult patients who had an anticoagulant-related adverse drug
event to warfarin
Number of opioid-related medication errors in patients of all ages
16 | National Healthcare Quality and Disparities Report
Patient Safety
Adverse Drug Events With Hypoglycemic Agents
Hospitalized adult patients who received a hypoglycemic agent who had adverse drug events with hypoglycemic agents by
raceethnicity 2010-2013 and renal disease 2009-2013
Source Agency for Healthcare Research and Quality and Centers for Medicare amp Medicaid Services Medicare Patient Safety Monitoring
System 2009-2013
Note For this measure lower percentages are better Hypoglycemic agents received by patients age 18 and over during a hospital stay include
insulin oral hypoglycemic or a combination of both The 2009 data for races did not meet the criteria for statistical reliability data quality or confidentiality
0
2
4
6
8
10
12
14
16
18
20
2009 2010 2011 2012 2013
Pe
rce
nt
Total Renal DiseaseNo Renal Disease
0
2
4
6
8
10
12
14
16
18
20
2010 2011 2012 2013
Pe
rce
nt
Total White BlackAsian Hispanic
Hospitalized adult patients who received a hypoglycemic agent who had adverse drug events with hypoglycemic agents by
raceethnicity 2010-2013 and renal disease 2009-2013
Source Agency for Healthcare Research and Quality and Centers for Medicare amp Medicaid Services Medicare Patient Safety Monitoring
System 2009-2013
Note For this measure lower percentages are better Hypoglycemic agents received by patients age 18 and over during a hospital stay include
insulin oral hypoglycemic or a combination of both The 2009 data for races did not meet the criteria for statistical reliability data quality or confidentiality
0
2
4
6
8
10
12
14
16
18
20
2009 2010 2011 2012 2013
Pe
rce
nt
Total Renal DiseaseNo Renal Disease
0
2
4
6
8
10
12
14
16
18
20
2010 2011 2012 2013
Pe
rce
nt
Total White BlackAsian Hispanic
Importance Hypoglycemic agents which are ingested orally are typically used in patients
with type II diabetes to control blood sugar levels In some cases diabetic patients use
hypoglycemic agents together with insulin The risk of chronic kidney disease increases
twofold for people with diabetes and renal impairment can increase the risk for adverse
events related to hypoglycemic agents
Overall Percentage In 2013 85 of hospital patients receiving hypoglycemic agents had
an adverse drug event
Trends The overall percentage of adverse drug events associated with hypoglycemic agents
improved from 2009 to 2013
Groups With Disparities
In 2013 the percentage of hospital patients who had adverse drug events with hypoglycemic agents was higher for Blacks (111) than for Whites (8)
Also in 2013 the percentage of hospital patients who had adverse drug events with
hypoglycemic agents was higher for those with renal disease (122) than for those
without renal disease (56)
From 2010 to 2013 there were no statistically significant changes in the gap between
minority groups and Whites in the percentage of patients who had adverse drug events
associated with hypoglycemic agents Similarly there were no statistically significant
changes in the gap between those with renal disease and those without
National Healthcare Quality and Disparities Report | 17
Patient Safety
Adverse Drug Events With Warfarin
Hospitalized adult patients with an anticoagulant-related adverse drug event with warfarin by age and corticosteroid use 2009-2013
Source Agency for Healthcare Research and Quality and Centers for Medicare amp Medicaid Services Medicare Patient Safety Monitoring
System 2009ndash2013
Denominator Patients 18 and over who received warfarin and had their international normalized ratio (INR) measured during their hospital
stay
Note For this measure lower percentages are better Adverse events occurring the day of hospital arrival were excluded
0
2
4
6
8
10
12
2009 2010 2011 2012 2013
Pe
rce
nt
TotalCorticosteroid UseNo Corticosteroid Use
0
2
4
6
8
10
12
2009 2010 2011 2012 2013
Pe
rce
nt
lt65 65-74 75-84 85+
Hospitalized adult patients with an anticoagulant-related adverse drug event with warfarin by age and corticosteroid use 2009-2013
Source Agency for Healthcare Research and Quality and Centers for Medicare amp Medicaid Services Medicare Patient Safety Monitoring
System 2009ndash2013
Denominator Patients 18 and over who received warfarin and had their international normalized ratio (INR) measured during their hospital
stay
Note For this measure lower percentages are better Adverse events occurring the day of hospital arrival were excluded
0
2
4
6
8
10
12
2009 2010 2011 2012 2013
Pe
rce
nt
TotalCorticosteroid UseNo Corticosteroid Use
0
2
4
6
8
10
12
2009 2010 2011 2012 2013
Pe
rce
nt
lt65 65-74 75-84 85+
Importance Blood clots in arteries and veins can cause a blockage of blood flow and lead to
strokes and heart attacks Anticoagulants such as warfarin reduce this risk but pose an
increased risk of bleeding Corticosteroids can interact with anticoagulants to raise the risk of
potential bleeding complications
Overall Percentage In 2013 50 of adults using warfarin experienced an anticoagulant-
related adverse drug event
Trends From 2009 to 2013 there were no statistically significant changes in the overall
percentage of hospital patients with an adverse drug event related to warfarin
Groups With Disparities
In 2013 the percentage of hospital patients who had an adverse drug event to warfarin
was the same regardless of corticosteroid use status
From 2009 to 2013 there were no statistically significant changes in the gap between
older age groups and those under age 65 in the percentage of patients who had adverse
events associated with warfarin Similarly there were no statistically significant changes
in the gap between those using corticosteroids and those not using corticosteroids
18 | National Healthcare Quality and Disparities Report
Patient Safety
Opioid-Related Medication Errors
Number of opioid-related medication errors reported in Pennsylvania by AHRQ eventharm category and age 2006 2008 2010 2012 2014
30 53 44 27 23
2947 2798 2714 27082408
9531014
984 969
910
175 245251 398
330
0
500
1000
1500
2000
2500
3000
3500
4000
4500
2006 2008 2010 2012 2014
Nu
mb
er o
f Ev
ents
Unsafe Condition Near Miss
Patient Event No Harm Patient Event Harm
Source Institute of Safe Medication Practices on behalf of the Pennsylvania Patient Safety Authority 2006-2014
Note Pennsylvania Patient Safety Reporting System reports of medication errors are from acute-level facilities that consist of hospitals
ambulatory surgical facilities birthing centers and abortion facilities Medication errors do not include adverse drug reactions Eventharm
categories refer to those in the Agency for Healthcare Research and Quality Common Formats Unsafe condition is defined as any
circumstance that increases the probability of a patient safety event A near miss is defined as a patient safety event that did not reach the
patient Deaths are included in the total but not shown on the chart because there were too few to render graphically
192 166 336530 662
2287 24842385
2364 1955
16271461 1272
1208
1055
0
500
1000
1500
2000
2500
3000
3500
4000
4500
2006 2008 2010 2012 2014
Nu
mb
er o
f Ev
en
ts
lt18 18-64 65+
Number of opioid-related medication errors reported in Pennsylvania by AHRQ eventharm category and age 2006 2008 2010 2012 2014
30 53 44 27 23
2947 2798 2714 27082408
9531014
984 969
910
175 245251 398
330
0
500
1000
1500
2000
2500
3000
3500
4000
4500
2006 2008 2010 2012 2014
Nu
mb
er o
f Ev
ents
Unsafe Condition Near Miss
Patient Event No Harm Patient Event Harm
Source Institute of Safe Medication Practices on behalf of the Pennsylvania Patient Safety Authority 2006-2014
Note Pennsylvania Patient Safety Reporting System reports of medication errors are from acute-level facilities that consist of hospitals
ambulatory surgical facilities birthing centers and abortion facilities Medication errors do not include adverse drug reac tions Eventharm
categories refer to those in the Agency for Healthcare Research and Quality Common Formats Unsafe condition is defined as any
circumstance that increases the probability of a patient safety event A near miss is defined as a patient safety event that did not reach the
patient Deaths are included in the total but not shown on the chart because there were too few to render graphically
192 166 336530 662
2287 24842385
2364 1955
16271461 1272
1208
1055
0
500
1000
1500
2000
2500
3000
3500
4000
4500
2006 2008 2010 2012 2014
Nu
mb
er o
f Ev
ents
lt18 18-64 65+
Importance Acute malignant andmdashincreasinglymdashchronic pain often is treated or managed
with prescription opioids Reducing patient harm from the use of opioids in both inpatient
and outpatient settings is a main area of focus because opioid-related adverse drug events are
often preventable
Trends
In Pennsylvania the total number of medication error reports related to opioids decreased
106 between 2006 (4106) and 2014 (3672)
Between 24 and 54 opioid-related medication errors resulting in patient harm or death
were reported from 2006 through 2014 accounting for approximately 1 of all reported
opioid medication errors each year
The largest share of opioid-related medication errors reported each year in Pennsylvania
related to those that reached the patient but did not result in harm Of these no-harm
events reaching the patient about one in four required monitoring andor intervention to
preclude the harm
National Healthcare Quality and Disparities Report | 19
Patient Safety
20 | National Healthcare Quality and Disparities Report
Although small in number reports of unsafe conditions increased from 43 (175) of
total opioid-related medication error reports in 2006 to 9 (330) in 2014 Reports of
unsafe conditions and near misses can provide important learning opportunities for
preventing patient harm
Differences Between Groups Reports of opioid-related medication errors involving
pediatric patients increased nearly fourfold from 192 (47) in 2006 to 662 (18) in 2014
During the same period reports of opioid-related medication errors involving older adult
patients decreased from nearly 40 of the total to less than 30
Patient Safety in the Nursing Home Setting
More than 3 million people receive care in US nursing homes and skilled nursing facilities
each year (CDC 2015)
For nursing home residents optimal care seeks to maximize quality of life and minimize
unintended complications
Measures tracked for patients of various age ranges include
Nursing home residents with urinary tract infections
Nursing home residents experiencing use of restraints
Nursing home residents who have pressure ulcers
Nursing home residents who had a fall with major injury
Nursing home residents who received antipsychotic medication
Urinary Tract Infections
Long-stay nursing home residents experiencing urinary tract infections by sex and raceethnicity 2011-2013
Source Centers for Medicare amp Medicaid Services Minimum Data Set 2011-2013
DenominatorNursing home residents of any age w ho have at least 101 cumulative days in the facility
Note For this measure low er percentages are better The measure w as calculated as follows Percentage of long-stay residents with a urinary
tract infection w ithin the 30 days prior to assessment White Black and Asian are non-Hispanic Hispanic includes all races
0
2
4
6
8
10
2011 2012 2013
Pe
rce
nt
Total Male Female
2011 Achievable
Benchmark 61
0
2
4
6
8
10
2011 2012 2013
Pe
rce
nt
White Black Asian Hispanic
2011 Achievable
Benchmark 61
Long-stay nursing home residents experiencing urinary tract infections by sex and raceethnicity 2011-2013
Source Centers for Medicare amp Medicaid Services Minimum Data Set 2011-2013
DenominatorNursing home residents of any age w ho have at least 101 cumulative days in the facilityNote For this measure low er percentages are better The measure w as calculated as follows Percentage of long-stay residents with a urinary
tract infection w ithin the 30 days prior to assessment White Black and Asian are non-Hispanic Hispanic includes all races
0
2
4
6
8
10
2011 2012 2013
Pe
rce
nt
Total Male Female
2011 Achievable
Benchmark 61
0
2
4
6
8
10
2011 2012 2013
Pe
rce
nt
White Black Asian Hispanic
2011 Achievable
Benchmark 61
Patient Safety
Importance Bacteria that cause urinary tract infections (UTIs) can spread to other body
parts and become more serious or contribute to further complications such as delirium
Overall Percentage In 2013 the percentage of long-stay nursing home residents with a UTI
was 64
Groups With Disparities
In 2013 compared with males (51) the percentage with UTIs was worse for females
(7)
In 2013 compared with White residents (68) the percentage of residents with UTIs
was lower for Blacks and Asians (47) as well as Hispanics (54)
Achievable Benchmark
In 2011 the top 5 State achievable benchmark for UTIs was 61 The States that
contributed to the achievable benchmark are Connecticut Hawaii Minnesota North
Dakota and Pennsylvania
Males Blacks Asians and Hispanics have achieved the benchmark
Use of Restraints
00
05
10
15
20
25
30
35
40
2011 2012 2013
Pe
rce
nt
White Black Asian Hispanic
00
05
10
15
20
25
30
35
40
2011 2012 2013
Pe
rce
nt
Total 0-64 65-74 75-84 85+
2011 Achievable
Benchmark 07
Long-stay nursing home residents experiencing use of restraints by age and raceethnicity 2011-2013
Source Centers for Medicare amp Medicaid Services Minimum Data Set 2011-2013
Denominator Nursing home residents of any age who have at least 101 cumulative days in the facility
Note For this measure lower percentages are better The measure was calculated as follows Percentage of long-stay residents who are
physically restrained on a daily basis
2011 Achievable
Benchmark 07
00
05
10
15
20
25
30
35
40
2011 2012 2013
Pe
rce
nt
White Black Asian Hispanic
00
05
10
15
20
25
30
35
40
2011 2012 2013
Pe
rce
nt
Total 0-64 65-74 75-84 85+
2011 Achievable
Benchmark 07
Long-stay nursing home residents experiencing use of restraints by age and raceethnicity 2011-2013
Source Centers for Medicare amp Medicaid Services Minimum Data Set 2011-2013
Denominator Nursing home residents of any age who have at least 101 cumulative days in the facility
Note For this measure lower percentages are better The measure was calculated as follows Percentage of long-stay residents who are
physically restrained on a daily basis
2011 Achievable
Benchmark 07
National Healthcare Quality and Disparities Report | 21
Patient Safety
Importance Residents who are restrained daily can become weak lose their ability to go to
the bathroom by themselves and develop pressure ulcers or other medical conditions
Overall Percentage In 2013 the percentage of long-stay nursing home residents who were
physically restrained on a daily basis was 14
Groups With Disparities
In 2011 2012 and 2013 the percentage of residents with restraint use on a daily basis
was lower for those ages 65-74 years compared with those under age 65 In 2013 the
percentage of residents ages 65-74 years experiencing use of restraints was 12
compared with 16 for residents younger than 65
In 2013 compared with Whites (14) Asians (2) and Hispanics (18) had worse
percentages of daily restraint use and Blacks (12) had a better percentage of daily
restraint use
Achievable Benchmark
In 2011 the top 5 State achievable benchmark for restraint use was 07 The States that
contributed to the achievable benchmark are Kansas Maine Nebraska New Hampshire
and Vermont
No group achieved the benchmark from 2011 to 2013
Pressure Ulcers
Low-risk short-stay and high-risk long-stay nursing home residents who have pressure ulcers by sex 2011-2013
Source Centers for Medicare amp Medicaid Services Minimum Data Set 2011-2013
Denominator Low-risk short-stay Nursing home residents of any age who have 100 or fewer cumulative days in the facility and are active can
change positions and are getting the nutrients they need to maintain good skin health High-risk long-stay Nursing home residents of any age
who have at least 101 cumulative days in the facility and are in a coma do not get the nutrients needed to maintain good skin health or cannot
change position on their own
Note For this measure lower percentages are better
0
2
4
6
8
10
12
2011 2012 2013
Pe
rce
nt
Low-Risk Short StayTotal Male Female
2011 Achievable Benchmark10
0
2
4
6
8
10
12
2011 2012 2013
Pe
rce
nt
High-Risk Long StayTotal Male Female
2008 Achievable Benchmark 71
Low-risk short-stay and high-risk long-stay nursing home residents who have pressure ulcers by sex 2011-2013
Source Centers for Medicare amp Medicaid Services Minimum Data Set 2011-2013
Denominator Low-risk short-stay Nursing home residents of any age who have 100 or fewer cumulative days in the facility and are active can
change positions and are getting the nutrients they need to maintain good skin health High-risk long-stay Nursing home residents of any age
who have at least 101 cumulative days in the facility and are in a coma do not get the nutrients needed to maintain good skin health or cannot
change position on their own
Note For this measure lower percentages are better
0
2
4
6
8
10
12
2011 2012 2013
Pe
rce
nt
Low-Risk Short StayTotal Male Female
2011 Achievable Benchmark10
0
2
4
6
8
10
12
2011 2012 2013
Pe
rce
nt
High-Risk Long StayTotal Male Female
2008 Achievable Benchmark 71
22 | National Healthcare Quality and Disparities Report
Patient Safety
Importance Pressure ulcers are serious medical conditions They typically result from
prolonged periods of uninterrupted pressure on the skin soft tissue muscle and bone
Vulnerable patients include older adults stroke and diabetic patients patients with dementia
circulatory diseases dehydration and malnutrition and people who use wheelchairs or are
bedriddenmdashthat is any patient with impaired mobility or sensation
Overall Percentage In 2013 the percentage of low-risk short-stay residents with pressure
ulcers was 13 and the percentage of high-risk long-stay residents with pressure ulcers was
77
Groups with Disparities
As in 2011 and 2012 male low-risk short-stay nursing home residents had a worse
percentage with pressure ulcers (15) compared with female residents (12) in 2013
As in 2011 and 2012 male high-risk long-stay nursing home residents had a worse
percentage with pressure ulcers (94) compared with female residents (70) in 2013
Achievable Benchmark
The 2011 top 5 State achievable benchmark for low-risk short-stay nursing home residents was 10 The States that contributed to the benchmark were Alabama Arizona Colorado Connecticut and Idaho
The 2008 top 5 State achievable benchmark for high-risk long-stay nursing home residents was 71 The States that contributed to the benchmark were Hawaii Minnesota Nebraska New Hampshire and North Dakota
No low-risk short-stay residents achieved the benchmark from 2011 to 2013 Among
high-risk long-stay residents only females achieved the benchmark by 2013
National Healthcare Quality and Disparities Report | 23
Patient Safety
Falls
00
05
10
15
20
25
30
35
40
45
50
Pe
rce
nt
2012 2013
Long-stay nursing home residents who had a fall with major injury by sex age and raceethnicity 2012-2013
Source Centers for Medicare amp Medicaid Services Minimum Data Set 2012-2013
Denominator Nursing home residents of any age who have at least 101 cumulative days in the facility with one or more look-back scan
assessments except when the occurrence of falls or number of falls with major injury was not assessed in the look-back scan assessment
Note For this measure lower percentages are better White Black and Other are non-Hispanic Hispanic includes all races
2012 Achievable
Benchmark 22
00
05
10
15
20
25
30
35
40
45
50
Pe
rce
nt
2012 2013
Long-stay nursing home residents who had a fall with major injury by sex age and raceethnicity 2012-2013
Source Centers for Medicare amp Medicaid Services Minimum Data Set 2012-2013
Denominator Nursing home residents of any age who have at least 101 cumulative days in the facility with one or more look-back scan
assessments except when the occurrence of falls or number of falls with major injury was not assessed in the look-back scan assessment
Note For this measure lower percentages are better White Black and Other are non-Hispanic Hispanic includes all races
2012 Achievable
Benchmark 22
Importance Nursing home residents who experience falls resulting in major injuries are at
higher risk of death and disability as well as emotional trauma that can affect functional
abilities and social well-being
Overall Percentage In 2013 the percentage of long-stay nursing home residents who had a
fall with a major injury was 34
Groups With Disparities
In 2013 female nursing home residents had a worse percentage of falls (38) compared
with male residents (25)
In 2013 the percentage of falls with major injury was worse for all subgroups of
residents age 65 years and over compared with their younger counterparts The
percentage for residents under 65 years old was 17 compared with 26 for ages 65shy
74 years 34 for ages 75-84 years and 41 for 85 years and over
Also in 2013 compared with Whites (38) the percentage of falls with major injury
was better for Black (13) Other (22) and Hispanic (24) residents
24 | National Healthcare Quality and Disparities Report
Patient Safety
National Healthcare Quality and Disparities Report | 25
Achievable Benchmark
The 2012 top 5 State achievable benchmark for falls with major injury was 22 The
States that contributed to the achievable benchmark are Alaska California District of
Columbia Hawaii and New Jersey The benchmark was achieved by Black residents and those ages 0-64 years
Antipsychotic Medication Among Nursing Home Residents
Importance The high use of antipsychotic medications among nursing home residents for
indications other than those for which the drug was approved has been noted by the Federal
Government These drugs are often used for too long at too high a dose or when
unnecessary In the past inappropriate prescribing of antipsychotics in nursing homes has
primarily been considered a marker of suboptimal care Recent studies have shown
antipsychotic use is also a drug safety issue (Huybrechts et al 2012) Antipsychotic
medication use is associated with increased risks of adverse events such as movement
disorders falls hip fractures and cerebrovascular events Their use in older adults with
dementia carries an increased risk of death Safety concerns with antipsychotic medication
use in older adults also include the risks of hyperprolactinemia pneumonia
0
5
10
15
20
25
30
Percent
2012 2013
Adult long-stay nursing home residents who received antipsychotic medication by raceethnicity and number of chronic conditions 2012-2013
Key NHOPI = Native Hawaiian or Other Pacific Islander AIAN = American Indian or Alaska Native
Source Centers for Medicare amp Medicaid Services Minimum Data Set 2012-2013
Denominator Nursing home residents of any age who have at least 101 cumulative days in the facility excluding residents with schizophrenia
Tourettersquos syndrome and Huntingtonrsquos disease
Numerator Subset of denominator that receives an antipsychotic medication
Note For this measure lower percentages are better
2012 Achievable
Benchmark 150
0
5
10
15
20
25
30
Percent
2012 2013
Adult long-stay nursing home residents who received antipsychotic medication by raceethnicity and number of chronic conditions 2012-2013
Key NHOPI = Native Hawaiian or Other Pacific Islander AIAN = American Indian or Alaska Native
Source Centers for Medicare amp Medicaid Services Minimum Data Set 2012-2013
Denominator Nursing home residents of any age who have at least 101 cumulative days in the facility excluding residents with schizophrenia
Tourettersquos syndrome and Huntingtonrsquos disease
Numerator Subset of denominator that receives an antipsychotic medication
Note For this measure lower percentages are better
2012 Achievable
Benchmark 150
Patient Safety
26 | National Healthcare Quality and Disparities Report
thromboembolism cerebrovascular events and other cardiovascular adverse events (Chiu et
al 2015)
Overall Percentage The percentage of long-stay nursing home residents who had
antipsychotic medications was 176 in 2013
Groups With Disparities
In 2013 the percentage of residents receiving antipsychotic medication was higher for
Hispanic residents (201) than for White residents (180)
In 2012 and 2013 the percentage of long-stay residents who received antipsychotic
medications was worse for residents with one or more chronic conditions than for
residents with no chronic conditions
Achievable Benchmark
The 2012 top 6 State achievable benchmark was 150 The States that contributed to the
achievable benchmark are Alaska California Hawaii Michigan New Jersey and
Wyoming Asians NHOPIs residents with no chronic conditions and residents with one chronic
condition achieved the benchmark
Antipsychotic Medication Among Nursing Home Residents by State
Long-stay nursing home residents who received antipsychotic medication by State 2013
Source Centers for Medicare amp Medicaid Services Minimum Data Set 2013
Denominator Nursing home residents of any age who have at least 101 cumulative days in the facility
Note For this measure lower percentages are better
AZ
CA
UT
CT
FL
GA
IA
IL
KS
MA
MDMO
NJ
NY
OR
PA
SC
TN
CO
WA
WI
VA
ME
MN
MI
NC
TX
KY
WV
RI
NE
VT
NV OH
SD
AR
IN
NH
MT
ID
WY
ND
NMOK
LA
MS AL
DE
AKAK
HI
DC
85-153 (1st Quartile)
154-173 (2nd Quartile)
No Data
174-192 (3rd Quartile)
PR193-234 (4th Quartile)
Long-stay nursing home residents who received antipsychotic medication by State 2013
Source Centers for Medicare amp Medicaid Services Minimum Data Set 2013
Denominator Nursing home residents of any age who have at least 101 cumulative days in the facility
Note For this measure lower percentages are better
AZ
CA
UT
CT
FL
GA
IA
IL
KS
MA
MDMO
NJ
NY
OR
PA
SC
TN
CO
WA
WI
VA
ME
MN
MI
NC
TX
KY
WV
RI
NE
VT
NV OH
SD
AR
IN
NH
MT
ID
WY
ND
NMOK
LA
MS AL
DE
AKAK
HI
DC
85-153 (1st Quartile)
154-173 (2nd Quartile)
No Data
174-192 (3rd Quartile)
PR193-234 (4th Quartile)
Patient Safety
Overall This map shows overall rankings of States (by quartiles) in the percentage of long-
stay nursing home residents who received antipsychotic medication in 2013 Values ranged
from 85 to 234
Differences by State Interquartile ranges follow
First quartile (lowest) 85-153 (AK CA DC DE HI MD MI MN NJ NC SC
WI WV)
Second quartile (second lowest) 153 -173 (CO ID MT NM NY ND OR PA
RI SD VT WA WY)
Third quartile (second highest) 174-192 (AZ CT GA IN IA KS ME MA MO
NV OH OK VA)
Fourth quartile (highest) 193-234 (AL AR FL IL KY LA MS NE NH TN
TX UT)
Eight of the 12 States in the quartile with the highest percentage of long-stay nursing
home residents who received antipsychotic medication were in the South
Patient Safety in the Home Health Setting
Home health agencies provide services to beneficiaries who are homebound and need skilled
nursing care or therapy
Approximately 12 million individuals receive home health care from more than 33000
providers for causes including acute illness long-term health conditions permanent
disability or terminal illness (NAHCH 2010)
Improvements among home health patients can reflect the quality of care from home health
agencies
Measures include
Home health patients with improvement in surgical wounds
Home health patients with improvements in their ability to take medications orally
National Healthcare Quality and Disparities Report | 27
Patient Safety
Improvement in Surgical Wounds
75
80
85
90
95
100
2010 2011 2012 2013
Pe
rce
nt
White Black Asian Hispanic
75
80
85
90
95
100
2010 2011 2012 2013
Pe
rce
nt
Total 0-64 65-74
75-84 85+
2011 Achievable
Benchmark 913
Home health patients with improvement in surgical wounds by age and raceethnicity 2010-2013
Source Centers for Medicare amp Medicaid Services Outcome and Assessment Information Set 2010-2013
Denominator Number of home health episodes during the measurement period in which the patient of any age had a surgical wound and the
episode ended with the patient discharged from home health care
Note White Black and Asian are non-Hispanic Hispanic includes all races
2011 Achievable
Benchmark 913
75
80
85
90
95
100
2010 2011 2012 2013
Per
cen
t
White Black Asian Hispanic
75
80
85
90
95
100
2010 2011 2012 2013
Per
cen
t
Total 0-64 65-74
75-84 85+
2011 Achievable
Benchmark 913
Home health patients with improvement in surgical wounds by age and raceethnicity 2010-2013
Source Centers for Medicare amp Medicaid Services Outcome and Assessment Information Set 2010-2013
Denominator Number of home health episodes during the measurement period in which the patient of any age had a surgical wound and the
episode ended with the patient discharged from home health care
Note White Black and Asian are non-Hispanic Hispanic includes all races
2011 Achievable
Benchmark 913
Importance Normal wound healing after an operation is an important marker of good care
The home health team should regularly change wound dressing and teach the patient about
wound care
Overall Percentage In 2013 the percentage of home health patients with improvement in
their surgical wounds was 890
Trends The percentage of health home patients with surgical wound improvement increased
between 2010 and 2013
Groups With Disparities
In 2013 compared with residents under age 65 years (856) all other age groups had
better percentages of improvement in surgical wounds The percentage was 893 for
ages 65-74 905 for ages 75-84 and 917 for ages 85 and over
In 2013 compared with Whites (893) Blacks (878) Asians (882) and Hispanics
(874) had worse percentages of improvement in surgical wounds
The 2010 through 2013 trend in the percent of home health patients with surgical wound
improvement did not change for those over age 65 relative to persons under age 65 years
28 | National Healthcare Quality and Disparities Report
Patient Safety
Achievable Benchmark
The 2011 top 5 State achievable benchmark was 913 The States that contributed to the
benchmark are Alabama Mississippi Nevada Oklahoma and South Carolina
Home health patients age 85 years and over achieved the benchmark for surgical wound
improvement in 2013
At the current rate of progress patients ages 75-84 years could reach the benchmark
within a year Patients ages 65-74 years could achieve the benchmark in approximately 2
years
White home health patients could achieve the benchmark in approximately 2 years
Improvement in Ability To Take Medication Orally
0
20
40
60
80
100
2010 2011 2012 2013
Per
cen
t
White Black Asian Hispanic
0
20
40
60
80
100
2010 2011 2012 2013
Per
cen
t
Total 0-64 65-74
75-84 85+
2008 Achievable
Benchmark 516
Home health patients with improvement in their ability to take medications orally by age and raceethnicity 2010-2013
Source Centers for Medicare amp Medicaid Services Outcome and Assessment Information Set 2010-2013
Denominator Number of home health care episodes in which a patient of any age was unable to take oral medications independently at the
start of the episode that ended during the measurement period
Note White Black and Asian are non-Hispanic Hispanic includes all races
2008 Achievable
Benchmark 516
0
20
40
60
80
100
2010 2011 2012 2013
Per
cen
t
White Black Asian Hispanic
0
20
40
60
80
100
2010 2011 2012 2013
Per
cen
t
Total 0-64 65-74
75-84 85+
2008 Achievable
Benchmark 516
Home health patients with improvement in their ability to take medications orally by age and raceethnicity 2010-2013
Source Centers for Medicare amp Medicaid Services Outcome and Assessment Information Set 2010-2013
Denominator Number of home health care episodes in which a patient of any age was unable to take oral medications independently at the
start of the episode that ended during the measurement period
Note White Black and Asian are non-Hispanic Hispanic includes all races
2008 Achievable
Benchmark 516
Importance Taking medications correctly is important to the health status and quality of life
of individuals living in the community The home health team can help teach a patient ways
to organize drugs and take them properly
Overall Percentage In 2013 the percentage of home health patients with improvement in
their ability to take medications orally was 513
Trends Between 2010 and 2013 there was improvement in the overall percentage of home
health patients with improved ability to take medications orally
National Healthcare Quality and Disparities Report | 29
Patient Safety
Groups With Disparities
In 2013 the percentage of home health patients with improvement in their ability to take
medications orally was worse for those age 85 years and over (398) compared with
those under age 65 years (577)
The percentage of patients with improvement in their ability to take medications orally
was worse among Hispanic home health patients (400) than among White patients
(526) in 2013
From 2010 to 2013 the gap between Blacks and Whites decreased and the gap between
Asians and Whites and Hispanics and Whites increased
Achievable Benchmark
The 2008 top 5 State achievable benchmark was 516 The States that contributed to the
achievable benchmark are Iowa Massachusetts New Jersey North Dakota and South
Carolina
The benchmark was achieved among age groups under 85 years and by White and Black
home health patients
The total population is estimated to reach the benchmark in less than a year Hispanic
patients and patients age 85 years and over are farthest from the benchmark
Improvement in Ability To Take Medication Orally by State
Home health patients with improvement in their ability to take medications orally by raceethnicity by State 2013
Source Centers for Medicare amp Medicaid Services Outcome and Assessment Information Set 2013
Denominator Number of home health care episodes in which a patient of any age was unable to take oral medications independently at the
start of the episode that ended during the measurement period
AZ
CA
UT
CT
FL
GA
IA
IL
KS
MA
MDMO
NJ
NY
OR
PA
SC
TN
CO
WA
WI
VA
ME
MN
MI
NC
TX
KY
WV
RI
NE
VT
NV OH
SD
AR
IN
NH
MT
ID
WY
ND
NMOK
LA
MS AL
DE
AKAK
HI
No significant difference between rates
of Hispanics and non-Hispanic Whites
Non-Hispanic Whites have significantly
worse rate than Hispanics
States do not have data that meet the
criteria for statistical reliability data
quality or confidentiality
Hispanics have significantly worse rate
than non-Hispanic Whites
DC
Home health patients with improvement in their ability to take medications orally by raceethnicity by State 2013
Source Centers for Medicare amp Medicaid Services Outcome and Assessment Information Set 2013
Denominator Number of home health care episodes in which a patient of any age was unable to take oral medications independently at the
start of the episode that ended during the measurement period
AZ
CA
UT
CT
FL
GA
IA
IL
KS
MA
MDMO
NJ
NY
OR
PA
SC
TN
CO
WA
WI
VA
ME
MN
MI
NC
TX
KY
WV
RI
NE
VT
NV OH
SD
AR
IN
NH
MT
ID
WY
ND
NMOK
LA
MS AL
DE
AKAK
HI
No significant difference between rates
of Hispanics and non-Hispanic Whites
Non-Hispanic Whites have significantly
worse rate than Hispanics
States do not have data that meet the
criteria for statistical reliability data
quality or confidentiality
Hispanics have significantly worse rate
than non-Hispanic Whites
DC
30 | National Healthcare Quality and Disparities Report
Patient Safety
Geographic Variation
In 2013 Hispanic home health patients had worse rates of improvement in taking oral
medications than non-Hispanic White patients in 11 States (Arizona California
Connecticut Florida Illinois Indiana Massachusetts Nevada New York North
Carolina and Texas
Non-Hispanic White patients had worse rates of improvement than Hispanic patients in
five States (Hawaii Idaho Iowa Michigan and Pennsylvania)
Patient Safety in the Ambulatory Setting
Although patient safety initiatives frequently focus on inpatient hospital events adverse
effects of medical care may be identified and treated in outpatient settings
Adverse effects of medical care can follow care or procedures in hospitals emergency
departments physician offices or other settings
Measures include
Patient safety and quality issues by frequency of occurrence in outpatient medical offices
Adults age 65 years and over who received potentially inappropriate prescription medications during the calendar year
Percentage of hemodialysis patients with vascular catheter in use for 90 days or longer
For more information see the PSNet link to Patient Safety Primer Patient Safety in
Ambulatory Care httpspsnetahrqgovprimersprimer16patient-safety-in-ambulatory-care
National Healthcare Quality and Disparities Report | 31
Patient Safety
Patient Safety and Quality Issues
Patient safety and quality issues by frequency of occurrence in outpatient medical offices 2014
Source Westat analysis of the AHRQ 2014 Medical Office Survey on Patient Safety Culture Comparative Database (N=935)
Note For this measure less frequent occurrences during the year are better
0
20
40
60
80
100
A pharmacy contactedour office to clarify orcorrect a prescription
A patient was unableto get an appointmentwithin 48 hours for anacuteserious problem
A patients medicationlist was not updatedduring his or her visit
The results from a labor imaging test were notavailable when needed
A patients chartmedicalrecord was not available
when needed
Occurred DailyWeekly
Occurred Monthly
Occurred Not at All to Several Times Over the Past Year
Patient safety and quality issues by frequency of occurrence in outpatient medical offices 2014
Source Westat analysis of the AHRQ 2014 Medical Office Survey on Patient Safety Culture Comparative Database (N=935)
Note For this measure less frequent occurrences during the year are better
0
20
40
60
80
100
A pharmacy contactedour office to clarify orcorrect a prescription
A patient was unableto get an appointmentwithin 48 hours for anacuteserious problem
A patients medicationlist was not updatedduring his or her visit
The results from a labor imaging test were notavailable when needed
A patients chartmedicalrecord was not available
when needed
Occurred DailyWeekly
Occurred Monthly
Occurred Not at All to Several Times Over the Past Year
Importance Most health care takes place in the outpatient or ambulatory care setting Lack
of access to care and lack of access to timely and accurate medical information and test
results may contribute to patient safety events such as missed or delayed diagnoses
medication errors failure to order appropriate diagnostic or laboratory tests incorrect
interpretation of tests and inadequate followup on results
Overall Percentage
Almost 30 of medical offices participating in the survey reported daily or weekly
occurrences of being contacted by the pharmacist for clarification or correction on a
prescription
After prescription clarifications or corrections by the pharmacy medical offices were
next most likely to report daily or weekly issues with patients being unable to get an
appointment within 48 hours for an acute or serious problem (14) or the patientrsquos
medication list not getting updated during their visit (11)
The share of medical offices reporting that lab or imaging tests were not available when
needed reached nearly 20 when considering monthly occurrences as well as those that
occurred more frequently
32 | National Healthcare Quality and Disparities Report
Patient Safety
Potentially Inappropriate Prescriptions for Older Adults
Adults age 65 years and over who received potentially inappropriate prescription medications during the calendar year by sex and
perceived health status 2003ndash2013
Source Agency for Healthcare Research and Quality Medical Expenditure Panel Survey 2003-2013
Note For this measure lower percentages are better Prescription medications received include all prescribed medications initiall y purchased
or otherwise obtained as well as any refills For more information on inappropriate medications see the American Geriatrics Society 2012 Beers
Criteria Update Expert Panel American Geriatrics Society updated Beers Criteria for potentially inappropriate medication use in older adults J
Am Geriatr Soc 2012 Apr60(4)616-31
0
5
10
15
20
25
30
Per
cen
t
Total Male Female
0
5
10
15
20
25
30
Per
cen
t
ExcellentVery GoodGood FairPoor
Adults age 65 years and over who received potentially inappropriate prescription medications during the calendar year by sex and
perceived health status 2003ndash2013
Source Agency for Healthcare Research and Quality Medical Expenditure Panel Survey 2003-2013
Note For this measure lower percentages are better Prescription medications received include all prescribed medications initially purchased
or otherwise obtained as well as any refills For more information on inappropriate medications see the American Geriatrics Society 2012 Beers
Criteria Update Expert Panel American Geriatrics Society updated Beers Criteria for potentially inappropriate medication use in older adults J
Am Geriatr Soc 2012 Apr60(4)616-31
0
5
10
15
20
25
30
Per
cen
t
Total Male Female
0
5
10
15
20
25
30
Per
cen
t
ExcellentVery GoodGood FairPoor
Importance Some drugs that are prescribed for older patients are known to be potentially
harmful for this age group
Overall Percentage In 2013 the percentage of adults age 65 years and over who received
potentially inappropriate prescription medications was 114
Trends From 2003 to 2013 the percentage of adults age 65 years and over who received
potentially inappropriate prescription medications improved overall for both sexes and for
people with excellentvery goodgood health status and people with fairpoor health status
Groups With Disparities
In all years the percentage of patients receiving potentially inappropriate medications
was higher among females compared with males This gap was not changing over time
In all years from 2003 to 2013 the percentage of patients receiving potentially
inappropriate medications was higher among people with fairpoor health status
compared with people with excellentgood health status This gap was not changing over
time
National Healthcare Quality and Disparities Report | 33
Patient Safety
Long-Term Catheter Use in Dialysis Patients
HI
AKAK
AZ
CA
UT
CT
FL
GA
IA
IL
KS
MA
MDMO
NJ
NY
OR
PA
SC
TN
CO
WA
WI
VA
ME
MN
MI
NC
TX
KY
WV
RI
NE
VT
NV OH
SD
AR
IN
NH
MT
ID
WY
ND
NMOK
LA
MSAL
DE
DC
10-12
13-18
7-9
PR
Source Centers for Medicare and Medicaid Services Dialysis Facility Compare 2014
Denominator At-risk adult Medicare patients with a central venous catheter who were receiving regular hemodialysis treatments at dialysis
facilities
Note For this measure lower percentages are better
Percentage of hemodialysis patients with central venous catheters used for vascular access for 90 days or longer by State 2014
HI
AKAK
AZ
CA
UT
CT
FL
GA
IA
IL
KS
MA
MDMO
NJ
NY
OR
PA
SC
TN
CO
WA
WI
VA
ME
MN
MI
NC
TX
KY
WV
RI
NE
VT
NV OH
SD
AR
IN
NH
MT
ID
WY
ND
NMOK
LA
MSAL
DE
DC
10-12
13-18
7-9
PR
Source Centers for Medicare and Medicaid Services Dialysis Facility Compare 2014
Denominator At-risk adult Medicare patients with a central venous catheter who were receiving regular hemodialysis treatments at dialysis
facilities
Note For this measure lower percentages are better
Percentage of hemodialysis patients with central venous catheters used for vascular access for 90 days or longer by State 2014
Importance Central venous catheters are frequently used for vascular access to dialysis
patients until a fistula or graft is formed Central venous catheters have higher rates of
infection and adverse events among patients receiving dialysis treatment compared with
other forms of vascular access To decrease the likelihood of adverse events catheters should
be used for less than 90 days
Overall Percentage Nationally an average of 10 of dialysis patients used central venous
catheters for 90 days or longer in 2014
Geographic Variation In 2014 Alabama and Kansas had the lowest percentages of dialysis
patients using central venous catheters for 90 days or longer (7) and Puerto Rico had the
highest percentage (18) of long-term catheter use
Patient Safety Infrastructure
Efforts to improve patient safety have been accompanied by various infrastructure
enhancements
Growth in patient safety organizations which assist providers in detecting and reducing
risks and hazards from care delivery that may lead to patient harm
System improvement initiatives at the Veterans Health Administration (VHA)
34 | National Healthcare Quality and Disparities Report
Patient Safety
Development of the National Practitioner Data Bank a clearinghouse for information on
medical malpractice payments
Patient Safety Organizations
Patient safety organizations (PSOs) aim to reduce preventable adverse events near misses
and unsafe conditions in all health care settings
PSOs provide an environment for health care providers to voluntarily report discuss and
learn from patient safety events and quality analyses on a privileged and confidential basis
Measures include
Number of PSOs serving each State
Variation in concentrations of compounded liquid medications for children
Patient Safety Organizations AHRQ Common Formats
AHRQ Common Formats provide a standardized method for PSOs health care providers
and other organizations to collect and report patient safety events
Data element standards are important for aggregating and analyzing events across
providers
AHRQ Common Formats have been developed for a variety of settings of care
Acute care hospitals
Skilled nursing facilities
Retail pharmacy
More information is available at httpspsoahrqgovcommon
National Healthcare Quality and Disparities Report | 35
Patient Safety
Number of Patient Safety Organizations
AZ (2)
CA (3)
UT (2)
CT(3)
FL (8)
GA (5)
IA (4)
IL (7)
KS (5)
MA(3)
MD (4)MO(2)
NJ(3)
NY (5)
OR (3)
PA (5)
SC (4)
TN (5)
CO (2)
WA (2)
WI (5)
VA (7)
ME(2)
MN(3)
MI (3)
NC (7)
TX (6)
KY (4)WV (3)
RI(2)
NE (2)
VT(2)
NV (2)
OH (2)
SD (1)
AR (4)
IN (2)
NH(2)
MT (2)
ID (3)
WY (2)
ND (1)
NM (3)OK (2)
LA (1)
MS (2)
AL (2)
DE(2)
HI (2)
AKAK (2)
DC(3)
PR (0)
1-2
3-4
5-6
7-8
Number of PSOs
excluding PSOs
operating nationally
Number of Patient Safety Organizations by area served 2014
Source Agency for Healthcare Research and Quality Patient Safety Organization Information Form Calendar Year 2014 and PSO-PPC
Contact Database
Note PSOs included in this map were AHRQ-listed during any part of 2014 and submitted the PSO Profile to the PSO Privacy Protection
Center (PSO-PPC) in early 2015 A PSO may have members in one or more States regardless of headquarters location Each State shows the
number of PSOs that serve that State map excludes 38 PSOs that are available to providers in all States
AZ (2)
CA (3)
UT (2)
CT(3)
FL (8)
GA (5)
IA (4)
IL (7)
KS (5)
MA(3)
MD (4)MO(2)
NJ(3)
NY (5)
OR (3)
PA (5)
SC (4)
TN (5)
CO (2)
WA (2)
WI (5)
VA (7)
ME(2)
MN(3)
MI (3)
NC (7)
TX (6)
KY (4)WV (3)
RI(2)
NE (2)
VT(2)
NV (2)
OH (2)
SD (1)
AR (4)
IN (2)
NH(2)
MT (2)
ID (3)
WY (2)
ND (1)
NM (3)OK (2)
LA (1)
MS (2)
AL (2)
DE(2)
HI (2)
AKAK (2)
DC(3)
PR (0)
1-2
3-4
5-6
7-8
Number of PSOs
excluding PSOs
operating nationally
Number of Patient Safety Organizations by area served 2014
Source Agency for Healthcare Research and Quality Patient Safety Organization Information Form Calendar Year 2014 and PSO-PPC
Contact Database
Note PSOs included in this map were AHRQ-listed during any part of 2014 and submitted the PSO Profile to the PSO Privacy Protection
Center (PSO-PPC) in early 2015 A PSO may have members in one or more States regardless of headquarters location Each State shows the
number of PSOs that serve that State map excludes 38 PSOs that are available to providers in all States
Importance All patient safety organizations (PSOs) have authority to operate in all 50
States and US territories but not all do In 2014 38 PSOs self-reported being available to
providers nationally PSOs not available nationally serve specific States
Geographic Variation
Nearly all States have at least 2 PSOs available to providers in their State in addition to
the 38 national PSOs that serve all States
Florida has the most PSOs available with 8 in addition to the 38 nationally available
PSOs The States with the largest number of PSOs available are generally on the East
Coast (eg North Carolina Virginia New York Pennsylvania Tennessee Georgia) or
have large populations (eg Texas Illinois)
North Dakota South Dakota and Louisiana are the only states with just one PSO serving
their State in addition to the 38 national PSOs
Puerto Rico is served by one national PSO only
36 | National Healthcare Quality and Disparities Report
Patient Safety
Compounded Liquid Medications for Children
Compounded liquid medications for children in Michigan 2012
Source Levy S Buckley B Safe Table Success The MI Pediatric Safety Collaboration Presentation presented at the 7th Annual
Meeting of Patient Safety Organizations (PSOs) Rockville MD 2015 April and Rood JM Engels MJ Ciarkowski SL et al Variability in
compounding of oral liquids for pediatric patients a patient safety concern J Am Pharm Assn 201454(4)383-9
Note Information represents 244 responses to online survey of approximately 2000 Michigan pharmacies conducted in June 2012 by
The University of Michigan College of Pharmacy in collaboration with the Michigan Pharmacists Association
0
10
20
30
40
50
1 2 3 4 5 6 7 8 9
Nu
mb
er o
f D
rugs
Number of Unique Concentrations
Number of Different Compounded Concentrations per Drug
0
10
20
30
40
50
No Harm No Harm ButMonitoring
TemporaryHarm
Pe
rce
nt
Compounding Errors by Related Harm and Pharmacy Setting
Inpatient Outpatient
Compounded liquid medications for children in Michigan 2012
Source Levy S Buckley B Safe Table Success The MI Pediatric Safety Collaboration Presentation presented at the 7th Annual
Meeting of Patient Safety Organizations (PSOs) Rockville MD 2015 April and Rood JM Engels MJ Ciarkowski SL et al Variability in
compounding of oral liquids for pediatric patients a patient safety concern J Am Pharm Assn 201454(4)383-9
Note Information represents 244 responses to online survey of approximately 2000 Michigan pharmacies conducted in June 2012 by
The University of Michigan College of Pharmacy in collaboration with the Michigan Pharmacists Association
0
10
20
30
40
50
1 2 3 4 5 6 7 8 9
Nu
mb
er o
f D
rugs
Number of Unique Concentrations
Number of Different Compounded Concentrations per Drug
0
10
20
30
40
50
No Harm No Harm ButMonitoring
TemporaryHarm
Per
cen
t
Compounding Errors by Related Harm and Pharmacy Setting
Inpatient Outpatient
Importance
Liquid medications are widely used in pediatrics because many children find it difficult
to swallow tablets or capsules If not commercially manufactured these liquid
medications require a pharmacist to compound them to the correct dosage for the patient
This practice of compounding has led to a variety of medication concentrations in use In
the absence of standard concentrations for compounded medications there is a risk that
children may accidentally receive medications that are too potent and can be dangerous
or are too weak to be effective
The Michigan Health amp Hospital Association Keystone Center Patient Safety
Organization hosts five Pediatric Safe Tables each year Safe Tables provided a
confidential and legally protected environment to discuss challenges and improvement
strategies regarding inconsistent medication concentrations for compounded oral liquids
without fear of punitive action against them
National Healthcare Quality and Disparities Report | 37
Patient Safety
Overall Percentage
More than half (527) of drugs identified in the 2012 survey had 3 or more unique
concentrations dispensed to children across Michigan For example Rifampin used to
treat bacterial infections was reported to have 8 different concentrations dispensed to
patients
Nearly one-third (313) of reported errors caused temporary harm or required additional
monitoring despite no harm
Standardization of Compounded Liquid Medications
Source Michigan Health amp Hospital Association Keystone Center Patient Safety Organization and University of Michigan College of Pharmacy
State-Wide Initiative to Standardize the Compounding of Oral Liquids in Pediatrics
Standardization of compounded liquid medications for children in Michigan 2011
Issue identificationbull Hospitals attending PSO Pediatrics Safe
Table raise compounded medication concentrations as a major safety issue
bull Small focus group determines extent of problem
bull Michigan pharmacies are surveyed about baseline concentrations
Develop Interventionbull PSO Quarterly Safe Tables are held to
discuss cases and practicesbull Team develops recommendations for
standard concentrationsbull Consensus is achieved for frequently
compounded pediatric medications 470 formulations for 147 drug entities are reduced to 104 concentrations for 100 drugs
Practice changebull Toolkit is createdbull Standards are disseminated to Michigan
prescribers and pharmacies bull Standards are disseminated to PSO
members and Safe Table participants
Source Michigan Health amp Hospital Association Keystone Center Patient Safety Organization and University of Michigan College of Pharmacy
State-Wide Initiative to Standardize the Compounding of Oral Liquids in Pediatrics
Standardization of compounded liquid medications for children in Michigan 2011
Issue identificationbull Hospitals attending PSO Pediatrics Safe
Table raise compounded medication concentrations as a major safety issue
bull Small focus group determines extent of problem
bull Michigan pharmacies are surveyed about baseline concentrations
Develop Interventionbull PSO Quarterly Safe Tables are held to
discuss cases and practicesbull Team develops recommendations for
standard concentrationsbull Consensus is achieved for frequently
compounded pediatric medications 470 formulations for 147 drug entities are reduced to 104 concentrations for 100 drugs
Practice changebull Toolkit is createdbull Standards are disseminated to Michigan
prescribers and pharmacies bull Standards are disseminated to PSO
members and Safe Table participants
The Role of PSO Safe Tables Based on adverse medication events discussed in the
Michigan Health amp Hospital Association (MHA) Keystone Center Patient Safety
Organization (PSO) Safe Tables in July 2011 the Michigan Pediatric Safety Collaboration
was developed to further assess the scope of the problem and formulate a solution
The Collaborative The Michigan Pediatric Safety Collaboration includes individuals from
the University of Michigan College of Pharmacy the Michigan Pharmacists Association
(MPA) the Food and Drug Administration (FDA) and the MHA Keystone PSO
38 | National Healthcare Quality and Disparities Report
Patient Safety
Practice Change
As a result of the standardization effort 470 unique formulations for 147 drug entities
were reduced to 104 different concentrations for 100 drugs
The Michigan Pediatric Safety Collaboration developed a multistep process to implement
standards for compounding medications The MPA surveyed pharmacies in Michigan to
better define the nature and scope of the problem The PSO continued to act as convener
The result was the creation and dissemination of statewide standards for 120 frequently
compounded pediatric medications
Veterans Health Administration
The National Center for Patient Safety is part of the Veterans Health Administration the
Nationrsquos largest integrated health care system
Patient safety-related system improvement initiatives include
The Daily Planreg
Purchasing for Safety Initiative
Patient Safety Improvement Initiative
Patient safety improvement initiative The Daily Planreg at Veterans Affairs Medical Centers 2009
Source King BJ Mills PD Fore A et al The Daily Planreg including patients for safetys sake Nurs Manage 201243(3)15-8
0
10
20
30
40
50
Identified atleast one
error
Identifiederror
of omission
Identifiederror
ofcommission
Nurses Who Identified Errors in Patient Treatment Plan by Type
0
10
20
30
40
50
Patient founddiscrepancy inplanned care
Family founddiscrepancy inplanned care
Nursing Stafffound
discrepancyin plannedtreatment
Respondents Who Identified Errors or Discrepancies Through The Daily Plan reg
Patient safety improvement initiative The Daily Planreg at Veterans Affairs Medical Centers 2009
Source King BJ Mills PD Fore A et al The Daily Planreg including patients for safetys sake Nurs Manage 201243(3)15-8
0
10
20
30
40
50
Identified atleast one
error
Identifiederror
of omission
Identifiederror
ofcommission
Nurses Who Identified Errors in Patient Treatment Plan by Type
0
10
20
30
40
50
Patient founddiscrepancy inplanned care
Family founddiscrepancy inplanned care
Nursing Stafffound
discrepancyin plannedtreatment
Respondents Who Identified Errors or Discrepancies Through The Daily Plan reg
National Healthcare Quality and Disparities Report | 39
Patient Safety
Importance The Daily Planreg
is a two-page printed summary that acts as a schedule for
patients and providers each day It shows the procedures laboratory tests and medications
scheduled for that day and lists essential health information such as patientrsquos name allergies
and current medications It can be tailored for a patientrsquos needs by extracting orders from the
electronic medical record (EMR) The Daily Planreg
is intended to facilitate patient and family
engagement throughout the course of care The Daily Planreg
shows promise for improving
patient safety Since 2009 the VA has implemented The Daily Planreg
in more than 65
hospitals both inpatient and outpatient care settings The Daily Planreg
is shared more than
75000 times a month and the VA plans to continue the spread of The Daily Planreg
at
additional sites in 2016
Findings
As part of a pilot test in 2009 a total of 198 patients and 85 nurses responded to a survey
across 10 facilities Nurses had an average of 34 patients per shift who received The
Daily Planreg Patients responded about their own experiences whereas nurses reported
about all of their patients who received The Daily Planreg
Nearly half (475) of patients reported finding a discrepancy in planned care through
The Daily Planreg In addition 30 of patients reported that their family members found a
discrepancy Although not every discrepancy will be a potential medical error having a
shared understanding of the plan of care decreases the risk of error
More than one in six nurses (176) identified a discrepancy in treatment among their
patients through The Daily Planreg Most of these nurses (153) found one or more errors
of omission and a smaller share (106) of nurses found one or more errors of
commission some found both
40 | National Healthcare Quality and Disparities Report
Patient Safety
Issues Related to Ventilators
Common use-issues related to ventilators at the Veterans Health Administration 2006-2014 (combined)
Source Veterans Health Administration National Center for Patient Safety data collected October 2006 to October 2014
Note Examples of equipment failures include ventilator shutdown and other ventilator problems Ventilator settings include setup problems and
incorrect settings Support activities include space utilities and supplies Transport includes accidental extubation other transportation issues
and vehicle-related issues Alarms include alarm settings and alarm connection Training includes unknown ventilator model and other training
concerns
0
20
40
60
80
100
120
140
160
EquipmentFailure
VentilatorSettings
SupportActivities
Transport Alarms Training
Nu
mb
er o
f R
epo
rts
Common use-issues related to ventilators at the Veterans Health Administration 2006-2014 (combined)
Source Veterans Health Administration National Center for Patient Safety data collected October 2006 to October 2014
Note Examples of equipment failures include ventilator shutdown and other ventilator problems Ventilator settings include setup problems and
incorrect settings Support activities include space utilities and supplies Transport includes accidental extubation other transportation issues
and vehicle-related issues Alarms include alarm settings and alarm connection Training includes unknown ventilator model and other training
concerns
0
20
40
60
80
100
120
140
160
EquipmentFailure
VentilatorSettings
SupportActivities
Transport Alarms Training
Nu
mb
er o
f R
epo
rts
Importance Beginning with a focus on ventilators the Veterans Health Administrationrsquos
human factors-based Purchasing for Safety Initiative communicates the most common use-
issues associated with medical devices in order to ultimately remove or contain identified
vulnerabilities and prevent further harm
Event Reporting Patient safety managers report events and close calls from more than 150
VA facilities to a national database The largest number of use issues related to ventilators
involved equipment failure and issues such as spontaneous ventilator shutdown compressor
failure and broken or missing parts Other categories of ventilator use issues involved the
physical space where the ventilator was used challenges of transporting patients on
ventilators and problems with ventilator settings and alarms Root cause analyses on reports
are conducted and Patient Safety Alerts are issued to share the learning internally
Other Key Components
Data on ventilator issues from the VA and the Food and Drug Administrationrsquos Medical
Product Safety Network are the basis for a ldquogovernment-industry dayrdquo to work with
manufacturers This information is used to help the device manufacturers better
understand the limits of human use of their products
National Healthcare Quality and Disparities Report | 41
Patient Safety
The VA also trains noncliniciansmdashsuch as biomedical engineers across the
organizationmdashto understand the devices consider the situation for their use and identify
what can go wrong (ldquofailure modesrdquo) in advance
The VA encourages discussions among clinicians about their experience in using devices
In the Applied Patient Safety Challenge hundreds of staff participate in brainstorming
about solutions and strategies for dealing with unexpected scenarios involving devices
National Practitioner Data Bank
Medical malpractice actions are one way to flag potential medical errors
Medical Malpractice Payment Reports are submitted to the National Practitioner Data Bank
by medical malpractice payers
Report of a monetary exchange made for the benefit of a physician dentist or other
health care provider
Result of a settlement or judgment of a written complaint or claim based on that
providerrsquos delivery of or failure to deliver health care services
Number of Medical Malpractice Payment Reports by Setting
Number of Medical Malpractice Payment Reports by health care setting 2004-2014
Source National Practitioner Data Bank (NPDB) Public Use Data File Health Resources and Services Administration Bureau of Health
Professions Division of Practitioner Data Banks 2004-2014
Note Health care setting was not collected by the NPDB for 2104 reports in 2004 ldquoOtherrdquo includes Medical Malpractice Payment Reports
related to unknown settings as well as those for a combination of inpatient and outpatient settings Reports pertain to patients of any age
0
2000
4000
6000
8000
10000
12000
14000
16000
18000
20000
2004 2005 2006 2007 2008 2009 2010 2011 2012 2013 2014
Nu
mb
er o
f R
epo
rts
Total Inpatient Outpatient Other
Number of Medical Malpractice Payment Reports by health care setting 2004-2014
Source National Practitioner Data Bank (NPDB) Public Use Data File Health Resources and Services Administration Bureau of Health
Professions Division of Practitioner Data Banks 2004-2014
Note Health care setting was not collected by the NPDB for 2104 reports in 2004 ldquoOtherrdquo includes Medical Malpractice Payment Reports
related to unknown settings as well as those for a combination of inpatient and outpatient settings Reports pertain to patients of any age
0
2000
4000
6000
8000
10000
12000
14000
16000
18000
20000
2004 2005 2006 2007 2008 2009 2010 2011 2012 2013 2014
Nu
mb
er o
f R
epo
rts
Total Inpatient Outpatient Other
42 | National Healthcare Quality and Disparities Report
Patient Safety
Trends The total number of medical malpractice payment reports (MMPRs) per year
decreased from 17641 in 2004 to 12699 in 2014
Variation Across Reports
Of 157022 MMPRs from 2004 through 2014 more reports related to care in the
outpatient setting (71937) than in the inpatient setting (60391)
Diagnosis-related and treatment-related payments were the most frequent types of
reports each accounting for about 27 of cases Reports of payments for medication-
related cases accounted for only 5 of MMPRs (data not shown)
Number of Medical Malpractice Payment Reports by Allegation and Harm
Number of Medical Malpractice Payment Reports by type of allegation and harm severity 2004-2014
Key Temporary injury = Minor temporary injury and Major temporary injury Permanent significant injury = Significant Permanent Injury
Major Permanent Injury Quadriplegia Brain Damage Lifelong care
Source National Practitioner Data Bank Public Use Data File Health Resources and Services Administration Bureau of Health Professions
Division of Practitioner Data Banks 2004-2014
Note Reports pertain to patients of any age
0
20
40
60
80
100
Treatment(n=42913)
Diagnosis(n=42507)
Surgery(n=36845)
Obstetrics(n=10555)
Medication(n=8287)
Monitoring(n=5329)
Anesthesia(n=4276)
Equipment(n=1161)
BehavioralHealth
(n=879)
Blood(n=379)
EmotionalInjury Only
InsignificantInjury
TemporaryInjury
PermanentMinor Injury
PermanentSignificant Injury
Death Unknown
Number of Medical Malpractice Payment Reports by type of allegation and harm severity 2004-2014
Key Temporary injury = Minor temporary injury and Major temporary injury Permanent significant injury = Significant Permanent Injury
Major Permanent Injury Quadriplegia Brain Damage Lifelong care
Source National Practitioner Data Bank Public Use Data File Health Resources and Services Administration Bureau of Health Professions
Division of Practitioner Data Banks 2004-2014
Note Reports pertain to patients of any age
0
20
40
60
80
100
Treatment(n=42913)
Diagnosis(n=42507)
Surgery(n=36845)
Obstetrics(n=10555)
Medication(n=8287)
Monitoring(n=5329)
Anesthesia(n=4276)
Equipment(n=1161)
BehavioralHealth
(n=879)
Blood(n=379)
EmotionalInjury Only
InsignificantInjury
TemporaryInjury
PermanentMinor Injury
PermanentSignificant Injury
Death Unknown
Overall Percentage From 2004 to 2014 medical malpractice payments were made for
allegations related to
Treatment (42913)
Diagnosis (42507)
Surgery (36845)
Obstetrics (10555)
Medication (8287)
Monitoring (5329)
National Healthcare Quality and Disparities Report | 43
Patient Safety
Anesthesia (4276)
Equipment or products (1161)
Behavioral health (879) and
IV and blood products (379)
Variation Across Reports
Death accounted for more than one-third of harm in payments related to monitoring
(499) diagnosis (393) medication (383) and anesthesia (363) allegations
More than half of all obstetric payments were for allegations of permanent severe harm
(570)
Temporary harm accounted for more than one-third of payments related to equipment
(485) and surgery (360)
Most of the behavioral health-related payments were for emotional harm (457) or
death (338)
References
Agency for Healthcare Research and Quality Making Health Care Safer II An Updated Critical Analysis of the
Evidence for Patient Safety Practices Comparative Effectiveness Review No 211 Rockville MD Agency for
Healthcare Research and Quality March 2013 AHRQ Publication No 13-E001-EF
httpwwwahrqgovsitesdefaultfileswysiwygresearchfindingsevidence-basedshy
reportsservicesqualityptsafetyII-fullpdf
Arriaga AF Lancaster RT Berry RW et al The better colectomy project association of evidence-based best-
practice adherence rates to outcomes in colorectal surgery Ann Surg 2009 Oct250(4)507-13
httpwwwncbinlmnihgovpubmed19734778
Centers for Disease Control and Prevention HAI Prevalence Survey
httpwwwcdcgovHAIsurveillanceindexhtml Last updated March 2016 Accessed March 4 2016
Centers for Disease Control and Prevention Nursing Homes and Assisted Living (Long-Term Care Facilities)
httpwwwcdcgovlongtermcare Last updated September 2015 Accessed March 4 2016
Chassin MR Loeb JM High-reliability health care getting there from here Milbank Q 201391(3)459-90
httpwwwncbinlmnihgovpmcarticlesPMC3790522 Accessed September 23 2015
Chiu Y Bero L Hessol NA et al A literature review of clinical outcomes associated with antipsychotic medication
use in North American nursing home residents Health Policy 2015 Jun119(6)802-813 Epub 2015 Feb 28 PMID
25791166 httpwwwsciencedirectcomsciencearticlepiiS0168851015000652 Accessed June 17 2015
Huybrechts KF Gerhard Crystal S et al Differential risk of death in older residents in nursing homes prescribed
specific antipsychotic drugs Population based cohort study BMJ 2012 Feb 23344e977 PMID 22362541
httpwwwncbinlmnihgovpmcarticlesPMC3285717 Accessed June 17 2015
Institute of Medicine Preventing Medication Errors Quality Chasm Series 2007
httpwwwnapeducatalog11623preventing-medication-errors-quality-chasm-series
National Association for Home Care amp Hospice Basic Statistics About Home Care Updated 2010
httpwwwnahcorgassets1710hc_statspdf Accessed August 31 2015
44 | National Healthcare Quality and Disparities Report
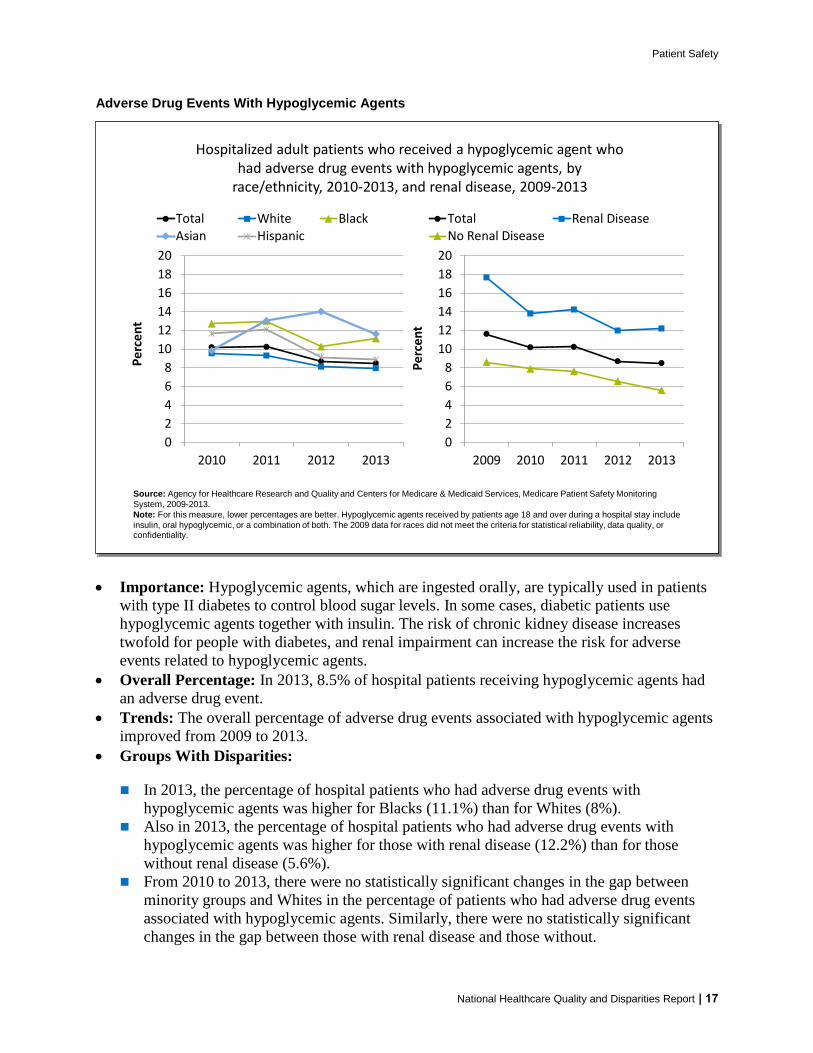
Patient Safety
Adverse Drug Events With Hypoglycemic Agents
Hospitalized adult patients who received a hypoglycemic agent who had adverse drug events with hypoglycemic agents by
raceethnicity 2010-2013 and renal disease 2009-2013
Source Agency for Healthcare Research and Quality and Centers for Medicare amp Medicaid Services Medicare Patient Safety Monitoring
System 2009-2013
Note For this measure lower percentages are better Hypoglycemic agents received by patients age 18 and over during a hospital stay include
insulin oral hypoglycemic or a combination of both The 2009 data for races did not meet the criteria for statistical reliability data quality or confidentiality
0
2
4
6
8
10
12
14
16
18
20
2009 2010 2011 2012 2013
Pe
rce
nt
Total Renal DiseaseNo Renal Disease
0
2
4
6
8
10
12
14
16
18
20
2010 2011 2012 2013
Pe
rce
nt
Total White BlackAsian Hispanic
Hospitalized adult patients who received a hypoglycemic agent who had adverse drug events with hypoglycemic agents by
raceethnicity 2010-2013 and renal disease 2009-2013
Source Agency for Healthcare Research and Quality and Centers for Medicare amp Medicaid Services Medicare Patient Safety Monitoring
System 2009-2013
Note For this measure lower percentages are better Hypoglycemic agents received by patients age 18 and over during a hospital stay include
insulin oral hypoglycemic or a combination of both The 2009 data for races did not meet the criteria for statistical reliability data quality or confidentiality
0
2
4
6
8
10
12
14
16
18
20
2009 2010 2011 2012 2013
Pe
rce
nt
Total Renal DiseaseNo Renal Disease
0
2
4
6
8
10
12
14
16
18
20
2010 2011 2012 2013
Pe
rce
nt
Total White BlackAsian Hispanic
Importance Hypoglycemic agents which are ingested orally are typically used in patients
with type II diabetes to control blood sugar levels In some cases diabetic patients use
hypoglycemic agents together with insulin The risk of chronic kidney disease increases
twofold for people with diabetes and renal impairment can increase the risk for adverse
events related to hypoglycemic agents
Overall Percentage In 2013 85 of hospital patients receiving hypoglycemic agents had
an adverse drug event
Trends The overall percentage of adverse drug events associated with hypoglycemic agents
improved from 2009 to 2013
Groups With Disparities
In 2013 the percentage of hospital patients who had adverse drug events with hypoglycemic agents was higher for Blacks (111) than for Whites (8)
Also in 2013 the percentage of hospital patients who had adverse drug events with
hypoglycemic agents was higher for those with renal disease (122) than for those
without renal disease (56)
From 2010 to 2013 there were no statistically significant changes in the gap between
minority groups and Whites in the percentage of patients who had adverse drug events
associated with hypoglycemic agents Similarly there were no statistically significant
changes in the gap between those with renal disease and those without
National Healthcare Quality and Disparities Report | 17
Patient Safety
Adverse Drug Events With Warfarin
Hospitalized adult patients with an anticoagulant-related adverse drug event with warfarin by age and corticosteroid use 2009-2013
Source Agency for Healthcare Research and Quality and Centers for Medicare amp Medicaid Services Medicare Patient Safety Monitoring
System 2009ndash2013
Denominator Patients 18 and over who received warfarin and had their international normalized ratio (INR) measured during their hospital
stay
Note For this measure lower percentages are better Adverse events occurring the day of hospital arrival were excluded
0
2
4
6
8
10
12
2009 2010 2011 2012 2013
Pe
rce
nt
TotalCorticosteroid UseNo Corticosteroid Use
0
2
4
6
8
10
12
2009 2010 2011 2012 2013
Pe
rce
nt
lt65 65-74 75-84 85+
Hospitalized adult patients with an anticoagulant-related adverse drug event with warfarin by age and corticosteroid use 2009-2013
Source Agency for Healthcare Research and Quality and Centers for Medicare amp Medicaid Services Medicare Patient Safety Monitoring
System 2009ndash2013
Denominator Patients 18 and over who received warfarin and had their international normalized ratio (INR) measured during their hospital
stay
Note For this measure lower percentages are better Adverse events occurring the day of hospital arrival were excluded
0
2
4
6
8
10
12
2009 2010 2011 2012 2013
Pe
rce
nt
TotalCorticosteroid UseNo Corticosteroid Use
0
2
4
6
8
10
12
2009 2010 2011 2012 2013
Pe
rce
nt
lt65 65-74 75-84 85+
Importance Blood clots in arteries and veins can cause a blockage of blood flow and lead to
strokes and heart attacks Anticoagulants such as warfarin reduce this risk but pose an
increased risk of bleeding Corticosteroids can interact with anticoagulants to raise the risk of
potential bleeding complications
Overall Percentage In 2013 50 of adults using warfarin experienced an anticoagulant-
related adverse drug event
Trends From 2009 to 2013 there were no statistically significant changes in the overall
percentage of hospital patients with an adverse drug event related to warfarin
Groups With Disparities
In 2013 the percentage of hospital patients who had an adverse drug event to warfarin
was the same regardless of corticosteroid use status
From 2009 to 2013 there were no statistically significant changes in the gap between
older age groups and those under age 65 in the percentage of patients who had adverse
events associated with warfarin Similarly there were no statistically significant changes
in the gap between those using corticosteroids and those not using corticosteroids
18 | National Healthcare Quality and Disparities Report
Patient Safety
Opioid-Related Medication Errors
Number of opioid-related medication errors reported in Pennsylvania by AHRQ eventharm category and age 2006 2008 2010 2012 2014
30 53 44 27 23
2947 2798 2714 27082408
9531014
984 969
910
175 245251 398
330
0
500
1000
1500
2000
2500
3000
3500
4000
4500
2006 2008 2010 2012 2014
Nu
mb
er o
f Ev
ents
Unsafe Condition Near Miss
Patient Event No Harm Patient Event Harm
Source Institute of Safe Medication Practices on behalf of the Pennsylvania Patient Safety Authority 2006-2014
Note Pennsylvania Patient Safety Reporting System reports of medication errors are from acute-level facilities that consist of hospitals
ambulatory surgical facilities birthing centers and abortion facilities Medication errors do not include adverse drug reactions Eventharm
categories refer to those in the Agency for Healthcare Research and Quality Common Formats Unsafe condition is defined as any
circumstance that increases the probability of a patient safety event A near miss is defined as a patient safety event that did not reach the
patient Deaths are included in the total but not shown on the chart because there were too few to render graphically
192 166 336530 662
2287 24842385
2364 1955
16271461 1272
1208
1055
0
500
1000
1500
2000
2500
3000
3500
4000
4500
2006 2008 2010 2012 2014
Nu
mb
er o
f Ev
en
ts
lt18 18-64 65+
Number of opioid-related medication errors reported in Pennsylvania by AHRQ eventharm category and age 2006 2008 2010 2012 2014
30 53 44 27 23
2947 2798 2714 27082408
9531014
984 969
910
175 245251 398
330
0
500
1000
1500
2000
2500
3000
3500
4000
4500
2006 2008 2010 2012 2014
Nu
mb
er o
f Ev
ents
Unsafe Condition Near Miss
Patient Event No Harm Patient Event Harm
Source Institute of Safe Medication Practices on behalf of the Pennsylvania Patient Safety Authority 2006-2014
Note Pennsylvania Patient Safety Reporting System reports of medication errors are from acute-level facilities that consist of hospitals
ambulatory surgical facilities birthing centers and abortion facilities Medication errors do not include adverse drug reac tions Eventharm
categories refer to those in the Agency for Healthcare Research and Quality Common Formats Unsafe condition is defined as any
circumstance that increases the probability of a patient safety event A near miss is defined as a patient safety event that did not reach the
patient Deaths are included in the total but not shown on the chart because there were too few to render graphically
192 166 336530 662
2287 24842385
2364 1955
16271461 1272
1208
1055
0
500
1000
1500
2000
2500
3000
3500
4000
4500
2006 2008 2010 2012 2014
Nu
mb
er o
f Ev
ents
lt18 18-64 65+
Importance Acute malignant andmdashincreasinglymdashchronic pain often is treated or managed
with prescription opioids Reducing patient harm from the use of opioids in both inpatient
and outpatient settings is a main area of focus because opioid-related adverse drug events are
often preventable
Trends
In Pennsylvania the total number of medication error reports related to opioids decreased
106 between 2006 (4106) and 2014 (3672)
Between 24 and 54 opioid-related medication errors resulting in patient harm or death
were reported from 2006 through 2014 accounting for approximately 1 of all reported
opioid medication errors each year
The largest share of opioid-related medication errors reported each year in Pennsylvania
related to those that reached the patient but did not result in harm Of these no-harm
events reaching the patient about one in four required monitoring andor intervention to
preclude the harm
National Healthcare Quality and Disparities Report | 19
Patient Safety
20 | National Healthcare Quality and Disparities Report
Although small in number reports of unsafe conditions increased from 43 (175) of
total opioid-related medication error reports in 2006 to 9 (330) in 2014 Reports of
unsafe conditions and near misses can provide important learning opportunities for
preventing patient harm
Differences Between Groups Reports of opioid-related medication errors involving
pediatric patients increased nearly fourfold from 192 (47) in 2006 to 662 (18) in 2014
During the same period reports of opioid-related medication errors involving older adult
patients decreased from nearly 40 of the total to less than 30
Patient Safety in the Nursing Home Setting
More than 3 million people receive care in US nursing homes and skilled nursing facilities
each year (CDC 2015)
For nursing home residents optimal care seeks to maximize quality of life and minimize
unintended complications
Measures tracked for patients of various age ranges include
Nursing home residents with urinary tract infections
Nursing home residents experiencing use of restraints
Nursing home residents who have pressure ulcers
Nursing home residents who had a fall with major injury
Nursing home residents who received antipsychotic medication
Urinary Tract Infections
Long-stay nursing home residents experiencing urinary tract infections by sex and raceethnicity 2011-2013
Source Centers for Medicare amp Medicaid Services Minimum Data Set 2011-2013
DenominatorNursing home residents of any age w ho have at least 101 cumulative days in the facility
Note For this measure low er percentages are better The measure w as calculated as follows Percentage of long-stay residents with a urinary
tract infection w ithin the 30 days prior to assessment White Black and Asian are non-Hispanic Hispanic includes all races
0
2
4
6
8
10
2011 2012 2013
Pe
rce
nt
Total Male Female
2011 Achievable
Benchmark 61
0
2
4
6
8
10
2011 2012 2013
Pe
rce
nt
White Black Asian Hispanic
2011 Achievable
Benchmark 61
Long-stay nursing home residents experiencing urinary tract infections by sex and raceethnicity 2011-2013
Source Centers for Medicare amp Medicaid Services Minimum Data Set 2011-2013
DenominatorNursing home residents of any age w ho have at least 101 cumulative days in the facilityNote For this measure low er percentages are better The measure w as calculated as follows Percentage of long-stay residents with a urinary
tract infection w ithin the 30 days prior to assessment White Black and Asian are non-Hispanic Hispanic includes all races
0
2
4
6
8
10
2011 2012 2013
Pe
rce
nt
Total Male Female
2011 Achievable
Benchmark 61
0
2
4
6
8
10
2011 2012 2013
Pe
rce
nt
White Black Asian Hispanic
2011 Achievable
Benchmark 61
Patient Safety
Importance Bacteria that cause urinary tract infections (UTIs) can spread to other body
parts and become more serious or contribute to further complications such as delirium
Overall Percentage In 2013 the percentage of long-stay nursing home residents with a UTI
was 64
Groups With Disparities
In 2013 compared with males (51) the percentage with UTIs was worse for females
(7)
In 2013 compared with White residents (68) the percentage of residents with UTIs
was lower for Blacks and Asians (47) as well as Hispanics (54)
Achievable Benchmark
In 2011 the top 5 State achievable benchmark for UTIs was 61 The States that
contributed to the achievable benchmark are Connecticut Hawaii Minnesota North
Dakota and Pennsylvania
Males Blacks Asians and Hispanics have achieved the benchmark
Use of Restraints
00
05
10
15
20
25
30
35
40
2011 2012 2013
Pe
rce
nt
White Black Asian Hispanic
00
05
10
15
20
25
30
35
40
2011 2012 2013
Pe
rce
nt
Total 0-64 65-74 75-84 85+
2011 Achievable
Benchmark 07
Long-stay nursing home residents experiencing use of restraints by age and raceethnicity 2011-2013
Source Centers for Medicare amp Medicaid Services Minimum Data Set 2011-2013
Denominator Nursing home residents of any age who have at least 101 cumulative days in the facility
Note For this measure lower percentages are better The measure was calculated as follows Percentage of long-stay residents who are
physically restrained on a daily basis
2011 Achievable
Benchmark 07
00
05
10
15
20
25
30
35
40
2011 2012 2013
Pe
rce
nt
White Black Asian Hispanic
00
05
10
15
20
25
30
35
40
2011 2012 2013
Pe
rce
nt
Total 0-64 65-74 75-84 85+
2011 Achievable
Benchmark 07
Long-stay nursing home residents experiencing use of restraints by age and raceethnicity 2011-2013
Source Centers for Medicare amp Medicaid Services Minimum Data Set 2011-2013
Denominator Nursing home residents of any age who have at least 101 cumulative days in the facility
Note For this measure lower percentages are better The measure was calculated as follows Percentage of long-stay residents who are
physically restrained on a daily basis
2011 Achievable
Benchmark 07
National Healthcare Quality and Disparities Report | 21
Patient Safety
Importance Residents who are restrained daily can become weak lose their ability to go to
the bathroom by themselves and develop pressure ulcers or other medical conditions
Overall Percentage In 2013 the percentage of long-stay nursing home residents who were
physically restrained on a daily basis was 14
Groups With Disparities
In 2011 2012 and 2013 the percentage of residents with restraint use on a daily basis
was lower for those ages 65-74 years compared with those under age 65 In 2013 the
percentage of residents ages 65-74 years experiencing use of restraints was 12
compared with 16 for residents younger than 65
In 2013 compared with Whites (14) Asians (2) and Hispanics (18) had worse
percentages of daily restraint use and Blacks (12) had a better percentage of daily
restraint use
Achievable Benchmark
In 2011 the top 5 State achievable benchmark for restraint use was 07 The States that
contributed to the achievable benchmark are Kansas Maine Nebraska New Hampshire
and Vermont
No group achieved the benchmark from 2011 to 2013
Pressure Ulcers
Low-risk short-stay and high-risk long-stay nursing home residents who have pressure ulcers by sex 2011-2013
Source Centers for Medicare amp Medicaid Services Minimum Data Set 2011-2013
Denominator Low-risk short-stay Nursing home residents of any age who have 100 or fewer cumulative days in the facility and are active can
change positions and are getting the nutrients they need to maintain good skin health High-risk long-stay Nursing home residents of any age
who have at least 101 cumulative days in the facility and are in a coma do not get the nutrients needed to maintain good skin health or cannot
change position on their own
Note For this measure lower percentages are better
0
2
4
6
8
10
12
2011 2012 2013
Pe
rce
nt
Low-Risk Short StayTotal Male Female
2011 Achievable Benchmark10
0
2
4
6
8
10
12
2011 2012 2013
Pe
rce
nt
High-Risk Long StayTotal Male Female
2008 Achievable Benchmark 71
Low-risk short-stay and high-risk long-stay nursing home residents who have pressure ulcers by sex 2011-2013
Source Centers for Medicare amp Medicaid Services Minimum Data Set 2011-2013
Denominator Low-risk short-stay Nursing home residents of any age who have 100 or fewer cumulative days in the facility and are active can
change positions and are getting the nutrients they need to maintain good skin health High-risk long-stay Nursing home residents of any age
who have at least 101 cumulative days in the facility and are in a coma do not get the nutrients needed to maintain good skin health or cannot
change position on their own
Note For this measure lower percentages are better
0
2
4
6
8
10
12
2011 2012 2013
Pe
rce
nt
Low-Risk Short StayTotal Male Female
2011 Achievable Benchmark10
0
2
4
6
8
10
12
2011 2012 2013
Pe
rce
nt
High-Risk Long StayTotal Male Female
2008 Achievable Benchmark 71
22 | National Healthcare Quality and Disparities Report
Patient Safety
Importance Pressure ulcers are serious medical conditions They typically result from
prolonged periods of uninterrupted pressure on the skin soft tissue muscle and bone
Vulnerable patients include older adults stroke and diabetic patients patients with dementia
circulatory diseases dehydration and malnutrition and people who use wheelchairs or are
bedriddenmdashthat is any patient with impaired mobility or sensation
Overall Percentage In 2013 the percentage of low-risk short-stay residents with pressure
ulcers was 13 and the percentage of high-risk long-stay residents with pressure ulcers was
77
Groups with Disparities
As in 2011 and 2012 male low-risk short-stay nursing home residents had a worse
percentage with pressure ulcers (15) compared with female residents (12) in 2013
As in 2011 and 2012 male high-risk long-stay nursing home residents had a worse
percentage with pressure ulcers (94) compared with female residents (70) in 2013
Achievable Benchmark
The 2011 top 5 State achievable benchmark for low-risk short-stay nursing home residents was 10 The States that contributed to the benchmark were Alabama Arizona Colorado Connecticut and Idaho
The 2008 top 5 State achievable benchmark for high-risk long-stay nursing home residents was 71 The States that contributed to the benchmark were Hawaii Minnesota Nebraska New Hampshire and North Dakota
No low-risk short-stay residents achieved the benchmark from 2011 to 2013 Among
high-risk long-stay residents only females achieved the benchmark by 2013
National Healthcare Quality and Disparities Report | 23
Patient Safety
Falls
00
05
10
15
20
25
30
35
40
45
50
Pe
rce
nt
2012 2013
Long-stay nursing home residents who had a fall with major injury by sex age and raceethnicity 2012-2013
Source Centers for Medicare amp Medicaid Services Minimum Data Set 2012-2013
Denominator Nursing home residents of any age who have at least 101 cumulative days in the facility with one or more look-back scan
assessments except when the occurrence of falls or number of falls with major injury was not assessed in the look-back scan assessment
Note For this measure lower percentages are better White Black and Other are non-Hispanic Hispanic includes all races
2012 Achievable
Benchmark 22
00
05
10
15
20
25
30
35
40
45
50
Pe
rce
nt
2012 2013
Long-stay nursing home residents who had a fall with major injury by sex age and raceethnicity 2012-2013
Source Centers for Medicare amp Medicaid Services Minimum Data Set 2012-2013
Denominator Nursing home residents of any age who have at least 101 cumulative days in the facility with one or more look-back scan
assessments except when the occurrence of falls or number of falls with major injury was not assessed in the look-back scan assessment
Note For this measure lower percentages are better White Black and Other are non-Hispanic Hispanic includes all races
2012 Achievable
Benchmark 22
Importance Nursing home residents who experience falls resulting in major injuries are at
higher risk of death and disability as well as emotional trauma that can affect functional
abilities and social well-being
Overall Percentage In 2013 the percentage of long-stay nursing home residents who had a
fall with a major injury was 34
Groups With Disparities
In 2013 female nursing home residents had a worse percentage of falls (38) compared
with male residents (25)
In 2013 the percentage of falls with major injury was worse for all subgroups of
residents age 65 years and over compared with their younger counterparts The
percentage for residents under 65 years old was 17 compared with 26 for ages 65shy
74 years 34 for ages 75-84 years and 41 for 85 years and over
Also in 2013 compared with Whites (38) the percentage of falls with major injury
was better for Black (13) Other (22) and Hispanic (24) residents
24 | National Healthcare Quality and Disparities Report
Patient Safety
National Healthcare Quality and Disparities Report | 25
Achievable Benchmark
The 2012 top 5 State achievable benchmark for falls with major injury was 22 The
States that contributed to the achievable benchmark are Alaska California District of
Columbia Hawaii and New Jersey The benchmark was achieved by Black residents and those ages 0-64 years
Antipsychotic Medication Among Nursing Home Residents
Importance The high use of antipsychotic medications among nursing home residents for
indications other than those for which the drug was approved has been noted by the Federal
Government These drugs are often used for too long at too high a dose or when
unnecessary In the past inappropriate prescribing of antipsychotics in nursing homes has
primarily been considered a marker of suboptimal care Recent studies have shown
antipsychotic use is also a drug safety issue (Huybrechts et al 2012) Antipsychotic
medication use is associated with increased risks of adverse events such as movement
disorders falls hip fractures and cerebrovascular events Their use in older adults with
dementia carries an increased risk of death Safety concerns with antipsychotic medication
use in older adults also include the risks of hyperprolactinemia pneumonia
0
5
10
15
20
25
30
Percent
2012 2013
Adult long-stay nursing home residents who received antipsychotic medication by raceethnicity and number of chronic conditions 2012-2013
Key NHOPI = Native Hawaiian or Other Pacific Islander AIAN = American Indian or Alaska Native
Source Centers for Medicare amp Medicaid Services Minimum Data Set 2012-2013
Denominator Nursing home residents of any age who have at least 101 cumulative days in the facility excluding residents with schizophrenia
Tourettersquos syndrome and Huntingtonrsquos disease
Numerator Subset of denominator that receives an antipsychotic medication
Note For this measure lower percentages are better
2012 Achievable
Benchmark 150
0
5
10
15
20
25
30
Percent
2012 2013
Adult long-stay nursing home residents who received antipsychotic medication by raceethnicity and number of chronic conditions 2012-2013
Key NHOPI = Native Hawaiian or Other Pacific Islander AIAN = American Indian or Alaska Native
Source Centers for Medicare amp Medicaid Services Minimum Data Set 2012-2013
Denominator Nursing home residents of any age who have at least 101 cumulative days in the facility excluding residents with schizophrenia
Tourettersquos syndrome and Huntingtonrsquos disease
Numerator Subset of denominator that receives an antipsychotic medication
Note For this measure lower percentages are better
2012 Achievable
Benchmark 150
Patient Safety
26 | National Healthcare Quality and Disparities Report
thromboembolism cerebrovascular events and other cardiovascular adverse events (Chiu et
al 2015)
Overall Percentage The percentage of long-stay nursing home residents who had
antipsychotic medications was 176 in 2013
Groups With Disparities
In 2013 the percentage of residents receiving antipsychotic medication was higher for
Hispanic residents (201) than for White residents (180)
In 2012 and 2013 the percentage of long-stay residents who received antipsychotic
medications was worse for residents with one or more chronic conditions than for
residents with no chronic conditions
Achievable Benchmark
The 2012 top 6 State achievable benchmark was 150 The States that contributed to the
achievable benchmark are Alaska California Hawaii Michigan New Jersey and
Wyoming Asians NHOPIs residents with no chronic conditions and residents with one chronic
condition achieved the benchmark
Antipsychotic Medication Among Nursing Home Residents by State
Long-stay nursing home residents who received antipsychotic medication by State 2013
Source Centers for Medicare amp Medicaid Services Minimum Data Set 2013
Denominator Nursing home residents of any age who have at least 101 cumulative days in the facility
Note For this measure lower percentages are better
AZ
CA
UT
CT
FL
GA
IA
IL
KS
MA
MDMO
NJ
NY
OR
PA
SC
TN
CO
WA
WI
VA
ME
MN
MI
NC
TX
KY
WV
RI
NE
VT
NV OH
SD
AR
IN
NH
MT
ID
WY
ND
NMOK
LA
MS AL
DE
AKAK
HI
DC
85-153 (1st Quartile)
154-173 (2nd Quartile)
No Data
174-192 (3rd Quartile)
PR193-234 (4th Quartile)
Long-stay nursing home residents who received antipsychotic medication by State 2013
Source Centers for Medicare amp Medicaid Services Minimum Data Set 2013
Denominator Nursing home residents of any age who have at least 101 cumulative days in the facility
Note For this measure lower percentages are better
AZ
CA
UT
CT
FL
GA
IA
IL
KS
MA
MDMO
NJ
NY
OR
PA
SC
TN
CO
WA
WI
VA
ME
MN
MI
NC
TX
KY
WV
RI
NE
VT
NV OH
SD
AR
IN
NH
MT
ID
WY
ND
NMOK
LA
MS AL
DE
AKAK
HI
DC
85-153 (1st Quartile)
154-173 (2nd Quartile)
No Data
174-192 (3rd Quartile)
PR193-234 (4th Quartile)
Patient Safety
Overall This map shows overall rankings of States (by quartiles) in the percentage of long-
stay nursing home residents who received antipsychotic medication in 2013 Values ranged
from 85 to 234
Differences by State Interquartile ranges follow
First quartile (lowest) 85-153 (AK CA DC DE HI MD MI MN NJ NC SC
WI WV)
Second quartile (second lowest) 153 -173 (CO ID MT NM NY ND OR PA
RI SD VT WA WY)
Third quartile (second highest) 174-192 (AZ CT GA IN IA KS ME MA MO
NV OH OK VA)
Fourth quartile (highest) 193-234 (AL AR FL IL KY LA MS NE NH TN
TX UT)
Eight of the 12 States in the quartile with the highest percentage of long-stay nursing
home residents who received antipsychotic medication were in the South
Patient Safety in the Home Health Setting
Home health agencies provide services to beneficiaries who are homebound and need skilled
nursing care or therapy
Approximately 12 million individuals receive home health care from more than 33000
providers for causes including acute illness long-term health conditions permanent
disability or terminal illness (NAHCH 2010)
Improvements among home health patients can reflect the quality of care from home health
agencies
Measures include
Home health patients with improvement in surgical wounds
Home health patients with improvements in their ability to take medications orally
National Healthcare Quality and Disparities Report | 27
Patient Safety
Improvement in Surgical Wounds
75
80
85
90
95
100
2010 2011 2012 2013
Pe
rce
nt
White Black Asian Hispanic
75
80
85
90
95
100
2010 2011 2012 2013
Pe
rce
nt
Total 0-64 65-74
75-84 85+
2011 Achievable
Benchmark 913
Home health patients with improvement in surgical wounds by age and raceethnicity 2010-2013
Source Centers for Medicare amp Medicaid Services Outcome and Assessment Information Set 2010-2013
Denominator Number of home health episodes during the measurement period in which the patient of any age had a surgical wound and the
episode ended with the patient discharged from home health care
Note White Black and Asian are non-Hispanic Hispanic includes all races
2011 Achievable
Benchmark 913
75
80
85
90
95
100
2010 2011 2012 2013
Per
cen
t
White Black Asian Hispanic
75
80
85
90
95
100
2010 2011 2012 2013
Per
cen
t
Total 0-64 65-74
75-84 85+
2011 Achievable
Benchmark 913
Home health patients with improvement in surgical wounds by age and raceethnicity 2010-2013
Source Centers for Medicare amp Medicaid Services Outcome and Assessment Information Set 2010-2013
Denominator Number of home health episodes during the measurement period in which the patient of any age had a surgical wound and the
episode ended with the patient discharged from home health care
Note White Black and Asian are non-Hispanic Hispanic includes all races
2011 Achievable
Benchmark 913
Importance Normal wound healing after an operation is an important marker of good care
The home health team should regularly change wound dressing and teach the patient about
wound care
Overall Percentage In 2013 the percentage of home health patients with improvement in
their surgical wounds was 890
Trends The percentage of health home patients with surgical wound improvement increased
between 2010 and 2013
Groups With Disparities
In 2013 compared with residents under age 65 years (856) all other age groups had
better percentages of improvement in surgical wounds The percentage was 893 for
ages 65-74 905 for ages 75-84 and 917 for ages 85 and over
In 2013 compared with Whites (893) Blacks (878) Asians (882) and Hispanics
(874) had worse percentages of improvement in surgical wounds
The 2010 through 2013 trend in the percent of home health patients with surgical wound
improvement did not change for those over age 65 relative to persons under age 65 years
28 | National Healthcare Quality and Disparities Report
Patient Safety
Achievable Benchmark
The 2011 top 5 State achievable benchmark was 913 The States that contributed to the
benchmark are Alabama Mississippi Nevada Oklahoma and South Carolina
Home health patients age 85 years and over achieved the benchmark for surgical wound
improvement in 2013
At the current rate of progress patients ages 75-84 years could reach the benchmark
within a year Patients ages 65-74 years could achieve the benchmark in approximately 2
years
White home health patients could achieve the benchmark in approximately 2 years
Improvement in Ability To Take Medication Orally
0
20
40
60
80
100
2010 2011 2012 2013
Per
cen
t
White Black Asian Hispanic
0
20
40
60
80
100
2010 2011 2012 2013
Per
cen
t
Total 0-64 65-74
75-84 85+
2008 Achievable
Benchmark 516
Home health patients with improvement in their ability to take medications orally by age and raceethnicity 2010-2013
Source Centers for Medicare amp Medicaid Services Outcome and Assessment Information Set 2010-2013
Denominator Number of home health care episodes in which a patient of any age was unable to take oral medications independently at the
start of the episode that ended during the measurement period
Note White Black and Asian are non-Hispanic Hispanic includes all races
2008 Achievable
Benchmark 516
0
20
40
60
80
100
2010 2011 2012 2013
Per
cen
t
White Black Asian Hispanic
0
20
40
60
80
100
2010 2011 2012 2013
Per
cen
t
Total 0-64 65-74
75-84 85+
2008 Achievable
Benchmark 516
Home health patients with improvement in their ability to take medications orally by age and raceethnicity 2010-2013
Source Centers for Medicare amp Medicaid Services Outcome and Assessment Information Set 2010-2013
Denominator Number of home health care episodes in which a patient of any age was unable to take oral medications independently at the
start of the episode that ended during the measurement period
Note White Black and Asian are non-Hispanic Hispanic includes all races
2008 Achievable
Benchmark 516
Importance Taking medications correctly is important to the health status and quality of life
of individuals living in the community The home health team can help teach a patient ways
to organize drugs and take them properly
Overall Percentage In 2013 the percentage of home health patients with improvement in
their ability to take medications orally was 513
Trends Between 2010 and 2013 there was improvement in the overall percentage of home
health patients with improved ability to take medications orally
National Healthcare Quality and Disparities Report | 29
Patient Safety
Groups With Disparities
In 2013 the percentage of home health patients with improvement in their ability to take
medications orally was worse for those age 85 years and over (398) compared with
those under age 65 years (577)
The percentage of patients with improvement in their ability to take medications orally
was worse among Hispanic home health patients (400) than among White patients
(526) in 2013
From 2010 to 2013 the gap between Blacks and Whites decreased and the gap between
Asians and Whites and Hispanics and Whites increased
Achievable Benchmark
The 2008 top 5 State achievable benchmark was 516 The States that contributed to the
achievable benchmark are Iowa Massachusetts New Jersey North Dakota and South
Carolina
The benchmark was achieved among age groups under 85 years and by White and Black
home health patients
The total population is estimated to reach the benchmark in less than a year Hispanic
patients and patients age 85 years and over are farthest from the benchmark
Improvement in Ability To Take Medication Orally by State
Home health patients with improvement in their ability to take medications orally by raceethnicity by State 2013
Source Centers for Medicare amp Medicaid Services Outcome and Assessment Information Set 2013
Denominator Number of home health care episodes in which a patient of any age was unable to take oral medications independently at the
start of the episode that ended during the measurement period
AZ
CA
UT
CT
FL
GA
IA
IL
KS
MA
MDMO
NJ
NY
OR
PA
SC
TN
CO
WA
WI
VA
ME
MN
MI
NC
TX
KY
WV
RI
NE
VT
NV OH
SD
AR
IN
NH
MT
ID
WY
ND
NMOK
LA
MS AL
DE
AKAK
HI
No significant difference between rates
of Hispanics and non-Hispanic Whites
Non-Hispanic Whites have significantly
worse rate than Hispanics
States do not have data that meet the
criteria for statistical reliability data
quality or confidentiality
Hispanics have significantly worse rate
than non-Hispanic Whites
DC
Home health patients with improvement in their ability to take medications orally by raceethnicity by State 2013
Source Centers for Medicare amp Medicaid Services Outcome and Assessment Information Set 2013
Denominator Number of home health care episodes in which a patient of any age was unable to take oral medications independently at the
start of the episode that ended during the measurement period
AZ
CA
UT
CT
FL
GA
IA
IL
KS
MA
MDMO
NJ
NY
OR
PA
SC
TN
CO
WA
WI
VA
ME
MN
MI
NC
TX
KY
WV
RI
NE
VT
NV OH
SD
AR
IN
NH
MT
ID
WY
ND
NMOK
LA
MS AL
DE
AKAK
HI
No significant difference between rates
of Hispanics and non-Hispanic Whites
Non-Hispanic Whites have significantly
worse rate than Hispanics
States do not have data that meet the
criteria for statistical reliability data
quality or confidentiality
Hispanics have significantly worse rate
than non-Hispanic Whites
DC
30 | National Healthcare Quality and Disparities Report
Patient Safety
Geographic Variation
In 2013 Hispanic home health patients had worse rates of improvement in taking oral
medications than non-Hispanic White patients in 11 States (Arizona California
Connecticut Florida Illinois Indiana Massachusetts Nevada New York North
Carolina and Texas
Non-Hispanic White patients had worse rates of improvement than Hispanic patients in
five States (Hawaii Idaho Iowa Michigan and Pennsylvania)
Patient Safety in the Ambulatory Setting
Although patient safety initiatives frequently focus on inpatient hospital events adverse
effects of medical care may be identified and treated in outpatient settings
Adverse effects of medical care can follow care or procedures in hospitals emergency
departments physician offices or other settings
Measures include
Patient safety and quality issues by frequency of occurrence in outpatient medical offices
Adults age 65 years and over who received potentially inappropriate prescription medications during the calendar year
Percentage of hemodialysis patients with vascular catheter in use for 90 days or longer
For more information see the PSNet link to Patient Safety Primer Patient Safety in
Ambulatory Care httpspsnetahrqgovprimersprimer16patient-safety-in-ambulatory-care
National Healthcare Quality and Disparities Report | 31
Patient Safety
Patient Safety and Quality Issues
Patient safety and quality issues by frequency of occurrence in outpatient medical offices 2014
Source Westat analysis of the AHRQ 2014 Medical Office Survey on Patient Safety Culture Comparative Database (N=935)
Note For this measure less frequent occurrences during the year are better
0
20
40
60
80
100
A pharmacy contactedour office to clarify orcorrect a prescription
A patient was unableto get an appointmentwithin 48 hours for anacuteserious problem
A patients medicationlist was not updatedduring his or her visit
The results from a labor imaging test were notavailable when needed
A patients chartmedicalrecord was not available
when needed
Occurred DailyWeekly
Occurred Monthly
Occurred Not at All to Several Times Over the Past Year
Patient safety and quality issues by frequency of occurrence in outpatient medical offices 2014
Source Westat analysis of the AHRQ 2014 Medical Office Survey on Patient Safety Culture Comparative Database (N=935)
Note For this measure less frequent occurrences during the year are better
0
20
40
60
80
100
A pharmacy contactedour office to clarify orcorrect a prescription
A patient was unableto get an appointmentwithin 48 hours for anacuteserious problem
A patients medicationlist was not updatedduring his or her visit
The results from a labor imaging test were notavailable when needed
A patients chartmedicalrecord was not available
when needed
Occurred DailyWeekly
Occurred Monthly
Occurred Not at All to Several Times Over the Past Year
Importance Most health care takes place in the outpatient or ambulatory care setting Lack
of access to care and lack of access to timely and accurate medical information and test
results may contribute to patient safety events such as missed or delayed diagnoses
medication errors failure to order appropriate diagnostic or laboratory tests incorrect
interpretation of tests and inadequate followup on results
Overall Percentage
Almost 30 of medical offices participating in the survey reported daily or weekly
occurrences of being contacted by the pharmacist for clarification or correction on a
prescription
After prescription clarifications or corrections by the pharmacy medical offices were
next most likely to report daily or weekly issues with patients being unable to get an
appointment within 48 hours for an acute or serious problem (14) or the patientrsquos
medication list not getting updated during their visit (11)
The share of medical offices reporting that lab or imaging tests were not available when
needed reached nearly 20 when considering monthly occurrences as well as those that
occurred more frequently
32 | National Healthcare Quality and Disparities Report
Patient Safety
Potentially Inappropriate Prescriptions for Older Adults
Adults age 65 years and over who received potentially inappropriate prescription medications during the calendar year by sex and
perceived health status 2003ndash2013
Source Agency for Healthcare Research and Quality Medical Expenditure Panel Survey 2003-2013
Note For this measure lower percentages are better Prescription medications received include all prescribed medications initiall y purchased
or otherwise obtained as well as any refills For more information on inappropriate medications see the American Geriatrics Society 2012 Beers
Criteria Update Expert Panel American Geriatrics Society updated Beers Criteria for potentially inappropriate medication use in older adults J
Am Geriatr Soc 2012 Apr60(4)616-31
0
5
10
15
20
25
30
Per
cen
t
Total Male Female
0
5
10
15
20
25
30
Per
cen
t
ExcellentVery GoodGood FairPoor
Adults age 65 years and over who received potentially inappropriate prescription medications during the calendar year by sex and
perceived health status 2003ndash2013
Source Agency for Healthcare Research and Quality Medical Expenditure Panel Survey 2003-2013
Note For this measure lower percentages are better Prescription medications received include all prescribed medications initially purchased
or otherwise obtained as well as any refills For more information on inappropriate medications see the American Geriatrics Society 2012 Beers
Criteria Update Expert Panel American Geriatrics Society updated Beers Criteria for potentially inappropriate medication use in older adults J
Am Geriatr Soc 2012 Apr60(4)616-31
0
5
10
15
20
25
30
Per
cen
t
Total Male Female
0
5
10
15
20
25
30
Per
cen
t
ExcellentVery GoodGood FairPoor
Importance Some drugs that are prescribed for older patients are known to be potentially
harmful for this age group
Overall Percentage In 2013 the percentage of adults age 65 years and over who received
potentially inappropriate prescription medications was 114
Trends From 2003 to 2013 the percentage of adults age 65 years and over who received
potentially inappropriate prescription medications improved overall for both sexes and for
people with excellentvery goodgood health status and people with fairpoor health status
Groups With Disparities
In all years the percentage of patients receiving potentially inappropriate medications
was higher among females compared with males This gap was not changing over time
In all years from 2003 to 2013 the percentage of patients receiving potentially
inappropriate medications was higher among people with fairpoor health status
compared with people with excellentgood health status This gap was not changing over
time
National Healthcare Quality and Disparities Report | 33
Patient Safety
Long-Term Catheter Use in Dialysis Patients
HI
AKAK
AZ
CA
UT
CT
FL
GA
IA
IL
KS
MA
MDMO
NJ
NY
OR
PA
SC
TN
CO
WA
WI
VA
ME
MN
MI
NC
TX
KY
WV
RI
NE
VT
NV OH
SD
AR
IN
NH
MT
ID
WY
ND
NMOK
LA
MSAL
DE
DC
10-12
13-18
7-9
PR
Source Centers for Medicare and Medicaid Services Dialysis Facility Compare 2014
Denominator At-risk adult Medicare patients with a central venous catheter who were receiving regular hemodialysis treatments at dialysis
facilities
Note For this measure lower percentages are better
Percentage of hemodialysis patients with central venous catheters used for vascular access for 90 days or longer by State 2014
HI
AKAK
AZ
CA
UT
CT
FL
GA
IA
IL
KS
MA
MDMO
NJ
NY
OR
PA
SC
TN
CO
WA
WI
VA
ME
MN
MI
NC
TX
KY
WV
RI
NE
VT
NV OH
SD
AR
IN
NH
MT
ID
WY
ND
NMOK
LA
MSAL
DE
DC
10-12
13-18
7-9
PR
Source Centers for Medicare and Medicaid Services Dialysis Facility Compare 2014
Denominator At-risk adult Medicare patients with a central venous catheter who were receiving regular hemodialysis treatments at dialysis
facilities
Note For this measure lower percentages are better
Percentage of hemodialysis patients with central venous catheters used for vascular access for 90 days or longer by State 2014
Importance Central venous catheters are frequently used for vascular access to dialysis
patients until a fistula or graft is formed Central venous catheters have higher rates of
infection and adverse events among patients receiving dialysis treatment compared with
other forms of vascular access To decrease the likelihood of adverse events catheters should
be used for less than 90 days
Overall Percentage Nationally an average of 10 of dialysis patients used central venous
catheters for 90 days or longer in 2014
Geographic Variation In 2014 Alabama and Kansas had the lowest percentages of dialysis
patients using central venous catheters for 90 days or longer (7) and Puerto Rico had the
highest percentage (18) of long-term catheter use
Patient Safety Infrastructure
Efforts to improve patient safety have been accompanied by various infrastructure
enhancements
Growth in patient safety organizations which assist providers in detecting and reducing
risks and hazards from care delivery that may lead to patient harm
System improvement initiatives at the Veterans Health Administration (VHA)
34 | National Healthcare Quality and Disparities Report
Patient Safety
Development of the National Practitioner Data Bank a clearinghouse for information on
medical malpractice payments
Patient Safety Organizations
Patient safety organizations (PSOs) aim to reduce preventable adverse events near misses
and unsafe conditions in all health care settings
PSOs provide an environment for health care providers to voluntarily report discuss and
learn from patient safety events and quality analyses on a privileged and confidential basis
Measures include
Number of PSOs serving each State
Variation in concentrations of compounded liquid medications for children
Patient Safety Organizations AHRQ Common Formats
AHRQ Common Formats provide a standardized method for PSOs health care providers
and other organizations to collect and report patient safety events
Data element standards are important for aggregating and analyzing events across
providers
AHRQ Common Formats have been developed for a variety of settings of care
Acute care hospitals
Skilled nursing facilities
Retail pharmacy
More information is available at httpspsoahrqgovcommon
National Healthcare Quality and Disparities Report | 35
Patient Safety
Number of Patient Safety Organizations
AZ (2)
CA (3)
UT (2)
CT(3)
FL (8)
GA (5)
IA (4)
IL (7)
KS (5)
MA(3)
MD (4)MO(2)
NJ(3)
NY (5)
OR (3)
PA (5)
SC (4)
TN (5)
CO (2)
WA (2)
WI (5)
VA (7)
ME(2)
MN(3)
MI (3)
NC (7)
TX (6)
KY (4)WV (3)
RI(2)
NE (2)
VT(2)
NV (2)
OH (2)
SD (1)
AR (4)
IN (2)
NH(2)
MT (2)
ID (3)
WY (2)
ND (1)
NM (3)OK (2)
LA (1)
MS (2)
AL (2)
DE(2)
HI (2)
AKAK (2)
DC(3)
PR (0)
1-2
3-4
5-6
7-8
Number of PSOs
excluding PSOs
operating nationally
Number of Patient Safety Organizations by area served 2014
Source Agency for Healthcare Research and Quality Patient Safety Organization Information Form Calendar Year 2014 and PSO-PPC
Contact Database
Note PSOs included in this map were AHRQ-listed during any part of 2014 and submitted the PSO Profile to the PSO Privacy Protection
Center (PSO-PPC) in early 2015 A PSO may have members in one or more States regardless of headquarters location Each State shows the
number of PSOs that serve that State map excludes 38 PSOs that are available to providers in all States
AZ (2)
CA (3)
UT (2)
CT(3)
FL (8)
GA (5)
IA (4)
IL (7)
KS (5)
MA(3)
MD (4)MO(2)
NJ(3)
NY (5)
OR (3)
PA (5)
SC (4)
TN (5)
CO (2)
WA (2)
WI (5)
VA (7)
ME(2)
MN(3)
MI (3)
NC (7)
TX (6)
KY (4)WV (3)
RI(2)
NE (2)
VT(2)
NV (2)
OH (2)
SD (1)
AR (4)
IN (2)
NH(2)
MT (2)
ID (3)
WY (2)
ND (1)
NM (3)OK (2)
LA (1)
MS (2)
AL (2)
DE(2)
HI (2)
AKAK (2)
DC(3)
PR (0)
1-2
3-4
5-6
7-8
Number of PSOs
excluding PSOs
operating nationally
Number of Patient Safety Organizations by area served 2014
Source Agency for Healthcare Research and Quality Patient Safety Organization Information Form Calendar Year 2014 and PSO-PPC
Contact Database
Note PSOs included in this map were AHRQ-listed during any part of 2014 and submitted the PSO Profile to the PSO Privacy Protection
Center (PSO-PPC) in early 2015 A PSO may have members in one or more States regardless of headquarters location Each State shows the
number of PSOs that serve that State map excludes 38 PSOs that are available to providers in all States
Importance All patient safety organizations (PSOs) have authority to operate in all 50
States and US territories but not all do In 2014 38 PSOs self-reported being available to
providers nationally PSOs not available nationally serve specific States
Geographic Variation
Nearly all States have at least 2 PSOs available to providers in their State in addition to
the 38 national PSOs that serve all States
Florida has the most PSOs available with 8 in addition to the 38 nationally available
PSOs The States with the largest number of PSOs available are generally on the East
Coast (eg North Carolina Virginia New York Pennsylvania Tennessee Georgia) or
have large populations (eg Texas Illinois)
North Dakota South Dakota and Louisiana are the only states with just one PSO serving
their State in addition to the 38 national PSOs
Puerto Rico is served by one national PSO only
36 | National Healthcare Quality and Disparities Report
Patient Safety
Compounded Liquid Medications for Children
Compounded liquid medications for children in Michigan 2012
Source Levy S Buckley B Safe Table Success The MI Pediatric Safety Collaboration Presentation presented at the 7th Annual
Meeting of Patient Safety Organizations (PSOs) Rockville MD 2015 April and Rood JM Engels MJ Ciarkowski SL et al Variability in
compounding of oral liquids for pediatric patients a patient safety concern J Am Pharm Assn 201454(4)383-9
Note Information represents 244 responses to online survey of approximately 2000 Michigan pharmacies conducted in June 2012 by
The University of Michigan College of Pharmacy in collaboration with the Michigan Pharmacists Association
0
10
20
30
40
50
1 2 3 4 5 6 7 8 9
Nu
mb
er o
f D
rugs
Number of Unique Concentrations
Number of Different Compounded Concentrations per Drug
0
10
20
30
40
50
No Harm No Harm ButMonitoring
TemporaryHarm
Pe
rce
nt
Compounding Errors by Related Harm and Pharmacy Setting
Inpatient Outpatient
Compounded liquid medications for children in Michigan 2012
Source Levy S Buckley B Safe Table Success The MI Pediatric Safety Collaboration Presentation presented at the 7th Annual
Meeting of Patient Safety Organizations (PSOs) Rockville MD 2015 April and Rood JM Engels MJ Ciarkowski SL et al Variability in
compounding of oral liquids for pediatric patients a patient safety concern J Am Pharm Assn 201454(4)383-9
Note Information represents 244 responses to online survey of approximately 2000 Michigan pharmacies conducted in June 2012 by
The University of Michigan College of Pharmacy in collaboration with the Michigan Pharmacists Association
0
10
20
30
40
50
1 2 3 4 5 6 7 8 9
Nu
mb
er o
f D
rugs
Number of Unique Concentrations
Number of Different Compounded Concentrations per Drug
0
10
20
30
40
50
No Harm No Harm ButMonitoring
TemporaryHarm
Per
cen
t
Compounding Errors by Related Harm and Pharmacy Setting
Inpatient Outpatient
Importance
Liquid medications are widely used in pediatrics because many children find it difficult
to swallow tablets or capsules If not commercially manufactured these liquid
medications require a pharmacist to compound them to the correct dosage for the patient
This practice of compounding has led to a variety of medication concentrations in use In
the absence of standard concentrations for compounded medications there is a risk that
children may accidentally receive medications that are too potent and can be dangerous
or are too weak to be effective
The Michigan Health amp Hospital Association Keystone Center Patient Safety
Organization hosts five Pediatric Safe Tables each year Safe Tables provided a
confidential and legally protected environment to discuss challenges and improvement
strategies regarding inconsistent medication concentrations for compounded oral liquids
without fear of punitive action against them
National Healthcare Quality and Disparities Report | 37
Patient Safety
Overall Percentage
More than half (527) of drugs identified in the 2012 survey had 3 or more unique
concentrations dispensed to children across Michigan For example Rifampin used to
treat bacterial infections was reported to have 8 different concentrations dispensed to
patients
Nearly one-third (313) of reported errors caused temporary harm or required additional
monitoring despite no harm
Standardization of Compounded Liquid Medications
Source Michigan Health amp Hospital Association Keystone Center Patient Safety Organization and University of Michigan College of Pharmacy
State-Wide Initiative to Standardize the Compounding of Oral Liquids in Pediatrics
Standardization of compounded liquid medications for children in Michigan 2011
Issue identificationbull Hospitals attending PSO Pediatrics Safe
Table raise compounded medication concentrations as a major safety issue
bull Small focus group determines extent of problem
bull Michigan pharmacies are surveyed about baseline concentrations
Develop Interventionbull PSO Quarterly Safe Tables are held to
discuss cases and practicesbull Team develops recommendations for
standard concentrationsbull Consensus is achieved for frequently
compounded pediatric medications 470 formulations for 147 drug entities are reduced to 104 concentrations for 100 drugs
Practice changebull Toolkit is createdbull Standards are disseminated to Michigan
prescribers and pharmacies bull Standards are disseminated to PSO
members and Safe Table participants
Source Michigan Health amp Hospital Association Keystone Center Patient Safety Organization and University of Michigan College of Pharmacy
State-Wide Initiative to Standardize the Compounding of Oral Liquids in Pediatrics
Standardization of compounded liquid medications for children in Michigan 2011
Issue identificationbull Hospitals attending PSO Pediatrics Safe
Table raise compounded medication concentrations as a major safety issue
bull Small focus group determines extent of problem
bull Michigan pharmacies are surveyed about baseline concentrations
Develop Interventionbull PSO Quarterly Safe Tables are held to
discuss cases and practicesbull Team develops recommendations for
standard concentrationsbull Consensus is achieved for frequently
compounded pediatric medications 470 formulations for 147 drug entities are reduced to 104 concentrations for 100 drugs
Practice changebull Toolkit is createdbull Standards are disseminated to Michigan
prescribers and pharmacies bull Standards are disseminated to PSO
members and Safe Table participants
The Role of PSO Safe Tables Based on adverse medication events discussed in the
Michigan Health amp Hospital Association (MHA) Keystone Center Patient Safety
Organization (PSO) Safe Tables in July 2011 the Michigan Pediatric Safety Collaboration
was developed to further assess the scope of the problem and formulate a solution
The Collaborative The Michigan Pediatric Safety Collaboration includes individuals from
the University of Michigan College of Pharmacy the Michigan Pharmacists Association
(MPA) the Food and Drug Administration (FDA) and the MHA Keystone PSO
38 | National Healthcare Quality and Disparities Report
Patient Safety
Practice Change
As a result of the standardization effort 470 unique formulations for 147 drug entities
were reduced to 104 different concentrations for 100 drugs
The Michigan Pediatric Safety Collaboration developed a multistep process to implement
standards for compounding medications The MPA surveyed pharmacies in Michigan to
better define the nature and scope of the problem The PSO continued to act as convener
The result was the creation and dissemination of statewide standards for 120 frequently
compounded pediatric medications
Veterans Health Administration
The National Center for Patient Safety is part of the Veterans Health Administration the
Nationrsquos largest integrated health care system
Patient safety-related system improvement initiatives include
The Daily Planreg
Purchasing for Safety Initiative
Patient Safety Improvement Initiative
Patient safety improvement initiative The Daily Planreg at Veterans Affairs Medical Centers 2009
Source King BJ Mills PD Fore A et al The Daily Planreg including patients for safetys sake Nurs Manage 201243(3)15-8
0
10
20
30
40
50
Identified atleast one
error
Identifiederror
of omission
Identifiederror
ofcommission
Nurses Who Identified Errors in Patient Treatment Plan by Type
0
10
20
30
40
50
Patient founddiscrepancy inplanned care
Family founddiscrepancy inplanned care
Nursing Stafffound
discrepancyin plannedtreatment
Respondents Who Identified Errors or Discrepancies Through The Daily Plan reg
Patient safety improvement initiative The Daily Planreg at Veterans Affairs Medical Centers 2009
Source King BJ Mills PD Fore A et al The Daily Planreg including patients for safetys sake Nurs Manage 201243(3)15-8
0
10
20
30
40
50
Identified atleast one
error
Identifiederror
of omission
Identifiederror
ofcommission
Nurses Who Identified Errors in Patient Treatment Plan by Type
0
10
20
30
40
50
Patient founddiscrepancy inplanned care
Family founddiscrepancy inplanned care
Nursing Stafffound
discrepancyin plannedtreatment
Respondents Who Identified Errors or Discrepancies Through The Daily Plan reg
National Healthcare Quality and Disparities Report | 39
Patient Safety
Importance The Daily Planreg
is a two-page printed summary that acts as a schedule for
patients and providers each day It shows the procedures laboratory tests and medications
scheduled for that day and lists essential health information such as patientrsquos name allergies
and current medications It can be tailored for a patientrsquos needs by extracting orders from the
electronic medical record (EMR) The Daily Planreg
is intended to facilitate patient and family
engagement throughout the course of care The Daily Planreg
shows promise for improving
patient safety Since 2009 the VA has implemented The Daily Planreg
in more than 65
hospitals both inpatient and outpatient care settings The Daily Planreg
is shared more than
75000 times a month and the VA plans to continue the spread of The Daily Planreg
at
additional sites in 2016
Findings
As part of a pilot test in 2009 a total of 198 patients and 85 nurses responded to a survey
across 10 facilities Nurses had an average of 34 patients per shift who received The
Daily Planreg Patients responded about their own experiences whereas nurses reported
about all of their patients who received The Daily Planreg
Nearly half (475) of patients reported finding a discrepancy in planned care through
The Daily Planreg In addition 30 of patients reported that their family members found a
discrepancy Although not every discrepancy will be a potential medical error having a
shared understanding of the plan of care decreases the risk of error
More than one in six nurses (176) identified a discrepancy in treatment among their
patients through The Daily Planreg Most of these nurses (153) found one or more errors
of omission and a smaller share (106) of nurses found one or more errors of
commission some found both
40 | National Healthcare Quality and Disparities Report
Patient Safety
Issues Related to Ventilators
Common use-issues related to ventilators at the Veterans Health Administration 2006-2014 (combined)
Source Veterans Health Administration National Center for Patient Safety data collected October 2006 to October 2014
Note Examples of equipment failures include ventilator shutdown and other ventilator problems Ventilator settings include setup problems and
incorrect settings Support activities include space utilities and supplies Transport includes accidental extubation other transportation issues
and vehicle-related issues Alarms include alarm settings and alarm connection Training includes unknown ventilator model and other training
concerns
0
20
40
60
80
100
120
140
160
EquipmentFailure
VentilatorSettings
SupportActivities
Transport Alarms Training
Nu
mb
er o
f R
epo
rts
Common use-issues related to ventilators at the Veterans Health Administration 2006-2014 (combined)
Source Veterans Health Administration National Center for Patient Safety data collected October 2006 to October 2014
Note Examples of equipment failures include ventilator shutdown and other ventilator problems Ventilator settings include setup problems and
incorrect settings Support activities include space utilities and supplies Transport includes accidental extubation other transportation issues
and vehicle-related issues Alarms include alarm settings and alarm connection Training includes unknown ventilator model and other training
concerns
0
20
40
60
80
100
120
140
160
EquipmentFailure
VentilatorSettings
SupportActivities
Transport Alarms Training
Nu
mb
er o
f R
epo
rts
Importance Beginning with a focus on ventilators the Veterans Health Administrationrsquos
human factors-based Purchasing for Safety Initiative communicates the most common use-
issues associated with medical devices in order to ultimately remove or contain identified
vulnerabilities and prevent further harm
Event Reporting Patient safety managers report events and close calls from more than 150
VA facilities to a national database The largest number of use issues related to ventilators
involved equipment failure and issues such as spontaneous ventilator shutdown compressor
failure and broken or missing parts Other categories of ventilator use issues involved the
physical space where the ventilator was used challenges of transporting patients on
ventilators and problems with ventilator settings and alarms Root cause analyses on reports
are conducted and Patient Safety Alerts are issued to share the learning internally
Other Key Components
Data on ventilator issues from the VA and the Food and Drug Administrationrsquos Medical
Product Safety Network are the basis for a ldquogovernment-industry dayrdquo to work with
manufacturers This information is used to help the device manufacturers better
understand the limits of human use of their products
National Healthcare Quality and Disparities Report | 41
Patient Safety
The VA also trains noncliniciansmdashsuch as biomedical engineers across the
organizationmdashto understand the devices consider the situation for their use and identify
what can go wrong (ldquofailure modesrdquo) in advance
The VA encourages discussions among clinicians about their experience in using devices
In the Applied Patient Safety Challenge hundreds of staff participate in brainstorming
about solutions and strategies for dealing with unexpected scenarios involving devices
National Practitioner Data Bank
Medical malpractice actions are one way to flag potential medical errors
Medical Malpractice Payment Reports are submitted to the National Practitioner Data Bank
by medical malpractice payers
Report of a monetary exchange made for the benefit of a physician dentist or other
health care provider
Result of a settlement or judgment of a written complaint or claim based on that
providerrsquos delivery of or failure to deliver health care services
Number of Medical Malpractice Payment Reports by Setting
Number of Medical Malpractice Payment Reports by health care setting 2004-2014
Source National Practitioner Data Bank (NPDB) Public Use Data File Health Resources and Services Administration Bureau of Health
Professions Division of Practitioner Data Banks 2004-2014
Note Health care setting was not collected by the NPDB for 2104 reports in 2004 ldquoOtherrdquo includes Medical Malpractice Payment Reports
related to unknown settings as well as those for a combination of inpatient and outpatient settings Reports pertain to patients of any age
0
2000
4000
6000
8000
10000
12000
14000
16000
18000
20000
2004 2005 2006 2007 2008 2009 2010 2011 2012 2013 2014
Nu
mb
er o
f R
epo
rts
Total Inpatient Outpatient Other
Number of Medical Malpractice Payment Reports by health care setting 2004-2014
Source National Practitioner Data Bank (NPDB) Public Use Data File Health Resources and Services Administration Bureau of Health
Professions Division of Practitioner Data Banks 2004-2014
Note Health care setting was not collected by the NPDB for 2104 reports in 2004 ldquoOtherrdquo includes Medical Malpractice Payment Reports
related to unknown settings as well as those for a combination of inpatient and outpatient settings Reports pertain to patients of any age
0
2000
4000
6000
8000
10000
12000
14000
16000
18000
20000
2004 2005 2006 2007 2008 2009 2010 2011 2012 2013 2014
Nu
mb
er o
f R
epo
rts
Total Inpatient Outpatient Other
42 | National Healthcare Quality and Disparities Report
Patient Safety
Trends The total number of medical malpractice payment reports (MMPRs) per year
decreased from 17641 in 2004 to 12699 in 2014
Variation Across Reports
Of 157022 MMPRs from 2004 through 2014 more reports related to care in the
outpatient setting (71937) than in the inpatient setting (60391)
Diagnosis-related and treatment-related payments were the most frequent types of
reports each accounting for about 27 of cases Reports of payments for medication-
related cases accounted for only 5 of MMPRs (data not shown)
Number of Medical Malpractice Payment Reports by Allegation and Harm
Number of Medical Malpractice Payment Reports by type of allegation and harm severity 2004-2014
Key Temporary injury = Minor temporary injury and Major temporary injury Permanent significant injury = Significant Permanent Injury
Major Permanent Injury Quadriplegia Brain Damage Lifelong care
Source National Practitioner Data Bank Public Use Data File Health Resources and Services Administration Bureau of Health Professions
Division of Practitioner Data Banks 2004-2014
Note Reports pertain to patients of any age
0
20
40
60
80
100
Treatment(n=42913)
Diagnosis(n=42507)
Surgery(n=36845)
Obstetrics(n=10555)
Medication(n=8287)
Monitoring(n=5329)
Anesthesia(n=4276)
Equipment(n=1161)
BehavioralHealth
(n=879)
Blood(n=379)
EmotionalInjury Only
InsignificantInjury
TemporaryInjury
PermanentMinor Injury
PermanentSignificant Injury
Death Unknown
Number of Medical Malpractice Payment Reports by type of allegation and harm severity 2004-2014
Key Temporary injury = Minor temporary injury and Major temporary injury Permanent significant injury = Significant Permanent Injury
Major Permanent Injury Quadriplegia Brain Damage Lifelong care
Source National Practitioner Data Bank Public Use Data File Health Resources and Services Administration Bureau of Health Professions
Division of Practitioner Data Banks 2004-2014
Note Reports pertain to patients of any age
0
20
40
60
80
100
Treatment(n=42913)
Diagnosis(n=42507)
Surgery(n=36845)
Obstetrics(n=10555)
Medication(n=8287)
Monitoring(n=5329)
Anesthesia(n=4276)
Equipment(n=1161)
BehavioralHealth
(n=879)
Blood(n=379)
EmotionalInjury Only
InsignificantInjury
TemporaryInjury
PermanentMinor Injury
PermanentSignificant Injury
Death Unknown
Overall Percentage From 2004 to 2014 medical malpractice payments were made for
allegations related to
Treatment (42913)
Diagnosis (42507)
Surgery (36845)
Obstetrics (10555)
Medication (8287)
Monitoring (5329)
National Healthcare Quality and Disparities Report | 43
Patient Safety
Anesthesia (4276)
Equipment or products (1161)
Behavioral health (879) and
IV and blood products (379)
Variation Across Reports
Death accounted for more than one-third of harm in payments related to monitoring
(499) diagnosis (393) medication (383) and anesthesia (363) allegations
More than half of all obstetric payments were for allegations of permanent severe harm
(570)
Temporary harm accounted for more than one-third of payments related to equipment
(485) and surgery (360)
Most of the behavioral health-related payments were for emotional harm (457) or
death (338)
References
Agency for Healthcare Research and Quality Making Health Care Safer II An Updated Critical Analysis of the
Evidence for Patient Safety Practices Comparative Effectiveness Review No 211 Rockville MD Agency for
Healthcare Research and Quality March 2013 AHRQ Publication No 13-E001-EF
httpwwwahrqgovsitesdefaultfileswysiwygresearchfindingsevidence-basedshy
reportsservicesqualityptsafetyII-fullpdf
Arriaga AF Lancaster RT Berry RW et al The better colectomy project association of evidence-based best-
practice adherence rates to outcomes in colorectal surgery Ann Surg 2009 Oct250(4)507-13
httpwwwncbinlmnihgovpubmed19734778
Centers for Disease Control and Prevention HAI Prevalence Survey
httpwwwcdcgovHAIsurveillanceindexhtml Last updated March 2016 Accessed March 4 2016
Centers for Disease Control and Prevention Nursing Homes and Assisted Living (Long-Term Care Facilities)
httpwwwcdcgovlongtermcare Last updated September 2015 Accessed March 4 2016
Chassin MR Loeb JM High-reliability health care getting there from here Milbank Q 201391(3)459-90
httpwwwncbinlmnihgovpmcarticlesPMC3790522 Accessed September 23 2015
Chiu Y Bero L Hessol NA et al A literature review of clinical outcomes associated with antipsychotic medication
use in North American nursing home residents Health Policy 2015 Jun119(6)802-813 Epub 2015 Feb 28 PMID
25791166 httpwwwsciencedirectcomsciencearticlepiiS0168851015000652 Accessed June 17 2015
Huybrechts KF Gerhard Crystal S et al Differential risk of death in older residents in nursing homes prescribed
specific antipsychotic drugs Population based cohort study BMJ 2012 Feb 23344e977 PMID 22362541
httpwwwncbinlmnihgovpmcarticlesPMC3285717 Accessed June 17 2015
Institute of Medicine Preventing Medication Errors Quality Chasm Series 2007
httpwwwnapeducatalog11623preventing-medication-errors-quality-chasm-series
National Association for Home Care amp Hospice Basic Statistics About Home Care Updated 2010
httpwwwnahcorgassets1710hc_statspdf Accessed August 31 2015
44 | National Healthcare Quality and Disparities Report
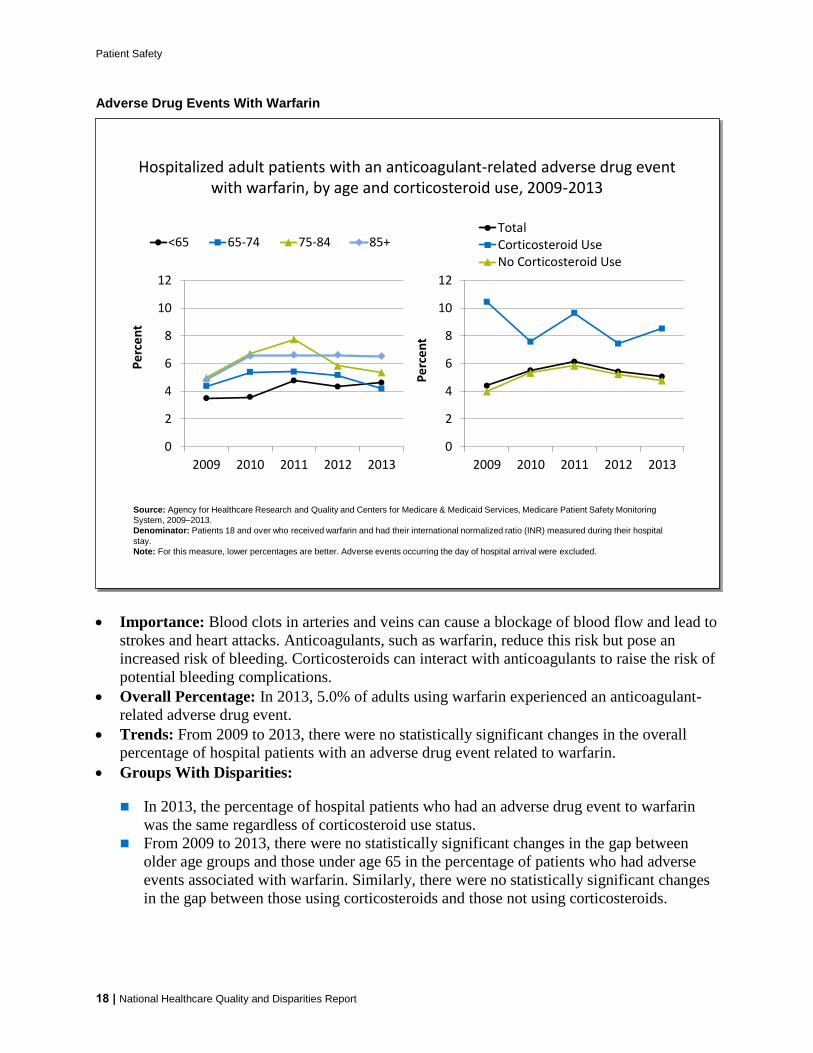
Patient Safety
Importance Pressure ulcers are serious medical conditions They typically result from
prolonged periods of uninterrupted pressure on the skin soft tissue muscle and bone
Vulnerable patients include older adults stroke and diabetic patients patients with dementia
circulatory diseases dehydration and malnutrition and people who use wheelchairs or are
bedriddenmdashthat is any patient with impaired mobility or sensation
Overall Percentage In 2013 the percentage of low-risk short-stay residents with pressure
ulcers was 13 and the percentage of high-risk long-stay residents with pressure ulcers was
77
Groups with Disparities
As in 2011 and 2012 male low-risk short-stay nursing home residents had a worse
percentage with pressure ulcers (15) compared with female residents (12) in 2013
As in 2011 and 2012 male high-risk long-stay nursing home residents had a worse
percentage with pressure ulcers (94) compared with female residents (70) in 2013
Achievable Benchmark
The 2011 top 5 State achievable benchmark for low-risk short-stay nursing home residents was 10 The States that contributed to the benchmark were Alabama Arizona Colorado Connecticut and Idaho
The 2008 top 5 State achievable benchmark for high-risk long-stay nursing home residents was 71 The States that contributed to the benchmark were Hawaii Minnesota Nebraska New Hampshire and North Dakota
No low-risk short-stay residents achieved the benchmark from 2011 to 2013 Among
high-risk long-stay residents only females achieved the benchmark by 2013
National Healthcare Quality and Disparities Report | 23
Patient Safety
Falls
00
05
10
15
20
25
30
35
40
45
50
Pe
rce
nt
2012 2013
Long-stay nursing home residents who had a fall with major injury by sex age and raceethnicity 2012-2013
Source Centers for Medicare amp Medicaid Services Minimum Data Set 2012-2013
Denominator Nursing home residents of any age who have at least 101 cumulative days in the facility with one or more look-back scan
assessments except when the occurrence of falls or number of falls with major injury was not assessed in the look-back scan assessment
Note For this measure lower percentages are better White Black and Other are non-Hispanic Hispanic includes all races
2012 Achievable
Benchmark 22
00
05
10
15
20
25
30
35
40
45
50
Pe
rce
nt
2012 2013
Long-stay nursing home residents who had a fall with major injury by sex age and raceethnicity 2012-2013
Source Centers for Medicare amp Medicaid Services Minimum Data Set 2012-2013
Denominator Nursing home residents of any age who have at least 101 cumulative days in the facility with one or more look-back scan
assessments except when the occurrence of falls or number of falls with major injury was not assessed in the look-back scan assessment
Note For this measure lower percentages are better White Black and Other are non-Hispanic Hispanic includes all races
2012 Achievable
Benchmark 22
Importance Nursing home residents who experience falls resulting in major injuries are at
higher risk of death and disability as well as emotional trauma that can affect functional
abilities and social well-being
Overall Percentage In 2013 the percentage of long-stay nursing home residents who had a
fall with a major injury was 34
Groups With Disparities
In 2013 female nursing home residents had a worse percentage of falls (38) compared
with male residents (25)
In 2013 the percentage of falls with major injury was worse for all subgroups of
residents age 65 years and over compared with their younger counterparts The
percentage for residents under 65 years old was 17 compared with 26 for ages 65shy
74 years 34 for ages 75-84 years and 41 for 85 years and over
Also in 2013 compared with Whites (38) the percentage of falls with major injury
was better for Black (13) Other (22) and Hispanic (24) residents
24 | National Healthcare Quality and Disparities Report
Patient Safety
National Healthcare Quality and Disparities Report | 25
Achievable Benchmark
The 2012 top 5 State achievable benchmark for falls with major injury was 22 The
States that contributed to the achievable benchmark are Alaska California District of
Columbia Hawaii and New Jersey The benchmark was achieved by Black residents and those ages 0-64 years
Antipsychotic Medication Among Nursing Home Residents
Importance The high use of antipsychotic medications among nursing home residents for
indications other than those for which the drug was approved has been noted by the Federal
Government These drugs are often used for too long at too high a dose or when
unnecessary In the past inappropriate prescribing of antipsychotics in nursing homes has
primarily been considered a marker of suboptimal care Recent studies have shown
antipsychotic use is also a drug safety issue (Huybrechts et al 2012) Antipsychotic
medication use is associated with increased risks of adverse events such as movement
disorders falls hip fractures and cerebrovascular events Their use in older adults with
dementia carries an increased risk of death Safety concerns with antipsychotic medication
use in older adults also include the risks of hyperprolactinemia pneumonia
0
5
10
15
20
25
30
Percent
2012 2013
Adult long-stay nursing home residents who received antipsychotic medication by raceethnicity and number of chronic conditions 2012-2013
Key NHOPI = Native Hawaiian or Other Pacific Islander AIAN = American Indian or Alaska Native
Source Centers for Medicare amp Medicaid Services Minimum Data Set 2012-2013
Denominator Nursing home residents of any age who have at least 101 cumulative days in the facility excluding residents with schizophrenia
Tourettersquos syndrome and Huntingtonrsquos disease
Numerator Subset of denominator that receives an antipsychotic medication
Note For this measure lower percentages are better
2012 Achievable
Benchmark 150
0
5
10
15
20
25
30
Percent
2012 2013
Adult long-stay nursing home residents who received antipsychotic medication by raceethnicity and number of chronic conditions 2012-2013
Key NHOPI = Native Hawaiian or Other Pacific Islander AIAN = American Indian or Alaska Native
Source Centers for Medicare amp Medicaid Services Minimum Data Set 2012-2013
Denominator Nursing home residents of any age who have at least 101 cumulative days in the facility excluding residents with schizophrenia
Tourettersquos syndrome and Huntingtonrsquos disease
Numerator Subset of denominator that receives an antipsychotic medication
Note For this measure lower percentages are better
2012 Achievable
Benchmark 150
Patient Safety
26 | National Healthcare Quality and Disparities Report
thromboembolism cerebrovascular events and other cardiovascular adverse events (Chiu et
al 2015)
Overall Percentage The percentage of long-stay nursing home residents who had
antipsychotic medications was 176 in 2013
Groups With Disparities
In 2013 the percentage of residents receiving antipsychotic medication was higher for
Hispanic residents (201) than for White residents (180)
In 2012 and 2013 the percentage of long-stay residents who received antipsychotic
medications was worse for residents with one or more chronic conditions than for
residents with no chronic conditions
Achievable Benchmark
The 2012 top 6 State achievable benchmark was 150 The States that contributed to the
achievable benchmark are Alaska California Hawaii Michigan New Jersey and
Wyoming Asians NHOPIs residents with no chronic conditions and residents with one chronic
condition achieved the benchmark
Antipsychotic Medication Among Nursing Home Residents by State
Long-stay nursing home residents who received antipsychotic medication by State 2013
Source Centers for Medicare amp Medicaid Services Minimum Data Set 2013
Denominator Nursing home residents of any age who have at least 101 cumulative days in the facility
Note For this measure lower percentages are better
AZ
CA
UT
CT
FL
GA
IA
IL
KS
MA
MDMO
NJ
NY
OR
PA
SC
TN
CO
WA
WI
VA
ME
MN
MI
NC
TX
KY
WV
RI
NE
VT
NV OH
SD
AR
IN
NH
MT
ID
WY
ND
NMOK
LA
MS AL
DE
AKAK
HI
DC
85-153 (1st Quartile)
154-173 (2nd Quartile)
No Data
174-192 (3rd Quartile)
PR193-234 (4th Quartile)
Long-stay nursing home residents who received antipsychotic medication by State 2013
Source Centers for Medicare amp Medicaid Services Minimum Data Set 2013
Denominator Nursing home residents of any age who have at least 101 cumulative days in the facility
Note For this measure lower percentages are better
AZ
CA
UT
CT
FL
GA
IA
IL
KS
MA
MDMO
NJ
NY
OR
PA
SC
TN
CO
WA
WI
VA
ME
MN
MI
NC
TX
KY
WV
RI
NE
VT
NV OH
SD
AR
IN
NH
MT
ID
WY
ND
NMOK
LA
MS AL
DE
AKAK
HI
DC
85-153 (1st Quartile)
154-173 (2nd Quartile)
No Data
174-192 (3rd Quartile)
PR193-234 (4th Quartile)
Patient Safety
Overall This map shows overall rankings of States (by quartiles) in the percentage of long-
stay nursing home residents who received antipsychotic medication in 2013 Values ranged
from 85 to 234
Differences by State Interquartile ranges follow
First quartile (lowest) 85-153 (AK CA DC DE HI MD MI MN NJ NC SC
WI WV)
Second quartile (second lowest) 153 -173 (CO ID MT NM NY ND OR PA
RI SD VT WA WY)
Third quartile (second highest) 174-192 (AZ CT GA IN IA KS ME MA MO
NV OH OK VA)
Fourth quartile (highest) 193-234 (AL AR FL IL KY LA MS NE NH TN
TX UT)
Eight of the 12 States in the quartile with the highest percentage of long-stay nursing
home residents who received antipsychotic medication were in the South
Patient Safety in the Home Health Setting
Home health agencies provide services to beneficiaries who are homebound and need skilled
nursing care or therapy
Approximately 12 million individuals receive home health care from more than 33000
providers for causes including acute illness long-term health conditions permanent
disability or terminal illness (NAHCH 2010)
Improvements among home health patients can reflect the quality of care from home health
agencies
Measures include
Home health patients with improvement in surgical wounds
Home health patients with improvements in their ability to take medications orally
National Healthcare Quality and Disparities Report | 27
Patient Safety
Improvement in Surgical Wounds
75
80
85
90
95
100
2010 2011 2012 2013
Pe
rce
nt
White Black Asian Hispanic
75
80
85
90
95
100
2010 2011 2012 2013
Pe
rce
nt
Total 0-64 65-74
75-84 85+
2011 Achievable
Benchmark 913
Home health patients with improvement in surgical wounds by age and raceethnicity 2010-2013
Source Centers for Medicare amp Medicaid Services Outcome and Assessment Information Set 2010-2013
Denominator Number of home health episodes during the measurement period in which the patient of any age had a surgical wound and the
episode ended with the patient discharged from home health care
Note White Black and Asian are non-Hispanic Hispanic includes all races
2011 Achievable
Benchmark 913
75
80
85
90
95
100
2010 2011 2012 2013
Per
cen
t
White Black Asian Hispanic
75
80
85
90
95
100
2010 2011 2012 2013
Per
cen
t
Total 0-64 65-74
75-84 85+
2011 Achievable
Benchmark 913
Home health patients with improvement in surgical wounds by age and raceethnicity 2010-2013
Source Centers for Medicare amp Medicaid Services Outcome and Assessment Information Set 2010-2013
Denominator Number of home health episodes during the measurement period in which the patient of any age had a surgical wound and the
episode ended with the patient discharged from home health care
Note White Black and Asian are non-Hispanic Hispanic includes all races
2011 Achievable
Benchmark 913
Importance Normal wound healing after an operation is an important marker of good care
The home health team should regularly change wound dressing and teach the patient about
wound care
Overall Percentage In 2013 the percentage of home health patients with improvement in
their surgical wounds was 890
Trends The percentage of health home patients with surgical wound improvement increased
between 2010 and 2013
Groups With Disparities
In 2013 compared with residents under age 65 years (856) all other age groups had
better percentages of improvement in surgical wounds The percentage was 893 for
ages 65-74 905 for ages 75-84 and 917 for ages 85 and over
In 2013 compared with Whites (893) Blacks (878) Asians (882) and Hispanics
(874) had worse percentages of improvement in surgical wounds
The 2010 through 2013 trend in the percent of home health patients with surgical wound
improvement did not change for those over age 65 relative to persons under age 65 years
28 | National Healthcare Quality and Disparities Report
Patient Safety
Achievable Benchmark
The 2011 top 5 State achievable benchmark was 913 The States that contributed to the
benchmark are Alabama Mississippi Nevada Oklahoma and South Carolina
Home health patients age 85 years and over achieved the benchmark for surgical wound
improvement in 2013
At the current rate of progress patients ages 75-84 years could reach the benchmark
within a year Patients ages 65-74 years could achieve the benchmark in approximately 2
years
White home health patients could achieve the benchmark in approximately 2 years
Improvement in Ability To Take Medication Orally
0
20
40
60
80
100
2010 2011 2012 2013
Per
cen
t
White Black Asian Hispanic
0
20
40
60
80
100
2010 2011 2012 2013
Per
cen
t
Total 0-64 65-74
75-84 85+
2008 Achievable
Benchmark 516
Home health patients with improvement in their ability to take medications orally by age and raceethnicity 2010-2013
Source Centers for Medicare amp Medicaid Services Outcome and Assessment Information Set 2010-2013
Denominator Number of home health care episodes in which a patient of any age was unable to take oral medications independently at the
start of the episode that ended during the measurement period
Note White Black and Asian are non-Hispanic Hispanic includes all races
2008 Achievable
Benchmark 516
0
20
40
60
80
100
2010 2011 2012 2013
Per
cen
t
White Black Asian Hispanic
0
20
40
60
80
100
2010 2011 2012 2013
Per
cen
t
Total 0-64 65-74
75-84 85+
2008 Achievable
Benchmark 516
Home health patients with improvement in their ability to take medications orally by age and raceethnicity 2010-2013
Source Centers for Medicare amp Medicaid Services Outcome and Assessment Information Set 2010-2013
Denominator Number of home health care episodes in which a patient of any age was unable to take oral medications independently at the
start of the episode that ended during the measurement period
Note White Black and Asian are non-Hispanic Hispanic includes all races
2008 Achievable
Benchmark 516
Importance Taking medications correctly is important to the health status and quality of life
of individuals living in the community The home health team can help teach a patient ways
to organize drugs and take them properly
Overall Percentage In 2013 the percentage of home health patients with improvement in
their ability to take medications orally was 513
Trends Between 2010 and 2013 there was improvement in the overall percentage of home
health patients with improved ability to take medications orally
National Healthcare Quality and Disparities Report | 29
Patient Safety
Groups With Disparities
In 2013 the percentage of home health patients with improvement in their ability to take
medications orally was worse for those age 85 years and over (398) compared with
those under age 65 years (577)
The percentage of patients with improvement in their ability to take medications orally
was worse among Hispanic home health patients (400) than among White patients
(526) in 2013
From 2010 to 2013 the gap between Blacks and Whites decreased and the gap between
Asians and Whites and Hispanics and Whites increased
Achievable Benchmark
The 2008 top 5 State achievable benchmark was 516 The States that contributed to the
achievable benchmark are Iowa Massachusetts New Jersey North Dakota and South
Carolina
The benchmark was achieved among age groups under 85 years and by White and Black
home health patients
The total population is estimated to reach the benchmark in less than a year Hispanic
patients and patients age 85 years and over are farthest from the benchmark
Improvement in Ability To Take Medication Orally by State
Home health patients with improvement in their ability to take medications orally by raceethnicity by State 2013
Source Centers for Medicare amp Medicaid Services Outcome and Assessment Information Set 2013
Denominator Number of home health care episodes in which a patient of any age was unable to take oral medications independently at the
start of the episode that ended during the measurement period
AZ
CA
UT
CT
FL
GA
IA
IL
KS
MA
MDMO
NJ
NY
OR
PA
SC
TN
CO
WA
WI
VA
ME
MN
MI
NC
TX
KY
WV
RI
NE
VT
NV OH
SD
AR
IN
NH
MT
ID
WY
ND
NMOK
LA
MS AL
DE
AKAK
HI
No significant difference between rates
of Hispanics and non-Hispanic Whites
Non-Hispanic Whites have significantly
worse rate than Hispanics
States do not have data that meet the
criteria for statistical reliability data
quality or confidentiality
Hispanics have significantly worse rate
than non-Hispanic Whites
DC
Home health patients with improvement in their ability to take medications orally by raceethnicity by State 2013
Source Centers for Medicare amp Medicaid Services Outcome and Assessment Information Set 2013
Denominator Number of home health care episodes in which a patient of any age was unable to take oral medications independently at the
start of the episode that ended during the measurement period
AZ
CA
UT
CT
FL
GA
IA
IL
KS
MA
MDMO
NJ
NY
OR
PA
SC
TN
CO
WA
WI
VA
ME
MN
MI
NC
TX
KY
WV
RI
NE
VT
NV OH
SD
AR
IN
NH
MT
ID
WY
ND
NMOK
LA
MS AL
DE
AKAK
HI
No significant difference between rates
of Hispanics and non-Hispanic Whites
Non-Hispanic Whites have significantly
worse rate than Hispanics
States do not have data that meet the
criteria for statistical reliability data
quality or confidentiality
Hispanics have significantly worse rate
than non-Hispanic Whites
DC
30 | National Healthcare Quality and Disparities Report
Patient Safety
Geographic Variation
In 2013 Hispanic home health patients had worse rates of improvement in taking oral
medications than non-Hispanic White patients in 11 States (Arizona California
Connecticut Florida Illinois Indiana Massachusetts Nevada New York North
Carolina and Texas
Non-Hispanic White patients had worse rates of improvement than Hispanic patients in
five States (Hawaii Idaho Iowa Michigan and Pennsylvania)
Patient Safety in the Ambulatory Setting
Although patient safety initiatives frequently focus on inpatient hospital events adverse
effects of medical care may be identified and treated in outpatient settings
Adverse effects of medical care can follow care or procedures in hospitals emergency
departments physician offices or other settings
Measures include
Patient safety and quality issues by frequency of occurrence in outpatient medical offices
Adults age 65 years and over who received potentially inappropriate prescription medications during the calendar year
Percentage of hemodialysis patients with vascular catheter in use for 90 days or longer
For more information see the PSNet link to Patient Safety Primer Patient Safety in
Ambulatory Care httpspsnetahrqgovprimersprimer16patient-safety-in-ambulatory-care
National Healthcare Quality and Disparities Report | 31
Patient Safety
Patient Safety and Quality Issues
Patient safety and quality issues by frequency of occurrence in outpatient medical offices 2014
Source Westat analysis of the AHRQ 2014 Medical Office Survey on Patient Safety Culture Comparative Database (N=935)
Note For this measure less frequent occurrences during the year are better
0
20
40
60
80
100
A pharmacy contactedour office to clarify orcorrect a prescription
A patient was unableto get an appointmentwithin 48 hours for anacuteserious problem
A patients medicationlist was not updatedduring his or her visit
The results from a labor imaging test were notavailable when needed
A patients chartmedicalrecord was not available
when needed
Occurred DailyWeekly
Occurred Monthly
Occurred Not at All to Several Times Over the Past Year
Patient safety and quality issues by frequency of occurrence in outpatient medical offices 2014
Source Westat analysis of the AHRQ 2014 Medical Office Survey on Patient Safety Culture Comparative Database (N=935)
Note For this measure less frequent occurrences during the year are better
0
20
40
60
80
100
A pharmacy contactedour office to clarify orcorrect a prescription
A patient was unableto get an appointmentwithin 48 hours for anacuteserious problem
A patients medicationlist was not updatedduring his or her visit
The results from a labor imaging test were notavailable when needed
A patients chartmedicalrecord was not available
when needed
Occurred DailyWeekly
Occurred Monthly
Occurred Not at All to Several Times Over the Past Year
Importance Most health care takes place in the outpatient or ambulatory care setting Lack
of access to care and lack of access to timely and accurate medical information and test
results may contribute to patient safety events such as missed or delayed diagnoses
medication errors failure to order appropriate diagnostic or laboratory tests incorrect
interpretation of tests and inadequate followup on results
Overall Percentage
Almost 30 of medical offices participating in the survey reported daily or weekly
occurrences of being contacted by the pharmacist for clarification or correction on a
prescription
After prescription clarifications or corrections by the pharmacy medical offices were
next most likely to report daily or weekly issues with patients being unable to get an
appointment within 48 hours for an acute or serious problem (14) or the patientrsquos
medication list not getting updated during their visit (11)
The share of medical offices reporting that lab or imaging tests were not available when
needed reached nearly 20 when considering monthly occurrences as well as those that
occurred more frequently
32 | National Healthcare Quality and Disparities Report
Patient Safety
Potentially Inappropriate Prescriptions for Older Adults
Adults age 65 years and over who received potentially inappropriate prescription medications during the calendar year by sex and
perceived health status 2003ndash2013
Source Agency for Healthcare Research and Quality Medical Expenditure Panel Survey 2003-2013
Note For this measure lower percentages are better Prescription medications received include all prescribed medications initiall y purchased
or otherwise obtained as well as any refills For more information on inappropriate medications see the American Geriatrics Society 2012 Beers
Criteria Update Expert Panel American Geriatrics Society updated Beers Criteria for potentially inappropriate medication use in older adults J
Am Geriatr Soc 2012 Apr60(4)616-31
0
5
10
15
20
25
30
Per
cen
t
Total Male Female
0
5
10
15
20
25
30
Per
cen
t
ExcellentVery GoodGood FairPoor
Adults age 65 years and over who received potentially inappropriate prescription medications during the calendar year by sex and
perceived health status 2003ndash2013
Source Agency for Healthcare Research and Quality Medical Expenditure Panel Survey 2003-2013
Note For this measure lower percentages are better Prescription medications received include all prescribed medications initially purchased
or otherwise obtained as well as any refills For more information on inappropriate medications see the American Geriatrics Society 2012 Beers
Criteria Update Expert Panel American Geriatrics Society updated Beers Criteria for potentially inappropriate medication use in older adults J
Am Geriatr Soc 2012 Apr60(4)616-31
0
5
10
15
20
25
30
Per
cen
t
Total Male Female
0
5
10
15
20
25
30
Per
cen
t
ExcellentVery GoodGood FairPoor
Importance Some drugs that are prescribed for older patients are known to be potentially
harmful for this age group
Overall Percentage In 2013 the percentage of adults age 65 years and over who received
potentially inappropriate prescription medications was 114
Trends From 2003 to 2013 the percentage of adults age 65 years and over who received
potentially inappropriate prescription medications improved overall for both sexes and for
people with excellentvery goodgood health status and people with fairpoor health status
Groups With Disparities
In all years the percentage of patients receiving potentially inappropriate medications
was higher among females compared with males This gap was not changing over time
In all years from 2003 to 2013 the percentage of patients receiving potentially
inappropriate medications was higher among people with fairpoor health status
compared with people with excellentgood health status This gap was not changing over
time
National Healthcare Quality and Disparities Report | 33
Patient Safety
Long-Term Catheter Use in Dialysis Patients
HI
AKAK
AZ
CA
UT
CT
FL
GA
IA
IL
KS
MA
MDMO
NJ
NY
OR
PA
SC
TN
CO
WA
WI
VA
ME
MN
MI
NC
TX
KY
WV
RI
NE
VT
NV OH
SD
AR
IN
NH
MT
ID
WY
ND
NMOK
LA
MSAL
DE
DC
10-12
13-18
7-9
PR
Source Centers for Medicare and Medicaid Services Dialysis Facility Compare 2014
Denominator At-risk adult Medicare patients with a central venous catheter who were receiving regular hemodialysis treatments at dialysis
facilities
Note For this measure lower percentages are better
Percentage of hemodialysis patients with central venous catheters used for vascular access for 90 days or longer by State 2014
HI
AKAK
AZ
CA
UT
CT
FL
GA
IA
IL
KS
MA
MDMO
NJ
NY
OR
PA
SC
TN
CO
WA
WI
VA
ME
MN
MI
NC
TX
KY
WV
RI
NE
VT
NV OH
SD
AR
IN
NH
MT
ID
WY
ND
NMOK
LA
MSAL
DE
DC
10-12
13-18
7-9
PR
Source Centers for Medicare and Medicaid Services Dialysis Facility Compare 2014
Denominator At-risk adult Medicare patients with a central venous catheter who were receiving regular hemodialysis treatments at dialysis
facilities
Note For this measure lower percentages are better
Percentage of hemodialysis patients with central venous catheters used for vascular access for 90 days or longer by State 2014
Importance Central venous catheters are frequently used for vascular access to dialysis
patients until a fistula or graft is formed Central venous catheters have higher rates of
infection and adverse events among patients receiving dialysis treatment compared with
other forms of vascular access To decrease the likelihood of adverse events catheters should
be used for less than 90 days
Overall Percentage Nationally an average of 10 of dialysis patients used central venous
catheters for 90 days or longer in 2014
Geographic Variation In 2014 Alabama and Kansas had the lowest percentages of dialysis
patients using central venous catheters for 90 days or longer (7) and Puerto Rico had the
highest percentage (18) of long-term catheter use
Patient Safety Infrastructure
Efforts to improve patient safety have been accompanied by various infrastructure
enhancements
Growth in patient safety organizations which assist providers in detecting and reducing
risks and hazards from care delivery that may lead to patient harm
System improvement initiatives at the Veterans Health Administration (VHA)
34 | National Healthcare Quality and Disparities Report
Patient Safety
Development of the National Practitioner Data Bank a clearinghouse for information on
medical malpractice payments
Patient Safety Organizations
Patient safety organizations (PSOs) aim to reduce preventable adverse events near misses
and unsafe conditions in all health care settings
PSOs provide an environment for health care providers to voluntarily report discuss and
learn from patient safety events and quality analyses on a privileged and confidential basis
Measures include
Number of PSOs serving each State
Variation in concentrations of compounded liquid medications for children
Patient Safety Organizations AHRQ Common Formats
AHRQ Common Formats provide a standardized method for PSOs health care providers
and other organizations to collect and report patient safety events
Data element standards are important for aggregating and analyzing events across
providers
AHRQ Common Formats have been developed for a variety of settings of care
Acute care hospitals
Skilled nursing facilities
Retail pharmacy
More information is available at httpspsoahrqgovcommon
National Healthcare Quality and Disparities Report | 35
Patient Safety
Number of Patient Safety Organizations
AZ (2)
CA (3)
UT (2)
CT(3)
FL (8)
GA (5)
IA (4)
IL (7)
KS (5)
MA(3)
MD (4)MO(2)
NJ(3)
NY (5)
OR (3)
PA (5)
SC (4)
TN (5)
CO (2)
WA (2)
WI (5)
VA (7)
ME(2)
MN(3)
MI (3)
NC (7)
TX (6)
KY (4)WV (3)
RI(2)
NE (2)
VT(2)
NV (2)
OH (2)
SD (1)
AR (4)
IN (2)
NH(2)
MT (2)
ID (3)
WY (2)
ND (1)
NM (3)OK (2)
LA (1)
MS (2)
AL (2)
DE(2)
HI (2)
AKAK (2)
DC(3)
PR (0)
1-2
3-4
5-6
7-8
Number of PSOs
excluding PSOs
operating nationally
Number of Patient Safety Organizations by area served 2014
Source Agency for Healthcare Research and Quality Patient Safety Organization Information Form Calendar Year 2014 and PSO-PPC
Contact Database
Note PSOs included in this map were AHRQ-listed during any part of 2014 and submitted the PSO Profile to the PSO Privacy Protection
Center (PSO-PPC) in early 2015 A PSO may have members in one or more States regardless of headquarters location Each State shows the
number of PSOs that serve that State map excludes 38 PSOs that are available to providers in all States
AZ (2)
CA (3)
UT (2)
CT(3)
FL (8)
GA (5)
IA (4)
IL (7)
KS (5)
MA(3)
MD (4)MO(2)
NJ(3)
NY (5)
OR (3)
PA (5)
SC (4)
TN (5)
CO (2)
WA (2)
WI (5)
VA (7)
ME(2)
MN(3)
MI (3)
NC (7)
TX (6)
KY (4)WV (3)
RI(2)
NE (2)
VT(2)
NV (2)
OH (2)
SD (1)
AR (4)
IN (2)
NH(2)
MT (2)
ID (3)
WY (2)
ND (1)
NM (3)OK (2)
LA (1)
MS (2)
AL (2)
DE(2)
HI (2)
AKAK (2)
DC(3)
PR (0)
1-2
3-4
5-6
7-8
Number of PSOs
excluding PSOs
operating nationally
Number of Patient Safety Organizations by area served 2014
Source Agency for Healthcare Research and Quality Patient Safety Organization Information Form Calendar Year 2014 and PSO-PPC
Contact Database
Note PSOs included in this map were AHRQ-listed during any part of 2014 and submitted the PSO Profile to the PSO Privacy Protection
Center (PSO-PPC) in early 2015 A PSO may have members in one or more States regardless of headquarters location Each State shows the
number of PSOs that serve that State map excludes 38 PSOs that are available to providers in all States
Importance All patient safety organizations (PSOs) have authority to operate in all 50
States and US territories but not all do In 2014 38 PSOs self-reported being available to
providers nationally PSOs not available nationally serve specific States
Geographic Variation
Nearly all States have at least 2 PSOs available to providers in their State in addition to
the 38 national PSOs that serve all States
Florida has the most PSOs available with 8 in addition to the 38 nationally available
PSOs The States with the largest number of PSOs available are generally on the East
Coast (eg North Carolina Virginia New York Pennsylvania Tennessee Georgia) or
have large populations (eg Texas Illinois)
North Dakota South Dakota and Louisiana are the only states with just one PSO serving
their State in addition to the 38 national PSOs
Puerto Rico is served by one national PSO only
36 | National Healthcare Quality and Disparities Report
Patient Safety
Compounded Liquid Medications for Children
Compounded liquid medications for children in Michigan 2012
Source Levy S Buckley B Safe Table Success The MI Pediatric Safety Collaboration Presentation presented at the 7th Annual
Meeting of Patient Safety Organizations (PSOs) Rockville MD 2015 April and Rood JM Engels MJ Ciarkowski SL et al Variability in
compounding of oral liquids for pediatric patients a patient safety concern J Am Pharm Assn 201454(4)383-9
Note Information represents 244 responses to online survey of approximately 2000 Michigan pharmacies conducted in June 2012 by
The University of Michigan College of Pharmacy in collaboration with the Michigan Pharmacists Association
0
10
20
30
40
50
1 2 3 4 5 6 7 8 9
Nu
mb
er o
f D
rugs
Number of Unique Concentrations
Number of Different Compounded Concentrations per Drug
0
10
20
30
40
50
No Harm No Harm ButMonitoring
TemporaryHarm
Pe
rce
nt
Compounding Errors by Related Harm and Pharmacy Setting
Inpatient Outpatient
Compounded liquid medications for children in Michigan 2012
Source Levy S Buckley B Safe Table Success The MI Pediatric Safety Collaboration Presentation presented at the 7th Annual
Meeting of Patient Safety Organizations (PSOs) Rockville MD 2015 April and Rood JM Engels MJ Ciarkowski SL et al Variability in
compounding of oral liquids for pediatric patients a patient safety concern J Am Pharm Assn 201454(4)383-9
Note Information represents 244 responses to online survey of approximately 2000 Michigan pharmacies conducted in June 2012 by
The University of Michigan College of Pharmacy in collaboration with the Michigan Pharmacists Association
0
10
20
30
40
50
1 2 3 4 5 6 7 8 9
Nu
mb
er o
f D
rugs
Number of Unique Concentrations
Number of Different Compounded Concentrations per Drug
0
10
20
30
40
50
No Harm No Harm ButMonitoring
TemporaryHarm
Per
cen
t
Compounding Errors by Related Harm and Pharmacy Setting
Inpatient Outpatient
Importance
Liquid medications are widely used in pediatrics because many children find it difficult
to swallow tablets or capsules If not commercially manufactured these liquid
medications require a pharmacist to compound them to the correct dosage for the patient
This practice of compounding has led to a variety of medication concentrations in use In
the absence of standard concentrations for compounded medications there is a risk that
children may accidentally receive medications that are too potent and can be dangerous
or are too weak to be effective
The Michigan Health amp Hospital Association Keystone Center Patient Safety
Organization hosts five Pediatric Safe Tables each year Safe Tables provided a
confidential and legally protected environment to discuss challenges and improvement
strategies regarding inconsistent medication concentrations for compounded oral liquids
without fear of punitive action against them
National Healthcare Quality and Disparities Report | 37
Patient Safety
Overall Percentage
More than half (527) of drugs identified in the 2012 survey had 3 or more unique
concentrations dispensed to children across Michigan For example Rifampin used to
treat bacterial infections was reported to have 8 different concentrations dispensed to
patients
Nearly one-third (313) of reported errors caused temporary harm or required additional
monitoring despite no harm
Standardization of Compounded Liquid Medications
Source Michigan Health amp Hospital Association Keystone Center Patient Safety Organization and University of Michigan College of Pharmacy
State-Wide Initiative to Standardize the Compounding of Oral Liquids in Pediatrics
Standardization of compounded liquid medications for children in Michigan 2011
Issue identificationbull Hospitals attending PSO Pediatrics Safe
Table raise compounded medication concentrations as a major safety issue
bull Small focus group determines extent of problem
bull Michigan pharmacies are surveyed about baseline concentrations
Develop Interventionbull PSO Quarterly Safe Tables are held to
discuss cases and practicesbull Team develops recommendations for
standard concentrationsbull Consensus is achieved for frequently
compounded pediatric medications 470 formulations for 147 drug entities are reduced to 104 concentrations for 100 drugs
Practice changebull Toolkit is createdbull Standards are disseminated to Michigan
prescribers and pharmacies bull Standards are disseminated to PSO
members and Safe Table participants
Source Michigan Health amp Hospital Association Keystone Center Patient Safety Organization and University of Michigan College of Pharmacy
State-Wide Initiative to Standardize the Compounding of Oral Liquids in Pediatrics
Standardization of compounded liquid medications for children in Michigan 2011
Issue identificationbull Hospitals attending PSO Pediatrics Safe
Table raise compounded medication concentrations as a major safety issue
bull Small focus group determines extent of problem
bull Michigan pharmacies are surveyed about baseline concentrations
Develop Interventionbull PSO Quarterly Safe Tables are held to
discuss cases and practicesbull Team develops recommendations for
standard concentrationsbull Consensus is achieved for frequently
compounded pediatric medications 470 formulations for 147 drug entities are reduced to 104 concentrations for 100 drugs
Practice changebull Toolkit is createdbull Standards are disseminated to Michigan
prescribers and pharmacies bull Standards are disseminated to PSO
members and Safe Table participants
The Role of PSO Safe Tables Based on adverse medication events discussed in the
Michigan Health amp Hospital Association (MHA) Keystone Center Patient Safety
Organization (PSO) Safe Tables in July 2011 the Michigan Pediatric Safety Collaboration
was developed to further assess the scope of the problem and formulate a solution
The Collaborative The Michigan Pediatric Safety Collaboration includes individuals from
the University of Michigan College of Pharmacy the Michigan Pharmacists Association
(MPA) the Food and Drug Administration (FDA) and the MHA Keystone PSO
38 | National Healthcare Quality and Disparities Report
Patient Safety
Practice Change
As a result of the standardization effort 470 unique formulations for 147 drug entities
were reduced to 104 different concentrations for 100 drugs
The Michigan Pediatric Safety Collaboration developed a multistep process to implement
standards for compounding medications The MPA surveyed pharmacies in Michigan to
better define the nature and scope of the problem The PSO continued to act as convener
The result was the creation and dissemination of statewide standards for 120 frequently
compounded pediatric medications
Veterans Health Administration
The National Center for Patient Safety is part of the Veterans Health Administration the
Nationrsquos largest integrated health care system
Patient safety-related system improvement initiatives include
The Daily Planreg
Purchasing for Safety Initiative
Patient Safety Improvement Initiative
Patient safety improvement initiative The Daily Planreg at Veterans Affairs Medical Centers 2009
Source King BJ Mills PD Fore A et al The Daily Planreg including patients for safetys sake Nurs Manage 201243(3)15-8
0
10
20
30
40
50
Identified atleast one
error
Identifiederror
of omission
Identifiederror
ofcommission
Nurses Who Identified Errors in Patient Treatment Plan by Type
0
10
20
30
40
50
Patient founddiscrepancy inplanned care
Family founddiscrepancy inplanned care
Nursing Stafffound
discrepancyin plannedtreatment
Respondents Who Identified Errors or Discrepancies Through The Daily Plan reg
Patient safety improvement initiative The Daily Planreg at Veterans Affairs Medical Centers 2009
Source King BJ Mills PD Fore A et al The Daily Planreg including patients for safetys sake Nurs Manage 201243(3)15-8
0
10
20
30
40
50
Identified atleast one
error
Identifiederror
of omission
Identifiederror
ofcommission
Nurses Who Identified Errors in Patient Treatment Plan by Type
0
10
20
30
40
50
Patient founddiscrepancy inplanned care
Family founddiscrepancy inplanned care
Nursing Stafffound
discrepancyin plannedtreatment
Respondents Who Identified Errors or Discrepancies Through The Daily Plan reg
National Healthcare Quality and Disparities Report | 39
Patient Safety
Importance The Daily Planreg
is a two-page printed summary that acts as a schedule for
patients and providers each day It shows the procedures laboratory tests and medications
scheduled for that day and lists essential health information such as patientrsquos name allergies
and current medications It can be tailored for a patientrsquos needs by extracting orders from the
electronic medical record (EMR) The Daily Planreg
is intended to facilitate patient and family
engagement throughout the course of care The Daily Planreg
shows promise for improving
patient safety Since 2009 the VA has implemented The Daily Planreg
in more than 65
hospitals both inpatient and outpatient care settings The Daily Planreg
is shared more than
75000 times a month and the VA plans to continue the spread of The Daily Planreg
at
additional sites in 2016
Findings
As part of a pilot test in 2009 a total of 198 patients and 85 nurses responded to a survey
across 10 facilities Nurses had an average of 34 patients per shift who received The
Daily Planreg Patients responded about their own experiences whereas nurses reported
about all of their patients who received The Daily Planreg
Nearly half (475) of patients reported finding a discrepancy in planned care through
The Daily Planreg In addition 30 of patients reported that their family members found a
discrepancy Although not every discrepancy will be a potential medical error having a
shared understanding of the plan of care decreases the risk of error
More than one in six nurses (176) identified a discrepancy in treatment among their
patients through The Daily Planreg Most of these nurses (153) found one or more errors
of omission and a smaller share (106) of nurses found one or more errors of
commission some found both
40 | National Healthcare Quality and Disparities Report
Patient Safety
Issues Related to Ventilators
Common use-issues related to ventilators at the Veterans Health Administration 2006-2014 (combined)
Source Veterans Health Administration National Center for Patient Safety data collected October 2006 to October 2014
Note Examples of equipment failures include ventilator shutdown and other ventilator problems Ventilator settings include setup problems and
incorrect settings Support activities include space utilities and supplies Transport includes accidental extubation other transportation issues
and vehicle-related issues Alarms include alarm settings and alarm connection Training includes unknown ventilator model and other training
concerns
0
20
40
60
80
100
120
140
160
EquipmentFailure
VentilatorSettings
SupportActivities
Transport Alarms Training
Nu
mb
er o
f R
epo
rts
Common use-issues related to ventilators at the Veterans Health Administration 2006-2014 (combined)
Source Veterans Health Administration National Center for Patient Safety data collected October 2006 to October 2014
Note Examples of equipment failures include ventilator shutdown and other ventilator problems Ventilator settings include setup problems and
incorrect settings Support activities include space utilities and supplies Transport includes accidental extubation other transportation issues
and vehicle-related issues Alarms include alarm settings and alarm connection Training includes unknown ventilator model and other training
concerns
0
20
40
60
80
100
120
140
160
EquipmentFailure
VentilatorSettings
SupportActivities
Transport Alarms Training
Nu
mb
er o
f R
epo
rts
Importance Beginning with a focus on ventilators the Veterans Health Administrationrsquos
human factors-based Purchasing for Safety Initiative communicates the most common use-
issues associated with medical devices in order to ultimately remove or contain identified
vulnerabilities and prevent further harm
Event Reporting Patient safety managers report events and close calls from more than 150
VA facilities to a national database The largest number of use issues related to ventilators
involved equipment failure and issues such as spontaneous ventilator shutdown compressor
failure and broken or missing parts Other categories of ventilator use issues involved the
physical space where the ventilator was used challenges of transporting patients on
ventilators and problems with ventilator settings and alarms Root cause analyses on reports
are conducted and Patient Safety Alerts are issued to share the learning internally
Other Key Components
Data on ventilator issues from the VA and the Food and Drug Administrationrsquos Medical
Product Safety Network are the basis for a ldquogovernment-industry dayrdquo to work with
manufacturers This information is used to help the device manufacturers better
understand the limits of human use of their products
National Healthcare Quality and Disparities Report | 41
Patient Safety
The VA also trains noncliniciansmdashsuch as biomedical engineers across the
organizationmdashto understand the devices consider the situation for their use and identify
what can go wrong (ldquofailure modesrdquo) in advance
The VA encourages discussions among clinicians about their experience in using devices
In the Applied Patient Safety Challenge hundreds of staff participate in brainstorming
about solutions and strategies for dealing with unexpected scenarios involving devices
National Practitioner Data Bank
Medical malpractice actions are one way to flag potential medical errors
Medical Malpractice Payment Reports are submitted to the National Practitioner Data Bank
by medical malpractice payers
Report of a monetary exchange made for the benefit of a physician dentist or other
health care provider
Result of a settlement or judgment of a written complaint or claim based on that
providerrsquos delivery of or failure to deliver health care services
Number of Medical Malpractice Payment Reports by Setting
Number of Medical Malpractice Payment Reports by health care setting 2004-2014
Source National Practitioner Data Bank (NPDB) Public Use Data File Health Resources and Services Administration Bureau of Health
Professions Division of Practitioner Data Banks 2004-2014
Note Health care setting was not collected by the NPDB for 2104 reports in 2004 ldquoOtherrdquo includes Medical Malpractice Payment Reports
related to unknown settings as well as those for a combination of inpatient and outpatient settings Reports pertain to patients of any age
0
2000
4000
6000
8000
10000
12000
14000
16000
18000
20000
2004 2005 2006 2007 2008 2009 2010 2011 2012 2013 2014
Nu
mb
er o
f R
epo
rts
Total Inpatient Outpatient Other
Number of Medical Malpractice Payment Reports by health care setting 2004-2014
Source National Practitioner Data Bank (NPDB) Public Use Data File Health Resources and Services Administration Bureau of Health
Professions Division of Practitioner Data Banks 2004-2014
Note Health care setting was not collected by the NPDB for 2104 reports in 2004 ldquoOtherrdquo includes Medical Malpractice Payment Reports
related to unknown settings as well as those for a combination of inpatient and outpatient settings Reports pertain to patients of any age
0
2000
4000
6000
8000
10000
12000
14000
16000
18000
20000
2004 2005 2006 2007 2008 2009 2010 2011 2012 2013 2014
Nu
mb
er o
f R
epo
rts
Total Inpatient Outpatient Other
42 | National Healthcare Quality and Disparities Report
Patient Safety
Trends The total number of medical malpractice payment reports (MMPRs) per year
decreased from 17641 in 2004 to 12699 in 2014
Variation Across Reports
Of 157022 MMPRs from 2004 through 2014 more reports related to care in the
outpatient setting (71937) than in the inpatient setting (60391)
Diagnosis-related and treatment-related payments were the most frequent types of
reports each accounting for about 27 of cases Reports of payments for medication-
related cases accounted for only 5 of MMPRs (data not shown)
Number of Medical Malpractice Payment Reports by Allegation and Harm
Number of Medical Malpractice Payment Reports by type of allegation and harm severity 2004-2014
Key Temporary injury = Minor temporary injury and Major temporary injury Permanent significant injury = Significant Permanent Injury
Major Permanent Injury Quadriplegia Brain Damage Lifelong care
Source National Practitioner Data Bank Public Use Data File Health Resources and Services Administration Bureau of Health Professions
Division of Practitioner Data Banks 2004-2014
Note Reports pertain to patients of any age
0
20
40
60
80
100
Treatment(n=42913)
Diagnosis(n=42507)
Surgery(n=36845)
Obstetrics(n=10555)
Medication(n=8287)
Monitoring(n=5329)
Anesthesia(n=4276)
Equipment(n=1161)
BehavioralHealth
(n=879)
Blood(n=379)
EmotionalInjury Only
InsignificantInjury
TemporaryInjury
PermanentMinor Injury
PermanentSignificant Injury
Death Unknown
Number of Medical Malpractice Payment Reports by type of allegation and harm severity 2004-2014
Key Temporary injury = Minor temporary injury and Major temporary injury Permanent significant injury = Significant Permanent Injury
Major Permanent Injury Quadriplegia Brain Damage Lifelong care
Source National Practitioner Data Bank Public Use Data File Health Resources and Services Administration Bureau of Health Professions
Division of Practitioner Data Banks 2004-2014
Note Reports pertain to patients of any age
0
20
40
60
80
100
Treatment(n=42913)
Diagnosis(n=42507)
Surgery(n=36845)
Obstetrics(n=10555)
Medication(n=8287)
Monitoring(n=5329)
Anesthesia(n=4276)
Equipment(n=1161)
BehavioralHealth
(n=879)
Blood(n=379)
EmotionalInjury Only
InsignificantInjury
TemporaryInjury
PermanentMinor Injury
PermanentSignificant Injury
Death Unknown
Overall Percentage From 2004 to 2014 medical malpractice payments were made for
allegations related to
Treatment (42913)
Diagnosis (42507)
Surgery (36845)
Obstetrics (10555)
Medication (8287)
Monitoring (5329)
National Healthcare Quality and Disparities Report | 43
Patient Safety
Anesthesia (4276)
Equipment or products (1161)
Behavioral health (879) and
IV and blood products (379)
Variation Across Reports
Death accounted for more than one-third of harm in payments related to monitoring
(499) diagnosis (393) medication (383) and anesthesia (363) allegations
More than half of all obstetric payments were for allegations of permanent severe harm
(570)
Temporary harm accounted for more than one-third of payments related to equipment
(485) and surgery (360)
Most of the behavioral health-related payments were for emotional harm (457) or
death (338)
References
Agency for Healthcare Research and Quality Making Health Care Safer II An Updated Critical Analysis of the
Evidence for Patient Safety Practices Comparative Effectiveness Review No 211 Rockville MD Agency for
Healthcare Research and Quality March 2013 AHRQ Publication No 13-E001-EF
httpwwwahrqgovsitesdefaultfileswysiwygresearchfindingsevidence-basedshy
reportsservicesqualityptsafetyII-fullpdf
Arriaga AF Lancaster RT Berry RW et al The better colectomy project association of evidence-based best-
practice adherence rates to outcomes in colorectal surgery Ann Surg 2009 Oct250(4)507-13
httpwwwncbinlmnihgovpubmed19734778
Centers for Disease Control and Prevention HAI Prevalence Survey
httpwwwcdcgovHAIsurveillanceindexhtml Last updated March 2016 Accessed March 4 2016
Centers for Disease Control and Prevention Nursing Homes and Assisted Living (Long-Term Care Facilities)
httpwwwcdcgovlongtermcare Last updated September 2015 Accessed March 4 2016
Chassin MR Loeb JM High-reliability health care getting there from here Milbank Q 201391(3)459-90
httpwwwncbinlmnihgovpmcarticlesPMC3790522 Accessed September 23 2015
Chiu Y Bero L Hessol NA et al A literature review of clinical outcomes associated with antipsychotic medication
use in North American nursing home residents Health Policy 2015 Jun119(6)802-813 Epub 2015 Feb 28 PMID
25791166 httpwwwsciencedirectcomsciencearticlepiiS0168851015000652 Accessed June 17 2015
Huybrechts KF Gerhard Crystal S et al Differential risk of death in older residents in nursing homes prescribed
specific antipsychotic drugs Population based cohort study BMJ 2012 Feb 23344e977 PMID 22362541
httpwwwncbinlmnihgovpmcarticlesPMC3285717 Accessed June 17 2015
Institute of Medicine Preventing Medication Errors Quality Chasm Series 2007
httpwwwnapeducatalog11623preventing-medication-errors-quality-chasm-series
National Association for Home Care amp Hospice Basic Statistics About Home Care Updated 2010
httpwwwnahcorgassets1710hc_statspdf Accessed August 31 2015
44 | National Healthcare Quality and Disparities Report
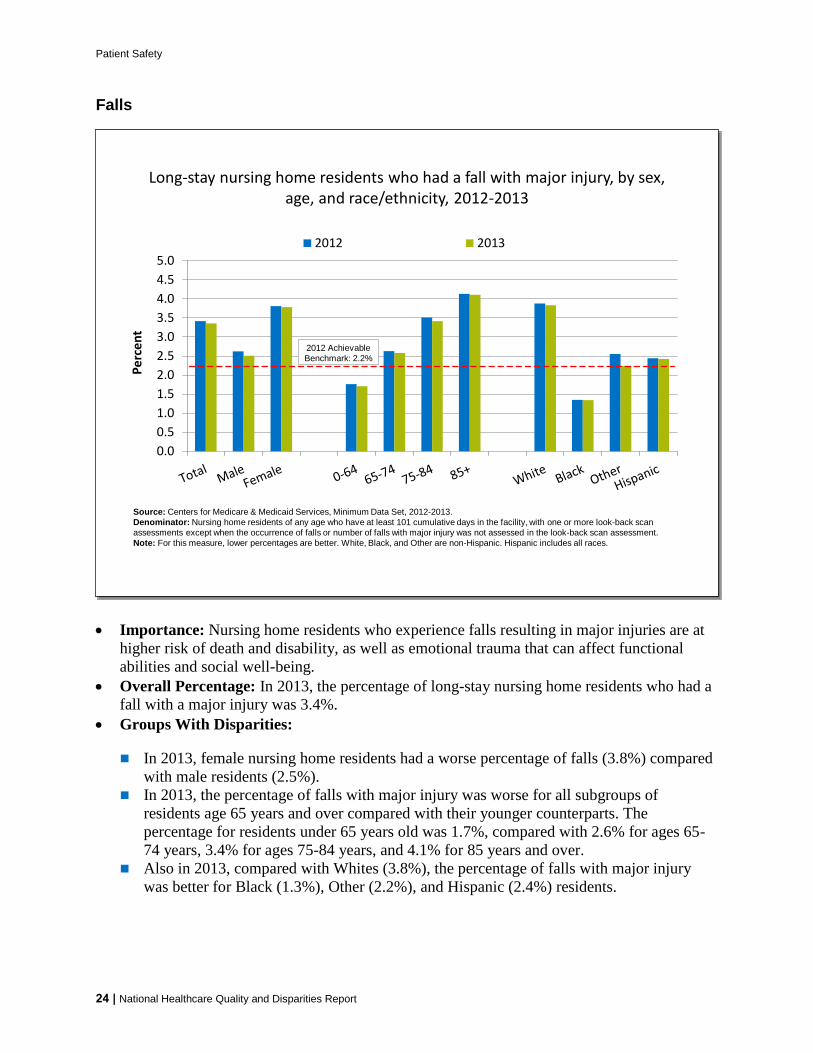
Patient Safety
Falls
00
05
10
15
20
25
30
35
40
45
50
Pe
rce
nt
2012 2013
Long-stay nursing home residents who had a fall with major injury by sex age and raceethnicity 2012-2013
Source Centers for Medicare amp Medicaid Services Minimum Data Set 2012-2013
Denominator Nursing home residents of any age who have at least 101 cumulative days in the facility with one or more look-back scan
assessments except when the occurrence of falls or number of falls with major injury was not assessed in the look-back scan assessment
Note For this measure lower percentages are better White Black and Other are non-Hispanic Hispanic includes all races
2012 Achievable
Benchmark 22
00
05
10
15
20
25
30
35
40
45
50
Pe
rce
nt
2012 2013
Long-stay nursing home residents who had a fall with major injury by sex age and raceethnicity 2012-2013
Source Centers for Medicare amp Medicaid Services Minimum Data Set 2012-2013
Denominator Nursing home residents of any age who have at least 101 cumulative days in the facility with one or more look-back scan
assessments except when the occurrence of falls or number of falls with major injury was not assessed in the look-back scan assessment
Note For this measure lower percentages are better White Black and Other are non-Hispanic Hispanic includes all races
2012 Achievable
Benchmark 22
Importance Nursing home residents who experience falls resulting in major injuries are at
higher risk of death and disability as well as emotional trauma that can affect functional
abilities and social well-being
Overall Percentage In 2013 the percentage of long-stay nursing home residents who had a
fall with a major injury was 34
Groups With Disparities
In 2013 female nursing home residents had a worse percentage of falls (38) compared
with male residents (25)
In 2013 the percentage of falls with major injury was worse for all subgroups of
residents age 65 years and over compared with their younger counterparts The
percentage for residents under 65 years old was 17 compared with 26 for ages 65shy
74 years 34 for ages 75-84 years and 41 for 85 years and over
Also in 2013 compared with Whites (38) the percentage of falls with major injury
was better for Black (13) Other (22) and Hispanic (24) residents
24 | National Healthcare Quality and Disparities Report
Patient Safety
National Healthcare Quality and Disparities Report | 25
Achievable Benchmark
The 2012 top 5 State achievable benchmark for falls with major injury was 22 The
States that contributed to the achievable benchmark are Alaska California District of
Columbia Hawaii and New Jersey The benchmark was achieved by Black residents and those ages 0-64 years
Antipsychotic Medication Among Nursing Home Residents
Importance The high use of antipsychotic medications among nursing home residents for
indications other than those for which the drug was approved has been noted by the Federal
Government These drugs are often used for too long at too high a dose or when
unnecessary In the past inappropriate prescribing of antipsychotics in nursing homes has
primarily been considered a marker of suboptimal care Recent studies have shown
antipsychotic use is also a drug safety issue (Huybrechts et al 2012) Antipsychotic
medication use is associated with increased risks of adverse events such as movement
disorders falls hip fractures and cerebrovascular events Their use in older adults with
dementia carries an increased risk of death Safety concerns with antipsychotic medication
use in older adults also include the risks of hyperprolactinemia pneumonia
0
5
10
15
20
25
30
Percent
2012 2013
Adult long-stay nursing home residents who received antipsychotic medication by raceethnicity and number of chronic conditions 2012-2013
Key NHOPI = Native Hawaiian or Other Pacific Islander AIAN = American Indian or Alaska Native
Source Centers for Medicare amp Medicaid Services Minimum Data Set 2012-2013
Denominator Nursing home residents of any age who have at least 101 cumulative days in the facility excluding residents with schizophrenia
Tourettersquos syndrome and Huntingtonrsquos disease
Numerator Subset of denominator that receives an antipsychotic medication
Note For this measure lower percentages are better
2012 Achievable
Benchmark 150
0
5
10
15
20
25
30
Percent
2012 2013
Adult long-stay nursing home residents who received antipsychotic medication by raceethnicity and number of chronic conditions 2012-2013
Key NHOPI = Native Hawaiian or Other Pacific Islander AIAN = American Indian or Alaska Native
Source Centers for Medicare amp Medicaid Services Minimum Data Set 2012-2013
Denominator Nursing home residents of any age who have at least 101 cumulative days in the facility excluding residents with schizophrenia
Tourettersquos syndrome and Huntingtonrsquos disease
Numerator Subset of denominator that receives an antipsychotic medication
Note For this measure lower percentages are better
2012 Achievable
Benchmark 150
Patient Safety
26 | National Healthcare Quality and Disparities Report
thromboembolism cerebrovascular events and other cardiovascular adverse events (Chiu et
al 2015)
Overall Percentage The percentage of long-stay nursing home residents who had
antipsychotic medications was 176 in 2013
Groups With Disparities
In 2013 the percentage of residents receiving antipsychotic medication was higher for
Hispanic residents (201) than for White residents (180)
In 2012 and 2013 the percentage of long-stay residents who received antipsychotic
medications was worse for residents with one or more chronic conditions than for
residents with no chronic conditions
Achievable Benchmark
The 2012 top 6 State achievable benchmark was 150 The States that contributed to the
achievable benchmark are Alaska California Hawaii Michigan New Jersey and
Wyoming Asians NHOPIs residents with no chronic conditions and residents with one chronic
condition achieved the benchmark
Antipsychotic Medication Among Nursing Home Residents by State
Long-stay nursing home residents who received antipsychotic medication by State 2013
Source Centers for Medicare amp Medicaid Services Minimum Data Set 2013
Denominator Nursing home residents of any age who have at least 101 cumulative days in the facility
Note For this measure lower percentages are better
AZ
CA
UT
CT
FL
GA
IA
IL
KS
MA
MDMO
NJ
NY
OR
PA
SC
TN
CO
WA
WI
VA
ME
MN
MI
NC
TX
KY
WV
RI
NE
VT
NV OH
SD
AR
IN
NH
MT
ID
WY
ND
NMOK
LA
MS AL
DE
AKAK
HI
DC
85-153 (1st Quartile)
154-173 (2nd Quartile)
No Data
174-192 (3rd Quartile)
PR193-234 (4th Quartile)
Long-stay nursing home residents who received antipsychotic medication by State 2013
Source Centers for Medicare amp Medicaid Services Minimum Data Set 2013
Denominator Nursing home residents of any age who have at least 101 cumulative days in the facility
Note For this measure lower percentages are better
AZ
CA
UT
CT
FL
GA
IA
IL
KS
MA
MDMO
NJ
NY
OR
PA
SC
TN
CO
WA
WI
VA
ME
MN
MI
NC
TX
KY
WV
RI
NE
VT
NV OH
SD
AR
IN
NH
MT
ID
WY
ND
NMOK
LA
MS AL
DE
AKAK
HI
DC
85-153 (1st Quartile)
154-173 (2nd Quartile)
No Data
174-192 (3rd Quartile)
PR193-234 (4th Quartile)
Patient Safety
Overall This map shows overall rankings of States (by quartiles) in the percentage of long-
stay nursing home residents who received antipsychotic medication in 2013 Values ranged
from 85 to 234
Differences by State Interquartile ranges follow
First quartile (lowest) 85-153 (AK CA DC DE HI MD MI MN NJ NC SC
WI WV)
Second quartile (second lowest) 153 -173 (CO ID MT NM NY ND OR PA
RI SD VT WA WY)
Third quartile (second highest) 174-192 (AZ CT GA IN IA KS ME MA MO
NV OH OK VA)
Fourth quartile (highest) 193-234 (AL AR FL IL KY LA MS NE NH TN
TX UT)
Eight of the 12 States in the quartile with the highest percentage of long-stay nursing
home residents who received antipsychotic medication were in the South
Patient Safety in the Home Health Setting
Home health agencies provide services to beneficiaries who are homebound and need skilled
nursing care or therapy
Approximately 12 million individuals receive home health care from more than 33000
providers for causes including acute illness long-term health conditions permanent
disability or terminal illness (NAHCH 2010)
Improvements among home health patients can reflect the quality of care from home health
agencies
Measures include
Home health patients with improvement in surgical wounds
Home health patients with improvements in their ability to take medications orally
National Healthcare Quality and Disparities Report | 27
Patient Safety
Improvement in Surgical Wounds
75
80
85
90
95
100
2010 2011 2012 2013
Pe
rce
nt
White Black Asian Hispanic
75
80
85
90
95
100
2010 2011 2012 2013
Pe
rce
nt
Total 0-64 65-74
75-84 85+
2011 Achievable
Benchmark 913
Home health patients with improvement in surgical wounds by age and raceethnicity 2010-2013
Source Centers for Medicare amp Medicaid Services Outcome and Assessment Information Set 2010-2013
Denominator Number of home health episodes during the measurement period in which the patient of any age had a surgical wound and the
episode ended with the patient discharged from home health care
Note White Black and Asian are non-Hispanic Hispanic includes all races
2011 Achievable
Benchmark 913
75
80
85
90
95
100
2010 2011 2012 2013
Per
cen
t
White Black Asian Hispanic
75
80
85
90
95
100
2010 2011 2012 2013
Per
cen
t
Total 0-64 65-74
75-84 85+
2011 Achievable
Benchmark 913
Home health patients with improvement in surgical wounds by age and raceethnicity 2010-2013
Source Centers for Medicare amp Medicaid Services Outcome and Assessment Information Set 2010-2013
Denominator Number of home health episodes during the measurement period in which the patient of any age had a surgical wound and the
episode ended with the patient discharged from home health care
Note White Black and Asian are non-Hispanic Hispanic includes all races
2011 Achievable
Benchmark 913
Importance Normal wound healing after an operation is an important marker of good care
The home health team should regularly change wound dressing and teach the patient about
wound care
Overall Percentage In 2013 the percentage of home health patients with improvement in
their surgical wounds was 890
Trends The percentage of health home patients with surgical wound improvement increased
between 2010 and 2013
Groups With Disparities
In 2013 compared with residents under age 65 years (856) all other age groups had
better percentages of improvement in surgical wounds The percentage was 893 for
ages 65-74 905 for ages 75-84 and 917 for ages 85 and over
In 2013 compared with Whites (893) Blacks (878) Asians (882) and Hispanics
(874) had worse percentages of improvement in surgical wounds
The 2010 through 2013 trend in the percent of home health patients with surgical wound
improvement did not change for those over age 65 relative to persons under age 65 years
28 | National Healthcare Quality and Disparities Report
Patient Safety
Achievable Benchmark
The 2011 top 5 State achievable benchmark was 913 The States that contributed to the
benchmark are Alabama Mississippi Nevada Oklahoma and South Carolina
Home health patients age 85 years and over achieved the benchmark for surgical wound
improvement in 2013
At the current rate of progress patients ages 75-84 years could reach the benchmark
within a year Patients ages 65-74 years could achieve the benchmark in approximately 2
years
White home health patients could achieve the benchmark in approximately 2 years
Improvement in Ability To Take Medication Orally
0
20
40
60
80
100
2010 2011 2012 2013
Per
cen
t
White Black Asian Hispanic
0
20
40
60
80
100
2010 2011 2012 2013
Per
cen
t
Total 0-64 65-74
75-84 85+
2008 Achievable
Benchmark 516
Home health patients with improvement in their ability to take medications orally by age and raceethnicity 2010-2013
Source Centers for Medicare amp Medicaid Services Outcome and Assessment Information Set 2010-2013
Denominator Number of home health care episodes in which a patient of any age was unable to take oral medications independently at the
start of the episode that ended during the measurement period
Note White Black and Asian are non-Hispanic Hispanic includes all races
2008 Achievable
Benchmark 516
0
20
40
60
80
100
2010 2011 2012 2013
Per
cen
t
White Black Asian Hispanic
0
20
40
60
80
100
2010 2011 2012 2013
Per
cen
t
Total 0-64 65-74
75-84 85+
2008 Achievable
Benchmark 516
Home health patients with improvement in their ability to take medications orally by age and raceethnicity 2010-2013
Source Centers for Medicare amp Medicaid Services Outcome and Assessment Information Set 2010-2013
Denominator Number of home health care episodes in which a patient of any age was unable to take oral medications independently at the
start of the episode that ended during the measurement period
Note White Black and Asian are non-Hispanic Hispanic includes all races
2008 Achievable
Benchmark 516
Importance Taking medications correctly is important to the health status and quality of life
of individuals living in the community The home health team can help teach a patient ways
to organize drugs and take them properly
Overall Percentage In 2013 the percentage of home health patients with improvement in
their ability to take medications orally was 513
Trends Between 2010 and 2013 there was improvement in the overall percentage of home
health patients with improved ability to take medications orally
National Healthcare Quality and Disparities Report | 29
Patient Safety
Groups With Disparities
In 2013 the percentage of home health patients with improvement in their ability to take
medications orally was worse for those age 85 years and over (398) compared with
those under age 65 years (577)
The percentage of patients with improvement in their ability to take medications orally
was worse among Hispanic home health patients (400) than among White patients
(526) in 2013
From 2010 to 2013 the gap between Blacks and Whites decreased and the gap between
Asians and Whites and Hispanics and Whites increased
Achievable Benchmark
The 2008 top 5 State achievable benchmark was 516 The States that contributed to the
achievable benchmark are Iowa Massachusetts New Jersey North Dakota and South
Carolina
The benchmark was achieved among age groups under 85 years and by White and Black
home health patients
The total population is estimated to reach the benchmark in less than a year Hispanic
patients and patients age 85 years and over are farthest from the benchmark
Improvement in Ability To Take Medication Orally by State
Home health patients with improvement in their ability to take medications orally by raceethnicity by State 2013
Source Centers for Medicare amp Medicaid Services Outcome and Assessment Information Set 2013
Denominator Number of home health care episodes in which a patient of any age was unable to take oral medications independently at the
start of the episode that ended during the measurement period
AZ
CA
UT
CT
FL
GA
IA
IL
KS
MA
MDMO
NJ
NY
OR
PA
SC
TN
CO
WA
WI
VA
ME
MN
MI
NC
TX
KY
WV
RI
NE
VT
NV OH
SD
AR
IN
NH
MT
ID
WY
ND
NMOK
LA
MS AL
DE
AKAK
HI
No significant difference between rates
of Hispanics and non-Hispanic Whites
Non-Hispanic Whites have significantly
worse rate than Hispanics
States do not have data that meet the
criteria for statistical reliability data
quality or confidentiality
Hispanics have significantly worse rate
than non-Hispanic Whites
DC
Home health patients with improvement in their ability to take medications orally by raceethnicity by State 2013
Source Centers for Medicare amp Medicaid Services Outcome and Assessment Information Set 2013
Denominator Number of home health care episodes in which a patient of any age was unable to take oral medications independently at the
start of the episode that ended during the measurement period
AZ
CA
UT
CT
FL
GA
IA
IL
KS
MA
MDMO
NJ
NY
OR
PA
SC
TN
CO
WA
WI
VA
ME
MN
MI
NC
TX
KY
WV
RI
NE
VT
NV OH
SD
AR
IN
NH
MT
ID
WY
ND
NMOK
LA
MS AL
DE
AKAK
HI
No significant difference between rates
of Hispanics and non-Hispanic Whites
Non-Hispanic Whites have significantly
worse rate than Hispanics
States do not have data that meet the
criteria for statistical reliability data
quality or confidentiality
Hispanics have significantly worse rate
than non-Hispanic Whites
DC
30 | National Healthcare Quality and Disparities Report
Patient Safety
Geographic Variation
In 2013 Hispanic home health patients had worse rates of improvement in taking oral
medications than non-Hispanic White patients in 11 States (Arizona California
Connecticut Florida Illinois Indiana Massachusetts Nevada New York North
Carolina and Texas
Non-Hispanic White patients had worse rates of improvement than Hispanic patients in
five States (Hawaii Idaho Iowa Michigan and Pennsylvania)
Patient Safety in the Ambulatory Setting
Although patient safety initiatives frequently focus on inpatient hospital events adverse
effects of medical care may be identified and treated in outpatient settings
Adverse effects of medical care can follow care or procedures in hospitals emergency
departments physician offices or other settings
Measures include
Patient safety and quality issues by frequency of occurrence in outpatient medical offices
Adults age 65 years and over who received potentially inappropriate prescription medications during the calendar year
Percentage of hemodialysis patients with vascular catheter in use for 90 days or longer
For more information see the PSNet link to Patient Safety Primer Patient Safety in
Ambulatory Care httpspsnetahrqgovprimersprimer16patient-safety-in-ambulatory-care
National Healthcare Quality and Disparities Report | 31
Patient Safety
Patient Safety and Quality Issues
Patient safety and quality issues by frequency of occurrence in outpatient medical offices 2014
Source Westat analysis of the AHRQ 2014 Medical Office Survey on Patient Safety Culture Comparative Database (N=935)
Note For this measure less frequent occurrences during the year are better
0
20
40
60
80
100
A pharmacy contactedour office to clarify orcorrect a prescription
A patient was unableto get an appointmentwithin 48 hours for anacuteserious problem
A patients medicationlist was not updatedduring his or her visit
The results from a labor imaging test were notavailable when needed
A patients chartmedicalrecord was not available
when needed
Occurred DailyWeekly
Occurred Monthly
Occurred Not at All to Several Times Over the Past Year
Patient safety and quality issues by frequency of occurrence in outpatient medical offices 2014
Source Westat analysis of the AHRQ 2014 Medical Office Survey on Patient Safety Culture Comparative Database (N=935)
Note For this measure less frequent occurrences during the year are better
0
20
40
60
80
100
A pharmacy contactedour office to clarify orcorrect a prescription
A patient was unableto get an appointmentwithin 48 hours for anacuteserious problem
A patients medicationlist was not updatedduring his or her visit
The results from a labor imaging test were notavailable when needed
A patients chartmedicalrecord was not available
when needed
Occurred DailyWeekly
Occurred Monthly
Occurred Not at All to Several Times Over the Past Year
Importance Most health care takes place in the outpatient or ambulatory care setting Lack
of access to care and lack of access to timely and accurate medical information and test
results may contribute to patient safety events such as missed or delayed diagnoses
medication errors failure to order appropriate diagnostic or laboratory tests incorrect
interpretation of tests and inadequate followup on results
Overall Percentage
Almost 30 of medical offices participating in the survey reported daily or weekly
occurrences of being contacted by the pharmacist for clarification or correction on a
prescription
After prescription clarifications or corrections by the pharmacy medical offices were
next most likely to report daily or weekly issues with patients being unable to get an
appointment within 48 hours for an acute or serious problem (14) or the patientrsquos
medication list not getting updated during their visit (11)
The share of medical offices reporting that lab or imaging tests were not available when
needed reached nearly 20 when considering monthly occurrences as well as those that
occurred more frequently
32 | National Healthcare Quality and Disparities Report
Patient Safety
Potentially Inappropriate Prescriptions for Older Adults
Adults age 65 years and over who received potentially inappropriate prescription medications during the calendar year by sex and
perceived health status 2003ndash2013
Source Agency for Healthcare Research and Quality Medical Expenditure Panel Survey 2003-2013
Note For this measure lower percentages are better Prescription medications received include all prescribed medications initiall y purchased
or otherwise obtained as well as any refills For more information on inappropriate medications see the American Geriatrics Society 2012 Beers
Criteria Update Expert Panel American Geriatrics Society updated Beers Criteria for potentially inappropriate medication use in older adults J
Am Geriatr Soc 2012 Apr60(4)616-31
0
5
10
15
20
25
30
Per
cen
t
Total Male Female
0
5
10
15
20
25
30
Per
cen
t
ExcellentVery GoodGood FairPoor
Adults age 65 years and over who received potentially inappropriate prescription medications during the calendar year by sex and
perceived health status 2003ndash2013
Source Agency for Healthcare Research and Quality Medical Expenditure Panel Survey 2003-2013
Note For this measure lower percentages are better Prescription medications received include all prescribed medications initially purchased
or otherwise obtained as well as any refills For more information on inappropriate medications see the American Geriatrics Society 2012 Beers
Criteria Update Expert Panel American Geriatrics Society updated Beers Criteria for potentially inappropriate medication use in older adults J
Am Geriatr Soc 2012 Apr60(4)616-31
0
5
10
15
20
25
30
Per
cen
t
Total Male Female
0
5
10
15
20
25
30
Per
cen
t
ExcellentVery GoodGood FairPoor
Importance Some drugs that are prescribed for older patients are known to be potentially
harmful for this age group
Overall Percentage In 2013 the percentage of adults age 65 years and over who received
potentially inappropriate prescription medications was 114
Trends From 2003 to 2013 the percentage of adults age 65 years and over who received
potentially inappropriate prescription medications improved overall for both sexes and for
people with excellentvery goodgood health status and people with fairpoor health status
Groups With Disparities
In all years the percentage of patients receiving potentially inappropriate medications
was higher among females compared with males This gap was not changing over time
In all years from 2003 to 2013 the percentage of patients receiving potentially
inappropriate medications was higher among people with fairpoor health status
compared with people with excellentgood health status This gap was not changing over
time
National Healthcare Quality and Disparities Report | 33
Patient Safety
Long-Term Catheter Use in Dialysis Patients
HI
AKAK
AZ
CA
UT
CT
FL
GA
IA
IL
KS
MA
MDMO
NJ
NY
OR
PA
SC
TN
CO
WA
WI
VA
ME
MN
MI
NC
TX
KY
WV
RI
NE
VT
NV OH
SD
AR
IN
NH
MT
ID
WY
ND
NMOK
LA
MSAL
DE
DC
10-12
13-18
7-9
PR
Source Centers for Medicare and Medicaid Services Dialysis Facility Compare 2014
Denominator At-risk adult Medicare patients with a central venous catheter who were receiving regular hemodialysis treatments at dialysis
facilities
Note For this measure lower percentages are better
Percentage of hemodialysis patients with central venous catheters used for vascular access for 90 days or longer by State 2014
HI
AKAK
AZ
CA
UT
CT
FL
GA
IA
IL
KS
MA
MDMO
NJ
NY
OR
PA
SC
TN
CO
WA
WI
VA
ME
MN
MI
NC
TX
KY
WV
RI
NE
VT
NV OH
SD
AR
IN
NH
MT
ID
WY
ND
NMOK
LA
MSAL
DE
DC
10-12
13-18
7-9
PR
Source Centers for Medicare and Medicaid Services Dialysis Facility Compare 2014
Denominator At-risk adult Medicare patients with a central venous catheter who were receiving regular hemodialysis treatments at dialysis
facilities
Note For this measure lower percentages are better
Percentage of hemodialysis patients with central venous catheters used for vascular access for 90 days or longer by State 2014
Importance Central venous catheters are frequently used for vascular access to dialysis
patients until a fistula or graft is formed Central venous catheters have higher rates of
infection and adverse events among patients receiving dialysis treatment compared with
other forms of vascular access To decrease the likelihood of adverse events catheters should
be used for less than 90 days
Overall Percentage Nationally an average of 10 of dialysis patients used central venous
catheters for 90 days or longer in 2014
Geographic Variation In 2014 Alabama and Kansas had the lowest percentages of dialysis
patients using central venous catheters for 90 days or longer (7) and Puerto Rico had the
highest percentage (18) of long-term catheter use
Patient Safety Infrastructure
Efforts to improve patient safety have been accompanied by various infrastructure
enhancements
Growth in patient safety organizations which assist providers in detecting and reducing
risks and hazards from care delivery that may lead to patient harm
System improvement initiatives at the Veterans Health Administration (VHA)
34 | National Healthcare Quality and Disparities Report
Patient Safety
Development of the National Practitioner Data Bank a clearinghouse for information on
medical malpractice payments
Patient Safety Organizations
Patient safety organizations (PSOs) aim to reduce preventable adverse events near misses
and unsafe conditions in all health care settings
PSOs provide an environment for health care providers to voluntarily report discuss and
learn from patient safety events and quality analyses on a privileged and confidential basis
Measures include
Number of PSOs serving each State
Variation in concentrations of compounded liquid medications for children
Patient Safety Organizations AHRQ Common Formats
AHRQ Common Formats provide a standardized method for PSOs health care providers
and other organizations to collect and report patient safety events
Data element standards are important for aggregating and analyzing events across
providers
AHRQ Common Formats have been developed for a variety of settings of care
Acute care hospitals
Skilled nursing facilities
Retail pharmacy
More information is available at httpspsoahrqgovcommon
National Healthcare Quality and Disparities Report | 35
Patient Safety
Number of Patient Safety Organizations
AZ (2)
CA (3)
UT (2)
CT(3)
FL (8)
GA (5)
IA (4)
IL (7)
KS (5)
MA(3)
MD (4)MO(2)
NJ(3)
NY (5)
OR (3)
PA (5)
SC (4)
TN (5)
CO (2)
WA (2)
WI (5)
VA (7)
ME(2)
MN(3)
MI (3)
NC (7)
TX (6)
KY (4)WV (3)
RI(2)
NE (2)
VT(2)
NV (2)
OH (2)
SD (1)
AR (4)
IN (2)
NH(2)
MT (2)
ID (3)
WY (2)
ND (1)
NM (3)OK (2)
LA (1)
MS (2)
AL (2)
DE(2)
HI (2)
AKAK (2)
DC(3)
PR (0)
1-2
3-4
5-6
7-8
Number of PSOs
excluding PSOs
operating nationally
Number of Patient Safety Organizations by area served 2014
Source Agency for Healthcare Research and Quality Patient Safety Organization Information Form Calendar Year 2014 and PSO-PPC
Contact Database
Note PSOs included in this map were AHRQ-listed during any part of 2014 and submitted the PSO Profile to the PSO Privacy Protection
Center (PSO-PPC) in early 2015 A PSO may have members in one or more States regardless of headquarters location Each State shows the
number of PSOs that serve that State map excludes 38 PSOs that are available to providers in all States
AZ (2)
CA (3)
UT (2)
CT(3)
FL (8)
GA (5)
IA (4)
IL (7)
KS (5)
MA(3)
MD (4)MO(2)
NJ(3)
NY (5)
OR (3)
PA (5)
SC (4)
TN (5)
CO (2)
WA (2)
WI (5)
VA (7)
ME(2)
MN(3)
MI (3)
NC (7)
TX (6)
KY (4)WV (3)
RI(2)
NE (2)
VT(2)
NV (2)
OH (2)
SD (1)
AR (4)
IN (2)
NH(2)
MT (2)
ID (3)
WY (2)
ND (1)
NM (3)OK (2)
LA (1)
MS (2)
AL (2)
DE(2)
HI (2)
AKAK (2)
DC(3)
PR (0)
1-2
3-4
5-6
7-8
Number of PSOs
excluding PSOs
operating nationally
Number of Patient Safety Organizations by area served 2014
Source Agency for Healthcare Research and Quality Patient Safety Organization Information Form Calendar Year 2014 and PSO-PPC
Contact Database
Note PSOs included in this map were AHRQ-listed during any part of 2014 and submitted the PSO Profile to the PSO Privacy Protection
Center (PSO-PPC) in early 2015 A PSO may have members in one or more States regardless of headquarters location Each State shows the
number of PSOs that serve that State map excludes 38 PSOs that are available to providers in all States
Importance All patient safety organizations (PSOs) have authority to operate in all 50
States and US territories but not all do In 2014 38 PSOs self-reported being available to
providers nationally PSOs not available nationally serve specific States
Geographic Variation
Nearly all States have at least 2 PSOs available to providers in their State in addition to
the 38 national PSOs that serve all States
Florida has the most PSOs available with 8 in addition to the 38 nationally available
PSOs The States with the largest number of PSOs available are generally on the East
Coast (eg North Carolina Virginia New York Pennsylvania Tennessee Georgia) or
have large populations (eg Texas Illinois)
North Dakota South Dakota and Louisiana are the only states with just one PSO serving
their State in addition to the 38 national PSOs
Puerto Rico is served by one national PSO only
36 | National Healthcare Quality and Disparities Report
Patient Safety
Compounded Liquid Medications for Children
Compounded liquid medications for children in Michigan 2012
Source Levy S Buckley B Safe Table Success The MI Pediatric Safety Collaboration Presentation presented at the 7th Annual
Meeting of Patient Safety Organizations (PSOs) Rockville MD 2015 April and Rood JM Engels MJ Ciarkowski SL et al Variability in
compounding of oral liquids for pediatric patients a patient safety concern J Am Pharm Assn 201454(4)383-9
Note Information represents 244 responses to online survey of approximately 2000 Michigan pharmacies conducted in June 2012 by
The University of Michigan College of Pharmacy in collaboration with the Michigan Pharmacists Association
0
10
20
30
40
50
1 2 3 4 5 6 7 8 9
Nu
mb
er o
f D
rugs
Number of Unique Concentrations
Number of Different Compounded Concentrations per Drug
0
10
20
30
40
50
No Harm No Harm ButMonitoring
TemporaryHarm
Pe
rce
nt
Compounding Errors by Related Harm and Pharmacy Setting
Inpatient Outpatient
Compounded liquid medications for children in Michigan 2012
Source Levy S Buckley B Safe Table Success The MI Pediatric Safety Collaboration Presentation presented at the 7th Annual
Meeting of Patient Safety Organizations (PSOs) Rockville MD 2015 April and Rood JM Engels MJ Ciarkowski SL et al Variability in
compounding of oral liquids for pediatric patients a patient safety concern J Am Pharm Assn 201454(4)383-9
Note Information represents 244 responses to online survey of approximately 2000 Michigan pharmacies conducted in June 2012 by
The University of Michigan College of Pharmacy in collaboration with the Michigan Pharmacists Association
0
10
20
30
40
50
1 2 3 4 5 6 7 8 9
Nu
mb
er o
f D
rugs
Number of Unique Concentrations
Number of Different Compounded Concentrations per Drug
0
10
20
30
40
50
No Harm No Harm ButMonitoring
TemporaryHarm
Per
cen
t
Compounding Errors by Related Harm and Pharmacy Setting
Inpatient Outpatient
Importance
Liquid medications are widely used in pediatrics because many children find it difficult
to swallow tablets or capsules If not commercially manufactured these liquid
medications require a pharmacist to compound them to the correct dosage for the patient
This practice of compounding has led to a variety of medication concentrations in use In
the absence of standard concentrations for compounded medications there is a risk that
children may accidentally receive medications that are too potent and can be dangerous
or are too weak to be effective
The Michigan Health amp Hospital Association Keystone Center Patient Safety
Organization hosts five Pediatric Safe Tables each year Safe Tables provided a
confidential and legally protected environment to discuss challenges and improvement
strategies regarding inconsistent medication concentrations for compounded oral liquids
without fear of punitive action against them
National Healthcare Quality and Disparities Report | 37
Patient Safety
Overall Percentage
More than half (527) of drugs identified in the 2012 survey had 3 or more unique
concentrations dispensed to children across Michigan For example Rifampin used to
treat bacterial infections was reported to have 8 different concentrations dispensed to
patients
Nearly one-third (313) of reported errors caused temporary harm or required additional
monitoring despite no harm
Standardization of Compounded Liquid Medications
Source Michigan Health amp Hospital Association Keystone Center Patient Safety Organization and University of Michigan College of Pharmacy
State-Wide Initiative to Standardize the Compounding of Oral Liquids in Pediatrics
Standardization of compounded liquid medications for children in Michigan 2011
Issue identificationbull Hospitals attending PSO Pediatrics Safe
Table raise compounded medication concentrations as a major safety issue
bull Small focus group determines extent of problem
bull Michigan pharmacies are surveyed about baseline concentrations
Develop Interventionbull PSO Quarterly Safe Tables are held to
discuss cases and practicesbull Team develops recommendations for
standard concentrationsbull Consensus is achieved for frequently
compounded pediatric medications 470 formulations for 147 drug entities are reduced to 104 concentrations for 100 drugs
Practice changebull Toolkit is createdbull Standards are disseminated to Michigan
prescribers and pharmacies bull Standards are disseminated to PSO
members and Safe Table participants
Source Michigan Health amp Hospital Association Keystone Center Patient Safety Organization and University of Michigan College of Pharmacy
State-Wide Initiative to Standardize the Compounding of Oral Liquids in Pediatrics
Standardization of compounded liquid medications for children in Michigan 2011
Issue identificationbull Hospitals attending PSO Pediatrics Safe
Table raise compounded medication concentrations as a major safety issue
bull Small focus group determines extent of problem
bull Michigan pharmacies are surveyed about baseline concentrations
Develop Interventionbull PSO Quarterly Safe Tables are held to
discuss cases and practicesbull Team develops recommendations for
standard concentrationsbull Consensus is achieved for frequently
compounded pediatric medications 470 formulations for 147 drug entities are reduced to 104 concentrations for 100 drugs
Practice changebull Toolkit is createdbull Standards are disseminated to Michigan
prescribers and pharmacies bull Standards are disseminated to PSO
members and Safe Table participants
The Role of PSO Safe Tables Based on adverse medication events discussed in the
Michigan Health amp Hospital Association (MHA) Keystone Center Patient Safety
Organization (PSO) Safe Tables in July 2011 the Michigan Pediatric Safety Collaboration
was developed to further assess the scope of the problem and formulate a solution
The Collaborative The Michigan Pediatric Safety Collaboration includes individuals from
the University of Michigan College of Pharmacy the Michigan Pharmacists Association
(MPA) the Food and Drug Administration (FDA) and the MHA Keystone PSO
38 | National Healthcare Quality and Disparities Report
Patient Safety
Practice Change
As a result of the standardization effort 470 unique formulations for 147 drug entities
were reduced to 104 different concentrations for 100 drugs
The Michigan Pediatric Safety Collaboration developed a multistep process to implement
standards for compounding medications The MPA surveyed pharmacies in Michigan to
better define the nature and scope of the problem The PSO continued to act as convener
The result was the creation and dissemination of statewide standards for 120 frequently
compounded pediatric medications
Veterans Health Administration
The National Center for Patient Safety is part of the Veterans Health Administration the
Nationrsquos largest integrated health care system
Patient safety-related system improvement initiatives include
The Daily Planreg
Purchasing for Safety Initiative
Patient Safety Improvement Initiative
Patient safety improvement initiative The Daily Planreg at Veterans Affairs Medical Centers 2009
Source King BJ Mills PD Fore A et al The Daily Planreg including patients for safetys sake Nurs Manage 201243(3)15-8
0
10
20
30
40
50
Identified atleast one
error
Identifiederror
of omission
Identifiederror
ofcommission
Nurses Who Identified Errors in Patient Treatment Plan by Type
0
10
20
30
40
50
Patient founddiscrepancy inplanned care
Family founddiscrepancy inplanned care
Nursing Stafffound
discrepancyin plannedtreatment
Respondents Who Identified Errors or Discrepancies Through The Daily Plan reg
Patient safety improvement initiative The Daily Planreg at Veterans Affairs Medical Centers 2009
Source King BJ Mills PD Fore A et al The Daily Planreg including patients for safetys sake Nurs Manage 201243(3)15-8
0
10
20
30
40
50
Identified atleast one
error
Identifiederror
of omission
Identifiederror
ofcommission
Nurses Who Identified Errors in Patient Treatment Plan by Type
0
10
20
30
40
50
Patient founddiscrepancy inplanned care
Family founddiscrepancy inplanned care
Nursing Stafffound
discrepancyin plannedtreatment
Respondents Who Identified Errors or Discrepancies Through The Daily Plan reg
National Healthcare Quality and Disparities Report | 39
Patient Safety
Importance The Daily Planreg
is a two-page printed summary that acts as a schedule for
patients and providers each day It shows the procedures laboratory tests and medications
scheduled for that day and lists essential health information such as patientrsquos name allergies
and current medications It can be tailored for a patientrsquos needs by extracting orders from the
electronic medical record (EMR) The Daily Planreg
is intended to facilitate patient and family
engagement throughout the course of care The Daily Planreg
shows promise for improving
patient safety Since 2009 the VA has implemented The Daily Planreg
in more than 65
hospitals both inpatient and outpatient care settings The Daily Planreg
is shared more than
75000 times a month and the VA plans to continue the spread of The Daily Planreg
at
additional sites in 2016
Findings
As part of a pilot test in 2009 a total of 198 patients and 85 nurses responded to a survey
across 10 facilities Nurses had an average of 34 patients per shift who received The
Daily Planreg Patients responded about their own experiences whereas nurses reported
about all of their patients who received The Daily Planreg
Nearly half (475) of patients reported finding a discrepancy in planned care through
The Daily Planreg In addition 30 of patients reported that their family members found a
discrepancy Although not every discrepancy will be a potential medical error having a
shared understanding of the plan of care decreases the risk of error
More than one in six nurses (176) identified a discrepancy in treatment among their
patients through The Daily Planreg Most of these nurses (153) found one or more errors
of omission and a smaller share (106) of nurses found one or more errors of
commission some found both
40 | National Healthcare Quality and Disparities Report
Patient Safety
Issues Related to Ventilators
Common use-issues related to ventilators at the Veterans Health Administration 2006-2014 (combined)
Source Veterans Health Administration National Center for Patient Safety data collected October 2006 to October 2014
Note Examples of equipment failures include ventilator shutdown and other ventilator problems Ventilator settings include setup problems and
incorrect settings Support activities include space utilities and supplies Transport includes accidental extubation other transportation issues
and vehicle-related issues Alarms include alarm settings and alarm connection Training includes unknown ventilator model and other training
concerns
0
20
40
60
80
100
120
140
160
EquipmentFailure
VentilatorSettings
SupportActivities
Transport Alarms Training
Nu
mb
er o
f R
epo
rts
Common use-issues related to ventilators at the Veterans Health Administration 2006-2014 (combined)
Source Veterans Health Administration National Center for Patient Safety data collected October 2006 to October 2014
Note Examples of equipment failures include ventilator shutdown and other ventilator problems Ventilator settings include setup problems and
incorrect settings Support activities include space utilities and supplies Transport includes accidental extubation other transportation issues
and vehicle-related issues Alarms include alarm settings and alarm connection Training includes unknown ventilator model and other training
concerns
0
20
40
60
80
100
120
140
160
EquipmentFailure
VentilatorSettings
SupportActivities
Transport Alarms Training
Nu
mb
er o
f R
epo
rts
Importance Beginning with a focus on ventilators the Veterans Health Administrationrsquos
human factors-based Purchasing for Safety Initiative communicates the most common use-
issues associated with medical devices in order to ultimately remove or contain identified
vulnerabilities and prevent further harm
Event Reporting Patient safety managers report events and close calls from more than 150
VA facilities to a national database The largest number of use issues related to ventilators
involved equipment failure and issues such as spontaneous ventilator shutdown compressor
failure and broken or missing parts Other categories of ventilator use issues involved the
physical space where the ventilator was used challenges of transporting patients on
ventilators and problems with ventilator settings and alarms Root cause analyses on reports
are conducted and Patient Safety Alerts are issued to share the learning internally
Other Key Components
Data on ventilator issues from the VA and the Food and Drug Administrationrsquos Medical
Product Safety Network are the basis for a ldquogovernment-industry dayrdquo to work with
manufacturers This information is used to help the device manufacturers better
understand the limits of human use of their products
National Healthcare Quality and Disparities Report | 41
Patient Safety
The VA also trains noncliniciansmdashsuch as biomedical engineers across the
organizationmdashto understand the devices consider the situation for their use and identify
what can go wrong (ldquofailure modesrdquo) in advance
The VA encourages discussions among clinicians about their experience in using devices
In the Applied Patient Safety Challenge hundreds of staff participate in brainstorming
about solutions and strategies for dealing with unexpected scenarios involving devices
National Practitioner Data Bank
Medical malpractice actions are one way to flag potential medical errors
Medical Malpractice Payment Reports are submitted to the National Practitioner Data Bank
by medical malpractice payers
Report of a monetary exchange made for the benefit of a physician dentist or other
health care provider
Result of a settlement or judgment of a written complaint or claim based on that
providerrsquos delivery of or failure to deliver health care services
Number of Medical Malpractice Payment Reports by Setting
Number of Medical Malpractice Payment Reports by health care setting 2004-2014
Source National Practitioner Data Bank (NPDB) Public Use Data File Health Resources and Services Administration Bureau of Health
Professions Division of Practitioner Data Banks 2004-2014
Note Health care setting was not collected by the NPDB for 2104 reports in 2004 ldquoOtherrdquo includes Medical Malpractice Payment Reports
related to unknown settings as well as those for a combination of inpatient and outpatient settings Reports pertain to patients of any age
0
2000
4000
6000
8000
10000
12000
14000
16000
18000
20000
2004 2005 2006 2007 2008 2009 2010 2011 2012 2013 2014
Nu
mb
er o
f R
epo
rts
Total Inpatient Outpatient Other
Number of Medical Malpractice Payment Reports by health care setting 2004-2014
Source National Practitioner Data Bank (NPDB) Public Use Data File Health Resources and Services Administration Bureau of Health
Professions Division of Practitioner Data Banks 2004-2014
Note Health care setting was not collected by the NPDB for 2104 reports in 2004 ldquoOtherrdquo includes Medical Malpractice Payment Reports
related to unknown settings as well as those for a combination of inpatient and outpatient settings Reports pertain to patients of any age
0
2000
4000
6000
8000
10000
12000
14000
16000
18000
20000
2004 2005 2006 2007 2008 2009 2010 2011 2012 2013 2014
Nu
mb
er o
f R
epo
rts
Total Inpatient Outpatient Other
42 | National Healthcare Quality and Disparities Report
Patient Safety
Trends The total number of medical malpractice payment reports (MMPRs) per year
decreased from 17641 in 2004 to 12699 in 2014
Variation Across Reports
Of 157022 MMPRs from 2004 through 2014 more reports related to care in the
outpatient setting (71937) than in the inpatient setting (60391)
Diagnosis-related and treatment-related payments were the most frequent types of
reports each accounting for about 27 of cases Reports of payments for medication-
related cases accounted for only 5 of MMPRs (data not shown)
Number of Medical Malpractice Payment Reports by Allegation and Harm
Number of Medical Malpractice Payment Reports by type of allegation and harm severity 2004-2014
Key Temporary injury = Minor temporary injury and Major temporary injury Permanent significant injury = Significant Permanent Injury
Major Permanent Injury Quadriplegia Brain Damage Lifelong care
Source National Practitioner Data Bank Public Use Data File Health Resources and Services Administration Bureau of Health Professions
Division of Practitioner Data Banks 2004-2014
Note Reports pertain to patients of any age
0
20
40
60
80
100
Treatment(n=42913)
Diagnosis(n=42507)
Surgery(n=36845)
Obstetrics(n=10555)
Medication(n=8287)
Monitoring(n=5329)
Anesthesia(n=4276)
Equipment(n=1161)
BehavioralHealth
(n=879)
Blood(n=379)
EmotionalInjury Only
InsignificantInjury
TemporaryInjury
PermanentMinor Injury
PermanentSignificant Injury
Death Unknown
Number of Medical Malpractice Payment Reports by type of allegation and harm severity 2004-2014
Key Temporary injury = Minor temporary injury and Major temporary injury Permanent significant injury = Significant Permanent Injury
Major Permanent Injury Quadriplegia Brain Damage Lifelong care
Source National Practitioner Data Bank Public Use Data File Health Resources and Services Administration Bureau of Health Professions
Division of Practitioner Data Banks 2004-2014
Note Reports pertain to patients of any age
0
20
40
60
80
100
Treatment(n=42913)
Diagnosis(n=42507)
Surgery(n=36845)
Obstetrics(n=10555)
Medication(n=8287)
Monitoring(n=5329)
Anesthesia(n=4276)
Equipment(n=1161)
BehavioralHealth
(n=879)
Blood(n=379)
EmotionalInjury Only
InsignificantInjury
TemporaryInjury
PermanentMinor Injury
PermanentSignificant Injury
Death Unknown
Overall Percentage From 2004 to 2014 medical malpractice payments were made for
allegations related to
Treatment (42913)
Diagnosis (42507)
Surgery (36845)
Obstetrics (10555)
Medication (8287)
Monitoring (5329)
National Healthcare Quality and Disparities Report | 43
Patient Safety
Anesthesia (4276)
Equipment or products (1161)
Behavioral health (879) and
IV and blood products (379)
Variation Across Reports
Death accounted for more than one-third of harm in payments related to monitoring
(499) diagnosis (393) medication (383) and anesthesia (363) allegations
More than half of all obstetric payments were for allegations of permanent severe harm
(570)
Temporary harm accounted for more than one-third of payments related to equipment
(485) and surgery (360)
Most of the behavioral health-related payments were for emotional harm (457) or
death (338)
References
Agency for Healthcare Research and Quality Making Health Care Safer II An Updated Critical Analysis of the
Evidence for Patient Safety Practices Comparative Effectiveness Review No 211 Rockville MD Agency for
Healthcare Research and Quality March 2013 AHRQ Publication No 13-E001-EF
httpwwwahrqgovsitesdefaultfileswysiwygresearchfindingsevidence-basedshy
reportsservicesqualityptsafetyII-fullpdf
Arriaga AF Lancaster RT Berry RW et al The better colectomy project association of evidence-based best-
practice adherence rates to outcomes in colorectal surgery Ann Surg 2009 Oct250(4)507-13
httpwwwncbinlmnihgovpubmed19734778
Centers for Disease Control and Prevention HAI Prevalence Survey
httpwwwcdcgovHAIsurveillanceindexhtml Last updated March 2016 Accessed March 4 2016
Centers for Disease Control and Prevention Nursing Homes and Assisted Living (Long-Term Care Facilities)
httpwwwcdcgovlongtermcare Last updated September 2015 Accessed March 4 2016
Chassin MR Loeb JM High-reliability health care getting there from here Milbank Q 201391(3)459-90
httpwwwncbinlmnihgovpmcarticlesPMC3790522 Accessed September 23 2015
Chiu Y Bero L Hessol NA et al A literature review of clinical outcomes associated with antipsychotic medication
use in North American nursing home residents Health Policy 2015 Jun119(6)802-813 Epub 2015 Feb 28 PMID
25791166 httpwwwsciencedirectcomsciencearticlepiiS0168851015000652 Accessed June 17 2015
Huybrechts KF Gerhard Crystal S et al Differential risk of death in older residents in nursing homes prescribed
specific antipsychotic drugs Population based cohort study BMJ 2012 Feb 23344e977 PMID 22362541
httpwwwncbinlmnihgovpmcarticlesPMC3285717 Accessed June 17 2015
Institute of Medicine Preventing Medication Errors Quality Chasm Series 2007
httpwwwnapeducatalog11623preventing-medication-errors-quality-chasm-series
National Association for Home Care amp Hospice Basic Statistics About Home Care Updated 2010
httpwwwnahcorgassets1710hc_statspdf Accessed August 31 2015
44 | National Healthcare Quality and Disparities Report
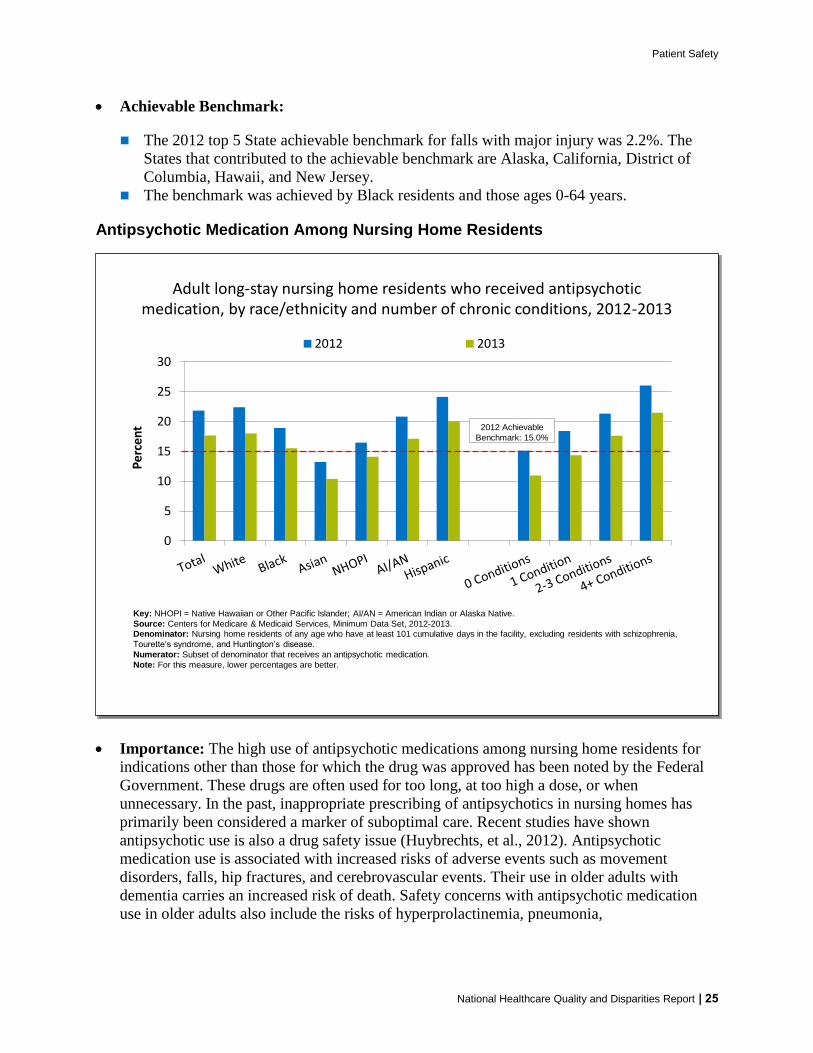
Patient Safety
National Healthcare Quality and Disparities Report | 25
Achievable Benchmark
The 2012 top 5 State achievable benchmark for falls with major injury was 22 The
States that contributed to the achievable benchmark are Alaska California District of
Columbia Hawaii and New Jersey The benchmark was achieved by Black residents and those ages 0-64 years
Antipsychotic Medication Among Nursing Home Residents
Importance The high use of antipsychotic medications among nursing home residents for
indications other than those for which the drug was approved has been noted by the Federal
Government These drugs are often used for too long at too high a dose or when
unnecessary In the past inappropriate prescribing of antipsychotics in nursing homes has
primarily been considered a marker of suboptimal care Recent studies have shown
antipsychotic use is also a drug safety issue (Huybrechts et al 2012) Antipsychotic
medication use is associated with increased risks of adverse events such as movement
disorders falls hip fractures and cerebrovascular events Their use in older adults with
dementia carries an increased risk of death Safety concerns with antipsychotic medication
use in older adults also include the risks of hyperprolactinemia pneumonia
0
5
10
15
20
25
30
Percent
2012 2013
Adult long-stay nursing home residents who received antipsychotic medication by raceethnicity and number of chronic conditions 2012-2013
Key NHOPI = Native Hawaiian or Other Pacific Islander AIAN = American Indian or Alaska Native
Source Centers for Medicare amp Medicaid Services Minimum Data Set 2012-2013
Denominator Nursing home residents of any age who have at least 101 cumulative days in the facility excluding residents with schizophrenia
Tourettersquos syndrome and Huntingtonrsquos disease
Numerator Subset of denominator that receives an antipsychotic medication
Note For this measure lower percentages are better
2012 Achievable
Benchmark 150
0
5
10
15
20
25
30
Percent
2012 2013
Adult long-stay nursing home residents who received antipsychotic medication by raceethnicity and number of chronic conditions 2012-2013
Key NHOPI = Native Hawaiian or Other Pacific Islander AIAN = American Indian or Alaska Native
Source Centers for Medicare amp Medicaid Services Minimum Data Set 2012-2013
Denominator Nursing home residents of any age who have at least 101 cumulative days in the facility excluding residents with schizophrenia
Tourettersquos syndrome and Huntingtonrsquos disease
Numerator Subset of denominator that receives an antipsychotic medication
Note For this measure lower percentages are better
2012 Achievable
Benchmark 150
Patient Safety
26 | National Healthcare Quality and Disparities Report
thromboembolism cerebrovascular events and other cardiovascular adverse events (Chiu et
al 2015)
Overall Percentage The percentage of long-stay nursing home residents who had
antipsychotic medications was 176 in 2013
Groups With Disparities
In 2013 the percentage of residents receiving antipsychotic medication was higher for
Hispanic residents (201) than for White residents (180)
In 2012 and 2013 the percentage of long-stay residents who received antipsychotic
medications was worse for residents with one or more chronic conditions than for
residents with no chronic conditions
Achievable Benchmark
The 2012 top 6 State achievable benchmark was 150 The States that contributed to the
achievable benchmark are Alaska California Hawaii Michigan New Jersey and
Wyoming Asians NHOPIs residents with no chronic conditions and residents with one chronic
condition achieved the benchmark
Antipsychotic Medication Among Nursing Home Residents by State
Long-stay nursing home residents who received antipsychotic medication by State 2013
Source Centers for Medicare amp Medicaid Services Minimum Data Set 2013
Denominator Nursing home residents of any age who have at least 101 cumulative days in the facility
Note For this measure lower percentages are better
AZ
CA
UT
CT
FL
GA
IA
IL
KS
MA
MDMO
NJ
NY
OR
PA
SC
TN
CO
WA
WI
VA
ME
MN
MI
NC
TX
KY
WV
RI
NE
VT
NV OH
SD
AR
IN
NH
MT
ID
WY
ND
NMOK
LA
MS AL
DE
AKAK
HI
DC
85-153 (1st Quartile)
154-173 (2nd Quartile)
No Data
174-192 (3rd Quartile)
PR193-234 (4th Quartile)
Long-stay nursing home residents who received antipsychotic medication by State 2013
Source Centers for Medicare amp Medicaid Services Minimum Data Set 2013
Denominator Nursing home residents of any age who have at least 101 cumulative days in the facility
Note For this measure lower percentages are better
AZ
CA
UT
CT
FL
GA
IA
IL
KS
MA
MDMO
NJ
NY
OR
PA
SC
TN
CO
WA
WI
VA
ME
MN
MI
NC
TX
KY
WV
RI
NE
VT
NV OH
SD
AR
IN
NH
MT
ID
WY
ND
NMOK
LA
MS AL
DE
AKAK
HI
DC
85-153 (1st Quartile)
154-173 (2nd Quartile)
No Data
174-192 (3rd Quartile)
PR193-234 (4th Quartile)
Patient Safety
Overall This map shows overall rankings of States (by quartiles) in the percentage of long-
stay nursing home residents who received antipsychotic medication in 2013 Values ranged
from 85 to 234
Differences by State Interquartile ranges follow
First quartile (lowest) 85-153 (AK CA DC DE HI MD MI MN NJ NC SC
WI WV)
Second quartile (second lowest) 153 -173 (CO ID MT NM NY ND OR PA
RI SD VT WA WY)
Third quartile (second highest) 174-192 (AZ CT GA IN IA KS ME MA MO
NV OH OK VA)
Fourth quartile (highest) 193-234 (AL AR FL IL KY LA MS NE NH TN
TX UT)
Eight of the 12 States in the quartile with the highest percentage of long-stay nursing
home residents who received antipsychotic medication were in the South
Patient Safety in the Home Health Setting
Home health agencies provide services to beneficiaries who are homebound and need skilled
nursing care or therapy
Approximately 12 million individuals receive home health care from more than 33000
providers for causes including acute illness long-term health conditions permanent
disability or terminal illness (NAHCH 2010)
Improvements among home health patients can reflect the quality of care from home health
agencies
Measures include
Home health patients with improvement in surgical wounds
Home health patients with improvements in their ability to take medications orally
National Healthcare Quality and Disparities Report | 27
Patient Safety
Improvement in Surgical Wounds
75
80
85
90
95
100
2010 2011 2012 2013
Pe
rce
nt
White Black Asian Hispanic
75
80
85
90
95
100
2010 2011 2012 2013
Pe
rce
nt
Total 0-64 65-74
75-84 85+
2011 Achievable
Benchmark 913
Home health patients with improvement in surgical wounds by age and raceethnicity 2010-2013
Source Centers for Medicare amp Medicaid Services Outcome and Assessment Information Set 2010-2013
Denominator Number of home health episodes during the measurement period in which the patient of any age had a surgical wound and the
episode ended with the patient discharged from home health care
Note White Black and Asian are non-Hispanic Hispanic includes all races
2011 Achievable
Benchmark 913
75
80
85
90
95
100
2010 2011 2012 2013
Per
cen
t
White Black Asian Hispanic
75
80
85
90
95
100
2010 2011 2012 2013
Per
cen
t
Total 0-64 65-74
75-84 85+
2011 Achievable
Benchmark 913
Home health patients with improvement in surgical wounds by age and raceethnicity 2010-2013
Source Centers for Medicare amp Medicaid Services Outcome and Assessment Information Set 2010-2013
Denominator Number of home health episodes during the measurement period in which the patient of any age had a surgical wound and the
episode ended with the patient discharged from home health care
Note White Black and Asian are non-Hispanic Hispanic includes all races
2011 Achievable
Benchmark 913
Importance Normal wound healing after an operation is an important marker of good care
The home health team should regularly change wound dressing and teach the patient about
wound care
Overall Percentage In 2013 the percentage of home health patients with improvement in
their surgical wounds was 890
Trends The percentage of health home patients with surgical wound improvement increased
between 2010 and 2013
Groups With Disparities
In 2013 compared with residents under age 65 years (856) all other age groups had
better percentages of improvement in surgical wounds The percentage was 893 for
ages 65-74 905 for ages 75-84 and 917 for ages 85 and over
In 2013 compared with Whites (893) Blacks (878) Asians (882) and Hispanics
(874) had worse percentages of improvement in surgical wounds
The 2010 through 2013 trend in the percent of home health patients with surgical wound
improvement did not change for those over age 65 relative to persons under age 65 years
28 | National Healthcare Quality and Disparities Report
Patient Safety
Achievable Benchmark
The 2011 top 5 State achievable benchmark was 913 The States that contributed to the
benchmark are Alabama Mississippi Nevada Oklahoma and South Carolina
Home health patients age 85 years and over achieved the benchmark for surgical wound
improvement in 2013
At the current rate of progress patients ages 75-84 years could reach the benchmark
within a year Patients ages 65-74 years could achieve the benchmark in approximately 2
years
White home health patients could achieve the benchmark in approximately 2 years
Improvement in Ability To Take Medication Orally
0
20
40
60
80
100
2010 2011 2012 2013
Per
cen
t
White Black Asian Hispanic
0
20
40
60
80
100
2010 2011 2012 2013
Per
cen
t
Total 0-64 65-74
75-84 85+
2008 Achievable
Benchmark 516
Home health patients with improvement in their ability to take medications orally by age and raceethnicity 2010-2013
Source Centers for Medicare amp Medicaid Services Outcome and Assessment Information Set 2010-2013
Denominator Number of home health care episodes in which a patient of any age was unable to take oral medications independently at the
start of the episode that ended during the measurement period
Note White Black and Asian are non-Hispanic Hispanic includes all races
2008 Achievable
Benchmark 516
0
20
40
60
80
100
2010 2011 2012 2013
Per
cen
t
White Black Asian Hispanic
0
20
40
60
80
100
2010 2011 2012 2013
Per
cen
t
Total 0-64 65-74
75-84 85+
2008 Achievable
Benchmark 516
Home health patients with improvement in their ability to take medications orally by age and raceethnicity 2010-2013
Source Centers for Medicare amp Medicaid Services Outcome and Assessment Information Set 2010-2013
Denominator Number of home health care episodes in which a patient of any age was unable to take oral medications independently at the
start of the episode that ended during the measurement period
Note White Black and Asian are non-Hispanic Hispanic includes all races
2008 Achievable
Benchmark 516
Importance Taking medications correctly is important to the health status and quality of life
of individuals living in the community The home health team can help teach a patient ways
to organize drugs and take them properly
Overall Percentage In 2013 the percentage of home health patients with improvement in
their ability to take medications orally was 513
Trends Between 2010 and 2013 there was improvement in the overall percentage of home
health patients with improved ability to take medications orally
National Healthcare Quality and Disparities Report | 29
Patient Safety
Groups With Disparities
In 2013 the percentage of home health patients with improvement in their ability to take
medications orally was worse for those age 85 years and over (398) compared with
those under age 65 years (577)
The percentage of patients with improvement in their ability to take medications orally
was worse among Hispanic home health patients (400) than among White patients
(526) in 2013
From 2010 to 2013 the gap between Blacks and Whites decreased and the gap between
Asians and Whites and Hispanics and Whites increased
Achievable Benchmark
The 2008 top 5 State achievable benchmark was 516 The States that contributed to the
achievable benchmark are Iowa Massachusetts New Jersey North Dakota and South
Carolina
The benchmark was achieved among age groups under 85 years and by White and Black
home health patients
The total population is estimated to reach the benchmark in less than a year Hispanic
patients and patients age 85 years and over are farthest from the benchmark
Improvement in Ability To Take Medication Orally by State
Home health patients with improvement in their ability to take medications orally by raceethnicity by State 2013
Source Centers for Medicare amp Medicaid Services Outcome and Assessment Information Set 2013
Denominator Number of home health care episodes in which a patient of any age was unable to take oral medications independently at the
start of the episode that ended during the measurement period
AZ
CA
UT
CT
FL
GA
IA
IL
KS
MA
MDMO
NJ
NY
OR
PA
SC
TN
CO
WA
WI
VA
ME
MN
MI
NC
TX
KY
WV
RI
NE
VT
NV OH
SD
AR
IN
NH
MT
ID
WY
ND
NMOK
LA
MS AL
DE
AKAK
HI
No significant difference between rates
of Hispanics and non-Hispanic Whites
Non-Hispanic Whites have significantly
worse rate than Hispanics
States do not have data that meet the
criteria for statistical reliability data
quality or confidentiality
Hispanics have significantly worse rate
than non-Hispanic Whites
DC
Home health patients with improvement in their ability to take medications orally by raceethnicity by State 2013
Source Centers for Medicare amp Medicaid Services Outcome and Assessment Information Set 2013
Denominator Number of home health care episodes in which a patient of any age was unable to take oral medications independently at the
start of the episode that ended during the measurement period
AZ
CA
UT
CT
FL
GA
IA
IL
KS
MA
MDMO
NJ
NY
OR
PA
SC
TN
CO
WA
WI
VA
ME
MN
MI
NC
TX
KY
WV
RI
NE
VT
NV OH
SD
AR
IN
NH
MT
ID
WY
ND
NMOK
LA
MS AL
DE
AKAK
HI
No significant difference between rates
of Hispanics and non-Hispanic Whites
Non-Hispanic Whites have significantly
worse rate than Hispanics
States do not have data that meet the
criteria for statistical reliability data
quality or confidentiality
Hispanics have significantly worse rate
than non-Hispanic Whites
DC
30 | National Healthcare Quality and Disparities Report
Patient Safety
Geographic Variation
In 2013 Hispanic home health patients had worse rates of improvement in taking oral
medications than non-Hispanic White patients in 11 States (Arizona California
Connecticut Florida Illinois Indiana Massachusetts Nevada New York North
Carolina and Texas
Non-Hispanic White patients had worse rates of improvement than Hispanic patients in
five States (Hawaii Idaho Iowa Michigan and Pennsylvania)
Patient Safety in the Ambulatory Setting
Although patient safety initiatives frequently focus on inpatient hospital events adverse
effects of medical care may be identified and treated in outpatient settings
Adverse effects of medical care can follow care or procedures in hospitals emergency
departments physician offices or other settings
Measures include
Patient safety and quality issues by frequency of occurrence in outpatient medical offices
Adults age 65 years and over who received potentially inappropriate prescription medications during the calendar year
Percentage of hemodialysis patients with vascular catheter in use for 90 days or longer
For more information see the PSNet link to Patient Safety Primer Patient Safety in
Ambulatory Care httpspsnetahrqgovprimersprimer16patient-safety-in-ambulatory-care
National Healthcare Quality and Disparities Report | 31
Patient Safety
Patient Safety and Quality Issues
Patient safety and quality issues by frequency of occurrence in outpatient medical offices 2014
Source Westat analysis of the AHRQ 2014 Medical Office Survey on Patient Safety Culture Comparative Database (N=935)
Note For this measure less frequent occurrences during the year are better
0
20
40
60
80
100
A pharmacy contactedour office to clarify orcorrect a prescription
A patient was unableto get an appointmentwithin 48 hours for anacuteserious problem
A patients medicationlist was not updatedduring his or her visit
The results from a labor imaging test were notavailable when needed
A patients chartmedicalrecord was not available
when needed
Occurred DailyWeekly
Occurred Monthly
Occurred Not at All to Several Times Over the Past Year
Patient safety and quality issues by frequency of occurrence in outpatient medical offices 2014
Source Westat analysis of the AHRQ 2014 Medical Office Survey on Patient Safety Culture Comparative Database (N=935)
Note For this measure less frequent occurrences during the year are better
0
20
40
60
80
100
A pharmacy contactedour office to clarify orcorrect a prescription
A patient was unableto get an appointmentwithin 48 hours for anacuteserious problem
A patients medicationlist was not updatedduring his or her visit
The results from a labor imaging test were notavailable when needed
A patients chartmedicalrecord was not available
when needed
Occurred DailyWeekly
Occurred Monthly
Occurred Not at All to Several Times Over the Past Year
Importance Most health care takes place in the outpatient or ambulatory care setting Lack
of access to care and lack of access to timely and accurate medical information and test
results may contribute to patient safety events such as missed or delayed diagnoses
medication errors failure to order appropriate diagnostic or laboratory tests incorrect
interpretation of tests and inadequate followup on results
Overall Percentage
Almost 30 of medical offices participating in the survey reported daily or weekly
occurrences of being contacted by the pharmacist for clarification or correction on a
prescription
After prescription clarifications or corrections by the pharmacy medical offices were
next most likely to report daily or weekly issues with patients being unable to get an
appointment within 48 hours for an acute or serious problem (14) or the patientrsquos
medication list not getting updated during their visit (11)
The share of medical offices reporting that lab or imaging tests were not available when
needed reached nearly 20 when considering monthly occurrences as well as those that
occurred more frequently
32 | National Healthcare Quality and Disparities Report
Patient Safety
Potentially Inappropriate Prescriptions for Older Adults
Adults age 65 years and over who received potentially inappropriate prescription medications during the calendar year by sex and
perceived health status 2003ndash2013
Source Agency for Healthcare Research and Quality Medical Expenditure Panel Survey 2003-2013
Note For this measure lower percentages are better Prescription medications received include all prescribed medications initiall y purchased
or otherwise obtained as well as any refills For more information on inappropriate medications see the American Geriatrics Society 2012 Beers
Criteria Update Expert Panel American Geriatrics Society updated Beers Criteria for potentially inappropriate medication use in older adults J
Am Geriatr Soc 2012 Apr60(4)616-31
0
5
10
15
20
25
30
Per
cen
t
Total Male Female
0
5
10
15
20
25
30
Per
cen
t
ExcellentVery GoodGood FairPoor
Adults age 65 years and over who received potentially inappropriate prescription medications during the calendar year by sex and
perceived health status 2003ndash2013
Source Agency for Healthcare Research and Quality Medical Expenditure Panel Survey 2003-2013
Note For this measure lower percentages are better Prescription medications received include all prescribed medications initially purchased
or otherwise obtained as well as any refills For more information on inappropriate medications see the American Geriatrics Society 2012 Beers
Criteria Update Expert Panel American Geriatrics Society updated Beers Criteria for potentially inappropriate medication use in older adults J
Am Geriatr Soc 2012 Apr60(4)616-31
0
5
10
15
20
25
30
Per
cen
t
Total Male Female
0
5
10
15
20
25
30
Per
cen
t
ExcellentVery GoodGood FairPoor
Importance Some drugs that are prescribed for older patients are known to be potentially
harmful for this age group
Overall Percentage In 2013 the percentage of adults age 65 years and over who received
potentially inappropriate prescription medications was 114
Trends From 2003 to 2013 the percentage of adults age 65 years and over who received
potentially inappropriate prescription medications improved overall for both sexes and for
people with excellentvery goodgood health status and people with fairpoor health status
Groups With Disparities
In all years the percentage of patients receiving potentially inappropriate medications
was higher among females compared with males This gap was not changing over time
In all years from 2003 to 2013 the percentage of patients receiving potentially
inappropriate medications was higher among people with fairpoor health status
compared with people with excellentgood health status This gap was not changing over
time
National Healthcare Quality and Disparities Report | 33
Patient Safety
Long-Term Catheter Use in Dialysis Patients
HI
AKAK
AZ
CA
UT
CT
FL
GA
IA
IL
KS
MA
MDMO
NJ
NY
OR
PA
SC
TN
CO
WA
WI
VA
ME
MN
MI
NC
TX
KY
WV
RI
NE
VT
NV OH
SD
AR
IN
NH
MT
ID
WY
ND
NMOK
LA
MSAL
DE
DC
10-12
13-18
7-9
PR
Source Centers for Medicare and Medicaid Services Dialysis Facility Compare 2014
Denominator At-risk adult Medicare patients with a central venous catheter who were receiving regular hemodialysis treatments at dialysis
facilities
Note For this measure lower percentages are better
Percentage of hemodialysis patients with central venous catheters used for vascular access for 90 days or longer by State 2014
HI
AKAK
AZ
CA
UT
CT
FL
GA
IA
IL
KS
MA
MDMO
NJ
NY
OR
PA
SC
TN
CO
WA
WI
VA
ME
MN
MI
NC
TX
KY
WV
RI
NE
VT
NV OH
SD
AR
IN
NH
MT
ID
WY
ND
NMOK
LA
MSAL
DE
DC
10-12
13-18
7-9
PR
Source Centers for Medicare and Medicaid Services Dialysis Facility Compare 2014
Denominator At-risk adult Medicare patients with a central venous catheter who were receiving regular hemodialysis treatments at dialysis
facilities
Note For this measure lower percentages are better
Percentage of hemodialysis patients with central venous catheters used for vascular access for 90 days or longer by State 2014
Importance Central venous catheters are frequently used for vascular access to dialysis
patients until a fistula or graft is formed Central venous catheters have higher rates of
infection and adverse events among patients receiving dialysis treatment compared with
other forms of vascular access To decrease the likelihood of adverse events catheters should
be used for less than 90 days
Overall Percentage Nationally an average of 10 of dialysis patients used central venous
catheters for 90 days or longer in 2014
Geographic Variation In 2014 Alabama and Kansas had the lowest percentages of dialysis
patients using central venous catheters for 90 days or longer (7) and Puerto Rico had the
highest percentage (18) of long-term catheter use
Patient Safety Infrastructure
Efforts to improve patient safety have been accompanied by various infrastructure
enhancements
Growth in patient safety organizations which assist providers in detecting and reducing
risks and hazards from care delivery that may lead to patient harm
System improvement initiatives at the Veterans Health Administration (VHA)
34 | National Healthcare Quality and Disparities Report
Patient Safety
Development of the National Practitioner Data Bank a clearinghouse for information on
medical malpractice payments
Patient Safety Organizations
Patient safety organizations (PSOs) aim to reduce preventable adverse events near misses
and unsafe conditions in all health care settings
PSOs provide an environment for health care providers to voluntarily report discuss and
learn from patient safety events and quality analyses on a privileged and confidential basis
Measures include
Number of PSOs serving each State
Variation in concentrations of compounded liquid medications for children
Patient Safety Organizations AHRQ Common Formats
AHRQ Common Formats provide a standardized method for PSOs health care providers
and other organizations to collect and report patient safety events
Data element standards are important for aggregating and analyzing events across
providers
AHRQ Common Formats have been developed for a variety of settings of care
Acute care hospitals
Skilled nursing facilities
Retail pharmacy
More information is available at httpspsoahrqgovcommon
National Healthcare Quality and Disparities Report | 35
Patient Safety
Number of Patient Safety Organizations
AZ (2)
CA (3)
UT (2)
CT(3)
FL (8)
GA (5)
IA (4)
IL (7)
KS (5)
MA(3)
MD (4)MO(2)
NJ(3)
NY (5)
OR (3)
PA (5)
SC (4)
TN (5)
CO (2)
WA (2)
WI (5)
VA (7)
ME(2)
MN(3)
MI (3)
NC (7)
TX (6)
KY (4)WV (3)
RI(2)
NE (2)
VT(2)
NV (2)
OH (2)
SD (1)
AR (4)
IN (2)
NH(2)
MT (2)
ID (3)
WY (2)
ND (1)
NM (3)OK (2)
LA (1)
MS (2)
AL (2)
DE(2)
HI (2)
AKAK (2)
DC(3)
PR (0)
1-2
3-4
5-6
7-8
Number of PSOs
excluding PSOs
operating nationally
Number of Patient Safety Organizations by area served 2014
Source Agency for Healthcare Research and Quality Patient Safety Organization Information Form Calendar Year 2014 and PSO-PPC
Contact Database
Note PSOs included in this map were AHRQ-listed during any part of 2014 and submitted the PSO Profile to the PSO Privacy Protection
Center (PSO-PPC) in early 2015 A PSO may have members in one or more States regardless of headquarters location Each State shows the
number of PSOs that serve that State map excludes 38 PSOs that are available to providers in all States
AZ (2)
CA (3)
UT (2)
CT(3)
FL (8)
GA (5)
IA (4)
IL (7)
KS (5)
MA(3)
MD (4)MO(2)
NJ(3)
NY (5)
OR (3)
PA (5)
SC (4)
TN (5)
CO (2)
WA (2)
WI (5)
VA (7)
ME(2)
MN(3)
MI (3)
NC (7)
TX (6)
KY (4)WV (3)
RI(2)
NE (2)
VT(2)
NV (2)
OH (2)
SD (1)
AR (4)
IN (2)
NH(2)
MT (2)
ID (3)
WY (2)
ND (1)
NM (3)OK (2)
LA (1)
MS (2)
AL (2)
DE(2)
HI (2)
AKAK (2)
DC(3)
PR (0)
1-2
3-4
5-6
7-8
Number of PSOs
excluding PSOs
operating nationally
Number of Patient Safety Organizations by area served 2014
Source Agency for Healthcare Research and Quality Patient Safety Organization Information Form Calendar Year 2014 and PSO-PPC
Contact Database
Note PSOs included in this map were AHRQ-listed during any part of 2014 and submitted the PSO Profile to the PSO Privacy Protection
Center (PSO-PPC) in early 2015 A PSO may have members in one or more States regardless of headquarters location Each State shows the
number of PSOs that serve that State map excludes 38 PSOs that are available to providers in all States
Importance All patient safety organizations (PSOs) have authority to operate in all 50
States and US territories but not all do In 2014 38 PSOs self-reported being available to
providers nationally PSOs not available nationally serve specific States
Geographic Variation
Nearly all States have at least 2 PSOs available to providers in their State in addition to
the 38 national PSOs that serve all States
Florida has the most PSOs available with 8 in addition to the 38 nationally available
PSOs The States with the largest number of PSOs available are generally on the East
Coast (eg North Carolina Virginia New York Pennsylvania Tennessee Georgia) or
have large populations (eg Texas Illinois)
North Dakota South Dakota and Louisiana are the only states with just one PSO serving
their State in addition to the 38 national PSOs
Puerto Rico is served by one national PSO only
36 | National Healthcare Quality and Disparities Report
Patient Safety
Compounded Liquid Medications for Children
Compounded liquid medications for children in Michigan 2012
Source Levy S Buckley B Safe Table Success The MI Pediatric Safety Collaboration Presentation presented at the 7th Annual
Meeting of Patient Safety Organizations (PSOs) Rockville MD 2015 April and Rood JM Engels MJ Ciarkowski SL et al Variability in
compounding of oral liquids for pediatric patients a patient safety concern J Am Pharm Assn 201454(4)383-9
Note Information represents 244 responses to online survey of approximately 2000 Michigan pharmacies conducted in June 2012 by
The University of Michigan College of Pharmacy in collaboration with the Michigan Pharmacists Association
0
10
20
30
40
50
1 2 3 4 5 6 7 8 9
Nu
mb
er o
f D
rugs
Number of Unique Concentrations
Number of Different Compounded Concentrations per Drug
0
10
20
30
40
50
No Harm No Harm ButMonitoring
TemporaryHarm
Pe
rce
nt
Compounding Errors by Related Harm and Pharmacy Setting
Inpatient Outpatient
Compounded liquid medications for children in Michigan 2012
Source Levy S Buckley B Safe Table Success The MI Pediatric Safety Collaboration Presentation presented at the 7th Annual
Meeting of Patient Safety Organizations (PSOs) Rockville MD 2015 April and Rood JM Engels MJ Ciarkowski SL et al Variability in
compounding of oral liquids for pediatric patients a patient safety concern J Am Pharm Assn 201454(4)383-9
Note Information represents 244 responses to online survey of approximately 2000 Michigan pharmacies conducted in June 2012 by
The University of Michigan College of Pharmacy in collaboration with the Michigan Pharmacists Association
0
10
20
30
40
50
1 2 3 4 5 6 7 8 9
Nu
mb
er o
f D
rugs
Number of Unique Concentrations
Number of Different Compounded Concentrations per Drug
0
10
20
30
40
50
No Harm No Harm ButMonitoring
TemporaryHarm
Per
cen
t
Compounding Errors by Related Harm and Pharmacy Setting
Inpatient Outpatient
Importance
Liquid medications are widely used in pediatrics because many children find it difficult
to swallow tablets or capsules If not commercially manufactured these liquid
medications require a pharmacist to compound them to the correct dosage for the patient
This practice of compounding has led to a variety of medication concentrations in use In
the absence of standard concentrations for compounded medications there is a risk that
children may accidentally receive medications that are too potent and can be dangerous
or are too weak to be effective
The Michigan Health amp Hospital Association Keystone Center Patient Safety
Organization hosts five Pediatric Safe Tables each year Safe Tables provided a
confidential and legally protected environment to discuss challenges and improvement
strategies regarding inconsistent medication concentrations for compounded oral liquids
without fear of punitive action against them
National Healthcare Quality and Disparities Report | 37
Patient Safety
Overall Percentage
More than half (527) of drugs identified in the 2012 survey had 3 or more unique
concentrations dispensed to children across Michigan For example Rifampin used to
treat bacterial infections was reported to have 8 different concentrations dispensed to
patients
Nearly one-third (313) of reported errors caused temporary harm or required additional
monitoring despite no harm
Standardization of Compounded Liquid Medications
Source Michigan Health amp Hospital Association Keystone Center Patient Safety Organization and University of Michigan College of Pharmacy
State-Wide Initiative to Standardize the Compounding of Oral Liquids in Pediatrics
Standardization of compounded liquid medications for children in Michigan 2011
Issue identificationbull Hospitals attending PSO Pediatrics Safe
Table raise compounded medication concentrations as a major safety issue
bull Small focus group determines extent of problem
bull Michigan pharmacies are surveyed about baseline concentrations
Develop Interventionbull PSO Quarterly Safe Tables are held to
discuss cases and practicesbull Team develops recommendations for
standard concentrationsbull Consensus is achieved for frequently
compounded pediatric medications 470 formulations for 147 drug entities are reduced to 104 concentrations for 100 drugs
Practice changebull Toolkit is createdbull Standards are disseminated to Michigan
prescribers and pharmacies bull Standards are disseminated to PSO
members and Safe Table participants
Source Michigan Health amp Hospital Association Keystone Center Patient Safety Organization and University of Michigan College of Pharmacy
State-Wide Initiative to Standardize the Compounding of Oral Liquids in Pediatrics
Standardization of compounded liquid medications for children in Michigan 2011
Issue identificationbull Hospitals attending PSO Pediatrics Safe
Table raise compounded medication concentrations as a major safety issue
bull Small focus group determines extent of problem
bull Michigan pharmacies are surveyed about baseline concentrations
Develop Interventionbull PSO Quarterly Safe Tables are held to
discuss cases and practicesbull Team develops recommendations for
standard concentrationsbull Consensus is achieved for frequently
compounded pediatric medications 470 formulations for 147 drug entities are reduced to 104 concentrations for 100 drugs
Practice changebull Toolkit is createdbull Standards are disseminated to Michigan
prescribers and pharmacies bull Standards are disseminated to PSO
members and Safe Table participants
The Role of PSO Safe Tables Based on adverse medication events discussed in the
Michigan Health amp Hospital Association (MHA) Keystone Center Patient Safety
Organization (PSO) Safe Tables in July 2011 the Michigan Pediatric Safety Collaboration
was developed to further assess the scope of the problem and formulate a solution
The Collaborative The Michigan Pediatric Safety Collaboration includes individuals from
the University of Michigan College of Pharmacy the Michigan Pharmacists Association
(MPA) the Food and Drug Administration (FDA) and the MHA Keystone PSO
38 | National Healthcare Quality and Disparities Report
Patient Safety
Practice Change
As a result of the standardization effort 470 unique formulations for 147 drug entities
were reduced to 104 different concentrations for 100 drugs
The Michigan Pediatric Safety Collaboration developed a multistep process to implement
standards for compounding medications The MPA surveyed pharmacies in Michigan to
better define the nature and scope of the problem The PSO continued to act as convener
The result was the creation and dissemination of statewide standards for 120 frequently
compounded pediatric medications
Veterans Health Administration
The National Center for Patient Safety is part of the Veterans Health Administration the
Nationrsquos largest integrated health care system
Patient safety-related system improvement initiatives include
The Daily Planreg
Purchasing for Safety Initiative
Patient Safety Improvement Initiative
Patient safety improvement initiative The Daily Planreg at Veterans Affairs Medical Centers 2009
Source King BJ Mills PD Fore A et al The Daily Planreg including patients for safetys sake Nurs Manage 201243(3)15-8
0
10
20
30
40
50
Identified atleast one
error
Identifiederror
of omission
Identifiederror
ofcommission
Nurses Who Identified Errors in Patient Treatment Plan by Type
0
10
20
30
40
50
Patient founddiscrepancy inplanned care
Family founddiscrepancy inplanned care
Nursing Stafffound
discrepancyin plannedtreatment
Respondents Who Identified Errors or Discrepancies Through The Daily Plan reg
Patient safety improvement initiative The Daily Planreg at Veterans Affairs Medical Centers 2009
Source King BJ Mills PD Fore A et al The Daily Planreg including patients for safetys sake Nurs Manage 201243(3)15-8
0
10
20
30
40
50
Identified atleast one
error
Identifiederror
of omission
Identifiederror
ofcommission
Nurses Who Identified Errors in Patient Treatment Plan by Type
0
10
20
30
40
50
Patient founddiscrepancy inplanned care
Family founddiscrepancy inplanned care
Nursing Stafffound
discrepancyin plannedtreatment
Respondents Who Identified Errors or Discrepancies Through The Daily Plan reg
National Healthcare Quality and Disparities Report | 39
Patient Safety
Importance The Daily Planreg
is a two-page printed summary that acts as a schedule for
patients and providers each day It shows the procedures laboratory tests and medications
scheduled for that day and lists essential health information such as patientrsquos name allergies
and current medications It can be tailored for a patientrsquos needs by extracting orders from the
electronic medical record (EMR) The Daily Planreg
is intended to facilitate patient and family
engagement throughout the course of care The Daily Planreg
shows promise for improving
patient safety Since 2009 the VA has implemented The Daily Planreg
in more than 65
hospitals both inpatient and outpatient care settings The Daily Planreg
is shared more than
75000 times a month and the VA plans to continue the spread of The Daily Planreg
at
additional sites in 2016
Findings
As part of a pilot test in 2009 a total of 198 patients and 85 nurses responded to a survey
across 10 facilities Nurses had an average of 34 patients per shift who received The
Daily Planreg Patients responded about their own experiences whereas nurses reported
about all of their patients who received The Daily Planreg
Nearly half (475) of patients reported finding a discrepancy in planned care through
The Daily Planreg In addition 30 of patients reported that their family members found a
discrepancy Although not every discrepancy will be a potential medical error having a
shared understanding of the plan of care decreases the risk of error
More than one in six nurses (176) identified a discrepancy in treatment among their
patients through The Daily Planreg Most of these nurses (153) found one or more errors
of omission and a smaller share (106) of nurses found one or more errors of
commission some found both
40 | National Healthcare Quality and Disparities Report
Patient Safety
Issues Related to Ventilators
Common use-issues related to ventilators at the Veterans Health Administration 2006-2014 (combined)
Source Veterans Health Administration National Center for Patient Safety data collected October 2006 to October 2014
Note Examples of equipment failures include ventilator shutdown and other ventilator problems Ventilator settings include setup problems and
incorrect settings Support activities include space utilities and supplies Transport includes accidental extubation other transportation issues
and vehicle-related issues Alarms include alarm settings and alarm connection Training includes unknown ventilator model and other training
concerns
0
20
40
60
80
100
120
140
160
EquipmentFailure
VentilatorSettings
SupportActivities
Transport Alarms Training
Nu
mb
er o
f R
epo
rts
Common use-issues related to ventilators at the Veterans Health Administration 2006-2014 (combined)
Source Veterans Health Administration National Center for Patient Safety data collected October 2006 to October 2014
Note Examples of equipment failures include ventilator shutdown and other ventilator problems Ventilator settings include setup problems and
incorrect settings Support activities include space utilities and supplies Transport includes accidental extubation other transportation issues
and vehicle-related issues Alarms include alarm settings and alarm connection Training includes unknown ventilator model and other training
concerns
0
20
40
60
80
100
120
140
160
EquipmentFailure
VentilatorSettings
SupportActivities
Transport Alarms Training
Nu
mb
er o
f R
epo
rts
Importance Beginning with a focus on ventilators the Veterans Health Administrationrsquos
human factors-based Purchasing for Safety Initiative communicates the most common use-
issues associated with medical devices in order to ultimately remove or contain identified
vulnerabilities and prevent further harm
Event Reporting Patient safety managers report events and close calls from more than 150
VA facilities to a national database The largest number of use issues related to ventilators
involved equipment failure and issues such as spontaneous ventilator shutdown compressor
failure and broken or missing parts Other categories of ventilator use issues involved the
physical space where the ventilator was used challenges of transporting patients on
ventilators and problems with ventilator settings and alarms Root cause analyses on reports
are conducted and Patient Safety Alerts are issued to share the learning internally
Other Key Components
Data on ventilator issues from the VA and the Food and Drug Administrationrsquos Medical
Product Safety Network are the basis for a ldquogovernment-industry dayrdquo to work with
manufacturers This information is used to help the device manufacturers better
understand the limits of human use of their products
National Healthcare Quality and Disparities Report | 41
Patient Safety
The VA also trains noncliniciansmdashsuch as biomedical engineers across the
organizationmdashto understand the devices consider the situation for their use and identify
what can go wrong (ldquofailure modesrdquo) in advance
The VA encourages discussions among clinicians about their experience in using devices
In the Applied Patient Safety Challenge hundreds of staff participate in brainstorming
about solutions and strategies for dealing with unexpected scenarios involving devices
National Practitioner Data Bank
Medical malpractice actions are one way to flag potential medical errors
Medical Malpractice Payment Reports are submitted to the National Practitioner Data Bank
by medical malpractice payers
Report of a monetary exchange made for the benefit of a physician dentist or other
health care provider
Result of a settlement or judgment of a written complaint or claim based on that
providerrsquos delivery of or failure to deliver health care services
Number of Medical Malpractice Payment Reports by Setting
Number of Medical Malpractice Payment Reports by health care setting 2004-2014
Source National Practitioner Data Bank (NPDB) Public Use Data File Health Resources and Services Administration Bureau of Health
Professions Division of Practitioner Data Banks 2004-2014
Note Health care setting was not collected by the NPDB for 2104 reports in 2004 ldquoOtherrdquo includes Medical Malpractice Payment Reports
related to unknown settings as well as those for a combination of inpatient and outpatient settings Reports pertain to patients of any age
0
2000
4000
6000
8000
10000
12000
14000
16000
18000
20000
2004 2005 2006 2007 2008 2009 2010 2011 2012 2013 2014
Nu
mb
er o
f R
epo
rts
Total Inpatient Outpatient Other
Number of Medical Malpractice Payment Reports by health care setting 2004-2014
Source National Practitioner Data Bank (NPDB) Public Use Data File Health Resources and Services Administration Bureau of Health
Professions Division of Practitioner Data Banks 2004-2014
Note Health care setting was not collected by the NPDB for 2104 reports in 2004 ldquoOtherrdquo includes Medical Malpractice Payment Reports
related to unknown settings as well as those for a combination of inpatient and outpatient settings Reports pertain to patients of any age
0
2000
4000
6000
8000
10000
12000
14000
16000
18000
20000
2004 2005 2006 2007 2008 2009 2010 2011 2012 2013 2014
Nu
mb
er o
f R
epo
rts
Total Inpatient Outpatient Other
42 | National Healthcare Quality and Disparities Report
Patient Safety
Trends The total number of medical malpractice payment reports (MMPRs) per year
decreased from 17641 in 2004 to 12699 in 2014
Variation Across Reports
Of 157022 MMPRs from 2004 through 2014 more reports related to care in the
outpatient setting (71937) than in the inpatient setting (60391)
Diagnosis-related and treatment-related payments were the most frequent types of
reports each accounting for about 27 of cases Reports of payments for medication-
related cases accounted for only 5 of MMPRs (data not shown)
Number of Medical Malpractice Payment Reports by Allegation and Harm
Number of Medical Malpractice Payment Reports by type of allegation and harm severity 2004-2014
Key Temporary injury = Minor temporary injury and Major temporary injury Permanent significant injury = Significant Permanent Injury
Major Permanent Injury Quadriplegia Brain Damage Lifelong care
Source National Practitioner Data Bank Public Use Data File Health Resources and Services Administration Bureau of Health Professions
Division of Practitioner Data Banks 2004-2014
Note Reports pertain to patients of any age
0
20
40
60
80
100
Treatment(n=42913)
Diagnosis(n=42507)
Surgery(n=36845)
Obstetrics(n=10555)
Medication(n=8287)
Monitoring(n=5329)
Anesthesia(n=4276)
Equipment(n=1161)
BehavioralHealth
(n=879)
Blood(n=379)
EmotionalInjury Only
InsignificantInjury
TemporaryInjury
PermanentMinor Injury
PermanentSignificant Injury
Death Unknown
Number of Medical Malpractice Payment Reports by type of allegation and harm severity 2004-2014
Key Temporary injury = Minor temporary injury and Major temporary injury Permanent significant injury = Significant Permanent Injury
Major Permanent Injury Quadriplegia Brain Damage Lifelong care
Source National Practitioner Data Bank Public Use Data File Health Resources and Services Administration Bureau of Health Professions
Division of Practitioner Data Banks 2004-2014
Note Reports pertain to patients of any age
0
20
40
60
80
100
Treatment(n=42913)
Diagnosis(n=42507)
Surgery(n=36845)
Obstetrics(n=10555)
Medication(n=8287)
Monitoring(n=5329)
Anesthesia(n=4276)
Equipment(n=1161)
BehavioralHealth
(n=879)
Blood(n=379)
EmotionalInjury Only
InsignificantInjury
TemporaryInjury
PermanentMinor Injury
PermanentSignificant Injury
Death Unknown
Overall Percentage From 2004 to 2014 medical malpractice payments were made for
allegations related to
Treatment (42913)
Diagnosis (42507)
Surgery (36845)
Obstetrics (10555)
Medication (8287)
Monitoring (5329)
National Healthcare Quality and Disparities Report | 43
Patient Safety
Anesthesia (4276)
Equipment or products (1161)
Behavioral health (879) and
IV and blood products (379)
Variation Across Reports
Death accounted for more than one-third of harm in payments related to monitoring
(499) diagnosis (393) medication (383) and anesthesia (363) allegations
More than half of all obstetric payments were for allegations of permanent severe harm
(570)
Temporary harm accounted for more than one-third of payments related to equipment
(485) and surgery (360)
Most of the behavioral health-related payments were for emotional harm (457) or
death (338)
References
Agency for Healthcare Research and Quality Making Health Care Safer II An Updated Critical Analysis of the
Evidence for Patient Safety Practices Comparative Effectiveness Review No 211 Rockville MD Agency for
Healthcare Research and Quality March 2013 AHRQ Publication No 13-E001-EF
httpwwwahrqgovsitesdefaultfileswysiwygresearchfindingsevidence-basedshy
reportsservicesqualityptsafetyII-fullpdf
Arriaga AF Lancaster RT Berry RW et al The better colectomy project association of evidence-based best-
practice adherence rates to outcomes in colorectal surgery Ann Surg 2009 Oct250(4)507-13
httpwwwncbinlmnihgovpubmed19734778
Centers for Disease Control and Prevention HAI Prevalence Survey
httpwwwcdcgovHAIsurveillanceindexhtml Last updated March 2016 Accessed March 4 2016
Centers for Disease Control and Prevention Nursing Homes and Assisted Living (Long-Term Care Facilities)
httpwwwcdcgovlongtermcare Last updated September 2015 Accessed March 4 2016
Chassin MR Loeb JM High-reliability health care getting there from here Milbank Q 201391(3)459-90
httpwwwncbinlmnihgovpmcarticlesPMC3790522 Accessed September 23 2015
Chiu Y Bero L Hessol NA et al A literature review of clinical outcomes associated with antipsychotic medication
use in North American nursing home residents Health Policy 2015 Jun119(6)802-813 Epub 2015 Feb 28 PMID
25791166 httpwwwsciencedirectcomsciencearticlepiiS0168851015000652 Accessed June 17 2015
Huybrechts KF Gerhard Crystal S et al Differential risk of death in older residents in nursing homes prescribed
specific antipsychotic drugs Population based cohort study BMJ 2012 Feb 23344e977 PMID 22362541
httpwwwncbinlmnihgovpmcarticlesPMC3285717 Accessed June 17 2015
Institute of Medicine Preventing Medication Errors Quality Chasm Series 2007
httpwwwnapeducatalog11623preventing-medication-errors-quality-chasm-series
National Association for Home Care amp Hospice Basic Statistics About Home Care Updated 2010
httpwwwnahcorgassets1710hc_statspdf Accessed August 31 2015
44 | National Healthcare Quality and Disparities Report
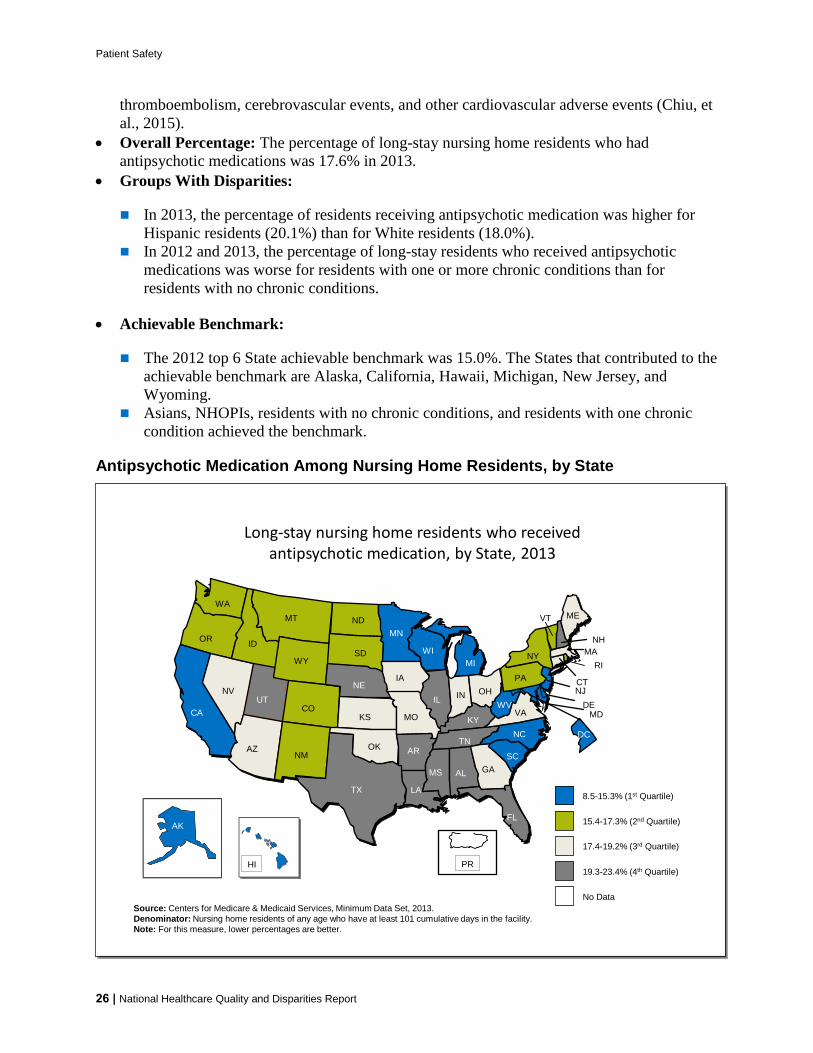
Patient Safety
Overall This map shows overall rankings of States (by quartiles) in the percentage of long-
stay nursing home residents who received antipsychotic medication in 2013 Values ranged
from 85 to 234
Differences by State Interquartile ranges follow
First quartile (lowest) 85-153 (AK CA DC DE HI MD MI MN NJ NC SC
WI WV)
Second quartile (second lowest) 153 -173 (CO ID MT NM NY ND OR PA
RI SD VT WA WY)
Third quartile (second highest) 174-192 (AZ CT GA IN IA KS ME MA MO
NV OH OK VA)
Fourth quartile (highest) 193-234 (AL AR FL IL KY LA MS NE NH TN
TX UT)
Eight of the 12 States in the quartile with the highest percentage of long-stay nursing
home residents who received antipsychotic medication were in the South
Patient Safety in the Home Health Setting
Home health agencies provide services to beneficiaries who are homebound and need skilled
nursing care or therapy
Approximately 12 million individuals receive home health care from more than 33000
providers for causes including acute illness long-term health conditions permanent
disability or terminal illness (NAHCH 2010)
Improvements among home health patients can reflect the quality of care from home health
agencies
Measures include
Home health patients with improvement in surgical wounds
Home health patients with improvements in their ability to take medications orally
National Healthcare Quality and Disparities Report | 27
Patient Safety
Improvement in Surgical Wounds
75
80
85
90
95
100
2010 2011 2012 2013
Pe
rce
nt
White Black Asian Hispanic
75
80
85
90
95
100
2010 2011 2012 2013
Pe
rce
nt
Total 0-64 65-74
75-84 85+
2011 Achievable
Benchmark 913
Home health patients with improvement in surgical wounds by age and raceethnicity 2010-2013
Source Centers for Medicare amp Medicaid Services Outcome and Assessment Information Set 2010-2013
Denominator Number of home health episodes during the measurement period in which the patient of any age had a surgical wound and the
episode ended with the patient discharged from home health care
Note White Black and Asian are non-Hispanic Hispanic includes all races
2011 Achievable
Benchmark 913
75
80
85
90
95
100
2010 2011 2012 2013
Per
cen
t
White Black Asian Hispanic
75
80
85
90
95
100
2010 2011 2012 2013
Per
cen
t
Total 0-64 65-74
75-84 85+
2011 Achievable
Benchmark 913
Home health patients with improvement in surgical wounds by age and raceethnicity 2010-2013
Source Centers for Medicare amp Medicaid Services Outcome and Assessment Information Set 2010-2013
Denominator Number of home health episodes during the measurement period in which the patient of any age had a surgical wound and the
episode ended with the patient discharged from home health care
Note White Black and Asian are non-Hispanic Hispanic includes all races
2011 Achievable
Benchmark 913
Importance Normal wound healing after an operation is an important marker of good care
The home health team should regularly change wound dressing and teach the patient about
wound care
Overall Percentage In 2013 the percentage of home health patients with improvement in
their surgical wounds was 890
Trends The percentage of health home patients with surgical wound improvement increased
between 2010 and 2013
Groups With Disparities
In 2013 compared with residents under age 65 years (856) all other age groups had
better percentages of improvement in surgical wounds The percentage was 893 for
ages 65-74 905 for ages 75-84 and 917 for ages 85 and over
In 2013 compared with Whites (893) Blacks (878) Asians (882) and Hispanics
(874) had worse percentages of improvement in surgical wounds
The 2010 through 2013 trend in the percent of home health patients with surgical wound
improvement did not change for those over age 65 relative to persons under age 65 years
28 | National Healthcare Quality and Disparities Report
Patient Safety
Achievable Benchmark
The 2011 top 5 State achievable benchmark was 913 The States that contributed to the
benchmark are Alabama Mississippi Nevada Oklahoma and South Carolina
Home health patients age 85 years and over achieved the benchmark for surgical wound
improvement in 2013
At the current rate of progress patients ages 75-84 years could reach the benchmark
within a year Patients ages 65-74 years could achieve the benchmark in approximately 2
years
White home health patients could achieve the benchmark in approximately 2 years
Improvement in Ability To Take Medication Orally
0
20
40
60
80
100
2010 2011 2012 2013
Per
cen
t
White Black Asian Hispanic
0
20
40
60
80
100
2010 2011 2012 2013
Per
cen
t
Total 0-64 65-74
75-84 85+
2008 Achievable
Benchmark 516
Home health patients with improvement in their ability to take medications orally by age and raceethnicity 2010-2013
Source Centers for Medicare amp Medicaid Services Outcome and Assessment Information Set 2010-2013
Denominator Number of home health care episodes in which a patient of any age was unable to take oral medications independently at the
start of the episode that ended during the measurement period
Note White Black and Asian are non-Hispanic Hispanic includes all races
2008 Achievable
Benchmark 516
0
20
40
60
80
100
2010 2011 2012 2013
Per
cen
t
White Black Asian Hispanic
0
20
40
60
80
100
2010 2011 2012 2013
Per
cen
t
Total 0-64 65-74
75-84 85+
2008 Achievable
Benchmark 516
Home health patients with improvement in their ability to take medications orally by age and raceethnicity 2010-2013
Source Centers for Medicare amp Medicaid Services Outcome and Assessment Information Set 2010-2013
Denominator Number of home health care episodes in which a patient of any age was unable to take oral medications independently at the
start of the episode that ended during the measurement period
Note White Black and Asian are non-Hispanic Hispanic includes all races
2008 Achievable
Benchmark 516
Importance Taking medications correctly is important to the health status and quality of life
of individuals living in the community The home health team can help teach a patient ways
to organize drugs and take them properly
Overall Percentage In 2013 the percentage of home health patients with improvement in
their ability to take medications orally was 513
Trends Between 2010 and 2013 there was improvement in the overall percentage of home
health patients with improved ability to take medications orally
National Healthcare Quality and Disparities Report | 29
Patient Safety
Groups With Disparities
In 2013 the percentage of home health patients with improvement in their ability to take
medications orally was worse for those age 85 years and over (398) compared with
those under age 65 years (577)
The percentage of patients with improvement in their ability to take medications orally
was worse among Hispanic home health patients (400) than among White patients
(526) in 2013
From 2010 to 2013 the gap between Blacks and Whites decreased and the gap between
Asians and Whites and Hispanics and Whites increased
Achievable Benchmark
The 2008 top 5 State achievable benchmark was 516 The States that contributed to the
achievable benchmark are Iowa Massachusetts New Jersey North Dakota and South
Carolina
The benchmark was achieved among age groups under 85 years and by White and Black
home health patients
The total population is estimated to reach the benchmark in less than a year Hispanic
patients and patients age 85 years and over are farthest from the benchmark
Improvement in Ability To Take Medication Orally by State
Home health patients with improvement in their ability to take medications orally by raceethnicity by State 2013
Source Centers for Medicare amp Medicaid Services Outcome and Assessment Information Set 2013
Denominator Number of home health care episodes in which a patient of any age was unable to take oral medications independently at the
start of the episode that ended during the measurement period
AZ
CA
UT
CT
FL
GA
IA
IL
KS
MA
MDMO
NJ
NY
OR
PA
SC
TN
CO
WA
WI
VA
ME
MN
MI
NC
TX
KY
WV
RI
NE
VT
NV OH
SD
AR
IN
NH
MT
ID
WY
ND
NMOK
LA
MS AL
DE
AKAK
HI
No significant difference between rates
of Hispanics and non-Hispanic Whites
Non-Hispanic Whites have significantly
worse rate than Hispanics
States do not have data that meet the
criteria for statistical reliability data
quality or confidentiality
Hispanics have significantly worse rate
than non-Hispanic Whites
DC
Home health patients with improvement in their ability to take medications orally by raceethnicity by State 2013
Source Centers for Medicare amp Medicaid Services Outcome and Assessment Information Set 2013
Denominator Number of home health care episodes in which a patient of any age was unable to take oral medications independently at the
start of the episode that ended during the measurement period
AZ
CA
UT
CT
FL
GA
IA
IL
KS
MA
MDMO
NJ
NY
OR
PA
SC
TN
CO
WA
WI
VA
ME
MN
MI
NC
TX
KY
WV
RI
NE
VT
NV OH
SD
AR
IN
NH
MT
ID
WY
ND
NMOK
LA
MS AL
DE
AKAK
HI
No significant difference between rates
of Hispanics and non-Hispanic Whites
Non-Hispanic Whites have significantly
worse rate than Hispanics
States do not have data that meet the
criteria for statistical reliability data
quality or confidentiality
Hispanics have significantly worse rate
than non-Hispanic Whites
DC
30 | National Healthcare Quality and Disparities Report
Patient Safety
Geographic Variation
In 2013 Hispanic home health patients had worse rates of improvement in taking oral
medications than non-Hispanic White patients in 11 States (Arizona California
Connecticut Florida Illinois Indiana Massachusetts Nevada New York North
Carolina and Texas
Non-Hispanic White patients had worse rates of improvement than Hispanic patients in
five States (Hawaii Idaho Iowa Michigan and Pennsylvania)
Patient Safety in the Ambulatory Setting
Although patient safety initiatives frequently focus on inpatient hospital events adverse
effects of medical care may be identified and treated in outpatient settings
Adverse effects of medical care can follow care or procedures in hospitals emergency
departments physician offices or other settings
Measures include
Patient safety and quality issues by frequency of occurrence in outpatient medical offices
Adults age 65 years and over who received potentially inappropriate prescription medications during the calendar year
Percentage of hemodialysis patients with vascular catheter in use for 90 days or longer
For more information see the PSNet link to Patient Safety Primer Patient Safety in
Ambulatory Care httpspsnetahrqgovprimersprimer16patient-safety-in-ambulatory-care
National Healthcare Quality and Disparities Report | 31
Patient Safety
Patient Safety and Quality Issues
Patient safety and quality issues by frequency of occurrence in outpatient medical offices 2014
Source Westat analysis of the AHRQ 2014 Medical Office Survey on Patient Safety Culture Comparative Database (N=935)
Note For this measure less frequent occurrences during the year are better
0
20
40
60
80
100
A pharmacy contactedour office to clarify orcorrect a prescription
A patient was unableto get an appointmentwithin 48 hours for anacuteserious problem
A patients medicationlist was not updatedduring his or her visit
The results from a labor imaging test were notavailable when needed
A patients chartmedicalrecord was not available
when needed
Occurred DailyWeekly
Occurred Monthly
Occurred Not at All to Several Times Over the Past Year
Patient safety and quality issues by frequency of occurrence in outpatient medical offices 2014
Source Westat analysis of the AHRQ 2014 Medical Office Survey on Patient Safety Culture Comparative Database (N=935)
Note For this measure less frequent occurrences during the year are better
0
20
40
60
80
100
A pharmacy contactedour office to clarify orcorrect a prescription
A patient was unableto get an appointmentwithin 48 hours for anacuteserious problem
A patients medicationlist was not updatedduring his or her visit
The results from a labor imaging test were notavailable when needed
A patients chartmedicalrecord was not available
when needed
Occurred DailyWeekly
Occurred Monthly
Occurred Not at All to Several Times Over the Past Year
Importance Most health care takes place in the outpatient or ambulatory care setting Lack
of access to care and lack of access to timely and accurate medical information and test
results may contribute to patient safety events such as missed or delayed diagnoses
medication errors failure to order appropriate diagnostic or laboratory tests incorrect
interpretation of tests and inadequate followup on results
Overall Percentage
Almost 30 of medical offices participating in the survey reported daily or weekly
occurrences of being contacted by the pharmacist for clarification or correction on a
prescription
After prescription clarifications or corrections by the pharmacy medical offices were
next most likely to report daily or weekly issues with patients being unable to get an
appointment within 48 hours for an acute or serious problem (14) or the patientrsquos
medication list not getting updated during their visit (11)
The share of medical offices reporting that lab or imaging tests were not available when
needed reached nearly 20 when considering monthly occurrences as well as those that
occurred more frequently
32 | National Healthcare Quality and Disparities Report
Patient Safety
Potentially Inappropriate Prescriptions for Older Adults
Adults age 65 years and over who received potentially inappropriate prescription medications during the calendar year by sex and
perceived health status 2003ndash2013
Source Agency for Healthcare Research and Quality Medical Expenditure Panel Survey 2003-2013
Note For this measure lower percentages are better Prescription medications received include all prescribed medications initiall y purchased
or otherwise obtained as well as any refills For more information on inappropriate medications see the American Geriatrics Society 2012 Beers
Criteria Update Expert Panel American Geriatrics Society updated Beers Criteria for potentially inappropriate medication use in older adults J
Am Geriatr Soc 2012 Apr60(4)616-31
0
5
10
15
20
25
30
Per
cen
t
Total Male Female
0
5
10
15
20
25
30
Per
cen
t
ExcellentVery GoodGood FairPoor
Adults age 65 years and over who received potentially inappropriate prescription medications during the calendar year by sex and
perceived health status 2003ndash2013
Source Agency for Healthcare Research and Quality Medical Expenditure Panel Survey 2003-2013
Note For this measure lower percentages are better Prescription medications received include all prescribed medications initially purchased
or otherwise obtained as well as any refills For more information on inappropriate medications see the American Geriatrics Society 2012 Beers
Criteria Update Expert Panel American Geriatrics Society updated Beers Criteria for potentially inappropriate medication use in older adults J
Am Geriatr Soc 2012 Apr60(4)616-31
0
5
10
15
20
25
30
Per
cen
t
Total Male Female
0
5
10
15
20
25
30
Per
cen
t
ExcellentVery GoodGood FairPoor
Importance Some drugs that are prescribed for older patients are known to be potentially
harmful for this age group
Overall Percentage In 2013 the percentage of adults age 65 years and over who received
potentially inappropriate prescription medications was 114
Trends From 2003 to 2013 the percentage of adults age 65 years and over who received
potentially inappropriate prescription medications improved overall for both sexes and for
people with excellentvery goodgood health status and people with fairpoor health status
Groups With Disparities
In all years the percentage of patients receiving potentially inappropriate medications
was higher among females compared with males This gap was not changing over time
In all years from 2003 to 2013 the percentage of patients receiving potentially
inappropriate medications was higher among people with fairpoor health status
compared with people with excellentgood health status This gap was not changing over
time
National Healthcare Quality and Disparities Report | 33
Patient Safety
Long-Term Catheter Use in Dialysis Patients
HI
AKAK
AZ
CA
UT
CT
FL
GA
IA
IL
KS
MA
MDMO
NJ
NY
OR
PA
SC
TN
CO
WA
WI
VA
ME
MN
MI
NC
TX
KY
WV
RI
NE
VT
NV OH
SD
AR
IN
NH
MT
ID
WY
ND
NMOK
LA
MSAL
DE
DC
10-12
13-18
7-9
PR
Source Centers for Medicare and Medicaid Services Dialysis Facility Compare 2014
Denominator At-risk adult Medicare patients with a central venous catheter who were receiving regular hemodialysis treatments at dialysis
facilities
Note For this measure lower percentages are better
Percentage of hemodialysis patients with central venous catheters used for vascular access for 90 days or longer by State 2014
HI
AKAK
AZ
CA
UT
CT
FL
GA
IA
IL
KS
MA
MDMO
NJ
NY
OR
PA
SC
TN
CO
WA
WI
VA
ME
MN
MI
NC
TX
KY
WV
RI
NE
VT
NV OH
SD
AR
IN
NH
MT
ID
WY
ND
NMOK
LA
MSAL
DE
DC
10-12
13-18
7-9
PR
Source Centers for Medicare and Medicaid Services Dialysis Facility Compare 2014
Denominator At-risk adult Medicare patients with a central venous catheter who were receiving regular hemodialysis treatments at dialysis
facilities
Note For this measure lower percentages are better
Percentage of hemodialysis patients with central venous catheters used for vascular access for 90 days or longer by State 2014
Importance Central venous catheters are frequently used for vascular access to dialysis
patients until a fistula or graft is formed Central venous catheters have higher rates of
infection and adverse events among patients receiving dialysis treatment compared with
other forms of vascular access To decrease the likelihood of adverse events catheters should
be used for less than 90 days
Overall Percentage Nationally an average of 10 of dialysis patients used central venous
catheters for 90 days or longer in 2014
Geographic Variation In 2014 Alabama and Kansas had the lowest percentages of dialysis
patients using central venous catheters for 90 days or longer (7) and Puerto Rico had the
highest percentage (18) of long-term catheter use
Patient Safety Infrastructure
Efforts to improve patient safety have been accompanied by various infrastructure
enhancements
Growth in patient safety organizations which assist providers in detecting and reducing
risks and hazards from care delivery that may lead to patient harm
System improvement initiatives at the Veterans Health Administration (VHA)
34 | National Healthcare Quality and Disparities Report
Patient Safety
Development of the National Practitioner Data Bank a clearinghouse for information on
medical malpractice payments
Patient Safety Organizations
Patient safety organizations (PSOs) aim to reduce preventable adverse events near misses
and unsafe conditions in all health care settings
PSOs provide an environment for health care providers to voluntarily report discuss and
learn from patient safety events and quality analyses on a privileged and confidential basis
Measures include
Number of PSOs serving each State
Variation in concentrations of compounded liquid medications for children
Patient Safety Organizations AHRQ Common Formats
AHRQ Common Formats provide a standardized method for PSOs health care providers
and other organizations to collect and report patient safety events
Data element standards are important for aggregating and analyzing events across
providers
AHRQ Common Formats have been developed for a variety of settings of care
Acute care hospitals
Skilled nursing facilities
Retail pharmacy
More information is available at httpspsoahrqgovcommon
National Healthcare Quality and Disparities Report | 35
Patient Safety
Number of Patient Safety Organizations
AZ (2)
CA (3)
UT (2)
CT(3)
FL (8)
GA (5)
IA (4)
IL (7)
KS (5)
MA(3)
MD (4)MO(2)
NJ(3)
NY (5)
OR (3)
PA (5)
SC (4)
TN (5)
CO (2)
WA (2)
WI (5)
VA (7)
ME(2)
MN(3)
MI (3)
NC (7)
TX (6)
KY (4)WV (3)
RI(2)
NE (2)
VT(2)
NV (2)
OH (2)
SD (1)
AR (4)
IN (2)
NH(2)
MT (2)
ID (3)
WY (2)
ND (1)
NM (3)OK (2)
LA (1)
MS (2)
AL (2)
DE(2)
HI (2)
AKAK (2)
DC(3)
PR (0)
1-2
3-4
5-6
7-8
Number of PSOs
excluding PSOs
operating nationally
Number of Patient Safety Organizations by area served 2014
Source Agency for Healthcare Research and Quality Patient Safety Organization Information Form Calendar Year 2014 and PSO-PPC
Contact Database
Note PSOs included in this map were AHRQ-listed during any part of 2014 and submitted the PSO Profile to the PSO Privacy Protection
Center (PSO-PPC) in early 2015 A PSO may have members in one or more States regardless of headquarters location Each State shows the
number of PSOs that serve that State map excludes 38 PSOs that are available to providers in all States
AZ (2)
CA (3)
UT (2)
CT(3)
FL (8)
GA (5)
IA (4)
IL (7)
KS (5)
MA(3)
MD (4)MO(2)
NJ(3)
NY (5)
OR (3)
PA (5)
SC (4)
TN (5)
CO (2)
WA (2)
WI (5)
VA (7)
ME(2)
MN(3)
MI (3)
NC (7)
TX (6)
KY (4)WV (3)
RI(2)
NE (2)
VT(2)
NV (2)
OH (2)
SD (1)
AR (4)
IN (2)
NH(2)
MT (2)
ID (3)
WY (2)
ND (1)
NM (3)OK (2)
LA (1)
MS (2)
AL (2)
DE(2)
HI (2)
AKAK (2)
DC(3)
PR (0)
1-2
3-4
5-6
7-8
Number of PSOs
excluding PSOs
operating nationally
Number of Patient Safety Organizations by area served 2014
Source Agency for Healthcare Research and Quality Patient Safety Organization Information Form Calendar Year 2014 and PSO-PPC
Contact Database
Note PSOs included in this map were AHRQ-listed during any part of 2014 and submitted the PSO Profile to the PSO Privacy Protection
Center (PSO-PPC) in early 2015 A PSO may have members in one or more States regardless of headquarters location Each State shows the
number of PSOs that serve that State map excludes 38 PSOs that are available to providers in all States
Importance All patient safety organizations (PSOs) have authority to operate in all 50
States and US territories but not all do In 2014 38 PSOs self-reported being available to
providers nationally PSOs not available nationally serve specific States
Geographic Variation
Nearly all States have at least 2 PSOs available to providers in their State in addition to
the 38 national PSOs that serve all States
Florida has the most PSOs available with 8 in addition to the 38 nationally available
PSOs The States with the largest number of PSOs available are generally on the East
Coast (eg North Carolina Virginia New York Pennsylvania Tennessee Georgia) or
have large populations (eg Texas Illinois)
North Dakota South Dakota and Louisiana are the only states with just one PSO serving
their State in addition to the 38 national PSOs
Puerto Rico is served by one national PSO only
36 | National Healthcare Quality and Disparities Report
Patient Safety
Compounded Liquid Medications for Children
Compounded liquid medications for children in Michigan 2012
Source Levy S Buckley B Safe Table Success The MI Pediatric Safety Collaboration Presentation presented at the 7th Annual
Meeting of Patient Safety Organizations (PSOs) Rockville MD 2015 April and Rood JM Engels MJ Ciarkowski SL et al Variability in
compounding of oral liquids for pediatric patients a patient safety concern J Am Pharm Assn 201454(4)383-9
Note Information represents 244 responses to online survey of approximately 2000 Michigan pharmacies conducted in June 2012 by
The University of Michigan College of Pharmacy in collaboration with the Michigan Pharmacists Association
0
10
20
30
40
50
1 2 3 4 5 6 7 8 9
Nu
mb
er o
f D
rugs
Number of Unique Concentrations
Number of Different Compounded Concentrations per Drug
0
10
20
30
40
50
No Harm No Harm ButMonitoring
TemporaryHarm
Pe
rce
nt
Compounding Errors by Related Harm and Pharmacy Setting
Inpatient Outpatient
Compounded liquid medications for children in Michigan 2012
Source Levy S Buckley B Safe Table Success The MI Pediatric Safety Collaboration Presentation presented at the 7th Annual
Meeting of Patient Safety Organizations (PSOs) Rockville MD 2015 April and Rood JM Engels MJ Ciarkowski SL et al Variability in
compounding of oral liquids for pediatric patients a patient safety concern J Am Pharm Assn 201454(4)383-9
Note Information represents 244 responses to online survey of approximately 2000 Michigan pharmacies conducted in June 2012 by
The University of Michigan College of Pharmacy in collaboration with the Michigan Pharmacists Association
0
10
20
30
40
50
1 2 3 4 5 6 7 8 9
Nu
mb
er o
f D
rugs
Number of Unique Concentrations
Number of Different Compounded Concentrations per Drug
0
10
20
30
40
50
No Harm No Harm ButMonitoring
TemporaryHarm
Per
cen
t
Compounding Errors by Related Harm and Pharmacy Setting
Inpatient Outpatient
Importance
Liquid medications are widely used in pediatrics because many children find it difficult
to swallow tablets or capsules If not commercially manufactured these liquid
medications require a pharmacist to compound them to the correct dosage for the patient
This practice of compounding has led to a variety of medication concentrations in use In
the absence of standard concentrations for compounded medications there is a risk that
children may accidentally receive medications that are too potent and can be dangerous
or are too weak to be effective
The Michigan Health amp Hospital Association Keystone Center Patient Safety
Organization hosts five Pediatric Safe Tables each year Safe Tables provided a
confidential and legally protected environment to discuss challenges and improvement
strategies regarding inconsistent medication concentrations for compounded oral liquids
without fear of punitive action against them
National Healthcare Quality and Disparities Report | 37
Patient Safety
Overall Percentage
More than half (527) of drugs identified in the 2012 survey had 3 or more unique
concentrations dispensed to children across Michigan For example Rifampin used to
treat bacterial infections was reported to have 8 different concentrations dispensed to
patients
Nearly one-third (313) of reported errors caused temporary harm or required additional
monitoring despite no harm
Standardization of Compounded Liquid Medications
Source Michigan Health amp Hospital Association Keystone Center Patient Safety Organization and University of Michigan College of Pharmacy
State-Wide Initiative to Standardize the Compounding of Oral Liquids in Pediatrics
Standardization of compounded liquid medications for children in Michigan 2011
Issue identificationbull Hospitals attending PSO Pediatrics Safe
Table raise compounded medication concentrations as a major safety issue
bull Small focus group determines extent of problem
bull Michigan pharmacies are surveyed about baseline concentrations
Develop Interventionbull PSO Quarterly Safe Tables are held to
discuss cases and practicesbull Team develops recommendations for
standard concentrationsbull Consensus is achieved for frequently
compounded pediatric medications 470 formulations for 147 drug entities are reduced to 104 concentrations for 100 drugs
Practice changebull Toolkit is createdbull Standards are disseminated to Michigan
prescribers and pharmacies bull Standards are disseminated to PSO
members and Safe Table participants
Source Michigan Health amp Hospital Association Keystone Center Patient Safety Organization and University of Michigan College of Pharmacy
State-Wide Initiative to Standardize the Compounding of Oral Liquids in Pediatrics
Standardization of compounded liquid medications for children in Michigan 2011
Issue identificationbull Hospitals attending PSO Pediatrics Safe
Table raise compounded medication concentrations as a major safety issue
bull Small focus group determines extent of problem
bull Michigan pharmacies are surveyed about baseline concentrations
Develop Interventionbull PSO Quarterly Safe Tables are held to
discuss cases and practicesbull Team develops recommendations for
standard concentrationsbull Consensus is achieved for frequently
compounded pediatric medications 470 formulations for 147 drug entities are reduced to 104 concentrations for 100 drugs
Practice changebull Toolkit is createdbull Standards are disseminated to Michigan
prescribers and pharmacies bull Standards are disseminated to PSO
members and Safe Table participants
The Role of PSO Safe Tables Based on adverse medication events discussed in the
Michigan Health amp Hospital Association (MHA) Keystone Center Patient Safety
Organization (PSO) Safe Tables in July 2011 the Michigan Pediatric Safety Collaboration
was developed to further assess the scope of the problem and formulate a solution
The Collaborative The Michigan Pediatric Safety Collaboration includes individuals from
the University of Michigan College of Pharmacy the Michigan Pharmacists Association
(MPA) the Food and Drug Administration (FDA) and the MHA Keystone PSO
38 | National Healthcare Quality and Disparities Report
Patient Safety
Practice Change
As a result of the standardization effort 470 unique formulations for 147 drug entities
were reduced to 104 different concentrations for 100 drugs
The Michigan Pediatric Safety Collaboration developed a multistep process to implement
standards for compounding medications The MPA surveyed pharmacies in Michigan to
better define the nature and scope of the problem The PSO continued to act as convener
The result was the creation and dissemination of statewide standards for 120 frequently
compounded pediatric medications
Veterans Health Administration
The National Center for Patient Safety is part of the Veterans Health Administration the
Nationrsquos largest integrated health care system
Patient safety-related system improvement initiatives include
The Daily Planreg
Purchasing for Safety Initiative
Patient Safety Improvement Initiative
Patient safety improvement initiative The Daily Planreg at Veterans Affairs Medical Centers 2009
Source King BJ Mills PD Fore A et al The Daily Planreg including patients for safetys sake Nurs Manage 201243(3)15-8
0
10
20
30
40
50
Identified atleast one
error
Identifiederror
of omission
Identifiederror
ofcommission
Nurses Who Identified Errors in Patient Treatment Plan by Type
0
10
20
30
40
50
Patient founddiscrepancy inplanned care
Family founddiscrepancy inplanned care
Nursing Stafffound
discrepancyin plannedtreatment
Respondents Who Identified Errors or Discrepancies Through The Daily Plan reg
Patient safety improvement initiative The Daily Planreg at Veterans Affairs Medical Centers 2009
Source King BJ Mills PD Fore A et al The Daily Planreg including patients for safetys sake Nurs Manage 201243(3)15-8
0
10
20
30
40
50
Identified atleast one
error
Identifiederror
of omission
Identifiederror
ofcommission
Nurses Who Identified Errors in Patient Treatment Plan by Type
0
10
20
30
40
50
Patient founddiscrepancy inplanned care
Family founddiscrepancy inplanned care
Nursing Stafffound
discrepancyin plannedtreatment
Respondents Who Identified Errors or Discrepancies Through The Daily Plan reg
National Healthcare Quality and Disparities Report | 39
Patient Safety
Importance The Daily Planreg
is a two-page printed summary that acts as a schedule for
patients and providers each day It shows the procedures laboratory tests and medications
scheduled for that day and lists essential health information such as patientrsquos name allergies
and current medications It can be tailored for a patientrsquos needs by extracting orders from the
electronic medical record (EMR) The Daily Planreg
is intended to facilitate patient and family
engagement throughout the course of care The Daily Planreg
shows promise for improving
patient safety Since 2009 the VA has implemented The Daily Planreg
in more than 65
hospitals both inpatient and outpatient care settings The Daily Planreg
is shared more than
75000 times a month and the VA plans to continue the spread of The Daily Planreg
at
additional sites in 2016
Findings
As part of a pilot test in 2009 a total of 198 patients and 85 nurses responded to a survey
across 10 facilities Nurses had an average of 34 patients per shift who received The
Daily Planreg Patients responded about their own experiences whereas nurses reported
about all of their patients who received The Daily Planreg
Nearly half (475) of patients reported finding a discrepancy in planned care through
The Daily Planreg In addition 30 of patients reported that their family members found a
discrepancy Although not every discrepancy will be a potential medical error having a
shared understanding of the plan of care decreases the risk of error
More than one in six nurses (176) identified a discrepancy in treatment among their
patients through The Daily Planreg Most of these nurses (153) found one or more errors
of omission and a smaller share (106) of nurses found one or more errors of
commission some found both
40 | National Healthcare Quality and Disparities Report
Patient Safety
Issues Related to Ventilators
Common use-issues related to ventilators at the Veterans Health Administration 2006-2014 (combined)
Source Veterans Health Administration National Center for Patient Safety data collected October 2006 to October 2014
Note Examples of equipment failures include ventilator shutdown and other ventilator problems Ventilator settings include setup problems and
incorrect settings Support activities include space utilities and supplies Transport includes accidental extubation other transportation issues
and vehicle-related issues Alarms include alarm settings and alarm connection Training includes unknown ventilator model and other training
concerns
0
20
40
60
80
100
120
140
160
EquipmentFailure
VentilatorSettings
SupportActivities
Transport Alarms Training
Nu
mb
er o
f R
epo
rts
Common use-issues related to ventilators at the Veterans Health Administration 2006-2014 (combined)
Source Veterans Health Administration National Center for Patient Safety data collected October 2006 to October 2014
Note Examples of equipment failures include ventilator shutdown and other ventilator problems Ventilator settings include setup problems and
incorrect settings Support activities include space utilities and supplies Transport includes accidental extubation other transportation issues
and vehicle-related issues Alarms include alarm settings and alarm connection Training includes unknown ventilator model and other training
concerns
0
20
40
60
80
100
120
140
160
EquipmentFailure
VentilatorSettings
SupportActivities
Transport Alarms Training
Nu
mb
er o
f R
epo
rts
Importance Beginning with a focus on ventilators the Veterans Health Administrationrsquos
human factors-based Purchasing for Safety Initiative communicates the most common use-
issues associated with medical devices in order to ultimately remove or contain identified
vulnerabilities and prevent further harm
Event Reporting Patient safety managers report events and close calls from more than 150
VA facilities to a national database The largest number of use issues related to ventilators
involved equipment failure and issues such as spontaneous ventilator shutdown compressor
failure and broken or missing parts Other categories of ventilator use issues involved the
physical space where the ventilator was used challenges of transporting patients on
ventilators and problems with ventilator settings and alarms Root cause analyses on reports
are conducted and Patient Safety Alerts are issued to share the learning internally
Other Key Components
Data on ventilator issues from the VA and the Food and Drug Administrationrsquos Medical
Product Safety Network are the basis for a ldquogovernment-industry dayrdquo to work with
manufacturers This information is used to help the device manufacturers better
understand the limits of human use of their products
National Healthcare Quality and Disparities Report | 41
Patient Safety
The VA also trains noncliniciansmdashsuch as biomedical engineers across the
organizationmdashto understand the devices consider the situation for their use and identify
what can go wrong (ldquofailure modesrdquo) in advance
The VA encourages discussions among clinicians about their experience in using devices
In the Applied Patient Safety Challenge hundreds of staff participate in brainstorming
about solutions and strategies for dealing with unexpected scenarios involving devices
National Practitioner Data Bank
Medical malpractice actions are one way to flag potential medical errors
Medical Malpractice Payment Reports are submitted to the National Practitioner Data Bank
by medical malpractice payers
Report of a monetary exchange made for the benefit of a physician dentist or other
health care provider
Result of a settlement or judgment of a written complaint or claim based on that
providerrsquos delivery of or failure to deliver health care services
Number of Medical Malpractice Payment Reports by Setting
Number of Medical Malpractice Payment Reports by health care setting 2004-2014
Source National Practitioner Data Bank (NPDB) Public Use Data File Health Resources and Services Administration Bureau of Health
Professions Division of Practitioner Data Banks 2004-2014
Note Health care setting was not collected by the NPDB for 2104 reports in 2004 ldquoOtherrdquo includes Medical Malpractice Payment Reports
related to unknown settings as well as those for a combination of inpatient and outpatient settings Reports pertain to patients of any age
0
2000
4000
6000
8000
10000
12000
14000
16000
18000
20000
2004 2005 2006 2007 2008 2009 2010 2011 2012 2013 2014
Nu
mb
er o
f R
epo
rts
Total Inpatient Outpatient Other
Number of Medical Malpractice Payment Reports by health care setting 2004-2014
Source National Practitioner Data Bank (NPDB) Public Use Data File Health Resources and Services Administration Bureau of Health
Professions Division of Practitioner Data Banks 2004-2014
Note Health care setting was not collected by the NPDB for 2104 reports in 2004 ldquoOtherrdquo includes Medical Malpractice Payment Reports
related to unknown settings as well as those for a combination of inpatient and outpatient settings Reports pertain to patients of any age
0
2000
4000
6000
8000
10000
12000
14000
16000
18000
20000
2004 2005 2006 2007 2008 2009 2010 2011 2012 2013 2014
Nu
mb
er o
f R
epo
rts
Total Inpatient Outpatient Other
42 | National Healthcare Quality and Disparities Report
Patient Safety
Trends The total number of medical malpractice payment reports (MMPRs) per year
decreased from 17641 in 2004 to 12699 in 2014
Variation Across Reports
Of 157022 MMPRs from 2004 through 2014 more reports related to care in the
outpatient setting (71937) than in the inpatient setting (60391)
Diagnosis-related and treatment-related payments were the most frequent types of
reports each accounting for about 27 of cases Reports of payments for medication-
related cases accounted for only 5 of MMPRs (data not shown)
Number of Medical Malpractice Payment Reports by Allegation and Harm
Number of Medical Malpractice Payment Reports by type of allegation and harm severity 2004-2014
Key Temporary injury = Minor temporary injury and Major temporary injury Permanent significant injury = Significant Permanent Injury
Major Permanent Injury Quadriplegia Brain Damage Lifelong care
Source National Practitioner Data Bank Public Use Data File Health Resources and Services Administration Bureau of Health Professions
Division of Practitioner Data Banks 2004-2014
Note Reports pertain to patients of any age
0
20
40
60
80
100
Treatment(n=42913)
Diagnosis(n=42507)
Surgery(n=36845)
Obstetrics(n=10555)
Medication(n=8287)
Monitoring(n=5329)
Anesthesia(n=4276)
Equipment(n=1161)
BehavioralHealth
(n=879)
Blood(n=379)
EmotionalInjury Only
InsignificantInjury
TemporaryInjury
PermanentMinor Injury
PermanentSignificant Injury
Death Unknown
Number of Medical Malpractice Payment Reports by type of allegation and harm severity 2004-2014
Key Temporary injury = Minor temporary injury and Major temporary injury Permanent significant injury = Significant Permanent Injury
Major Permanent Injury Quadriplegia Brain Damage Lifelong care
Source National Practitioner Data Bank Public Use Data File Health Resources and Services Administration Bureau of Health Professions
Division of Practitioner Data Banks 2004-2014
Note Reports pertain to patients of any age
0
20
40
60
80
100
Treatment(n=42913)
Diagnosis(n=42507)
Surgery(n=36845)
Obstetrics(n=10555)
Medication(n=8287)
Monitoring(n=5329)
Anesthesia(n=4276)
Equipment(n=1161)
BehavioralHealth
(n=879)
Blood(n=379)
EmotionalInjury Only
InsignificantInjury
TemporaryInjury
PermanentMinor Injury
PermanentSignificant Injury
Death Unknown
Overall Percentage From 2004 to 2014 medical malpractice payments were made for
allegations related to
Treatment (42913)
Diagnosis (42507)
Surgery (36845)
Obstetrics (10555)
Medication (8287)
Monitoring (5329)
National Healthcare Quality and Disparities Report | 43
Patient Safety
Anesthesia (4276)
Equipment or products (1161)
Behavioral health (879) and
IV and blood products (379)
Variation Across Reports
Death accounted for more than one-third of harm in payments related to monitoring
(499) diagnosis (393) medication (383) and anesthesia (363) allegations
More than half of all obstetric payments were for allegations of permanent severe harm
(570)
Temporary harm accounted for more than one-third of payments related to equipment
(485) and surgery (360)
Most of the behavioral health-related payments were for emotional harm (457) or
death (338)
References
Agency for Healthcare Research and Quality Making Health Care Safer II An Updated Critical Analysis of the
Evidence for Patient Safety Practices Comparative Effectiveness Review No 211 Rockville MD Agency for
Healthcare Research and Quality March 2013 AHRQ Publication No 13-E001-EF
httpwwwahrqgovsitesdefaultfileswysiwygresearchfindingsevidence-basedshy
reportsservicesqualityptsafetyII-fullpdf
Arriaga AF Lancaster RT Berry RW et al The better colectomy project association of evidence-based best-
practice adherence rates to outcomes in colorectal surgery Ann Surg 2009 Oct250(4)507-13
httpwwwncbinlmnihgovpubmed19734778
Centers for Disease Control and Prevention HAI Prevalence Survey
httpwwwcdcgovHAIsurveillanceindexhtml Last updated March 2016 Accessed March 4 2016
Centers for Disease Control and Prevention Nursing Homes and Assisted Living (Long-Term Care Facilities)
httpwwwcdcgovlongtermcare Last updated September 2015 Accessed March 4 2016
Chassin MR Loeb JM High-reliability health care getting there from here Milbank Q 201391(3)459-90
httpwwwncbinlmnihgovpmcarticlesPMC3790522 Accessed September 23 2015
Chiu Y Bero L Hessol NA et al A literature review of clinical outcomes associated with antipsychotic medication
use in North American nursing home residents Health Policy 2015 Jun119(6)802-813 Epub 2015 Feb 28 PMID
25791166 httpwwwsciencedirectcomsciencearticlepiiS0168851015000652 Accessed June 17 2015
Huybrechts KF Gerhard Crystal S et al Differential risk of death in older residents in nursing homes prescribed
specific antipsychotic drugs Population based cohort study BMJ 2012 Feb 23344e977 PMID 22362541
httpwwwncbinlmnihgovpmcarticlesPMC3285717 Accessed June 17 2015
Institute of Medicine Preventing Medication Errors Quality Chasm Series 2007
httpwwwnapeducatalog11623preventing-medication-errors-quality-chasm-series
National Association for Home Care amp Hospice Basic Statistics About Home Care Updated 2010
httpwwwnahcorgassets1710hc_statspdf Accessed August 31 2015
44 | National Healthcare Quality and Disparities Report
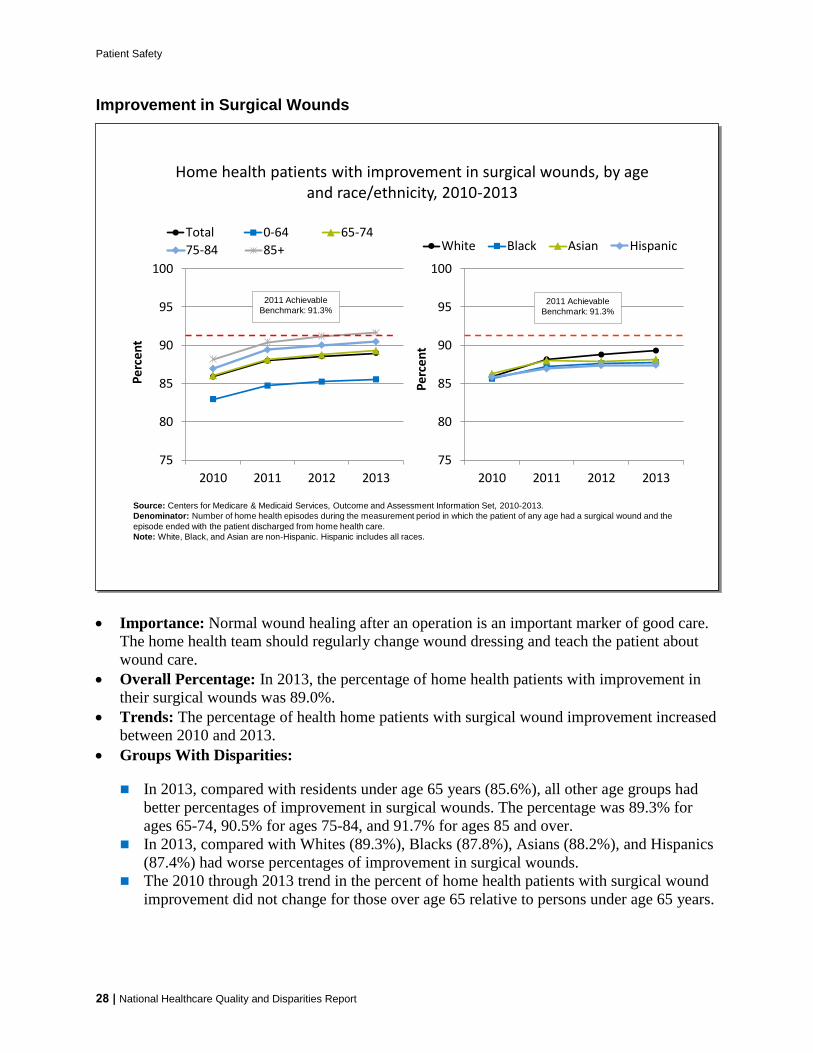
Patient Safety
Improvement in Surgical Wounds
75
80
85
90
95
100
2010 2011 2012 2013
Pe
rce
nt
White Black Asian Hispanic
75
80
85
90
95
100
2010 2011 2012 2013
Pe
rce
nt
Total 0-64 65-74
75-84 85+
2011 Achievable
Benchmark 913
Home health patients with improvement in surgical wounds by age and raceethnicity 2010-2013
Source Centers for Medicare amp Medicaid Services Outcome and Assessment Information Set 2010-2013
Denominator Number of home health episodes during the measurement period in which the patient of any age had a surgical wound and the
episode ended with the patient discharged from home health care
Note White Black and Asian are non-Hispanic Hispanic includes all races
2011 Achievable
Benchmark 913
75
80
85
90
95
100
2010 2011 2012 2013
Per
cen
t
White Black Asian Hispanic
75
80
85
90
95
100
2010 2011 2012 2013
Per
cen
t
Total 0-64 65-74
75-84 85+
2011 Achievable
Benchmark 913
Home health patients with improvement in surgical wounds by age and raceethnicity 2010-2013
Source Centers for Medicare amp Medicaid Services Outcome and Assessment Information Set 2010-2013
Denominator Number of home health episodes during the measurement period in which the patient of any age had a surgical wound and the
episode ended with the patient discharged from home health care
Note White Black and Asian are non-Hispanic Hispanic includes all races
2011 Achievable
Benchmark 913
Importance Normal wound healing after an operation is an important marker of good care
The home health team should regularly change wound dressing and teach the patient about
wound care
Overall Percentage In 2013 the percentage of home health patients with improvement in
their surgical wounds was 890
Trends The percentage of health home patients with surgical wound improvement increased
between 2010 and 2013
Groups With Disparities
In 2013 compared with residents under age 65 years (856) all other age groups had
better percentages of improvement in surgical wounds The percentage was 893 for
ages 65-74 905 for ages 75-84 and 917 for ages 85 and over
In 2013 compared with Whites (893) Blacks (878) Asians (882) and Hispanics
(874) had worse percentages of improvement in surgical wounds
The 2010 through 2013 trend in the percent of home health patients with surgical wound
improvement did not change for those over age 65 relative to persons under age 65 years
28 | National Healthcare Quality and Disparities Report
Patient Safety
Achievable Benchmark
The 2011 top 5 State achievable benchmark was 913 The States that contributed to the
benchmark are Alabama Mississippi Nevada Oklahoma and South Carolina
Home health patients age 85 years and over achieved the benchmark for surgical wound
improvement in 2013
At the current rate of progress patients ages 75-84 years could reach the benchmark
within a year Patients ages 65-74 years could achieve the benchmark in approximately 2
years
White home health patients could achieve the benchmark in approximately 2 years
Improvement in Ability To Take Medication Orally
0
20
40
60
80
100
2010 2011 2012 2013
Per
cen
t
White Black Asian Hispanic
0
20
40
60
80
100
2010 2011 2012 2013
Per
cen
t
Total 0-64 65-74
75-84 85+
2008 Achievable
Benchmark 516
Home health patients with improvement in their ability to take medications orally by age and raceethnicity 2010-2013
Source Centers for Medicare amp Medicaid Services Outcome and Assessment Information Set 2010-2013
Denominator Number of home health care episodes in which a patient of any age was unable to take oral medications independently at the
start of the episode that ended during the measurement period
Note White Black and Asian are non-Hispanic Hispanic includes all races
2008 Achievable
Benchmark 516
0
20
40
60
80
100
2010 2011 2012 2013
Per
cen
t
White Black Asian Hispanic
0
20
40
60
80
100
2010 2011 2012 2013
Per
cen
t
Total 0-64 65-74
75-84 85+
2008 Achievable
Benchmark 516
Home health patients with improvement in their ability to take medications orally by age and raceethnicity 2010-2013
Source Centers for Medicare amp Medicaid Services Outcome and Assessment Information Set 2010-2013
Denominator Number of home health care episodes in which a patient of any age was unable to take oral medications independently at the
start of the episode that ended during the measurement period
Note White Black and Asian are non-Hispanic Hispanic includes all races
2008 Achievable
Benchmark 516
Importance Taking medications correctly is important to the health status and quality of life
of individuals living in the community The home health team can help teach a patient ways
to organize drugs and take them properly
Overall Percentage In 2013 the percentage of home health patients with improvement in
their ability to take medications orally was 513
Trends Between 2010 and 2013 there was improvement in the overall percentage of home
health patients with improved ability to take medications orally
National Healthcare Quality and Disparities Report | 29
Patient Safety
Groups With Disparities
In 2013 the percentage of home health patients with improvement in their ability to take
medications orally was worse for those age 85 years and over (398) compared with
those under age 65 years (577)
The percentage of patients with improvement in their ability to take medications orally
was worse among Hispanic home health patients (400) than among White patients
(526) in 2013
From 2010 to 2013 the gap between Blacks and Whites decreased and the gap between
Asians and Whites and Hispanics and Whites increased
Achievable Benchmark
The 2008 top 5 State achievable benchmark was 516 The States that contributed to the
achievable benchmark are Iowa Massachusetts New Jersey North Dakota and South
Carolina
The benchmark was achieved among age groups under 85 years and by White and Black
home health patients
The total population is estimated to reach the benchmark in less than a year Hispanic
patients and patients age 85 years and over are farthest from the benchmark
Improvement in Ability To Take Medication Orally by State
Home health patients with improvement in their ability to take medications orally by raceethnicity by State 2013
Source Centers for Medicare amp Medicaid Services Outcome and Assessment Information Set 2013
Denominator Number of home health care episodes in which a patient of any age was unable to take oral medications independently at the
start of the episode that ended during the measurement period
AZ
CA
UT
CT
FL
GA
IA
IL
KS
MA
MDMO
NJ
NY
OR
PA
SC
TN
CO
WA
WI
VA
ME
MN
MI
NC
TX
KY
WV
RI
NE
VT
NV OH
SD
AR
IN
NH
MT
ID
WY
ND
NMOK
LA
MS AL
DE
AKAK
HI
No significant difference between rates
of Hispanics and non-Hispanic Whites
Non-Hispanic Whites have significantly
worse rate than Hispanics
States do not have data that meet the
criteria for statistical reliability data
quality or confidentiality
Hispanics have significantly worse rate
than non-Hispanic Whites
DC
Home health patients with improvement in their ability to take medications orally by raceethnicity by State 2013
Source Centers for Medicare amp Medicaid Services Outcome and Assessment Information Set 2013
Denominator Number of home health care episodes in which a patient of any age was unable to take oral medications independently at the
start of the episode that ended during the measurement period
AZ
CA
UT
CT
FL
GA
IA
IL
KS
MA
MDMO
NJ
NY
OR
PA
SC
TN
CO
WA
WI
VA
ME
MN
MI
NC
TX
KY
WV
RI
NE
VT
NV OH
SD
AR
IN
NH
MT
ID
WY
ND
NMOK
LA
MS AL
DE
AKAK
HI
No significant difference between rates
of Hispanics and non-Hispanic Whites
Non-Hispanic Whites have significantly
worse rate than Hispanics
States do not have data that meet the
criteria for statistical reliability data
quality or confidentiality
Hispanics have significantly worse rate
than non-Hispanic Whites
DC
30 | National Healthcare Quality and Disparities Report
Patient Safety
Geographic Variation
In 2013 Hispanic home health patients had worse rates of improvement in taking oral
medications than non-Hispanic White patients in 11 States (Arizona California
Connecticut Florida Illinois Indiana Massachusetts Nevada New York North
Carolina and Texas
Non-Hispanic White patients had worse rates of improvement than Hispanic patients in
five States (Hawaii Idaho Iowa Michigan and Pennsylvania)
Patient Safety in the Ambulatory Setting
Although patient safety initiatives frequently focus on inpatient hospital events adverse
effects of medical care may be identified and treated in outpatient settings
Adverse effects of medical care can follow care or procedures in hospitals emergency
departments physician offices or other settings
Measures include
Patient safety and quality issues by frequency of occurrence in outpatient medical offices
Adults age 65 years and over who received potentially inappropriate prescription medications during the calendar year
Percentage of hemodialysis patients with vascular catheter in use for 90 days or longer
For more information see the PSNet link to Patient Safety Primer Patient Safety in
Ambulatory Care httpspsnetahrqgovprimersprimer16patient-safety-in-ambulatory-care
National Healthcare Quality and Disparities Report | 31
Patient Safety
Patient Safety and Quality Issues
Patient safety and quality issues by frequency of occurrence in outpatient medical offices 2014
Source Westat analysis of the AHRQ 2014 Medical Office Survey on Patient Safety Culture Comparative Database (N=935)
Note For this measure less frequent occurrences during the year are better
0
20
40
60
80
100
A pharmacy contactedour office to clarify orcorrect a prescription
A patient was unableto get an appointmentwithin 48 hours for anacuteserious problem
A patients medicationlist was not updatedduring his or her visit
The results from a labor imaging test were notavailable when needed
A patients chartmedicalrecord was not available
when needed
Occurred DailyWeekly
Occurred Monthly
Occurred Not at All to Several Times Over the Past Year
Patient safety and quality issues by frequency of occurrence in outpatient medical offices 2014
Source Westat analysis of the AHRQ 2014 Medical Office Survey on Patient Safety Culture Comparative Database (N=935)
Note For this measure less frequent occurrences during the year are better
0
20
40
60
80
100
A pharmacy contactedour office to clarify orcorrect a prescription
A patient was unableto get an appointmentwithin 48 hours for anacuteserious problem
A patients medicationlist was not updatedduring his or her visit
The results from a labor imaging test were notavailable when needed
A patients chartmedicalrecord was not available
when needed
Occurred DailyWeekly
Occurred Monthly
Occurred Not at All to Several Times Over the Past Year
Importance Most health care takes place in the outpatient or ambulatory care setting Lack
of access to care and lack of access to timely and accurate medical information and test
results may contribute to patient safety events such as missed or delayed diagnoses
medication errors failure to order appropriate diagnostic or laboratory tests incorrect
interpretation of tests and inadequate followup on results
Overall Percentage
Almost 30 of medical offices participating in the survey reported daily or weekly
occurrences of being contacted by the pharmacist for clarification or correction on a
prescription
After prescription clarifications or corrections by the pharmacy medical offices were
next most likely to report daily or weekly issues with patients being unable to get an
appointment within 48 hours for an acute or serious problem (14) or the patientrsquos
medication list not getting updated during their visit (11)
The share of medical offices reporting that lab or imaging tests were not available when
needed reached nearly 20 when considering monthly occurrences as well as those that
occurred more frequently
32 | National Healthcare Quality and Disparities Report
Patient Safety
Potentially Inappropriate Prescriptions for Older Adults
Adults age 65 years and over who received potentially inappropriate prescription medications during the calendar year by sex and
perceived health status 2003ndash2013
Source Agency for Healthcare Research and Quality Medical Expenditure Panel Survey 2003-2013
Note For this measure lower percentages are better Prescription medications received include all prescribed medications initiall y purchased
or otherwise obtained as well as any refills For more information on inappropriate medications see the American Geriatrics Society 2012 Beers
Criteria Update Expert Panel American Geriatrics Society updated Beers Criteria for potentially inappropriate medication use in older adults J
Am Geriatr Soc 2012 Apr60(4)616-31
0
5
10
15
20
25
30
Per
cen
t
Total Male Female
0
5
10
15
20
25
30
Per
cen
t
ExcellentVery GoodGood FairPoor
Adults age 65 years and over who received potentially inappropriate prescription medications during the calendar year by sex and
perceived health status 2003ndash2013
Source Agency for Healthcare Research and Quality Medical Expenditure Panel Survey 2003-2013
Note For this measure lower percentages are better Prescription medications received include all prescribed medications initially purchased
or otherwise obtained as well as any refills For more information on inappropriate medications see the American Geriatrics Society 2012 Beers
Criteria Update Expert Panel American Geriatrics Society updated Beers Criteria for potentially inappropriate medication use in older adults J
Am Geriatr Soc 2012 Apr60(4)616-31
0
5
10
15
20
25
30
Per
cen
t
Total Male Female
0
5
10
15
20
25
30
Per
cen
t
ExcellentVery GoodGood FairPoor
Importance Some drugs that are prescribed for older patients are known to be potentially
harmful for this age group
Overall Percentage In 2013 the percentage of adults age 65 years and over who received
potentially inappropriate prescription medications was 114
Trends From 2003 to 2013 the percentage of adults age 65 years and over who received
potentially inappropriate prescription medications improved overall for both sexes and for
people with excellentvery goodgood health status and people with fairpoor health status
Groups With Disparities
In all years the percentage of patients receiving potentially inappropriate medications
was higher among females compared with males This gap was not changing over time
In all years from 2003 to 2013 the percentage of patients receiving potentially
inappropriate medications was higher among people with fairpoor health status
compared with people with excellentgood health status This gap was not changing over
time
National Healthcare Quality and Disparities Report | 33
Patient Safety
Long-Term Catheter Use in Dialysis Patients
HI
AKAK
AZ
CA
UT
CT
FL
GA
IA
IL
KS
MA
MDMO
NJ
NY
OR
PA
SC
TN
CO
WA
WI
VA
ME
MN
MI
NC
TX
KY
WV
RI
NE
VT
NV OH
SD
AR
IN
NH
MT
ID
WY
ND
NMOK
LA
MSAL
DE
DC
10-12
13-18
7-9
PR
Source Centers for Medicare and Medicaid Services Dialysis Facility Compare 2014
Denominator At-risk adult Medicare patients with a central venous catheter who were receiving regular hemodialysis treatments at dialysis
facilities
Note For this measure lower percentages are better
Percentage of hemodialysis patients with central venous catheters used for vascular access for 90 days or longer by State 2014
HI
AKAK
AZ
CA
UT
CT
FL
GA
IA
IL
KS
MA
MDMO
NJ
NY
OR
PA
SC
TN
CO
WA
WI
VA
ME
MN
MI
NC
TX
KY
WV
RI
NE
VT
NV OH
SD
AR
IN
NH
MT
ID
WY
ND
NMOK
LA
MSAL
DE
DC
10-12
13-18
7-9
PR
Source Centers for Medicare and Medicaid Services Dialysis Facility Compare 2014
Denominator At-risk adult Medicare patients with a central venous catheter who were receiving regular hemodialysis treatments at dialysis
facilities
Note For this measure lower percentages are better
Percentage of hemodialysis patients with central venous catheters used for vascular access for 90 days or longer by State 2014
Importance Central venous catheters are frequently used for vascular access to dialysis
patients until a fistula or graft is formed Central venous catheters have higher rates of
infection and adverse events among patients receiving dialysis treatment compared with
other forms of vascular access To decrease the likelihood of adverse events catheters should
be used for less than 90 days
Overall Percentage Nationally an average of 10 of dialysis patients used central venous
catheters for 90 days or longer in 2014
Geographic Variation In 2014 Alabama and Kansas had the lowest percentages of dialysis
patients using central venous catheters for 90 days or longer (7) and Puerto Rico had the
highest percentage (18) of long-term catheter use
Patient Safety Infrastructure
Efforts to improve patient safety have been accompanied by various infrastructure
enhancements
Growth in patient safety organizations which assist providers in detecting and reducing
risks and hazards from care delivery that may lead to patient harm
System improvement initiatives at the Veterans Health Administration (VHA)
34 | National Healthcare Quality and Disparities Report
Patient Safety
Development of the National Practitioner Data Bank a clearinghouse for information on
medical malpractice payments
Patient Safety Organizations
Patient safety organizations (PSOs) aim to reduce preventable adverse events near misses
and unsafe conditions in all health care settings
PSOs provide an environment for health care providers to voluntarily report discuss and
learn from patient safety events and quality analyses on a privileged and confidential basis
Measures include
Number of PSOs serving each State
Variation in concentrations of compounded liquid medications for children
Patient Safety Organizations AHRQ Common Formats
AHRQ Common Formats provide a standardized method for PSOs health care providers
and other organizations to collect and report patient safety events
Data element standards are important for aggregating and analyzing events across
providers
AHRQ Common Formats have been developed for a variety of settings of care
Acute care hospitals
Skilled nursing facilities
Retail pharmacy
More information is available at httpspsoahrqgovcommon
National Healthcare Quality and Disparities Report | 35
Patient Safety
Number of Patient Safety Organizations
AZ (2)
CA (3)
UT (2)
CT(3)
FL (8)
GA (5)
IA (4)
IL (7)
KS (5)
MA(3)
MD (4)MO(2)
NJ(3)
NY (5)
OR (3)
PA (5)
SC (4)
TN (5)
CO (2)
WA (2)
WI (5)
VA (7)
ME(2)
MN(3)
MI (3)
NC (7)
TX (6)
KY (4)WV (3)
RI(2)
NE (2)
VT(2)
NV (2)
OH (2)
SD (1)
AR (4)
IN (2)
NH(2)
MT (2)
ID (3)
WY (2)
ND (1)
NM (3)OK (2)
LA (1)
MS (2)
AL (2)
DE(2)
HI (2)
AKAK (2)
DC(3)
PR (0)
1-2
3-4
5-6
7-8
Number of PSOs
excluding PSOs
operating nationally
Number of Patient Safety Organizations by area served 2014
Source Agency for Healthcare Research and Quality Patient Safety Organization Information Form Calendar Year 2014 and PSO-PPC
Contact Database
Note PSOs included in this map were AHRQ-listed during any part of 2014 and submitted the PSO Profile to the PSO Privacy Protection
Center (PSO-PPC) in early 2015 A PSO may have members in one or more States regardless of headquarters location Each State shows the
number of PSOs that serve that State map excludes 38 PSOs that are available to providers in all States
AZ (2)
CA (3)
UT (2)
CT(3)
FL (8)
GA (5)
IA (4)
IL (7)
KS (5)
MA(3)
MD (4)MO(2)
NJ(3)
NY (5)
OR (3)
PA (5)
SC (4)
TN (5)
CO (2)
WA (2)
WI (5)
VA (7)
ME(2)
MN(3)
MI (3)
NC (7)
TX (6)
KY (4)WV (3)
RI(2)
NE (2)
VT(2)
NV (2)
OH (2)
SD (1)
AR (4)
IN (2)
NH(2)
MT (2)
ID (3)
WY (2)
ND (1)
NM (3)OK (2)
LA (1)
MS (2)
AL (2)
DE(2)
HI (2)
AKAK (2)
DC(3)
PR (0)
1-2
3-4
5-6
7-8
Number of PSOs
excluding PSOs
operating nationally
Number of Patient Safety Organizations by area served 2014
Source Agency for Healthcare Research and Quality Patient Safety Organization Information Form Calendar Year 2014 and PSO-PPC
Contact Database
Note PSOs included in this map were AHRQ-listed during any part of 2014 and submitted the PSO Profile to the PSO Privacy Protection
Center (PSO-PPC) in early 2015 A PSO may have members in one or more States regardless of headquarters location Each State shows the
number of PSOs that serve that State map excludes 38 PSOs that are available to providers in all States
Importance All patient safety organizations (PSOs) have authority to operate in all 50
States and US territories but not all do In 2014 38 PSOs self-reported being available to
providers nationally PSOs not available nationally serve specific States
Geographic Variation
Nearly all States have at least 2 PSOs available to providers in their State in addition to
the 38 national PSOs that serve all States
Florida has the most PSOs available with 8 in addition to the 38 nationally available
PSOs The States with the largest number of PSOs available are generally on the East
Coast (eg North Carolina Virginia New York Pennsylvania Tennessee Georgia) or
have large populations (eg Texas Illinois)
North Dakota South Dakota and Louisiana are the only states with just one PSO serving
their State in addition to the 38 national PSOs
Puerto Rico is served by one national PSO only
36 | National Healthcare Quality and Disparities Report
Patient Safety
Compounded Liquid Medications for Children
Compounded liquid medications for children in Michigan 2012
Source Levy S Buckley B Safe Table Success The MI Pediatric Safety Collaboration Presentation presented at the 7th Annual
Meeting of Patient Safety Organizations (PSOs) Rockville MD 2015 April and Rood JM Engels MJ Ciarkowski SL et al Variability in
compounding of oral liquids for pediatric patients a patient safety concern J Am Pharm Assn 201454(4)383-9
Note Information represents 244 responses to online survey of approximately 2000 Michigan pharmacies conducted in June 2012 by
The University of Michigan College of Pharmacy in collaboration with the Michigan Pharmacists Association
0
10
20
30
40
50
1 2 3 4 5 6 7 8 9
Nu
mb
er o
f D
rugs
Number of Unique Concentrations
Number of Different Compounded Concentrations per Drug
0
10
20
30
40
50
No Harm No Harm ButMonitoring
TemporaryHarm
Pe
rce
nt
Compounding Errors by Related Harm and Pharmacy Setting
Inpatient Outpatient
Compounded liquid medications for children in Michigan 2012
Source Levy S Buckley B Safe Table Success The MI Pediatric Safety Collaboration Presentation presented at the 7th Annual
Meeting of Patient Safety Organizations (PSOs) Rockville MD 2015 April and Rood JM Engels MJ Ciarkowski SL et al Variability in
compounding of oral liquids for pediatric patients a patient safety concern J Am Pharm Assn 201454(4)383-9
Note Information represents 244 responses to online survey of approximately 2000 Michigan pharmacies conducted in June 2012 by
The University of Michigan College of Pharmacy in collaboration with the Michigan Pharmacists Association
0
10
20
30
40
50
1 2 3 4 5 6 7 8 9
Nu
mb
er o
f D
rugs
Number of Unique Concentrations
Number of Different Compounded Concentrations per Drug
0
10
20
30
40
50
No Harm No Harm ButMonitoring
TemporaryHarm
Per
cen
t
Compounding Errors by Related Harm and Pharmacy Setting
Inpatient Outpatient
Importance
Liquid medications are widely used in pediatrics because many children find it difficult
to swallow tablets or capsules If not commercially manufactured these liquid
medications require a pharmacist to compound them to the correct dosage for the patient
This practice of compounding has led to a variety of medication concentrations in use In
the absence of standard concentrations for compounded medications there is a risk that
children may accidentally receive medications that are too potent and can be dangerous
or are too weak to be effective
The Michigan Health amp Hospital Association Keystone Center Patient Safety
Organization hosts five Pediatric Safe Tables each year Safe Tables provided a
confidential and legally protected environment to discuss challenges and improvement
strategies regarding inconsistent medication concentrations for compounded oral liquids
without fear of punitive action against them
National Healthcare Quality and Disparities Report | 37
Patient Safety
Overall Percentage
More than half (527) of drugs identified in the 2012 survey had 3 or more unique
concentrations dispensed to children across Michigan For example Rifampin used to
treat bacterial infections was reported to have 8 different concentrations dispensed to
patients
Nearly one-third (313) of reported errors caused temporary harm or required additional
monitoring despite no harm
Standardization of Compounded Liquid Medications
Source Michigan Health amp Hospital Association Keystone Center Patient Safety Organization and University of Michigan College of Pharmacy
State-Wide Initiative to Standardize the Compounding of Oral Liquids in Pediatrics
Standardization of compounded liquid medications for children in Michigan 2011
Issue identificationbull Hospitals attending PSO Pediatrics Safe
Table raise compounded medication concentrations as a major safety issue
bull Small focus group determines extent of problem
bull Michigan pharmacies are surveyed about baseline concentrations
Develop Interventionbull PSO Quarterly Safe Tables are held to
discuss cases and practicesbull Team develops recommendations for
standard concentrationsbull Consensus is achieved for frequently
compounded pediatric medications 470 formulations for 147 drug entities are reduced to 104 concentrations for 100 drugs
Practice changebull Toolkit is createdbull Standards are disseminated to Michigan
prescribers and pharmacies bull Standards are disseminated to PSO
members and Safe Table participants
Source Michigan Health amp Hospital Association Keystone Center Patient Safety Organization and University of Michigan College of Pharmacy
State-Wide Initiative to Standardize the Compounding of Oral Liquids in Pediatrics
Standardization of compounded liquid medications for children in Michigan 2011
Issue identificationbull Hospitals attending PSO Pediatrics Safe
Table raise compounded medication concentrations as a major safety issue
bull Small focus group determines extent of problem
bull Michigan pharmacies are surveyed about baseline concentrations
Develop Interventionbull PSO Quarterly Safe Tables are held to
discuss cases and practicesbull Team develops recommendations for
standard concentrationsbull Consensus is achieved for frequently
compounded pediatric medications 470 formulations for 147 drug entities are reduced to 104 concentrations for 100 drugs
Practice changebull Toolkit is createdbull Standards are disseminated to Michigan
prescribers and pharmacies bull Standards are disseminated to PSO
members and Safe Table participants
The Role of PSO Safe Tables Based on adverse medication events discussed in the
Michigan Health amp Hospital Association (MHA) Keystone Center Patient Safety
Organization (PSO) Safe Tables in July 2011 the Michigan Pediatric Safety Collaboration
was developed to further assess the scope of the problem and formulate a solution
The Collaborative The Michigan Pediatric Safety Collaboration includes individuals from
the University of Michigan College of Pharmacy the Michigan Pharmacists Association
(MPA) the Food and Drug Administration (FDA) and the MHA Keystone PSO
38 | National Healthcare Quality and Disparities Report
Patient Safety
Practice Change
As a result of the standardization effort 470 unique formulations for 147 drug entities
were reduced to 104 different concentrations for 100 drugs
The Michigan Pediatric Safety Collaboration developed a multistep process to implement
standards for compounding medications The MPA surveyed pharmacies in Michigan to
better define the nature and scope of the problem The PSO continued to act as convener
The result was the creation and dissemination of statewide standards for 120 frequently
compounded pediatric medications
Veterans Health Administration
The National Center for Patient Safety is part of the Veterans Health Administration the
Nationrsquos largest integrated health care system
Patient safety-related system improvement initiatives include
The Daily Planreg
Purchasing for Safety Initiative
Patient Safety Improvement Initiative
Patient safety improvement initiative The Daily Planreg at Veterans Affairs Medical Centers 2009
Source King BJ Mills PD Fore A et al The Daily Planreg including patients for safetys sake Nurs Manage 201243(3)15-8
0
10
20
30
40
50
Identified atleast one
error
Identifiederror
of omission
Identifiederror
ofcommission
Nurses Who Identified Errors in Patient Treatment Plan by Type
0
10
20
30
40
50
Patient founddiscrepancy inplanned care
Family founddiscrepancy inplanned care
Nursing Stafffound
discrepancyin plannedtreatment
Respondents Who Identified Errors or Discrepancies Through The Daily Plan reg
Patient safety improvement initiative The Daily Planreg at Veterans Affairs Medical Centers 2009
Source King BJ Mills PD Fore A et al The Daily Planreg including patients for safetys sake Nurs Manage 201243(3)15-8
0
10
20
30
40
50
Identified atleast one
error
Identifiederror
of omission
Identifiederror
ofcommission
Nurses Who Identified Errors in Patient Treatment Plan by Type
0
10
20
30
40
50
Patient founddiscrepancy inplanned care
Family founddiscrepancy inplanned care
Nursing Stafffound
discrepancyin plannedtreatment
Respondents Who Identified Errors or Discrepancies Through The Daily Plan reg
National Healthcare Quality and Disparities Report | 39
Patient Safety
Importance The Daily Planreg
is a two-page printed summary that acts as a schedule for
patients and providers each day It shows the procedures laboratory tests and medications
scheduled for that day and lists essential health information such as patientrsquos name allergies
and current medications It can be tailored for a patientrsquos needs by extracting orders from the
electronic medical record (EMR) The Daily Planreg
is intended to facilitate patient and family
engagement throughout the course of care The Daily Planreg
shows promise for improving
patient safety Since 2009 the VA has implemented The Daily Planreg
in more than 65
hospitals both inpatient and outpatient care settings The Daily Planreg
is shared more than
75000 times a month and the VA plans to continue the spread of The Daily Planreg
at
additional sites in 2016
Findings
As part of a pilot test in 2009 a total of 198 patients and 85 nurses responded to a survey
across 10 facilities Nurses had an average of 34 patients per shift who received The
Daily Planreg Patients responded about their own experiences whereas nurses reported
about all of their patients who received The Daily Planreg
Nearly half (475) of patients reported finding a discrepancy in planned care through
The Daily Planreg In addition 30 of patients reported that their family members found a
discrepancy Although not every discrepancy will be a potential medical error having a
shared understanding of the plan of care decreases the risk of error
More than one in six nurses (176) identified a discrepancy in treatment among their
patients through The Daily Planreg Most of these nurses (153) found one or more errors
of omission and a smaller share (106) of nurses found one or more errors of
commission some found both
40 | National Healthcare Quality and Disparities Report
Patient Safety
Issues Related to Ventilators
Common use-issues related to ventilators at the Veterans Health Administration 2006-2014 (combined)
Source Veterans Health Administration National Center for Patient Safety data collected October 2006 to October 2014
Note Examples of equipment failures include ventilator shutdown and other ventilator problems Ventilator settings include setup problems and
incorrect settings Support activities include space utilities and supplies Transport includes accidental extubation other transportation issues
and vehicle-related issues Alarms include alarm settings and alarm connection Training includes unknown ventilator model and other training
concerns
0
20
40
60
80
100
120
140
160
EquipmentFailure
VentilatorSettings
SupportActivities
Transport Alarms Training
Nu
mb
er o
f R
epo
rts
Common use-issues related to ventilators at the Veterans Health Administration 2006-2014 (combined)
Source Veterans Health Administration National Center for Patient Safety data collected October 2006 to October 2014
Note Examples of equipment failures include ventilator shutdown and other ventilator problems Ventilator settings include setup problems and
incorrect settings Support activities include space utilities and supplies Transport includes accidental extubation other transportation issues
and vehicle-related issues Alarms include alarm settings and alarm connection Training includes unknown ventilator model and other training
concerns
0
20
40
60
80
100
120
140
160
EquipmentFailure
VentilatorSettings
SupportActivities
Transport Alarms Training
Nu
mb
er o
f R
epo
rts
Importance Beginning with a focus on ventilators the Veterans Health Administrationrsquos
human factors-based Purchasing for Safety Initiative communicates the most common use-
issues associated with medical devices in order to ultimately remove or contain identified
vulnerabilities and prevent further harm
Event Reporting Patient safety managers report events and close calls from more than 150
VA facilities to a national database The largest number of use issues related to ventilators
involved equipment failure and issues such as spontaneous ventilator shutdown compressor
failure and broken or missing parts Other categories of ventilator use issues involved the
physical space where the ventilator was used challenges of transporting patients on
ventilators and problems with ventilator settings and alarms Root cause analyses on reports
are conducted and Patient Safety Alerts are issued to share the learning internally
Other Key Components
Data on ventilator issues from the VA and the Food and Drug Administrationrsquos Medical
Product Safety Network are the basis for a ldquogovernment-industry dayrdquo to work with
manufacturers This information is used to help the device manufacturers better
understand the limits of human use of their products
National Healthcare Quality and Disparities Report | 41
Patient Safety
The VA also trains noncliniciansmdashsuch as biomedical engineers across the
organizationmdashto understand the devices consider the situation for their use and identify
what can go wrong (ldquofailure modesrdquo) in advance
The VA encourages discussions among clinicians about their experience in using devices
In the Applied Patient Safety Challenge hundreds of staff participate in brainstorming
about solutions and strategies for dealing with unexpected scenarios involving devices
National Practitioner Data Bank
Medical malpractice actions are one way to flag potential medical errors
Medical Malpractice Payment Reports are submitted to the National Practitioner Data Bank
by medical malpractice payers
Report of a monetary exchange made for the benefit of a physician dentist or other
health care provider
Result of a settlement or judgment of a written complaint or claim based on that
providerrsquos delivery of or failure to deliver health care services
Number of Medical Malpractice Payment Reports by Setting
Number of Medical Malpractice Payment Reports by health care setting 2004-2014
Source National Practitioner Data Bank (NPDB) Public Use Data File Health Resources and Services Administration Bureau of Health
Professions Division of Practitioner Data Banks 2004-2014
Note Health care setting was not collected by the NPDB for 2104 reports in 2004 ldquoOtherrdquo includes Medical Malpractice Payment Reports
related to unknown settings as well as those for a combination of inpatient and outpatient settings Reports pertain to patients of any age
0
2000
4000
6000
8000
10000
12000
14000
16000
18000
20000
2004 2005 2006 2007 2008 2009 2010 2011 2012 2013 2014
Nu
mb
er o
f R
epo
rts
Total Inpatient Outpatient Other
Number of Medical Malpractice Payment Reports by health care setting 2004-2014
Source National Practitioner Data Bank (NPDB) Public Use Data File Health Resources and Services Administration Bureau of Health
Professions Division of Practitioner Data Banks 2004-2014
Note Health care setting was not collected by the NPDB for 2104 reports in 2004 ldquoOtherrdquo includes Medical Malpractice Payment Reports
related to unknown settings as well as those for a combination of inpatient and outpatient settings Reports pertain to patients of any age
0
2000
4000
6000
8000
10000
12000
14000
16000
18000
20000
2004 2005 2006 2007 2008 2009 2010 2011 2012 2013 2014
Nu
mb
er o
f R
epo
rts
Total Inpatient Outpatient Other
42 | National Healthcare Quality and Disparities Report
Patient Safety
Trends The total number of medical malpractice payment reports (MMPRs) per year
decreased from 17641 in 2004 to 12699 in 2014
Variation Across Reports
Of 157022 MMPRs from 2004 through 2014 more reports related to care in the
outpatient setting (71937) than in the inpatient setting (60391)
Diagnosis-related and treatment-related payments were the most frequent types of
reports each accounting for about 27 of cases Reports of payments for medication-
related cases accounted for only 5 of MMPRs (data not shown)
Number of Medical Malpractice Payment Reports by Allegation and Harm
Number of Medical Malpractice Payment Reports by type of allegation and harm severity 2004-2014
Key Temporary injury = Minor temporary injury and Major temporary injury Permanent significant injury = Significant Permanent Injury
Major Permanent Injury Quadriplegia Brain Damage Lifelong care
Source National Practitioner Data Bank Public Use Data File Health Resources and Services Administration Bureau of Health Professions
Division of Practitioner Data Banks 2004-2014
Note Reports pertain to patients of any age
0
20
40
60
80
100
Treatment(n=42913)
Diagnosis(n=42507)
Surgery(n=36845)
Obstetrics(n=10555)
Medication(n=8287)
Monitoring(n=5329)
Anesthesia(n=4276)
Equipment(n=1161)
BehavioralHealth
(n=879)
Blood(n=379)
EmotionalInjury Only
InsignificantInjury
TemporaryInjury
PermanentMinor Injury
PermanentSignificant Injury
Death Unknown
Number of Medical Malpractice Payment Reports by type of allegation and harm severity 2004-2014
Key Temporary injury = Minor temporary injury and Major temporary injury Permanent significant injury = Significant Permanent Injury
Major Permanent Injury Quadriplegia Brain Damage Lifelong care
Source National Practitioner Data Bank Public Use Data File Health Resources and Services Administration Bureau of Health Professions
Division of Practitioner Data Banks 2004-2014
Note Reports pertain to patients of any age
0
20
40
60
80
100
Treatment(n=42913)
Diagnosis(n=42507)
Surgery(n=36845)
Obstetrics(n=10555)
Medication(n=8287)
Monitoring(n=5329)
Anesthesia(n=4276)
Equipment(n=1161)
BehavioralHealth
(n=879)
Blood(n=379)
EmotionalInjury Only
InsignificantInjury
TemporaryInjury
PermanentMinor Injury
PermanentSignificant Injury
Death Unknown
Overall Percentage From 2004 to 2014 medical malpractice payments were made for
allegations related to
Treatment (42913)
Diagnosis (42507)
Surgery (36845)
Obstetrics (10555)
Medication (8287)
Monitoring (5329)
National Healthcare Quality and Disparities Report | 43
Patient Safety
Anesthesia (4276)
Equipment or products (1161)
Behavioral health (879) and
IV and blood products (379)
Variation Across Reports
Death accounted for more than one-third of harm in payments related to monitoring
(499) diagnosis (393) medication (383) and anesthesia (363) allegations
More than half of all obstetric payments were for allegations of permanent severe harm
(570)
Temporary harm accounted for more than one-third of payments related to equipment
(485) and surgery (360)
Most of the behavioral health-related payments were for emotional harm (457) or
death (338)
References
Agency for Healthcare Research and Quality Making Health Care Safer II An Updated Critical Analysis of the
Evidence for Patient Safety Practices Comparative Effectiveness Review No 211 Rockville MD Agency for
Healthcare Research and Quality March 2013 AHRQ Publication No 13-E001-EF
httpwwwahrqgovsitesdefaultfileswysiwygresearchfindingsevidence-basedshy
reportsservicesqualityptsafetyII-fullpdf
Arriaga AF Lancaster RT Berry RW et al The better colectomy project association of evidence-based best-
practice adherence rates to outcomes in colorectal surgery Ann Surg 2009 Oct250(4)507-13
httpwwwncbinlmnihgovpubmed19734778
Centers for Disease Control and Prevention HAI Prevalence Survey
httpwwwcdcgovHAIsurveillanceindexhtml Last updated March 2016 Accessed March 4 2016
Centers for Disease Control and Prevention Nursing Homes and Assisted Living (Long-Term Care Facilities)
httpwwwcdcgovlongtermcare Last updated September 2015 Accessed March 4 2016
Chassin MR Loeb JM High-reliability health care getting there from here Milbank Q 201391(3)459-90
httpwwwncbinlmnihgovpmcarticlesPMC3790522 Accessed September 23 2015
Chiu Y Bero L Hessol NA et al A literature review of clinical outcomes associated with antipsychotic medication
use in North American nursing home residents Health Policy 2015 Jun119(6)802-813 Epub 2015 Feb 28 PMID
25791166 httpwwwsciencedirectcomsciencearticlepiiS0168851015000652 Accessed June 17 2015
Huybrechts KF Gerhard Crystal S et al Differential risk of death in older residents in nursing homes prescribed
specific antipsychotic drugs Population based cohort study BMJ 2012 Feb 23344e977 PMID 22362541
httpwwwncbinlmnihgovpmcarticlesPMC3285717 Accessed June 17 2015
Institute of Medicine Preventing Medication Errors Quality Chasm Series 2007
httpwwwnapeducatalog11623preventing-medication-errors-quality-chasm-series
National Association for Home Care amp Hospice Basic Statistics About Home Care Updated 2010
httpwwwnahcorgassets1710hc_statspdf Accessed August 31 2015
44 | National Healthcare Quality and Disparities Report
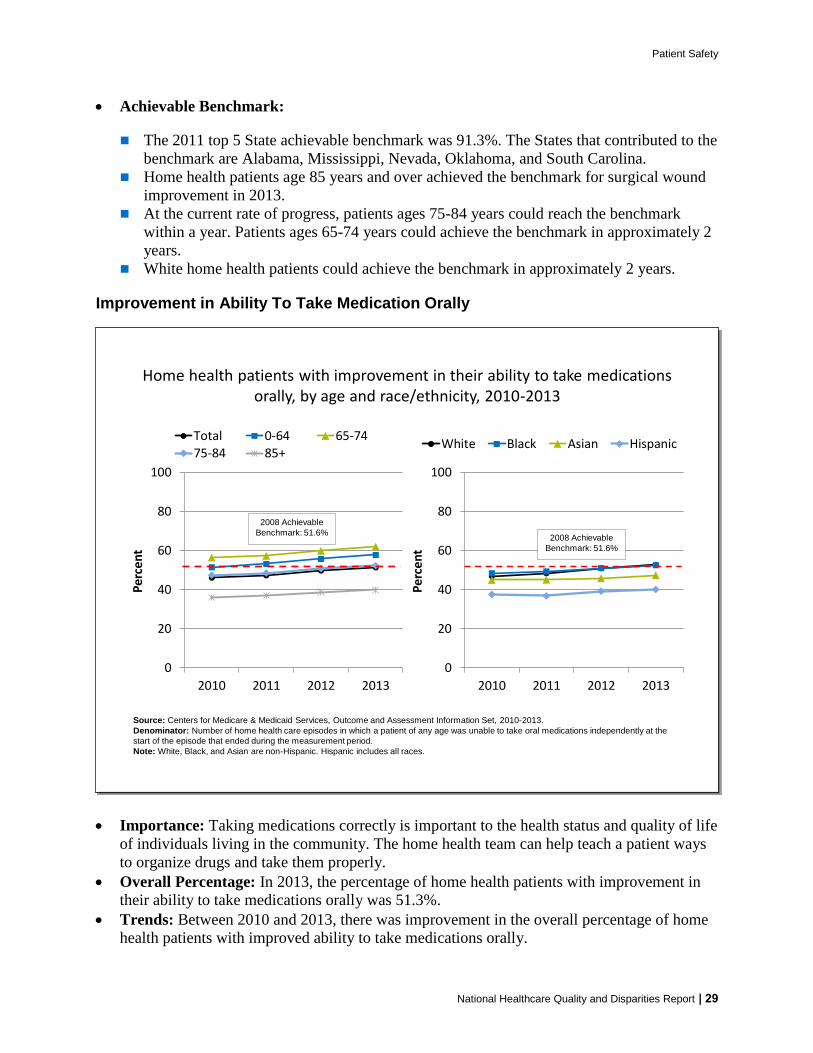
Patient Safety
Achievable Benchmark
The 2011 top 5 State achievable benchmark was 913 The States that contributed to the
benchmark are Alabama Mississippi Nevada Oklahoma and South Carolina
Home health patients age 85 years and over achieved the benchmark for surgical wound
improvement in 2013
At the current rate of progress patients ages 75-84 years could reach the benchmark
within a year Patients ages 65-74 years could achieve the benchmark in approximately 2
years
White home health patients could achieve the benchmark in approximately 2 years
Improvement in Ability To Take Medication Orally
0
20
40
60
80
100
2010 2011 2012 2013
Per
cen
t
White Black Asian Hispanic
0
20
40
60
80
100
2010 2011 2012 2013
Per
cen
t
Total 0-64 65-74
75-84 85+
2008 Achievable
Benchmark 516
Home health patients with improvement in their ability to take medications orally by age and raceethnicity 2010-2013
Source Centers for Medicare amp Medicaid Services Outcome and Assessment Information Set 2010-2013
Denominator Number of home health care episodes in which a patient of any age was unable to take oral medications independently at the
start of the episode that ended during the measurement period
Note White Black and Asian are non-Hispanic Hispanic includes all races
2008 Achievable
Benchmark 516
0
20
40
60
80
100
2010 2011 2012 2013
Per
cen
t
White Black Asian Hispanic
0
20
40
60
80
100
2010 2011 2012 2013
Per
cen
t
Total 0-64 65-74
75-84 85+
2008 Achievable
Benchmark 516
Home health patients with improvement in their ability to take medications orally by age and raceethnicity 2010-2013
Source Centers for Medicare amp Medicaid Services Outcome and Assessment Information Set 2010-2013
Denominator Number of home health care episodes in which a patient of any age was unable to take oral medications independently at the
start of the episode that ended during the measurement period
Note White Black and Asian are non-Hispanic Hispanic includes all races
2008 Achievable
Benchmark 516
Importance Taking medications correctly is important to the health status and quality of life
of individuals living in the community The home health team can help teach a patient ways
to organize drugs and take them properly
Overall Percentage In 2013 the percentage of home health patients with improvement in
their ability to take medications orally was 513
Trends Between 2010 and 2013 there was improvement in the overall percentage of home
health patients with improved ability to take medications orally
National Healthcare Quality and Disparities Report | 29
Patient Safety
Groups With Disparities
In 2013 the percentage of home health patients with improvement in their ability to take
medications orally was worse for those age 85 years and over (398) compared with
those under age 65 years (577)
The percentage of patients with improvement in their ability to take medications orally
was worse among Hispanic home health patients (400) than among White patients
(526) in 2013
From 2010 to 2013 the gap between Blacks and Whites decreased and the gap between
Asians and Whites and Hispanics and Whites increased
Achievable Benchmark
The 2008 top 5 State achievable benchmark was 516 The States that contributed to the
achievable benchmark are Iowa Massachusetts New Jersey North Dakota and South
Carolina
The benchmark was achieved among age groups under 85 years and by White and Black
home health patients
The total population is estimated to reach the benchmark in less than a year Hispanic
patients and patients age 85 years and over are farthest from the benchmark
Improvement in Ability To Take Medication Orally by State
Home health patients with improvement in their ability to take medications orally by raceethnicity by State 2013
Source Centers for Medicare amp Medicaid Services Outcome and Assessment Information Set 2013
Denominator Number of home health care episodes in which a patient of any age was unable to take oral medications independently at the
start of the episode that ended during the measurement period
AZ
CA
UT
CT
FL
GA
IA
IL
KS
MA
MDMO
NJ
NY
OR
PA
SC
TN
CO
WA
WI
VA
ME
MN
MI
NC
TX
KY
WV
RI
NE
VT
NV OH
SD
AR
IN
NH
MT
ID
WY
ND
NMOK
LA
MS AL
DE
AKAK
HI
No significant difference between rates
of Hispanics and non-Hispanic Whites
Non-Hispanic Whites have significantly
worse rate than Hispanics
States do not have data that meet the
criteria for statistical reliability data
quality or confidentiality
Hispanics have significantly worse rate
than non-Hispanic Whites
DC
Home health patients with improvement in their ability to take medications orally by raceethnicity by State 2013
Source Centers for Medicare amp Medicaid Services Outcome and Assessment Information Set 2013
Denominator Number of home health care episodes in which a patient of any age was unable to take oral medications independently at the
start of the episode that ended during the measurement period
AZ
CA
UT
CT
FL
GA
IA
IL
KS
MA
MDMO
NJ
NY
OR
PA
SC
TN
CO
WA
WI
VA
ME
MN
MI
NC
TX
KY
WV
RI
NE
VT
NV OH
SD
AR
IN
NH
MT
ID
WY
ND
NMOK
LA
MS AL
DE
AKAK
HI
No significant difference between rates
of Hispanics and non-Hispanic Whites
Non-Hispanic Whites have significantly
worse rate than Hispanics
States do not have data that meet the
criteria for statistical reliability data
quality or confidentiality
Hispanics have significantly worse rate
than non-Hispanic Whites
DC
30 | National Healthcare Quality and Disparities Report
Patient Safety
Geographic Variation
In 2013 Hispanic home health patients had worse rates of improvement in taking oral
medications than non-Hispanic White patients in 11 States (Arizona California
Connecticut Florida Illinois Indiana Massachusetts Nevada New York North
Carolina and Texas
Non-Hispanic White patients had worse rates of improvement than Hispanic patients in
five States (Hawaii Idaho Iowa Michigan and Pennsylvania)
Patient Safety in the Ambulatory Setting
Although patient safety initiatives frequently focus on inpatient hospital events adverse
effects of medical care may be identified and treated in outpatient settings
Adverse effects of medical care can follow care or procedures in hospitals emergency
departments physician offices or other settings
Measures include
Patient safety and quality issues by frequency of occurrence in outpatient medical offices
Adults age 65 years and over who received potentially inappropriate prescription medications during the calendar year
Percentage of hemodialysis patients with vascular catheter in use for 90 days or longer
For more information see the PSNet link to Patient Safety Primer Patient Safety in
Ambulatory Care httpspsnetahrqgovprimersprimer16patient-safety-in-ambulatory-care
National Healthcare Quality and Disparities Report | 31
Patient Safety
Patient Safety and Quality Issues
Patient safety and quality issues by frequency of occurrence in outpatient medical offices 2014
Source Westat analysis of the AHRQ 2014 Medical Office Survey on Patient Safety Culture Comparative Database (N=935)
Note For this measure less frequent occurrences during the year are better
0
20
40
60
80
100
A pharmacy contactedour office to clarify orcorrect a prescription
A patient was unableto get an appointmentwithin 48 hours for anacuteserious problem
A patients medicationlist was not updatedduring his or her visit
The results from a labor imaging test were notavailable when needed
A patients chartmedicalrecord was not available
when needed
Occurred DailyWeekly
Occurred Monthly
Occurred Not at All to Several Times Over the Past Year
Patient safety and quality issues by frequency of occurrence in outpatient medical offices 2014
Source Westat analysis of the AHRQ 2014 Medical Office Survey on Patient Safety Culture Comparative Database (N=935)
Note For this measure less frequent occurrences during the year are better
0
20
40
60
80
100
A pharmacy contactedour office to clarify orcorrect a prescription
A patient was unableto get an appointmentwithin 48 hours for anacuteserious problem
A patients medicationlist was not updatedduring his or her visit
The results from a labor imaging test were notavailable when needed
A patients chartmedicalrecord was not available
when needed
Occurred DailyWeekly
Occurred Monthly
Occurred Not at All to Several Times Over the Past Year
Importance Most health care takes place in the outpatient or ambulatory care setting Lack
of access to care and lack of access to timely and accurate medical information and test
results may contribute to patient safety events such as missed or delayed diagnoses
medication errors failure to order appropriate diagnostic or laboratory tests incorrect
interpretation of tests and inadequate followup on results
Overall Percentage
Almost 30 of medical offices participating in the survey reported daily or weekly
occurrences of being contacted by the pharmacist for clarification or correction on a
prescription
After prescription clarifications or corrections by the pharmacy medical offices were
next most likely to report daily or weekly issues with patients being unable to get an
appointment within 48 hours for an acute or serious problem (14) or the patientrsquos
medication list not getting updated during their visit (11)
The share of medical offices reporting that lab or imaging tests were not available when
needed reached nearly 20 when considering monthly occurrences as well as those that
occurred more frequently
32 | National Healthcare Quality and Disparities Report
Patient Safety
Potentially Inappropriate Prescriptions for Older Adults
Adults age 65 years and over who received potentially inappropriate prescription medications during the calendar year by sex and
perceived health status 2003ndash2013
Source Agency for Healthcare Research and Quality Medical Expenditure Panel Survey 2003-2013
Note For this measure lower percentages are better Prescription medications received include all prescribed medications initiall y purchased
or otherwise obtained as well as any refills For more information on inappropriate medications see the American Geriatrics Society 2012 Beers
Criteria Update Expert Panel American Geriatrics Society updated Beers Criteria for potentially inappropriate medication use in older adults J
Am Geriatr Soc 2012 Apr60(4)616-31
0
5
10
15
20
25
30
Per
cen
t
Total Male Female
0
5
10
15
20
25
30
Per
cen
t
ExcellentVery GoodGood FairPoor
Adults age 65 years and over who received potentially inappropriate prescription medications during the calendar year by sex and
perceived health status 2003ndash2013
Source Agency for Healthcare Research and Quality Medical Expenditure Panel Survey 2003-2013
Note For this measure lower percentages are better Prescription medications received include all prescribed medications initially purchased
or otherwise obtained as well as any refills For more information on inappropriate medications see the American Geriatrics Society 2012 Beers
Criteria Update Expert Panel American Geriatrics Society updated Beers Criteria for potentially inappropriate medication use in older adults J
Am Geriatr Soc 2012 Apr60(4)616-31
0
5
10
15
20
25
30
Per
cen
t
Total Male Female
0
5
10
15
20
25
30
Per
cen
t
ExcellentVery GoodGood FairPoor
Importance Some drugs that are prescribed for older patients are known to be potentially
harmful for this age group
Overall Percentage In 2013 the percentage of adults age 65 years and over who received
potentially inappropriate prescription medications was 114
Trends From 2003 to 2013 the percentage of adults age 65 years and over who received
potentially inappropriate prescription medications improved overall for both sexes and for
people with excellentvery goodgood health status and people with fairpoor health status
Groups With Disparities
In all years the percentage of patients receiving potentially inappropriate medications
was higher among females compared with males This gap was not changing over time
In all years from 2003 to 2013 the percentage of patients receiving potentially
inappropriate medications was higher among people with fairpoor health status
compared with people with excellentgood health status This gap was not changing over
time
National Healthcare Quality and Disparities Report | 33
Patient Safety
Long-Term Catheter Use in Dialysis Patients
HI
AKAK
AZ
CA
UT
CT
FL
GA
IA
IL
KS
MA
MDMO
NJ
NY
OR
PA
SC
TN
CO
WA
WI
VA
ME
MN
MI
NC
TX
KY
WV
RI
NE
VT
NV OH
SD
AR
IN
NH
MT
ID
WY
ND
NMOK
LA
MSAL
DE
DC
10-12
13-18
7-9
PR
Source Centers for Medicare and Medicaid Services Dialysis Facility Compare 2014
Denominator At-risk adult Medicare patients with a central venous catheter who were receiving regular hemodialysis treatments at dialysis
facilities
Note For this measure lower percentages are better
Percentage of hemodialysis patients with central venous catheters used for vascular access for 90 days or longer by State 2014
HI
AKAK
AZ
CA
UT
CT
FL
GA
IA
IL
KS
MA
MDMO
NJ
NY
OR
PA
SC
TN
CO
WA
WI
VA
ME
MN
MI
NC
TX
KY
WV
RI
NE
VT
NV OH
SD
AR
IN
NH
MT
ID
WY
ND
NMOK
LA
MSAL
DE
DC
10-12
13-18
7-9
PR
Source Centers for Medicare and Medicaid Services Dialysis Facility Compare 2014
Denominator At-risk adult Medicare patients with a central venous catheter who were receiving regular hemodialysis treatments at dialysis
facilities
Note For this measure lower percentages are better
Percentage of hemodialysis patients with central venous catheters used for vascular access for 90 days or longer by State 2014
Importance Central venous catheters are frequently used for vascular access to dialysis
patients until a fistula or graft is formed Central venous catheters have higher rates of
infection and adverse events among patients receiving dialysis treatment compared with
other forms of vascular access To decrease the likelihood of adverse events catheters should
be used for less than 90 days
Overall Percentage Nationally an average of 10 of dialysis patients used central venous
catheters for 90 days or longer in 2014
Geographic Variation In 2014 Alabama and Kansas had the lowest percentages of dialysis
patients using central venous catheters for 90 days or longer (7) and Puerto Rico had the
highest percentage (18) of long-term catheter use
Patient Safety Infrastructure
Efforts to improve patient safety have been accompanied by various infrastructure
enhancements
Growth in patient safety organizations which assist providers in detecting and reducing
risks and hazards from care delivery that may lead to patient harm
System improvement initiatives at the Veterans Health Administration (VHA)
34 | National Healthcare Quality and Disparities Report
Patient Safety
Development of the National Practitioner Data Bank a clearinghouse for information on
medical malpractice payments
Patient Safety Organizations
Patient safety organizations (PSOs) aim to reduce preventable adverse events near misses
and unsafe conditions in all health care settings
PSOs provide an environment for health care providers to voluntarily report discuss and
learn from patient safety events and quality analyses on a privileged and confidential basis
Measures include
Number of PSOs serving each State
Variation in concentrations of compounded liquid medications for children
Patient Safety Organizations AHRQ Common Formats
AHRQ Common Formats provide a standardized method for PSOs health care providers
and other organizations to collect and report patient safety events
Data element standards are important for aggregating and analyzing events across
providers
AHRQ Common Formats have been developed for a variety of settings of care
Acute care hospitals
Skilled nursing facilities
Retail pharmacy
More information is available at httpspsoahrqgovcommon
National Healthcare Quality and Disparities Report | 35
Patient Safety
Number of Patient Safety Organizations
AZ (2)
CA (3)
UT (2)
CT(3)
FL (8)
GA (5)
IA (4)
IL (7)
KS (5)
MA(3)
MD (4)MO(2)
NJ(3)
NY (5)
OR (3)
PA (5)
SC (4)
TN (5)
CO (2)
WA (2)
WI (5)
VA (7)
ME(2)
MN(3)
MI (3)
NC (7)
TX (6)
KY (4)WV (3)
RI(2)
NE (2)
VT(2)
NV (2)
OH (2)
SD (1)
AR (4)
IN (2)
NH(2)
MT (2)
ID (3)
WY (2)
ND (1)
NM (3)OK (2)
LA (1)
MS (2)
AL (2)
DE(2)
HI (2)
AKAK (2)
DC(3)
PR (0)
1-2
3-4
5-6
7-8
Number of PSOs
excluding PSOs
operating nationally
Number of Patient Safety Organizations by area served 2014
Source Agency for Healthcare Research and Quality Patient Safety Organization Information Form Calendar Year 2014 and PSO-PPC
Contact Database
Note PSOs included in this map were AHRQ-listed during any part of 2014 and submitted the PSO Profile to the PSO Privacy Protection
Center (PSO-PPC) in early 2015 A PSO may have members in one or more States regardless of headquarters location Each State shows the
number of PSOs that serve that State map excludes 38 PSOs that are available to providers in all States
AZ (2)
CA (3)
UT (2)
CT(3)
FL (8)
GA (5)
IA (4)
IL (7)
KS (5)
MA(3)
MD (4)MO(2)
NJ(3)
NY (5)
OR (3)
PA (5)
SC (4)
TN (5)
CO (2)
WA (2)
WI (5)
VA (7)
ME(2)
MN(3)
MI (3)
NC (7)
TX (6)
KY (4)WV (3)
RI(2)
NE (2)
VT(2)
NV (2)
OH (2)
SD (1)
AR (4)
IN (2)
NH(2)
MT (2)
ID (3)
WY (2)
ND (1)
NM (3)OK (2)
LA (1)
MS (2)
AL (2)
DE(2)
HI (2)
AKAK (2)
DC(3)
PR (0)
1-2
3-4
5-6
7-8
Number of PSOs
excluding PSOs
operating nationally
Number of Patient Safety Organizations by area served 2014
Source Agency for Healthcare Research and Quality Patient Safety Organization Information Form Calendar Year 2014 and PSO-PPC
Contact Database
Note PSOs included in this map were AHRQ-listed during any part of 2014 and submitted the PSO Profile to the PSO Privacy Protection
Center (PSO-PPC) in early 2015 A PSO may have members in one or more States regardless of headquarters location Each State shows the
number of PSOs that serve that State map excludes 38 PSOs that are available to providers in all States
Importance All patient safety organizations (PSOs) have authority to operate in all 50
States and US territories but not all do In 2014 38 PSOs self-reported being available to
providers nationally PSOs not available nationally serve specific States
Geographic Variation
Nearly all States have at least 2 PSOs available to providers in their State in addition to
the 38 national PSOs that serve all States
Florida has the most PSOs available with 8 in addition to the 38 nationally available
PSOs The States with the largest number of PSOs available are generally on the East
Coast (eg North Carolina Virginia New York Pennsylvania Tennessee Georgia) or
have large populations (eg Texas Illinois)
North Dakota South Dakota and Louisiana are the only states with just one PSO serving
their State in addition to the 38 national PSOs
Puerto Rico is served by one national PSO only
36 | National Healthcare Quality and Disparities Report
Patient Safety
Compounded Liquid Medications for Children
Compounded liquid medications for children in Michigan 2012
Source Levy S Buckley B Safe Table Success The MI Pediatric Safety Collaboration Presentation presented at the 7th Annual
Meeting of Patient Safety Organizations (PSOs) Rockville MD 2015 April and Rood JM Engels MJ Ciarkowski SL et al Variability in
compounding of oral liquids for pediatric patients a patient safety concern J Am Pharm Assn 201454(4)383-9
Note Information represents 244 responses to online survey of approximately 2000 Michigan pharmacies conducted in June 2012 by
The University of Michigan College of Pharmacy in collaboration with the Michigan Pharmacists Association
0
10
20
30
40
50
1 2 3 4 5 6 7 8 9
Nu
mb
er o
f D
rugs
Number of Unique Concentrations
Number of Different Compounded Concentrations per Drug
0
10
20
30
40
50
No Harm No Harm ButMonitoring
TemporaryHarm
Pe
rce
nt
Compounding Errors by Related Harm and Pharmacy Setting
Inpatient Outpatient
Compounded liquid medications for children in Michigan 2012
Source Levy S Buckley B Safe Table Success The MI Pediatric Safety Collaboration Presentation presented at the 7th Annual
Meeting of Patient Safety Organizations (PSOs) Rockville MD 2015 April and Rood JM Engels MJ Ciarkowski SL et al Variability in
compounding of oral liquids for pediatric patients a patient safety concern J Am Pharm Assn 201454(4)383-9
Note Information represents 244 responses to online survey of approximately 2000 Michigan pharmacies conducted in June 2012 by
The University of Michigan College of Pharmacy in collaboration with the Michigan Pharmacists Association
0
10
20
30
40
50
1 2 3 4 5 6 7 8 9
Nu
mb
er o
f D
rugs
Number of Unique Concentrations
Number of Different Compounded Concentrations per Drug
0
10
20
30
40
50
No Harm No Harm ButMonitoring
TemporaryHarm
Per
cen
t
Compounding Errors by Related Harm and Pharmacy Setting
Inpatient Outpatient
Importance
Liquid medications are widely used in pediatrics because many children find it difficult
to swallow tablets or capsules If not commercially manufactured these liquid
medications require a pharmacist to compound them to the correct dosage for the patient
This practice of compounding has led to a variety of medication concentrations in use In
the absence of standard concentrations for compounded medications there is a risk that
children may accidentally receive medications that are too potent and can be dangerous
or are too weak to be effective
The Michigan Health amp Hospital Association Keystone Center Patient Safety
Organization hosts five Pediatric Safe Tables each year Safe Tables provided a
confidential and legally protected environment to discuss challenges and improvement
strategies regarding inconsistent medication concentrations for compounded oral liquids
without fear of punitive action against them
National Healthcare Quality and Disparities Report | 37
Patient Safety
Overall Percentage
More than half (527) of drugs identified in the 2012 survey had 3 or more unique
concentrations dispensed to children across Michigan For example Rifampin used to
treat bacterial infections was reported to have 8 different concentrations dispensed to
patients
Nearly one-third (313) of reported errors caused temporary harm or required additional
monitoring despite no harm
Standardization of Compounded Liquid Medications
Source Michigan Health amp Hospital Association Keystone Center Patient Safety Organization and University of Michigan College of Pharmacy
State-Wide Initiative to Standardize the Compounding of Oral Liquids in Pediatrics
Standardization of compounded liquid medications for children in Michigan 2011
Issue identificationbull Hospitals attending PSO Pediatrics Safe
Table raise compounded medication concentrations as a major safety issue
bull Small focus group determines extent of problem
bull Michigan pharmacies are surveyed about baseline concentrations
Develop Interventionbull PSO Quarterly Safe Tables are held to
discuss cases and practicesbull Team develops recommendations for
standard concentrationsbull Consensus is achieved for frequently
compounded pediatric medications 470 formulations for 147 drug entities are reduced to 104 concentrations for 100 drugs
Practice changebull Toolkit is createdbull Standards are disseminated to Michigan
prescribers and pharmacies bull Standards are disseminated to PSO
members and Safe Table participants
Source Michigan Health amp Hospital Association Keystone Center Patient Safety Organization and University of Michigan College of Pharmacy
State-Wide Initiative to Standardize the Compounding of Oral Liquids in Pediatrics
Standardization of compounded liquid medications for children in Michigan 2011
Issue identificationbull Hospitals attending PSO Pediatrics Safe
Table raise compounded medication concentrations as a major safety issue
bull Small focus group determines extent of problem
bull Michigan pharmacies are surveyed about baseline concentrations
Develop Interventionbull PSO Quarterly Safe Tables are held to
discuss cases and practicesbull Team develops recommendations for
standard concentrationsbull Consensus is achieved for frequently
compounded pediatric medications 470 formulations for 147 drug entities are reduced to 104 concentrations for 100 drugs
Practice changebull Toolkit is createdbull Standards are disseminated to Michigan
prescribers and pharmacies bull Standards are disseminated to PSO
members and Safe Table participants
The Role of PSO Safe Tables Based on adverse medication events discussed in the
Michigan Health amp Hospital Association (MHA) Keystone Center Patient Safety
Organization (PSO) Safe Tables in July 2011 the Michigan Pediatric Safety Collaboration
was developed to further assess the scope of the problem and formulate a solution
The Collaborative The Michigan Pediatric Safety Collaboration includes individuals from
the University of Michigan College of Pharmacy the Michigan Pharmacists Association
(MPA) the Food and Drug Administration (FDA) and the MHA Keystone PSO
38 | National Healthcare Quality and Disparities Report
Patient Safety
Practice Change
As a result of the standardization effort 470 unique formulations for 147 drug entities
were reduced to 104 different concentrations for 100 drugs
The Michigan Pediatric Safety Collaboration developed a multistep process to implement
standards for compounding medications The MPA surveyed pharmacies in Michigan to
better define the nature and scope of the problem The PSO continued to act as convener
The result was the creation and dissemination of statewide standards for 120 frequently
compounded pediatric medications
Veterans Health Administration
The National Center for Patient Safety is part of the Veterans Health Administration the
Nationrsquos largest integrated health care system
Patient safety-related system improvement initiatives include
The Daily Planreg
Purchasing for Safety Initiative
Patient Safety Improvement Initiative
Patient safety improvement initiative The Daily Planreg at Veterans Affairs Medical Centers 2009
Source King BJ Mills PD Fore A et al The Daily Planreg including patients for safetys sake Nurs Manage 201243(3)15-8
0
10
20
30
40
50
Identified atleast one
error
Identifiederror
of omission
Identifiederror
ofcommission
Nurses Who Identified Errors in Patient Treatment Plan by Type
0
10
20
30
40
50
Patient founddiscrepancy inplanned care
Family founddiscrepancy inplanned care
Nursing Stafffound
discrepancyin plannedtreatment
Respondents Who Identified Errors or Discrepancies Through The Daily Plan reg
Patient safety improvement initiative The Daily Planreg at Veterans Affairs Medical Centers 2009
Source King BJ Mills PD Fore A et al The Daily Planreg including patients for safetys sake Nurs Manage 201243(3)15-8
0
10
20
30
40
50
Identified atleast one
error
Identifiederror
of omission
Identifiederror
ofcommission
Nurses Who Identified Errors in Patient Treatment Plan by Type
0
10
20
30
40
50
Patient founddiscrepancy inplanned care
Family founddiscrepancy inplanned care
Nursing Stafffound
discrepancyin plannedtreatment
Respondents Who Identified Errors or Discrepancies Through The Daily Plan reg
National Healthcare Quality and Disparities Report | 39
Patient Safety
Importance The Daily Planreg
is a two-page printed summary that acts as a schedule for
patients and providers each day It shows the procedures laboratory tests and medications
scheduled for that day and lists essential health information such as patientrsquos name allergies
and current medications It can be tailored for a patientrsquos needs by extracting orders from the
electronic medical record (EMR) The Daily Planreg
is intended to facilitate patient and family
engagement throughout the course of care The Daily Planreg
shows promise for improving
patient safety Since 2009 the VA has implemented The Daily Planreg
in more than 65
hospitals both inpatient and outpatient care settings The Daily Planreg
is shared more than
75000 times a month and the VA plans to continue the spread of The Daily Planreg
at
additional sites in 2016
Findings
As part of a pilot test in 2009 a total of 198 patients and 85 nurses responded to a survey
across 10 facilities Nurses had an average of 34 patients per shift who received The
Daily Planreg Patients responded about their own experiences whereas nurses reported
about all of their patients who received The Daily Planreg
Nearly half (475) of patients reported finding a discrepancy in planned care through
The Daily Planreg In addition 30 of patients reported that their family members found a
discrepancy Although not every discrepancy will be a potential medical error having a
shared understanding of the plan of care decreases the risk of error
More than one in six nurses (176) identified a discrepancy in treatment among their
patients through The Daily Planreg Most of these nurses (153) found one or more errors
of omission and a smaller share (106) of nurses found one or more errors of
commission some found both
40 | National Healthcare Quality and Disparities Report
Patient Safety
Issues Related to Ventilators
Common use-issues related to ventilators at the Veterans Health Administration 2006-2014 (combined)
Source Veterans Health Administration National Center for Patient Safety data collected October 2006 to October 2014
Note Examples of equipment failures include ventilator shutdown and other ventilator problems Ventilator settings include setup problems and
incorrect settings Support activities include space utilities and supplies Transport includes accidental extubation other transportation issues
and vehicle-related issues Alarms include alarm settings and alarm connection Training includes unknown ventilator model and other training
concerns
0
20
40
60
80
100
120
140
160
EquipmentFailure
VentilatorSettings
SupportActivities
Transport Alarms Training
Nu
mb
er o
f R
epo
rts
Common use-issues related to ventilators at the Veterans Health Administration 2006-2014 (combined)
Source Veterans Health Administration National Center for Patient Safety data collected October 2006 to October 2014
Note Examples of equipment failures include ventilator shutdown and other ventilator problems Ventilator settings include setup problems and
incorrect settings Support activities include space utilities and supplies Transport includes accidental extubation other transportation issues
and vehicle-related issues Alarms include alarm settings and alarm connection Training includes unknown ventilator model and other training
concerns
0
20
40
60
80
100
120
140
160
EquipmentFailure
VentilatorSettings
SupportActivities
Transport Alarms Training
Nu
mb
er o
f R
epo
rts
Importance Beginning with a focus on ventilators the Veterans Health Administrationrsquos
human factors-based Purchasing for Safety Initiative communicates the most common use-
issues associated with medical devices in order to ultimately remove or contain identified
vulnerabilities and prevent further harm
Event Reporting Patient safety managers report events and close calls from more than 150
VA facilities to a national database The largest number of use issues related to ventilators
involved equipment failure and issues such as spontaneous ventilator shutdown compressor
failure and broken or missing parts Other categories of ventilator use issues involved the
physical space where the ventilator was used challenges of transporting patients on
ventilators and problems with ventilator settings and alarms Root cause analyses on reports
are conducted and Patient Safety Alerts are issued to share the learning internally
Other Key Components
Data on ventilator issues from the VA and the Food and Drug Administrationrsquos Medical
Product Safety Network are the basis for a ldquogovernment-industry dayrdquo to work with
manufacturers This information is used to help the device manufacturers better
understand the limits of human use of their products
National Healthcare Quality and Disparities Report | 41
Patient Safety
The VA also trains noncliniciansmdashsuch as biomedical engineers across the
organizationmdashto understand the devices consider the situation for their use and identify
what can go wrong (ldquofailure modesrdquo) in advance
The VA encourages discussions among clinicians about their experience in using devices
In the Applied Patient Safety Challenge hundreds of staff participate in brainstorming
about solutions and strategies for dealing with unexpected scenarios involving devices
National Practitioner Data Bank
Medical malpractice actions are one way to flag potential medical errors
Medical Malpractice Payment Reports are submitted to the National Practitioner Data Bank
by medical malpractice payers
Report of a monetary exchange made for the benefit of a physician dentist or other
health care provider
Result of a settlement or judgment of a written complaint or claim based on that
providerrsquos delivery of or failure to deliver health care services
Number of Medical Malpractice Payment Reports by Setting
Number of Medical Malpractice Payment Reports by health care setting 2004-2014
Source National Practitioner Data Bank (NPDB) Public Use Data File Health Resources and Services Administration Bureau of Health
Professions Division of Practitioner Data Banks 2004-2014
Note Health care setting was not collected by the NPDB for 2104 reports in 2004 ldquoOtherrdquo includes Medical Malpractice Payment Reports
related to unknown settings as well as those for a combination of inpatient and outpatient settings Reports pertain to patients of any age
0
2000
4000
6000
8000
10000
12000
14000
16000
18000
20000
2004 2005 2006 2007 2008 2009 2010 2011 2012 2013 2014
Nu
mb
er o
f R
epo
rts
Total Inpatient Outpatient Other
Number of Medical Malpractice Payment Reports by health care setting 2004-2014
Source National Practitioner Data Bank (NPDB) Public Use Data File Health Resources and Services Administration Bureau of Health
Professions Division of Practitioner Data Banks 2004-2014
Note Health care setting was not collected by the NPDB for 2104 reports in 2004 ldquoOtherrdquo includes Medical Malpractice Payment Reports
related to unknown settings as well as those for a combination of inpatient and outpatient settings Reports pertain to patients of any age
0
2000
4000
6000
8000
10000
12000
14000
16000
18000
20000
2004 2005 2006 2007 2008 2009 2010 2011 2012 2013 2014
Nu
mb
er o
f R
epo
rts
Total Inpatient Outpatient Other
42 | National Healthcare Quality and Disparities Report
Patient Safety
Trends The total number of medical malpractice payment reports (MMPRs) per year
decreased from 17641 in 2004 to 12699 in 2014
Variation Across Reports
Of 157022 MMPRs from 2004 through 2014 more reports related to care in the
outpatient setting (71937) than in the inpatient setting (60391)
Diagnosis-related and treatment-related payments were the most frequent types of
reports each accounting for about 27 of cases Reports of payments for medication-
related cases accounted for only 5 of MMPRs (data not shown)
Number of Medical Malpractice Payment Reports by Allegation and Harm
Number of Medical Malpractice Payment Reports by type of allegation and harm severity 2004-2014
Key Temporary injury = Minor temporary injury and Major temporary injury Permanent significant injury = Significant Permanent Injury
Major Permanent Injury Quadriplegia Brain Damage Lifelong care
Source National Practitioner Data Bank Public Use Data File Health Resources and Services Administration Bureau of Health Professions
Division of Practitioner Data Banks 2004-2014
Note Reports pertain to patients of any age
0
20
40
60
80
100
Treatment(n=42913)
Diagnosis(n=42507)
Surgery(n=36845)
Obstetrics(n=10555)
Medication(n=8287)
Monitoring(n=5329)
Anesthesia(n=4276)
Equipment(n=1161)
BehavioralHealth
(n=879)
Blood(n=379)
EmotionalInjury Only
InsignificantInjury
TemporaryInjury
PermanentMinor Injury
PermanentSignificant Injury
Death Unknown
Number of Medical Malpractice Payment Reports by type of allegation and harm severity 2004-2014
Key Temporary injury = Minor temporary injury and Major temporary injury Permanent significant injury = Significant Permanent Injury
Major Permanent Injury Quadriplegia Brain Damage Lifelong care
Source National Practitioner Data Bank Public Use Data File Health Resources and Services Administration Bureau of Health Professions
Division of Practitioner Data Banks 2004-2014
Note Reports pertain to patients of any age
0
20
40
60
80
100
Treatment(n=42913)
Diagnosis(n=42507)
Surgery(n=36845)
Obstetrics(n=10555)
Medication(n=8287)
Monitoring(n=5329)
Anesthesia(n=4276)
Equipment(n=1161)
BehavioralHealth
(n=879)
Blood(n=379)
EmotionalInjury Only
InsignificantInjury
TemporaryInjury
PermanentMinor Injury
PermanentSignificant Injury
Death Unknown
Overall Percentage From 2004 to 2014 medical malpractice payments were made for
allegations related to
Treatment (42913)
Diagnosis (42507)
Surgery (36845)
Obstetrics (10555)
Medication (8287)
Monitoring (5329)
National Healthcare Quality and Disparities Report | 43
Patient Safety
Anesthesia (4276)
Equipment or products (1161)
Behavioral health (879) and
IV and blood products (379)
Variation Across Reports
Death accounted for more than one-third of harm in payments related to monitoring
(499) diagnosis (393) medication (383) and anesthesia (363) allegations
More than half of all obstetric payments were for allegations of permanent severe harm
(570)
Temporary harm accounted for more than one-third of payments related to equipment
(485) and surgery (360)
Most of the behavioral health-related payments were for emotional harm (457) or
death (338)
References
Agency for Healthcare Research and Quality Making Health Care Safer II An Updated Critical Analysis of the
Evidence for Patient Safety Practices Comparative Effectiveness Review No 211 Rockville MD Agency for
Healthcare Research and Quality March 2013 AHRQ Publication No 13-E001-EF
httpwwwahrqgovsitesdefaultfileswysiwygresearchfindingsevidence-basedshy
reportsservicesqualityptsafetyII-fullpdf
Arriaga AF Lancaster RT Berry RW et al The better colectomy project association of evidence-based best-
practice adherence rates to outcomes in colorectal surgery Ann Surg 2009 Oct250(4)507-13
httpwwwncbinlmnihgovpubmed19734778
Centers for Disease Control and Prevention HAI Prevalence Survey
httpwwwcdcgovHAIsurveillanceindexhtml Last updated March 2016 Accessed March 4 2016
Centers for Disease Control and Prevention Nursing Homes and Assisted Living (Long-Term Care Facilities)
httpwwwcdcgovlongtermcare Last updated September 2015 Accessed March 4 2016
Chassin MR Loeb JM High-reliability health care getting there from here Milbank Q 201391(3)459-90
httpwwwncbinlmnihgovpmcarticlesPMC3790522 Accessed September 23 2015
Chiu Y Bero L Hessol NA et al A literature review of clinical outcomes associated with antipsychotic medication
use in North American nursing home residents Health Policy 2015 Jun119(6)802-813 Epub 2015 Feb 28 PMID
25791166 httpwwwsciencedirectcomsciencearticlepiiS0168851015000652 Accessed June 17 2015
Huybrechts KF Gerhard Crystal S et al Differential risk of death in older residents in nursing homes prescribed
specific antipsychotic drugs Population based cohort study BMJ 2012 Feb 23344e977 PMID 22362541
httpwwwncbinlmnihgovpmcarticlesPMC3285717 Accessed June 17 2015
Institute of Medicine Preventing Medication Errors Quality Chasm Series 2007
httpwwwnapeducatalog11623preventing-medication-errors-quality-chasm-series
National Association for Home Care amp Hospice Basic Statistics About Home Care Updated 2010
httpwwwnahcorgassets1710hc_statspdf Accessed August 31 2015
44 | National Healthcare Quality and Disparities Report
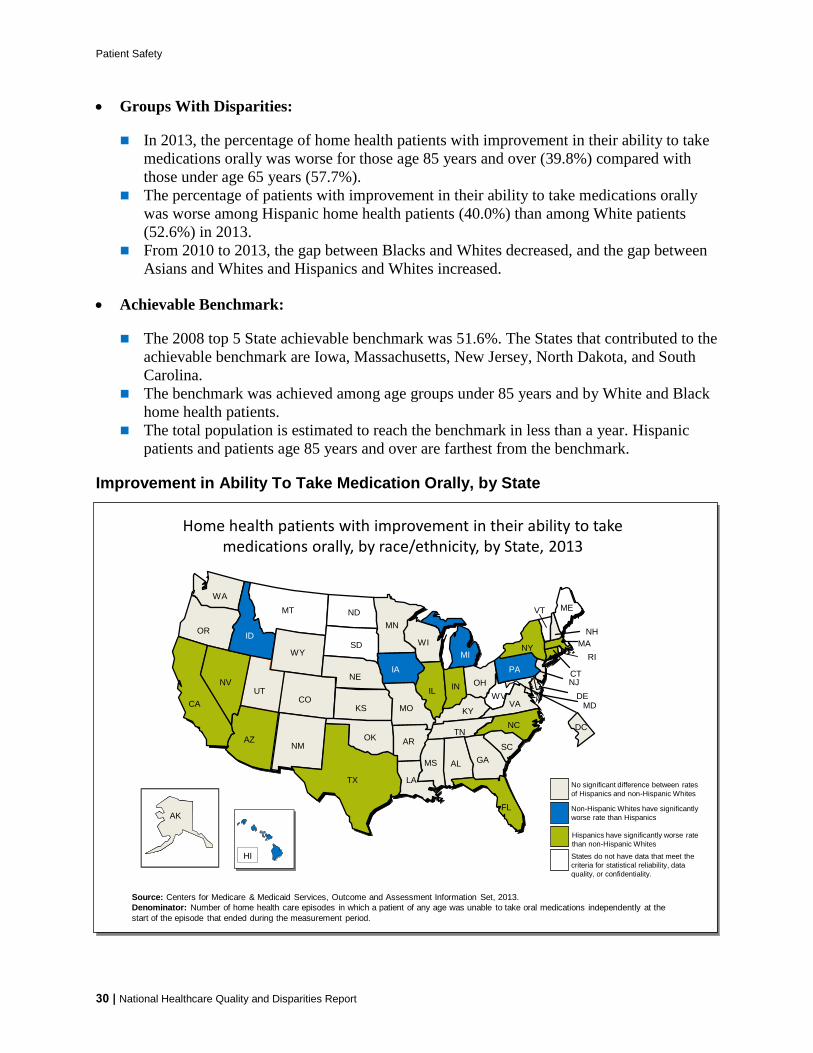
Patient Safety
Groups With Disparities
In 2013 the percentage of home health patients with improvement in their ability to take
medications orally was worse for those age 85 years and over (398) compared with
those under age 65 years (577)
The percentage of patients with improvement in their ability to take medications orally
was worse among Hispanic home health patients (400) than among White patients
(526) in 2013
From 2010 to 2013 the gap between Blacks and Whites decreased and the gap between
Asians and Whites and Hispanics and Whites increased
Achievable Benchmark
The 2008 top 5 State achievable benchmark was 516 The States that contributed to the
achievable benchmark are Iowa Massachusetts New Jersey North Dakota and South
Carolina
The benchmark was achieved among age groups under 85 years and by White and Black
home health patients
The total population is estimated to reach the benchmark in less than a year Hispanic
patients and patients age 85 years and over are farthest from the benchmark
Improvement in Ability To Take Medication Orally by State
Home health patients with improvement in their ability to take medications orally by raceethnicity by State 2013
Source Centers for Medicare amp Medicaid Services Outcome and Assessment Information Set 2013
Denominator Number of home health care episodes in which a patient of any age was unable to take oral medications independently at the
start of the episode that ended during the measurement period
AZ
CA
UT
CT
FL
GA
IA
IL
KS
MA
MDMO
NJ
NY
OR
PA
SC
TN
CO
WA
WI
VA
ME
MN
MI
NC
TX
KY
WV
RI
NE
VT
NV OH
SD
AR
IN
NH
MT
ID
WY
ND
NMOK
LA
MS AL
DE
AKAK
HI
No significant difference between rates
of Hispanics and non-Hispanic Whites
Non-Hispanic Whites have significantly
worse rate than Hispanics
States do not have data that meet the
criteria for statistical reliability data
quality or confidentiality
Hispanics have significantly worse rate
than non-Hispanic Whites
DC
Home health patients with improvement in their ability to take medications orally by raceethnicity by State 2013
Source Centers for Medicare amp Medicaid Services Outcome and Assessment Information Set 2013
Denominator Number of home health care episodes in which a patient of any age was unable to take oral medications independently at the
start of the episode that ended during the measurement period
AZ
CA
UT
CT
FL
GA
IA
IL
KS
MA
MDMO
NJ
NY
OR
PA
SC
TN
CO
WA
WI
VA
ME
MN
MI
NC
TX
KY
WV
RI
NE
VT
NV OH
SD
AR
IN
NH
MT
ID
WY
ND
NMOK
LA
MS AL
DE
AKAK
HI
No significant difference between rates
of Hispanics and non-Hispanic Whites
Non-Hispanic Whites have significantly
worse rate than Hispanics
States do not have data that meet the
criteria for statistical reliability data
quality or confidentiality
Hispanics have significantly worse rate
than non-Hispanic Whites
DC
30 | National Healthcare Quality and Disparities Report
Patient Safety
Geographic Variation
In 2013 Hispanic home health patients had worse rates of improvement in taking oral
medications than non-Hispanic White patients in 11 States (Arizona California
Connecticut Florida Illinois Indiana Massachusetts Nevada New York North
Carolina and Texas
Non-Hispanic White patients had worse rates of improvement than Hispanic patients in
five States (Hawaii Idaho Iowa Michigan and Pennsylvania)
Patient Safety in the Ambulatory Setting
Although patient safety initiatives frequently focus on inpatient hospital events adverse
effects of medical care may be identified and treated in outpatient settings
Adverse effects of medical care can follow care or procedures in hospitals emergency
departments physician offices or other settings
Measures include
Patient safety and quality issues by frequency of occurrence in outpatient medical offices
Adults age 65 years and over who received potentially inappropriate prescription medications during the calendar year
Percentage of hemodialysis patients with vascular catheter in use for 90 days or longer
For more information see the PSNet link to Patient Safety Primer Patient Safety in
Ambulatory Care httpspsnetahrqgovprimersprimer16patient-safety-in-ambulatory-care
National Healthcare Quality and Disparities Report | 31
Patient Safety
Patient Safety and Quality Issues
Patient safety and quality issues by frequency of occurrence in outpatient medical offices 2014
Source Westat analysis of the AHRQ 2014 Medical Office Survey on Patient Safety Culture Comparative Database (N=935)
Note For this measure less frequent occurrences during the year are better
0
20
40
60
80
100
A pharmacy contactedour office to clarify orcorrect a prescription
A patient was unableto get an appointmentwithin 48 hours for anacuteserious problem
A patients medicationlist was not updatedduring his or her visit
The results from a labor imaging test were notavailable when needed
A patients chartmedicalrecord was not available
when needed
Occurred DailyWeekly
Occurred Monthly
Occurred Not at All to Several Times Over the Past Year
Patient safety and quality issues by frequency of occurrence in outpatient medical offices 2014
Source Westat analysis of the AHRQ 2014 Medical Office Survey on Patient Safety Culture Comparative Database (N=935)
Note For this measure less frequent occurrences during the year are better
0
20
40
60
80
100
A pharmacy contactedour office to clarify orcorrect a prescription
A patient was unableto get an appointmentwithin 48 hours for anacuteserious problem
A patients medicationlist was not updatedduring his or her visit
The results from a labor imaging test were notavailable when needed
A patients chartmedicalrecord was not available
when needed
Occurred DailyWeekly
Occurred Monthly
Occurred Not at All to Several Times Over the Past Year
Importance Most health care takes place in the outpatient or ambulatory care setting Lack
of access to care and lack of access to timely and accurate medical information and test
results may contribute to patient safety events such as missed or delayed diagnoses
medication errors failure to order appropriate diagnostic or laboratory tests incorrect
interpretation of tests and inadequate followup on results
Overall Percentage
Almost 30 of medical offices participating in the survey reported daily or weekly
occurrences of being contacted by the pharmacist for clarification or correction on a
prescription
After prescription clarifications or corrections by the pharmacy medical offices were
next most likely to report daily or weekly issues with patients being unable to get an
appointment within 48 hours for an acute or serious problem (14) or the patientrsquos
medication list not getting updated during their visit (11)
The share of medical offices reporting that lab or imaging tests were not available when
needed reached nearly 20 when considering monthly occurrences as well as those that
occurred more frequently
32 | National Healthcare Quality and Disparities Report
Patient Safety
Potentially Inappropriate Prescriptions for Older Adults
Adults age 65 years and over who received potentially inappropriate prescription medications during the calendar year by sex and
perceived health status 2003ndash2013
Source Agency for Healthcare Research and Quality Medical Expenditure Panel Survey 2003-2013
Note For this measure lower percentages are better Prescription medications received include all prescribed medications initiall y purchased
or otherwise obtained as well as any refills For more information on inappropriate medications see the American Geriatrics Society 2012 Beers
Criteria Update Expert Panel American Geriatrics Society updated Beers Criteria for potentially inappropriate medication use in older adults J
Am Geriatr Soc 2012 Apr60(4)616-31
0
5
10
15
20
25
30
Per
cen
t
Total Male Female
0
5
10
15
20
25
30
Per
cen
t
ExcellentVery GoodGood FairPoor
Adults age 65 years and over who received potentially inappropriate prescription medications during the calendar year by sex and
perceived health status 2003ndash2013
Source Agency for Healthcare Research and Quality Medical Expenditure Panel Survey 2003-2013
Note For this measure lower percentages are better Prescription medications received include all prescribed medications initially purchased
or otherwise obtained as well as any refills For more information on inappropriate medications see the American Geriatrics Society 2012 Beers
Criteria Update Expert Panel American Geriatrics Society updated Beers Criteria for potentially inappropriate medication use in older adults J
Am Geriatr Soc 2012 Apr60(4)616-31
0
5
10
15
20
25
30
Per
cen
t
Total Male Female
0
5
10
15
20
25
30
Per
cen
t
ExcellentVery GoodGood FairPoor
Importance Some drugs that are prescribed for older patients are known to be potentially
harmful for this age group
Overall Percentage In 2013 the percentage of adults age 65 years and over who received
potentially inappropriate prescription medications was 114
Trends From 2003 to 2013 the percentage of adults age 65 years and over who received
potentially inappropriate prescription medications improved overall for both sexes and for
people with excellentvery goodgood health status and people with fairpoor health status
Groups With Disparities
In all years the percentage of patients receiving potentially inappropriate medications
was higher among females compared with males This gap was not changing over time
In all years from 2003 to 2013 the percentage of patients receiving potentially
inappropriate medications was higher among people with fairpoor health status
compared with people with excellentgood health status This gap was not changing over
time
National Healthcare Quality and Disparities Report | 33
Patient Safety
Long-Term Catheter Use in Dialysis Patients
HI
AKAK
AZ
CA
UT
CT
FL
GA
IA
IL
KS
MA
MDMO
NJ
NY
OR
PA
SC
TN
CO
WA
WI
VA
ME
MN
MI
NC
TX
KY
WV
RI
NE
VT
NV OH
SD
AR
IN
NH
MT
ID
WY
ND
NMOK
LA
MSAL
DE
DC
10-12
13-18
7-9
PR
Source Centers for Medicare and Medicaid Services Dialysis Facility Compare 2014
Denominator At-risk adult Medicare patients with a central venous catheter who were receiving regular hemodialysis treatments at dialysis
facilities
Note For this measure lower percentages are better
Percentage of hemodialysis patients with central venous catheters used for vascular access for 90 days or longer by State 2014
HI
AKAK
AZ
CA
UT
CT
FL
GA
IA
IL
KS
MA
MDMO
NJ
NY
OR
PA
SC
TN
CO
WA
WI
VA
ME
MN
MI
NC
TX
KY
WV
RI
NE
VT
NV OH
SD
AR
IN
NH
MT
ID
WY
ND
NMOK
LA
MSAL
DE
DC
10-12
13-18
7-9
PR
Source Centers for Medicare and Medicaid Services Dialysis Facility Compare 2014
Denominator At-risk adult Medicare patients with a central venous catheter who were receiving regular hemodialysis treatments at dialysis
facilities
Note For this measure lower percentages are better
Percentage of hemodialysis patients with central venous catheters used for vascular access for 90 days or longer by State 2014
Importance Central venous catheters are frequently used for vascular access to dialysis
patients until a fistula or graft is formed Central venous catheters have higher rates of
infection and adverse events among patients receiving dialysis treatment compared with
other forms of vascular access To decrease the likelihood of adverse events catheters should
be used for less than 90 days
Overall Percentage Nationally an average of 10 of dialysis patients used central venous
catheters for 90 days or longer in 2014
Geographic Variation In 2014 Alabama and Kansas had the lowest percentages of dialysis
patients using central venous catheters for 90 days or longer (7) and Puerto Rico had the
highest percentage (18) of long-term catheter use
Patient Safety Infrastructure
Efforts to improve patient safety have been accompanied by various infrastructure
enhancements
Growth in patient safety organizations which assist providers in detecting and reducing
risks and hazards from care delivery that may lead to patient harm
System improvement initiatives at the Veterans Health Administration (VHA)
34 | National Healthcare Quality and Disparities Report
Patient Safety
Development of the National Practitioner Data Bank a clearinghouse for information on
medical malpractice payments
Patient Safety Organizations
Patient safety organizations (PSOs) aim to reduce preventable adverse events near misses
and unsafe conditions in all health care settings
PSOs provide an environment for health care providers to voluntarily report discuss and
learn from patient safety events and quality analyses on a privileged and confidential basis
Measures include
Number of PSOs serving each State
Variation in concentrations of compounded liquid medications for children
Patient Safety Organizations AHRQ Common Formats
AHRQ Common Formats provide a standardized method for PSOs health care providers
and other organizations to collect and report patient safety events
Data element standards are important for aggregating and analyzing events across
providers
AHRQ Common Formats have been developed for a variety of settings of care
Acute care hospitals
Skilled nursing facilities
Retail pharmacy
More information is available at httpspsoahrqgovcommon
National Healthcare Quality and Disparities Report | 35
Patient Safety
Number of Patient Safety Organizations
AZ (2)
CA (3)
UT (2)
CT(3)
FL (8)
GA (5)
IA (4)
IL (7)
KS (5)
MA(3)
MD (4)MO(2)
NJ(3)
NY (5)
OR (3)
PA (5)
SC (4)
TN (5)
CO (2)
WA (2)
WI (5)
VA (7)
ME(2)
MN(3)
MI (3)
NC (7)
TX (6)
KY (4)WV (3)
RI(2)
NE (2)
VT(2)
NV (2)
OH (2)
SD (1)
AR (4)
IN (2)
NH(2)
MT (2)
ID (3)
WY (2)
ND (1)
NM (3)OK (2)
LA (1)
MS (2)
AL (2)
DE(2)
HI (2)
AKAK (2)
DC(3)
PR (0)
1-2
3-4
5-6
7-8
Number of PSOs
excluding PSOs
operating nationally
Number of Patient Safety Organizations by area served 2014
Source Agency for Healthcare Research and Quality Patient Safety Organization Information Form Calendar Year 2014 and PSO-PPC
Contact Database
Note PSOs included in this map were AHRQ-listed during any part of 2014 and submitted the PSO Profile to the PSO Privacy Protection
Center (PSO-PPC) in early 2015 A PSO may have members in one or more States regardless of headquarters location Each State shows the
number of PSOs that serve that State map excludes 38 PSOs that are available to providers in all States
AZ (2)
CA (3)
UT (2)
CT(3)
FL (8)
GA (5)
IA (4)
IL (7)
KS (5)
MA(3)
MD (4)MO(2)
NJ(3)
NY (5)
OR (3)
PA (5)
SC (4)
TN (5)
CO (2)
WA (2)
WI (5)
VA (7)
ME(2)
MN(3)
MI (3)
NC (7)
TX (6)
KY (4)WV (3)
RI(2)
NE (2)
VT(2)
NV (2)
OH (2)
SD (1)
AR (4)
IN (2)
NH(2)
MT (2)
ID (3)
WY (2)
ND (1)
NM (3)OK (2)
LA (1)
MS (2)
AL (2)
DE(2)
HI (2)
AKAK (2)
DC(3)
PR (0)
1-2
3-4
5-6
7-8
Number of PSOs
excluding PSOs
operating nationally
Number of Patient Safety Organizations by area served 2014
Source Agency for Healthcare Research and Quality Patient Safety Organization Information Form Calendar Year 2014 and PSO-PPC
Contact Database
Note PSOs included in this map were AHRQ-listed during any part of 2014 and submitted the PSO Profile to the PSO Privacy Protection
Center (PSO-PPC) in early 2015 A PSO may have members in one or more States regardless of headquarters location Each State shows the
number of PSOs that serve that State map excludes 38 PSOs that are available to providers in all States
Importance All patient safety organizations (PSOs) have authority to operate in all 50
States and US territories but not all do In 2014 38 PSOs self-reported being available to
providers nationally PSOs not available nationally serve specific States
Geographic Variation
Nearly all States have at least 2 PSOs available to providers in their State in addition to
the 38 national PSOs that serve all States
Florida has the most PSOs available with 8 in addition to the 38 nationally available
PSOs The States with the largest number of PSOs available are generally on the East
Coast (eg North Carolina Virginia New York Pennsylvania Tennessee Georgia) or
have large populations (eg Texas Illinois)
North Dakota South Dakota and Louisiana are the only states with just one PSO serving
their State in addition to the 38 national PSOs
Puerto Rico is served by one national PSO only
36 | National Healthcare Quality and Disparities Report
Patient Safety
Compounded Liquid Medications for Children
Compounded liquid medications for children in Michigan 2012
Source Levy S Buckley B Safe Table Success The MI Pediatric Safety Collaboration Presentation presented at the 7th Annual
Meeting of Patient Safety Organizations (PSOs) Rockville MD 2015 April and Rood JM Engels MJ Ciarkowski SL et al Variability in
compounding of oral liquids for pediatric patients a patient safety concern J Am Pharm Assn 201454(4)383-9
Note Information represents 244 responses to online survey of approximately 2000 Michigan pharmacies conducted in June 2012 by
The University of Michigan College of Pharmacy in collaboration with the Michigan Pharmacists Association
0
10
20
30
40
50
1 2 3 4 5 6 7 8 9
Nu
mb
er o
f D
rugs
Number of Unique Concentrations
Number of Different Compounded Concentrations per Drug
0
10
20
30
40
50
No Harm No Harm ButMonitoring
TemporaryHarm
Pe
rce
nt
Compounding Errors by Related Harm and Pharmacy Setting
Inpatient Outpatient
Compounded liquid medications for children in Michigan 2012
Source Levy S Buckley B Safe Table Success The MI Pediatric Safety Collaboration Presentation presented at the 7th Annual
Meeting of Patient Safety Organizations (PSOs) Rockville MD 2015 April and Rood JM Engels MJ Ciarkowski SL et al Variability in
compounding of oral liquids for pediatric patients a patient safety concern J Am Pharm Assn 201454(4)383-9
Note Information represents 244 responses to online survey of approximately 2000 Michigan pharmacies conducted in June 2012 by
The University of Michigan College of Pharmacy in collaboration with the Michigan Pharmacists Association
0
10
20
30
40
50
1 2 3 4 5 6 7 8 9
Nu
mb
er o
f D
rugs
Number of Unique Concentrations
Number of Different Compounded Concentrations per Drug
0
10
20
30
40
50
No Harm No Harm ButMonitoring
TemporaryHarm
Per
cen
t
Compounding Errors by Related Harm and Pharmacy Setting
Inpatient Outpatient
Importance
Liquid medications are widely used in pediatrics because many children find it difficult
to swallow tablets or capsules If not commercially manufactured these liquid
medications require a pharmacist to compound them to the correct dosage for the patient
This practice of compounding has led to a variety of medication concentrations in use In
the absence of standard concentrations for compounded medications there is a risk that
children may accidentally receive medications that are too potent and can be dangerous
or are too weak to be effective
The Michigan Health amp Hospital Association Keystone Center Patient Safety
Organization hosts five Pediatric Safe Tables each year Safe Tables provided a
confidential and legally protected environment to discuss challenges and improvement
strategies regarding inconsistent medication concentrations for compounded oral liquids
without fear of punitive action against them
National Healthcare Quality and Disparities Report | 37
Patient Safety
Overall Percentage
More than half (527) of drugs identified in the 2012 survey had 3 or more unique
concentrations dispensed to children across Michigan For example Rifampin used to
treat bacterial infections was reported to have 8 different concentrations dispensed to
patients
Nearly one-third (313) of reported errors caused temporary harm or required additional
monitoring despite no harm
Standardization of Compounded Liquid Medications
Source Michigan Health amp Hospital Association Keystone Center Patient Safety Organization and University of Michigan College of Pharmacy
State-Wide Initiative to Standardize the Compounding of Oral Liquids in Pediatrics
Standardization of compounded liquid medications for children in Michigan 2011
Issue identificationbull Hospitals attending PSO Pediatrics Safe
Table raise compounded medication concentrations as a major safety issue
bull Small focus group determines extent of problem
bull Michigan pharmacies are surveyed about baseline concentrations
Develop Interventionbull PSO Quarterly Safe Tables are held to
discuss cases and practicesbull Team develops recommendations for
standard concentrationsbull Consensus is achieved for frequently
compounded pediatric medications 470 formulations for 147 drug entities are reduced to 104 concentrations for 100 drugs
Practice changebull Toolkit is createdbull Standards are disseminated to Michigan
prescribers and pharmacies bull Standards are disseminated to PSO
members and Safe Table participants
Source Michigan Health amp Hospital Association Keystone Center Patient Safety Organization and University of Michigan College of Pharmacy
State-Wide Initiative to Standardize the Compounding of Oral Liquids in Pediatrics
Standardization of compounded liquid medications for children in Michigan 2011
Issue identificationbull Hospitals attending PSO Pediatrics Safe
Table raise compounded medication concentrations as a major safety issue
bull Small focus group determines extent of problem
bull Michigan pharmacies are surveyed about baseline concentrations
Develop Interventionbull PSO Quarterly Safe Tables are held to
discuss cases and practicesbull Team develops recommendations for
standard concentrationsbull Consensus is achieved for frequently
compounded pediatric medications 470 formulations for 147 drug entities are reduced to 104 concentrations for 100 drugs
Practice changebull Toolkit is createdbull Standards are disseminated to Michigan
prescribers and pharmacies bull Standards are disseminated to PSO
members and Safe Table participants
The Role of PSO Safe Tables Based on adverse medication events discussed in the
Michigan Health amp Hospital Association (MHA) Keystone Center Patient Safety
Organization (PSO) Safe Tables in July 2011 the Michigan Pediatric Safety Collaboration
was developed to further assess the scope of the problem and formulate a solution
The Collaborative The Michigan Pediatric Safety Collaboration includes individuals from
the University of Michigan College of Pharmacy the Michigan Pharmacists Association
(MPA) the Food and Drug Administration (FDA) and the MHA Keystone PSO
38 | National Healthcare Quality and Disparities Report
Patient Safety
Practice Change
As a result of the standardization effort 470 unique formulations for 147 drug entities
were reduced to 104 different concentrations for 100 drugs
The Michigan Pediatric Safety Collaboration developed a multistep process to implement
standards for compounding medications The MPA surveyed pharmacies in Michigan to
better define the nature and scope of the problem The PSO continued to act as convener
The result was the creation and dissemination of statewide standards for 120 frequently
compounded pediatric medications
Veterans Health Administration
The National Center for Patient Safety is part of the Veterans Health Administration the
Nationrsquos largest integrated health care system
Patient safety-related system improvement initiatives include
The Daily Planreg
Purchasing for Safety Initiative
Patient Safety Improvement Initiative
Patient safety improvement initiative The Daily Planreg at Veterans Affairs Medical Centers 2009
Source King BJ Mills PD Fore A et al The Daily Planreg including patients for safetys sake Nurs Manage 201243(3)15-8
0
10
20
30
40
50
Identified atleast one
error
Identifiederror
of omission
Identifiederror
ofcommission
Nurses Who Identified Errors in Patient Treatment Plan by Type
0
10
20
30
40
50
Patient founddiscrepancy inplanned care
Family founddiscrepancy inplanned care
Nursing Stafffound
discrepancyin plannedtreatment
Respondents Who Identified Errors or Discrepancies Through The Daily Plan reg
Patient safety improvement initiative The Daily Planreg at Veterans Affairs Medical Centers 2009
Source King BJ Mills PD Fore A et al The Daily Planreg including patients for safetys sake Nurs Manage 201243(3)15-8
0
10
20
30
40
50
Identified atleast one
error
Identifiederror
of omission
Identifiederror
ofcommission
Nurses Who Identified Errors in Patient Treatment Plan by Type
0
10
20
30
40
50
Patient founddiscrepancy inplanned care
Family founddiscrepancy inplanned care
Nursing Stafffound
discrepancyin plannedtreatment
Respondents Who Identified Errors or Discrepancies Through The Daily Plan reg
National Healthcare Quality and Disparities Report | 39
Patient Safety
Importance The Daily Planreg
is a two-page printed summary that acts as a schedule for
patients and providers each day It shows the procedures laboratory tests and medications
scheduled for that day and lists essential health information such as patientrsquos name allergies
and current medications It can be tailored for a patientrsquos needs by extracting orders from the
electronic medical record (EMR) The Daily Planreg
is intended to facilitate patient and family
engagement throughout the course of care The Daily Planreg
shows promise for improving
patient safety Since 2009 the VA has implemented The Daily Planreg
in more than 65
hospitals both inpatient and outpatient care settings The Daily Planreg
is shared more than
75000 times a month and the VA plans to continue the spread of The Daily Planreg
at
additional sites in 2016
Findings
As part of a pilot test in 2009 a total of 198 patients and 85 nurses responded to a survey
across 10 facilities Nurses had an average of 34 patients per shift who received The
Daily Planreg Patients responded about their own experiences whereas nurses reported
about all of their patients who received The Daily Planreg
Nearly half (475) of patients reported finding a discrepancy in planned care through
The Daily Planreg In addition 30 of patients reported that their family members found a
discrepancy Although not every discrepancy will be a potential medical error having a
shared understanding of the plan of care decreases the risk of error
More than one in six nurses (176) identified a discrepancy in treatment among their
patients through The Daily Planreg Most of these nurses (153) found one or more errors
of omission and a smaller share (106) of nurses found one or more errors of
commission some found both
40 | National Healthcare Quality and Disparities Report
Patient Safety
Issues Related to Ventilators
Common use-issues related to ventilators at the Veterans Health Administration 2006-2014 (combined)
Source Veterans Health Administration National Center for Patient Safety data collected October 2006 to October 2014
Note Examples of equipment failures include ventilator shutdown and other ventilator problems Ventilator settings include setup problems and
incorrect settings Support activities include space utilities and supplies Transport includes accidental extubation other transportation issues
and vehicle-related issues Alarms include alarm settings and alarm connection Training includes unknown ventilator model and other training
concerns
0
20
40
60
80
100
120
140
160
EquipmentFailure
VentilatorSettings
SupportActivities
Transport Alarms Training
Nu
mb
er o
f R
epo
rts
Common use-issues related to ventilators at the Veterans Health Administration 2006-2014 (combined)
Source Veterans Health Administration National Center for Patient Safety data collected October 2006 to October 2014
Note Examples of equipment failures include ventilator shutdown and other ventilator problems Ventilator settings include setup problems and
incorrect settings Support activities include space utilities and supplies Transport includes accidental extubation other transportation issues
and vehicle-related issues Alarms include alarm settings and alarm connection Training includes unknown ventilator model and other training
concerns
0
20
40
60
80
100
120
140
160
EquipmentFailure
VentilatorSettings
SupportActivities
Transport Alarms Training
Nu
mb
er o
f R
epo
rts
Importance Beginning with a focus on ventilators the Veterans Health Administrationrsquos
human factors-based Purchasing for Safety Initiative communicates the most common use-
issues associated with medical devices in order to ultimately remove or contain identified
vulnerabilities and prevent further harm
Event Reporting Patient safety managers report events and close calls from more than 150
VA facilities to a national database The largest number of use issues related to ventilators
involved equipment failure and issues such as spontaneous ventilator shutdown compressor
failure and broken or missing parts Other categories of ventilator use issues involved the
physical space where the ventilator was used challenges of transporting patients on
ventilators and problems with ventilator settings and alarms Root cause analyses on reports
are conducted and Patient Safety Alerts are issued to share the learning internally
Other Key Components
Data on ventilator issues from the VA and the Food and Drug Administrationrsquos Medical
Product Safety Network are the basis for a ldquogovernment-industry dayrdquo to work with
manufacturers This information is used to help the device manufacturers better
understand the limits of human use of their products
National Healthcare Quality and Disparities Report | 41
Patient Safety
The VA also trains noncliniciansmdashsuch as biomedical engineers across the
organizationmdashto understand the devices consider the situation for their use and identify
what can go wrong (ldquofailure modesrdquo) in advance
The VA encourages discussions among clinicians about their experience in using devices
In the Applied Patient Safety Challenge hundreds of staff participate in brainstorming
about solutions and strategies for dealing with unexpected scenarios involving devices
National Practitioner Data Bank
Medical malpractice actions are one way to flag potential medical errors
Medical Malpractice Payment Reports are submitted to the National Practitioner Data Bank
by medical malpractice payers
Report of a monetary exchange made for the benefit of a physician dentist or other
health care provider
Result of a settlement or judgment of a written complaint or claim based on that
providerrsquos delivery of or failure to deliver health care services
Number of Medical Malpractice Payment Reports by Setting
Number of Medical Malpractice Payment Reports by health care setting 2004-2014
Source National Practitioner Data Bank (NPDB) Public Use Data File Health Resources and Services Administration Bureau of Health
Professions Division of Practitioner Data Banks 2004-2014
Note Health care setting was not collected by the NPDB for 2104 reports in 2004 ldquoOtherrdquo includes Medical Malpractice Payment Reports
related to unknown settings as well as those for a combination of inpatient and outpatient settings Reports pertain to patients of any age
0
2000
4000
6000
8000
10000
12000
14000
16000
18000
20000
2004 2005 2006 2007 2008 2009 2010 2011 2012 2013 2014
Nu
mb
er o
f R
epo
rts
Total Inpatient Outpatient Other
Number of Medical Malpractice Payment Reports by health care setting 2004-2014
Source National Practitioner Data Bank (NPDB) Public Use Data File Health Resources and Services Administration Bureau of Health
Professions Division of Practitioner Data Banks 2004-2014
Note Health care setting was not collected by the NPDB for 2104 reports in 2004 ldquoOtherrdquo includes Medical Malpractice Payment Reports
related to unknown settings as well as those for a combination of inpatient and outpatient settings Reports pertain to patients of any age
0
2000
4000
6000
8000
10000
12000
14000
16000
18000
20000
2004 2005 2006 2007 2008 2009 2010 2011 2012 2013 2014
Nu
mb
er o
f R
epo
rts
Total Inpatient Outpatient Other
42 | National Healthcare Quality and Disparities Report
Patient Safety
Trends The total number of medical malpractice payment reports (MMPRs) per year
decreased from 17641 in 2004 to 12699 in 2014
Variation Across Reports
Of 157022 MMPRs from 2004 through 2014 more reports related to care in the
outpatient setting (71937) than in the inpatient setting (60391)
Diagnosis-related and treatment-related payments were the most frequent types of
reports each accounting for about 27 of cases Reports of payments for medication-
related cases accounted for only 5 of MMPRs (data not shown)
Number of Medical Malpractice Payment Reports by Allegation and Harm
Number of Medical Malpractice Payment Reports by type of allegation and harm severity 2004-2014
Key Temporary injury = Minor temporary injury and Major temporary injury Permanent significant injury = Significant Permanent Injury
Major Permanent Injury Quadriplegia Brain Damage Lifelong care
Source National Practitioner Data Bank Public Use Data File Health Resources and Services Administration Bureau of Health Professions
Division of Practitioner Data Banks 2004-2014
Note Reports pertain to patients of any age
0
20
40
60
80
100
Treatment(n=42913)
Diagnosis(n=42507)
Surgery(n=36845)
Obstetrics(n=10555)
Medication(n=8287)
Monitoring(n=5329)
Anesthesia(n=4276)
Equipment(n=1161)
BehavioralHealth
(n=879)
Blood(n=379)
EmotionalInjury Only
InsignificantInjury
TemporaryInjury
PermanentMinor Injury
PermanentSignificant Injury
Death Unknown
Number of Medical Malpractice Payment Reports by type of allegation and harm severity 2004-2014
Key Temporary injury = Minor temporary injury and Major temporary injury Permanent significant injury = Significant Permanent Injury
Major Permanent Injury Quadriplegia Brain Damage Lifelong care
Source National Practitioner Data Bank Public Use Data File Health Resources and Services Administration Bureau of Health Professions
Division of Practitioner Data Banks 2004-2014
Note Reports pertain to patients of any age
0
20
40
60
80
100
Treatment(n=42913)
Diagnosis(n=42507)
Surgery(n=36845)
Obstetrics(n=10555)
Medication(n=8287)
Monitoring(n=5329)
Anesthesia(n=4276)
Equipment(n=1161)
BehavioralHealth
(n=879)
Blood(n=379)
EmotionalInjury Only
InsignificantInjury
TemporaryInjury
PermanentMinor Injury
PermanentSignificant Injury
Death Unknown
Overall Percentage From 2004 to 2014 medical malpractice payments were made for
allegations related to
Treatment (42913)
Diagnosis (42507)
Surgery (36845)
Obstetrics (10555)
Medication (8287)
Monitoring (5329)
National Healthcare Quality and Disparities Report | 43
Patient Safety
Anesthesia (4276)
Equipment or products (1161)
Behavioral health (879) and
IV and blood products (379)
Variation Across Reports
Death accounted for more than one-third of harm in payments related to monitoring
(499) diagnosis (393) medication (383) and anesthesia (363) allegations
More than half of all obstetric payments were for allegations of permanent severe harm
(570)
Temporary harm accounted for more than one-third of payments related to equipment
(485) and surgery (360)
Most of the behavioral health-related payments were for emotional harm (457) or
death (338)
References
Agency for Healthcare Research and Quality Making Health Care Safer II An Updated Critical Analysis of the
Evidence for Patient Safety Practices Comparative Effectiveness Review No 211 Rockville MD Agency for
Healthcare Research and Quality March 2013 AHRQ Publication No 13-E001-EF
httpwwwahrqgovsitesdefaultfileswysiwygresearchfindingsevidence-basedshy
reportsservicesqualityptsafetyII-fullpdf
Arriaga AF Lancaster RT Berry RW et al The better colectomy project association of evidence-based best-
practice adherence rates to outcomes in colorectal surgery Ann Surg 2009 Oct250(4)507-13
httpwwwncbinlmnihgovpubmed19734778
Centers for Disease Control and Prevention HAI Prevalence Survey
httpwwwcdcgovHAIsurveillanceindexhtml Last updated March 2016 Accessed March 4 2016
Centers for Disease Control and Prevention Nursing Homes and Assisted Living (Long-Term Care Facilities)
httpwwwcdcgovlongtermcare Last updated September 2015 Accessed March 4 2016
Chassin MR Loeb JM High-reliability health care getting there from here Milbank Q 201391(3)459-90
httpwwwncbinlmnihgovpmcarticlesPMC3790522 Accessed September 23 2015
Chiu Y Bero L Hessol NA et al A literature review of clinical outcomes associated with antipsychotic medication
use in North American nursing home residents Health Policy 2015 Jun119(6)802-813 Epub 2015 Feb 28 PMID
25791166 httpwwwsciencedirectcomsciencearticlepiiS0168851015000652 Accessed June 17 2015
Huybrechts KF Gerhard Crystal S et al Differential risk of death in older residents in nursing homes prescribed
specific antipsychotic drugs Population based cohort study BMJ 2012 Feb 23344e977 PMID 22362541
httpwwwncbinlmnihgovpmcarticlesPMC3285717 Accessed June 17 2015
Institute of Medicine Preventing Medication Errors Quality Chasm Series 2007
httpwwwnapeducatalog11623preventing-medication-errors-quality-chasm-series
National Association for Home Care amp Hospice Basic Statistics About Home Care Updated 2010
httpwwwnahcorgassets1710hc_statspdf Accessed August 31 2015
44 | National Healthcare Quality and Disparities Report
Patient Safety
Geographic Variation
In 2013 Hispanic home health patients had worse rates of improvement in taking oral
medications than non-Hispanic White patients in 11 States (Arizona California
Connecticut Florida Illinois Indiana Massachusetts Nevada New York North
Carolina and Texas
Non-Hispanic White patients had worse rates of improvement than Hispanic patients in
five States (Hawaii Idaho Iowa Michigan and Pennsylvania)
Patient Safety in the Ambulatory Setting
Although patient safety initiatives frequently focus on inpatient hospital events adverse
effects of medical care may be identified and treated in outpatient settings
Adverse effects of medical care can follow care or procedures in hospitals emergency
departments physician offices or other settings
Measures include
Patient safety and quality issues by frequency of occurrence in outpatient medical offices
Adults age 65 years and over who received potentially inappropriate prescription medications during the calendar year
Percentage of hemodialysis patients with vascular catheter in use for 90 days or longer
For more information see the PSNet link to Patient Safety Primer Patient Safety in
Ambulatory Care httpspsnetahrqgovprimersprimer16patient-safety-in-ambulatory-care
National Healthcare Quality and Disparities Report | 31
Patient Safety
Patient Safety and Quality Issues
Patient safety and quality issues by frequency of occurrence in outpatient medical offices 2014
Source Westat analysis of the AHRQ 2014 Medical Office Survey on Patient Safety Culture Comparative Database (N=935)
Note For this measure less frequent occurrences during the year are better
0
20
40
60
80
100
A pharmacy contactedour office to clarify orcorrect a prescription
A patient was unableto get an appointmentwithin 48 hours for anacuteserious problem
A patients medicationlist was not updatedduring his or her visit
The results from a labor imaging test were notavailable when needed
A patients chartmedicalrecord was not available
when needed
Occurred DailyWeekly
Occurred Monthly
Occurred Not at All to Several Times Over the Past Year
Patient safety and quality issues by frequency of occurrence in outpatient medical offices 2014
Source Westat analysis of the AHRQ 2014 Medical Office Survey on Patient Safety Culture Comparative Database (N=935)
Note For this measure less frequent occurrences during the year are better
0
20
40
60
80
100
A pharmacy contactedour office to clarify orcorrect a prescription
A patient was unableto get an appointmentwithin 48 hours for anacuteserious problem
A patients medicationlist was not updatedduring his or her visit
The results from a labor imaging test were notavailable when needed
A patients chartmedicalrecord was not available
when needed
Occurred DailyWeekly
Occurred Monthly
Occurred Not at All to Several Times Over the Past Year
Importance Most health care takes place in the outpatient or ambulatory care setting Lack
of access to care and lack of access to timely and accurate medical information and test
results may contribute to patient safety events such as missed or delayed diagnoses
medication errors failure to order appropriate diagnostic or laboratory tests incorrect
interpretation of tests and inadequate followup on results
Overall Percentage
Almost 30 of medical offices participating in the survey reported daily or weekly
occurrences of being contacted by the pharmacist for clarification or correction on a
prescription
After prescription clarifications or corrections by the pharmacy medical offices were
next most likely to report daily or weekly issues with patients being unable to get an
appointment within 48 hours for an acute or serious problem (14) or the patientrsquos
medication list not getting updated during their visit (11)
The share of medical offices reporting that lab or imaging tests were not available when
needed reached nearly 20 when considering monthly occurrences as well as those that
occurred more frequently
32 | National Healthcare Quality and Disparities Report
Patient Safety
Potentially Inappropriate Prescriptions for Older Adults
Adults age 65 years and over who received potentially inappropriate prescription medications during the calendar year by sex and
perceived health status 2003ndash2013
Source Agency for Healthcare Research and Quality Medical Expenditure Panel Survey 2003-2013
Note For this measure lower percentages are better Prescription medications received include all prescribed medications initiall y purchased
or otherwise obtained as well as any refills For more information on inappropriate medications see the American Geriatrics Society 2012 Beers
Criteria Update Expert Panel American Geriatrics Society updated Beers Criteria for potentially inappropriate medication use in older adults J
Am Geriatr Soc 2012 Apr60(4)616-31
0
5
10
15
20
25
30
Per
cen
t
Total Male Female
0
5
10
15
20
25
30
Per
cen
t
ExcellentVery GoodGood FairPoor
Adults age 65 years and over who received potentially inappropriate prescription medications during the calendar year by sex and
perceived health status 2003ndash2013
Source Agency for Healthcare Research and Quality Medical Expenditure Panel Survey 2003-2013
Note For this measure lower percentages are better Prescription medications received include all prescribed medications initially purchased
or otherwise obtained as well as any refills For more information on inappropriate medications see the American Geriatrics Society 2012 Beers
Criteria Update Expert Panel American Geriatrics Society updated Beers Criteria for potentially inappropriate medication use in older adults J
Am Geriatr Soc 2012 Apr60(4)616-31
0
5
10
15
20
25
30
Per
cen
t
Total Male Female
0
5
10
15
20
25
30
Per
cen
t
ExcellentVery GoodGood FairPoor
Importance Some drugs that are prescribed for older patients are known to be potentially
harmful for this age group
Overall Percentage In 2013 the percentage of adults age 65 years and over who received
potentially inappropriate prescription medications was 114
Trends From 2003 to 2013 the percentage of adults age 65 years and over who received
potentially inappropriate prescription medications improved overall for both sexes and for
people with excellentvery goodgood health status and people with fairpoor health status
Groups With Disparities
In all years the percentage of patients receiving potentially inappropriate medications
was higher among females compared with males This gap was not changing over time
In all years from 2003 to 2013 the percentage of patients receiving potentially
inappropriate medications was higher among people with fairpoor health status
compared with people with excellentgood health status This gap was not changing over
time
National Healthcare Quality and Disparities Report | 33
Patient Safety
Long-Term Catheter Use in Dialysis Patients
HI
AKAK
AZ
CA
UT
CT
FL
GA
IA
IL
KS
MA
MDMO
NJ
NY
OR
PA
SC
TN
CO
WA
WI
VA
ME
MN
MI
NC
TX
KY
WV
RI
NE
VT
NV OH
SD
AR
IN
NH
MT
ID
WY
ND
NMOK
LA
MSAL
DE
DC
10-12
13-18
7-9
PR
Source Centers for Medicare and Medicaid Services Dialysis Facility Compare 2014
Denominator At-risk adult Medicare patients with a central venous catheter who were receiving regular hemodialysis treatments at dialysis
facilities
Note For this measure lower percentages are better
Percentage of hemodialysis patients with central venous catheters used for vascular access for 90 days or longer by State 2014
HI
AKAK
AZ
CA
UT
CT
FL
GA
IA
IL
KS
MA
MDMO
NJ
NY
OR
PA
SC
TN
CO
WA
WI
VA
ME
MN
MI
NC
TX
KY
WV
RI
NE
VT
NV OH
SD
AR
IN
NH
MT
ID
WY
ND
NMOK
LA
MSAL
DE
DC
10-12
13-18
7-9
PR
Source Centers for Medicare and Medicaid Services Dialysis Facility Compare 2014
Denominator At-risk adult Medicare patients with a central venous catheter who were receiving regular hemodialysis treatments at dialysis
facilities
Note For this measure lower percentages are better
Percentage of hemodialysis patients with central venous catheters used for vascular access for 90 days or longer by State 2014
Importance Central venous catheters are frequently used for vascular access to dialysis
patients until a fistula or graft is formed Central venous catheters have higher rates of
infection and adverse events among patients receiving dialysis treatment compared with
other forms of vascular access To decrease the likelihood of adverse events catheters should
be used for less than 90 days
Overall Percentage Nationally an average of 10 of dialysis patients used central venous
catheters for 90 days or longer in 2014
Geographic Variation In 2014 Alabama and Kansas had the lowest percentages of dialysis
patients using central venous catheters for 90 days or longer (7) and Puerto Rico had the
highest percentage (18) of long-term catheter use
Patient Safety Infrastructure
Efforts to improve patient safety have been accompanied by various infrastructure
enhancements
Growth in patient safety organizations which assist providers in detecting and reducing
risks and hazards from care delivery that may lead to patient harm
System improvement initiatives at the Veterans Health Administration (VHA)
34 | National Healthcare Quality and Disparities Report
Patient Safety
Development of the National Practitioner Data Bank a clearinghouse for information on
medical malpractice payments
Patient Safety Organizations
Patient safety organizations (PSOs) aim to reduce preventable adverse events near misses
and unsafe conditions in all health care settings
PSOs provide an environment for health care providers to voluntarily report discuss and
learn from patient safety events and quality analyses on a privileged and confidential basis
Measures include
Number of PSOs serving each State
Variation in concentrations of compounded liquid medications for children
Patient Safety Organizations AHRQ Common Formats
AHRQ Common Formats provide a standardized method for PSOs health care providers
and other organizations to collect and report patient safety events
Data element standards are important for aggregating and analyzing events across
providers
AHRQ Common Formats have been developed for a variety of settings of care
Acute care hospitals
Skilled nursing facilities
Retail pharmacy
More information is available at httpspsoahrqgovcommon
National Healthcare Quality and Disparities Report | 35
Patient Safety
Number of Patient Safety Organizations
AZ (2)
CA (3)
UT (2)
CT(3)
FL (8)
GA (5)
IA (4)
IL (7)
KS (5)
MA(3)
MD (4)MO(2)
NJ(3)
NY (5)
OR (3)
PA (5)
SC (4)
TN (5)
CO (2)
WA (2)
WI (5)
VA (7)
ME(2)
MN(3)
MI (3)
NC (7)
TX (6)
KY (4)WV (3)
RI(2)
NE (2)
VT(2)
NV (2)
OH (2)
SD (1)
AR (4)
IN (2)
NH(2)
MT (2)
ID (3)
WY (2)
ND (1)
NM (3)OK (2)
LA (1)
MS (2)
AL (2)
DE(2)
HI (2)
AKAK (2)
DC(3)
PR (0)
1-2
3-4
5-6
7-8
Number of PSOs
excluding PSOs
operating nationally
Number of Patient Safety Organizations by area served 2014
Source Agency for Healthcare Research and Quality Patient Safety Organization Information Form Calendar Year 2014 and PSO-PPC
Contact Database
Note PSOs included in this map were AHRQ-listed during any part of 2014 and submitted the PSO Profile to the PSO Privacy Protection
Center (PSO-PPC) in early 2015 A PSO may have members in one or more States regardless of headquarters location Each State shows the
number of PSOs that serve that State map excludes 38 PSOs that are available to providers in all States
AZ (2)
CA (3)
UT (2)
CT(3)
FL (8)
GA (5)
IA (4)
IL (7)
KS (5)
MA(3)
MD (4)MO(2)
NJ(3)
NY (5)
OR (3)
PA (5)
SC (4)
TN (5)
CO (2)
WA (2)
WI (5)
VA (7)
ME(2)
MN(3)
MI (3)
NC (7)
TX (6)
KY (4)WV (3)
RI(2)
NE (2)
VT(2)
NV (2)
OH (2)
SD (1)
AR (4)
IN (2)
NH(2)
MT (2)
ID (3)
WY (2)
ND (1)
NM (3)OK (2)
LA (1)
MS (2)
AL (2)
DE(2)
HI (2)
AKAK (2)
DC(3)
PR (0)
1-2
3-4
5-6
7-8
Number of PSOs
excluding PSOs
operating nationally
Number of Patient Safety Organizations by area served 2014
Source Agency for Healthcare Research and Quality Patient Safety Organization Information Form Calendar Year 2014 and PSO-PPC
Contact Database
Note PSOs included in this map were AHRQ-listed during any part of 2014 and submitted the PSO Profile to the PSO Privacy Protection
Center (PSO-PPC) in early 2015 A PSO may have members in one or more States regardless of headquarters location Each State shows the
number of PSOs that serve that State map excludes 38 PSOs that are available to providers in all States
Importance All patient safety organizations (PSOs) have authority to operate in all 50
States and US territories but not all do In 2014 38 PSOs self-reported being available to
providers nationally PSOs not available nationally serve specific States
Geographic Variation
Nearly all States have at least 2 PSOs available to providers in their State in addition to
the 38 national PSOs that serve all States
Florida has the most PSOs available with 8 in addition to the 38 nationally available
PSOs The States with the largest number of PSOs available are generally on the East
Coast (eg North Carolina Virginia New York Pennsylvania Tennessee Georgia) or
have large populations (eg Texas Illinois)
North Dakota South Dakota and Louisiana are the only states with just one PSO serving
their State in addition to the 38 national PSOs
Puerto Rico is served by one national PSO only
36 | National Healthcare Quality and Disparities Report
Patient Safety
Compounded Liquid Medications for Children
Compounded liquid medications for children in Michigan 2012
Source Levy S Buckley B Safe Table Success The MI Pediatric Safety Collaboration Presentation presented at the 7th Annual
Meeting of Patient Safety Organizations (PSOs) Rockville MD 2015 April and Rood JM Engels MJ Ciarkowski SL et al Variability in
compounding of oral liquids for pediatric patients a patient safety concern J Am Pharm Assn 201454(4)383-9
Note Information represents 244 responses to online survey of approximately 2000 Michigan pharmacies conducted in June 2012 by
The University of Michigan College of Pharmacy in collaboration with the Michigan Pharmacists Association
0
10
20
30
40
50
1 2 3 4 5 6 7 8 9
Nu
mb
er o
f D
rugs
Number of Unique Concentrations
Number of Different Compounded Concentrations per Drug
0
10
20
30
40
50
No Harm No Harm ButMonitoring
TemporaryHarm
Pe
rce
nt
Compounding Errors by Related Harm and Pharmacy Setting
Inpatient Outpatient
Compounded liquid medications for children in Michigan 2012
Source Levy S Buckley B Safe Table Success The MI Pediatric Safety Collaboration Presentation presented at the 7th Annual
Meeting of Patient Safety Organizations (PSOs) Rockville MD 2015 April and Rood JM Engels MJ Ciarkowski SL et al Variability in
compounding of oral liquids for pediatric patients a patient safety concern J Am Pharm Assn 201454(4)383-9
Note Information represents 244 responses to online survey of approximately 2000 Michigan pharmacies conducted in June 2012 by
The University of Michigan College of Pharmacy in collaboration with the Michigan Pharmacists Association
0
10
20
30
40
50
1 2 3 4 5 6 7 8 9
Nu
mb
er o
f D
rugs
Number of Unique Concentrations
Number of Different Compounded Concentrations per Drug
0
10
20
30
40
50
No Harm No Harm ButMonitoring
TemporaryHarm
Per
cen
t
Compounding Errors by Related Harm and Pharmacy Setting
Inpatient Outpatient
Importance
Liquid medications are widely used in pediatrics because many children find it difficult
to swallow tablets or capsules If not commercially manufactured these liquid
medications require a pharmacist to compound them to the correct dosage for the patient
This practice of compounding has led to a variety of medication concentrations in use In
the absence of standard concentrations for compounded medications there is a risk that
children may accidentally receive medications that are too potent and can be dangerous
or are too weak to be effective
The Michigan Health amp Hospital Association Keystone Center Patient Safety
Organization hosts five Pediatric Safe Tables each year Safe Tables provided a
confidential and legally protected environment to discuss challenges and improvement
strategies regarding inconsistent medication concentrations for compounded oral liquids
without fear of punitive action against them
National Healthcare Quality and Disparities Report | 37
Patient Safety
Overall Percentage
More than half (527) of drugs identified in the 2012 survey had 3 or more unique
concentrations dispensed to children across Michigan For example Rifampin used to
treat bacterial infections was reported to have 8 different concentrations dispensed to
patients
Nearly one-third (313) of reported errors caused temporary harm or required additional
monitoring despite no harm
Standardization of Compounded Liquid Medications
Source Michigan Health amp Hospital Association Keystone Center Patient Safety Organization and University of Michigan College of Pharmacy
State-Wide Initiative to Standardize the Compounding of Oral Liquids in Pediatrics
Standardization of compounded liquid medications for children in Michigan 2011
Issue identificationbull Hospitals attending PSO Pediatrics Safe
Table raise compounded medication concentrations as a major safety issue
bull Small focus group determines extent of problem
bull Michigan pharmacies are surveyed about baseline concentrations
Develop Interventionbull PSO Quarterly Safe Tables are held to
discuss cases and practicesbull Team develops recommendations for
standard concentrationsbull Consensus is achieved for frequently
compounded pediatric medications 470 formulations for 147 drug entities are reduced to 104 concentrations for 100 drugs
Practice changebull Toolkit is createdbull Standards are disseminated to Michigan
prescribers and pharmacies bull Standards are disseminated to PSO
members and Safe Table participants
Source Michigan Health amp Hospital Association Keystone Center Patient Safety Organization and University of Michigan College of Pharmacy
State-Wide Initiative to Standardize the Compounding of Oral Liquids in Pediatrics
Standardization of compounded liquid medications for children in Michigan 2011
Issue identificationbull Hospitals attending PSO Pediatrics Safe
Table raise compounded medication concentrations as a major safety issue
bull Small focus group determines extent of problem
bull Michigan pharmacies are surveyed about baseline concentrations
Develop Interventionbull PSO Quarterly Safe Tables are held to
discuss cases and practicesbull Team develops recommendations for
standard concentrationsbull Consensus is achieved for frequently
compounded pediatric medications 470 formulations for 147 drug entities are reduced to 104 concentrations for 100 drugs
Practice changebull Toolkit is createdbull Standards are disseminated to Michigan
prescribers and pharmacies bull Standards are disseminated to PSO
members and Safe Table participants
The Role of PSO Safe Tables Based on adverse medication events discussed in the
Michigan Health amp Hospital Association (MHA) Keystone Center Patient Safety
Organization (PSO) Safe Tables in July 2011 the Michigan Pediatric Safety Collaboration
was developed to further assess the scope of the problem and formulate a solution
The Collaborative The Michigan Pediatric Safety Collaboration includes individuals from
the University of Michigan College of Pharmacy the Michigan Pharmacists Association
(MPA) the Food and Drug Administration (FDA) and the MHA Keystone PSO
38 | National Healthcare Quality and Disparities Report
Patient Safety
Practice Change
As a result of the standardization effort 470 unique formulations for 147 drug entities
were reduced to 104 different concentrations for 100 drugs
The Michigan Pediatric Safety Collaboration developed a multistep process to implement
standards for compounding medications The MPA surveyed pharmacies in Michigan to
better define the nature and scope of the problem The PSO continued to act as convener
The result was the creation and dissemination of statewide standards for 120 frequently
compounded pediatric medications
Veterans Health Administration
The National Center for Patient Safety is part of the Veterans Health Administration the
Nationrsquos largest integrated health care system
Patient safety-related system improvement initiatives include
The Daily Planreg
Purchasing for Safety Initiative
Patient Safety Improvement Initiative
Patient safety improvement initiative The Daily Planreg at Veterans Affairs Medical Centers 2009
Source King BJ Mills PD Fore A et al The Daily Planreg including patients for safetys sake Nurs Manage 201243(3)15-8
0
10
20
30
40
50
Identified atleast one
error
Identifiederror
of omission
Identifiederror
ofcommission
Nurses Who Identified Errors in Patient Treatment Plan by Type
0
10
20
30
40
50
Patient founddiscrepancy inplanned care
Family founddiscrepancy inplanned care
Nursing Stafffound
discrepancyin plannedtreatment
Respondents Who Identified Errors or Discrepancies Through The Daily Plan reg
Patient safety improvement initiative The Daily Planreg at Veterans Affairs Medical Centers 2009
Source King BJ Mills PD Fore A et al The Daily Planreg including patients for safetys sake Nurs Manage 201243(3)15-8
0
10
20
30
40
50
Identified atleast one
error
Identifiederror
of omission
Identifiederror
ofcommission
Nurses Who Identified Errors in Patient Treatment Plan by Type
0
10
20
30
40
50
Patient founddiscrepancy inplanned care
Family founddiscrepancy inplanned care
Nursing Stafffound
discrepancyin plannedtreatment
Respondents Who Identified Errors or Discrepancies Through The Daily Plan reg
National Healthcare Quality and Disparities Report | 39
Patient Safety
Importance The Daily Planreg
is a two-page printed summary that acts as a schedule for
patients and providers each day It shows the procedures laboratory tests and medications
scheduled for that day and lists essential health information such as patientrsquos name allergies
and current medications It can be tailored for a patientrsquos needs by extracting orders from the
electronic medical record (EMR) The Daily Planreg
is intended to facilitate patient and family
engagement throughout the course of care The Daily Planreg
shows promise for improving
patient safety Since 2009 the VA has implemented The Daily Planreg
in more than 65
hospitals both inpatient and outpatient care settings The Daily Planreg
is shared more than
75000 times a month and the VA plans to continue the spread of The Daily Planreg
at
additional sites in 2016
Findings
As part of a pilot test in 2009 a total of 198 patients and 85 nurses responded to a survey
across 10 facilities Nurses had an average of 34 patients per shift who received The
Daily Planreg Patients responded about their own experiences whereas nurses reported
about all of their patients who received The Daily Planreg
Nearly half (475) of patients reported finding a discrepancy in planned care through
The Daily Planreg In addition 30 of patients reported that their family members found a
discrepancy Although not every discrepancy will be a potential medical error having a
shared understanding of the plan of care decreases the risk of error
More than one in six nurses (176) identified a discrepancy in treatment among their
patients through The Daily Planreg Most of these nurses (153) found one or more errors
of omission and a smaller share (106) of nurses found one or more errors of
commission some found both
40 | National Healthcare Quality and Disparities Report
Patient Safety
Issues Related to Ventilators
Common use-issues related to ventilators at the Veterans Health Administration 2006-2014 (combined)
Source Veterans Health Administration National Center for Patient Safety data collected October 2006 to October 2014
Note Examples of equipment failures include ventilator shutdown and other ventilator problems Ventilator settings include setup problems and
incorrect settings Support activities include space utilities and supplies Transport includes accidental extubation other transportation issues
and vehicle-related issues Alarms include alarm settings and alarm connection Training includes unknown ventilator model and other training
concerns
0
20
40
60
80
100
120
140
160
EquipmentFailure
VentilatorSettings
SupportActivities
Transport Alarms Training
Nu
mb
er o
f R
epo
rts
Common use-issues related to ventilators at the Veterans Health Administration 2006-2014 (combined)
Source Veterans Health Administration National Center for Patient Safety data collected October 2006 to October 2014
Note Examples of equipment failures include ventilator shutdown and other ventilator problems Ventilator settings include setup problems and
incorrect settings Support activities include space utilities and supplies Transport includes accidental extubation other transportation issues
and vehicle-related issues Alarms include alarm settings and alarm connection Training includes unknown ventilator model and other training
concerns
0
20
40
60
80
100
120
140
160
EquipmentFailure
VentilatorSettings
SupportActivities
Transport Alarms Training
Nu
mb
er o
f R
epo
rts
Importance Beginning with a focus on ventilators the Veterans Health Administrationrsquos
human factors-based Purchasing for Safety Initiative communicates the most common use-
issues associated with medical devices in order to ultimately remove or contain identified
vulnerabilities and prevent further harm
Event Reporting Patient safety managers report events and close calls from more than 150
VA facilities to a national database The largest number of use issues related to ventilators
involved equipment failure and issues such as spontaneous ventilator shutdown compressor
failure and broken or missing parts Other categories of ventilator use issues involved the
physical space where the ventilator was used challenges of transporting patients on
ventilators and problems with ventilator settings and alarms Root cause analyses on reports
are conducted and Patient Safety Alerts are issued to share the learning internally
Other Key Components
Data on ventilator issues from the VA and the Food and Drug Administrationrsquos Medical
Product Safety Network are the basis for a ldquogovernment-industry dayrdquo to work with
manufacturers This information is used to help the device manufacturers better
understand the limits of human use of their products
National Healthcare Quality and Disparities Report | 41
Patient Safety
The VA also trains noncliniciansmdashsuch as biomedical engineers across the
organizationmdashto understand the devices consider the situation for their use and identify
what can go wrong (ldquofailure modesrdquo) in advance
The VA encourages discussions among clinicians about their experience in using devices
In the Applied Patient Safety Challenge hundreds of staff participate in brainstorming
about solutions and strategies for dealing with unexpected scenarios involving devices
National Practitioner Data Bank
Medical malpractice actions are one way to flag potential medical errors
Medical Malpractice Payment Reports are submitted to the National Practitioner Data Bank
by medical malpractice payers
Report of a monetary exchange made for the benefit of a physician dentist or other
health care provider
Result of a settlement or judgment of a written complaint or claim based on that
providerrsquos delivery of or failure to deliver health care services
Number of Medical Malpractice Payment Reports by Setting
Number of Medical Malpractice Payment Reports by health care setting 2004-2014
Source National Practitioner Data Bank (NPDB) Public Use Data File Health Resources and Services Administration Bureau of Health
Professions Division of Practitioner Data Banks 2004-2014
Note Health care setting was not collected by the NPDB for 2104 reports in 2004 ldquoOtherrdquo includes Medical Malpractice Payment Reports
related to unknown settings as well as those for a combination of inpatient and outpatient settings Reports pertain to patients of any age
0
2000
4000
6000
8000
10000
12000
14000
16000
18000
20000
2004 2005 2006 2007 2008 2009 2010 2011 2012 2013 2014
Nu
mb
er o
f R
epo
rts
Total Inpatient Outpatient Other
Number of Medical Malpractice Payment Reports by health care setting 2004-2014
Source National Practitioner Data Bank (NPDB) Public Use Data File Health Resources and Services Administration Bureau of Health
Professions Division of Practitioner Data Banks 2004-2014
Note Health care setting was not collected by the NPDB for 2104 reports in 2004 ldquoOtherrdquo includes Medical Malpractice Payment Reports
related to unknown settings as well as those for a combination of inpatient and outpatient settings Reports pertain to patients of any age
0
2000
4000
6000
8000
10000
12000
14000
16000
18000
20000
2004 2005 2006 2007 2008 2009 2010 2011 2012 2013 2014
Nu
mb
er o
f R
epo
rts
Total Inpatient Outpatient Other
42 | National Healthcare Quality and Disparities Report
Patient Safety
Trends The total number of medical malpractice payment reports (MMPRs) per year
decreased from 17641 in 2004 to 12699 in 2014
Variation Across Reports
Of 157022 MMPRs from 2004 through 2014 more reports related to care in the
outpatient setting (71937) than in the inpatient setting (60391)
Diagnosis-related and treatment-related payments were the most frequent types of
reports each accounting for about 27 of cases Reports of payments for medication-
related cases accounted for only 5 of MMPRs (data not shown)
Number of Medical Malpractice Payment Reports by Allegation and Harm
Number of Medical Malpractice Payment Reports by type of allegation and harm severity 2004-2014
Key Temporary injury = Minor temporary injury and Major temporary injury Permanent significant injury = Significant Permanent Injury
Major Permanent Injury Quadriplegia Brain Damage Lifelong care
Source National Practitioner Data Bank Public Use Data File Health Resources and Services Administration Bureau of Health Professions
Division of Practitioner Data Banks 2004-2014
Note Reports pertain to patients of any age
0
20
40
60
80
100
Treatment(n=42913)
Diagnosis(n=42507)
Surgery(n=36845)
Obstetrics(n=10555)
Medication(n=8287)
Monitoring(n=5329)
Anesthesia(n=4276)
Equipment(n=1161)
BehavioralHealth
(n=879)
Blood(n=379)
EmotionalInjury Only
InsignificantInjury
TemporaryInjury
PermanentMinor Injury
PermanentSignificant Injury
Death Unknown
Number of Medical Malpractice Payment Reports by type of allegation and harm severity 2004-2014
Key Temporary injury = Minor temporary injury and Major temporary injury Permanent significant injury = Significant Permanent Injury
Major Permanent Injury Quadriplegia Brain Damage Lifelong care
Source National Practitioner Data Bank Public Use Data File Health Resources and Services Administration Bureau of Health Professions
Division of Practitioner Data Banks 2004-2014
Note Reports pertain to patients of any age
0
20
40
60
80
100
Treatment(n=42913)
Diagnosis(n=42507)
Surgery(n=36845)
Obstetrics(n=10555)
Medication(n=8287)
Monitoring(n=5329)
Anesthesia(n=4276)
Equipment(n=1161)
BehavioralHealth
(n=879)
Blood(n=379)
EmotionalInjury Only
InsignificantInjury
TemporaryInjury
PermanentMinor Injury
PermanentSignificant Injury
Death Unknown
Overall Percentage From 2004 to 2014 medical malpractice payments were made for
allegations related to
Treatment (42913)
Diagnosis (42507)
Surgery (36845)
Obstetrics (10555)
Medication (8287)
Monitoring (5329)
National Healthcare Quality and Disparities Report | 43
Patient Safety
Anesthesia (4276)
Equipment or products (1161)
Behavioral health (879) and
IV and blood products (379)
Variation Across Reports
Death accounted for more than one-third of harm in payments related to monitoring
(499) diagnosis (393) medication (383) and anesthesia (363) allegations
More than half of all obstetric payments were for allegations of permanent severe harm
(570)
Temporary harm accounted for more than one-third of payments related to equipment
(485) and surgery (360)
Most of the behavioral health-related payments were for emotional harm (457) or
death (338)
References
Agency for Healthcare Research and Quality Making Health Care Safer II An Updated Critical Analysis of the
Evidence for Patient Safety Practices Comparative Effectiveness Review No 211 Rockville MD Agency for
Healthcare Research and Quality March 2013 AHRQ Publication No 13-E001-EF
httpwwwahrqgovsitesdefaultfileswysiwygresearchfindingsevidence-basedshy
reportsservicesqualityptsafetyII-fullpdf
Arriaga AF Lancaster RT Berry RW et al The better colectomy project association of evidence-based best-
practice adherence rates to outcomes in colorectal surgery Ann Surg 2009 Oct250(4)507-13
httpwwwncbinlmnihgovpubmed19734778
Centers for Disease Control and Prevention HAI Prevalence Survey
httpwwwcdcgovHAIsurveillanceindexhtml Last updated March 2016 Accessed March 4 2016
Centers for Disease Control and Prevention Nursing Homes and Assisted Living (Long-Term Care Facilities)
httpwwwcdcgovlongtermcare Last updated September 2015 Accessed March 4 2016
Chassin MR Loeb JM High-reliability health care getting there from here Milbank Q 201391(3)459-90
httpwwwncbinlmnihgovpmcarticlesPMC3790522 Accessed September 23 2015
Chiu Y Bero L Hessol NA et al A literature review of clinical outcomes associated with antipsychotic medication
use in North American nursing home residents Health Policy 2015 Jun119(6)802-813 Epub 2015 Feb 28 PMID
25791166 httpwwwsciencedirectcomsciencearticlepiiS0168851015000652 Accessed June 17 2015
Huybrechts KF Gerhard Crystal S et al Differential risk of death in older residents in nursing homes prescribed
specific antipsychotic drugs Population based cohort study BMJ 2012 Feb 23344e977 PMID 22362541
httpwwwncbinlmnihgovpmcarticlesPMC3285717 Accessed June 17 2015
Institute of Medicine Preventing Medication Errors Quality Chasm Series 2007
httpwwwnapeducatalog11623preventing-medication-errors-quality-chasm-series
National Association for Home Care amp Hospice Basic Statistics About Home Care Updated 2010
httpwwwnahcorgassets1710hc_statspdf Accessed August 31 2015
44 | National Healthcare Quality and Disparities Report

Patient Safety
Potentially Inappropriate Prescriptions for Older Adults
Adults age 65 years and over who received potentially inappropriate prescription medications during the calendar year by sex and
perceived health status 2003ndash2013
Source Agency for Healthcare Research and Quality Medical Expenditure Panel Survey 2003-2013
Note For this measure lower percentages are better Prescription medications received include all prescribed medications initiall y purchased
or otherwise obtained as well as any refills For more information on inappropriate medications see the American Geriatrics Society 2012 Beers
Criteria Update Expert Panel American Geriatrics Society updated Beers Criteria for potentially inappropriate medication use in older adults J
Am Geriatr Soc 2012 Apr60(4)616-31
0
5
10
15
20
25
30
Per
cen
t
Total Male Female
0
5
10
15
20
25
30
Per
cen
t
ExcellentVery GoodGood FairPoor
Adults age 65 years and over who received potentially inappropriate prescription medications during the calendar year by sex and
perceived health status 2003ndash2013
Source Agency for Healthcare Research and Quality Medical Expenditure Panel Survey 2003-2013
Note For this measure lower percentages are better Prescription medications received include all prescribed medications initially purchased
or otherwise obtained as well as any refills For more information on inappropriate medications see the American Geriatrics Society 2012 Beers
Criteria Update Expert Panel American Geriatrics Society updated Beers Criteria for potentially inappropriate medication use in older adults J
Am Geriatr Soc 2012 Apr60(4)616-31
0
5
10
15
20
25
30
Per
cen
t
Total Male Female
0
5
10
15
20
25
30
Per
cen
t
ExcellentVery GoodGood FairPoor
Importance Some drugs that are prescribed for older patients are known to be potentially
harmful for this age group
Overall Percentage In 2013 the percentage of adults age 65 years and over who received
potentially inappropriate prescription medications was 114
Trends From 2003 to 2013 the percentage of adults age 65 years and over who received
potentially inappropriate prescription medications improved overall for both sexes and for
people with excellentvery goodgood health status and people with fairpoor health status
Groups With Disparities
In all years the percentage of patients receiving potentially inappropriate medications
was higher among females compared with males This gap was not changing over time
In all years from 2003 to 2013 the percentage of patients receiving potentially
inappropriate medications was higher among people with fairpoor health status
compared with people with excellentgood health status This gap was not changing over
time
National Healthcare Quality and Disparities Report | 33
Patient Safety
Long-Term Catheter Use in Dialysis Patients
HI
AKAK
AZ
CA
UT
CT
FL
GA
IA
IL
KS
MA
MDMO
NJ
NY
OR
PA
SC
TN
CO
WA
WI
VA
ME
MN
MI
NC
TX
KY
WV
RI
NE
VT
NV OH
SD
AR
IN
NH
MT
ID
WY
ND
NMOK
LA
MSAL
DE
DC
10-12
13-18
7-9
PR
Source Centers for Medicare and Medicaid Services Dialysis Facility Compare 2014
Denominator At-risk adult Medicare patients with a central venous catheter who were receiving regular hemodialysis treatments at dialysis
facilities
Note For this measure lower percentages are better
Percentage of hemodialysis patients with central venous catheters used for vascular access for 90 days or longer by State 2014
HI
AKAK
AZ
CA
UT
CT
FL
GA
IA
IL
KS
MA
MDMO
NJ
NY
OR
PA
SC
TN
CO
WA
WI
VA
ME
MN
MI
NC
TX
KY
WV
RI
NE
VT
NV OH
SD
AR
IN
NH
MT
ID
WY
ND
NMOK
LA
MSAL
DE
DC
10-12
13-18
7-9
PR
Source Centers for Medicare and Medicaid Services Dialysis Facility Compare 2014
Denominator At-risk adult Medicare patients with a central venous catheter who were receiving regular hemodialysis treatments at dialysis
facilities
Note For this measure lower percentages are better
Percentage of hemodialysis patients with central venous catheters used for vascular access for 90 days or longer by State 2014
Importance Central venous catheters are frequently used for vascular access to dialysis
patients until a fistula or graft is formed Central venous catheters have higher rates of
infection and adverse events among patients receiving dialysis treatment compared with
other forms of vascular access To decrease the likelihood of adverse events catheters should
be used for less than 90 days
Overall Percentage Nationally an average of 10 of dialysis patients used central venous
catheters for 90 days or longer in 2014
Geographic Variation In 2014 Alabama and Kansas had the lowest percentages of dialysis
patients using central venous catheters for 90 days or longer (7) and Puerto Rico had the
highest percentage (18) of long-term catheter use
Patient Safety Infrastructure
Efforts to improve patient safety have been accompanied by various infrastructure
enhancements
Growth in patient safety organizations which assist providers in detecting and reducing
risks and hazards from care delivery that may lead to patient harm
System improvement initiatives at the Veterans Health Administration (VHA)
34 | National Healthcare Quality and Disparities Report
Patient Safety
Development of the National Practitioner Data Bank a clearinghouse for information on
medical malpractice payments
Patient Safety Organizations
Patient safety organizations (PSOs) aim to reduce preventable adverse events near misses
and unsafe conditions in all health care settings
PSOs provide an environment for health care providers to voluntarily report discuss and
learn from patient safety events and quality analyses on a privileged and confidential basis
Measures include
Number of PSOs serving each State
Variation in concentrations of compounded liquid medications for children
Patient Safety Organizations AHRQ Common Formats
AHRQ Common Formats provide a standardized method for PSOs health care providers
and other organizations to collect and report patient safety events
Data element standards are important for aggregating and analyzing events across
providers
AHRQ Common Formats have been developed for a variety of settings of care
Acute care hospitals
Skilled nursing facilities
Retail pharmacy
More information is available at httpspsoahrqgovcommon
National Healthcare Quality and Disparities Report | 35
Patient Safety
Number of Patient Safety Organizations
AZ (2)
CA (3)
UT (2)
CT(3)
FL (8)
GA (5)
IA (4)
IL (7)
KS (5)
MA(3)
MD (4)MO(2)
NJ(3)
NY (5)
OR (3)
PA (5)
SC (4)
TN (5)
CO (2)
WA (2)
WI (5)
VA (7)
ME(2)
MN(3)
MI (3)
NC (7)
TX (6)
KY (4)WV (3)
RI(2)
NE (2)
VT(2)
NV (2)
OH (2)
SD (1)
AR (4)
IN (2)
NH(2)
MT (2)
ID (3)
WY (2)
ND (1)
NM (3)OK (2)
LA (1)
MS (2)
AL (2)
DE(2)
HI (2)
AKAK (2)
DC(3)
PR (0)
1-2
3-4
5-6
7-8
Number of PSOs
excluding PSOs
operating nationally
Number of Patient Safety Organizations by area served 2014
Source Agency for Healthcare Research and Quality Patient Safety Organization Information Form Calendar Year 2014 and PSO-PPC
Contact Database
Note PSOs included in this map were AHRQ-listed during any part of 2014 and submitted the PSO Profile to the PSO Privacy Protection
Center (PSO-PPC) in early 2015 A PSO may have members in one or more States regardless of headquarters location Each State shows the
number of PSOs that serve that State map excludes 38 PSOs that are available to providers in all States
AZ (2)
CA (3)
UT (2)
CT(3)
FL (8)
GA (5)
IA (4)
IL (7)
KS (5)
MA(3)
MD (4)MO(2)
NJ(3)
NY (5)
OR (3)
PA (5)
SC (4)
TN (5)
CO (2)
WA (2)
WI (5)
VA (7)
ME(2)
MN(3)
MI (3)
NC (7)
TX (6)
KY (4)WV (3)
RI(2)
NE (2)
VT(2)
NV (2)
OH (2)
SD (1)
AR (4)
IN (2)
NH(2)
MT (2)
ID (3)
WY (2)
ND (1)
NM (3)OK (2)
LA (1)
MS (2)
AL (2)
DE(2)
HI (2)
AKAK (2)
DC(3)
PR (0)
1-2
3-4
5-6
7-8
Number of PSOs
excluding PSOs
operating nationally
Number of Patient Safety Organizations by area served 2014
Source Agency for Healthcare Research and Quality Patient Safety Organization Information Form Calendar Year 2014 and PSO-PPC
Contact Database
Note PSOs included in this map were AHRQ-listed during any part of 2014 and submitted the PSO Profile to the PSO Privacy Protection
Center (PSO-PPC) in early 2015 A PSO may have members in one or more States regardless of headquarters location Each State shows the
number of PSOs that serve that State map excludes 38 PSOs that are available to providers in all States
Importance All patient safety organizations (PSOs) have authority to operate in all 50
States and US territories but not all do In 2014 38 PSOs self-reported being available to
providers nationally PSOs not available nationally serve specific States
Geographic Variation
Nearly all States have at least 2 PSOs available to providers in their State in addition to
the 38 national PSOs that serve all States
Florida has the most PSOs available with 8 in addition to the 38 nationally available
PSOs The States with the largest number of PSOs available are generally on the East
Coast (eg North Carolina Virginia New York Pennsylvania Tennessee Georgia) or
have large populations (eg Texas Illinois)
North Dakota South Dakota and Louisiana are the only states with just one PSO serving
their State in addition to the 38 national PSOs
Puerto Rico is served by one national PSO only
36 | National Healthcare Quality and Disparities Report
Patient Safety
Compounded Liquid Medications for Children
Compounded liquid medications for children in Michigan 2012
Source Levy S Buckley B Safe Table Success The MI Pediatric Safety Collaboration Presentation presented at the 7th Annual
Meeting of Patient Safety Organizations (PSOs) Rockville MD 2015 April and Rood JM Engels MJ Ciarkowski SL et al Variability in
compounding of oral liquids for pediatric patients a patient safety concern J Am Pharm Assn 201454(4)383-9
Note Information represents 244 responses to online survey of approximately 2000 Michigan pharmacies conducted in June 2012 by
The University of Michigan College of Pharmacy in collaboration with the Michigan Pharmacists Association
0
10
20
30
40
50
1 2 3 4 5 6 7 8 9
Nu
mb
er o
f D
rugs
Number of Unique Concentrations
Number of Different Compounded Concentrations per Drug
0
10
20
30
40
50
No Harm No Harm ButMonitoring
TemporaryHarm
Pe
rce
nt
Compounding Errors by Related Harm and Pharmacy Setting
Inpatient Outpatient
Compounded liquid medications for children in Michigan 2012
Source Levy S Buckley B Safe Table Success The MI Pediatric Safety Collaboration Presentation presented at the 7th Annual
Meeting of Patient Safety Organizations (PSOs) Rockville MD 2015 April and Rood JM Engels MJ Ciarkowski SL et al Variability in
compounding of oral liquids for pediatric patients a patient safety concern J Am Pharm Assn 201454(4)383-9
Note Information represents 244 responses to online survey of approximately 2000 Michigan pharmacies conducted in June 2012 by
The University of Michigan College of Pharmacy in collaboration with the Michigan Pharmacists Association
0
10
20
30
40
50
1 2 3 4 5 6 7 8 9
Nu
mb
er o
f D
rugs
Number of Unique Concentrations
Number of Different Compounded Concentrations per Drug
0
10
20
30
40
50
No Harm No Harm ButMonitoring
TemporaryHarm
Per
cen
t
Compounding Errors by Related Harm and Pharmacy Setting
Inpatient Outpatient
Importance
Liquid medications are widely used in pediatrics because many children find it difficult
to swallow tablets or capsules If not commercially manufactured these liquid
medications require a pharmacist to compound them to the correct dosage for the patient
This practice of compounding has led to a variety of medication concentrations in use In
the absence of standard concentrations for compounded medications there is a risk that
children may accidentally receive medications that are too potent and can be dangerous
or are too weak to be effective
The Michigan Health amp Hospital Association Keystone Center Patient Safety
Organization hosts five Pediatric Safe Tables each year Safe Tables provided a
confidential and legally protected environment to discuss challenges and improvement
strategies regarding inconsistent medication concentrations for compounded oral liquids
without fear of punitive action against them
National Healthcare Quality and Disparities Report | 37
Patient Safety
Overall Percentage
More than half (527) of drugs identified in the 2012 survey had 3 or more unique
concentrations dispensed to children across Michigan For example Rifampin used to
treat bacterial infections was reported to have 8 different concentrations dispensed to
patients
Nearly one-third (313) of reported errors caused temporary harm or required additional
monitoring despite no harm
Standardization of Compounded Liquid Medications
Source Michigan Health amp Hospital Association Keystone Center Patient Safety Organization and University of Michigan College of Pharmacy
State-Wide Initiative to Standardize the Compounding of Oral Liquids in Pediatrics
Standardization of compounded liquid medications for children in Michigan 2011
Issue identificationbull Hospitals attending PSO Pediatrics Safe
Table raise compounded medication concentrations as a major safety issue
bull Small focus group determines extent of problem
bull Michigan pharmacies are surveyed about baseline concentrations
Develop Interventionbull PSO Quarterly Safe Tables are held to
discuss cases and practicesbull Team develops recommendations for
standard concentrationsbull Consensus is achieved for frequently
compounded pediatric medications 470 formulations for 147 drug entities are reduced to 104 concentrations for 100 drugs
Practice changebull Toolkit is createdbull Standards are disseminated to Michigan
prescribers and pharmacies bull Standards are disseminated to PSO
members and Safe Table participants
Source Michigan Health amp Hospital Association Keystone Center Patient Safety Organization and University of Michigan College of Pharmacy
State-Wide Initiative to Standardize the Compounding of Oral Liquids in Pediatrics
Standardization of compounded liquid medications for children in Michigan 2011
Issue identificationbull Hospitals attending PSO Pediatrics Safe
Table raise compounded medication concentrations as a major safety issue
bull Small focus group determines extent of problem
bull Michigan pharmacies are surveyed about baseline concentrations
Develop Interventionbull PSO Quarterly Safe Tables are held to
discuss cases and practicesbull Team develops recommendations for
standard concentrationsbull Consensus is achieved for frequently
compounded pediatric medications 470 formulations for 147 drug entities are reduced to 104 concentrations for 100 drugs
Practice changebull Toolkit is createdbull Standards are disseminated to Michigan
prescribers and pharmacies bull Standards are disseminated to PSO
members and Safe Table participants
The Role of PSO Safe Tables Based on adverse medication events discussed in the
Michigan Health amp Hospital Association (MHA) Keystone Center Patient Safety
Organization (PSO) Safe Tables in July 2011 the Michigan Pediatric Safety Collaboration
was developed to further assess the scope of the problem and formulate a solution
The Collaborative The Michigan Pediatric Safety Collaboration includes individuals from
the University of Michigan College of Pharmacy the Michigan Pharmacists Association
(MPA) the Food and Drug Administration (FDA) and the MHA Keystone PSO
38 | National Healthcare Quality and Disparities Report
Patient Safety
Practice Change
As a result of the standardization effort 470 unique formulations for 147 drug entities
were reduced to 104 different concentrations for 100 drugs
The Michigan Pediatric Safety Collaboration developed a multistep process to implement
standards for compounding medications The MPA surveyed pharmacies in Michigan to
better define the nature and scope of the problem The PSO continued to act as convener
The result was the creation and dissemination of statewide standards for 120 frequently
compounded pediatric medications
Veterans Health Administration
The National Center for Patient Safety is part of the Veterans Health Administration the
Nationrsquos largest integrated health care system
Patient safety-related system improvement initiatives include
The Daily Planreg
Purchasing for Safety Initiative
Patient Safety Improvement Initiative
Patient safety improvement initiative The Daily Planreg at Veterans Affairs Medical Centers 2009
Source King BJ Mills PD Fore A et al The Daily Planreg including patients for safetys sake Nurs Manage 201243(3)15-8
0
10
20
30
40
50
Identified atleast one
error
Identifiederror
of omission
Identifiederror
ofcommission
Nurses Who Identified Errors in Patient Treatment Plan by Type
0
10
20
30
40
50
Patient founddiscrepancy inplanned care
Family founddiscrepancy inplanned care
Nursing Stafffound
discrepancyin plannedtreatment
Respondents Who Identified Errors or Discrepancies Through The Daily Plan reg
Patient safety improvement initiative The Daily Planreg at Veterans Affairs Medical Centers 2009
Source King BJ Mills PD Fore A et al The Daily Planreg including patients for safetys sake Nurs Manage 201243(3)15-8
0
10
20
30
40
50
Identified atleast one
error
Identifiederror
of omission
Identifiederror
ofcommission
Nurses Who Identified Errors in Patient Treatment Plan by Type
0
10
20
30
40
50
Patient founddiscrepancy inplanned care
Family founddiscrepancy inplanned care
Nursing Stafffound
discrepancyin plannedtreatment
Respondents Who Identified Errors or Discrepancies Through The Daily Plan reg
National Healthcare Quality and Disparities Report | 39
Patient Safety
Importance The Daily Planreg
is a two-page printed summary that acts as a schedule for
patients and providers each day It shows the procedures laboratory tests and medications
scheduled for that day and lists essential health information such as patientrsquos name allergies
and current medications It can be tailored for a patientrsquos needs by extracting orders from the
electronic medical record (EMR) The Daily Planreg
is intended to facilitate patient and family
engagement throughout the course of care The Daily Planreg
shows promise for improving
patient safety Since 2009 the VA has implemented The Daily Planreg
in more than 65
hospitals both inpatient and outpatient care settings The Daily Planreg
is shared more than
75000 times a month and the VA plans to continue the spread of The Daily Planreg
at
additional sites in 2016
Findings
As part of a pilot test in 2009 a total of 198 patients and 85 nurses responded to a survey
across 10 facilities Nurses had an average of 34 patients per shift who received The
Daily Planreg Patients responded about their own experiences whereas nurses reported
about all of their patients who received The Daily Planreg
Nearly half (475) of patients reported finding a discrepancy in planned care through
The Daily Planreg In addition 30 of patients reported that their family members found a
discrepancy Although not every discrepancy will be a potential medical error having a
shared understanding of the plan of care decreases the risk of error
More than one in six nurses (176) identified a discrepancy in treatment among their
patients through The Daily Planreg Most of these nurses (153) found one or more errors
of omission and a smaller share (106) of nurses found one or more errors of
commission some found both
40 | National Healthcare Quality and Disparities Report
Patient Safety
Issues Related to Ventilators
Common use-issues related to ventilators at the Veterans Health Administration 2006-2014 (combined)
Source Veterans Health Administration National Center for Patient Safety data collected October 2006 to October 2014
Note Examples of equipment failures include ventilator shutdown and other ventilator problems Ventilator settings include setup problems and
incorrect settings Support activities include space utilities and supplies Transport includes accidental extubation other transportation issues
and vehicle-related issues Alarms include alarm settings and alarm connection Training includes unknown ventilator model and other training
concerns
0
20
40
60
80
100
120
140
160
EquipmentFailure
VentilatorSettings
SupportActivities
Transport Alarms Training
Nu
mb
er o
f R
epo
rts
Common use-issues related to ventilators at the Veterans Health Administration 2006-2014 (combined)
Source Veterans Health Administration National Center for Patient Safety data collected October 2006 to October 2014
Note Examples of equipment failures include ventilator shutdown and other ventilator problems Ventilator settings include setup problems and
incorrect settings Support activities include space utilities and supplies Transport includes accidental extubation other transportation issues
and vehicle-related issues Alarms include alarm settings and alarm connection Training includes unknown ventilator model and other training
concerns
0
20
40
60
80
100
120
140
160
EquipmentFailure
VentilatorSettings
SupportActivities
Transport Alarms Training
Nu
mb
er o
f R
epo
rts
Importance Beginning with a focus on ventilators the Veterans Health Administrationrsquos
human factors-based Purchasing for Safety Initiative communicates the most common use-
issues associated with medical devices in order to ultimately remove or contain identified
vulnerabilities and prevent further harm
Event Reporting Patient safety managers report events and close calls from more than 150
VA facilities to a national database The largest number of use issues related to ventilators
involved equipment failure and issues such as spontaneous ventilator shutdown compressor
failure and broken or missing parts Other categories of ventilator use issues involved the
physical space where the ventilator was used challenges of transporting patients on
ventilators and problems with ventilator settings and alarms Root cause analyses on reports
are conducted and Patient Safety Alerts are issued to share the learning internally
Other Key Components
Data on ventilator issues from the VA and the Food and Drug Administrationrsquos Medical
Product Safety Network are the basis for a ldquogovernment-industry dayrdquo to work with
manufacturers This information is used to help the device manufacturers better
understand the limits of human use of their products
National Healthcare Quality and Disparities Report | 41
Patient Safety
The VA also trains noncliniciansmdashsuch as biomedical engineers across the
organizationmdashto understand the devices consider the situation for their use and identify
what can go wrong (ldquofailure modesrdquo) in advance
The VA encourages discussions among clinicians about their experience in using devices
In the Applied Patient Safety Challenge hundreds of staff participate in brainstorming
about solutions and strategies for dealing with unexpected scenarios involving devices
National Practitioner Data Bank
Medical malpractice actions are one way to flag potential medical errors
Medical Malpractice Payment Reports are submitted to the National Practitioner Data Bank
by medical malpractice payers
Report of a monetary exchange made for the benefit of a physician dentist or other
health care provider
Result of a settlement or judgment of a written complaint or claim based on that
providerrsquos delivery of or failure to deliver health care services
Number of Medical Malpractice Payment Reports by Setting
Number of Medical Malpractice Payment Reports by health care setting 2004-2014
Source National Practitioner Data Bank (NPDB) Public Use Data File Health Resources and Services Administration Bureau of Health
Professions Division of Practitioner Data Banks 2004-2014
Note Health care setting was not collected by the NPDB for 2104 reports in 2004 ldquoOtherrdquo includes Medical Malpractice Payment Reports
related to unknown settings as well as those for a combination of inpatient and outpatient settings Reports pertain to patients of any age
0
2000
4000
6000
8000
10000
12000
14000
16000
18000
20000
2004 2005 2006 2007 2008 2009 2010 2011 2012 2013 2014
Nu
mb
er o
f R
epo
rts
Total Inpatient Outpatient Other
Number of Medical Malpractice Payment Reports by health care setting 2004-2014
Source National Practitioner Data Bank (NPDB) Public Use Data File Health Resources and Services Administration Bureau of Health
Professions Division of Practitioner Data Banks 2004-2014
Note Health care setting was not collected by the NPDB for 2104 reports in 2004 ldquoOtherrdquo includes Medical Malpractice Payment Reports
related to unknown settings as well as those for a combination of inpatient and outpatient settings Reports pertain to patients of any age
0
2000
4000
6000
8000
10000
12000
14000
16000
18000
20000
2004 2005 2006 2007 2008 2009 2010 2011 2012 2013 2014
Nu
mb
er o
f R
epo
rts
Total Inpatient Outpatient Other
42 | National Healthcare Quality and Disparities Report
Patient Safety
Trends The total number of medical malpractice payment reports (MMPRs) per year
decreased from 17641 in 2004 to 12699 in 2014
Variation Across Reports
Of 157022 MMPRs from 2004 through 2014 more reports related to care in the
outpatient setting (71937) than in the inpatient setting (60391)
Diagnosis-related and treatment-related payments were the most frequent types of
reports each accounting for about 27 of cases Reports of payments for medication-
related cases accounted for only 5 of MMPRs (data not shown)
Number of Medical Malpractice Payment Reports by Allegation and Harm
Number of Medical Malpractice Payment Reports by type of allegation and harm severity 2004-2014
Key Temporary injury = Minor temporary injury and Major temporary injury Permanent significant injury = Significant Permanent Injury
Major Permanent Injury Quadriplegia Brain Damage Lifelong care
Source National Practitioner Data Bank Public Use Data File Health Resources and Services Administration Bureau of Health Professions
Division of Practitioner Data Banks 2004-2014
Note Reports pertain to patients of any age
0
20
40
60
80
100
Treatment(n=42913)
Diagnosis(n=42507)
Surgery(n=36845)
Obstetrics(n=10555)
Medication(n=8287)
Monitoring(n=5329)
Anesthesia(n=4276)
Equipment(n=1161)
BehavioralHealth
(n=879)
Blood(n=379)
EmotionalInjury Only
InsignificantInjury
TemporaryInjury
PermanentMinor Injury
PermanentSignificant Injury
Death Unknown
Number of Medical Malpractice Payment Reports by type of allegation and harm severity 2004-2014
Key Temporary injury = Minor temporary injury and Major temporary injury Permanent significant injury = Significant Permanent Injury
Major Permanent Injury Quadriplegia Brain Damage Lifelong care
Source National Practitioner Data Bank Public Use Data File Health Resources and Services Administration Bureau of Health Professions
Division of Practitioner Data Banks 2004-2014
Note Reports pertain to patients of any age
0
20
40
60
80
100
Treatment(n=42913)
Diagnosis(n=42507)
Surgery(n=36845)
Obstetrics(n=10555)
Medication(n=8287)
Monitoring(n=5329)
Anesthesia(n=4276)
Equipment(n=1161)
BehavioralHealth
(n=879)
Blood(n=379)
EmotionalInjury Only
InsignificantInjury
TemporaryInjury
PermanentMinor Injury
PermanentSignificant Injury
Death Unknown
Overall Percentage From 2004 to 2014 medical malpractice payments were made for
allegations related to
Treatment (42913)
Diagnosis (42507)
Surgery (36845)
Obstetrics (10555)
Medication (8287)
Monitoring (5329)
National Healthcare Quality and Disparities Report | 43
Patient Safety
Anesthesia (4276)
Equipment or products (1161)
Behavioral health (879) and
IV and blood products (379)
Variation Across Reports
Death accounted for more than one-third of harm in payments related to monitoring
(499) diagnosis (393) medication (383) and anesthesia (363) allegations
More than half of all obstetric payments were for allegations of permanent severe harm
(570)
Temporary harm accounted for more than one-third of payments related to equipment
(485) and surgery (360)
Most of the behavioral health-related payments were for emotional harm (457) or
death (338)
References
Agency for Healthcare Research and Quality Making Health Care Safer II An Updated Critical Analysis of the
Evidence for Patient Safety Practices Comparative Effectiveness Review No 211 Rockville MD Agency for
Healthcare Research and Quality March 2013 AHRQ Publication No 13-E001-EF
httpwwwahrqgovsitesdefaultfileswysiwygresearchfindingsevidence-basedshy
reportsservicesqualityptsafetyII-fullpdf
Arriaga AF Lancaster RT Berry RW et al The better colectomy project association of evidence-based best-
practice adherence rates to outcomes in colorectal surgery Ann Surg 2009 Oct250(4)507-13
httpwwwncbinlmnihgovpubmed19734778
Centers for Disease Control and Prevention HAI Prevalence Survey
httpwwwcdcgovHAIsurveillanceindexhtml Last updated March 2016 Accessed March 4 2016
Centers for Disease Control and Prevention Nursing Homes and Assisted Living (Long-Term Care Facilities)
httpwwwcdcgovlongtermcare Last updated September 2015 Accessed March 4 2016
Chassin MR Loeb JM High-reliability health care getting there from here Milbank Q 201391(3)459-90
httpwwwncbinlmnihgovpmcarticlesPMC3790522 Accessed September 23 2015
Chiu Y Bero L Hessol NA et al A literature review of clinical outcomes associated with antipsychotic medication
use in North American nursing home residents Health Policy 2015 Jun119(6)802-813 Epub 2015 Feb 28 PMID
25791166 httpwwwsciencedirectcomsciencearticlepiiS0168851015000652 Accessed June 17 2015
Huybrechts KF Gerhard Crystal S et al Differential risk of death in older residents in nursing homes prescribed
specific antipsychotic drugs Population based cohort study BMJ 2012 Feb 23344e977 PMID 22362541
httpwwwncbinlmnihgovpmcarticlesPMC3285717 Accessed June 17 2015
Institute of Medicine Preventing Medication Errors Quality Chasm Series 2007
httpwwwnapeducatalog11623preventing-medication-errors-quality-chasm-series
National Association for Home Care amp Hospice Basic Statistics About Home Care Updated 2010
httpwwwnahcorgassets1710hc_statspdf Accessed August 31 2015
44 | National Healthcare Quality and Disparities Report
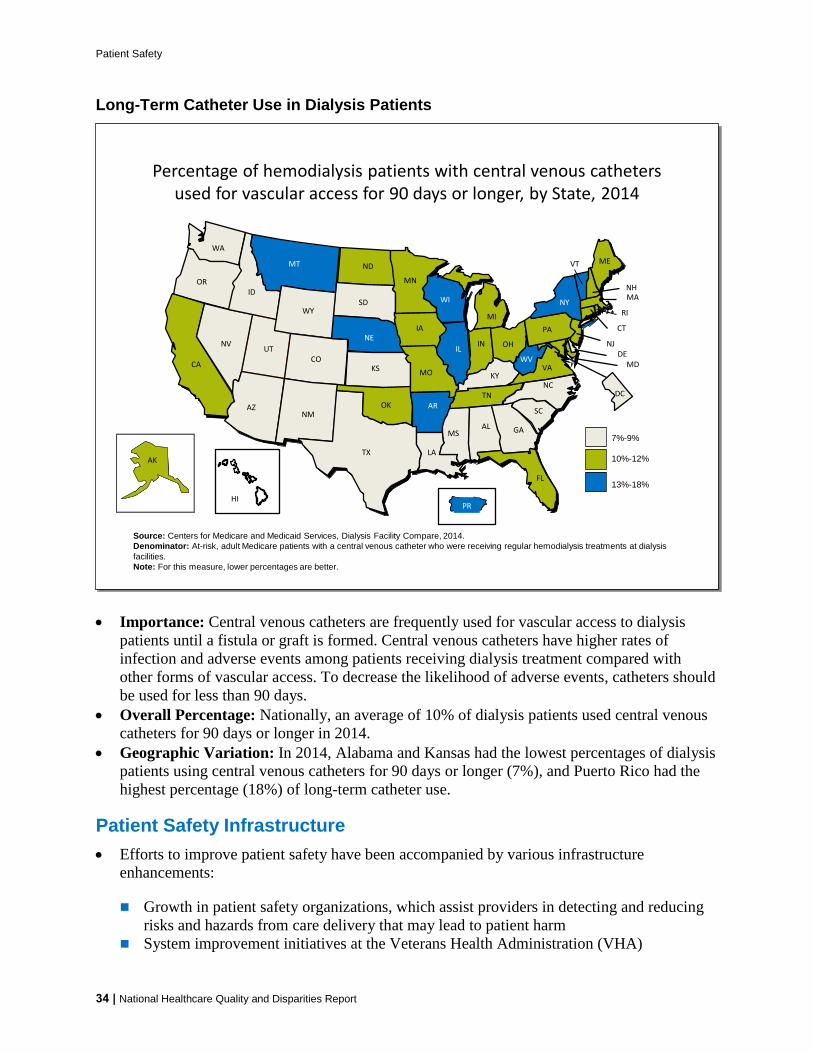
Patient Safety
Long-Term Catheter Use in Dialysis Patients
HI
AKAK
AZ
CA
UT
CT
FL
GA
IA
IL
KS
MA
MDMO
NJ
NY
OR
PA
SC
TN
CO
WA
WI
VA
ME
MN
MI
NC
TX
KY
WV
RI
NE
VT
NV OH
SD
AR
IN
NH
MT
ID
WY
ND
NMOK
LA
MSAL
DE
DC
10-12
13-18
7-9
PR
Source Centers for Medicare and Medicaid Services Dialysis Facility Compare 2014
Denominator At-risk adult Medicare patients with a central venous catheter who were receiving regular hemodialysis treatments at dialysis
facilities
Note For this measure lower percentages are better
Percentage of hemodialysis patients with central venous catheters used for vascular access for 90 days or longer by State 2014
HI
AKAK
AZ
CA
UT
CT
FL
GA
IA
IL
KS
MA
MDMO
NJ
NY
OR
PA
SC
TN
CO
WA
WI
VA
ME
MN
MI
NC
TX
KY
WV
RI
NE
VT
NV OH
SD
AR
IN
NH
MT
ID
WY
ND
NMOK
LA
MSAL
DE
DC
10-12
13-18
7-9
PR
Source Centers for Medicare and Medicaid Services Dialysis Facility Compare 2014
Denominator At-risk adult Medicare patients with a central venous catheter who were receiving regular hemodialysis treatments at dialysis
facilities
Note For this measure lower percentages are better
Percentage of hemodialysis patients with central venous catheters used for vascular access for 90 days or longer by State 2014
Importance Central venous catheters are frequently used for vascular access to dialysis
patients until a fistula or graft is formed Central venous catheters have higher rates of
infection and adverse events among patients receiving dialysis treatment compared with
other forms of vascular access To decrease the likelihood of adverse events catheters should
be used for less than 90 days
Overall Percentage Nationally an average of 10 of dialysis patients used central venous
catheters for 90 days or longer in 2014
Geographic Variation In 2014 Alabama and Kansas had the lowest percentages of dialysis
patients using central venous catheters for 90 days or longer (7) and Puerto Rico had the
highest percentage (18) of long-term catheter use
Patient Safety Infrastructure
Efforts to improve patient safety have been accompanied by various infrastructure
enhancements
Growth in patient safety organizations which assist providers in detecting and reducing
risks and hazards from care delivery that may lead to patient harm
System improvement initiatives at the Veterans Health Administration (VHA)
34 | National Healthcare Quality and Disparities Report
Patient Safety
Development of the National Practitioner Data Bank a clearinghouse for information on
medical malpractice payments
Patient Safety Organizations
Patient safety organizations (PSOs) aim to reduce preventable adverse events near misses
and unsafe conditions in all health care settings
PSOs provide an environment for health care providers to voluntarily report discuss and
learn from patient safety events and quality analyses on a privileged and confidential basis
Measures include
Number of PSOs serving each State
Variation in concentrations of compounded liquid medications for children
Patient Safety Organizations AHRQ Common Formats
AHRQ Common Formats provide a standardized method for PSOs health care providers
and other organizations to collect and report patient safety events
Data element standards are important for aggregating and analyzing events across
providers
AHRQ Common Formats have been developed for a variety of settings of care
Acute care hospitals
Skilled nursing facilities
Retail pharmacy
More information is available at httpspsoahrqgovcommon
National Healthcare Quality and Disparities Report | 35
Patient Safety
Number of Patient Safety Organizations
AZ (2)
CA (3)
UT (2)
CT(3)
FL (8)
GA (5)
IA (4)
IL (7)
KS (5)
MA(3)
MD (4)MO(2)
NJ(3)
NY (5)
OR (3)
PA (5)
SC (4)
TN (5)
CO (2)
WA (2)
WI (5)
VA (7)
ME(2)
MN(3)
MI (3)
NC (7)
TX (6)
KY (4)WV (3)
RI(2)
NE (2)
VT(2)
NV (2)
OH (2)
SD (1)
AR (4)
IN (2)
NH(2)
MT (2)
ID (3)
WY (2)
ND (1)
NM (3)OK (2)
LA (1)
MS (2)
AL (2)
DE(2)
HI (2)
AKAK (2)
DC(3)
PR (0)
1-2
3-4
5-6
7-8
Number of PSOs
excluding PSOs
operating nationally
Number of Patient Safety Organizations by area served 2014
Source Agency for Healthcare Research and Quality Patient Safety Organization Information Form Calendar Year 2014 and PSO-PPC
Contact Database
Note PSOs included in this map were AHRQ-listed during any part of 2014 and submitted the PSO Profile to the PSO Privacy Protection
Center (PSO-PPC) in early 2015 A PSO may have members in one or more States regardless of headquarters location Each State shows the
number of PSOs that serve that State map excludes 38 PSOs that are available to providers in all States
AZ (2)
CA (3)
UT (2)
CT(3)
FL (8)
GA (5)
IA (4)
IL (7)
KS (5)
MA(3)
MD (4)MO(2)
NJ(3)
NY (5)
OR (3)
PA (5)
SC (4)
TN (5)
CO (2)
WA (2)
WI (5)
VA (7)
ME(2)
MN(3)
MI (3)
NC (7)
TX (6)
KY (4)WV (3)
RI(2)
NE (2)
VT(2)
NV (2)
OH (2)
SD (1)
AR (4)
IN (2)
NH(2)
MT (2)
ID (3)
WY (2)
ND (1)
NM (3)OK (2)
LA (1)
MS (2)
AL (2)
DE(2)
HI (2)
AKAK (2)
DC(3)
PR (0)
1-2
3-4
5-6
7-8
Number of PSOs
excluding PSOs
operating nationally
Number of Patient Safety Organizations by area served 2014
Source Agency for Healthcare Research and Quality Patient Safety Organization Information Form Calendar Year 2014 and PSO-PPC
Contact Database
Note PSOs included in this map were AHRQ-listed during any part of 2014 and submitted the PSO Profile to the PSO Privacy Protection
Center (PSO-PPC) in early 2015 A PSO may have members in one or more States regardless of headquarters location Each State shows the
number of PSOs that serve that State map excludes 38 PSOs that are available to providers in all States
Importance All patient safety organizations (PSOs) have authority to operate in all 50
States and US territories but not all do In 2014 38 PSOs self-reported being available to
providers nationally PSOs not available nationally serve specific States
Geographic Variation
Nearly all States have at least 2 PSOs available to providers in their State in addition to
the 38 national PSOs that serve all States
Florida has the most PSOs available with 8 in addition to the 38 nationally available
PSOs The States with the largest number of PSOs available are generally on the East
Coast (eg North Carolina Virginia New York Pennsylvania Tennessee Georgia) or
have large populations (eg Texas Illinois)
North Dakota South Dakota and Louisiana are the only states with just one PSO serving
their State in addition to the 38 national PSOs
Puerto Rico is served by one national PSO only
36 | National Healthcare Quality and Disparities Report
Patient Safety
Compounded Liquid Medications for Children
Compounded liquid medications for children in Michigan 2012
Source Levy S Buckley B Safe Table Success The MI Pediatric Safety Collaboration Presentation presented at the 7th Annual
Meeting of Patient Safety Organizations (PSOs) Rockville MD 2015 April and Rood JM Engels MJ Ciarkowski SL et al Variability in
compounding of oral liquids for pediatric patients a patient safety concern J Am Pharm Assn 201454(4)383-9
Note Information represents 244 responses to online survey of approximately 2000 Michigan pharmacies conducted in June 2012 by
The University of Michigan College of Pharmacy in collaboration with the Michigan Pharmacists Association
0
10
20
30
40
50
1 2 3 4 5 6 7 8 9
Nu
mb
er o
f D
rugs
Number of Unique Concentrations
Number of Different Compounded Concentrations per Drug
0
10
20
30
40
50
No Harm No Harm ButMonitoring
TemporaryHarm
Pe
rce
nt
Compounding Errors by Related Harm and Pharmacy Setting
Inpatient Outpatient
Compounded liquid medications for children in Michigan 2012
Source Levy S Buckley B Safe Table Success The MI Pediatric Safety Collaboration Presentation presented at the 7th Annual
Meeting of Patient Safety Organizations (PSOs) Rockville MD 2015 April and Rood JM Engels MJ Ciarkowski SL et al Variability in
compounding of oral liquids for pediatric patients a patient safety concern J Am Pharm Assn 201454(4)383-9
Note Information represents 244 responses to online survey of approximately 2000 Michigan pharmacies conducted in June 2012 by
The University of Michigan College of Pharmacy in collaboration with the Michigan Pharmacists Association
0
10
20
30
40
50
1 2 3 4 5 6 7 8 9
Nu
mb
er o
f D
rugs
Number of Unique Concentrations
Number of Different Compounded Concentrations per Drug
0
10
20
30
40
50
No Harm No Harm ButMonitoring
TemporaryHarm
Per
cen
t
Compounding Errors by Related Harm and Pharmacy Setting
Inpatient Outpatient
Importance
Liquid medications are widely used in pediatrics because many children find it difficult
to swallow tablets or capsules If not commercially manufactured these liquid
medications require a pharmacist to compound them to the correct dosage for the patient
This practice of compounding has led to a variety of medication concentrations in use In
the absence of standard concentrations for compounded medications there is a risk that
children may accidentally receive medications that are too potent and can be dangerous
or are too weak to be effective
The Michigan Health amp Hospital Association Keystone Center Patient Safety
Organization hosts five Pediatric Safe Tables each year Safe Tables provided a
confidential and legally protected environment to discuss challenges and improvement
strategies regarding inconsistent medication concentrations for compounded oral liquids
without fear of punitive action against them
National Healthcare Quality and Disparities Report | 37
Patient Safety
Overall Percentage
More than half (527) of drugs identified in the 2012 survey had 3 or more unique
concentrations dispensed to children across Michigan For example Rifampin used to
treat bacterial infections was reported to have 8 different concentrations dispensed to
patients
Nearly one-third (313) of reported errors caused temporary harm or required additional
monitoring despite no harm
Standardization of Compounded Liquid Medications
Source Michigan Health amp Hospital Association Keystone Center Patient Safety Organization and University of Michigan College of Pharmacy
State-Wide Initiative to Standardize the Compounding of Oral Liquids in Pediatrics
Standardization of compounded liquid medications for children in Michigan 2011
Issue identificationbull Hospitals attending PSO Pediatrics Safe
Table raise compounded medication concentrations as a major safety issue
bull Small focus group determines extent of problem
bull Michigan pharmacies are surveyed about baseline concentrations
Develop Interventionbull PSO Quarterly Safe Tables are held to
discuss cases and practicesbull Team develops recommendations for
standard concentrationsbull Consensus is achieved for frequently
compounded pediatric medications 470 formulations for 147 drug entities are reduced to 104 concentrations for 100 drugs
Practice changebull Toolkit is createdbull Standards are disseminated to Michigan
prescribers and pharmacies bull Standards are disseminated to PSO
members and Safe Table participants
Source Michigan Health amp Hospital Association Keystone Center Patient Safety Organization and University of Michigan College of Pharmacy
State-Wide Initiative to Standardize the Compounding of Oral Liquids in Pediatrics
Standardization of compounded liquid medications for children in Michigan 2011
Issue identificationbull Hospitals attending PSO Pediatrics Safe
Table raise compounded medication concentrations as a major safety issue
bull Small focus group determines extent of problem
bull Michigan pharmacies are surveyed about baseline concentrations
Develop Interventionbull PSO Quarterly Safe Tables are held to
discuss cases and practicesbull Team develops recommendations for
standard concentrationsbull Consensus is achieved for frequently
compounded pediatric medications 470 formulations for 147 drug entities are reduced to 104 concentrations for 100 drugs
Practice changebull Toolkit is createdbull Standards are disseminated to Michigan
prescribers and pharmacies bull Standards are disseminated to PSO
members and Safe Table participants
The Role of PSO Safe Tables Based on adverse medication events discussed in the
Michigan Health amp Hospital Association (MHA) Keystone Center Patient Safety
Organization (PSO) Safe Tables in July 2011 the Michigan Pediatric Safety Collaboration
was developed to further assess the scope of the problem and formulate a solution
The Collaborative The Michigan Pediatric Safety Collaboration includes individuals from
the University of Michigan College of Pharmacy the Michigan Pharmacists Association
(MPA) the Food and Drug Administration (FDA) and the MHA Keystone PSO
38 | National Healthcare Quality and Disparities Report
Patient Safety
Practice Change
As a result of the standardization effort 470 unique formulations for 147 drug entities
were reduced to 104 different concentrations for 100 drugs
The Michigan Pediatric Safety Collaboration developed a multistep process to implement
standards for compounding medications The MPA surveyed pharmacies in Michigan to
better define the nature and scope of the problem The PSO continued to act as convener
The result was the creation and dissemination of statewide standards for 120 frequently
compounded pediatric medications
Veterans Health Administration
The National Center for Patient Safety is part of the Veterans Health Administration the
Nationrsquos largest integrated health care system
Patient safety-related system improvement initiatives include
The Daily Planreg
Purchasing for Safety Initiative
Patient Safety Improvement Initiative
Patient safety improvement initiative The Daily Planreg at Veterans Affairs Medical Centers 2009
Source King BJ Mills PD Fore A et al The Daily Planreg including patients for safetys sake Nurs Manage 201243(3)15-8
0
10
20
30
40
50
Identified atleast one
error
Identifiederror
of omission
Identifiederror
ofcommission
Nurses Who Identified Errors in Patient Treatment Plan by Type
0
10
20
30
40
50
Patient founddiscrepancy inplanned care
Family founddiscrepancy inplanned care
Nursing Stafffound
discrepancyin plannedtreatment
Respondents Who Identified Errors or Discrepancies Through The Daily Plan reg
Patient safety improvement initiative The Daily Planreg at Veterans Affairs Medical Centers 2009
Source King BJ Mills PD Fore A et al The Daily Planreg including patients for safetys sake Nurs Manage 201243(3)15-8
0
10
20
30
40
50
Identified atleast one
error
Identifiederror
of omission
Identifiederror
ofcommission
Nurses Who Identified Errors in Patient Treatment Plan by Type
0
10
20
30
40
50
Patient founddiscrepancy inplanned care
Family founddiscrepancy inplanned care
Nursing Stafffound
discrepancyin plannedtreatment
Respondents Who Identified Errors or Discrepancies Through The Daily Plan reg
National Healthcare Quality and Disparities Report | 39
Patient Safety
Importance The Daily Planreg
is a two-page printed summary that acts as a schedule for
patients and providers each day It shows the procedures laboratory tests and medications
scheduled for that day and lists essential health information such as patientrsquos name allergies
and current medications It can be tailored for a patientrsquos needs by extracting orders from the
electronic medical record (EMR) The Daily Planreg
is intended to facilitate patient and family
engagement throughout the course of care The Daily Planreg
shows promise for improving
patient safety Since 2009 the VA has implemented The Daily Planreg
in more than 65
hospitals both inpatient and outpatient care settings The Daily Planreg
is shared more than
75000 times a month and the VA plans to continue the spread of The Daily Planreg
at
additional sites in 2016
Findings
As part of a pilot test in 2009 a total of 198 patients and 85 nurses responded to a survey
across 10 facilities Nurses had an average of 34 patients per shift who received The
Daily Planreg Patients responded about their own experiences whereas nurses reported
about all of their patients who received The Daily Planreg
Nearly half (475) of patients reported finding a discrepancy in planned care through
The Daily Planreg In addition 30 of patients reported that their family members found a
discrepancy Although not every discrepancy will be a potential medical error having a
shared understanding of the plan of care decreases the risk of error
More than one in six nurses (176) identified a discrepancy in treatment among their
patients through The Daily Planreg Most of these nurses (153) found one or more errors
of omission and a smaller share (106) of nurses found one or more errors of
commission some found both
40 | National Healthcare Quality and Disparities Report
Patient Safety
Issues Related to Ventilators
Common use-issues related to ventilators at the Veterans Health Administration 2006-2014 (combined)
Source Veterans Health Administration National Center for Patient Safety data collected October 2006 to October 2014
Note Examples of equipment failures include ventilator shutdown and other ventilator problems Ventilator settings include setup problems and
incorrect settings Support activities include space utilities and supplies Transport includes accidental extubation other transportation issues
and vehicle-related issues Alarms include alarm settings and alarm connection Training includes unknown ventilator model and other training
concerns
0
20
40
60
80
100
120
140
160
EquipmentFailure
VentilatorSettings
SupportActivities
Transport Alarms Training
Nu
mb
er o
f R
epo
rts
Common use-issues related to ventilators at the Veterans Health Administration 2006-2014 (combined)
Source Veterans Health Administration National Center for Patient Safety data collected October 2006 to October 2014
Note Examples of equipment failures include ventilator shutdown and other ventilator problems Ventilator settings include setup problems and
incorrect settings Support activities include space utilities and supplies Transport includes accidental extubation other transportation issues
and vehicle-related issues Alarms include alarm settings and alarm connection Training includes unknown ventilator model and other training
concerns
0
20
40
60
80
100
120
140
160
EquipmentFailure
VentilatorSettings
SupportActivities
Transport Alarms Training
Nu
mb
er o
f R
epo
rts
Importance Beginning with a focus on ventilators the Veterans Health Administrationrsquos
human factors-based Purchasing for Safety Initiative communicates the most common use-
issues associated with medical devices in order to ultimately remove or contain identified
vulnerabilities and prevent further harm
Event Reporting Patient safety managers report events and close calls from more than 150
VA facilities to a national database The largest number of use issues related to ventilators
involved equipment failure and issues such as spontaneous ventilator shutdown compressor
failure and broken or missing parts Other categories of ventilator use issues involved the
physical space where the ventilator was used challenges of transporting patients on
ventilators and problems with ventilator settings and alarms Root cause analyses on reports
are conducted and Patient Safety Alerts are issued to share the learning internally
Other Key Components
Data on ventilator issues from the VA and the Food and Drug Administrationrsquos Medical
Product Safety Network are the basis for a ldquogovernment-industry dayrdquo to work with
manufacturers This information is used to help the device manufacturers better
understand the limits of human use of their products
National Healthcare Quality and Disparities Report | 41
Patient Safety
The VA also trains noncliniciansmdashsuch as biomedical engineers across the
organizationmdashto understand the devices consider the situation for their use and identify
what can go wrong (ldquofailure modesrdquo) in advance
The VA encourages discussions among clinicians about their experience in using devices
In the Applied Patient Safety Challenge hundreds of staff participate in brainstorming
about solutions and strategies for dealing with unexpected scenarios involving devices
National Practitioner Data Bank
Medical malpractice actions are one way to flag potential medical errors
Medical Malpractice Payment Reports are submitted to the National Practitioner Data Bank
by medical malpractice payers
Report of a monetary exchange made for the benefit of a physician dentist or other
health care provider
Result of a settlement or judgment of a written complaint or claim based on that
providerrsquos delivery of or failure to deliver health care services
Number of Medical Malpractice Payment Reports by Setting
Number of Medical Malpractice Payment Reports by health care setting 2004-2014
Source National Practitioner Data Bank (NPDB) Public Use Data File Health Resources and Services Administration Bureau of Health
Professions Division of Practitioner Data Banks 2004-2014
Note Health care setting was not collected by the NPDB for 2104 reports in 2004 ldquoOtherrdquo includes Medical Malpractice Payment Reports
related to unknown settings as well as those for a combination of inpatient and outpatient settings Reports pertain to patients of any age
0
2000
4000
6000
8000
10000
12000
14000
16000
18000
20000
2004 2005 2006 2007 2008 2009 2010 2011 2012 2013 2014
Nu
mb
er o
f R
epo
rts
Total Inpatient Outpatient Other
Number of Medical Malpractice Payment Reports by health care setting 2004-2014
Source National Practitioner Data Bank (NPDB) Public Use Data File Health Resources and Services Administration Bureau of Health
Professions Division of Practitioner Data Banks 2004-2014
Note Health care setting was not collected by the NPDB for 2104 reports in 2004 ldquoOtherrdquo includes Medical Malpractice Payment Reports
related to unknown settings as well as those for a combination of inpatient and outpatient settings Reports pertain to patients of any age
0
2000
4000
6000
8000
10000
12000
14000
16000
18000
20000
2004 2005 2006 2007 2008 2009 2010 2011 2012 2013 2014
Nu
mb
er o
f R
epo
rts
Total Inpatient Outpatient Other
42 | National Healthcare Quality and Disparities Report
Patient Safety
Trends The total number of medical malpractice payment reports (MMPRs) per year
decreased from 17641 in 2004 to 12699 in 2014
Variation Across Reports
Of 157022 MMPRs from 2004 through 2014 more reports related to care in the
outpatient setting (71937) than in the inpatient setting (60391)
Diagnosis-related and treatment-related payments were the most frequent types of
reports each accounting for about 27 of cases Reports of payments for medication-
related cases accounted for only 5 of MMPRs (data not shown)
Number of Medical Malpractice Payment Reports by Allegation and Harm
Number of Medical Malpractice Payment Reports by type of allegation and harm severity 2004-2014
Key Temporary injury = Minor temporary injury and Major temporary injury Permanent significant injury = Significant Permanent Injury
Major Permanent Injury Quadriplegia Brain Damage Lifelong care
Source National Practitioner Data Bank Public Use Data File Health Resources and Services Administration Bureau of Health Professions
Division of Practitioner Data Banks 2004-2014
Note Reports pertain to patients of any age
0
20
40
60
80
100
Treatment(n=42913)
Diagnosis(n=42507)
Surgery(n=36845)
Obstetrics(n=10555)
Medication(n=8287)
Monitoring(n=5329)
Anesthesia(n=4276)
Equipment(n=1161)
BehavioralHealth
(n=879)
Blood(n=379)
EmotionalInjury Only
InsignificantInjury
TemporaryInjury
PermanentMinor Injury
PermanentSignificant Injury
Death Unknown
Number of Medical Malpractice Payment Reports by type of allegation and harm severity 2004-2014
Key Temporary injury = Minor temporary injury and Major temporary injury Permanent significant injury = Significant Permanent Injury
Major Permanent Injury Quadriplegia Brain Damage Lifelong care
Source National Practitioner Data Bank Public Use Data File Health Resources and Services Administration Bureau of Health Professions
Division of Practitioner Data Banks 2004-2014
Note Reports pertain to patients of any age
0
20
40
60
80
100
Treatment(n=42913)
Diagnosis(n=42507)
Surgery(n=36845)
Obstetrics(n=10555)
Medication(n=8287)
Monitoring(n=5329)
Anesthesia(n=4276)
Equipment(n=1161)
BehavioralHealth
(n=879)
Blood(n=379)
EmotionalInjury Only
InsignificantInjury
TemporaryInjury
PermanentMinor Injury
PermanentSignificant Injury
Death Unknown
Overall Percentage From 2004 to 2014 medical malpractice payments were made for
allegations related to
Treatment (42913)
Diagnosis (42507)
Surgery (36845)
Obstetrics (10555)
Medication (8287)
Monitoring (5329)
National Healthcare Quality and Disparities Report | 43
Patient Safety
Anesthesia (4276)
Equipment or products (1161)
Behavioral health (879) and
IV and blood products (379)
Variation Across Reports
Death accounted for more than one-third of harm in payments related to monitoring
(499) diagnosis (393) medication (383) and anesthesia (363) allegations
More than half of all obstetric payments were for allegations of permanent severe harm
(570)
Temporary harm accounted for more than one-third of payments related to equipment
(485) and surgery (360)
Most of the behavioral health-related payments were for emotional harm (457) or
death (338)
References
Agency for Healthcare Research and Quality Making Health Care Safer II An Updated Critical Analysis of the
Evidence for Patient Safety Practices Comparative Effectiveness Review No 211 Rockville MD Agency for
Healthcare Research and Quality March 2013 AHRQ Publication No 13-E001-EF
httpwwwahrqgovsitesdefaultfileswysiwygresearchfindingsevidence-basedshy
reportsservicesqualityptsafetyII-fullpdf
Arriaga AF Lancaster RT Berry RW et al The better colectomy project association of evidence-based best-
practice adherence rates to outcomes in colorectal surgery Ann Surg 2009 Oct250(4)507-13
httpwwwncbinlmnihgovpubmed19734778
Centers for Disease Control and Prevention HAI Prevalence Survey
httpwwwcdcgovHAIsurveillanceindexhtml Last updated March 2016 Accessed March 4 2016
Centers for Disease Control and Prevention Nursing Homes and Assisted Living (Long-Term Care Facilities)
httpwwwcdcgovlongtermcare Last updated September 2015 Accessed March 4 2016
Chassin MR Loeb JM High-reliability health care getting there from here Milbank Q 201391(3)459-90
httpwwwncbinlmnihgovpmcarticlesPMC3790522 Accessed September 23 2015
Chiu Y Bero L Hessol NA et al A literature review of clinical outcomes associated with antipsychotic medication
use in North American nursing home residents Health Policy 2015 Jun119(6)802-813 Epub 2015 Feb 28 PMID
25791166 httpwwwsciencedirectcomsciencearticlepiiS0168851015000652 Accessed June 17 2015
Huybrechts KF Gerhard Crystal S et al Differential risk of death in older residents in nursing homes prescribed
specific antipsychotic drugs Population based cohort study BMJ 2012 Feb 23344e977 PMID 22362541
httpwwwncbinlmnihgovpmcarticlesPMC3285717 Accessed June 17 2015
Institute of Medicine Preventing Medication Errors Quality Chasm Series 2007
httpwwwnapeducatalog11623preventing-medication-errors-quality-chasm-series
National Association for Home Care amp Hospice Basic Statistics About Home Care Updated 2010
httpwwwnahcorgassets1710hc_statspdf Accessed August 31 2015
44 | National Healthcare Quality and Disparities Report
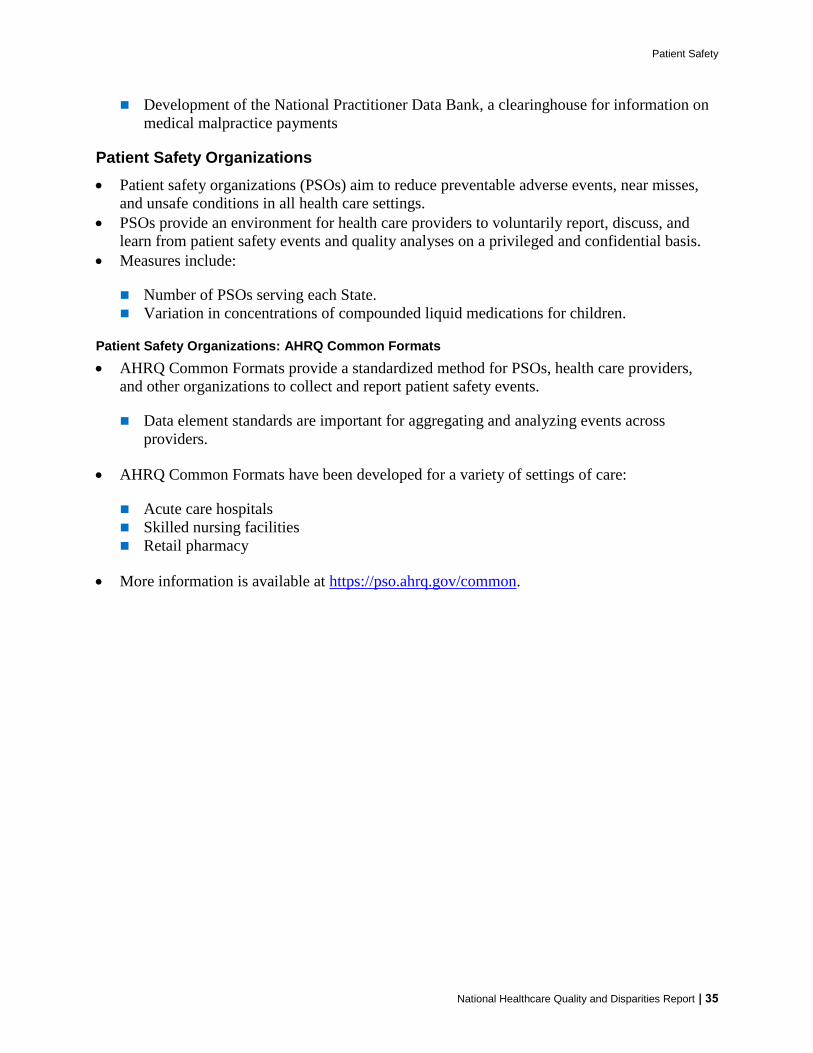
Patient Safety
Development of the National Practitioner Data Bank a clearinghouse for information on
medical malpractice payments
Patient Safety Organizations
Patient safety organizations (PSOs) aim to reduce preventable adverse events near misses
and unsafe conditions in all health care settings
PSOs provide an environment for health care providers to voluntarily report discuss and
learn from patient safety events and quality analyses on a privileged and confidential basis
Measures include
Number of PSOs serving each State
Variation in concentrations of compounded liquid medications for children
Patient Safety Organizations AHRQ Common Formats
AHRQ Common Formats provide a standardized method for PSOs health care providers
and other organizations to collect and report patient safety events
Data element standards are important for aggregating and analyzing events across
providers
AHRQ Common Formats have been developed for a variety of settings of care
Acute care hospitals
Skilled nursing facilities
Retail pharmacy
More information is available at httpspsoahrqgovcommon
National Healthcare Quality and Disparities Report | 35
Patient Safety
Number of Patient Safety Organizations
AZ (2)
CA (3)
UT (2)
CT(3)
FL (8)
GA (5)
IA (4)
IL (7)
KS (5)
MA(3)
MD (4)MO(2)
NJ(3)
NY (5)
OR (3)
PA (5)
SC (4)
TN (5)
CO (2)
WA (2)
WI (5)
VA (7)
ME(2)
MN(3)
MI (3)
NC (7)
TX (6)
KY (4)WV (3)
RI(2)
NE (2)
VT(2)
NV (2)
OH (2)
SD (1)
AR (4)
IN (2)
NH(2)
MT (2)
ID (3)
WY (2)
ND (1)
NM (3)OK (2)
LA (1)
MS (2)
AL (2)
DE(2)
HI (2)
AKAK (2)
DC(3)
PR (0)
1-2
3-4
5-6
7-8
Number of PSOs
excluding PSOs
operating nationally
Number of Patient Safety Organizations by area served 2014
Source Agency for Healthcare Research and Quality Patient Safety Organization Information Form Calendar Year 2014 and PSO-PPC
Contact Database
Note PSOs included in this map were AHRQ-listed during any part of 2014 and submitted the PSO Profile to the PSO Privacy Protection
Center (PSO-PPC) in early 2015 A PSO may have members in one or more States regardless of headquarters location Each State shows the
number of PSOs that serve that State map excludes 38 PSOs that are available to providers in all States
AZ (2)
CA (3)
UT (2)
CT(3)
FL (8)
GA (5)
IA (4)
IL (7)
KS (5)
MA(3)
MD (4)MO(2)
NJ(3)
NY (5)
OR (3)
PA (5)
SC (4)
TN (5)
CO (2)
WA (2)
WI (5)
VA (7)
ME(2)
MN(3)
MI (3)
NC (7)
TX (6)
KY (4)WV (3)
RI(2)
NE (2)
VT(2)
NV (2)
OH (2)
SD (1)
AR (4)
IN (2)
NH(2)
MT (2)
ID (3)
WY (2)
ND (1)
NM (3)OK (2)
LA (1)
MS (2)
AL (2)
DE(2)
HI (2)
AKAK (2)
DC(3)
PR (0)
1-2
3-4
5-6
7-8
Number of PSOs
excluding PSOs
operating nationally
Number of Patient Safety Organizations by area served 2014
Source Agency for Healthcare Research and Quality Patient Safety Organization Information Form Calendar Year 2014 and PSO-PPC
Contact Database
Note PSOs included in this map were AHRQ-listed during any part of 2014 and submitted the PSO Profile to the PSO Privacy Protection
Center (PSO-PPC) in early 2015 A PSO may have members in one or more States regardless of headquarters location Each State shows the
number of PSOs that serve that State map excludes 38 PSOs that are available to providers in all States
Importance All patient safety organizations (PSOs) have authority to operate in all 50
States and US territories but not all do In 2014 38 PSOs self-reported being available to
providers nationally PSOs not available nationally serve specific States
Geographic Variation
Nearly all States have at least 2 PSOs available to providers in their State in addition to
the 38 national PSOs that serve all States
Florida has the most PSOs available with 8 in addition to the 38 nationally available
PSOs The States with the largest number of PSOs available are generally on the East
Coast (eg North Carolina Virginia New York Pennsylvania Tennessee Georgia) or
have large populations (eg Texas Illinois)
North Dakota South Dakota and Louisiana are the only states with just one PSO serving
their State in addition to the 38 national PSOs
Puerto Rico is served by one national PSO only
36 | National Healthcare Quality and Disparities Report
Patient Safety
Compounded Liquid Medications for Children
Compounded liquid medications for children in Michigan 2012
Source Levy S Buckley B Safe Table Success The MI Pediatric Safety Collaboration Presentation presented at the 7th Annual
Meeting of Patient Safety Organizations (PSOs) Rockville MD 2015 April and Rood JM Engels MJ Ciarkowski SL et al Variability in
compounding of oral liquids for pediatric patients a patient safety concern J Am Pharm Assn 201454(4)383-9
Note Information represents 244 responses to online survey of approximately 2000 Michigan pharmacies conducted in June 2012 by
The University of Michigan College of Pharmacy in collaboration with the Michigan Pharmacists Association
0
10
20
30
40
50
1 2 3 4 5 6 7 8 9
Nu
mb
er o
f D
rugs
Number of Unique Concentrations
Number of Different Compounded Concentrations per Drug
0
10
20
30
40
50
No Harm No Harm ButMonitoring
TemporaryHarm
Pe
rce
nt
Compounding Errors by Related Harm and Pharmacy Setting
Inpatient Outpatient
Compounded liquid medications for children in Michigan 2012
Source Levy S Buckley B Safe Table Success The MI Pediatric Safety Collaboration Presentation presented at the 7th Annual
Meeting of Patient Safety Organizations (PSOs) Rockville MD 2015 April and Rood JM Engels MJ Ciarkowski SL et al Variability in
compounding of oral liquids for pediatric patients a patient safety concern J Am Pharm Assn 201454(4)383-9
Note Information represents 244 responses to online survey of approximately 2000 Michigan pharmacies conducted in June 2012 by
The University of Michigan College of Pharmacy in collaboration with the Michigan Pharmacists Association
0
10
20
30
40
50
1 2 3 4 5 6 7 8 9
Nu
mb
er o
f D
rugs
Number of Unique Concentrations
Number of Different Compounded Concentrations per Drug
0
10
20
30
40
50
No Harm No Harm ButMonitoring
TemporaryHarm
Per
cen
t
Compounding Errors by Related Harm and Pharmacy Setting
Inpatient Outpatient
Importance
Liquid medications are widely used in pediatrics because many children find it difficult
to swallow tablets or capsules If not commercially manufactured these liquid
medications require a pharmacist to compound them to the correct dosage for the patient
This practice of compounding has led to a variety of medication concentrations in use In
the absence of standard concentrations for compounded medications there is a risk that
children may accidentally receive medications that are too potent and can be dangerous
or are too weak to be effective
The Michigan Health amp Hospital Association Keystone Center Patient Safety
Organization hosts five Pediatric Safe Tables each year Safe Tables provided a
confidential and legally protected environment to discuss challenges and improvement
strategies regarding inconsistent medication concentrations for compounded oral liquids
without fear of punitive action against them
National Healthcare Quality and Disparities Report | 37
Patient Safety
Overall Percentage
More than half (527) of drugs identified in the 2012 survey had 3 or more unique
concentrations dispensed to children across Michigan For example Rifampin used to
treat bacterial infections was reported to have 8 different concentrations dispensed to
patients
Nearly one-third (313) of reported errors caused temporary harm or required additional
monitoring despite no harm
Standardization of Compounded Liquid Medications
Source Michigan Health amp Hospital Association Keystone Center Patient Safety Organization and University of Michigan College of Pharmacy
State-Wide Initiative to Standardize the Compounding of Oral Liquids in Pediatrics
Standardization of compounded liquid medications for children in Michigan 2011
Issue identificationbull Hospitals attending PSO Pediatrics Safe
Table raise compounded medication concentrations as a major safety issue
bull Small focus group determines extent of problem
bull Michigan pharmacies are surveyed about baseline concentrations
Develop Interventionbull PSO Quarterly Safe Tables are held to
discuss cases and practicesbull Team develops recommendations for
standard concentrationsbull Consensus is achieved for frequently
compounded pediatric medications 470 formulations for 147 drug entities are reduced to 104 concentrations for 100 drugs
Practice changebull Toolkit is createdbull Standards are disseminated to Michigan
prescribers and pharmacies bull Standards are disseminated to PSO
members and Safe Table participants
Source Michigan Health amp Hospital Association Keystone Center Patient Safety Organization and University of Michigan College of Pharmacy
State-Wide Initiative to Standardize the Compounding of Oral Liquids in Pediatrics
Standardization of compounded liquid medications for children in Michigan 2011
Issue identificationbull Hospitals attending PSO Pediatrics Safe
Table raise compounded medication concentrations as a major safety issue
bull Small focus group determines extent of problem
bull Michigan pharmacies are surveyed about baseline concentrations
Develop Interventionbull PSO Quarterly Safe Tables are held to
discuss cases and practicesbull Team develops recommendations for
standard concentrationsbull Consensus is achieved for frequently
compounded pediatric medications 470 formulations for 147 drug entities are reduced to 104 concentrations for 100 drugs
Practice changebull Toolkit is createdbull Standards are disseminated to Michigan
prescribers and pharmacies bull Standards are disseminated to PSO
members and Safe Table participants
The Role of PSO Safe Tables Based on adverse medication events discussed in the
Michigan Health amp Hospital Association (MHA) Keystone Center Patient Safety
Organization (PSO) Safe Tables in July 2011 the Michigan Pediatric Safety Collaboration
was developed to further assess the scope of the problem and formulate a solution
The Collaborative The Michigan Pediatric Safety Collaboration includes individuals from
the University of Michigan College of Pharmacy the Michigan Pharmacists Association
(MPA) the Food and Drug Administration (FDA) and the MHA Keystone PSO
38 | National Healthcare Quality and Disparities Report
Patient Safety
Practice Change
As a result of the standardization effort 470 unique formulations for 147 drug entities
were reduced to 104 different concentrations for 100 drugs
The Michigan Pediatric Safety Collaboration developed a multistep process to implement
standards for compounding medications The MPA surveyed pharmacies in Michigan to
better define the nature and scope of the problem The PSO continued to act as convener
The result was the creation and dissemination of statewide standards for 120 frequently
compounded pediatric medications
Veterans Health Administration
The National Center for Patient Safety is part of the Veterans Health Administration the
Nationrsquos largest integrated health care system
Patient safety-related system improvement initiatives include
The Daily Planreg
Purchasing for Safety Initiative
Patient Safety Improvement Initiative
Patient safety improvement initiative The Daily Planreg at Veterans Affairs Medical Centers 2009
Source King BJ Mills PD Fore A et al The Daily Planreg including patients for safetys sake Nurs Manage 201243(3)15-8
0
10
20
30
40
50
Identified atleast one
error
Identifiederror
of omission
Identifiederror
ofcommission
Nurses Who Identified Errors in Patient Treatment Plan by Type
0
10
20
30
40
50
Patient founddiscrepancy inplanned care
Family founddiscrepancy inplanned care
Nursing Stafffound
discrepancyin plannedtreatment
Respondents Who Identified Errors or Discrepancies Through The Daily Plan reg
Patient safety improvement initiative The Daily Planreg at Veterans Affairs Medical Centers 2009
Source King BJ Mills PD Fore A et al The Daily Planreg including patients for safetys sake Nurs Manage 201243(3)15-8
0
10
20
30
40
50
Identified atleast one
error
Identifiederror
of omission
Identifiederror
ofcommission
Nurses Who Identified Errors in Patient Treatment Plan by Type
0
10
20
30
40
50
Patient founddiscrepancy inplanned care
Family founddiscrepancy inplanned care
Nursing Stafffound
discrepancyin plannedtreatment
Respondents Who Identified Errors or Discrepancies Through The Daily Plan reg
National Healthcare Quality and Disparities Report | 39
Patient Safety
Importance The Daily Planreg
is a two-page printed summary that acts as a schedule for
patients and providers each day It shows the procedures laboratory tests and medications
scheduled for that day and lists essential health information such as patientrsquos name allergies
and current medications It can be tailored for a patientrsquos needs by extracting orders from the
electronic medical record (EMR) The Daily Planreg
is intended to facilitate patient and family
engagement throughout the course of care The Daily Planreg
shows promise for improving
patient safety Since 2009 the VA has implemented The Daily Planreg
in more than 65
hospitals both inpatient and outpatient care settings The Daily Planreg
is shared more than
75000 times a month and the VA plans to continue the spread of The Daily Planreg
at
additional sites in 2016
Findings
As part of a pilot test in 2009 a total of 198 patients and 85 nurses responded to a survey
across 10 facilities Nurses had an average of 34 patients per shift who received The
Daily Planreg Patients responded about their own experiences whereas nurses reported
about all of their patients who received The Daily Planreg
Nearly half (475) of patients reported finding a discrepancy in planned care through
The Daily Planreg In addition 30 of patients reported that their family members found a
discrepancy Although not every discrepancy will be a potential medical error having a
shared understanding of the plan of care decreases the risk of error
More than one in six nurses (176) identified a discrepancy in treatment among their
patients through The Daily Planreg Most of these nurses (153) found one or more errors
of omission and a smaller share (106) of nurses found one or more errors of
commission some found both
40 | National Healthcare Quality and Disparities Report
Patient Safety
Issues Related to Ventilators
Common use-issues related to ventilators at the Veterans Health Administration 2006-2014 (combined)
Source Veterans Health Administration National Center for Patient Safety data collected October 2006 to October 2014
Note Examples of equipment failures include ventilator shutdown and other ventilator problems Ventilator settings include setup problems and
incorrect settings Support activities include space utilities and supplies Transport includes accidental extubation other transportation issues
and vehicle-related issues Alarms include alarm settings and alarm connection Training includes unknown ventilator model and other training
concerns
0
20
40
60
80
100
120
140
160
EquipmentFailure
VentilatorSettings
SupportActivities
Transport Alarms Training
Nu
mb
er o
f R
epo
rts
Common use-issues related to ventilators at the Veterans Health Administration 2006-2014 (combined)
Source Veterans Health Administration National Center for Patient Safety data collected October 2006 to October 2014
Note Examples of equipment failures include ventilator shutdown and other ventilator problems Ventilator settings include setup problems and
incorrect settings Support activities include space utilities and supplies Transport includes accidental extubation other transportation issues
and vehicle-related issues Alarms include alarm settings and alarm connection Training includes unknown ventilator model and other training
concerns
0
20
40
60
80
100
120
140
160
EquipmentFailure
VentilatorSettings
SupportActivities
Transport Alarms Training
Nu
mb
er o
f R
epo
rts
Importance Beginning with a focus on ventilators the Veterans Health Administrationrsquos
human factors-based Purchasing for Safety Initiative communicates the most common use-
issues associated with medical devices in order to ultimately remove or contain identified
vulnerabilities and prevent further harm
Event Reporting Patient safety managers report events and close calls from more than 150
VA facilities to a national database The largest number of use issues related to ventilators
involved equipment failure and issues such as spontaneous ventilator shutdown compressor
failure and broken or missing parts Other categories of ventilator use issues involved the
physical space where the ventilator was used challenges of transporting patients on
ventilators and problems with ventilator settings and alarms Root cause analyses on reports
are conducted and Patient Safety Alerts are issued to share the learning internally
Other Key Components
Data on ventilator issues from the VA and the Food and Drug Administrationrsquos Medical
Product Safety Network are the basis for a ldquogovernment-industry dayrdquo to work with
manufacturers This information is used to help the device manufacturers better
understand the limits of human use of their products
National Healthcare Quality and Disparities Report | 41
Patient Safety
The VA also trains noncliniciansmdashsuch as biomedical engineers across the
organizationmdashto understand the devices consider the situation for their use and identify
what can go wrong (ldquofailure modesrdquo) in advance
The VA encourages discussions among clinicians about their experience in using devices
In the Applied Patient Safety Challenge hundreds of staff participate in brainstorming
about solutions and strategies for dealing with unexpected scenarios involving devices
National Practitioner Data Bank
Medical malpractice actions are one way to flag potential medical errors
Medical Malpractice Payment Reports are submitted to the National Practitioner Data Bank
by medical malpractice payers
Report of a monetary exchange made for the benefit of a physician dentist or other
health care provider
Result of a settlement or judgment of a written complaint or claim based on that
providerrsquos delivery of or failure to deliver health care services
Number of Medical Malpractice Payment Reports by Setting
Number of Medical Malpractice Payment Reports by health care setting 2004-2014
Source National Practitioner Data Bank (NPDB) Public Use Data File Health Resources and Services Administration Bureau of Health
Professions Division of Practitioner Data Banks 2004-2014
Note Health care setting was not collected by the NPDB for 2104 reports in 2004 ldquoOtherrdquo includes Medical Malpractice Payment Reports
related to unknown settings as well as those for a combination of inpatient and outpatient settings Reports pertain to patients of any age
0
2000
4000
6000
8000
10000
12000
14000
16000
18000
20000
2004 2005 2006 2007 2008 2009 2010 2011 2012 2013 2014
Nu
mb
er o
f R
epo
rts
Total Inpatient Outpatient Other
Number of Medical Malpractice Payment Reports by health care setting 2004-2014
Source National Practitioner Data Bank (NPDB) Public Use Data File Health Resources and Services Administration Bureau of Health
Professions Division of Practitioner Data Banks 2004-2014
Note Health care setting was not collected by the NPDB for 2104 reports in 2004 ldquoOtherrdquo includes Medical Malpractice Payment Reports
related to unknown settings as well as those for a combination of inpatient and outpatient settings Reports pertain to patients of any age
0
2000
4000
6000
8000
10000
12000
14000
16000
18000
20000
2004 2005 2006 2007 2008 2009 2010 2011 2012 2013 2014
Nu
mb
er o
f R
epo
rts
Total Inpatient Outpatient Other
42 | National Healthcare Quality and Disparities Report
Patient Safety
Trends The total number of medical malpractice payment reports (MMPRs) per year
decreased from 17641 in 2004 to 12699 in 2014
Variation Across Reports
Of 157022 MMPRs from 2004 through 2014 more reports related to care in the
outpatient setting (71937) than in the inpatient setting (60391)
Diagnosis-related and treatment-related payments were the most frequent types of
reports each accounting for about 27 of cases Reports of payments for medication-
related cases accounted for only 5 of MMPRs (data not shown)
Number of Medical Malpractice Payment Reports by Allegation and Harm
Number of Medical Malpractice Payment Reports by type of allegation and harm severity 2004-2014
Key Temporary injury = Minor temporary injury and Major temporary injury Permanent significant injury = Significant Permanent Injury
Major Permanent Injury Quadriplegia Brain Damage Lifelong care
Source National Practitioner Data Bank Public Use Data File Health Resources and Services Administration Bureau of Health Professions
Division of Practitioner Data Banks 2004-2014
Note Reports pertain to patients of any age
0
20
40
60
80
100
Treatment(n=42913)
Diagnosis(n=42507)
Surgery(n=36845)
Obstetrics(n=10555)
Medication(n=8287)
Monitoring(n=5329)
Anesthesia(n=4276)
Equipment(n=1161)
BehavioralHealth
(n=879)
Blood(n=379)
EmotionalInjury Only
InsignificantInjury
TemporaryInjury
PermanentMinor Injury
PermanentSignificant Injury
Death Unknown
Number of Medical Malpractice Payment Reports by type of allegation and harm severity 2004-2014
Key Temporary injury = Minor temporary injury and Major temporary injury Permanent significant injury = Significant Permanent Injury
Major Permanent Injury Quadriplegia Brain Damage Lifelong care
Source National Practitioner Data Bank Public Use Data File Health Resources and Services Administration Bureau of Health Professions
Division of Practitioner Data Banks 2004-2014
Note Reports pertain to patients of any age
0
20
40
60
80
100
Treatment(n=42913)
Diagnosis(n=42507)
Surgery(n=36845)
Obstetrics(n=10555)
Medication(n=8287)
Monitoring(n=5329)
Anesthesia(n=4276)
Equipment(n=1161)
BehavioralHealth
(n=879)
Blood(n=379)
EmotionalInjury Only
InsignificantInjury
TemporaryInjury
PermanentMinor Injury
PermanentSignificant Injury
Death Unknown
Overall Percentage From 2004 to 2014 medical malpractice payments were made for
allegations related to
Treatment (42913)
Diagnosis (42507)
Surgery (36845)
Obstetrics (10555)
Medication (8287)
Monitoring (5329)
National Healthcare Quality and Disparities Report | 43
Patient Safety
Anesthesia (4276)
Equipment or products (1161)
Behavioral health (879) and
IV and blood products (379)
Variation Across Reports
Death accounted for more than one-third of harm in payments related to monitoring
(499) diagnosis (393) medication (383) and anesthesia (363) allegations
More than half of all obstetric payments were for allegations of permanent severe harm
(570)
Temporary harm accounted for more than one-third of payments related to equipment
(485) and surgery (360)
Most of the behavioral health-related payments were for emotional harm (457) or
death (338)
References
Agency for Healthcare Research and Quality Making Health Care Safer II An Updated Critical Analysis of the
Evidence for Patient Safety Practices Comparative Effectiveness Review No 211 Rockville MD Agency for
Healthcare Research and Quality March 2013 AHRQ Publication No 13-E001-EF
httpwwwahrqgovsitesdefaultfileswysiwygresearchfindingsevidence-basedshy
reportsservicesqualityptsafetyII-fullpdf
Arriaga AF Lancaster RT Berry RW et al The better colectomy project association of evidence-based best-
practice adherence rates to outcomes in colorectal surgery Ann Surg 2009 Oct250(4)507-13
httpwwwncbinlmnihgovpubmed19734778
Centers for Disease Control and Prevention HAI Prevalence Survey
httpwwwcdcgovHAIsurveillanceindexhtml Last updated March 2016 Accessed March 4 2016
Centers for Disease Control and Prevention Nursing Homes and Assisted Living (Long-Term Care Facilities)
httpwwwcdcgovlongtermcare Last updated September 2015 Accessed March 4 2016
Chassin MR Loeb JM High-reliability health care getting there from here Milbank Q 201391(3)459-90
httpwwwncbinlmnihgovpmcarticlesPMC3790522 Accessed September 23 2015
Chiu Y Bero L Hessol NA et al A literature review of clinical outcomes associated with antipsychotic medication
use in North American nursing home residents Health Policy 2015 Jun119(6)802-813 Epub 2015 Feb 28 PMID
25791166 httpwwwsciencedirectcomsciencearticlepiiS0168851015000652 Accessed June 17 2015
Huybrechts KF Gerhard Crystal S et al Differential risk of death in older residents in nursing homes prescribed
specific antipsychotic drugs Population based cohort study BMJ 2012 Feb 23344e977 PMID 22362541
httpwwwncbinlmnihgovpmcarticlesPMC3285717 Accessed June 17 2015
Institute of Medicine Preventing Medication Errors Quality Chasm Series 2007
httpwwwnapeducatalog11623preventing-medication-errors-quality-chasm-series
National Association for Home Care amp Hospice Basic Statistics About Home Care Updated 2010
httpwwwnahcorgassets1710hc_statspdf Accessed August 31 2015
44 | National Healthcare Quality and Disparities Report
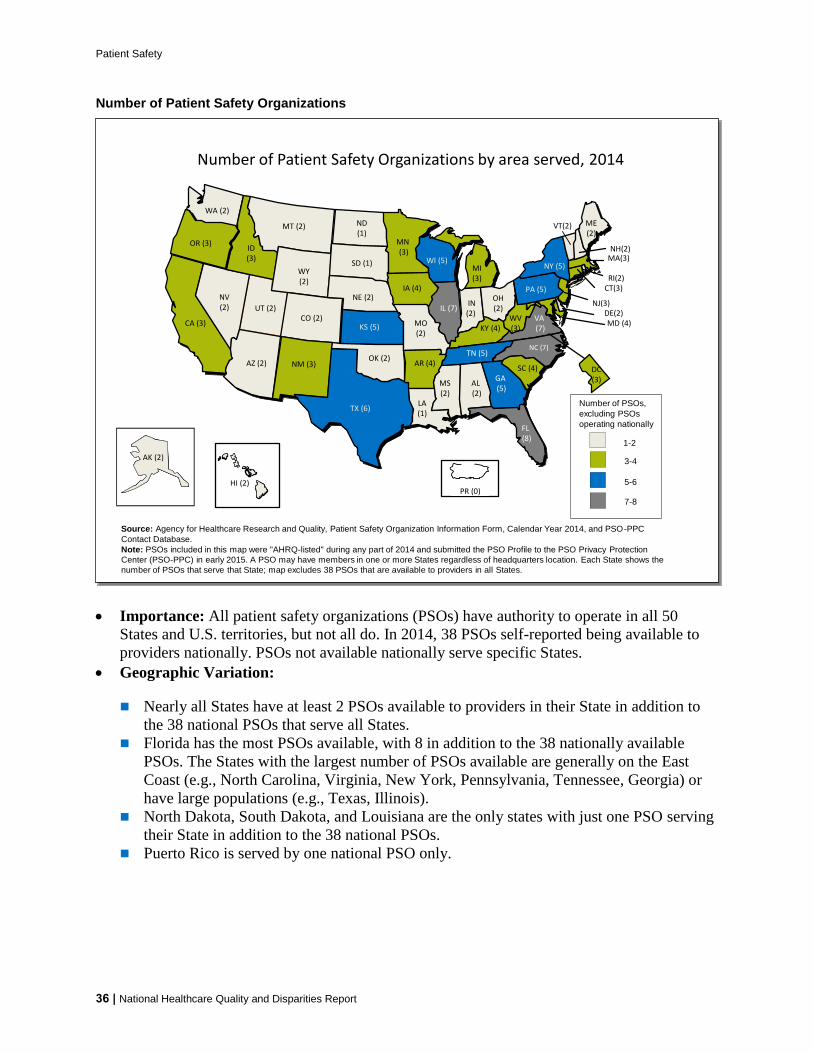
Patient Safety
Overall Percentage
More than half (527) of drugs identified in the 2012 survey had 3 or more unique
concentrations dispensed to children across Michigan For example Rifampin used to
treat bacterial infections was reported to have 8 different concentrations dispensed to
patients
Nearly one-third (313) of reported errors caused temporary harm or required additional
monitoring despite no harm
Standardization of Compounded Liquid Medications
Source Michigan Health amp Hospital Association Keystone Center Patient Safety Organization and University of Michigan College of Pharmacy
State-Wide Initiative to Standardize the Compounding of Oral Liquids in Pediatrics
Standardization of compounded liquid medications for children in Michigan 2011
Issue identificationbull Hospitals attending PSO Pediatrics Safe
Table raise compounded medication concentrations as a major safety issue
bull Small focus group determines extent of problem
bull Michigan pharmacies are surveyed about baseline concentrations
Develop Interventionbull PSO Quarterly Safe Tables are held to
discuss cases and practicesbull Team develops recommendations for
standard concentrationsbull Consensus is achieved for frequently
compounded pediatric medications 470 formulations for 147 drug entities are reduced to 104 concentrations for 100 drugs
Practice changebull Toolkit is createdbull Standards are disseminated to Michigan
prescribers and pharmacies bull Standards are disseminated to PSO
members and Safe Table participants
Source Michigan Health amp Hospital Association Keystone Center Patient Safety Organization and University of Michigan College of Pharmacy
State-Wide Initiative to Standardize the Compounding of Oral Liquids in Pediatrics
Standardization of compounded liquid medications for children in Michigan 2011
Issue identificationbull Hospitals attending PSO Pediatrics Safe
Table raise compounded medication concentrations as a major safety issue
bull Small focus group determines extent of problem
bull Michigan pharmacies are surveyed about baseline concentrations
Develop Interventionbull PSO Quarterly Safe Tables are held to
discuss cases and practicesbull Team develops recommendations for
standard concentrationsbull Consensus is achieved for frequently
compounded pediatric medications 470 formulations for 147 drug entities are reduced to 104 concentrations for 100 drugs
Practice changebull Toolkit is createdbull Standards are disseminated to Michigan
prescribers and pharmacies bull Standards are disseminated to PSO
members and Safe Table participants
The Role of PSO Safe Tables Based on adverse medication events discussed in the
Michigan Health amp Hospital Association (MHA) Keystone Center Patient Safety
Organization (PSO) Safe Tables in July 2011 the Michigan Pediatric Safety Collaboration
was developed to further assess the scope of the problem and formulate a solution
The Collaborative The Michigan Pediatric Safety Collaboration includes individuals from
the University of Michigan College of Pharmacy the Michigan Pharmacists Association
(MPA) the Food and Drug Administration (FDA) and the MHA Keystone PSO
38 | National Healthcare Quality and Disparities Report
Patient Safety
Practice Change
As a result of the standardization effort 470 unique formulations for 147 drug entities
were reduced to 104 different concentrations for 100 drugs
The Michigan Pediatric Safety Collaboration developed a multistep process to implement
standards for compounding medications The MPA surveyed pharmacies in Michigan to
better define the nature and scope of the problem The PSO continued to act as convener
The result was the creation and dissemination of statewide standards for 120 frequently
compounded pediatric medications
Veterans Health Administration
The National Center for Patient Safety is part of the Veterans Health Administration the
Nationrsquos largest integrated health care system
Patient safety-related system improvement initiatives include
The Daily Planreg
Purchasing for Safety Initiative
Patient Safety Improvement Initiative
Patient safety improvement initiative The Daily Planreg at Veterans Affairs Medical Centers 2009
Source King BJ Mills PD Fore A et al The Daily Planreg including patients for safetys sake Nurs Manage 201243(3)15-8
0
10
20
30
40
50
Identified atleast one
error
Identifiederror
of omission
Identifiederror
ofcommission
Nurses Who Identified Errors in Patient Treatment Plan by Type
0
10
20
30
40
50
Patient founddiscrepancy inplanned care
Family founddiscrepancy inplanned care
Nursing Stafffound
discrepancyin plannedtreatment
Respondents Who Identified Errors or Discrepancies Through The Daily Plan reg
Patient safety improvement initiative The Daily Planreg at Veterans Affairs Medical Centers 2009
Source King BJ Mills PD Fore A et al The Daily Planreg including patients for safetys sake Nurs Manage 201243(3)15-8
0
10
20
30
40
50
Identified atleast one
error
Identifiederror
of omission
Identifiederror
ofcommission
Nurses Who Identified Errors in Patient Treatment Plan by Type
0
10
20
30
40
50
Patient founddiscrepancy inplanned care
Family founddiscrepancy inplanned care
Nursing Stafffound
discrepancyin plannedtreatment
Respondents Who Identified Errors or Discrepancies Through The Daily Plan reg
National Healthcare Quality and Disparities Report | 39
Patient Safety
Importance The Daily Planreg
is a two-page printed summary that acts as a schedule for
patients and providers each day It shows the procedures laboratory tests and medications
scheduled for that day and lists essential health information such as patientrsquos name allergies
and current medications It can be tailored for a patientrsquos needs by extracting orders from the
electronic medical record (EMR) The Daily Planreg
is intended to facilitate patient and family
engagement throughout the course of care The Daily Planreg
shows promise for improving
patient safety Since 2009 the VA has implemented The Daily Planreg
in more than 65
hospitals both inpatient and outpatient care settings The Daily Planreg
is shared more than
75000 times a month and the VA plans to continue the spread of The Daily Planreg
at
additional sites in 2016
Findings
As part of a pilot test in 2009 a total of 198 patients and 85 nurses responded to a survey
across 10 facilities Nurses had an average of 34 patients per shift who received The
Daily Planreg Patients responded about their own experiences whereas nurses reported
about all of their patients who received The Daily Planreg
Nearly half (475) of patients reported finding a discrepancy in planned care through
The Daily Planreg In addition 30 of patients reported that their family members found a
discrepancy Although not every discrepancy will be a potential medical error having a
shared understanding of the plan of care decreases the risk of error
More than one in six nurses (176) identified a discrepancy in treatment among their
patients through The Daily Planreg Most of these nurses (153) found one or more errors
of omission and a smaller share (106) of nurses found one or more errors of
commission some found both
40 | National Healthcare Quality and Disparities Report
Patient Safety
Issues Related to Ventilators
Common use-issues related to ventilators at the Veterans Health Administration 2006-2014 (combined)
Source Veterans Health Administration National Center for Patient Safety data collected October 2006 to October 2014
Note Examples of equipment failures include ventilator shutdown and other ventilator problems Ventilator settings include setup problems and
incorrect settings Support activities include space utilities and supplies Transport includes accidental extubation other transportation issues
and vehicle-related issues Alarms include alarm settings and alarm connection Training includes unknown ventilator model and other training
concerns
0
20
40
60
80
100
120
140
160
EquipmentFailure
VentilatorSettings
SupportActivities
Transport Alarms Training
Nu
mb
er o
f R
epo
rts
Common use-issues related to ventilators at the Veterans Health Administration 2006-2014 (combined)
Source Veterans Health Administration National Center for Patient Safety data collected October 2006 to October 2014
Note Examples of equipment failures include ventilator shutdown and other ventilator problems Ventilator settings include setup problems and
incorrect settings Support activities include space utilities and supplies Transport includes accidental extubation other transportation issues
and vehicle-related issues Alarms include alarm settings and alarm connection Training includes unknown ventilator model and other training
concerns
0
20
40
60
80
100
120
140
160
EquipmentFailure
VentilatorSettings
SupportActivities
Transport Alarms Training
Nu
mb
er o
f R
epo
rts
Importance Beginning with a focus on ventilators the Veterans Health Administrationrsquos
human factors-based Purchasing for Safety Initiative communicates the most common use-
issues associated with medical devices in order to ultimately remove or contain identified
vulnerabilities and prevent further harm
Event Reporting Patient safety managers report events and close calls from more than 150
VA facilities to a national database The largest number of use issues related to ventilators
involved equipment failure and issues such as spontaneous ventilator shutdown compressor
failure and broken or missing parts Other categories of ventilator use issues involved the
physical space where the ventilator was used challenges of transporting patients on
ventilators and problems with ventilator settings and alarms Root cause analyses on reports
are conducted and Patient Safety Alerts are issued to share the learning internally
Other Key Components
Data on ventilator issues from the VA and the Food and Drug Administrationrsquos Medical
Product Safety Network are the basis for a ldquogovernment-industry dayrdquo to work with
manufacturers This information is used to help the device manufacturers better
understand the limits of human use of their products
National Healthcare Quality and Disparities Report | 41
Patient Safety
The VA also trains noncliniciansmdashsuch as biomedical engineers across the
organizationmdashto understand the devices consider the situation for their use and identify
what can go wrong (ldquofailure modesrdquo) in advance
The VA encourages discussions among clinicians about their experience in using devices
In the Applied Patient Safety Challenge hundreds of staff participate in brainstorming
about solutions and strategies for dealing with unexpected scenarios involving devices
National Practitioner Data Bank
Medical malpractice actions are one way to flag potential medical errors
Medical Malpractice Payment Reports are submitted to the National Practitioner Data Bank
by medical malpractice payers
Report of a monetary exchange made for the benefit of a physician dentist or other
health care provider
Result of a settlement or judgment of a written complaint or claim based on that
providerrsquos delivery of or failure to deliver health care services
Number of Medical Malpractice Payment Reports by Setting
Number of Medical Malpractice Payment Reports by health care setting 2004-2014
Source National Practitioner Data Bank (NPDB) Public Use Data File Health Resources and Services Administration Bureau of Health
Professions Division of Practitioner Data Banks 2004-2014
Note Health care setting was not collected by the NPDB for 2104 reports in 2004 ldquoOtherrdquo includes Medical Malpractice Payment Reports
related to unknown settings as well as those for a combination of inpatient and outpatient settings Reports pertain to patients of any age
0
2000
4000
6000
8000
10000
12000
14000
16000
18000
20000
2004 2005 2006 2007 2008 2009 2010 2011 2012 2013 2014
Nu
mb
er o
f R
epo
rts
Total Inpatient Outpatient Other
Number of Medical Malpractice Payment Reports by health care setting 2004-2014
Source National Practitioner Data Bank (NPDB) Public Use Data File Health Resources and Services Administration Bureau of Health
Professions Division of Practitioner Data Banks 2004-2014
Note Health care setting was not collected by the NPDB for 2104 reports in 2004 ldquoOtherrdquo includes Medical Malpractice Payment Reports
related to unknown settings as well as those for a combination of inpatient and outpatient settings Reports pertain to patients of any age
0
2000
4000
6000
8000
10000
12000
14000
16000
18000
20000
2004 2005 2006 2007 2008 2009 2010 2011 2012 2013 2014
Nu
mb
er o
f R
epo
rts
Total Inpatient Outpatient Other
42 | National Healthcare Quality and Disparities Report
Patient Safety
Trends The total number of medical malpractice payment reports (MMPRs) per year
decreased from 17641 in 2004 to 12699 in 2014
Variation Across Reports
Of 157022 MMPRs from 2004 through 2014 more reports related to care in the
outpatient setting (71937) than in the inpatient setting (60391)
Diagnosis-related and treatment-related payments were the most frequent types of
reports each accounting for about 27 of cases Reports of payments for medication-
related cases accounted for only 5 of MMPRs (data not shown)
Number of Medical Malpractice Payment Reports by Allegation and Harm
Number of Medical Malpractice Payment Reports by type of allegation and harm severity 2004-2014
Key Temporary injury = Minor temporary injury and Major temporary injury Permanent significant injury = Significant Permanent Injury
Major Permanent Injury Quadriplegia Brain Damage Lifelong care
Source National Practitioner Data Bank Public Use Data File Health Resources and Services Administration Bureau of Health Professions
Division of Practitioner Data Banks 2004-2014
Note Reports pertain to patients of any age
0
20
40
60
80
100
Treatment(n=42913)
Diagnosis(n=42507)
Surgery(n=36845)
Obstetrics(n=10555)
Medication(n=8287)
Monitoring(n=5329)
Anesthesia(n=4276)
Equipment(n=1161)
BehavioralHealth
(n=879)
Blood(n=379)
EmotionalInjury Only
InsignificantInjury
TemporaryInjury
PermanentMinor Injury
PermanentSignificant Injury
Death Unknown
Number of Medical Malpractice Payment Reports by type of allegation and harm severity 2004-2014
Key Temporary injury = Minor temporary injury and Major temporary injury Permanent significant injury = Significant Permanent Injury
Major Permanent Injury Quadriplegia Brain Damage Lifelong care
Source National Practitioner Data Bank Public Use Data File Health Resources and Services Administration Bureau of Health Professions
Division of Practitioner Data Banks 2004-2014
Note Reports pertain to patients of any age
0
20
40
60
80
100
Treatment(n=42913)
Diagnosis(n=42507)
Surgery(n=36845)
Obstetrics(n=10555)
Medication(n=8287)
Monitoring(n=5329)
Anesthesia(n=4276)
Equipment(n=1161)
BehavioralHealth
(n=879)
Blood(n=379)
EmotionalInjury Only
InsignificantInjury
TemporaryInjury
PermanentMinor Injury
PermanentSignificant Injury
Death Unknown
Overall Percentage From 2004 to 2014 medical malpractice payments were made for
allegations related to
Treatment (42913)
Diagnosis (42507)
Surgery (36845)
Obstetrics (10555)
Medication (8287)
Monitoring (5329)
National Healthcare Quality and Disparities Report | 43
Patient Safety
Anesthesia (4276)
Equipment or products (1161)
Behavioral health (879) and
IV and blood products (379)
Variation Across Reports
Death accounted for more than one-third of harm in payments related to monitoring
(499) diagnosis (393) medication (383) and anesthesia (363) allegations
More than half of all obstetric payments were for allegations of permanent severe harm
(570)
Temporary harm accounted for more than one-third of payments related to equipment
(485) and surgery (360)
Most of the behavioral health-related payments were for emotional harm (457) or
death (338)
References
Agency for Healthcare Research and Quality Making Health Care Safer II An Updated Critical Analysis of the
Evidence for Patient Safety Practices Comparative Effectiveness Review No 211 Rockville MD Agency for
Healthcare Research and Quality March 2013 AHRQ Publication No 13-E001-EF
httpwwwahrqgovsitesdefaultfileswysiwygresearchfindingsevidence-basedshy
reportsservicesqualityptsafetyII-fullpdf
Arriaga AF Lancaster RT Berry RW et al The better colectomy project association of evidence-based best-
practice adherence rates to outcomes in colorectal surgery Ann Surg 2009 Oct250(4)507-13
httpwwwncbinlmnihgovpubmed19734778
Centers for Disease Control and Prevention HAI Prevalence Survey
httpwwwcdcgovHAIsurveillanceindexhtml Last updated March 2016 Accessed March 4 2016
Centers for Disease Control and Prevention Nursing Homes and Assisted Living (Long-Term Care Facilities)
httpwwwcdcgovlongtermcare Last updated September 2015 Accessed March 4 2016
Chassin MR Loeb JM High-reliability health care getting there from here Milbank Q 201391(3)459-90
httpwwwncbinlmnihgovpmcarticlesPMC3790522 Accessed September 23 2015
Chiu Y Bero L Hessol NA et al A literature review of clinical outcomes associated with antipsychotic medication
use in North American nursing home residents Health Policy 2015 Jun119(6)802-813 Epub 2015 Feb 28 PMID
25791166 httpwwwsciencedirectcomsciencearticlepiiS0168851015000652 Accessed June 17 2015
Huybrechts KF Gerhard Crystal S et al Differential risk of death in older residents in nursing homes prescribed
specific antipsychotic drugs Population based cohort study BMJ 2012 Feb 23344e977 PMID 22362541
httpwwwncbinlmnihgovpmcarticlesPMC3285717 Accessed June 17 2015
Institute of Medicine Preventing Medication Errors Quality Chasm Series 2007
httpwwwnapeducatalog11623preventing-medication-errors-quality-chasm-series
National Association for Home Care amp Hospice Basic Statistics About Home Care Updated 2010
httpwwwnahcorgassets1710hc_statspdf Accessed August 31 2015
44 | National Healthcare Quality and Disparities Report
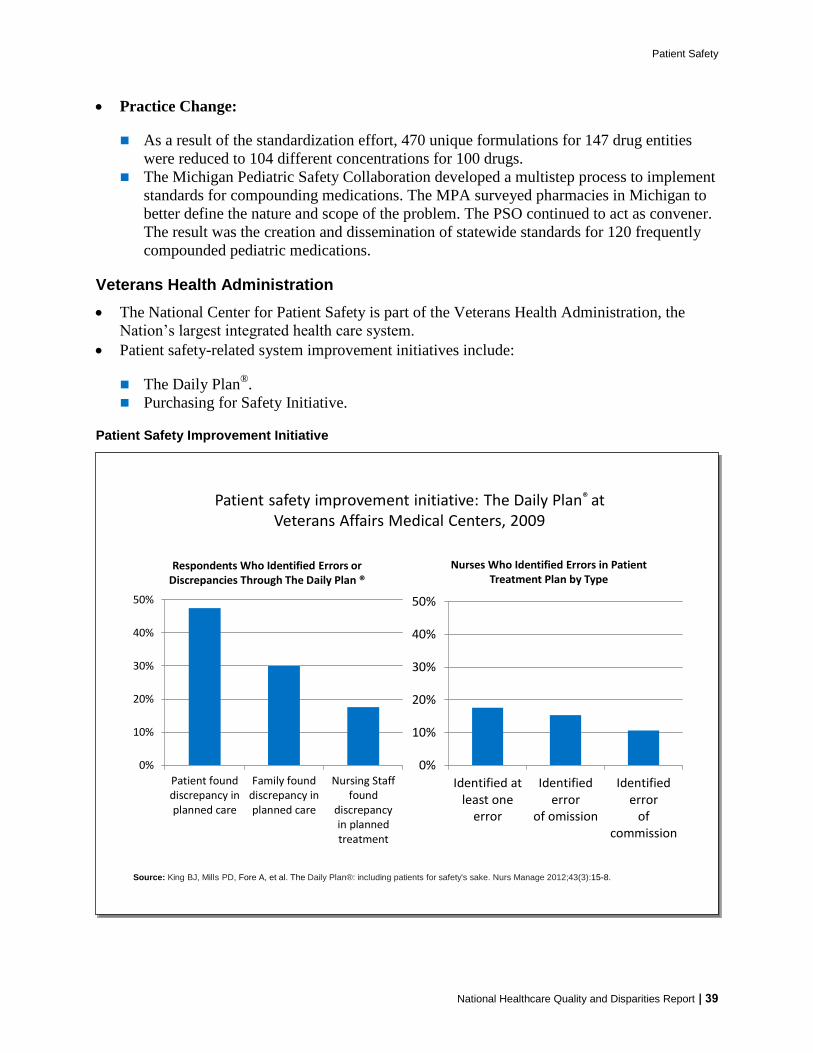
Patient Safety
Practice Change
As a result of the standardization effort 470 unique formulations for 147 drug entities
were reduced to 104 different concentrations for 100 drugs
The Michigan Pediatric Safety Collaboration developed a multistep process to implement
standards for compounding medications The MPA surveyed pharmacies in Michigan to
better define the nature and scope of the problem The PSO continued to act as convener
The result was the creation and dissemination of statewide standards for 120 frequently
compounded pediatric medications
Veterans Health Administration
The National Center for Patient Safety is part of the Veterans Health Administration the
Nationrsquos largest integrated health care system
Patient safety-related system improvement initiatives include
The Daily Planreg
Purchasing for Safety Initiative
Patient Safety Improvement Initiative
Patient safety improvement initiative The Daily Planreg at Veterans Affairs Medical Centers 2009
Source King BJ Mills PD Fore A et al The Daily Planreg including patients for safetys sake Nurs Manage 201243(3)15-8
0
10
20
30
40
50
Identified atleast one
error
Identifiederror
of omission
Identifiederror
ofcommission
Nurses Who Identified Errors in Patient Treatment Plan by Type
0
10
20
30
40
50
Patient founddiscrepancy inplanned care
Family founddiscrepancy inplanned care
Nursing Stafffound
discrepancyin plannedtreatment
Respondents Who Identified Errors or Discrepancies Through The Daily Plan reg
Patient safety improvement initiative The Daily Planreg at Veterans Affairs Medical Centers 2009
Source King BJ Mills PD Fore A et al The Daily Planreg including patients for safetys sake Nurs Manage 201243(3)15-8
0
10
20
30
40
50
Identified atleast one
error
Identifiederror
of omission
Identifiederror
ofcommission
Nurses Who Identified Errors in Patient Treatment Plan by Type
0
10
20
30
40
50
Patient founddiscrepancy inplanned care
Family founddiscrepancy inplanned care
Nursing Stafffound
discrepancyin plannedtreatment
Respondents Who Identified Errors or Discrepancies Through The Daily Plan reg
National Healthcare Quality and Disparities Report | 39
Patient Safety
Importance The Daily Planreg
is a two-page printed summary that acts as a schedule for
patients and providers each day It shows the procedures laboratory tests and medications
scheduled for that day and lists essential health information such as patientrsquos name allergies
and current medications It can be tailored for a patientrsquos needs by extracting orders from the
electronic medical record (EMR) The Daily Planreg
is intended to facilitate patient and family
engagement throughout the course of care The Daily Planreg
shows promise for improving
patient safety Since 2009 the VA has implemented The Daily Planreg
in more than 65
hospitals both inpatient and outpatient care settings The Daily Planreg
is shared more than
75000 times a month and the VA plans to continue the spread of The Daily Planreg
at
additional sites in 2016
Findings
As part of a pilot test in 2009 a total of 198 patients and 85 nurses responded to a survey
across 10 facilities Nurses had an average of 34 patients per shift who received The
Daily Planreg Patients responded about their own experiences whereas nurses reported
about all of their patients who received The Daily Planreg
Nearly half (475) of patients reported finding a discrepancy in planned care through
The Daily Planreg In addition 30 of patients reported that their family members found a
discrepancy Although not every discrepancy will be a potential medical error having a
shared understanding of the plan of care decreases the risk of error
More than one in six nurses (176) identified a discrepancy in treatment among their
patients through The Daily Planreg Most of these nurses (153) found one or more errors
of omission and a smaller share (106) of nurses found one or more errors of
commission some found both
40 | National Healthcare Quality and Disparities Report
Patient Safety
Issues Related to Ventilators
Common use-issues related to ventilators at the Veterans Health Administration 2006-2014 (combined)
Source Veterans Health Administration National Center for Patient Safety data collected October 2006 to October 2014
Note Examples of equipment failures include ventilator shutdown and other ventilator problems Ventilator settings include setup problems and
incorrect settings Support activities include space utilities and supplies Transport includes accidental extubation other transportation issues
and vehicle-related issues Alarms include alarm settings and alarm connection Training includes unknown ventilator model and other training
concerns
0
20
40
60
80
100
120
140
160
EquipmentFailure
VentilatorSettings
SupportActivities
Transport Alarms Training
Nu
mb
er o
f R
epo
rts
Common use-issues related to ventilators at the Veterans Health Administration 2006-2014 (combined)
Source Veterans Health Administration National Center for Patient Safety data collected October 2006 to October 2014
Note Examples of equipment failures include ventilator shutdown and other ventilator problems Ventilator settings include setup problems and
incorrect settings Support activities include space utilities and supplies Transport includes accidental extubation other transportation issues
and vehicle-related issues Alarms include alarm settings and alarm connection Training includes unknown ventilator model and other training
concerns
0
20
40
60
80
100
120
140
160
EquipmentFailure
VentilatorSettings
SupportActivities
Transport Alarms Training
Nu
mb
er o
f R
epo
rts
Importance Beginning with a focus on ventilators the Veterans Health Administrationrsquos
human factors-based Purchasing for Safety Initiative communicates the most common use-
issues associated with medical devices in order to ultimately remove or contain identified
vulnerabilities and prevent further harm
Event Reporting Patient safety managers report events and close calls from more than 150
VA facilities to a national database The largest number of use issues related to ventilators
involved equipment failure and issues such as spontaneous ventilator shutdown compressor
failure and broken or missing parts Other categories of ventilator use issues involved the
physical space where the ventilator was used challenges of transporting patients on
ventilators and problems with ventilator settings and alarms Root cause analyses on reports
are conducted and Patient Safety Alerts are issued to share the learning internally
Other Key Components
Data on ventilator issues from the VA and the Food and Drug Administrationrsquos Medical
Product Safety Network are the basis for a ldquogovernment-industry dayrdquo to work with
manufacturers This information is used to help the device manufacturers better
understand the limits of human use of their products
National Healthcare Quality and Disparities Report | 41
Patient Safety
The VA also trains noncliniciansmdashsuch as biomedical engineers across the
organizationmdashto understand the devices consider the situation for their use and identify
what can go wrong (ldquofailure modesrdquo) in advance
The VA encourages discussions among clinicians about their experience in using devices
In the Applied Patient Safety Challenge hundreds of staff participate in brainstorming
about solutions and strategies for dealing with unexpected scenarios involving devices
National Practitioner Data Bank
Medical malpractice actions are one way to flag potential medical errors
Medical Malpractice Payment Reports are submitted to the National Practitioner Data Bank
by medical malpractice payers
Report of a monetary exchange made for the benefit of a physician dentist or other
health care provider
Result of a settlement or judgment of a written complaint or claim based on that
providerrsquos delivery of or failure to deliver health care services
Number of Medical Malpractice Payment Reports by Setting
Number of Medical Malpractice Payment Reports by health care setting 2004-2014
Source National Practitioner Data Bank (NPDB) Public Use Data File Health Resources and Services Administration Bureau of Health
Professions Division of Practitioner Data Banks 2004-2014
Note Health care setting was not collected by the NPDB for 2104 reports in 2004 ldquoOtherrdquo includes Medical Malpractice Payment Reports
related to unknown settings as well as those for a combination of inpatient and outpatient settings Reports pertain to patients of any age
0
2000
4000
6000
8000
10000
12000
14000
16000
18000
20000
2004 2005 2006 2007 2008 2009 2010 2011 2012 2013 2014
Nu
mb
er o
f R
epo
rts
Total Inpatient Outpatient Other
Number of Medical Malpractice Payment Reports by health care setting 2004-2014
Source National Practitioner Data Bank (NPDB) Public Use Data File Health Resources and Services Administration Bureau of Health
Professions Division of Practitioner Data Banks 2004-2014
Note Health care setting was not collected by the NPDB for 2104 reports in 2004 ldquoOtherrdquo includes Medical Malpractice Payment Reports
related to unknown settings as well as those for a combination of inpatient and outpatient settings Reports pertain to patients of any age
0
2000
4000
6000
8000
10000
12000
14000
16000
18000
20000
2004 2005 2006 2007 2008 2009 2010 2011 2012 2013 2014
Nu
mb
er o
f R
epo
rts
Total Inpatient Outpatient Other
42 | National Healthcare Quality and Disparities Report
Patient Safety
Trends The total number of medical malpractice payment reports (MMPRs) per year
decreased from 17641 in 2004 to 12699 in 2014
Variation Across Reports
Of 157022 MMPRs from 2004 through 2014 more reports related to care in the
outpatient setting (71937) than in the inpatient setting (60391)
Diagnosis-related and treatment-related payments were the most frequent types of
reports each accounting for about 27 of cases Reports of payments for medication-
related cases accounted for only 5 of MMPRs (data not shown)
Number of Medical Malpractice Payment Reports by Allegation and Harm
Number of Medical Malpractice Payment Reports by type of allegation and harm severity 2004-2014
Key Temporary injury = Minor temporary injury and Major temporary injury Permanent significant injury = Significant Permanent Injury
Major Permanent Injury Quadriplegia Brain Damage Lifelong care
Source National Practitioner Data Bank Public Use Data File Health Resources and Services Administration Bureau of Health Professions
Division of Practitioner Data Banks 2004-2014
Note Reports pertain to patients of any age
0
20
40
60
80
100
Treatment(n=42913)
Diagnosis(n=42507)
Surgery(n=36845)
Obstetrics(n=10555)
Medication(n=8287)
Monitoring(n=5329)
Anesthesia(n=4276)
Equipment(n=1161)
BehavioralHealth
(n=879)
Blood(n=379)
EmotionalInjury Only
InsignificantInjury
TemporaryInjury
PermanentMinor Injury
PermanentSignificant Injury
Death Unknown
Number of Medical Malpractice Payment Reports by type of allegation and harm severity 2004-2014
Key Temporary injury = Minor temporary injury and Major temporary injury Permanent significant injury = Significant Permanent Injury
Major Permanent Injury Quadriplegia Brain Damage Lifelong care
Source National Practitioner Data Bank Public Use Data File Health Resources and Services Administration Bureau of Health Professions
Division of Practitioner Data Banks 2004-2014
Note Reports pertain to patients of any age
0
20
40
60
80
100
Treatment(n=42913)
Diagnosis(n=42507)
Surgery(n=36845)
Obstetrics(n=10555)
Medication(n=8287)
Monitoring(n=5329)
Anesthesia(n=4276)
Equipment(n=1161)
BehavioralHealth
(n=879)
Blood(n=379)
EmotionalInjury Only
InsignificantInjury
TemporaryInjury
PermanentMinor Injury
PermanentSignificant Injury
Death Unknown
Overall Percentage From 2004 to 2014 medical malpractice payments were made for
allegations related to
Treatment (42913)
Diagnosis (42507)
Surgery (36845)
Obstetrics (10555)
Medication (8287)
Monitoring (5329)
National Healthcare Quality and Disparities Report | 43
Patient Safety
Anesthesia (4276)
Equipment or products (1161)
Behavioral health (879) and
IV and blood products (379)
Variation Across Reports
Death accounted for more than one-third of harm in payments related to monitoring
(499) diagnosis (393) medication (383) and anesthesia (363) allegations
More than half of all obstetric payments were for allegations of permanent severe harm
(570)
Temporary harm accounted for more than one-third of payments related to equipment
(485) and surgery (360)
Most of the behavioral health-related payments were for emotional harm (457) or
death (338)
References
Agency for Healthcare Research and Quality Making Health Care Safer II An Updated Critical Analysis of the
Evidence for Patient Safety Practices Comparative Effectiveness Review No 211 Rockville MD Agency for
Healthcare Research and Quality March 2013 AHRQ Publication No 13-E001-EF
httpwwwahrqgovsitesdefaultfileswysiwygresearchfindingsevidence-basedshy
reportsservicesqualityptsafetyII-fullpdf
Arriaga AF Lancaster RT Berry RW et al The better colectomy project association of evidence-based best-
practice adherence rates to outcomes in colorectal surgery Ann Surg 2009 Oct250(4)507-13
httpwwwncbinlmnihgovpubmed19734778
Centers for Disease Control and Prevention HAI Prevalence Survey
httpwwwcdcgovHAIsurveillanceindexhtml Last updated March 2016 Accessed March 4 2016
Centers for Disease Control and Prevention Nursing Homes and Assisted Living (Long-Term Care Facilities)
httpwwwcdcgovlongtermcare Last updated September 2015 Accessed March 4 2016
Chassin MR Loeb JM High-reliability health care getting there from here Milbank Q 201391(3)459-90
httpwwwncbinlmnihgovpmcarticlesPMC3790522 Accessed September 23 2015
Chiu Y Bero L Hessol NA et al A literature review of clinical outcomes associated with antipsychotic medication
use in North American nursing home residents Health Policy 2015 Jun119(6)802-813 Epub 2015 Feb 28 PMID
25791166 httpwwwsciencedirectcomsciencearticlepiiS0168851015000652 Accessed June 17 2015
Huybrechts KF Gerhard Crystal S et al Differential risk of death in older residents in nursing homes prescribed
specific antipsychotic drugs Population based cohort study BMJ 2012 Feb 23344e977 PMID 22362541
httpwwwncbinlmnihgovpmcarticlesPMC3285717 Accessed June 17 2015
Institute of Medicine Preventing Medication Errors Quality Chasm Series 2007
httpwwwnapeducatalog11623preventing-medication-errors-quality-chasm-series
National Association for Home Care amp Hospice Basic Statistics About Home Care Updated 2010
httpwwwnahcorgassets1710hc_statspdf Accessed August 31 2015
44 | National Healthcare Quality and Disparities Report
Patient Safety
Importance The Daily Planreg
is a two-page printed summary that acts as a schedule for
patients and providers each day It shows the procedures laboratory tests and medications
scheduled for that day and lists essential health information such as patientrsquos name allergies
and current medications It can be tailored for a patientrsquos needs by extracting orders from the
electronic medical record (EMR) The Daily Planreg
is intended to facilitate patient and family
engagement throughout the course of care The Daily Planreg
shows promise for improving
patient safety Since 2009 the VA has implemented The Daily Planreg
in more than 65
hospitals both inpatient and outpatient care settings The Daily Planreg
is shared more than
75000 times a month and the VA plans to continue the spread of The Daily Planreg
at
additional sites in 2016
Findings
As part of a pilot test in 2009 a total of 198 patients and 85 nurses responded to a survey
across 10 facilities Nurses had an average of 34 patients per shift who received The
Daily Planreg Patients responded about their own experiences whereas nurses reported
about all of their patients who received The Daily Planreg
Nearly half (475) of patients reported finding a discrepancy in planned care through
The Daily Planreg In addition 30 of patients reported that their family members found a
discrepancy Although not every discrepancy will be a potential medical error having a
shared understanding of the plan of care decreases the risk of error
More than one in six nurses (176) identified a discrepancy in treatment among their
patients through The Daily Planreg Most of these nurses (153) found one or more errors
of omission and a smaller share (106) of nurses found one or more errors of
commission some found both
40 | National Healthcare Quality and Disparities Report
Patient Safety
Issues Related to Ventilators
Common use-issues related to ventilators at the Veterans Health Administration 2006-2014 (combined)
Source Veterans Health Administration National Center for Patient Safety data collected October 2006 to October 2014
Note Examples of equipment failures include ventilator shutdown and other ventilator problems Ventilator settings include setup problems and
incorrect settings Support activities include space utilities and supplies Transport includes accidental extubation other transportation issues
and vehicle-related issues Alarms include alarm settings and alarm connection Training includes unknown ventilator model and other training
concerns
0
20
40
60
80
100
120
140
160
EquipmentFailure
VentilatorSettings
SupportActivities
Transport Alarms Training
Nu
mb
er o
f R
epo
rts
Common use-issues related to ventilators at the Veterans Health Administration 2006-2014 (combined)
Source Veterans Health Administration National Center for Patient Safety data collected October 2006 to October 2014
Note Examples of equipment failures include ventilator shutdown and other ventilator problems Ventilator settings include setup problems and
incorrect settings Support activities include space utilities and supplies Transport includes accidental extubation other transportation issues
and vehicle-related issues Alarms include alarm settings and alarm connection Training includes unknown ventilator model and other training
concerns
0
20
40
60
80
100
120
140
160
EquipmentFailure
VentilatorSettings
SupportActivities
Transport Alarms Training
Nu
mb
er o
f R
epo
rts
Importance Beginning with a focus on ventilators the Veterans Health Administrationrsquos
human factors-based Purchasing for Safety Initiative communicates the most common use-
issues associated with medical devices in order to ultimately remove or contain identified
vulnerabilities and prevent further harm
Event Reporting Patient safety managers report events and close calls from more than 150
VA facilities to a national database The largest number of use issues related to ventilators
involved equipment failure and issues such as spontaneous ventilator shutdown compressor
failure and broken or missing parts Other categories of ventilator use issues involved the
physical space where the ventilator was used challenges of transporting patients on
ventilators and problems with ventilator settings and alarms Root cause analyses on reports
are conducted and Patient Safety Alerts are issued to share the learning internally
Other Key Components
Data on ventilator issues from the VA and the Food and Drug Administrationrsquos Medical
Product Safety Network are the basis for a ldquogovernment-industry dayrdquo to work with
manufacturers This information is used to help the device manufacturers better
understand the limits of human use of their products
National Healthcare Quality and Disparities Report | 41
Patient Safety
The VA also trains noncliniciansmdashsuch as biomedical engineers across the
organizationmdashto understand the devices consider the situation for their use and identify
what can go wrong (ldquofailure modesrdquo) in advance
The VA encourages discussions among clinicians about their experience in using devices
In the Applied Patient Safety Challenge hundreds of staff participate in brainstorming
about solutions and strategies for dealing with unexpected scenarios involving devices
National Practitioner Data Bank
Medical malpractice actions are one way to flag potential medical errors
Medical Malpractice Payment Reports are submitted to the National Practitioner Data Bank
by medical malpractice payers
Report of a monetary exchange made for the benefit of a physician dentist or other
health care provider
Result of a settlement or judgment of a written complaint or claim based on that
providerrsquos delivery of or failure to deliver health care services
Number of Medical Malpractice Payment Reports by Setting
Number of Medical Malpractice Payment Reports by health care setting 2004-2014
Source National Practitioner Data Bank (NPDB) Public Use Data File Health Resources and Services Administration Bureau of Health
Professions Division of Practitioner Data Banks 2004-2014
Note Health care setting was not collected by the NPDB for 2104 reports in 2004 ldquoOtherrdquo includes Medical Malpractice Payment Reports
related to unknown settings as well as those for a combination of inpatient and outpatient settings Reports pertain to patients of any age
0
2000
4000
6000
8000
10000
12000
14000
16000
18000
20000
2004 2005 2006 2007 2008 2009 2010 2011 2012 2013 2014
Nu
mb
er o
f R
epo
rts
Total Inpatient Outpatient Other
Number of Medical Malpractice Payment Reports by health care setting 2004-2014
Source National Practitioner Data Bank (NPDB) Public Use Data File Health Resources and Services Administration Bureau of Health
Professions Division of Practitioner Data Banks 2004-2014
Note Health care setting was not collected by the NPDB for 2104 reports in 2004 ldquoOtherrdquo includes Medical Malpractice Payment Reports
related to unknown settings as well as those for a combination of inpatient and outpatient settings Reports pertain to patients of any age
0
2000
4000
6000
8000
10000
12000
14000
16000
18000
20000
2004 2005 2006 2007 2008 2009 2010 2011 2012 2013 2014
Nu
mb
er o
f R
epo
rts
Total Inpatient Outpatient Other
42 | National Healthcare Quality and Disparities Report
Patient Safety
Trends The total number of medical malpractice payment reports (MMPRs) per year
decreased from 17641 in 2004 to 12699 in 2014
Variation Across Reports
Of 157022 MMPRs from 2004 through 2014 more reports related to care in the
outpatient setting (71937) than in the inpatient setting (60391)
Diagnosis-related and treatment-related payments were the most frequent types of
reports each accounting for about 27 of cases Reports of payments for medication-
related cases accounted for only 5 of MMPRs (data not shown)
Number of Medical Malpractice Payment Reports by Allegation and Harm
Number of Medical Malpractice Payment Reports by type of allegation and harm severity 2004-2014
Key Temporary injury = Minor temporary injury and Major temporary injury Permanent significant injury = Significant Permanent Injury
Major Permanent Injury Quadriplegia Brain Damage Lifelong care
Source National Practitioner Data Bank Public Use Data File Health Resources and Services Administration Bureau of Health Professions
Division of Practitioner Data Banks 2004-2014
Note Reports pertain to patients of any age
0
20
40
60
80
100
Treatment(n=42913)
Diagnosis(n=42507)
Surgery(n=36845)
Obstetrics(n=10555)
Medication(n=8287)
Monitoring(n=5329)
Anesthesia(n=4276)
Equipment(n=1161)
BehavioralHealth
(n=879)
Blood(n=379)
EmotionalInjury Only
InsignificantInjury
TemporaryInjury
PermanentMinor Injury
PermanentSignificant Injury
Death Unknown
Number of Medical Malpractice Payment Reports by type of allegation and harm severity 2004-2014
Key Temporary injury = Minor temporary injury and Major temporary injury Permanent significant injury = Significant Permanent Injury
Major Permanent Injury Quadriplegia Brain Damage Lifelong care
Source National Practitioner Data Bank Public Use Data File Health Resources and Services Administration Bureau of Health Professions
Division of Practitioner Data Banks 2004-2014
Note Reports pertain to patients of any age
0
20
40
60
80
100
Treatment(n=42913)
Diagnosis(n=42507)
Surgery(n=36845)
Obstetrics(n=10555)
Medication(n=8287)
Monitoring(n=5329)
Anesthesia(n=4276)
Equipment(n=1161)
BehavioralHealth
(n=879)
Blood(n=379)
EmotionalInjury Only
InsignificantInjury
TemporaryInjury
PermanentMinor Injury
PermanentSignificant Injury
Death Unknown
Overall Percentage From 2004 to 2014 medical malpractice payments were made for
allegations related to
Treatment (42913)
Diagnosis (42507)
Surgery (36845)
Obstetrics (10555)
Medication (8287)
Monitoring (5329)
National Healthcare Quality and Disparities Report | 43
Patient Safety
Anesthesia (4276)
Equipment or products (1161)
Behavioral health (879) and
IV and blood products (379)
Variation Across Reports
Death accounted for more than one-third of harm in payments related to monitoring
(499) diagnosis (393) medication (383) and anesthesia (363) allegations
More than half of all obstetric payments were for allegations of permanent severe harm
(570)
Temporary harm accounted for more than one-third of payments related to equipment
(485) and surgery (360)
Most of the behavioral health-related payments were for emotional harm (457) or
death (338)
References
Agency for Healthcare Research and Quality Making Health Care Safer II An Updated Critical Analysis of the
Evidence for Patient Safety Practices Comparative Effectiveness Review No 211 Rockville MD Agency for
Healthcare Research and Quality March 2013 AHRQ Publication No 13-E001-EF
httpwwwahrqgovsitesdefaultfileswysiwygresearchfindingsevidence-basedshy
reportsservicesqualityptsafetyII-fullpdf
Arriaga AF Lancaster RT Berry RW et al The better colectomy project association of evidence-based best-
practice adherence rates to outcomes in colorectal surgery Ann Surg 2009 Oct250(4)507-13
httpwwwncbinlmnihgovpubmed19734778
Centers for Disease Control and Prevention HAI Prevalence Survey
httpwwwcdcgovHAIsurveillanceindexhtml Last updated March 2016 Accessed March 4 2016
Centers for Disease Control and Prevention Nursing Homes and Assisted Living (Long-Term Care Facilities)
httpwwwcdcgovlongtermcare Last updated September 2015 Accessed March 4 2016
Chassin MR Loeb JM High-reliability health care getting there from here Milbank Q 201391(3)459-90
httpwwwncbinlmnihgovpmcarticlesPMC3790522 Accessed September 23 2015
Chiu Y Bero L Hessol NA et al A literature review of clinical outcomes associated with antipsychotic medication
use in North American nursing home residents Health Policy 2015 Jun119(6)802-813 Epub 2015 Feb 28 PMID
25791166 httpwwwsciencedirectcomsciencearticlepiiS0168851015000652 Accessed June 17 2015
Huybrechts KF Gerhard Crystal S et al Differential risk of death in older residents in nursing homes prescribed
specific antipsychotic drugs Population based cohort study BMJ 2012 Feb 23344e977 PMID 22362541
httpwwwncbinlmnihgovpmcarticlesPMC3285717 Accessed June 17 2015
Institute of Medicine Preventing Medication Errors Quality Chasm Series 2007
httpwwwnapeducatalog11623preventing-medication-errors-quality-chasm-series
National Association for Home Care amp Hospice Basic Statistics About Home Care Updated 2010
httpwwwnahcorgassets1710hc_statspdf Accessed August 31 2015
44 | National Healthcare Quality and Disparities Report
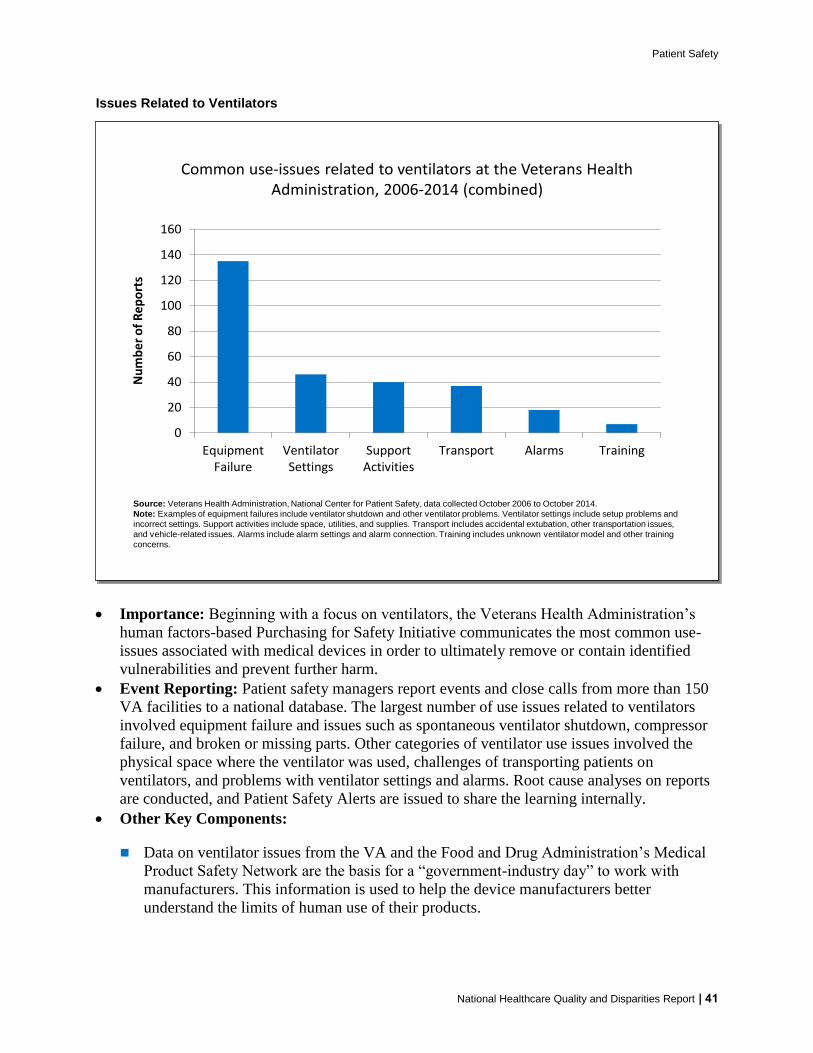
Patient Safety
The VA also trains noncliniciansmdashsuch as biomedical engineers across the
organizationmdashto understand the devices consider the situation for their use and identify
what can go wrong (ldquofailure modesrdquo) in advance
The VA encourages discussions among clinicians about their experience in using devices
In the Applied Patient Safety Challenge hundreds of staff participate in brainstorming
about solutions and strategies for dealing with unexpected scenarios involving devices
National Practitioner Data Bank
Medical malpractice actions are one way to flag potential medical errors
Medical Malpractice Payment Reports are submitted to the National Practitioner Data Bank
by medical malpractice payers
Report of a monetary exchange made for the benefit of a physician dentist or other
health care provider
Result of a settlement or judgment of a written complaint or claim based on that
providerrsquos delivery of or failure to deliver health care services
Number of Medical Malpractice Payment Reports by Setting
Number of Medical Malpractice Payment Reports by health care setting 2004-2014
Source National Practitioner Data Bank (NPDB) Public Use Data File Health Resources and Services Administration Bureau of Health
Professions Division of Practitioner Data Banks 2004-2014
Note Health care setting was not collected by the NPDB for 2104 reports in 2004 ldquoOtherrdquo includes Medical Malpractice Payment Reports
related to unknown settings as well as those for a combination of inpatient and outpatient settings Reports pertain to patients of any age
0
2000
4000
6000
8000
10000
12000
14000
16000
18000
20000
2004 2005 2006 2007 2008 2009 2010 2011 2012 2013 2014
Nu
mb
er o
f R
epo
rts
Total Inpatient Outpatient Other
Number of Medical Malpractice Payment Reports by health care setting 2004-2014
Source National Practitioner Data Bank (NPDB) Public Use Data File Health Resources and Services Administration Bureau of Health
Professions Division of Practitioner Data Banks 2004-2014
Note Health care setting was not collected by the NPDB for 2104 reports in 2004 ldquoOtherrdquo includes Medical Malpractice Payment Reports
related to unknown settings as well as those for a combination of inpatient and outpatient settings Reports pertain to patients of any age
0
2000
4000
6000
8000
10000
12000
14000
16000
18000
20000
2004 2005 2006 2007 2008 2009 2010 2011 2012 2013 2014
Nu
mb
er o
f R
epo
rts
Total Inpatient Outpatient Other
42 | National Healthcare Quality and Disparities Report
Patient Safety
Trends The total number of medical malpractice payment reports (MMPRs) per year
decreased from 17641 in 2004 to 12699 in 2014
Variation Across Reports
Of 157022 MMPRs from 2004 through 2014 more reports related to care in the
outpatient setting (71937) than in the inpatient setting (60391)
Diagnosis-related and treatment-related payments were the most frequent types of
reports each accounting for about 27 of cases Reports of payments for medication-
related cases accounted for only 5 of MMPRs (data not shown)
Number of Medical Malpractice Payment Reports by Allegation and Harm
Number of Medical Malpractice Payment Reports by type of allegation and harm severity 2004-2014
Key Temporary injury = Minor temporary injury and Major temporary injury Permanent significant injury = Significant Permanent Injury
Major Permanent Injury Quadriplegia Brain Damage Lifelong care
Source National Practitioner Data Bank Public Use Data File Health Resources and Services Administration Bureau of Health Professions
Division of Practitioner Data Banks 2004-2014
Note Reports pertain to patients of any age
0
20
40
60
80
100
Treatment(n=42913)
Diagnosis(n=42507)
Surgery(n=36845)
Obstetrics(n=10555)
Medication(n=8287)
Monitoring(n=5329)
Anesthesia(n=4276)
Equipment(n=1161)
BehavioralHealth
(n=879)
Blood(n=379)
EmotionalInjury Only
InsignificantInjury
TemporaryInjury
PermanentMinor Injury
PermanentSignificant Injury
Death Unknown
Number of Medical Malpractice Payment Reports by type of allegation and harm severity 2004-2014
Key Temporary injury = Minor temporary injury and Major temporary injury Permanent significant injury = Significant Permanent Injury
Major Permanent Injury Quadriplegia Brain Damage Lifelong care
Source National Practitioner Data Bank Public Use Data File Health Resources and Services Administration Bureau of Health Professions
Division of Practitioner Data Banks 2004-2014
Note Reports pertain to patients of any age
0
20
40
60
80
100
Treatment(n=42913)
Diagnosis(n=42507)
Surgery(n=36845)
Obstetrics(n=10555)
Medication(n=8287)
Monitoring(n=5329)
Anesthesia(n=4276)
Equipment(n=1161)
BehavioralHealth
(n=879)
Blood(n=379)
EmotionalInjury Only
InsignificantInjury
TemporaryInjury
PermanentMinor Injury
PermanentSignificant Injury
Death Unknown
Overall Percentage From 2004 to 2014 medical malpractice payments were made for
allegations related to
Treatment (42913)
Diagnosis (42507)
Surgery (36845)
Obstetrics (10555)
Medication (8287)
Monitoring (5329)
National Healthcare Quality and Disparities Report | 43
Patient Safety
Anesthesia (4276)
Equipment or products (1161)
Behavioral health (879) and
IV and blood products (379)
Variation Across Reports
Death accounted for more than one-third of harm in payments related to monitoring
(499) diagnosis (393) medication (383) and anesthesia (363) allegations
More than half of all obstetric payments were for allegations of permanent severe harm
(570)
Temporary harm accounted for more than one-third of payments related to equipment
(485) and surgery (360)
Most of the behavioral health-related payments were for emotional harm (457) or
death (338)
References
Agency for Healthcare Research and Quality Making Health Care Safer II An Updated Critical Analysis of the
Evidence for Patient Safety Practices Comparative Effectiveness Review No 211 Rockville MD Agency for
Healthcare Research and Quality March 2013 AHRQ Publication No 13-E001-EF
httpwwwahrqgovsitesdefaultfileswysiwygresearchfindingsevidence-basedshy
reportsservicesqualityptsafetyII-fullpdf
Arriaga AF Lancaster RT Berry RW et al The better colectomy project association of evidence-based best-
practice adherence rates to outcomes in colorectal surgery Ann Surg 2009 Oct250(4)507-13
httpwwwncbinlmnihgovpubmed19734778
Centers for Disease Control and Prevention HAI Prevalence Survey
httpwwwcdcgovHAIsurveillanceindexhtml Last updated March 2016 Accessed March 4 2016
Centers for Disease Control and Prevention Nursing Homes and Assisted Living (Long-Term Care Facilities)
httpwwwcdcgovlongtermcare Last updated September 2015 Accessed March 4 2016
Chassin MR Loeb JM High-reliability health care getting there from here Milbank Q 201391(3)459-90
httpwwwncbinlmnihgovpmcarticlesPMC3790522 Accessed September 23 2015
Chiu Y Bero L Hessol NA et al A literature review of clinical outcomes associated with antipsychotic medication
use in North American nursing home residents Health Policy 2015 Jun119(6)802-813 Epub 2015 Feb 28 PMID
25791166 httpwwwsciencedirectcomsciencearticlepiiS0168851015000652 Accessed June 17 2015
Huybrechts KF Gerhard Crystal S et al Differential risk of death in older residents in nursing homes prescribed
specific antipsychotic drugs Population based cohort study BMJ 2012 Feb 23344e977 PMID 22362541
httpwwwncbinlmnihgovpmcarticlesPMC3285717 Accessed June 17 2015
Institute of Medicine Preventing Medication Errors Quality Chasm Series 2007
httpwwwnapeducatalog11623preventing-medication-errors-quality-chasm-series
National Association for Home Care amp Hospice Basic Statistics About Home Care Updated 2010
httpwwwnahcorgassets1710hc_statspdf Accessed August 31 2015
44 | National Healthcare Quality and Disparities Report
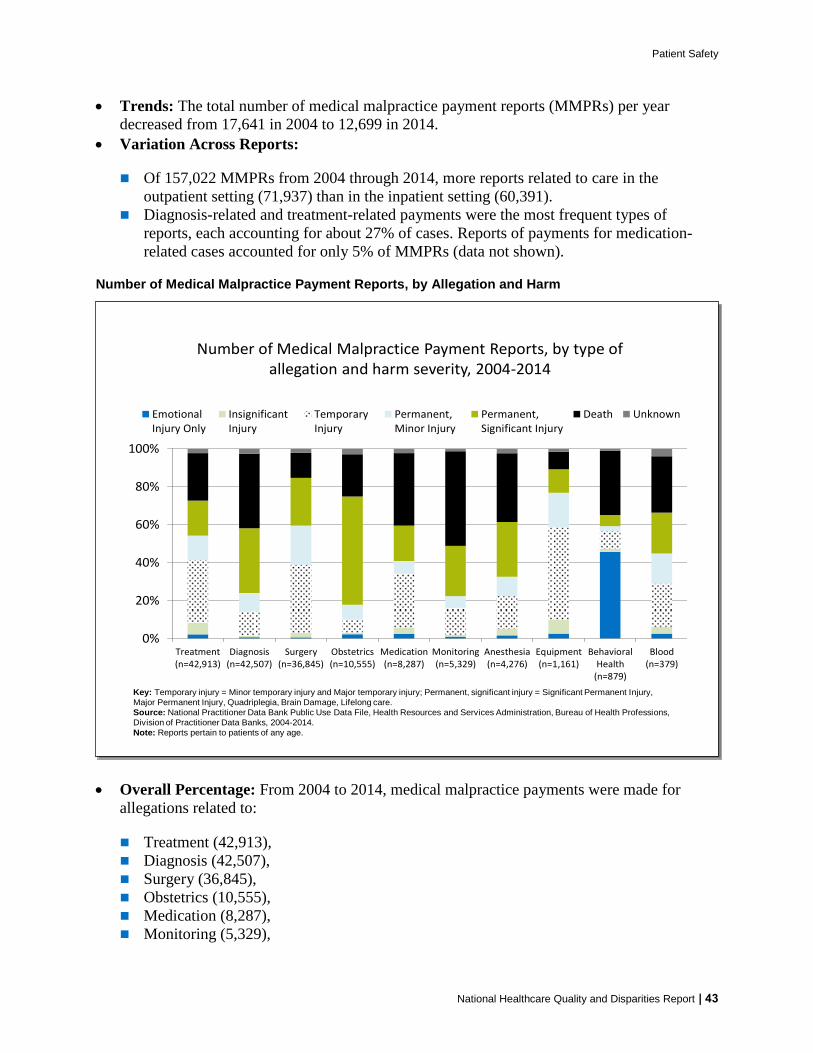
Patient Safety
Anesthesia (4276)
Equipment or products (1161)
Behavioral health (879) and
IV and blood products (379)
Variation Across Reports
Death accounted for more than one-third of harm in payments related to monitoring
(499) diagnosis (393) medication (383) and anesthesia (363) allegations
More than half of all obstetric payments were for allegations of permanent severe harm
(570)
Temporary harm accounted for more than one-third of payments related to equipment
(485) and surgery (360)
Most of the behavioral health-related payments were for emotional harm (457) or
death (338)
References
Agency for Healthcare Research and Quality Making Health Care Safer II An Updated Critical Analysis of the
Evidence for Patient Safety Practices Comparative Effectiveness Review No 211 Rockville MD Agency for
Healthcare Research and Quality March 2013 AHRQ Publication No 13-E001-EF
httpwwwahrqgovsitesdefaultfileswysiwygresearchfindingsevidence-basedshy
reportsservicesqualityptsafetyII-fullpdf
Arriaga AF Lancaster RT Berry RW et al The better colectomy project association of evidence-based best-
practice adherence rates to outcomes in colorectal surgery Ann Surg 2009 Oct250(4)507-13
httpwwwncbinlmnihgovpubmed19734778
Centers for Disease Control and Prevention HAI Prevalence Survey
httpwwwcdcgovHAIsurveillanceindexhtml Last updated March 2016 Accessed March 4 2016
Centers for Disease Control and Prevention Nursing Homes and Assisted Living (Long-Term Care Facilities)
httpwwwcdcgovlongtermcare Last updated September 2015 Accessed March 4 2016
Chassin MR Loeb JM High-reliability health care getting there from here Milbank Q 201391(3)459-90
httpwwwncbinlmnihgovpmcarticlesPMC3790522 Accessed September 23 2015
Chiu Y Bero L Hessol NA et al A literature review of clinical outcomes associated with antipsychotic medication
use in North American nursing home residents Health Policy 2015 Jun119(6)802-813 Epub 2015 Feb 28 PMID
25791166 httpwwwsciencedirectcomsciencearticlepiiS0168851015000652 Accessed June 17 2015
Huybrechts KF Gerhard Crystal S et al Differential risk of death in older residents in nursing homes prescribed
specific antipsychotic drugs Population based cohort study BMJ 2012 Feb 23344e977 PMID 22362541
httpwwwncbinlmnihgovpmcarticlesPMC3285717 Accessed June 17 2015
Institute of Medicine Preventing Medication Errors Quality Chasm Series 2007
httpwwwnapeducatalog11623preventing-medication-errors-quality-chasm-series
National Association for Home Care amp Hospice Basic Statistics About Home Care Updated 2010
httpwwwnahcorgassets1710hc_statspdf Accessed August 31 2015
44 | National Healthcare Quality and Disparities Report