Embed Size (px)
Citation preview
Charlie Thame andKraiyos PatrawartFebruary 2017
1
ACKNOWLEDGEMENTS
This report was written by Charlie Thame and Kraiyos Patrawart. Both would like to thank all those who contributed to the project, which would not have been possible without the kind support of several individuals and organisations. Special thanks are extended to the Primary Education Service Area Office Tak 2 (PESAO Tak 2), Tak Province. Khun Pongsakorn, Khun Aof, and Khun Ninarall graciously gave their time and support to the team, without which the study would not have been possible. Aarju Hamal and Sia Kukuawkasem provided invaluable research assistance with documentary review, management and coordination, and translation. Siraporn Kaewsombat’s assistance was also crucial for the success of the project. The team would like to express further thanks to all at Save the Children Thailand for their support during the study, particularly Tim Murray and Kate McDermott.
Strengthening Out of School Children (OOSC) Mechanisms in Tak Province (February 2017)Charlie Thame and Kraiyos Patrawart
Cover photo by Kantamat Palawat
Published bySave the Children Thailand14th Fl., Maneeya Center Building (South), 518/5 Ploenchit Road, Lumpini, Pathumwan, Bangkok 10330, Thailand+66(0) 2684 [email protected]://thailand.savethechildren.net
REACT The Reaching Education for All Children in Thailand (REACT) project is supported by Save the Children Hong Kong and implemented by Save the Children International in Thailand. REACT aims to ensure migrant children in Thailand have access to quality basic education and communities support children’s learning. The main target groups are the migrant children in Tak and Ranong provinces.
2 3
TABLE OF CONTENTSEXECUTIVE SUMMARY 4
BACKGROUND 7
OOSC AT THE NATIONAL LEVEL 8 Estimating OOSC 8 OOSC Definition 8 The 5DE Framework 9 OOSC Visibility Model 10 Challenges in Estimating OOSC in Thailand 11 “Best Guesses”: Estimating OOSC in Thailand 13 National Estimates of OOSC 13
OOSC AT THE PROVINCIAL LEVEL 19 Tak Province 19 Data Points for Administrative Data 20 Other Data Sources 21 OOSC in Mae Sot District 21 Existing Mechanisms for Estimating OOSC in Tak Province 22 Mechanism 1: Secondary Data Analysis 22 Mechanism 2: Primary Data Collection 22 An Assessment of Existing Mechanisms 23 Established Barriers to Access in Tak Province 24
PILOT STUDY RESULTS 26 Strengthening Existing Mechanisms 26 Mechanism One: Identifying OOSC “Hotspots” through Administrative Data 26 Mechanism Two: Strengthening Existing OOSC Data Collection Mechanisms 29
DISCUSSION 39 OOSC Definition and Age Range 39 OOSC Estimates in Tak Province 40 Mechanism One 40 Mechanism Two 41
CONCLUSIONS AND RECOMMENDATIONS 42 Research Questions 43 Recommendations 46
FIGURES AND TABLESLIST OF FIGURESFigure 1: School Age Ranges in Thailand 9 Figure 2: 5DE Framework 9 Figure 3: UNICEF OOSC Estimates for Thailand 11Figure 4: Student Registration Data Flow 10th June Every Year 14Figure 5: Number of Students in EMIS 15Figure 6: Systems that Share Only Statistics and not Individual Data 15Figure 7: Estimating OOSC at the National Level (EMIS: AY2015) 16Figure 8: Estimating OOSC in Thailand and Tak Province (EMIS: AY2015) 17Figure 9: Dropouts in Thailand and Tak Province 18Figure 10: Estimate of Migrant Children in Thailand 18Figure 11: Community Interviews 32
LIST OF TABLES Table 1: OOSC Visibility Model 10Table 2: Summary of Available Population Data for ESAO 2, Tak Province 28Table 3: Existing OOSC Primary Data Collection Tools 29Table 4: Summary of Pilot Survey Results 34Table 5: Nationwide OOSC Estimates 39Table 6: Out-of-School Children in Thailand in Academic Year 2015 (QLF) 39Table 7: Summary of Out-of-school in Tak Province 42
Annex 1: Original Por Tor 04 Form (English Translation) 50Annex 2: Original Por Tor 04 Form 54 Annex 3: Revised Por Tor 04 Form (English) 59Annex 4: Revised Por Tor 04 Form (Thai) 65Annex 5: MOI and MOE Data for 2015 71
BIBLIOGRAPHY 72
ANNEXES
4 5
EXECUTIVE SUMMARY
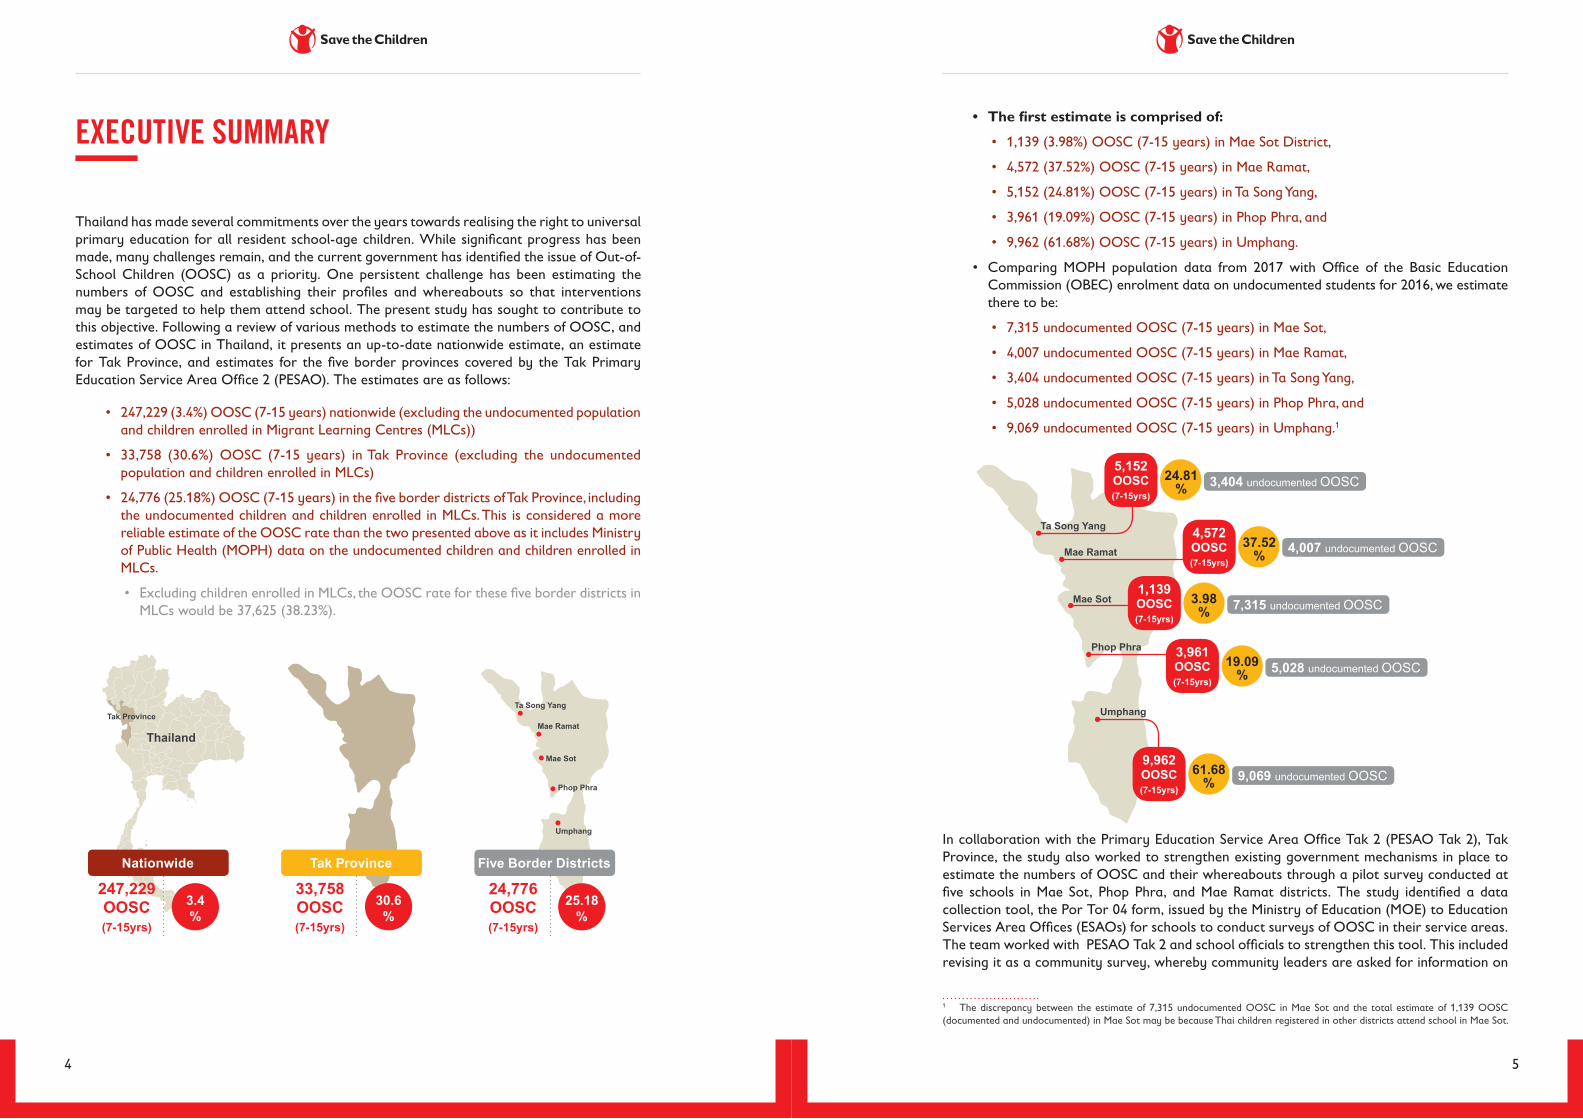
Thailand has made several commitments over the years towards realising the right to universal primary education for all resident school-age children. While significant progress has been made, many challenges remain, and the current government has identified the issue of Out-of-School Children (OOSC) as a priority. One persistent challenge has been estimating the numbers of OOSC and establishing their profiles and whereabouts so that interventions may be targeted to help them attend school. The present study has sought to contribute to this objective. Following a review of various methods to estimate the numbers of OOSC, and estimates of OOSC in Thailand, it presents an up-to-date nationwide estimate, an estimate for Tak Province, and estimates for the five border provinces covered by the Tak Primary Education Service Area Office 2 (PESAO). The estimates are as follows:
• 247,229 (3.4%) OOSC (7-15 years) nationwide (excluding the undocumented population and children enrolled in Migrant Learning Centres (MLCs))
• 33,758 (30.6%) OOSC (7-15 years) in Tak Province (excluding the undocumented population and children enrolled in MLCs)
• 24,776 (25.18%) OOSC (7-15 years) in the five border districts of Tak Province, including the undocumented children and children enrolled in MLCs. This is considered a more reliable estimate of the OOSC rate than the two presented above as it includes Ministry of Public Health (MOPH) data on the undocumented children and children enrolled in MLCs.
• Excluding children enrolled in MLCs, the OOSC rate for these five border districts in MLCs would be 37,625 (38.23%).
• The first estimate is comprised of:
• 1,139 (3.98%) OOSC (7-15 years) in Mae Sot District,
• 4,572 (37.52%) OOSC (7-15 years) in Mae Ramat,
• 5,152 (24.81%) OOSC (7-15 years) in Ta Song Yang,
• 3,961 (19.09%) OOSC (7-15 years) in Phop Phra, and
• 9,962 (61.68%) OOSC (7-15 years) in Umphang.
• Comparing MOPH population data from 2017 with Office of the Basic Education Commission (OBEC) enrolment data on undocumented students for 2016, we estimate there to be:
• 7,315 undocumented OOSC (7-15 years) in Mae Sot,
• 4,007 undocumented OOSC (7-15 years) in Mae Ramat,
• 3,404 undocumented OOSC (7-15 years) in Ta Song Yang,
• 5,028 undocumented OOSC (7-15 years) in Phop Phra, and
• 9,069 undocumented OOSC (7-15 years) in Umphang.1
In collaboration with the Primary Education Service Area Office Tak 2 (PESAO Tak 2), Tak Province, the study also worked to strengthen existing government mechanisms in place to estimate the numbers of OOSC and their whereabouts through a pilot survey conducted at five schools in Mae Sot, Phop Phra, and Mae Ramat districts. The study identified a data collection tool, the Por Tor 04 form, issued by the Ministry of Education (MOE) to Education Services Area Offices (ESAOs) for schools to conduct surveys of OOSC in their service areas. The team worked with PESAO Tak 2 and school officials to strengthen this tool. This included revising it as a community survey, whereby community leaders are asked for information on
1 The discrepancy between the estimate of 7,315 undocumented OOSC in Mae Sot and the total estimate of 1,139 OOSC (documented and undocumented) in Mae Sot may be because Thai children registered in other districts attend school in Mae Sot.
Mae Sot
Mae Ramat
Ta Song Yang
Phop Phra
Umphang
Five Border Districts
24,776OOSC(7-15yrs)
25.18%
Tak Province
33,758OOSC(7-15yrs)
30.6%
Nationwide
247,229OOSC(7-15yrs)
3.4%
Tak Province
Mae Sot
Mae Ramat
Ta Song Yang
Phop Phra
Umphang
1,139OOSC(7-15yrs)
3,961OOSC(7-15yrs)
9,962OOSC(7-15yrs)
4,572OOSC(7-15yrs)
5,152OOSC(7-15yrs)
3.98%
19.09%
61.68%
37.52%
24.81%
7,315 undocumented OOSC
5,028 undocumented OOSC
9,069 undocumented OOSC
4,007 undocumented OOSC
3,404 undocumented OOSC
Thailand
6 7
Since 1990, Thailand has committed to the World Declaration on Education for All (EFA) and the Dakar Framework for Action in line with the Millennium Development Goal 2 on universal primary education. The Royal Thai Government (RTG) enacted laws and regulations to implement these commitments including the National Education Act 1990 and the 5 July 2005 cabinet resolutions guaranteeing equal access for unregistered or non-Thai persons to schooling regardless of nationality, legal status, or identity documentation. While much progress has been made in terms of Out-of-School Children (OOSC) since 2005, significant challenges remain, and addressing OOSC is a high priority for the current government. One persistent challenge has been in estimating the numbers of OOSC and establishing their whereabouts so that barriers to access to education services may be addressed and overcome through targeted interventions. The present study aims to contribute to this objective by piloting an effective model of data collection for OOSC in two pilot districts in Tak Province. The specific aims of the research were as follows:
• Goal 1. Collect and analyse data on OOSC in two target districts.
• Goal 2. Assess methodologies for OOSC data collection and conduct pilot data collection
• Goal 3. Assess barriers to access
A series of consultations were held in Bangkok and Tak Province between September and December 2016 to identify and assess established data collection and analysis mechanisms and to conduct a feasibility study for the development of survey methods and tools to pilot in two districts of Tak Province. The consultant team spoke with senior and operational level representatives of the Ministry of Interior, the Ministry of Education, the Ministry of Public Health, including the Chief Medical Officer of Tak Province (MOPH), the Chief District Officer for Mae Sot District (MOI), the Chief of Tak Primary Education Service Area Office (ESAO) 2, and the Director of the Migrant Education Coordination Centre Tak Province. Visits were made to three schools, two in Phop Phra and one in Mae Sot, and consultations were held with school Principals and/or Directors. NGOs including World Education, Help Without Frontiers, the Burmese Migrant Teachers’ Association, and Mae Tao Clinic also provided input to the study. Following the submission of a feasibility study on potential OOSC data collection methods in December 2016 by the consultant team of Save the Children, a pilot study was then conducted in Tak Province in coordination with PESAO Tak 2. This included revising the household survey currently issued by the MOE to schools to survey OOSC in their service areas in February 2017, with the assistance of directors and teachers from six schools across four border districts, followed, in March 2017, by data collection using these revised tools.
BACKGROUND
OOSC within a service area. Although the estimates thereby derived cannot be considered reliable, they can help corroborate estimates based on administrative data and help to locate OOSC at the local level, as well as to mitigate some challenges related to fear and distrust among shadow populations. The tool also helps to identify the main barriers to access for OOSC in a school’s service area, and what help local children need to attend school.
The pilot found that community leaders estimated there to be up to 145 OOSC in the 10 villages served by the five schools. For these OOSC, child labour, family mobility, disabilities, caring for family members, and lack of documentation, were reported as the most important barriers to access by community leaders. Financial support, transportation to school, documentation, and accommodation for mobile children were suggested as possible ways of encouraging OOSC to return to school. School- or policy-related barriers were not reported as significant in the pilot. However, this may be attributable to the selective sampling of schools to participate in the study; many were welcoming to migrants, and so these findings may not be generalizable to all schools in PESAO Tak 2.
Recommendations based on the study include the following: • Thailand could officially define the term “Out-of-School Children”
• The Royal Thai Government could consider committing to the improvement of the OOSC data system, by:
• continuing efforts to ensure all residents of Thailand are included in the civil registration database
• strengthening the Education Management Information System (EMIS) database, which maintains school enrolment data
• reviewing the tools and resources currently allocated to schools and ESAO offices to identify OOSC
• Formalise and enhance intra-governmental data sharing between Ministry of Interior (MOI), Ministry of Public Health (MOPH), and MOE to more effectively and efficiently identify numbers of OOSC and their whereabouts.
Kan
tam
at P
alaw
at |
Sav
e th
e C
hild
ren
8 9
Special vocational educationVocational education for specific groupsShort-course training
Vocational educationSpecial vocational educationVocational education forspecific groups
Short-course training
Bachelor’s degreeand below
Graduate degreelevel
Year of Schooling 1
3 4 5 6 7 8 9 10 11 12 13 14 15 16 17 18 19 20 21 22 23 24
2 3 4 5 6 7 8 9 10 11 12
Approximate Age
Special education
Uppersecondaryeducation
Higher educationElementary educationLower
secondaryeducation
Pre-schooleducation
Level of education
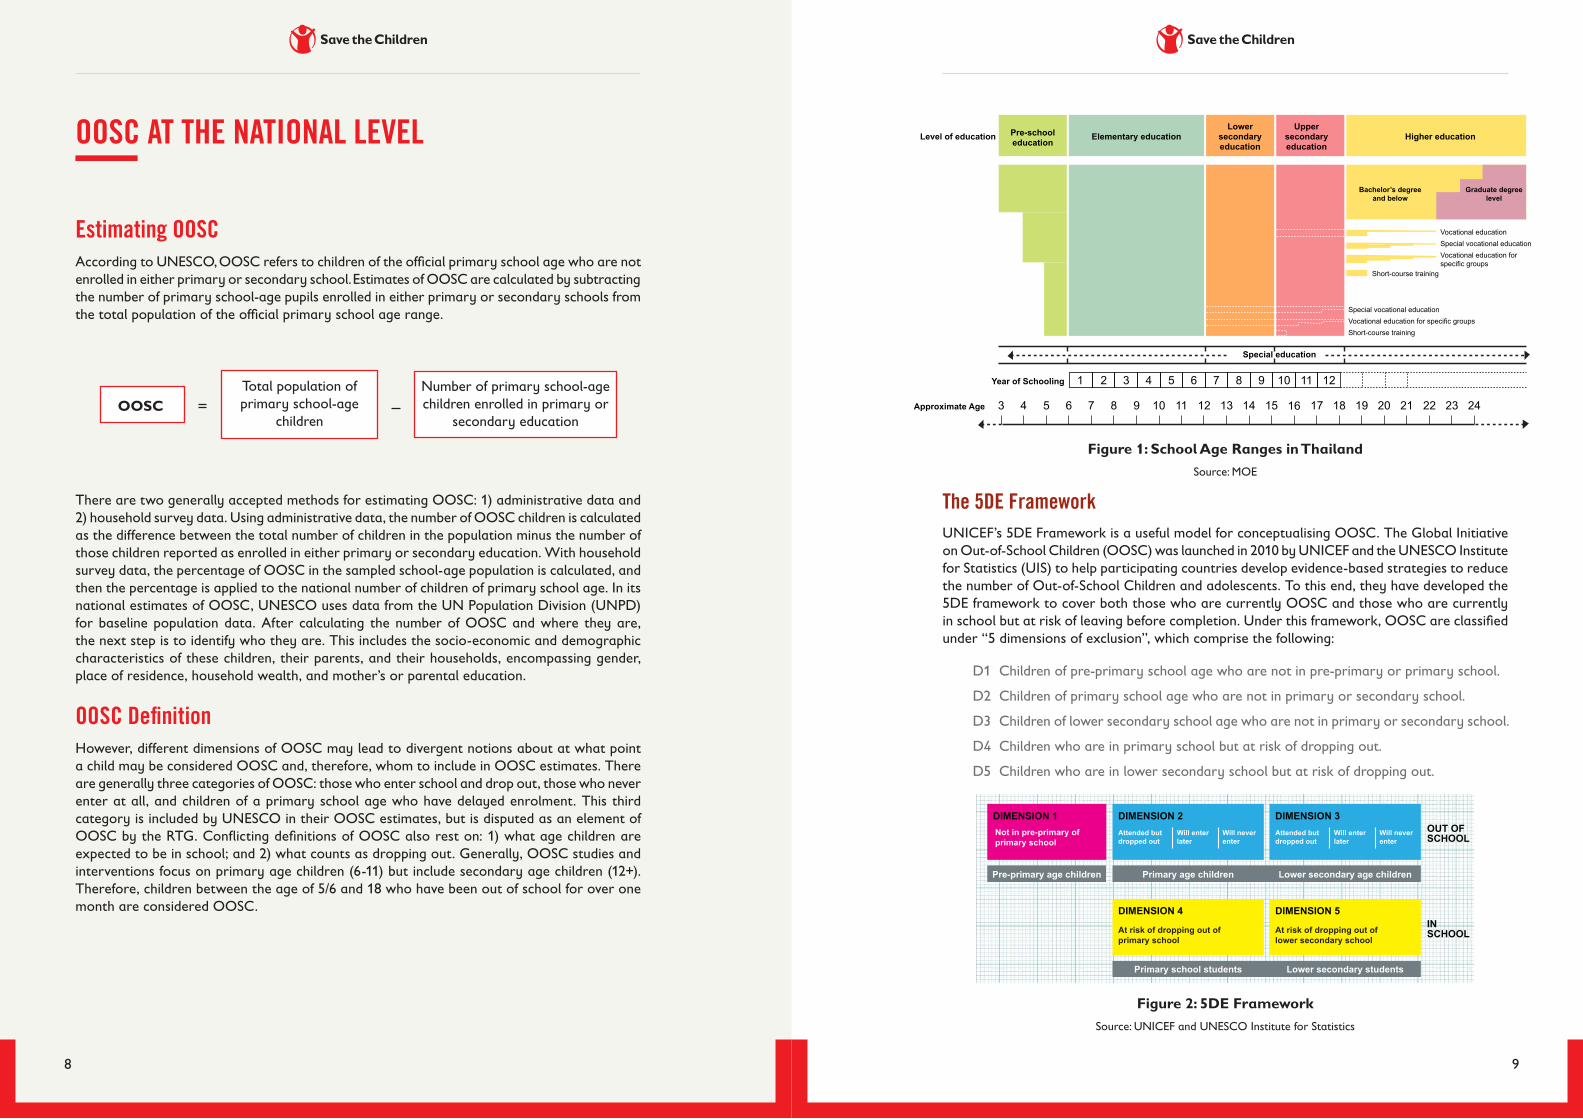
Figure 1: School Age Ranges in ThailandSource: MOE
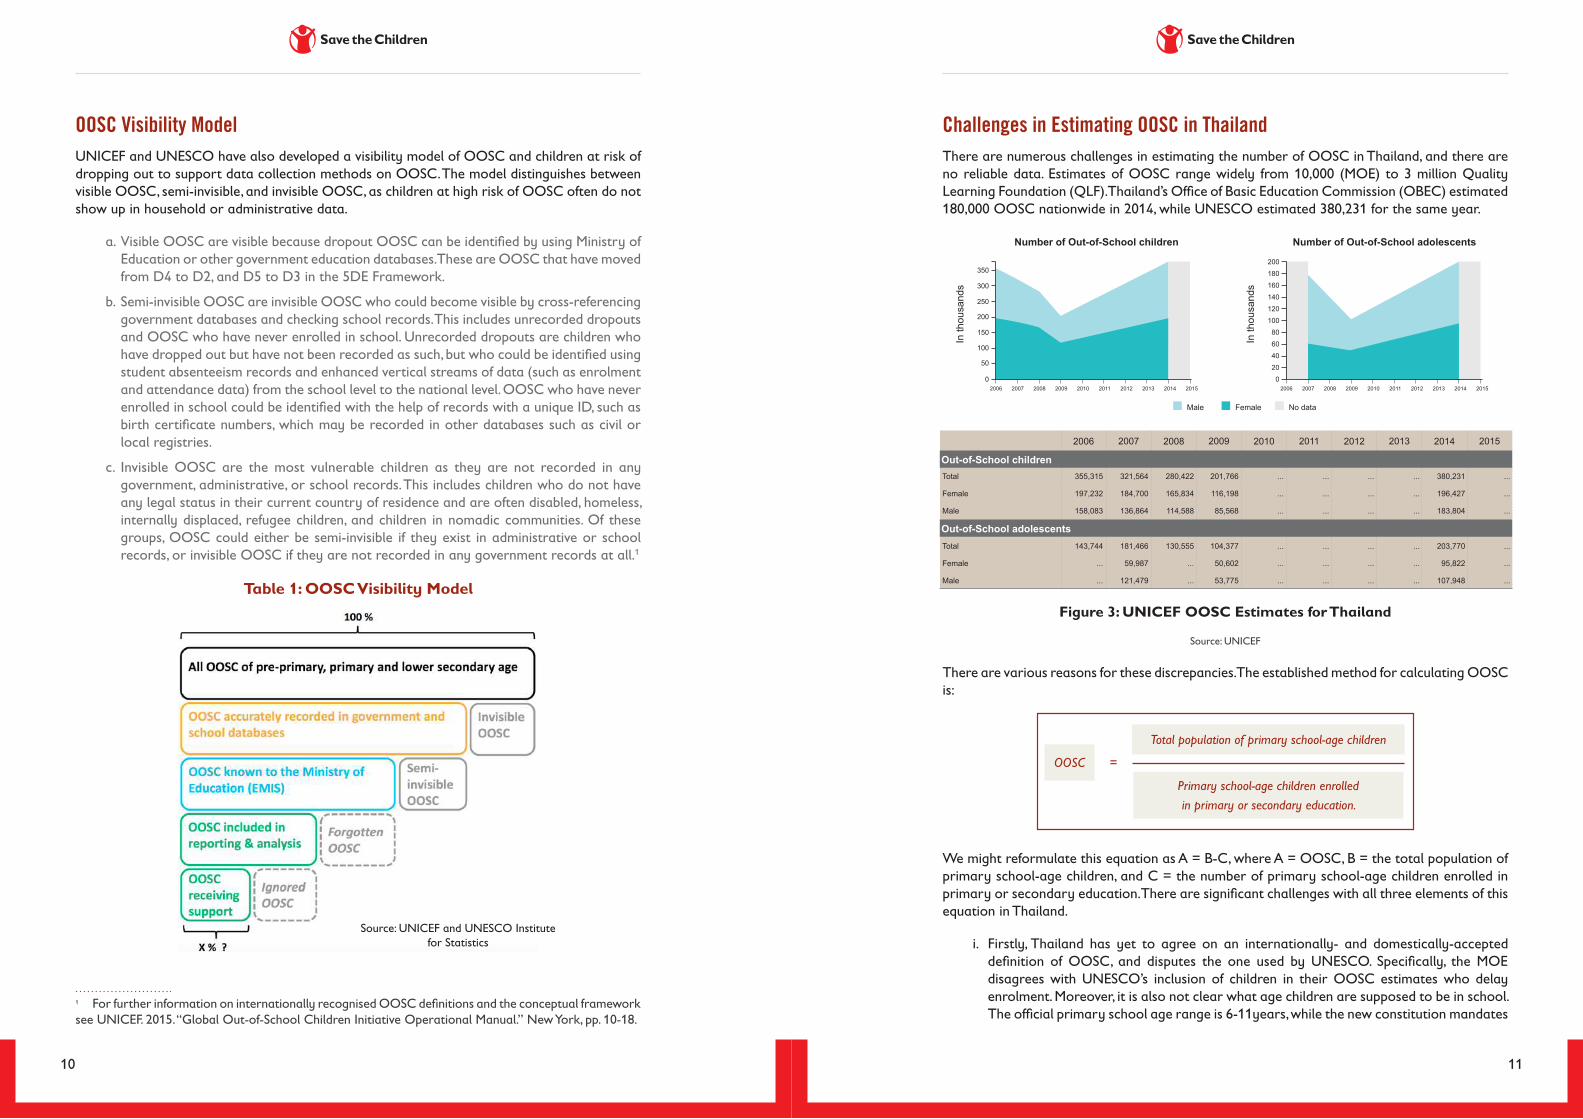
The 5DE FrameworkUNICEF’s 5DE Framework is a useful model for conceptualising OOSC. The Global Initiative on Out-of-School Children (OOSC) was launched in 2010 by UNICEF and the UNESCO Institute for Statistics (UIS) to help participating countries develop evidence-based strategies to reduce the number of Out-of-School Children and adolescents. To this end, they have developed the 5DE framework to cover both those who are currently OOSC and those who are currently in school but at risk of leaving before completion. Under this framework, OOSC are classified under “5 dimensions of exclusion”, which comprise the following:
D1 Children of pre-primary school age who are not in pre-primary or primary school.
D2 Children of primary school age who are not in primary or secondary school.
D3 Children of lower secondary school age who are not in primary or secondary school.
D4 Children who are in primary school but at risk of dropping out.
D5 Children who are in lower secondary school but at risk of dropping out.
Not in pre-primary ofprimary school
At risk of dropping out ofprimary school
At risk of dropping out oflower secondary school
Attended butdropped out
Will enterlater
Will neverenter
DIMENSION 1 DIMENSION 2 DIMENSION 3
DIMENSION 4
Pre-primary age children Primary age children Lower secondary age children
Primary school students Lower secondary students
DIMENSION 5
OUT OFSCHOOL
INSCHOOL
Attended butdropped out
Will enterlater
Will neverenter
Figure 2: 5DE FrameworkSource: UNICEF and UNESCO Institute for Statistics
OOSC AT THE NATIONAL LEVEL
Estimating OOSCAccording to UNESCO, OOSC refers to children of the official primary school age who are not enrolled in either primary or secondary school. Estimates of OOSC are calculated by subtracting the number of primary school-age pupils enrolled in either primary or secondary schools from the total population of the official primary school age range.
OOSCTotal population of primary school-age
children
Number of primary school-age children enrolled in primary or
secondary education
There are two generally accepted methods for estimating OOSC: 1) administrative data and 2) household survey data. Using administrative data, the number of OOSC children is calculated as the difference between the total number of children in the population minus the number of those children reported as enrolled in either primary or secondary education. With household survey data, the percentage of OOSC in the sampled school-age population is calculated, and then the percentage is applied to the national number of children of primary school age. In its national estimates of OOSC, UNESCO uses data from the UN Population Division (UNPD) for baseline population data. After calculating the number of OOSC and where they are, the next step is to identify who they are. This includes the socio-economic and demographic characteristics of these children, their parents, and their households, encompassing gender, place of residence, household wealth, and mother’s or parental education.
OOSC DefinitionHowever, different dimensions of OOSC may lead to divergent notions about at what point a child may be considered OOSC and, therefore, whom to include in OOSC estimates. There are generally three categories of OOSC: those who enter school and drop out, those who never enter at all, and children of a primary school age who have delayed enrolment. This third category is included by UNESCO in their OOSC estimates, but is disputed as an element of OOSC by the RTG. Conflicting definitions of OOSC also rest on: 1) what age children are expected to be in school; and 2) what counts as dropping out. Generally, OOSC studies and interventions focus on primary age children (6-11) but include secondary age children (12+). Therefore, children between the age of 5/6 and 18 who have been out of school for over one month are considered OOSC.
10 11
Challenges in Estimating OOSC in ThailandThere are numerous challenges in estimating the number of OOSC in Thailand, and there are no reliable data. Estimates of OOSC range widely from 10,000 (MOE) to 3 million Quality Learning Foundation (QLF). Thailand’s Office of Basic Education Commission (OBEC) estimated 180,000 OOSC nationwide in 2014, while UNESCO estimated 380,231 for the same year.
Number of Out-of-School children
In th
ousa
nds
Number of Out-of-School adolescents
350
300
250
200
2006 2009 2010 2011 2012 2013 2014 20152007 2008
150
100
50
0
In th
ousa
nds
Male
200
180
160
140
120
100
80
60
40
20
2006 2009 2010 2011 2012 2013 2014 20152007 20080
Female No data
2006 2007
Total 355,315 321,564 280,422 201,766 ... ... ... ... 380,231 ...
Female 197,232 184,700 165,834 116,198 ... ... ... ... 196,427 ...
Male 158,083 136,864 114,588 85,568 ... ... ... ... 183,804 ...
2008 2009 2010 2011 2012 2013 2014 2015
Out-of-School children
Out-of-School adolescentsTotal 143,744 181,466 130,555 104,377 ... ... ... ... 203,770 ...
Female ... 59,987 ... 50,602 ... ... ... ... 95,822 ...
Male ... 121,479 ... 53,775 ... ... ... ... 107,948 ...
Figure 3: UNICEF OOSC Estimates for Thailand
Source: UNICEF
There are various reasons for these discrepancies. The established method for calculating OOSC is:
OOSC
Total population of primary school-age children
Primary school-age children enrolledin primary or secondary education.
=
We might reformulate this equation as A = B-C, where A = OOSC, B = the total population of primary school-age children, and C = the number of primary school-age children enrolled in primary or secondary education. There are significant challenges with all three elements of this equation in Thailand.
i. Firstly, Thailand has yet to agree on an internationally- and domestically-accepted definition of OOSC, and disputes the one used by UNESCO. Specifically, the MOE disagrees with UNESCO’s inclusion of children in their OOSC estimates who delay enrolment. Moreover, it is also not clear what age children are supposed to be in school. The official primary school age range is 6-11years, while the new constitution mandates
OOSC Visibility ModelUNICEF and UNESCO have also developed a visibility model of OOSC and children at risk of dropping out to support data collection methods on OOSC. The model distinguishes between visible OOSC, semi-invisible, and invisible OOSC, as children at high risk of OOSC often do not show up in household or administrative data.
a. Visible OOSC are visible because dropout OOSC can be identified by using Ministry of Education or other government education databases. These are OOSC that have moved from D4 to D2, and D5 to D3 in the 5DE Framework.
b. Semi-invisible OOSC are invisible OOSC who could become visible by cross-referencing government databases and checking school records. This includes unrecorded dropouts and OOSC who have never enrolled in school. Unrecorded dropouts are children who have dropped out but have not been recorded as such, but who could be identified using student absenteeism records and enhanced vertical streams of data (such as enrolment and attendance data) from the school level to the national level. OOSC who have never enrolled in school could be identified with the help of records with a unique ID, such as birth certificate numbers, which may be recorded in other databases such as civil or local registries.
c. Invisible OOSC are the most vulnerable children as they are not recorded in any government, administrative, or school records. This includes children who do not have any legal status in their current country of residence and are often disabled, homeless, internally displaced, refugee children, and children in nomadic communities. Of these groups, OOSC could either be semi-invisible if they exist in administrative or school records, or invisible OOSC if they are not recorded in any government records at all.1
Table 1: OOSC Visibility Model
1 For further information on internationally recognised OOSC definitions and the conceptual framework see UNICEF. 2015. “Global Out-of-School Children Initiative Operational Manual.” New York, pp. 10-18.
Source: UNICEF and UNESCO Institute for Statistics
12 13
“in school” if they are regularly attending any form of formal or non-formal education, if these pathways do not meet quality standards, children attending regularly may nonetheless be officially considered “out of school.” This may also apply to some schools under the Office of Non-Formal and Informal Education (ONIE) and Border Patrol Schools, since students enrolled in these systems have been treated as OOSC in some estimates.
“Best Guesses”: Estimating OOSC in ThailandUntil all seven obstacles listed above are addressed by the RTG, significant variance will remain between the OOSC estimations by key stakeholders such as the MOE, UNESCO, and Save the Children. For the purposes of this study, the consultant team initially decided to adopt the definition of OOSC as primary school age children (6-11) not enrolled in primary or secondary school. Using the 5DE framework, this encompasses D2-D5, including those with delayed enrolment. However, this age range was changed to 7-15 years old as a result of consultations with ESAO and school officials, since this is the age range currently used by the MOE. Regarding B, ethnic minorities without Thai citizenship and undocumented migrant workers will be treated as invisible or semi-invisible OOSC as they are not captured in estimates based on administrative data. Lastly, children regularly attending MLCs or Border Patrol Schools will be considered as “in school.” Without questioning the validity of UNESCO’s estimates, the present study has used Thai government data.
A reasonable estimate of the number of OOSC in a given area may be made by employing the following formula:
OOSC
X= Consolidation of OBEC, MLC, private school, and other government data
Y = Y1 + Y2Y1 = Thai childrenY2 = Migrant childrenY1 source = Census data Y2 source = Consolidation of data from MOPH, MOI, MOE.
=
(Y = Children of a school age in the area)
(X = Number of children in school (OBEC, Private, Vocational, MLCs))
-
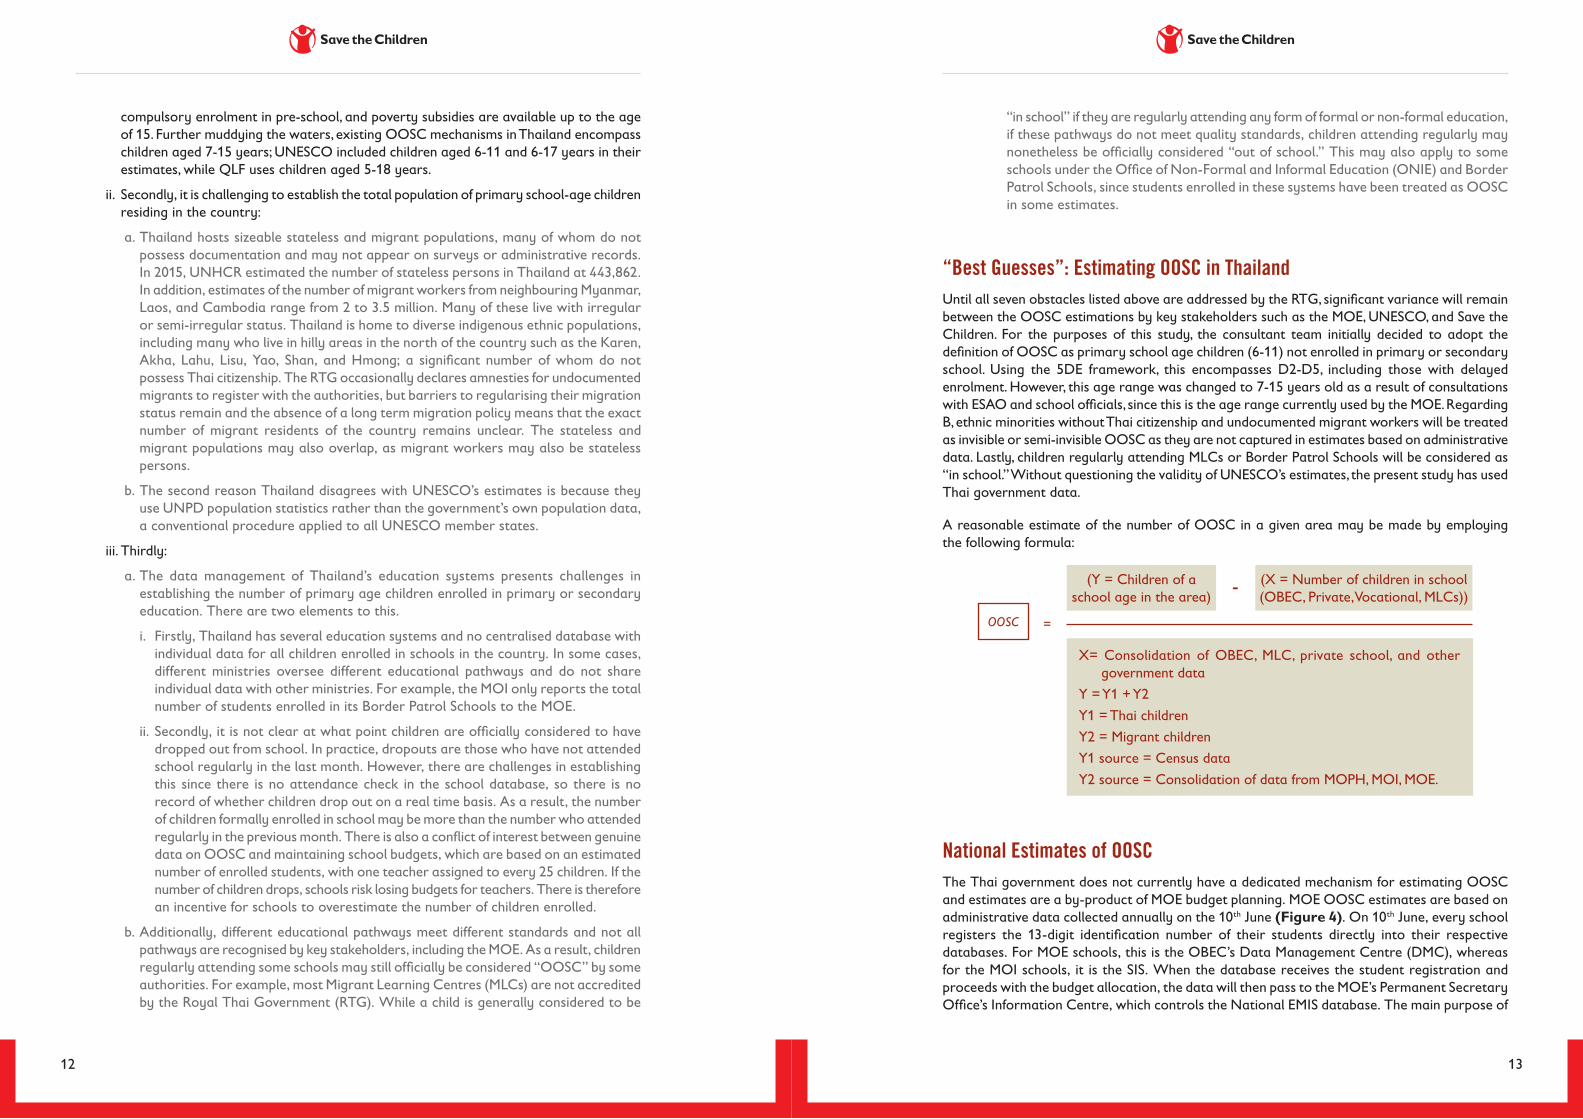
National Estimates of OOSCThe Thai government does not currently have a dedicated mechanism for estimating OOSC and estimates are a by-product of MOE budget planning. MOE OOSC estimates are based on administrative data collected annually on the 10th June (Figure 4). On 10th June, every school registers the 13-digit identification number of their students directly into their respective databases. For MOE schools, this is the OBEC’s Data Management Centre (DMC), whereas for the MOI schools, it is the SIS. When the database receives the student registration and proceeds with the budget allocation, the data will then pass to the MOE’s Permanent Secretary Office’s Information Centre, which controls the National EMIS database. The main purpose of
compulsory enrolment in pre-school, and poverty subsidies are available up to the age of 15. Further muddying the waters, existing OOSC mechanisms in Thailand encompass children aged 7-15 years; UNESCO included children aged 6-11 and 6-17 years in their estimates, while QLF uses children aged 5-18 years.
ii. Secondly, it is challenging to establish the total population of primary school-age children residing in the country:
a. Thailand hosts sizeable stateless and migrant populations, many of whom do not possess documentation and may not appear on surveys or administrative records. In 2015, UNHCR estimated the number of stateless persons in Thailand at 443,862. In addition, estimates of the number of migrant workers from neighbouring Myanmar, Laos, and Cambodia range from 2 to 3.5 million. Many of these live with irregular or semi-irregular status. Thailand is home to diverse indigenous ethnic populations, including many who live in hilly areas in the north of the country such as the Karen, Akha, Lahu, Lisu, Yao, Shan, and Hmong; a significant number of whom do not possess Thai citizenship. The RTG occasionally declares amnesties for undocumented migrants to register with the authorities, but barriers to regularising their migration status remain and the absence of a long term migration policy means that the exact number of migrant residents of the country remains unclear. The stateless and migrant populations may also overlap, as migrant workers may also be stateless persons.
b. The second reason Thailand disagrees with UNESCO’s estimates is because they use UNPD population statistics rather than the government’s own population data, a conventional procedure applied to all UNESCO member states.
iii. Thirdly:
a. The data management of Thailand’s education systems presents challenges in establishing the number of primary age children enrolled in primary or secondary education. There are two elements to this.
i. Firstly, Thailand has several education systems and no centralised database with individual data for all children enrolled in schools in the country. In some cases, different ministries oversee different educational pathways and do not share individual data with other ministries. For example, the MOI only reports the total number of students enrolled in its Border Patrol Schools to the MOE.
ii. Secondly, it is not clear at what point children are officially considered to have dropped out from school. In practice, dropouts are those who have not attended school regularly in the last month. However, there are challenges in establishing this since there is no attendance check in the school database, so there is no record of whether children drop out on a real time basis. As a result, the number of children formally enrolled in school may be more than the number who attended regularly in the previous month. There is also a conflict of interest between genuine data on OOSC and maintaining school budgets, which are based on an estimated number of enrolled students, with one teacher assigned to every 25 children. If the number of children drops, schools risk losing budgets for teachers. There is therefore an incentive for schools to overestimate the number of children enrolled.
b. Additionally, different educational pathways meet different standards and not all pathways are recognised by key stakeholders, including the MOE. As a result, children regularly attending some schools may still officially be considered “OOSC” by some authorities. For example, most Migrant Learning Centres (MLCs) are not accredited by the Royal Thai Government (RTG). While a child is generally considered to be
14 15
(ESAOs) across Thailand, while the MOI helps to keep track of the number of school-age children, old and new students, and the number of OOSC in each district. Each year after the national enrolment day on 10th June, OBEC will submit the DMC database to the MOE’s National Education Information System (NEIS) which is responsible for gathering all enrolment databases from education administrative agencies, including OBEC. The only agency that does not share data with NEIS, due to its security policy, is the MOI, which accepts the database from NEIS after all of the other agencies have submitted their databases to cross-check the 13-digit IDs for any possible double counting. The MOI then reports back to the NEIS any 13-digit IDs that are double counted for students who are enrolling with the MOI. The NEIS then reports back to the education agencies that have reported the same 13 digit IDs with the MOI to resolve the double counting conflict. The NEIS has been negotiating with the MOI to share the database and individual data like all other educational agencies to simplify the process and to develop a more efficient system, and more importantly, to help identify the double counted students and OOSC in the Thai education system.
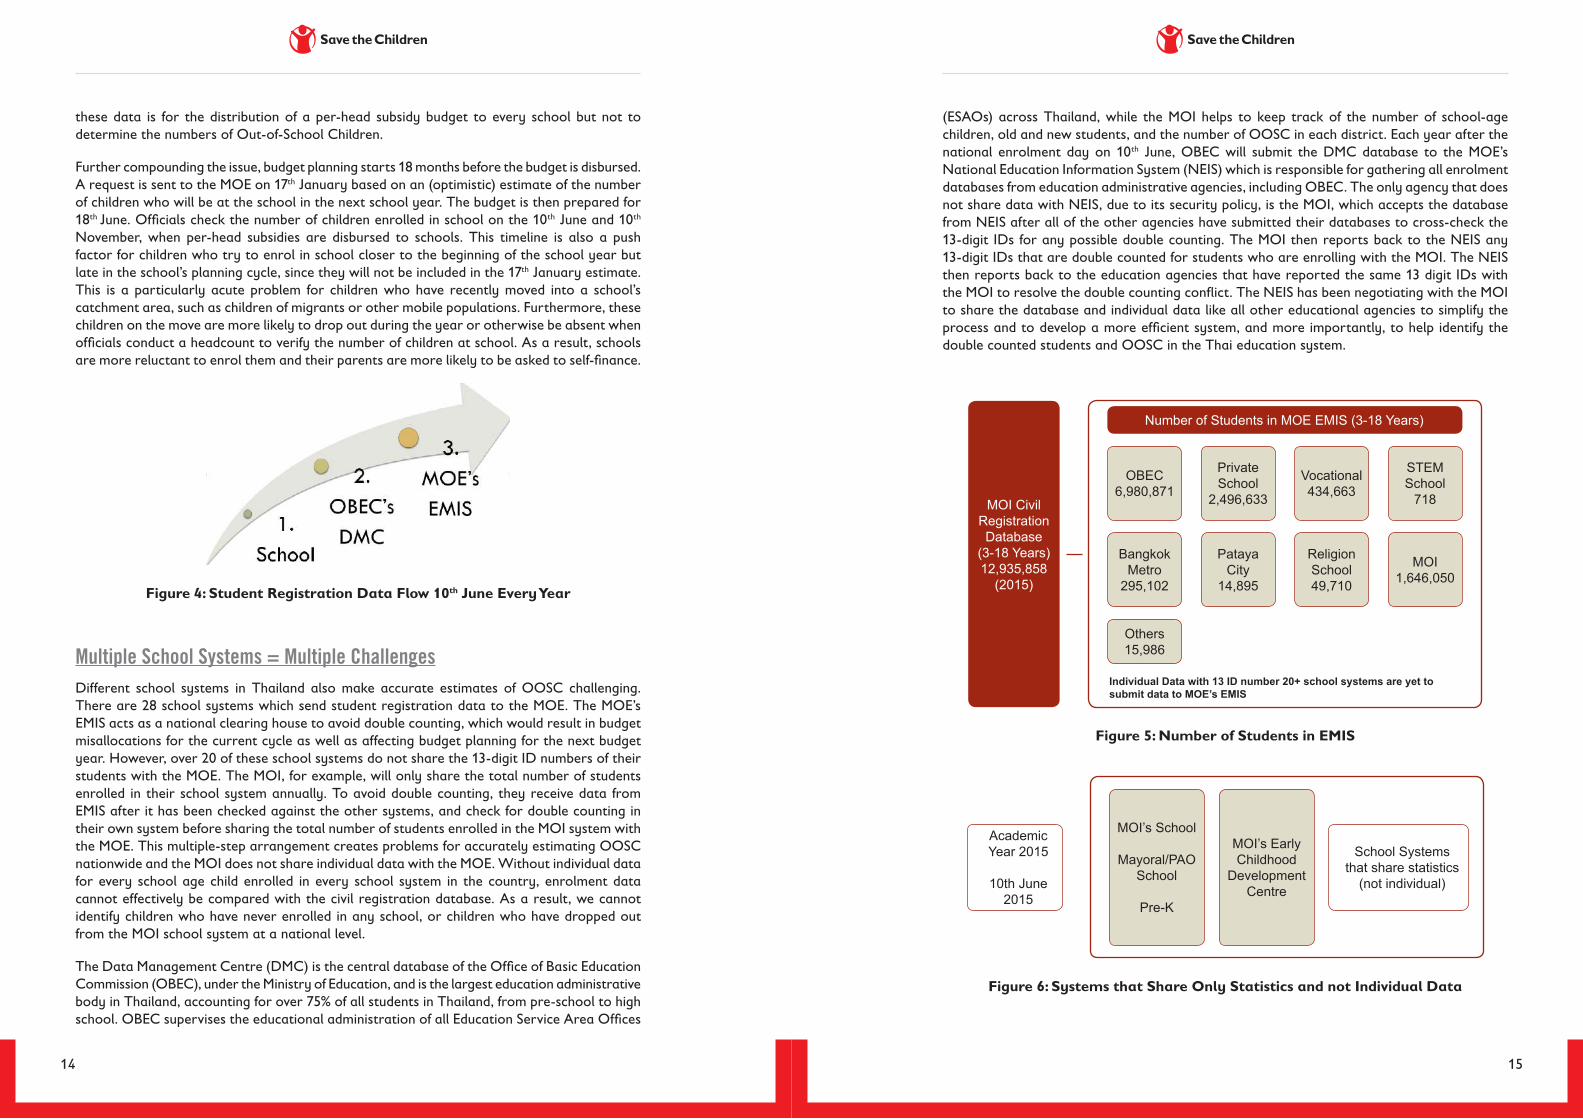
Number of Students in MOE EMIS (3-18 Years)
Others15,986
OBEC6,980,871
PrivateSchool
2,496,633
Vocational434,663
STEMSchool
718
BangkokMetro
295,102
PatayaCity
14,895
ReligionSchool49,710
MOI1,646,050
Individual Data with 13 ID number 20+ school systems are yet to submit data to MOE’s EMIS
MOI Civil Registration Database
(3-18 Years) 12,935,858
(2015)
Figure 5: Number of Students in EMIS
MOI’s School
Mayoral/PAOSchool
Pre-K
Academic Year 2015
10th June2015
MOI’s Early Childhood
DevelopmentCentre
School Systemsthat share statistics
(not individual)
Figure 6: Systems that Share Only Statistics and not Individual Data
these data is for the distribution of a per-head subsidy budget to every school but not to determine the numbers of Out-of-School Children.
Further compounding the issue, budget planning starts 18 months before the budget is disbursed. A request is sent to the MOE on 17th January based on an (optimistic) estimate of the number of children who will be at the school in the next school year. The budget is then prepared for 18th June. Officials check the number of children enrolled in school on the 10th June and 10th November, when per-head subsidies are disbursed to schools. This timeline is also a push factor for children who try to enrol in school closer to the beginning of the school year but late in the school’s planning cycle, since they will not be included in the 17th January estimate. This is a particularly acute problem for children who have recently moved into a school’s catchment area, such as children of migrants or other mobile populations. Furthermore, these children on the move are more likely to drop out during the year or otherwise be absent when officials conduct a headcount to verify the number of children at school. As a result, schools are more reluctant to enrol them and their parents are more likely to be asked to self-finance.
Figure 4: Student Registration Data Flow 10th June Every Year
Multiple School Systems = Multiple ChallengesDifferent school systems in Thailand also make accurate estimates of OOSC challenging. There are 28 school systems which send student registration data to the MOE. The MOE’s EMIS acts as a national clearing house to avoid double counting, which would result in budget misallocations for the current cycle as well as affecting budget planning for the next budget year. However, over 20 of these school systems do not share the 13-digit ID numbers of their students with the MOE. The MOI, for example, will only share the total number of students enrolled in their school system annually. To avoid double counting, they receive data from EMIS after it has been checked against the other systems, and check for double counting in their own system before sharing the total number of students enrolled in the MOI system with the MOE. This multiple-step arrangement creates problems for accurately estimating OOSC nationwide and the MOI does not share individual data with the MOE. Without individual data for every school age child enrolled in every school system in the country, enrolment data cannot effectively be compared with the civil registration database. As a result, we cannot identify children who have never enrolled in any school, or children who have dropped out from the MOI school system at a national level.
The Data Management Centre (DMC) is the central database of the Office of Basic Education Commission (OBEC), under the Ministry of Education, and is the largest education administrative body in Thailand, accounting for over 75% of all students in Thailand, from pre-school to high school. OBEC supervises the educational administration of all Education Service Area Offices
16 17
Thailand and Tak OOSC Number (7-15 Years Old)
Thailand7,239,047
Tak110,172
Thailand6,991,818
Tak76,414
Thailand247,229
Tak33,758
3.4%
30.6%
Figure 8: Estimating OOSC in Thailand and Tak Province (EMIS: AY2015)
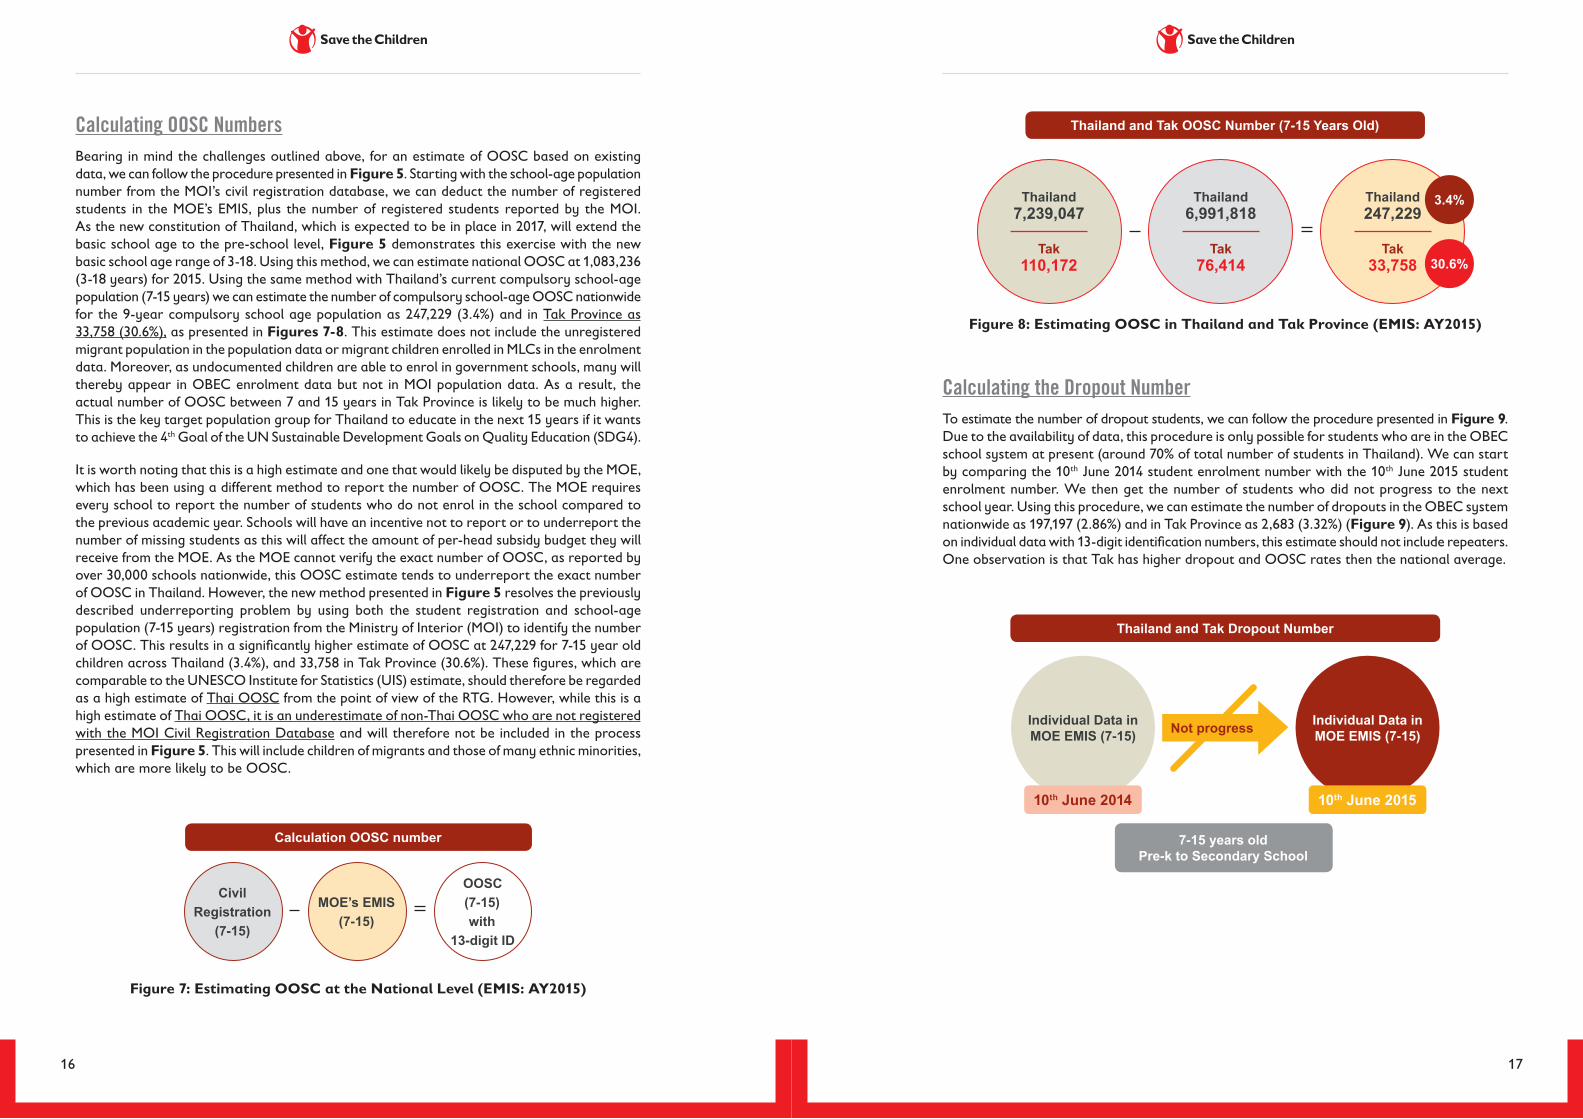
Calculating the Dropout NumberTo estimate the number of dropout students, we can follow the procedure presented in Figure 9. Due to the availability of data, this procedure is only possible for students who are in the OBEC school system at present (around 70% of total number of students in Thailand). We can start by comparing the 10th June 2014 student enrolment number with the 10th June 2015 student enrolment number. We then get the number of students who did not progress to the next school year. Using this procedure, we can estimate the number of dropouts in the OBEC system nationwide as 197,197 (2.86%) and in Tak Province as 2,683 (3.32%) (Figure 9). As this is based on individual data with 13-digit identification numbers, this estimate should not include repeaters. One observation is that Tak has higher dropout and OOSC rates then the national average.
Thailand and Tak Dropout Number
7-15 years oldPre-k to Secondary School
Individual Data in MOE EMIS (7-15)
10th June 201510th June 2014
Individual Data in MOE EMIS (7-15)Not progress
Calculating OOSC NumbersBearing in mind the challenges outlined above, for an estimate of OOSC based on existing data, we can follow the procedure presented in Figure 5. Starting with the school-age population number from the MOI’s civil registration database, we can deduct the number of registered students in the MOE’s EMIS, plus the number of registered students reported by the MOI. As the new constitution of Thailand, which is expected to be in place in 2017, will extend the basic school age to the pre-school level, Figure 5 demonstrates this exercise with the new basic school age range of 3-18. Using this method, we can estimate national OOSC at 1,083,236 (3-18 years) for 2015. Using the same method with Thailand’s current compulsory school-age population (7-15 years) we can estimate the number of compulsory school-age OOSC nationwide for the 9-year compulsory school age population as 247,229 (3.4%) and in Tak Province as 33,758 (30.6%), as presented in Figures 7-8. This estimate does not include the unregistered migrant population in the population data or migrant children enrolled in MLCs in the enrolment data. Moreover, as undocumented children are able to enrol in government schools, many will thereby appear in OBEC enrolment data but not in MOI population data. As a result, the actual number of OOSC between 7 and 15 years in Tak Province is likely to be much higher. This is the key target population group for Thailand to educate in the next 15 years if it wants to achieve the 4th Goal of the UN Sustainable Development Goals on Quality Education (SDG4).
It is worth noting that this is a high estimate and one that would likely be disputed by the MOE, which has been using a different method to report the number of OOSC. The MOE requires every school to report the number of students who do not enrol in the school compared to the previous academic year. Schools will have an incentive not to report or to underreport the number of missing students as this will affect the amount of per-head subsidy budget they will receive from the MOE. As the MOE cannot verify the exact number of OOSC, as reported by over 30,000 schools nationwide, this OOSC estimate tends to underreport the exact number of OOSC in Thailand. However, the new method presented in Figure 5 resolves the previously described underreporting problem by using both the student registration and school-age population (7-15 years) registration from the Ministry of Interior (MOI) to identify the number of OOSC. This results in a significantly higher estimate of OOSC at 247,229 for 7-15 year old children across Thailand (3.4%), and 33,758 in Tak Province (30.6%). These figures, which are comparable to the UNESCO Institute for Statistics (UIS) estimate, should therefore be regarded as a high estimate of Thai OOSC from the point of view of the RTG. However, while this is a high estimate of Thai OOSC, it is an underestimate of non-Thai OOSC who are not registered with the MOI Civil Registration Database and will therefore not be included in the process presented in Figure 5. This will include children of migrants and those of many ethnic minorities, which are more likely to be OOSC.
Calculation OOSC number
CivilRegistration
(7-15)
MOE’s EMIS(7-15)
OOSC(7-15)with
13-digit ID
Figure 7: Estimating OOSC at the National Level (EMIS: AY2015)
18 19
OOSC AT THE PROVINCIAL LEVEL
Tak ProvinceTak Province is on Thailand’s western border with Myanmar. Tak town (thesaban mueang) is the capital of Tak Province, and is comprised of nine districts (ampur) including five border districts: Tha Song Yang, Mae Ramat, Mae Sot, Phop Phra, and Umphang. Education services in these five border districts are governed by Education Service Area Office, Area 2 Tak (ESAO Tak 2). This ESAO covers an area of 500 kilometres from north to south. All five border districts include sizeable migrant and ethnic minority populations, with migrants often moving between the border districts for work. Of these, Mae Sot is the most populous and includes Mae Sot City. Tha Song Yang has a sizeable population of Karen migrants and refugees, while Phop Phra and Mae Ramat have migrants working in the agricultural sector. Umphang includes a mixed population of Karen refugees and hill people indigenous to the area. In Mae Ramat and Phop Phra, migrants commonly work in rice fields whereas Phop Phra is more mountainous and migrants commonly live in small groups and work on farms.
According to Mae Sot’s Chief District Officer, in Mae Sot District alone there are 100,000 people with household registration data who are therefore included in the civil registration database, plus an additional shadow population of 200,000 Thai and migrant residents.1 Included in the registered population were 11,160 Thai children between the ages of 6 and 17 in 2015 according to the MOI. The total number of migrant children is unclear as not all are officially registered. In 2009, the Committee for Promotion and Protection of Child Rights estimated that there were 15,000-30,000 migrant children in all districts of Tak Province, but according to UNESCO, the MOPH estimated there to be 17,889 non-Thai children in Mae Sot District alone in 2016. This estimate is four or five times higher than other sources for two reasons. Firstly, the MOPH collects data on the undocumented population whereas the MOI does not.
1 Interview, 19 October 2016. According to the most recent census, there were 121,062 people in Mae Sot (MOI: 1/9/2010).
How to obtain Dropout Number (OBEC only)
Thailand7,084,091
Tak83,404
Thailand6,886,894
Tak80,721
10th June 201510th June 2014
Not progress
2.86% 3.32%
Dropout
Thailand
197,197Tak
2,683
Figure 9: Dropouts in Thailand and Tak Province
Semi-invisible Migrant OOSCThe high ratio of migrant OOSC in Thailand significantly affects the country’s OOSC rate. One possible explanation for the sizeable OOSC estimate using the government data above is the large number of migrant OOSC. Based on an MOI estimate of 390,015 migrant children in Thailand, subtracting the number of these children in formal schools (67,577), Border Patrol Boarding Schools (22,000), and Migrant Learning Centres (18,321), Save the Children and World Education estimated in 2014 that there were 238,402 migrant children OOSC nationwide, a rate of 61%. Children of migrants may show up on administrative records when they are registered with the MOI as dependents of their parents on occasions when registration is open to them. At other times, they would remain invisible. Children of migrants are currently educated through various channels: Thai government schools, Migrant Learning Centres (MLCs), School within a School programs, and non-formal education and private schools. MLCs are run by communities and civil society organisations. However, this channel is largely unrecognised and is a precarious educational pathway for these students due to financial instability and the lack of standardisation.
18,3215%
133,34634%238,402
61%
43% are fromMyanmar
MLC students Students in Thai school Estimated OOSC
Estimated Number of Migrant Children in Thailand: 390,015 (MOI, 2014)
Figure 10: Estimate of Migrant Children in ThailandSources: Save the Children, 2014; MOI, 2014; FRY, 2014; OBEC, 2013 as extracted from Miyazawa, 2015
Art
ist
Cre
dit:
Sath
l w
ww
.sat
h.es
Phot
o cr
edit:
Kae
wta
San
gsuk
| S
ave
the
Chi
ldre
n
20 21
Secondly, UNESCO explained there may be some double counting, as the figure includes the number of recipients of services at sub-district health promoting hospitals, and some may have received services at more than one hospital.2
There are three different education systems serving the population of Tak Province. The first and biggest system is the government system, which includes the MOE school system and the MOI school systems, as well as the MOE’s non-formal schooling. The second system is a private system which includes both profit and non-profit, and formal and non-formal private education institutions. The third system is the migrant learning centres. All of these 3 systems in Mae Sot are supervised by the Education Service Area Office, Area 2 Tak (ESAO Tak 2) and Mae Sot Office of Non-Formal and Informal Education Office (ONIE).
The RTG provides financial support to the government and private system, wherein 46,266 were enrolled in government schools in October 2016 for the 2016 academic year. There were 9,016 in the private system in June 2015. Around 30% of students across these systems do not hold Thai citizenship, the majority of whom are Karen. These students have been assigned 13-digit identification numbers beginning with “G”. Branched classrooms are affiliated with government schools and are located in rural areas with Thai teachers sent to teach a number of classes. There are 58 of these across the five border districts. Lastly are the migrant learning centres (MLCs) which receive some support from NGOs and little support from the RTG. The majority of the students in these schools are not Thai nationals, and many are children of migrants from Myanmar. There are 59 MLCs and 12 branch classrooms in the five border districts registered with the ESAO Tak 2 with 12,848 students (MECC, 31 January 2017). These learning centres use diverse curricula and school leavers do not receive certificates from the government when they have completed their education. This makes progressing to tertiary education challenging although students can enrol in Thai Non-Formal Education (NFE) at the same time and obtain certification that way. Some also sit exams in Myanmar to obtain recognised accredited education certificates.
Data Points for Administrative DataThere are currently three reliable sources of data that can be used to estimate OOSC in Tak Province.
1. Ministry of Public Health Database: The MOPH maintains population data on all residents, documented and undocumented. This is updated annually as a population survey, but disease data are updated monthly. This is conducted through hospitals by community health volunteers.
2. Ministry of Interior Civil Registration Database: The MOI periodically updates its civil registration database on the 31st December every year. This includes household data for all residents in possession of a 13-digit ID card for Thai citizens or a temporary 13-digit ID card for non-Thai citizens. Data collection is conducted through village leaders, who report to the MOI. Village leaders are familiar with children in their
2 UNESCO Thailand (2016) Executive Summary: Rapid Assessment Survey: Situation and Estimated Number of Out-of-School Children (OOSC) at the Primary education level in Mae Sot District, Tak Province. September. It should be noted that the MOPH data obtained by the consultant team presented below estimates there to be 20,351 children aged 7-15 in Mae Sot district as of February 2017.
community and those who have moved elsewhere. According to the ESAO, the MOI data guarantee the residential status of persons that live in Thailand and is therefore the only database that ESAO and schools can use for budgeting and school planning purposes, by MOE regulation. MOPH data may include highly mobile migrants, or migrants that come for treatment at Mae Tao Clinic and then return to Myanmar, so village leaders and schools can only recognise MOI data, but not MOPH data.
3. Ministry of Education Database: This includes student enrolment figures and is updated twice a year on the 10th June and the 10th of November. These figures are regularly used for budgeting and school planning purposes.
Other Data Sources• UNICEF has worked on a Multiple Indicator Clusters Survey (MICS). This is a household
survey, not just on education but on children in general. This is effectively a rigorous household census with good data.
• UNESCO has worked on an OOSC Monitoring System. However, the RTG is hostile to the data point used based on UN Population Department data rather than RTG data, which the RTG believes results in an inflated OOSC estimate.
OOSC in Mae Sot DistrictUNESCO conducted a rapid assessment survey on OOSC in Mae Sot District in mid-2016. When comparing the number of 6-17 years old in the civil registration database against the number of children in formal, informal, and non-formal education, they found that there were actually 3,817 more Thai children enrolled in schools in Mae Sot District than were listed in the civil registration database (UNESCO, 2016).3 This could be because students travel to school in Mae Sot District from other districts, or they could be residents without household registration. With non-Thai children, they compared the number of children who were recipients of healthcare services in hospitals in Mae Sot district and deducted from this the number of non-Thais in formal and informal education. They found that, excluding children enrolled in MLCs, there were 8,107 non-Thai OOSC in Mae Sot. Including those enrolled in MLCs, they found there to be 1,874 non-Thai OOSC in Mae Sot.
To estimate OOSC, UNESCO used two methods. The first used RTG administrative data, including MOI, MOPH, and MOE data. The second was a questionnaire-based telephone survey. They found that data from the health and education sectors were more accurate than data from other sources, such as phone surveys with village leaders, and recommended that administrative health and education data are best suited to calculate OOSC estimates rather than household surveys.
3 From the executive summary it was not clear if estimates were based on children aged 6-11 years old or 6-17 years old as the two were used interchangeably when explaining survey methodology.
22 23
Existing Mechanisms for Estimating OOSC in Tak ProvinceThere are currently two mechanisms for estimating OOSC under the OBEC system in PESAO Tak 2, Tak Province. The first is based on secondary data analysis, the second on primary data collection conducted by schools.
Mechanism 1: Secondary Data AnalysisPESAO Tak 2 works with schools in the five border districts to collect and analyse secondary population data which allows them to check i) the number of four-year old children in a community (that is, kindergarten age); and ii) the number of school-age (7-15 years) children in school catchment areas. This allows them to cross-check community-level population data and MOI population registration data (updated annually on 31st December) with MOE enrolment figures, enabling them to: 1) prevent over- or under-estimation of enrolment figures and verify school budgets; 2) identify areas with OOSC and conduct awareness-raising and outreach activities in communities.
MOI population data are obtained from the Mae Sot District Office once a year for children who will be 4 years old and hence expected to enrol in kindergarten. MOI birth registration data are current as of 31st December each year. ESAO officials obtain a hard copy of individual data from the MOI, type it up into a spreadsheet and send a list of children aged four years old to the schools in their catchment area. The school will compare these data with their own data to establish whether there are any children who have not yet enrolled for the next school year.
Enrolment data from schools are then submitted to the ESAO on the 10th June and 10th November, for the 1st and 2nd semesters respectively. School records from the 10th June are matched with the MOI data by ESAO. A list is compiled of school-age children missing from the school records and a letter is sent to the school to check why these children are missing and what assistance they might need. The local school is given the home address of the student and is required to visit these children to encourage them to return to school. If these school-age children and their parents refuse to come to school, parents will receive a warning letter from ESAO that they will be fined THB 10,000 if they do not register with a nearby school or in a non-formal education centre. If the school cannot find the student, they will have to eliminate that student from their enrolment figures within 15 days (in practice they eliminate the student within 30 days).
Mechanism 2: Primary Data CollectionIn addition to secondary population data analysis, there are also primary data collection mechanisms. Schools are required to conduct an annual school age census (7-15 years) survey in communities with village leaders [see Annex 1 and 2], which is cross-checked by the ESAO against MOI data (as described above). Village leaders and school committees facilitate data collection and a school representative is obliged to conduct home visits to children’s homes.
Gaps in this mechanism include the following:
• There are reportedly several forms used by the ESAO for data collection, and officials have reported it would be simpler if there were one to avoid duplication and time inefficiencies.
• Officials have also reported that these forms were not designed with the local context in mind.
• It is not clear what mechanisms are currently operational and respondents have indicated that these mechanisms may not always be implemented.
• It is not clear what analysis, if any, is currently being conducted with these data.
• The mechanism only applies to OBEC schools
• Community leaders may sometimes act as “gatekeepers”, blocking access to schools for non-Thai children. They have been reported to be less cooperative in urban areas.
An Assessment of Existing MechanismsBoth mechanisms are currently informal and are undertaken at the initiative of PESAO Tak 2. This is a good practice. However, there are gaps that could be addressed to improve the mechanism.
1) Firstly, data collection and analysis is an unnecessarily inefficient process. Formalising horizontal data sharing and cooperation between the MOE and MOI through an Memorandum of Understanding (MOU) would significantly reduce the burden on local ESAO staff. At present, MOI data for each sub-district are printed out and handed to MOE staff. ESAO officials type these data into Excel. This is not part of their official duty so around 10 officials do this outside of office hours for up to four months.4
2) Secondly, population data from the MOI only include children in possession of 13-digit ID numbers. This means that undocumented students, migrants and stateless persons, as well as those who obtain birth certificates from the hospital but do not subsequently register with the MOI, are not included in the population level data. These invisible OOSC could be rendered semi-invisible by using other data sources, such as MOPH disease surveillance data.
3) Thirdly, this mechanism currently only covers OBEC schools, meaning that children enrolled in schools under different systems will not be included, and there is no follow up for students dropping out from other systems.
4) Finally, the mechanism currently only operates at the local level in the five border districts. Under the present system, it is not clear what happens when students move outside these border districts. They may have enrolled in another school outside the ESAO administrative area or may have become OOSC. If conducted by the MOE at the central level and rolled out nationwide, it would enable cross-checking of students against national, rather than only provincial databases. This would also increase efficiency and reduce the burden on local ESAO staff.
The aim of this study was to contribute to strengthening these mechanisms, the results of which are detailed in the next section.
4 ESAO official
24 25
Established Barriers to Access in Tak ProvinceOnce estimates of OOSC numbers and their whereabouts are established, the next step is to identify who they are and what barriers are faced in attending school full time. Based on a literature review and discussions with key stakeholders, the following have been established as barriers to access in Tak Province.
Socio Demographic Factors
• Many children drop out at the age of 10/11 to work
• Informal financial costs associated with schools
Sociocultural Factors
• Thai language is a barrier for children of migrants and sometimes also ethnic minorities.
• Negative attitudes in the Thai community towards migrant workers, poverty, lack of appreciation of the importance of education.
• Discrimination and bullying of migrant/ethnic minority children by other students and parents.
• Some parents and communities do not recognise the value of education, and therefore do not see the need to send their children to school.
• In some cases, village leaders block access to a school. Landlords/employers of migrants can also act as gatekeepers. Sometimes the employers want children to work rather than attend school. Children are much quicker than adults at spreading fertiliser and de-weeding between plants on farms, for example, but they are paid the same and in some cases more than adult workers.
School-related Factors
• Government policy is clear that schools should accept all children, but principals still have the right to deny access based on limited resources, or when accepting more children compromises the quality of education.
• Limitation of school capacity and resources.
• Confusion among schools about what paperwork is necessary and the process for enrolling non-Thai students.
• Enrolling migrant students can lower the school’s performance in the O-Net examinations.
• Teachers may not want to enrol migrant students because it can mean a larger work load for the same salary when teaching bilingual students.
• The content of the Thai non-formal education curriculum may be perceived as inappropriate for non-Thais and Thai language is also an important barrier.
• School’s lack of understanding of the EFA policy regardless of nationality.
• MLCs short of funding as there has been a shift of funding from Thailand to Myanmar.
Government Financing and Policies
• Lack of documentation and financial support for schools from the MOE are reported to be the main barriers for non-Thais accessing Thai schools.
• Support for implementation of the EFA from central to local level, which has then been filtering down to the school principal level, has been identified as a key barrier to access by World Education.
• The implementation of the EFA for under-served Thai communities is reportedly different than that for migrant communities. The latter require more resources, especially to overcome language issues.
• MOE regulation allows per-head subsidies in private schools only for those with documents issued officially by the MOI. This is a key barrier for non-Thai children.
• No standardised tracking system of children enrolled in schools.
• Education support is seen as the sole responsibility of the MOE.
• There is no punishment for schools denying access.
• Children turning up to school on the first day of school (10th June) will miss out on the semester as this is the last day the schools can submit their enrolment list to the ESAO.
Kae
wta
San
gsuk
| S
ave
the
Chi
ldre
n
26 27
which would lead to a more accurate estimation of OOSC numbers and their whereabouts at the national, provincial, and district levels. These data could be leveraged to help identify hotspots of invisible OOSC. An analysis of MOE enrolment data for schools in a district, which distinguishes between Thai and non-Thai students (i.e. those with MOE assigned “G” numbers) with MOI data for registered residents in a district with MOPH data for the total population in the district would not only enable a more accurate estimate of the total population of that district, but also the extent to which undocumented students (ethnic minority and children of migrants) are represented in local schools. Should non-Thais be significantly underrepresented in school enrolment data, ESAO might conclude that interventions need to be targeted toward those populations in that district.
The consultant team and director of PESAO Tak 2 met with the Chief Medical Officer (CMO) for Tak Province on 30th November 2016. The CMO is responsible for the MOPH Disease Surveillance Database. A request was submitted at the time to share key data points from this database with the ESAO related to the number of school age children in each district, which was agreed to in principle. Despite several follow-up requests made by PESAO Tak 2, individual data were not shared with ESAO staff as of the end of the survey period. It is understood that in the past, law enforcement agents visited undocumented residents after they had been visited by community health volunteers, which may explain the reluctance to share data. Data were nonetheless obtained through the Tak Health Information Centre, as summarised in Table 2 below. These data are for undocumented children between the ages of 7 and 15 who are not included in the MOI Civil Registration Database as they do not possess 13-digit identification cards, and it does not include children residing in displaced persons’ camps along the border. The data were collected in a household survey in July 2016, with the addition of any new patients using health services up to February 2017. It should be noted that some government agencies might dispute the inclusion of these data in an estimate of the resident population as mobile and migrant residents are included.
In section 2, it was stated that a reasonable estimate of the number of OOSC in a given area may be made according to the following formula:
(Y = Children of a school age in the area)
(X = Number of children in school (OBEC, Private, Vocational, MLCs))
Where:
X = Consolidation of OBEC, MLC, private school, and other government data
Y = Y1 + Y2 (Y1 = Thai children; Y2 = Migrant children)
Currently available data obtained for PESAO Tak 2 in Tak Province are presented in Table 2 below. It should be noted that the data are for the ages of 7-15 years, the compulsory education age in Thailand. This is different to the ages used by UNESCO and UNICEF (6-11, 12-18). Moreover, available OBEC enrolment data for 2016 were used rather than for 2015 because they were more recent and included non-Thai students. However, the available data for 2016 were disaggregated by grade rather than age. As a result, enrolment data in OBEC schools included children of all ages enrolled in schools, while undocumented students enrolled from kindergarten to grade 9 were included. This would lead to an overestimation of children between the ages of 7 and 15 included in the enrolment data and thus underestimates OOSC.
Strengthening Existing MechanismsThe aim of the pilot project was to strengthen existing mechanisms for estimating OOSC in Tak Province. The results of which are discussed below.
Mechanism One: Identifying OOSC “Hotspots” through Administrative DataIt was reported prior to the pilot study that ESAOs currently informally obtain data from MOI for children turning 4 years of age and for children of compulsory school age (7-15 years). However, only the first mechanism, for children turning four, could be verified and it seems that the second is not currently implemented. Since it takes ESAO officials several months to process and analyse data on children turning 4 years old, and that this is a practice they undertake on their own initiative in addition to their official workload, it is unsurprising that the second mechanism is not currently operational. Consequently, the first step to strengthen mechanism one would be for the MOI to share individual data on the school age population (3-18 years) in each district and sub district with ESAOs so that semi-invisible OOSC can be identified using the civil registration database. At present, only the total number of children can be identified in each district, whereas if the MOE had access to individual data from the MOI, they would be able to cross-check with enrolment data and identify residents with 13-digit identification numbers who are not currently enrolled in any school and obtain their registered household address.
This mechanism could then be further strengthened by using population data that include all residents. A significant number of Thai ethnic minorities and children of migrant workers have no identification at all and may not be registered with the MOI. These residents will not be included in the MOI’s Civil Registration Database and therefore will not currently be included in the process outlined above to estimate OOSC at the national level. These invisible OOSC could be rendered semi-invisible if MOPH were to share their disease surveillance database,
PILOT STUDY RESULTS
Kan
tam
at P
alaw
at |
Sav
e th
e C
hild
ren
28 29
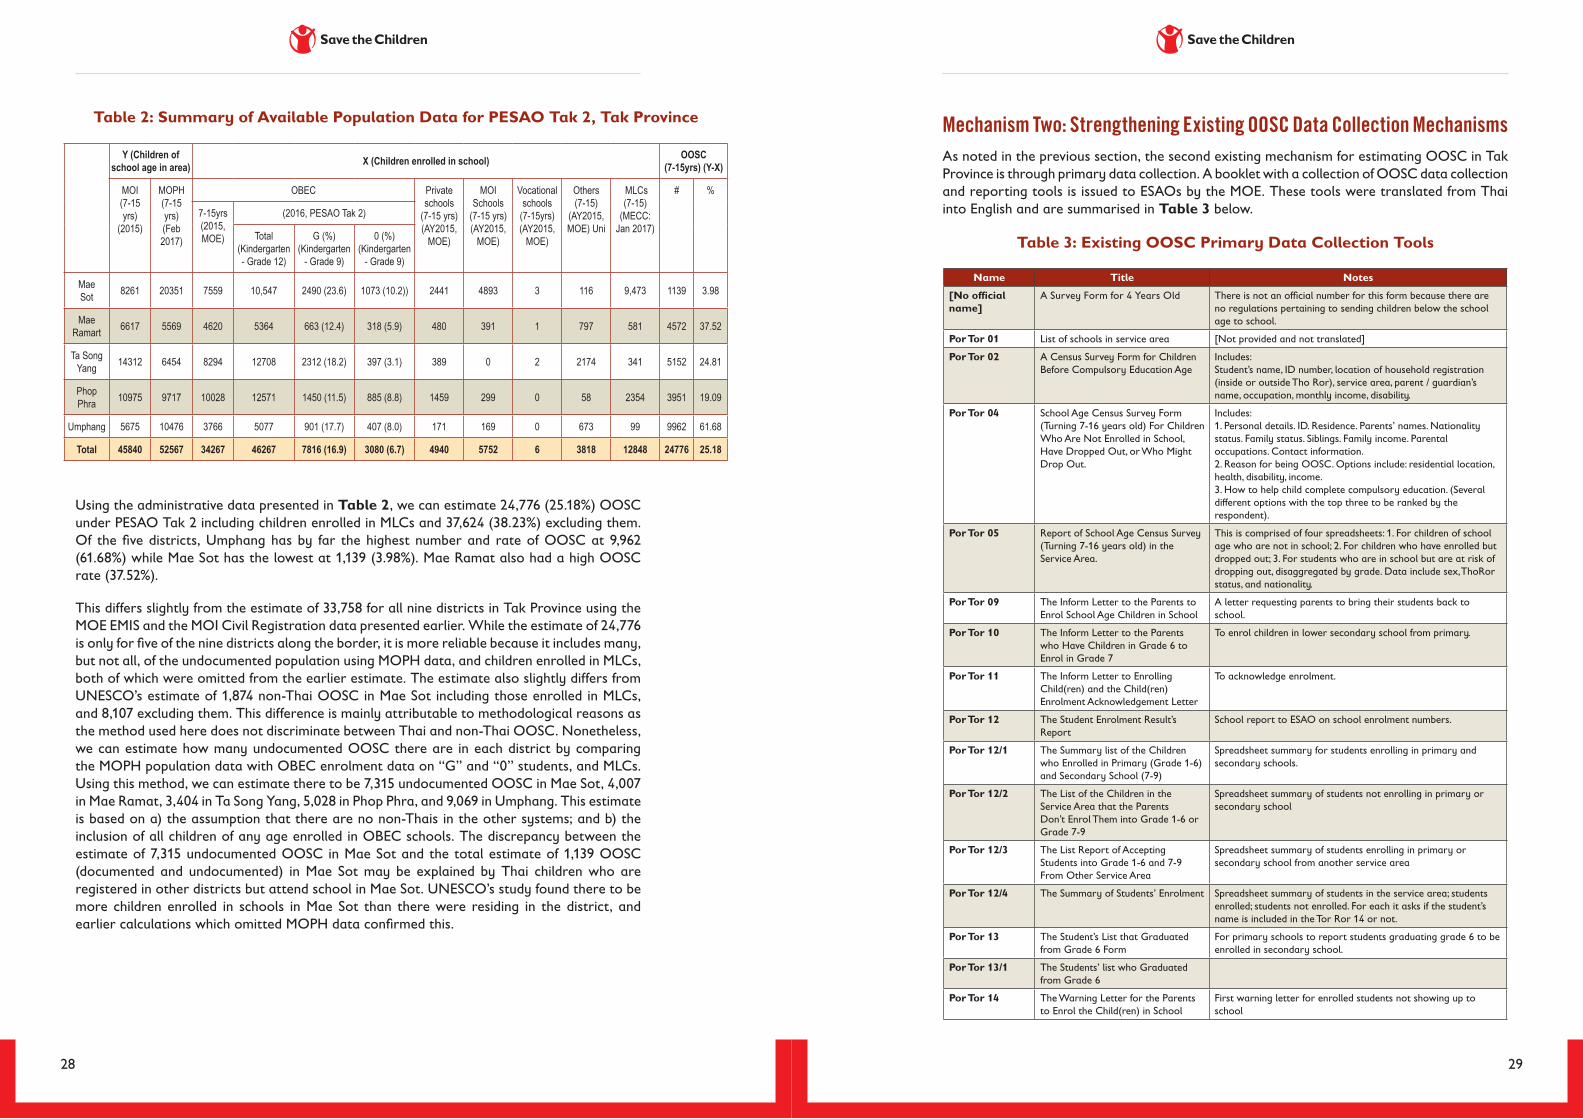
Using the administrative data presented in Table 2, we can estimate 24,776 (25.18%) OOSC under PESAO Tak 2 including children enrolled in MLCs and 37,624 (38.23%) excluding them. Of the five districts, Umphang has by far the highest number and rate of OOSC at 9,962 (61.68%) while Mae Sot has the lowest at 1,139 (3.98%). Mae Ramat also had a high OOSC rate (37.52%).
This differs slightly from the estimate of 33,758 for all nine districts in Tak Province using the MOE EMIS and the MOI Civil Registration data presented earlier. While the estimate of 24,776 is only for five of the nine districts along the border, it is more reliable because it includes many, but not all, of the undocumented population using MOPH data, and children enrolled in MLCs, both of which were omitted from the earlier estimate. The estimate also slightly differs from UNESCO’s estimate of 1,874 non-Thai OOSC in Mae Sot including those enrolled in MLCs, and 8,107 excluding them. This difference is mainly attributable to methodological reasons as the method used here does not discriminate between Thai and non-Thai OOSC. Nonetheless, we can estimate how many undocumented OOSC there are in each district by comparing the MOPH population data with OBEC enrolment data on “G” and “0” students, and MLCs. Using this method, we can estimate there to be 7,315 undocumented OOSC in Mae Sot, 4,007 in Mae Ramat, 3,404 in Ta Song Yang, 5,028 in Phop Phra, and 9,069 in Umphang. This estimate is based on a) the assumption that there are no non-Thais in the other systems; and b) the inclusion of all children of any age enrolled in OBEC schools. The discrepancy between the estimate of 7,315 undocumented OOSC in Mae Sot and the total estimate of 1,139 OOSC (documented and undocumented) in Mae Sot may be explained by Thai children who are registered in other districts but attend school in Mae Sot. UNESCO’s study found there to be more children enrolled in schools in Mae Sot than there were residing in the district, and earlier calculations which omitted MOPH data confirmed this.
Table 2: Summary of Available Population Data for PESAO Tak 2, Tak Province
Y (Children of school age in area) X (Children enrolled in school) OOSC
(7-15yrs) (Y-X)
MOI (7-15 yrs)
(2015)
MOPH (7-15 yrs)(Feb 2017)
OBEC Private schools
(7-15 yrs) (AY2015,
MOE)
MOI Schools
(7-15 yrs)(AY2015,
MOE)
Vocational schools
(7-15yrs)(AY2015,
MOE)
Others (7-15)
(AY2015, MOE) Uni
MLCs (7-15)
(MECC: Jan 2017)
# %
7-15yrs(2015, MOE)
(2016, PESAO Tak 2)
Total(Kindergarten - Grade 12)
G (%) (Kindergarten
- Grade 9)
0 (%) (Kindergarten
- Grade 9)
MaeSot 8261 20351 7559 10,547 2490 (23.6) 1073 (10.2)) 2441 4893 3 116 9,473 1139 3.98
Mae Ramart 6617 5569 4620 5364 663 (12.4) 318 (5.9) 480 391 1 797 581 4572 37.52
Ta Song Yang 14312 6454 8294 12708 2312 (18.2) 397 (3.1) 389 0 2 2174 341 5152 24.81
Phop Phra 10975 9717 10028 12571 1450 (11.5) 885 (8.8) 1459 299 0 58 2354 3951 19.09
Umphang 5675 10476 3766 5077 901 (17.7) 407 (8.0) 171 169 0 673 99 9962 61.68
Total 45840 52567 34267 46267 7816 (16.9) 3080 (6.7) 4940 5752 6 3818 12848 24776 25.18
Mechanism Two: Strengthening Existing OOSC Data Collection Mechanisms As noted in the previous section, the second existing mechanism for estimating OOSC in Tak Province is through primary data collection. A booklet with a collection of OOSC data collection and reporting tools is issued to ESAOs by the MOE. These tools were translated from Thai into English and are summarised in Table 3 below.
Table 3: Existing OOSC Primary Data Collection Tools
Name Title Notes
[No official name]
A Survey Form for 4 Years Old There is not an official number for this form because there are no regulations pertaining to sending children below the school age to school.
Por Tor 01 List of schools in service area [Not provided and not translated]
Por Tor 02 A Census Survey Form for Children Before Compulsory Education Age
Includes: Student’s name, ID number, location of household registration (inside or outside Tho Ror), service area, parent / guardian’s name, occupation, monthly income, disability.
Por Tor 04 School Age Census Survey Form (Turning 7-16 years old) For Children Who Are Not Enrolled in School, Have Dropped Out, or Who Might Drop Out.
Includes:1. Personal details. ID. Residence. Parents’ names. Nationality status. Family status. Siblings. Family income. Parental occupations. Contact information. 2. Reason for being OOSC. Options include: residential location, health, disability, income. 3. How to help child complete compulsory education. (Several different options with the top three to be ranked by the respondent).
Por Tor 05 Report of School Age Census Survey (Turning 7-16 years old) in the Service Area.
This is comprised of four spreadsheets: 1. For children of school age who are not in school; 2. For children who have enrolled but dropped out; 3. For students who are in school but are at risk of dropping out, disaggregated by grade. Data include sex, ThoRor status, and nationality.
Por Tor 09 The Inform Letter to the Parents to Enrol School Age Children in School
A letter requesting parents to bring their students back to school.
Por Tor 10 The Inform Letter to the Parents who Have Children in Grade 6 to Enrol in Grade 7
To enrol children in lower secondary school from primary.
Por Tor 11 The Inform Letter to Enrolling Child(ren) and the Child(ren) Enrolment Acknowledgement Letter
To acknowledge enrolment.
Por Tor 12 The Student Enrolment Result’s Report
School report to ESAO on school enrolment numbers.
Por Tor 12/1 The Summary list of the Children who Enrolled in Primary (Grade 1-6) and Secondary School (7-9)
Spreadsheet summary for students enrolling in primary and secondary schools.
Por Tor 12/2 The List of the Children in the Service Area that the Parents Don’t Enrol Them into Grade 1-6 or Grade 7-9
Spreadsheet summary of students not enrolling in primary or secondary school
Por Tor 12/3 The List Report of Accepting Students into Grade 1-6 and 7-9 From Other Service Area
Spreadsheet summary of students enrolling in primary or secondary school from another service area
Por Tor 12/4 The Summary of Students’ Enrolment Spreadsheet summary of students in the service area; students enrolled; students not enrolled. For each it asks if the student’s name is included in the Tor Ror 14 or not.
Por Tor 13 The Student’s List that Graduated from Grade 6 Form
For primary schools to report students graduating grade 6 to be enrolled in secondary school.
Por Tor 13/1 The Students’ list who Graduated from Grade 6
Por Tor 14 The Warning Letter for the Parents to Enrol the Child(ren) in School
First warning letter for enrolled students not showing up to school
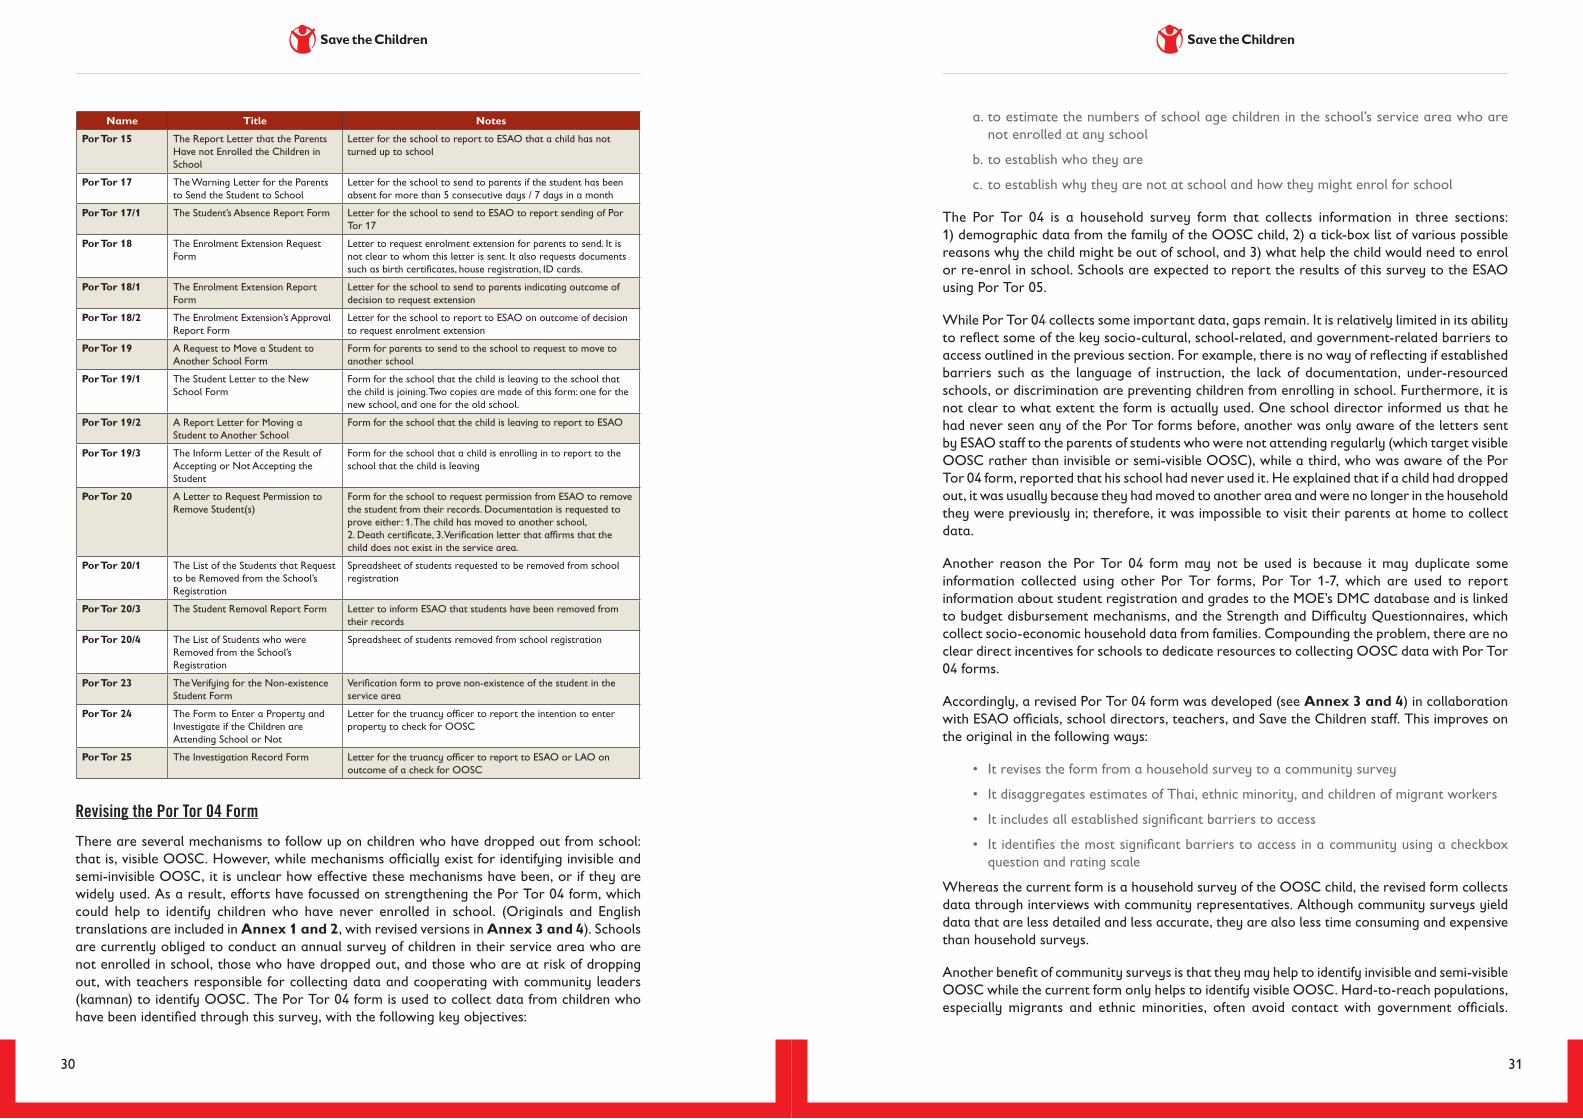
30 31
Name Title Notes
Por Tor 15 The Report Letter that the Parents Have not Enrolled the Children in School
Letter for the school to report to ESAO that a child has not turned up to school
Por Tor 17 The Warning Letter for the Parents to Send the Student to School
Letter for the school to send to parents if the student has been absent for more than 5 consecutive days / 7 days in a month
Por Tor 17/1 The Student’s Absence Report Form Letter for the school to send to ESAO to report sending of Por Tor 17
Por Tor 18 The Enrolment Extension Request Form
Letter to request enrolment extension for parents to send. It is not clear to whom this letter is sent. It also requests documents such as birth certificates, house registration, ID cards.
Por Tor 18/1 The Enrolment Extension Report Form
Letter for the school to send to parents indicating outcome of decision to request extension
Por Tor 18/2 The Enrolment Extension’s Approval Report Form
Letter for the school to report to ESAO on outcome of decision to request enrolment extension
Por Tor 19 A Request to Move a Student to Another School Form
Form for parents to send to the school to request to move to another school
Por Tor 19/1 The Student Letter to the New School Form
Form for the school that the child is leaving to the school that the child is joining. Two copies are made of this form: one for the new school, and one for the old school.
Por Tor 19/2 A Report Letter for Moving a Student to Another School
Form for the school that the child is leaving to report to ESAO
Por Tor 19/3 The Inform Letter of the Result of Accepting or Not Accepting the Student
Form for the school that a child is enrolling in to report to the school that the child is leaving
Por Tor 20 A Letter to Request Permission to Remove Student(s)
Form for the school to request permission from ESAO to remove the student from their records. Documentation is requested to prove either: 1. The child has moved to another school, 2. Death certificate, 3. Verification letter that affirms that the child does not exist in the service area.
Por Tor 20/1 The List of the Students that Request to be Removed from the School’s Registration
Spreadsheet of students requested to be removed from school registration
Por Tor 20/3 The Student Removal Report Form Letter to inform ESAO that students have been removed from their records
Por Tor 20/4 The List of Students who were Removed from the School’s Registration
Spreadsheet of students removed from school registration
Por Tor 23 The Verifying for the Non-existence Student Form
Verification form to prove non-existence of the student in the service area
Por Tor 24 The Form to Enter a Property and Investigate if the Children are Attending School or Not
Letter for the truancy officer to report the intention to enter property to check for OOSC
Por Tor 25 The Investigation Record Form Letter for the truancy officer to report to ESAO or LAO on outcome of a check for OOSC
Revising the Por Tor 04 Form
There are several mechanisms to follow up on children who have dropped out from school: that is, visible OOSC. However, while mechanisms officially exist for identifying invisible and semi-invisible OOSC, it is unclear how effective these mechanisms have been, or if they are widely used. As a result, efforts have focussed on strengthening the Por Tor 04 form, which could help to identify children who have never enrolled in school. (Originals and English translations are included in Annex 1 and 2, with revised versions in Annex 3 and 4). Schools are currently obliged to conduct an annual survey of children in their service area who are not enrolled in school, those who have dropped out, and those who are at risk of dropping out, with teachers responsible for collecting data and cooperating with community leaders (kamnan) to identify OOSC. The Por Tor 04 form is used to collect data from children who have been identified through this survey, with the following key objectives:
a. to estimate the numbers of school age children in the school’s service area who are not enrolled at any school
b. to establish who they are
c. to establish why they are not at school and how they might enrol for school
The Por Tor 04 is a household survey form that collects information in three sections: 1) demographic data from the family of the OOSC child, 2) a tick-box list of various possible reasons why the child might be out of school, and 3) what help the child would need to enrol or re-enrol in school. Schools are expected to report the results of this survey to the ESAO using Por Tor 05.
While Por Tor 04 collects some important data, gaps remain. It is relatively limited in its ability to reflect some of the key socio-cultural, school-related, and government-related barriers to access outlined in the previous section. For example, there is no way of reflecting if established barriers such as the language of instruction, the lack of documentation, under-resourced schools, or discrimination are preventing children from enrolling in school. Furthermore, it is not clear to what extent the form is actually used. One school director informed us that he had never seen any of the Por Tor forms before, another was only aware of the letters sent by ESAO staff to the parents of students who were not attending regularly (which target visible OOSC rather than invisible or semi-visible OOSC), while a third, who was aware of the Por Tor 04 form, reported that his school had never used it. He explained that if a child had dropped out, it was usually because they had moved to another area and were no longer in the household they were previously in; therefore, it was impossible to visit their parents at home to collect data.
Another reason the Por Tor 04 form may not be used is because it may duplicate some information collected using other Por Tor forms, Por Tor 1-7, which are used to report information about student registration and grades to the MOE’s DMC database and is linked to budget disbursement mechanisms, and the Strength and Difficulty Questionnaires, which collect socio-economic household data from families. Compounding the problem, there are no clear direct incentives for schools to dedicate resources to collecting OOSC data with Por Tor 04 forms.
Accordingly, a revised Por Tor 04 form was developed (see Annex 3 and 4) in collaboration with ESAO officials, school directors, teachers, and Save the Children staff. This improves on the original in the following ways:
• It revises the form from a household survey to a community survey
• It disaggregates estimates of Thai, ethnic minority, and children of migrant workers
• It includes all established significant barriers to access
• It identifies the most significant barriers to access in a community using a checkbox question and rating scale
Whereas the current form is a household survey of the OOSC child, the revised form collects data through interviews with community representatives. Although community surveys yield data that are less detailed and less accurate, they are also less time consuming and expensive than household surveys.
Another benefit of community surveys is that they may help to identify invisible and semi-visible OOSC while the current form only helps to identify visible OOSC. Hard-to-reach populations, especially migrants and ethnic minorities, often avoid contact with government officials.
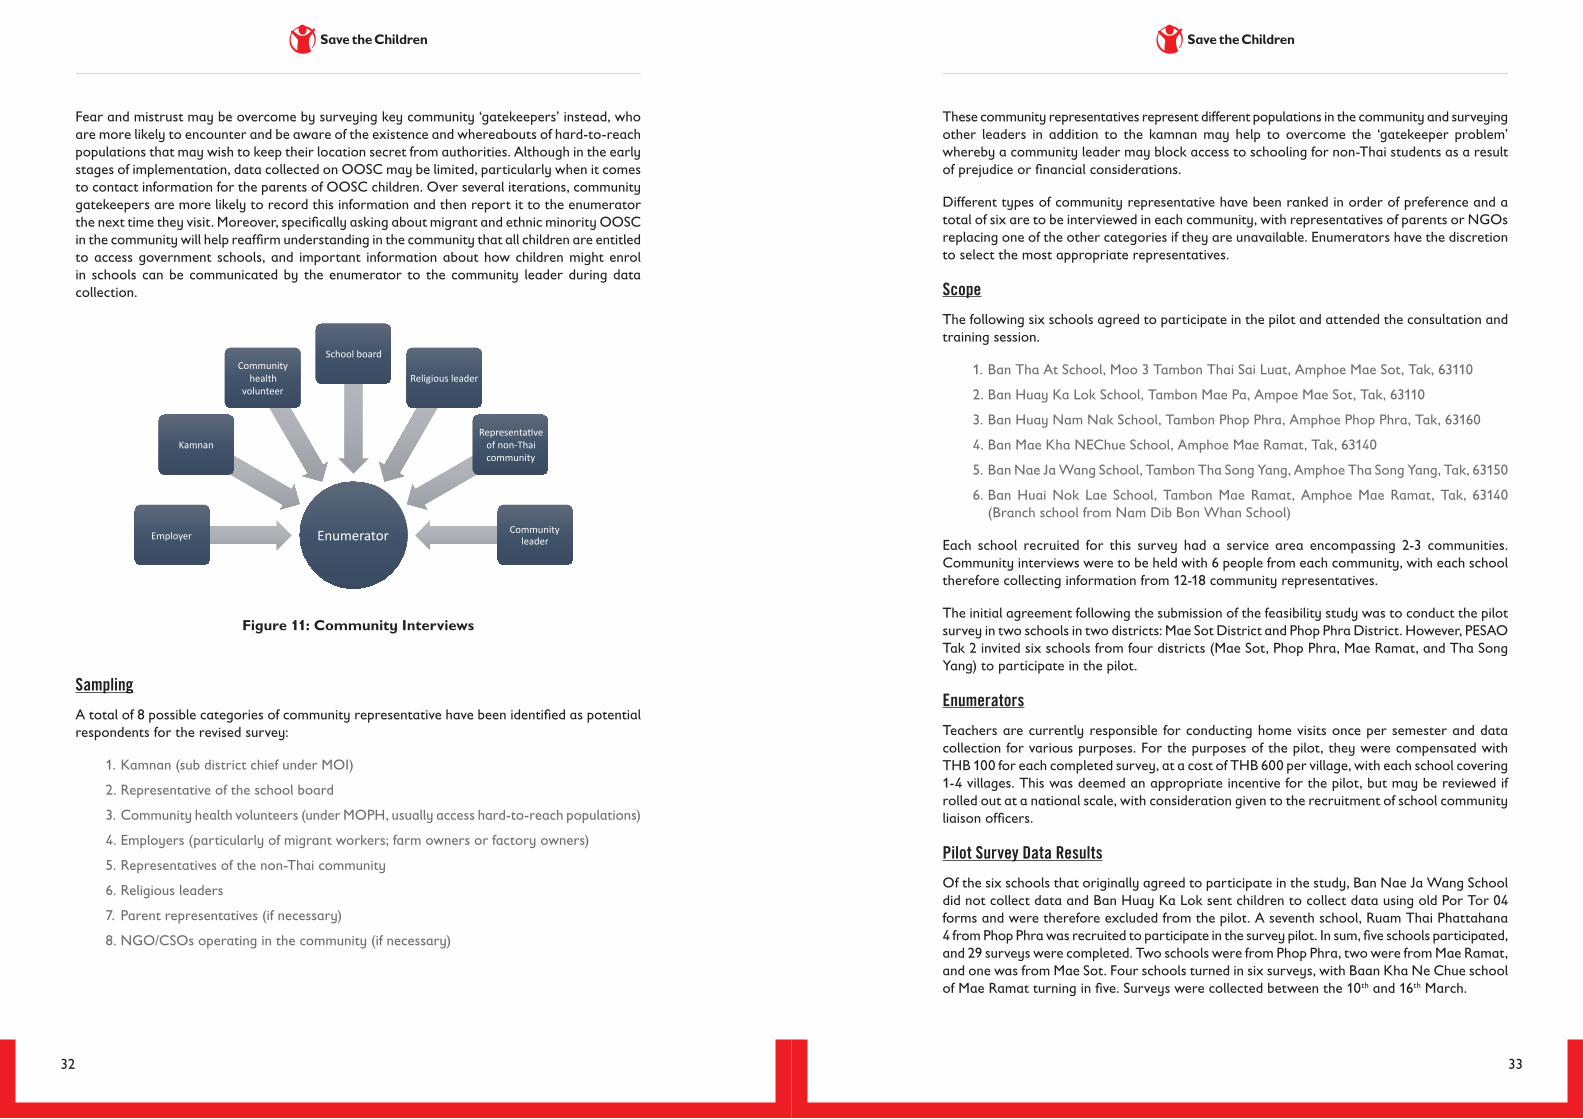
32 33
Fear and mistrust may be overcome by surveying key community ‘gatekeepers’ instead, who are more likely to encounter and be aware of the existence and whereabouts of hard-to-reach populations that may wish to keep their location secret from authorities. Although in the early stages of implementation, data collected on OOSC may be limited, particularly when it comes to contact information for the parents of OOSC children. Over several iterations, community gatekeepers are more likely to record this information and then report it to the enumerator the next time they visit. Moreover, specifically asking about migrant and ethnic minority OOSC in the community will help reaffirm understanding in the community that all children are entitled to access government schools, and important information about how children might enrol in schools can be communicated by the enumerator to the community leader during data collection.
�
EnumeratorEmployer
Kamnan
Communityhealth
volunteer
Schoolboard
Religiousleader
Representa:veofnon-Thaicommunity
Communityleader
Figure 11: Community Interviews
Sampling
A total of 8 possible categories of community representative have been identified as potential respondents for the revised survey:
1. Kamnan (sub district chief under MOI)
2. Representative of the school board
3. Community health volunteers (under MOPH, usually access hard-to-reach populations)
4. Employers (particularly of migrant workers; farm owners or factory owners)
5. Representatives of the non-Thai community
6. Religious leaders
7. Parent representatives (if necessary)
8. NGO/CSOs operating in the community (if necessary)
EmployerKamnanCommunity health volunteerSchool boardReligious leaderRepresentative of non-Thai communityCommunity leader
These community representatives represent different populations in the community and surveying other leaders in addition to the kamnan may help to overcome the ‘gatekeeper problem’ whereby a community leader may block access to schooling for non-Thai students as a result of prejudice or financial considerations.
Different types of community representative have been ranked in order of preference and a total of six are to be interviewed in each community, with representatives of parents or NGOs replacing one of the other categories if they are unavailable. Enumerators have the discretion to select the most appropriate representatives.
Scope
The following six schools agreed to participate in the pilot and attended the consultation and training session.
1. Ban Tha At School, Moo 3 Tambon Thai Sai Luat, Amphoe Mae Sot, Tak, 63110
2. Ban Huay Ka Lok School, Tambon Mae Pa, Ampoe Mae Sot, Tak, 63110
3. Ban Huay Nam Nak School, Tambon Phop Phra, Amphoe Phop Phra, Tak, 63160
4. Ban Mae Kha NEChue School, Amphoe Mae Ramat, Tak, 63140
5. Ban Nae Ja Wang School, Tambon Tha Song Yang, Amphoe Tha Song Yang, Tak, 63150
6. Ban Huai Nok Lae School, Tambon Mae Ramat, Amphoe Mae Ramat, Tak, 63140 (Branch school from Nam Dib Bon Whan School)
Each school recruited for this survey had a service area encompassing 2-3 communities. Community interviews were to be held with 6 people from each community, with each school therefore collecting information from 12-18 community representatives.
The initial agreement following the submission of the feasibility study was to conduct the pilot survey in two schools in two districts: Mae Sot District and Phop Phra District. However, PESAO Tak 2 invited six schools from four districts (Mae Sot, Phop Phra, Mae Ramat, and Tha Song Yang) to participate in the pilot.
Enumerators
Teachers are currently responsible for conducting home visits once per semester and data collection for various purposes. For the purposes of the pilot, they were compensated with THB 100 for each completed survey, at a cost of THB 600 per village, with each school covering 1-4 villages. This was deemed an appropriate incentive for the pilot, but may be reviewed if rolled out at a national scale, with consideration given to the recruitment of school community liaison officers.
Pilot Survey Data Results
Of the six schools that originally agreed to participate in the study, Ban Nae Ja Wang School did not collect data and Ban Huay Ka Lok sent children to collect data using old Por Tor 04 forms and were therefore excluded from the pilot. A seventh school, Ruam Thai Phattahana 4 from Phop Phra was recruited to participate in the survey pilot. In sum, five schools participated, and 29 surveys were completed. Two schools were from Phop Phra, two were from Mae Ramat, and one was from Mae Sot. Four schools turned in six surveys, with Baan Kha Ne Chue school of Mae Ramat turning in five. Surveys were collected between the 10th and 16th March.
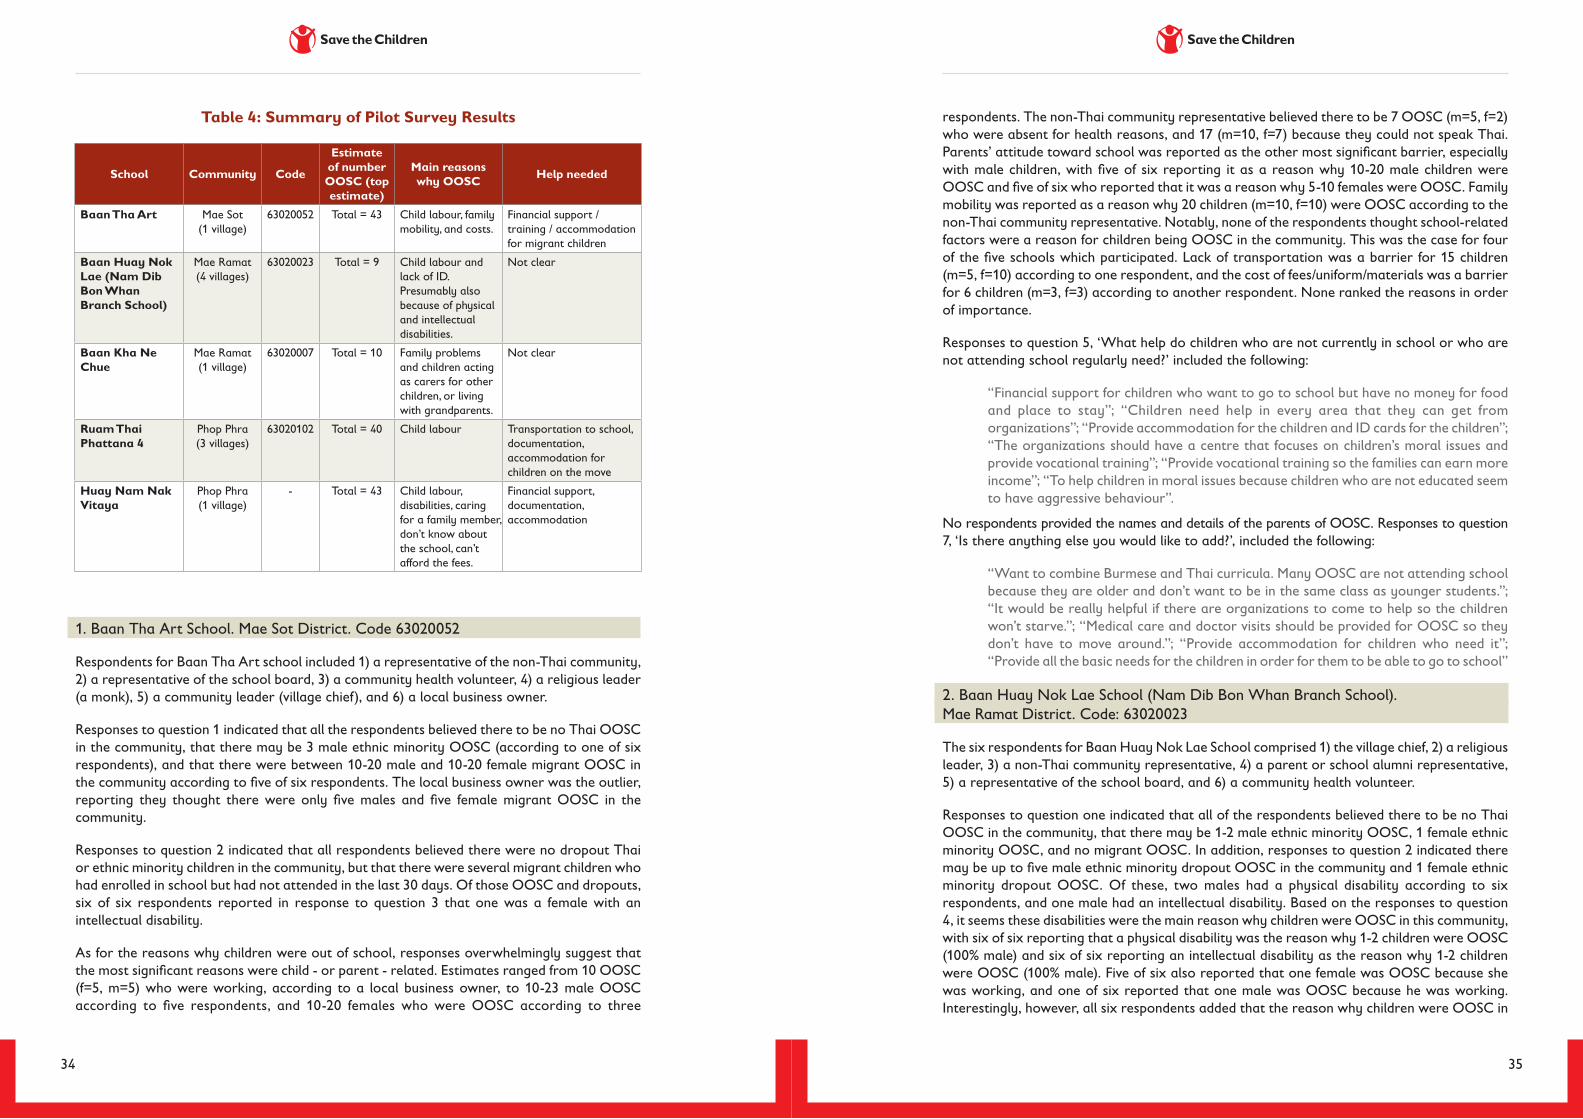
34 35
Table 4: Summary of Pilot Survey Results
School Community Code
Estimate of number OOSC (top estimate)
Main reasons why OOSC Help needed
Baan Tha Art Mae Sot (1 village)
63020052 Total = 43 Child labour, family mobility, and costs.
Financial support / training / accommodation for migrant children
Baan Huay Nok Lae (Nam Dib Bon Whan Branch School)
Mae Ramat (4 villages)
63020023 Total = 9 Child labour and lack of ID. Presumably also because of physical and intellectual disabilities.
Not clear
Baan Kha Ne Chue
Mae Ramat (1 village)
63020007 Total = 10 Family problems and children acting as carers for other children, or living with grandparents.
Not clear
Ruam Thai Phattana 4
Phop Phra (3 villages)
63020102 Total = 40 Child labour Transportation to school, documentation, accommodation for children on the move
Huay Nam Nak Vitaya
Phop Phra (1 village)
- Total = 43 Child labour, disabilities, caring for a family member, don’t know about the school, can’t afford the fees.
Financial support, documentation, accommodation
1. Baan Tha Art School. Mae Sot District. Code 63020052
Respondents for Baan Tha Art school included 1) a representative of the non-Thai community, 2) a representative of the school board, 3) a community health volunteer, 4) a religious leader (a monk), 5) a community leader (village chief), and 6) a local business owner.
Responses to question 1 indicated that all the respondents believed there to be no Thai OOSC in the community, that there may be 3 male ethnic minority OOSC (according to one of six respondents), and that there were between 10-20 male and 10-20 female migrant OOSC in the community according to five of six respondents. The local business owner was the outlier, reporting they thought there were only five males and five female migrant OOSC in the community.
Responses to question 2 indicated that all respondents believed there were no dropout Thai or ethnic minority children in the community, but that there were several migrant children who had enrolled in school but had not attended in the last 30 days. Of those OOSC and dropouts, six of six respondents reported in response to question 3 that one was a female with an intellectual disability.
As for the reasons why children were out of school, responses overwhelmingly suggest that the most significant reasons were child - or parent - related. Estimates ranged from 10 OOSC (f=5, m=5) who were working, according to a local business owner, to 10-23 male OOSC according to five respondents, and 10-20 females who were OOSC according to three
respondents. The non-Thai community representative believed there to be 7 OOSC (m=5, f=2) who were absent for health reasons, and 17 (m=10, f=7) because they could not speak Thai. Parents’ attitude toward school was reported as the other most significant barrier, especially with male children, with five of six reporting it as a reason why 10-20 male children were OOSC and five of six who reported that it was a reason why 5-10 females were OOSC. Family mobility was reported as a reason why 20 children (m=10, f=10) were OOSC according to the non-Thai community representative. Notably, none of the respondents thought school-related factors were a reason for children being OOSC in the community. This was the case for four of the five schools which participated. Lack of transportation was a barrier for 15 children (m=5, f=10) according to one respondent, and the cost of fees/uniform/materials was a barrier for 6 children (m=3, f=3) according to another respondent. None ranked the reasons in order of importance.
Responses to question 5, ‘What help do children who are not currently in school or who are not attending school regularly need?’ included the following:
“Financial support for children who want to go to school but have no money for food and place to stay”; “Children need help in every area that they can get from organizations”; “Provide accommodation for the children and ID cards for the children”; “The organizations should have a centre that focuses on children’s moral issues and provide vocational training”; “Provide vocational training so the families can earn more income”; “To help children in moral issues because children who are not educated seem to have aggressive behaviour”.
No respondents provided the names and details of the parents of OOSC. Responses to question 7, ‘Is there anything else you would like to add?’, included the following:
“Want to combine Burmese and Thai curricula. Many OOSC are not attending school because they are older and don’t want to be in the same class as younger students.”; “It would be really helpful if there are organizations to come to help so the children won’t starve.”; “Medical care and doctor visits should be provided for OOSC so they don’t have to move around.”; “Provide accommodation for children who need it”; “Provide all the basic needs for the children in order for them to be able to go to school”
2. Baan Huay Nok Lae School (Nam Dib Bon Whan Branch School).Mae Ramat District. Code: 63020023
The six respondents for Baan Huay Nok Lae School comprised 1) the village chief, 2) a religious leader, 3) a non-Thai community representative, 4) a parent or school alumni representative, 5) a representative of the school board, and 6) a community health volunteer.
Responses to question one indicated that all of the respondents believed there to be no Thai OOSC in the community, that there may be 1-2 male ethnic minority OOSC, 1 female ethnic minority OOSC, and no migrant OOSC. In addition, responses to question 2 indicated there may be up to five male ethnic minority dropout OOSC in the community and 1 female ethnic minority dropout OOSC. Of these, two males had a physical disability according to six respondents, and one male had an intellectual disability. Based on the responses to question 4, it seems these disabilities were the main reason why children were OOSC in this community, with six of six reporting that a physical disability was the reason why 1-2 children were OOSC (100% male) and six of six reporting an intellectual disability as the reason why 1-2 children were OOSC (100% male). Five of six also reported that one female was OOSC because she was working, and one of six reported that one male was OOSC because he was working. Interestingly, however, all six respondents added that the reason why children were OOSC in
36 37
the community was because they had to help parents work and that they needed ID cards to return to school.
Responses to question 6 indicated that three thought OOSC were the responsibility of teachers and community leaders, one thought it was the community leader’s responsibility, and one thought it was no one’s responsibility. Usefully, respondents provided addresses for OOSC in the community which have been summarised as follows:
1. Manee, F, 15 years. Moo 2, Mae Ramat. Moves all the time / Working.
2. Moborobo, M, 14 years. Physical disability.
3. Nick, M, 9 years. Moo 2, Mae Ramat. Physical disability.
4. Manberry, F, 15 years. Moo 2. Dropped out.
5. Mandy, F, 13 years. Last grade completed: K2. Moo 2. Mae Ramat.
6. Ann, F, 15 years. Last grade completed: G1. Intellectual disability.
None suggested how to return these OOSC to school.
3. Ban Kha Ne Che School. Mae Ramat, Code: 63020007
Five respondents for Ban Kha Ne Che School comprised 1) two school board representatives, 2) a school alumnus, 3) a community leader, and 4) a religious leader. The data collector did not follow sampling instructions and selected two from one category, and did not select any representatives of the non-Thai community or a community health volunteer.
Two of five reported 2 Thai (m=2), and 3 ethnic minority OOSC (m=3) who had never been to school. The same respondents reported the same number of dropouts (3 male Thai and 2 male ethnic minority OOSC). Given the identical responses, and that they did not follow the sampling instructions, it may be that the data collector was confused by the difference between never enrolling in school and children dropping out. Of those OOSC, two of five reported that one female was OOSC due to an intellectual disability.
In addition, one respondent stated that one female did not go to school because her parents did not know about the school, which is an entry barrier for the child. Examples categorized as other reasons include: one respondent reported “family problem, parents separated, parents working in other provinces, the children are living with grandparents”; another reported “caring for children, family problems”. One gave the following details for an OOSC in their community: “1. Diana, F, Age 13, Reason for being out of school, intellectual disability”. None suggested how OOSC could be brought back to school.
4. Ruam Thai Patthana 4 School, Phop Phra, Code: 63020102
Six respondents for Ruam Thai Patthana 4 School comprised: 1) two community leaders (one of Moo 5 community, another of Moo 14 community; 2) two community health volunteers (presumably also one from each community); 3) one representative of the school board; and 4) one school alumnus. Sampling instructions were also not followed. If the school covers several communities, six surveys are supposed to be collected in each community, rather than six between them. While there were no non-Thai community or religious community respondents, the community health volunteers should be aware of non-Thai OOSC in their communities.
Respondents believed there to be 0 Thai OOSC and 0 Thai dropouts in their communities, and there may be up to 5 ethnic minority OOSC (m=5) and up to 25 migrant OOSC (m=17, f=8)
according to one of six respondents, the community leader of Moo 5 community. There may also be 5 ethnic minority dropout OOSC (m=5) and five migrant dropout OOSC (m=5) according to another one of the six respondents. Of these OOSC, one female may be OOSC due to an intellectual disability. There were no responses to 4 a) or b) asking why these children were OOSC. Nonetheless, explanations given for why children were OOSC in the community included the following:
“Children have to help parents work and sometimes have to take care of a sick person in the family. School is too far from the children’s house.”; “Children have to work to bring income to the family”; “Parents move often and children have to work to support the family”; “Children have to help parents work and some children have no place to stay so they became a monk and study”; “Parents let the children move to other areas and do not follow up and don’t let the children go to school”; “Children have to work”.
Responses to question 5, which asked about what help children needed, included the following: “Provide transportation and documents for children, (children have no documents to enrol at school), children are always on the move”; “provide accommodation”; “need accommodation/dormitory for children who are on the move”. Responses to question 7, included: “Most Burmese migrant children are attending MLC”; “most of the Burmese migrant children attend MLC because they provide transportation and there is no school fee. Children can enrol in school without any documents”; “most children who are married won’t attend the school, and when Burmese children reach age 15, they normally help parents work”.
5. Huay Nam Nak Vitaya School, Phop Phra, Code: [not given]
Six respondents for Huay Nam Nak Vitaya School comprised 1) two parent representatives or school alumni; 2) one community health volunteer; 3) two community leaders, the village chief and the village chief’s assistant; 4) one representative of the school board. Sampling instructions given during the training were again not followed.
Four of six respondents estimated there were 1 or 2 Thai children (all male) OOSC in the community, but possibly up to 15 (m=12, f=3) according to one parent or alumnus. One of six reported there may be 6 ethnic minority OOSC (m=4, f=2) and 6 migrant OOSC (m=5, f=1). In addition, it is likely there are 4 Thai dropout OOSC (m=3, f=1) based on two of six responses, and possibly 7 ethnic minority dropout OOSC (m=5, f=2) and 5 migrant dropout OOSC (m=4, f=1). This may be an over estimate of the OOSC in the community as the majority of responses estimated the number of OOSC to be much lower. Of these OOSC, it seems 2-3 are males with physical disabilities according to six of six respondents.
As for the reasons why the children were OOSC, it appears that several may be working. One respondent estimated 10 (m=10) were working, another estimated 4 were working (m=4). Another 2-3 were not in school due to a disability according to six of six respondents. 2 (m=2) were not in school because they did not speak Thai. 2-3 (m=100%) were not in school because they were caring for a sick parent or sibling according to two respondents. 1-4 (m=1-3, f=1) were not in school because their family moves often for work; 2 (m=2) were OOSC because their parents did not know about the school; 1-2 males, and possibly 1 female were OOSC because their family could not afford learning materials / school fees / or uniforms, and up to 1-2 males were OOSC because they had no ID. One respondent ranked the barriers to accessing school in the community in the following order (the only one of 29 respondents to do so): 1. Child is working, 2. Child is caring for a sick family member, 3. Children’s family moves all the time, 4. Parents don’t know about the school, and 5. Can’t afford learning materials / uniform / fees. Explanations for why children were OOSC in the community included the following:
38 39
“Children need to take care of parents or younger siblings, children have physical disabilities, have to work.”; “Working or having a physical disability and can’t care for themselves”; “Working or looking after younger siblings”; “Don’t want to go to school, can’t afford to go to school, often move”; “Often move, can’t afford school supplies (uniforms, school fee), physical disability”; “Help parents work, have financial issue, often move”.
These indicate that socio-economic conditions are a major factor for OOSC in this community. Supporting this interpretation, responses for how to bring OOSC to school in this community included the following:
“Financial support, and provide daily basic needs” “financial support, and provide daily basic needs”; “financial support”; “provide scholarship and accommodation”; “financial support, ID or other legal documents, support for disabled children”; “financial support, and accommodation”.
Respondents provided the following names and addresses of OOSC in the community:
Name Sex Age Address Last grade completed
Reason for being out of school Help needed
Chris M 13 Moo 4, Huay Nam Nak, Phop Phra
Physical disability. Financial support and family support.
Art M 10 Moo 4, Huay Nam Nak, Phop Phra
Dropped out. Follow up and financial support. Absent from school often, talk to the parents.
Anderson M 14 Moo 4, Huay Nam Nak, Phop Phra
Moved to Myanmar. Financial support and solving family issue.
Son M 15 Moo 4, Huay Nam Nak, Phop Phra
Physical disability. School for disabled children and financial support and school supplies.
Sunday M 11 Moo 4, Huay Nam Nak, Phop Phra
Physical disability. Financial support and school supplies.
Pat F 12 Moo 4, Huay Nam Nak, Phop Phra
Grade 6 Absent more than 30 days.
Pret F 14 Moo 4, Huay Nam Nak, Phop Phra
Grade 8 Changed school often because of failing in different subjects
Tom M 14 Moo 4, Huay Nam Nak, Phop Phra
Grade 8 Absent from school often. Talk to the parents.
Candy M 15 Moo 4, Huay Nam Nak, Phop Phra
Physical disability.
* Pseudonyms have been used to protect the identity of vulnerable children, no real names are included in this report.
In sum, of the five schools that participated in the pilot survey data collection, all only surveyed 6 respondents in total, rather than 6 respondents for each community in their service area. There are usually 1-3 communities in each school service area. Two schools that joined the pilot after the training did not follow the sampling instructions.
DISCUSSION
OOSC Definition and Age RangeThe lack of a clear definition of OOSC presents a significant obstacle in estimating the number of OOSC. The Quality Learning Foundation uses the age range 5-18 years, UNICEF uses 6-11 and 6-18 years, while the pilot study established that OBEC uses 7-15. The original intention was to use the international definition of OOSC, as primary age (6-11 years) children but also including OOSC adolescents (12-18). However, during consultations with ESAO officials and school directors, requests were made to the team to use the ages of 7-15 years as this is the compulsory school age range and that which is used in existing mechanisms. Nonetheless, as earlier data collection and analysis had used other age ranges, these were used in the report when it was not practical to revise them to 7-15.
Table 5: Nationwide OOSC Estimates
OOSC OOSC adolescents
QLF (2015) 247,229 (7-15 years)
579,229 (16-18 years)
UNICEF (2014) 380,231 (6-11 years)
203,770 (12-18 years)
UNESCO (2014) 200-300,000 (6-11 years) 100,000
Table 6: Out-of-School Children in Thailand in Academic Year 2015 (QLF)
No. of Children Percentage of children (%)
Total Attending School
Not Attending
SchoolTotal Attending
School
Not Attending
School
Pre-school (3-6 Years old) 3,098,809 2,841,648 257,161 100 91.70 8.30
Compulsory Schooling (7-15 Years old) 7,239,047 6,991,818 247,229 100 96.58 3.42
High School (16-18 Years old) 2,598,002 2,018,770 579,232 100 77.70 22.30
Total 12,935,858 11,852,236 1,083,622 100 91.62 8.38
40 41
OOSC Estimates in Tak Province
Mechanism OneUsing the first mechanism to estimate OOSC in Tak Province: MOI Civil Registration (7-15 years) – MOE’s EMIS = OOSC (7-15 years) with 13-digit ID, we estimated there to be 247,229 OOSC (7-15 years) nationwide (3.4%) and 33,758 (30.6%) in Tak Province. Using the second mechanism at the ESAO level, incorporating MOPH population data and MLC enrolment data, we estimated there to be 24,776 (25.18%) OOSC in the five border districts of Tak Province when treating students enrolled in MLCs as in school, and 37,624 (38.23%) when treating them as out of school. The second mechanism is considered as the more reliable estimate as it includes population data for undocumented residents as well as MLC enrolment data.
Conclusions that we may draw from this include the following:
1. Tak has a high OOSC rate among both Thai and non-Thai and interventions need to be targeted to both.
2. The OOSC rate would be much higher if MLCs were not recognised, or if they were to close and the children had not been enrolled in Thai government schools.
3. MOI population data for Tak Province significantly underestimates the size of the population in Tak Province. The biggest challenge in estimating OOSC in Tak Province is therefore the presence of a large shadow population which may not be captured in government administrative data.
Although the MOPH is reluctant to share data, it may be obtained through the Tak Health Information Centre, which may then be used to estimate the number of undocumented OOSC at the district level.
Using method one, of those children between the ages of 5-18 years (i.e. including non-compulsory education) included in the MOI database, 34.82% of them are not in MOE schools in Tak Province. This is second only to Phuket (44.66%). A significant number of children in Phuket are enrolled in MOI schools however (19,835), meaning that when MOI and MOE enrolment are combined, Tak Province has the highest rate of OOSC in the country at 27.5% (using existing data, not the estimate of 30.6% presented here). This is followed by Bangkok, with a rate of 24.91% (266,389 5-18 years).
Given that these estimates are based on existing government data, significant progress could be made on the OOSC issue if the MOI formally shared population data with the MOE. The MOE would be able to cross check enrolment data with MOI population data and identify children between the ages of 7-15 who are not enrolled in school. While informal data sharing between the MOI and ESAO 2 takes place in Tak Province, it is only for children of 4 years of age to invite them to enrol in school.
To address the OOSC issue nationwide, the Royal Thai Government (RTG) should therefore address the issue of OOSC in Tak Province as a priority area for targeted interventions. Other inferences that may be made from the OBEC data is that Phop Phra and Mae Ramat have relatively low percentages of undocumented “G” students enrolled in government schools at 11.5% and 12.3%, respectively. The results of the pilot survey presented below may give an indication as to why this is the case and what help is needed for them to enrol in school. Given the small sample size of five schools, and the purposive sampling used for selecting the schools to participate in the survey, the findings may not, however, be generalisable.
Mechanism TwoGiven that relatively sound administrative data on the shadow population are held by the MOI and MOPH, which could help estimate the numbers of OOSC and their whereabouts, and the finding that the shadow population of Tak Province is more likely to include OOSC, mechanism two should focus on identifying the most important barriers to accessing the service area of each school. If the ESAO is aware of which barriers are most significant for a given service area, and can highlight ‘hotspots’ of service areas with high OOSC rates, interventions may be targeted in certain areas to efficiently and effectively address the OOSC issue. Given the high administrative burden currently placed on teachers, mechanism two could also encourage community ownership of the OOSC problem by institutionalising regular communication between schools and community leaders on the topic. Both are key objectives reflected in the revised Por Tor 04 form.
Data which were collected using the revised Por Tor 04 form suggest that there may be up to 145 OOSC in communities served by the five schools which participated, averaging 29 OOSC per school. It should be noted that this is a high estimate of the OOSC known to community leaders, based on the highest estimate of each respondent, but it may nonetheless still miss some invisible OOSC. Among these OOSC, child labour, mobility, disabilities, caring for family members, and documentation were reported as being the most important barriers to access. Financial support, transportation to school, documentation, and accommodation for mobile children were reported as possible ways of encouraging OOSC to return to school. School-related barriers were not reported to be a significant barrier, but this may be attributable to the selective sampling of schools participating in the study.
Other biases may also have resulted from this sampling method, and conclusions for these five schools therefore may not be generalizable. Barriers to access are diverse and will vary significantly from school to school, yet all schools included in this pilot were welcoming to non-Thai citizens and had high numbers of enrolled migrants. We would therefore expect the mobility of migrant populations to be overrepresented in this study, and other barriers, such as discrimination against migrant communities by school and community leaders, who sometimes act as gatekeepers and may grant or deny access to schools, to be underrepresented. To overcome this bias, the pilot should be expanded to include more schools, particularly ones with relatively low enrolment of “G” students.
Another observation from the pilot study is that there is a significant administrative and reporting burden on education officials. One school director expressed frustration at the paperwork involved when following up on the dropout children of migrant parents. This may therefore be a further barrier to access for children perceived to be mobile. Data from the survey were analysed by the consultant team, but given the high workload of ESAO staff, at least one extra staff member should be recruited in each PESAO Tak 2 to be responsible for OOSC data collection, analysis, and follow-up. Perhaps the most significant limitation of this aspect of the study is that it was unable to survey the OOSC themselves. This is an unsurprising outcome given that the study identified hard-to-reach populations as the most important target group, and is a necessary trade-off when attempting to overcome barriers of fear and mistrust among these populations associated with the community interview approach adopted in the study.
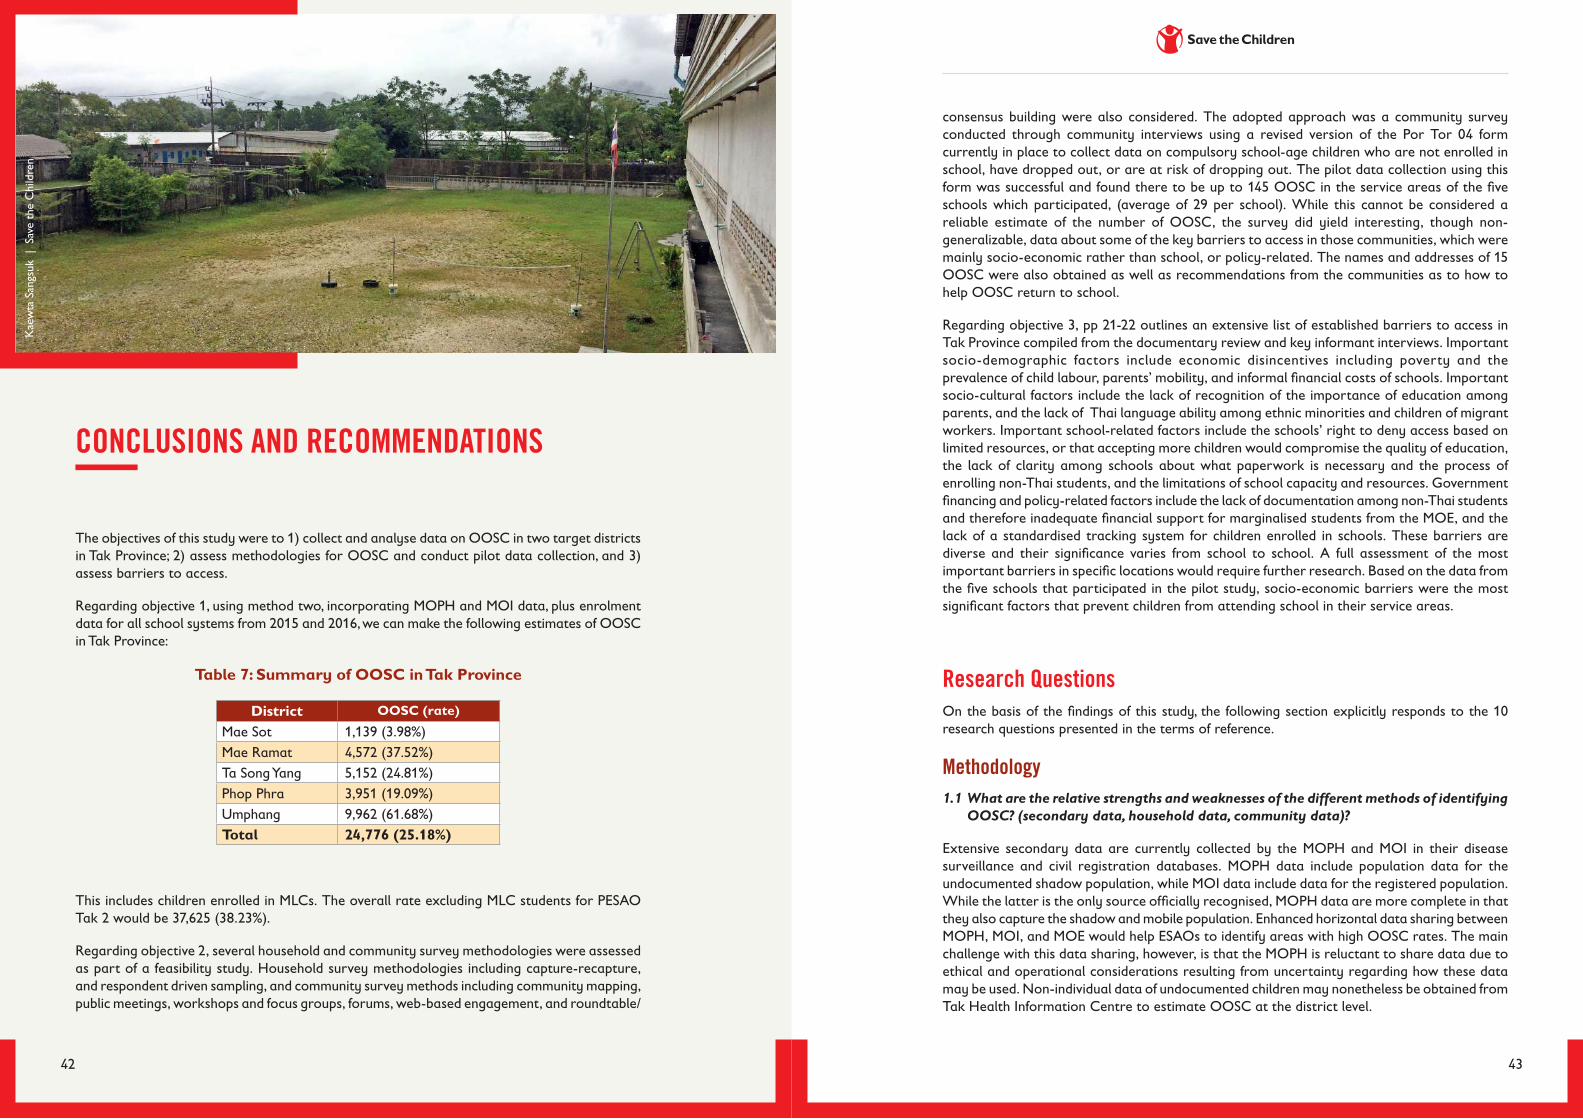
42 43
CONCLUSIONS AND RECOMMENDATIONS
The objectives of this study were to 1) collect and analyse data on OOSC in two target districts in Tak Province; 2) assess methodologies for OOSC and conduct pilot data collection, and 3) assess barriers to access.
Regarding objective 1, using method two, incorporating MOPH and MOI data, plus enrolment data for all school systems from 2015 and 2016, we can make the following estimates of OOSC in Tak Province:
Table 7: Summary of OOSC in Tak Province
District OOSC (rate)
Mae Sot 1,139 (3.98%)Mae Ramat 4,572 (37.52%)Ta Song Yang 5,152 (24.81%)Phop Phra 3,951 (19.09%)Umphang 9,962 (61.68%)Total 24,776 (25.18%)
This includes children enrolled in MLCs. The overall rate excluding MLC students for PESAO Tak 2 would be 37,625 (38.23%).
Regarding objective 2, several household and community survey methodologies were assessed as part of a feasibility study. Household survey methodologies including capture-recapture, and respondent driven sampling, and community survey methods including community mapping, public meetings, workshops and focus groups, forums, web-based engagement, and roundtable/
consensus building were also considered. The adopted approach was a community survey conducted through community interviews using a revised version of the Por Tor 04 form currently in place to collect data on compulsory school-age children who are not enrolled in school, have dropped out, or are at risk of dropping out. The pilot data collection using this form was successful and found there to be up to 145 OOSC in the service areas of the five schools which participated, (average of 29 per school). While this cannot be considered a reliable estimate of the number of OOSC, the survey did yield interesting, though non-generalizable, data about some of the key barriers to access in those communities, which were mainly socio-economic rather than school, or policy-related. The names and addresses of 15 OOSC were also obtained as well as recommendations from the communities as to how to help OOSC return to school.
Regarding objective 3, pp 21-22 outlines an extensive list of established barriers to access in Tak Province compiled from the documentary review and key informant interviews. Important socio-demographic factors include economic disincentives including poverty and the prevalence of child labour, parents’ mobility, and informal financial costs of schools. Important socio-cultural factors include the lack of recognition of the importance of education among parents, and the lack of Thai language ability among ethnic minorities and children of migrant workers. Important school-related factors include the schools’ right to deny access based on limited resources, or that accepting more children would compromise the quality of education, the lack of clarity among schools about what paperwork is necessary and the process of enrolling non-Thai students, and the limitations of school capacity and resources. Government financing and policy-related factors include the lack of documentation among non-Thai students and therefore inadequate financial support for marginalised students from the MOE, and the lack of a standardised tracking system for children enrolled in schools. These barriers are diverse and their significance varies from school to school. A full assessment of the most important barriers in specific locations would require further research. Based on the data from the five schools that participated in the pilot study, socio-economic barriers were the most significant factors that prevent children from attending school in their service areas.
Research QuestionsOn the basis of the findings of this study, the following section explicitly responds to the 10 research questions presented in the terms of reference.
Methodology 1.1 What are the relative strengths and weaknesses of the different methods of identifying
OOSC? (secondary data, household data, community data)?
Extensive secondary data are currently collected by the MOPH and MOI in their disease surveillance and civil registration databases. MOPH data include population data for the undocumented shadow population, while MOI data include data for the registered population. While the latter is the only source officially recognised, MOPH data are more complete in that they also capture the shadow and mobile population. Enhanced horizontal data sharing between MOPH, MOI, and MOE would help ESAOs to identify areas with high OOSC rates. The main challenge with this data sharing, however, is that the MOPH is reluctant to share data due to ethical and operational considerations resulting from uncertainty regarding how these data may be used. Non-individual data of undocumented children may nonetheless be obtained from Tak Health Information Centre to estimate OOSC at the district level.
Kae
wta
San
gsuk
| S
ave
the
Chi
ldre
n
44 45
Household data may yield more detailed information about individuals, but when it comes to OOSC households, are challenging to identify, and when a child drops out of school, it is often because their family has vacated their residence posing a challenge for data collection. While community data are less detailed and less reliable, institutionalising a community survey may help encourage community ownership of the OOSC issue and overcome some of the barriers to collecting data on the shadow population.
1.2 What are the best methods for over-coming particular barriers associated with collecting data on migrant OOSC (mistrust, fear, mobility of populations)?
Mobility, fear, and distrust are some of the most significant barriers to collecting data on migrant OOSC, as well as ethnic minority OOSC. This study was not able to establish an effective method to overcome the issue of mobility, although fear and distrust may be overcome to some extent by collecting data from intermediaries, specifically, key community representatives such as community health volunteers, representatives of the non-Thai community in a given area, and religious leaders.
1.3 What are the costs implications of the different models?
There are 124 OBEC schools in the five border districts of Tak Province. To collect data using the community survey proposed in this study, at a compensation rate of THB 100 for each survey collected, would cost between THB 148,000 - THB 223,200 based on the calculation that each school has a service area that includes 2-3 communities and the need to interview 6 community leaders in each community. Alternatively, if the survey just sought six responses per school, the tool could be deployed for THB 12,400.
1.4 What is the most viable and cost effective model for scaling up efforts to identify migrant OOSC in a further 3 districts?
The most cost effective and viable model to scale up efforts to identify migrant OOSC in a further three districts would be to roll out the revised Por Tor 04 form in Umphang and Mae Sot. Umphang has a remarkably high OOSC rate of 61.28%, while it is hard to establish how many OOSC are in Mae Sot as significant numbers of children may be registered in a different district according to population data, yet they attend school in Mae Sot district. This means that identifying actual rate of OOSC in Mae Sot is very challenging without individual data being shared by the MOI and MOPH to cross check with school enrolment data.
Expansion of Data2.1 How many migrant OOSC are there in target areas?
Method 2, which was used to estimate numbers of OOSC, does not discriminate between Thai and non-Thai OOSC. This decision was taken in line with the EFA policy to encourage authorities to treat OOSC as OOSC. Nonetheless, we have estimated there to be 7,315 undocumented OOSC in Mae Sot, 4,007 in Phop Phra, and 9,069 in Umphang. This estimate is based on a) the (unrealistic) assumption that there are no non-Thais in other education systems; and b) the inclusion of all children of any age, not just 7-15, enrolled in OBEC schools.
2.2 What are the profiles, needs and interests of OOSC (gender, age, schooling, socio-economic, work status, interest in education etc.)?
The profiles, needs, and interests of OOSC (gender, age, schooling, work status, interest in education, etc.) have not yet been established and may not be established using the proposed mechanisms. Community health volunteers may be able to collect such data.
2.3 To what extent has existing government data been capturing the numbers and needs of OOSC (education, health, population, labour data sources)?
Existing government education data have been capturing the numbers of visible OOSC who have dropped out year-on-year, although dropouts are likely still underreported as there is currently no way for the MOE to verify dropout data and enrolment projections submitted by each school in the country. Mechanisms are in place for OBEC schools to follow up on dropout students (visible OOSC) and gather information about their needs, although current data and mechanisms do not currently capture the needs of semi-visible and invisible OOSC. Moreover, these mechanisms do not seem to exist in other school systems, such as the MLCs, for example. Consultations were held with the director of the ONIE who indicated that they would be interested in working on a similar project for migrant learning centres.
Education data have not been capturing the numbers and needs of semi-invisible OOSC who are included on the MOI database. While PESAO Tak 2 in Tak Province informally receives information once per year about 4-years old from MOI to invite their parents to enrol them in school, it does not currently receive information about other school age children in their districts from the MOI. However, even MOI database is fundamentally limited in the data on the undocumented population that is not included. Approximately 30% of children enrolled in OBEC schools in PESAO Tak 2, Tak Province are undocumented (and are therefore assigned “G” numbers by the MOE), and it is not clear how many undocumented children reside in Tak Province. This invisible population of OOSC may be rendered semi-visible using MOPH disease surveillance data. This database is updated annually, with disease data updated monthly. Labour data, deemed to be incomplete and out of date, were not analysed during this study.
2.4 Given the current government structures, policies, budget and priorities, what are the specific steps and recommendations for scaling-up efforts to identify migrant OOSC across Thailand?
Before scaling-up efforts nationwide, a second pilot survey should be conducted with a larger sample using the revised form. Efforts should also be directed toward encouraging horizontal data sharing and supporting analysis of the secondary data. While MOUs at the central level between the MOE and MOI, and the MOE and MOPH to formalise sharing of population data on school-age children would be preferable, the current government structures and on-going relationships between Save the Children and the MOI at the district level in Tak Province relating to the issuance of identity cards to “G” students may be the most appropriate place to start. Success in these districts could help to justify scaling up the relationship nationwide. To this end, meetings should be held between representatives of different stakeholders in the OOSC issue at the district level in Tak Province, including, but not limited to, the MOE, MOI, MOPH, Ministry of Social Development and Human Security (MSDHS), and civil society. The current CDO in Mae Sot District has expressed his willingness to the consultant team to cooperate in such an endeavour.
46 47
Barriers to Access3.1 What are the key barriers perceived by OOSC to education access?
Key barriers to access perceived by community representatives are mainly socio-economic, with many children working to help support their families. However, these barriers are not generalizable to the three districts included in the pilot survey, and further data collection would need to be conducted with a larger and more representative sample of schools in PESAO Tak 2.
3.2 What are the profiles, needs and interests of OOSC (gender, age, schooling, work status, interest in education etc.)?
The profiles, needs, and interests of OOSC have not been established.
Recommendations
Policy Recommendations to the Royal Thai Government1. Define the Term “Out-of-School Children”
The Royal Thai Government could consider defining the term “Out-of-School Children” for Thailand through an inclusive process involving all relevant governmental and non-governmental agencies.
2. Improve Thailand’s Out-of-School Children Data System
The Royal Thai Government could consider committing to improving the country’s OOSC data system. This may include:
a) MOI continuing efforts to ensure all residents of Thailand, Thai or non-Thai, are included in the Civil Registration database. This includes:
I) Issuing documentation to ethnic minorities, and
II) Registering irregular migrant workers and their dependents.
b) MOE making a long-term commitment to strengthen the EMIS database. This is the repository for individual data of all children enrolled in schools nationwide.
The database could also include real-time data attendance checks.
A fully digitalised and centralised EMIS with individual data for students enrolled in schools under all educational pathways in Thailand would:
I) Make it much easier to establish the number of children in the country in school, and on a real-time basis.
II) Optimise the utilisation of MOE’s human resources, by, inter alia:
i) Reducing duplication of data collected by schools and ESAOs using different forms, such as the Por Tor forms, and Strength and Difficulty Questionnaires.
ii) Allowing education officials to follow up on children who have dropped out or moved to another province at the click of a button, and thereby also eliminating the present need for ESAO officials to send letters to their counterparts in other ESAO offices around the country to follow up to see if a student who has dropped out of a school in their service area has turned up at another school somewhere else in the country.
III) Help identify and support at-risk students. The MOE could also regularly submit the number of at-risk students to all schools and provide additional financial support to schools that help to support children at high risk of becoming OOSC and to prevent dropouts.
c) The MOE may consider reviewing data collection tools and resources currently allocated to schools and ESAO offices to identify OOSC. This may include considering lessons learnt from a pilot research project conducted in Tak Province with a view to scaling up these practices nationwide. These include:
I) Reviewing, consolidating, and digitalising data collection through Por Tor forms, other Por Tor forms, and Strength and Difficulty Questionnaires, as there may be significant overlap in the data collected.
II) In particular, the Por Tor 04 form may be revised to include missing data relevant to understanding the OOSC issue in the local context and to collect data through a community survey rather than a household survey, since the latter is not effective with hard-to-reach and mobile populations. While this would yield less detailed information about individual OOSC, it could broaden the scope of the survey and institutionalise regular communication between schools and key ‘gatekeepers’ in the community such as kamnans, phuyaibaans, religious leaders, business owners, community health volunteers, and representatives of the non-Thai community, on the OOSC issue. This would encourage greater community ownership of the OOSC issue and help to identify hard-to-reach populations who may not appear in administrative data.
III) The MOE could also consider allocating community liaison officers to schools who would be responsible for OOSC data collection and follow-up, and one dedicated staff per ESAO to supervise OOSC data collection and analysis.
3. Formalise intra-governmental data sharing and collaboration
The Royal Thai Government could consider enhancing horizontal data sharing and collaboration between ministries, and vertical data sharing between authorities at the central, provincial, and district levels.
a) Horizontal data sharing and collaboration between the MOI, MOE, and MOPH would allow the MOE to make the best use of existing data and save considerable resources. Arrangements may be formalised through inter-ministerial MOUs, preferably at the national level.
I) If the MOI and MOPH shared population data with the MOE, this would allow the MOE to cross check these data with school enrolment data to better estimate the number of OOSC in each and every Education Service Area (ESA) across Thailand.
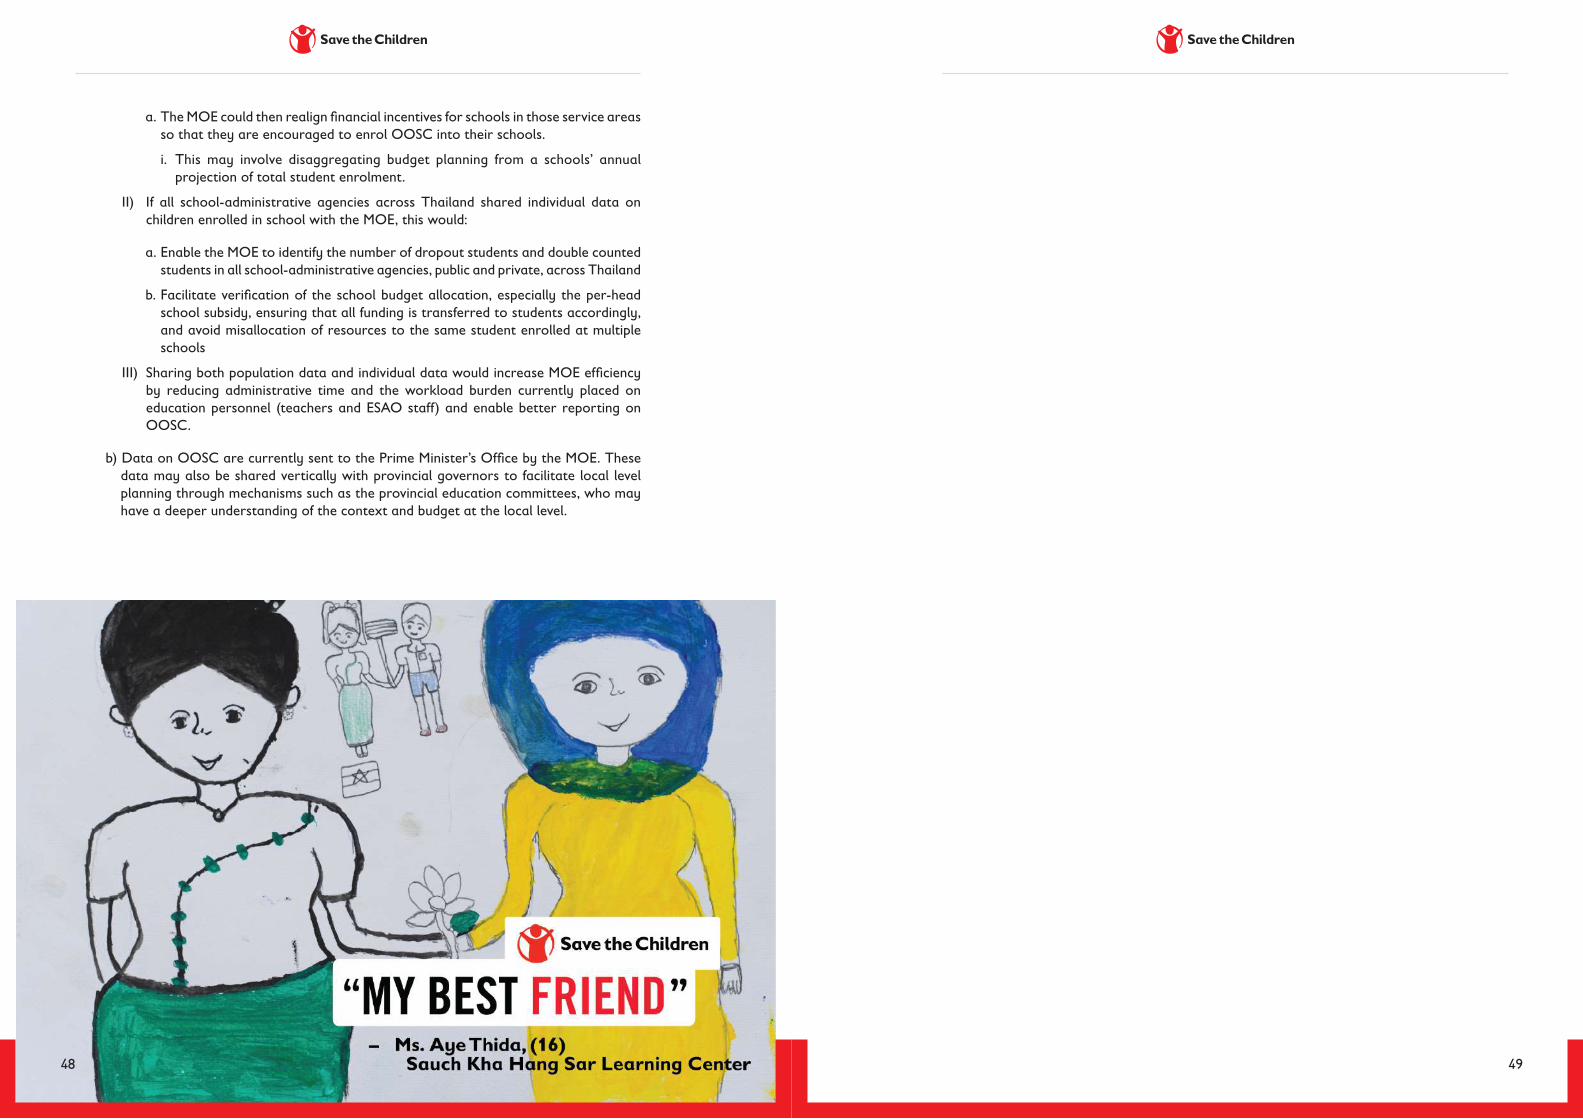
48 49
a. The MOE could then realign financial incentives for schools in those service areas so that they are encouraged to enrol OOSC into their schools.
i. This may involve disaggregating budget planning from a schools’ annual projection of total student enrolment.
II) If all school-administrative agencies across Thailand shared individual data on children enrolled in school with the MOE, this would:
a. Enable the MOE to identify the number of dropout students and double counted students in all school-administrative agencies, public and private, across Thailand
b. Facilitate verification of the school budget allocation, especially the per-head school subsidy, ensuring that all funding is transferred to students accordingly, and avoid misallocation of resources to the same student enrolled at multiple schools
III) Sharing both population data and individual data would increase MOE efficiency by reducing administrative time and the workload burden currently placed on education personnel (teachers and ESAO staff) and enable better reporting on OOSC.
b) Data on OOSC are currently sent to the Prime Minister’s Office by the MOE. These data may also be shared vertically with provincial governors to facilitate local level planning through mechanisms such as the provincial education committees, who may have a deeper understanding of the context and budget at the local level.
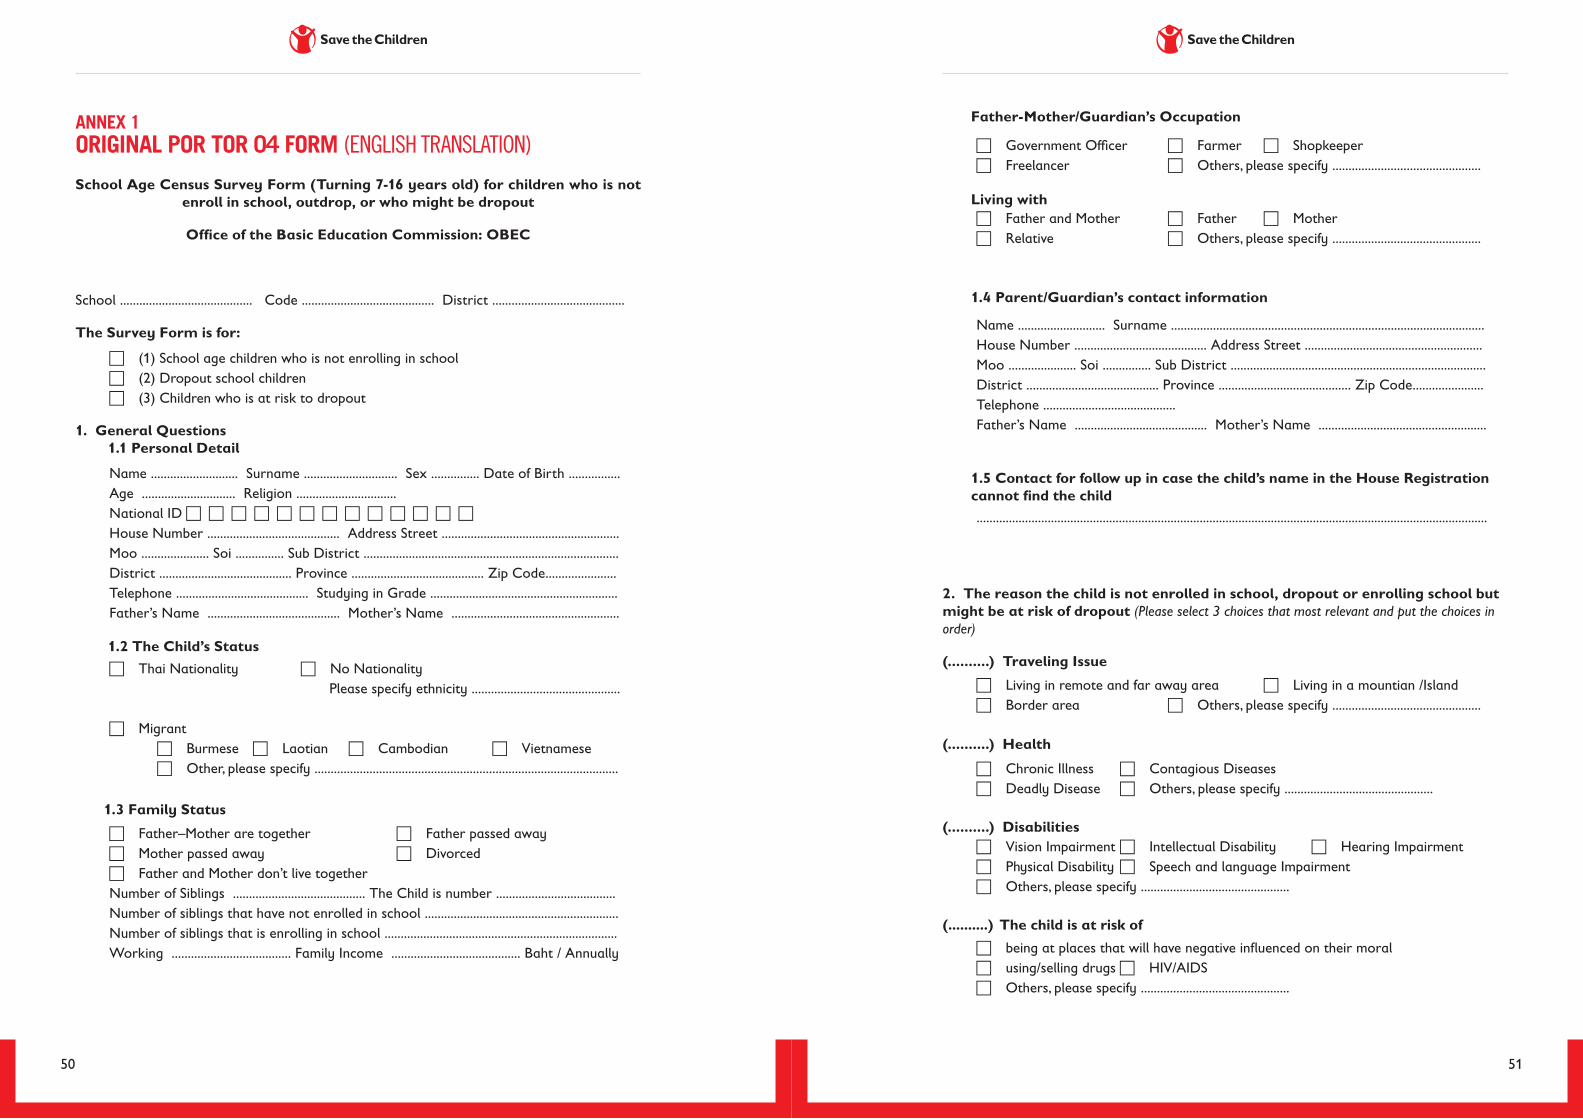
ANNEX 1 ORIGINAL POR TOR 04 FORM (ENGLISH TRANSLATION)
50 51
School Age Census Survey Form (Turning 7-16 years old) for children who is not enroll in school, outdrop, or who might be dropout
Office of the Basic Education Commission: OBEC
School ......................................... Code ......................................... District .........................................
The Survey Form is for:
1. General Questions 1.1 Personal Detail
1.2 The Child’s Status
1.3 Family Status
c (1) School age children who is not enrolling in schoolc (2) Dropout school childrenc (3) Children who is at risk to dropout
c Thai Nationality c No Nationality Please specify ethnicity ..............................................
c Migrant c Burmese c Laotian c Cambodian c Vietnamese c Other, please specify ..............................................................................................
c Father–Mother are together c Father passed awayc Mother passed away c Divorced c Father and Mother don’t live togetherNumber of Siblings ......................................... The Child is number .....................................Number of siblings that have not enrolled in school ............................................................Number of siblings that is enrolling in school ........................................................................Working ..................................... Family Income ........................................ Baht / Annually
Name ........................... Surname ............................. Sex ............... Date of Birth ................Age ............................. Religion ...............................National ID c c c c c c c c c c c c c
House Number ......................................... Address Street ....................................................... Moo ..................... Soi ............... Sub District ...............................................................................District ......................................... Province ......................................... Zip Code...................... Telephone ......................................... Studying in Grade .......................................................... Father’s Name ......................................... Mother’s Name ....................................................
Father-Mother/Guardian’s Occupation
Living with
1.4 Parent/Guardian’s contact information
1.5 Contact for follow up in case the child’s name in the House Registration cannot find the child
2. The reason the child is not enrolled in school, dropout or enrolling school but might be at risk of dropout (Please select 3 choices that most relevant and put the choices in order)
(..........) Traveling Issue
(..........) Health
(..........) Disabilities
(..........) The child is at risk of
c Government Officer c Farmer c Shopkeeperc Freelancer c Others, please specify ..............................................
c Father and Mother c Father c Motherc Relative c Others, please specify ..............................................
Name ........................... Surname .................................................................................................House Number ......................................... Address Street ....................................................... Moo ..................... Soi ............... Sub District ...............................................................................District ......................................... Province ......................................... Zip Code...................... Telephone ......................................... Father’s Name ......................................... Mother’s Name ....................................................
..............................................................................................................................................................
c Living in remote and far away area c Living in a mountian /Islandc Border area c Others, please specify ..............................................
c being at places that will have negative influenced on their moralc using/selling drugs c HIV/AIDSc Others, please specify ..............................................
c Chronic Illness c Contagious Diseasesc Deadly Disease c Others, please specify ..............................................
c Vision Impairment c Intellectual Disability c Hearing Impairmentc Physical Disability c Speech and language Impairmentc Others, please specify ..............................................
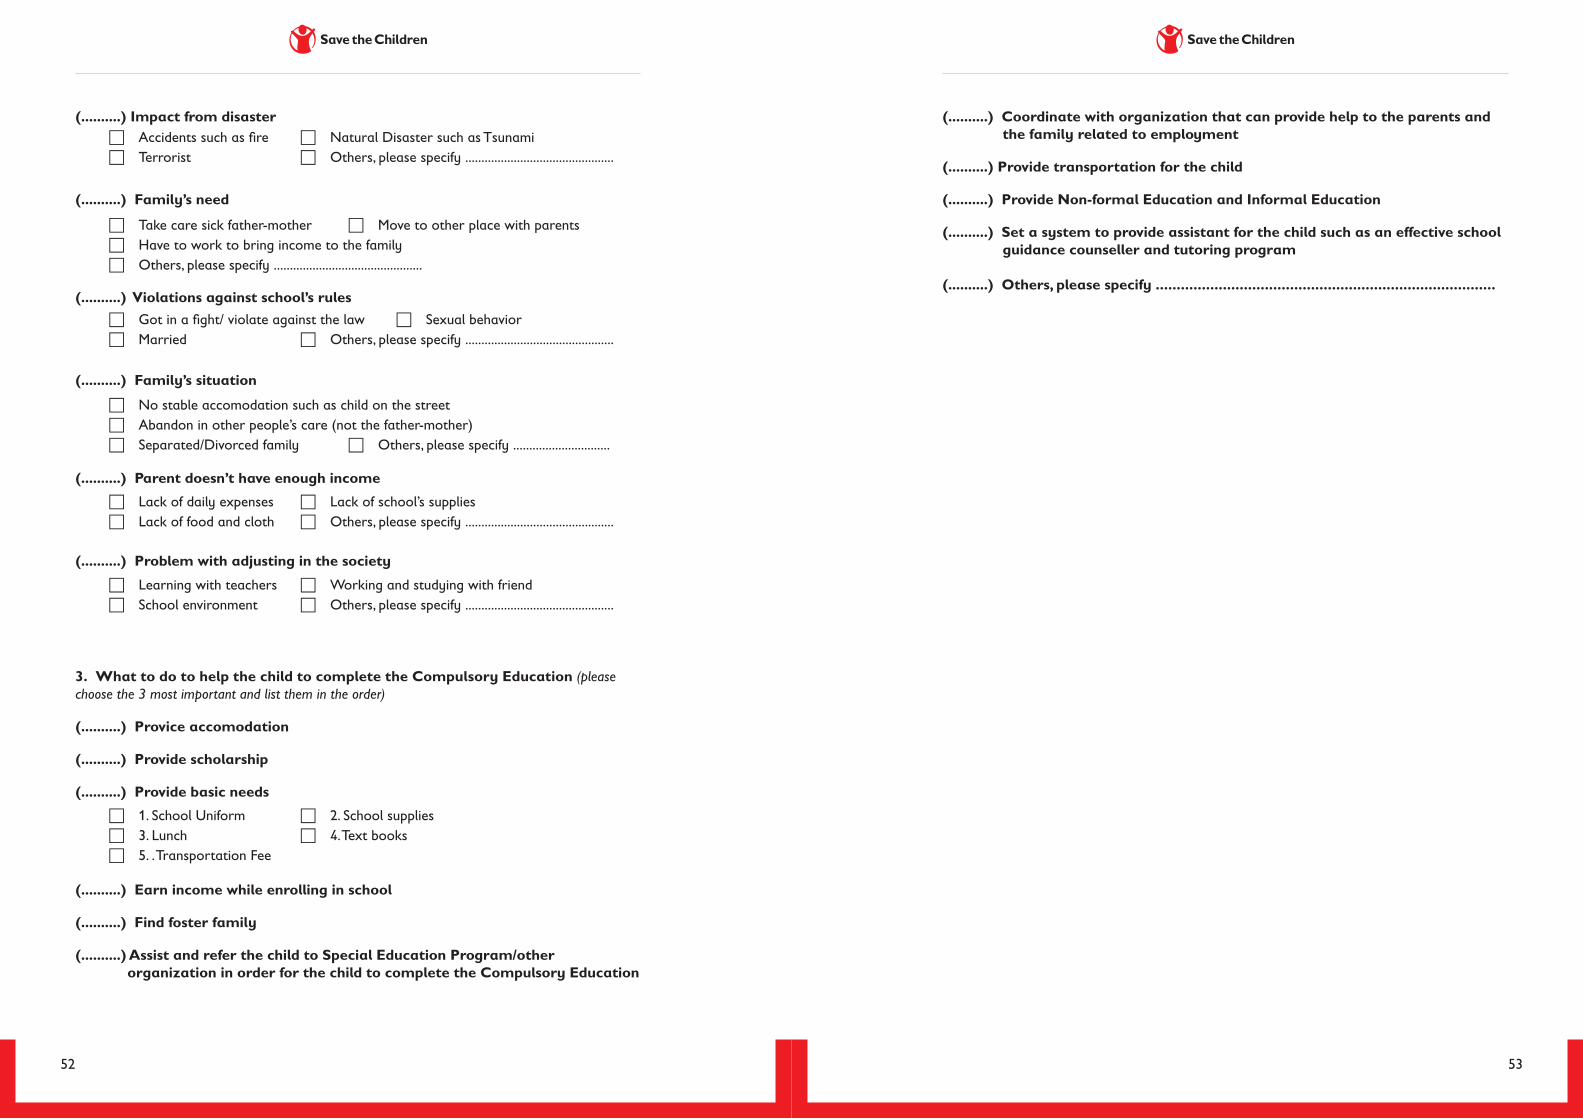
52 53
(..........) Impact from disaster
(..........) Family’s need
(..........) Violations against school’s rules
(..........) Family’s situation
(..........) Parent doesn’t have enough income
(..........) Problem with adjusting in the society
3. What to do to help the child to complete the Compulsory Education (please choose the 3 most important and list them in the order)
(..........) Provice accomodation
(..........) Provide scholarship
(..........) Provide basic needs
(..........) Earn income while enrolling in school
(..........) Find foster family
(..........) Assist and refer the child to Special Education Program/other organization in order for the child to complete the Compulsory Education
c Accidents such as fire c Natural Disaster such as Tsunamic Terrorist c Others, please specify ..............................................
c Lack of daily expenses c Lack of school’s suppliesc Lack of food and cloth c Others, please specify ..............................................
c 1. School Uniform c 2. School supplies c 3. Lunch c 4. Text booksc 5. . Transportation Fee
c Learning with teachers c Working and studying with friendc School environment c Others, please specify ..............................................
c Got in a fight/ violate against the law c Sexual behaviorc Married c Others, please specify ..............................................
c Take care sick father-mother c Move to other place with parents c Have to work to bring income to the family c Others, please specify ..............................................
c No stable accomodation such as child on the streetc Abandon in other people’s care (not the father-mother) c Separated/Divorced family c Others, please specify ..............................
(..........) Coordinate with organization that can provide help to the parents and the family related to employment
(..........) Provide transportation for the child
(..........) Provide Non-formal Education and Informal Education
(..........) Set a system to provide assistant for the child such as an effective school guidance counseller and tutoring program
(..........) Others, please specify .................................................................................
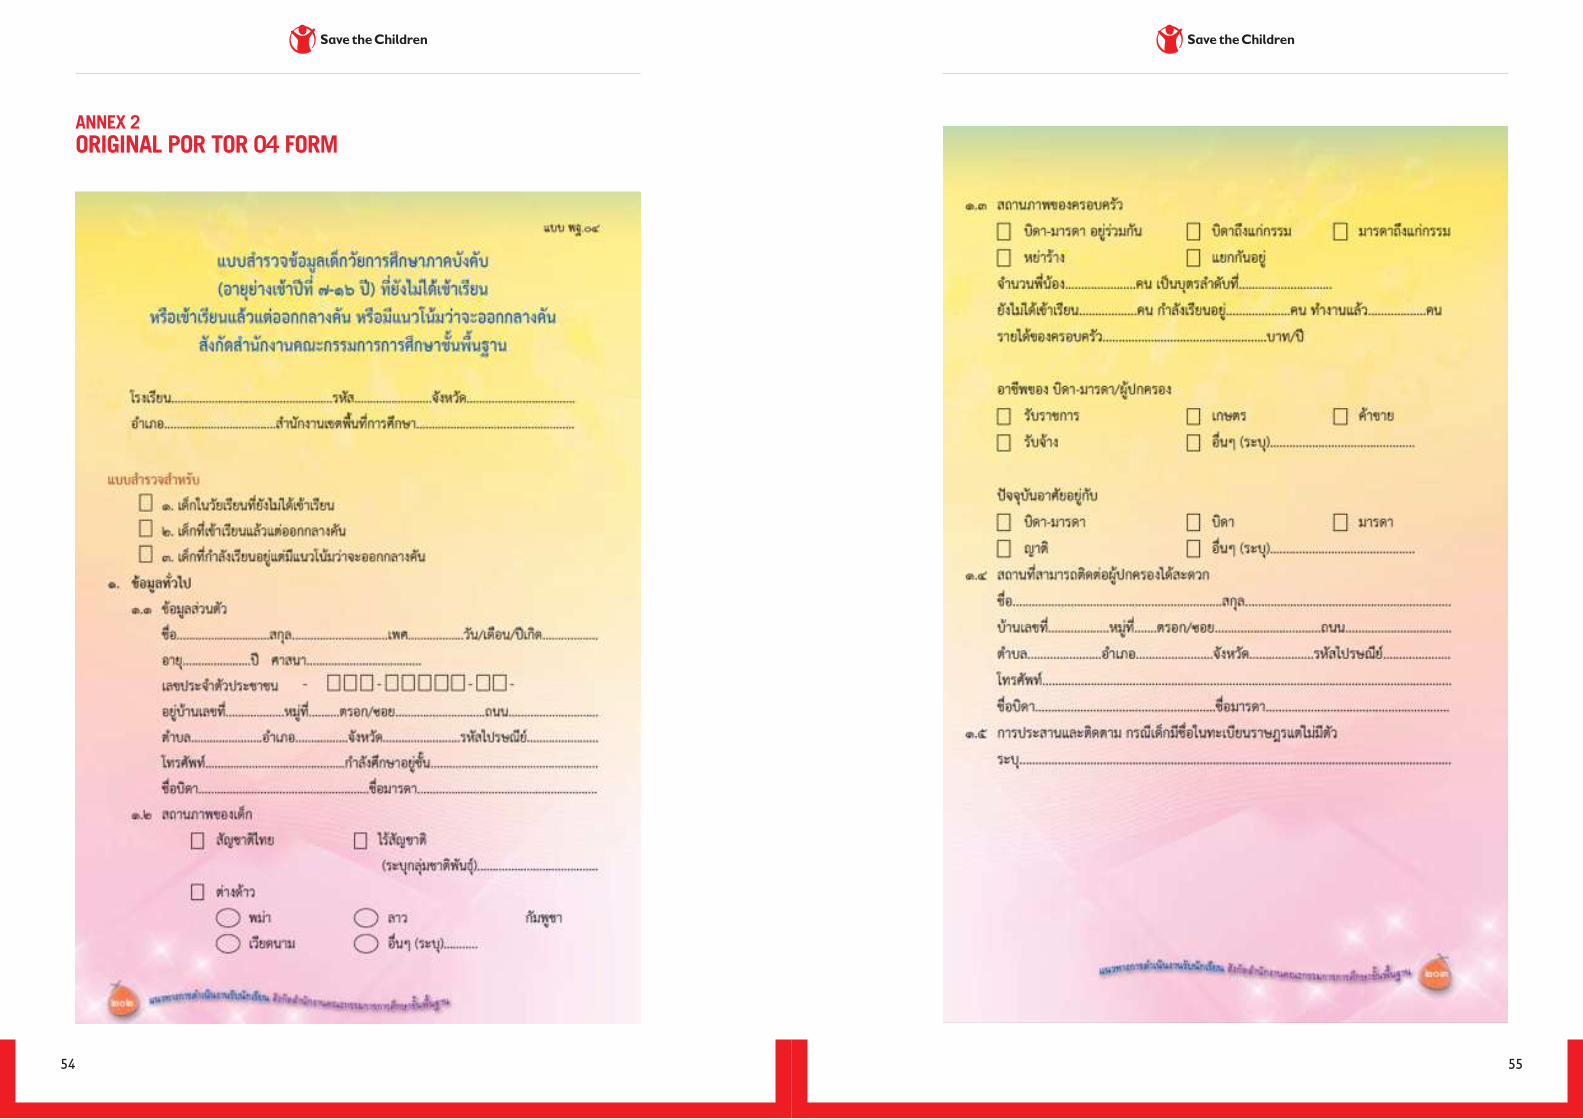
ANNEX 2 ORIGINAL POR TOR 04 FORM
54 55
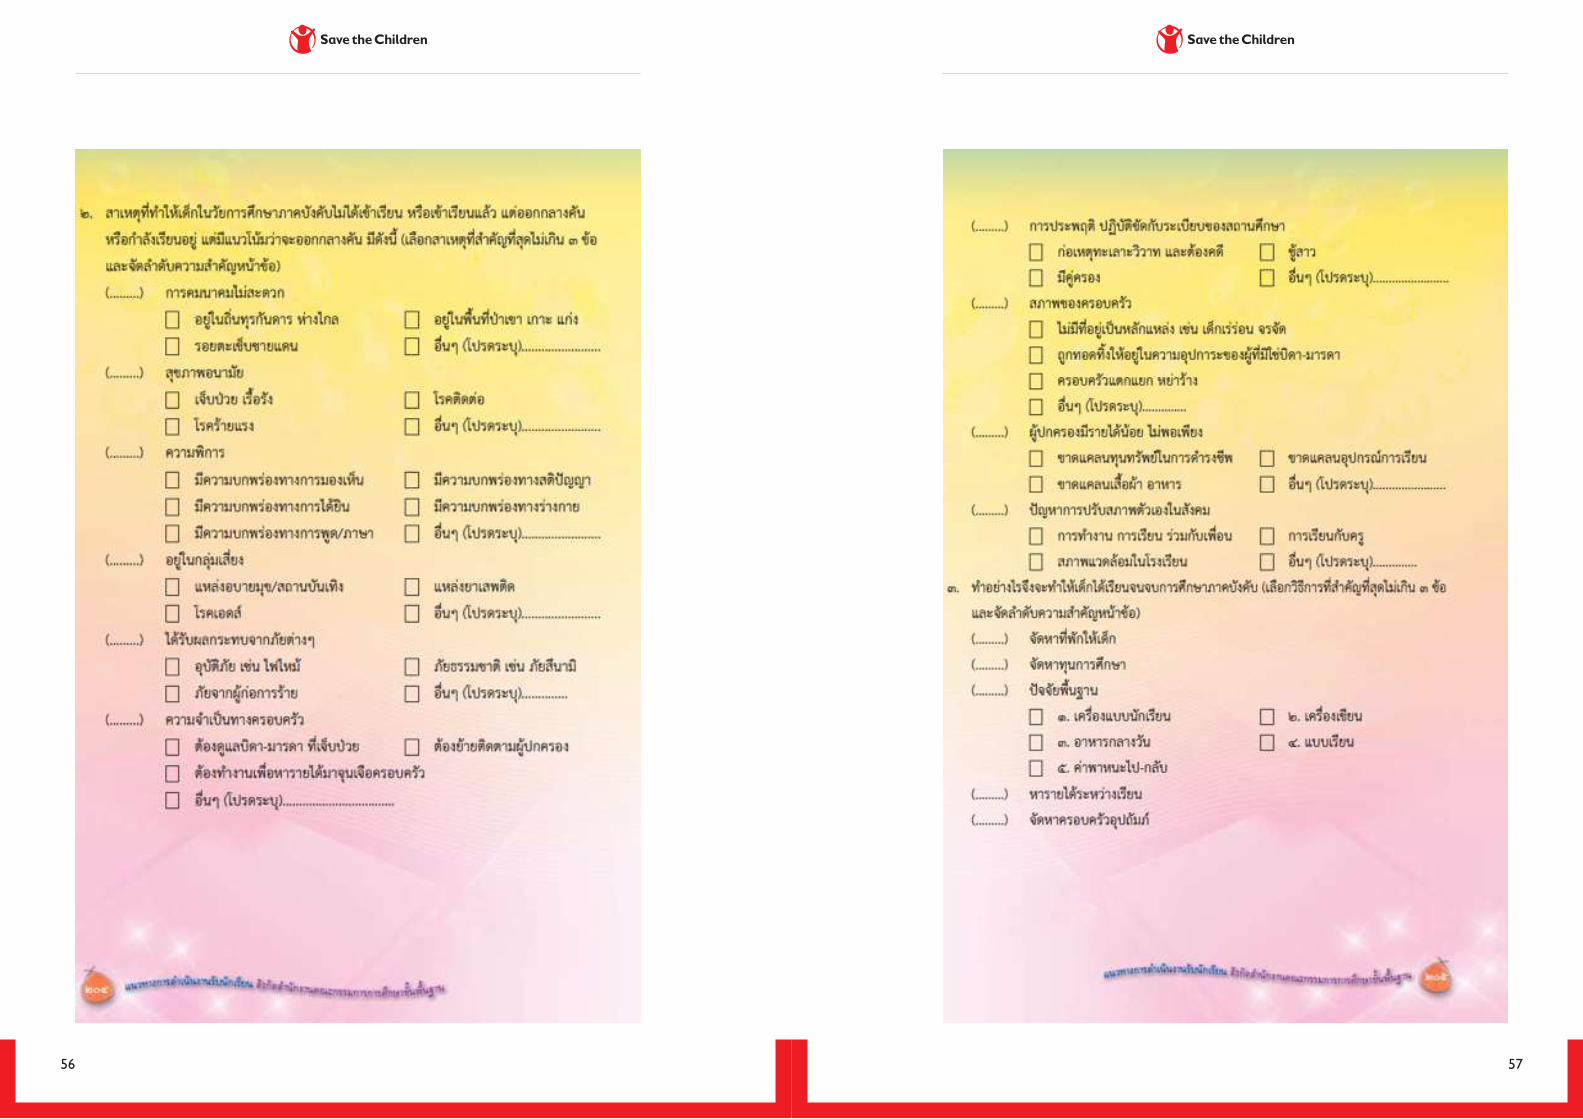
56 57
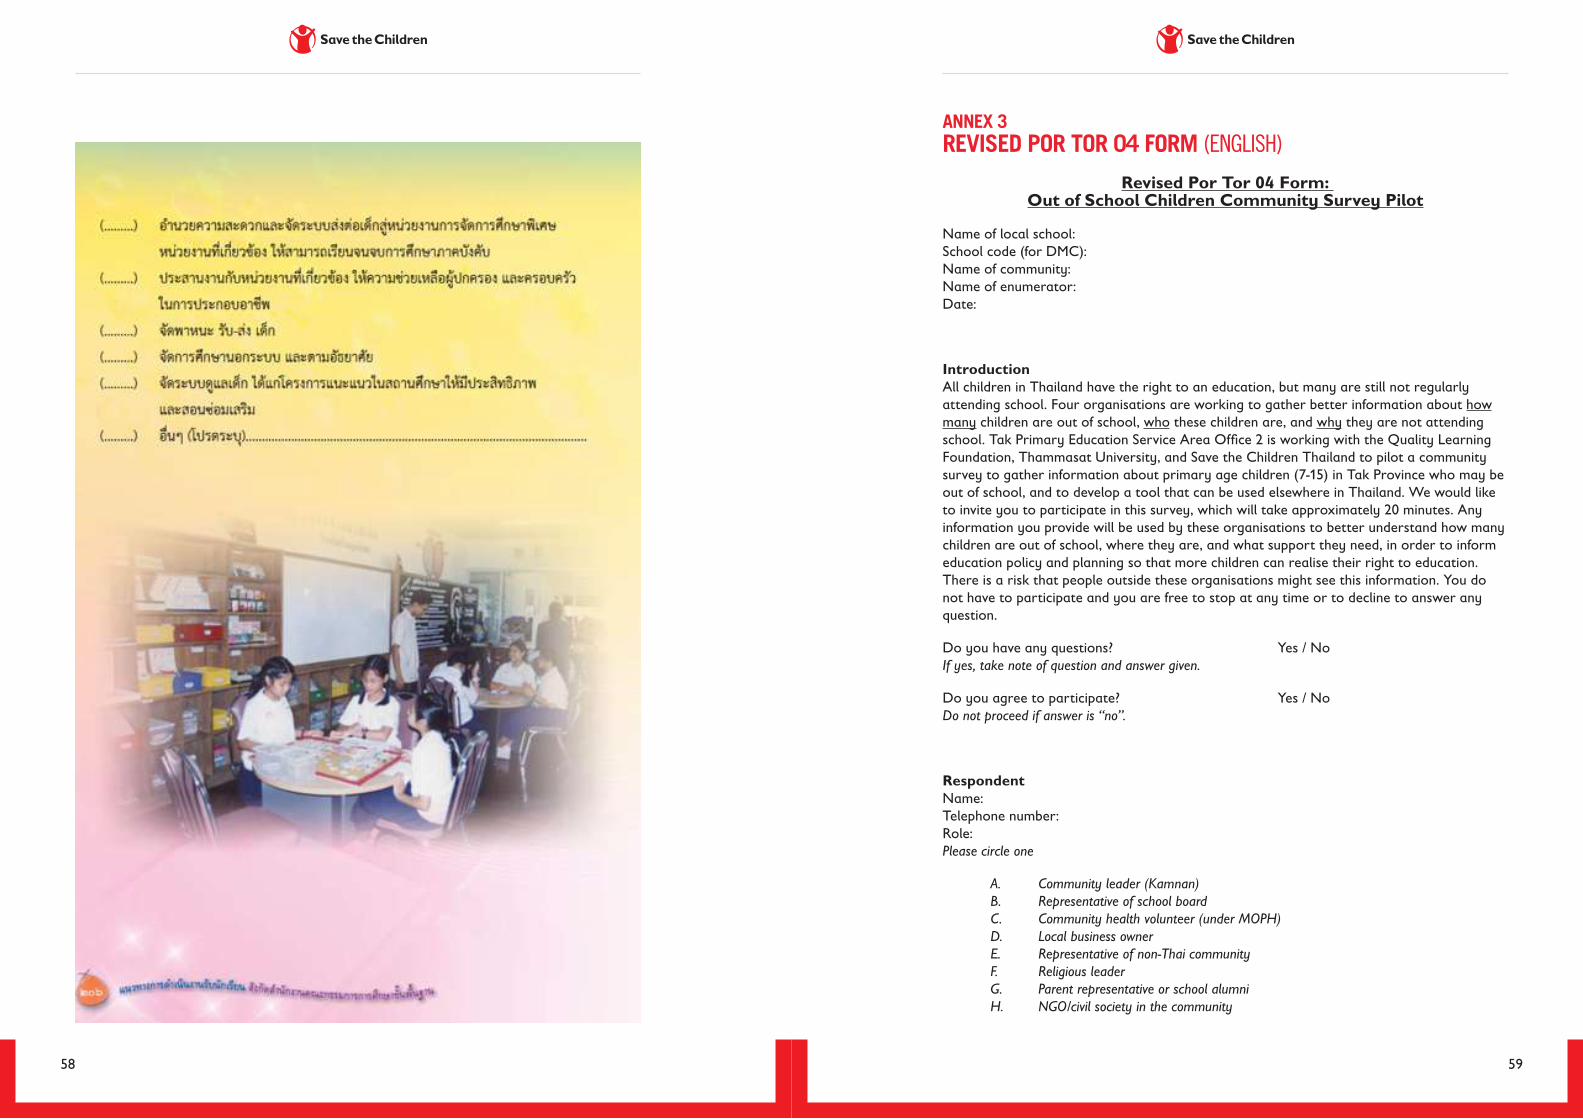
ANNEX 3 REVISED POR TOR 04 FORM (ENGLISH)
58 59
Revised Por Tor 04 Form: Out of School Children Community Survey Pilot
Name of local school: School code (for DMC): Name of community: Name of enumerator: Date:
Introduction All children in Thailand have the right to an education, but many are still not regularly attending school. Four organisations are working to gather better information about how many children are out of school, who these children are, and why they are not attending school. Tak Primary Education Service Area Office 2 is working with the Quality Learning Foundation, Thammasat University, and Save the Children Thailand to pilot a community survey to gather information about primary age children (7-15) in Tak Province who may be out of school, and to develop a tool that can be used elsewhere in Thailand. We would like to invite you to participate in this survey, which will take approximately 20 minutes. Any information you provide will be used by these organisations to better understand how many children are out of school, where they are, and what support they need, in order to inform education policy and planning so that more children can realise their right to education. There is a risk that people outside these organisations might see this information. You do not have to participate and you are free to stop at any time or to decline to answer any question.
Do you have any questions? Yes / No If yes, take note of question and answer given.
Do you agree to participate? Yes / No Do not proceed if answer is “no”.
Respondent Name: Telephone number: Role: Please circle one
A. Community leader (Kamnan) B. Representative of school board C. Community health volunteer (under MOPH) D. Local business owner E. Representative of non-Thai community F. Religious leader G. Parent representative or school alumni H. NGO/civil society in the community
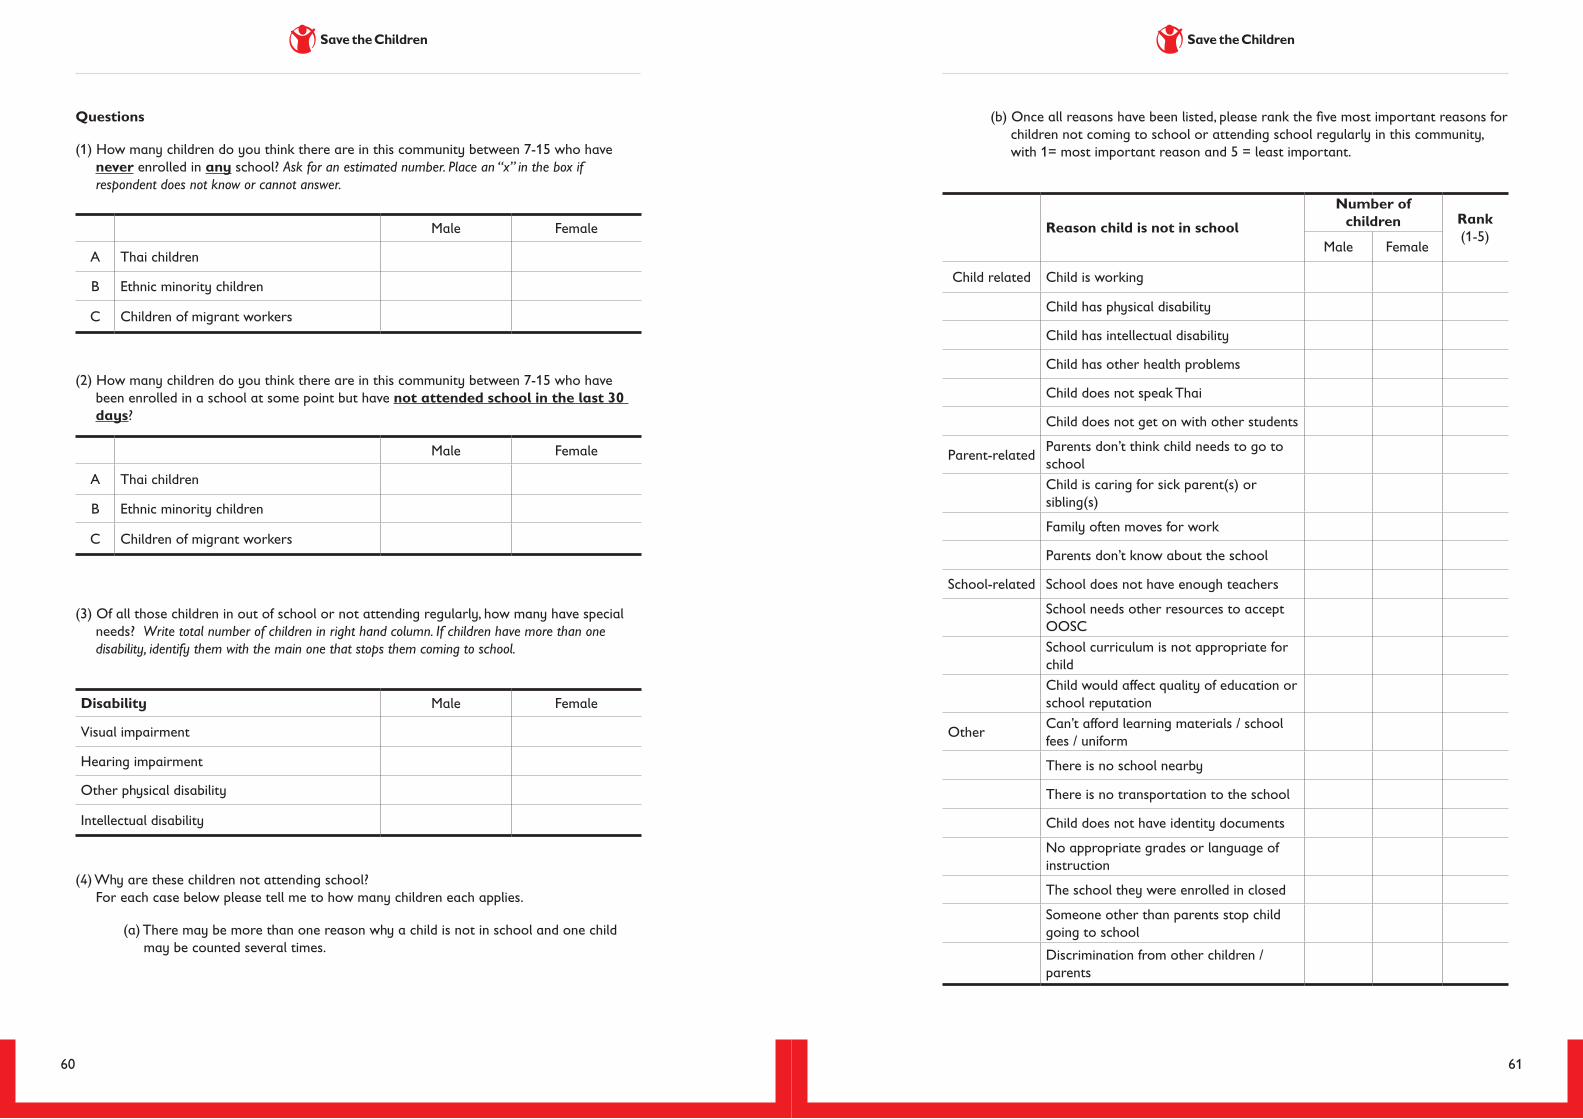
60 61
Questions
(1) How many children do you think there are in this community between 7-15 who have never enrolled in any school? Ask for an estimated number. Place an “x” in the box if respondent does not know or cannot answer.
(2) How many children do you think there are in this community between 7-15 who have been enrolled in a school at some point but have not attended school in the last 30 days?
(3) Of all those children in out of school or not attending regularly, how many have special needs? Write total number of children in right hand column. If children have more than one disability, identify them with the main one that stops them coming to school.
(4) Why are these children not attending school? For each case below please tell me to how many children each applies.
(a) There may be more than one reason why a child is not in school and one child may be counted several times.
Male Female
A Thai children
B Ethnic minority children
C Children of migrant workers
Male Female
A Thai children
B Ethnic minority children
C Children of migrant workers
Disability Male Female
Visual impairment
Hearing impairment
Other physical disability
Intellectual disability
(b) Once all reasons have been listed, please rank the five most important reasons for children not coming to school or attending school regularly in this community, with 1= most important reason and 5 = least important.
Reason child is not in school
Number of children Rank
(1-5)Male Female
Child related Child is working
Child has physical disability
Child has intellectual disability
Child has other health problems
Child does not speak Thai
Child does not get on with other students
Parent-related Parents don’t think child needs to go to schoolChild is caring for sick parent(s) or sibling(s)
Family often moves for work
Parents don’t know about the school
School-related School does not have enough teachers
School needs other resources to accept OOSC School curriculum is not appropriate for childChild would affect quality of education or school reputation
Other Can’t afford learning materials / school fees / uniform
There is no school nearby
There is no transportation to the school
Child does not have identity documents
No appropriate grades or language of instruction
The school they were enrolled in closed
Someone other than parents stop child going to school
Discrimination from other children / parents

62 63
Other reason:
Please specify what the reason is, how many affected by it, and include in the ranking at (b).
Please use the following space to elaborate on / explain any key reasons that you believe children in this community are not coming to school or do not attend regularly:
(5) What help do children who are not currently in school or who are not attending school regularly need? (Examples= financial support, transportation, documentation/ID cards, a school for migrants, accessibility for children with special needs).
(6) Who is responsible in this community for helping out of school children return to school? E.g. Teachers at the local school, or village leaders, to help them come to school.
Continued on next page
Ple
ase
use
thi
s pa
ge t
o id
enti
fy n
am
es a
nd c
onta
ct d
eta
ils fo
r pa
rent
/gua
rdia
n of
chi
ldre
n be
twee
n 7-
15
yea
rs o
ld n
ot c
urre
ntly
in s
choo
l.
If yo
u do
not
hav
e al
l the
info
rmat
ion,
plea
se fi
ll ou
t as
muc
h as
you
can
.
Fam
ily N
ame
Gen
der
Age
Last
gra
de
com
plet
edTe
leph
one
num
ber
Add
ress
(Opt
iona
l)
Mai
n re
ason
for
bein
g ou
t of
sc
hool
Wha
t he
lp is
re
quire
d to
att
end
scho
ol
ANNEX 4 REVISED POR TOR 04 FORM (THAI)
แบบน�ำรองส�ำรวจเดกนอกระบบโรงเรยนในชมชน (ปรบปรงมำจำกแบบ พฐ.4)
ชอโรงเรยน:............................................................รหส DMC โรงเรยน:..............................................อ�ำเภอ:....................................................................ผเกบขอมล:............................................................ วนท:........................................................................
ควำมเปนมำและเหตผล:เดกทกคนทอยในประเทศไทยมสทธในเรองกำรศกษำภำยใตพระรำชบญญตกำรศกษำแหงชำต พ.ศ. 2545 และตำมมตคณะรฐมนตร เมอวนท 5 กรกฎำคม พ.ศ. 2548 อยำงไรกตำมถงแมจะมควำมคบหนำในกำรสมครเรยนของเดกๆ แตกยงมเดกจ�ำนวนมำกทไมไดเขำเรยนอยำงสม�ำเสมอ ขอมลทเกยวกบจ�ำนวนเดกนอกระบบโรงเรยน วำเดกเหลำนคอใครและท�ำไมพวกเขำถงไมอยในโรงเรยน เปนขอมลทจ�ำเปนทจะตองรส�ำนกงำนเขตพนทกำรศกษำประถมศกษำตำกเขต 2 ไดท�ำงำนรวมกบส�ำนกงำนสงเสรมสงคมแหงกำรเรยนรและพฒนำคณภำพเยำวชน(สสค.) มหำวทยำลยธรรมศำสตรและองคกร Save the Children เพอน�ำรองกำรท�ำแบบส�ำรวจในชมชนเพอเกบรวบรวมขอมลเดกทอยในวยประถมศกษำ (7-15 ป)ทไมไดอยในโรงเรยนในพนทจงหวดตำกท และเพอพฒนำเครองมอทสำมำรถใชในพนทอนๆในประเทศไทย ทำงเรำอยำกขอควำมรวมมอจำกทำนในกำรท�ำแบบส�ำรวจ ซงแบบส�ำรวจนจะใชเวลำไมเกน 20 นำท ทำนสำมำรถปฏเสธทจะไมท�ำแบบส�ำรวจ หรอหยดท�ำ แบบส�ำรวจไดทกเมอททำนตองกำรหรอปฏเสธทจะไมตอบค�ำถำมใดๆ อยำงไรกตำมขอมลจำกทำนจะชวยใหเดกอกหลำยคนทจะไดเขำโรงเรยนอกทงจะยงชวยใหทำงโรงเรยนในทองถนของทำนไดรบกำรสนบสนนทพวกเขำตองกำร
คณมค�ำถำมหรอไม ม/ ไมม ถำม ใหเขยนค�ำถำมและค�ำตอบทใหไป............................................................................................................................................................................................................................................................................................................................................................................................................................................................................................................................................................................................................
คณตกลงทจะท�ำแบบส�ำรวจ ใช / ไมถำค�ำตอบคอ “ไม” หยดกำรท�ำขอตอไป
ผใหขอมลชอ: .................................................................เบอรโทรศพท:...............................................ต�ำแหนง:........................................................โปรดวงกลมเพยงหนงขอ A. ผน�ำชมชน(ก�ำนน/ผใหญบำน) B. ผแทนคณะกรรมกำรสถำนศกษำ C. อสม. D. เจำของโรงงำน/เจำของธรกจ E. ผแทนจำกชมชนขำมชำต F. ผน�ำทำงศำสนำ G. ผแทนผปกครอง หรอ ศษยเกำโรงเรยน H. องคกรเอกชน (NGO) หรอกลมประชำสงคมจำกชนชน
64 65
Is there anything else you would like to tell us about the issue of out of school children in your community?
Yes/ No
Signature of respondent:
Signature of enumerator:
Please take a photo together and submit to Khun Sia
Contact details Please contact the following people if you have any questions about the survey:
Sia Kukaewkasem 0932918818 (Thai) or Charlie Thame [email protected] (English)
Please contact the following people if you would like to learn more about education opportunities:
Khun Pongsakorn [Official title and preferred method of contact]
ค�ำถำม1. มเดกอำยระหวำง 7-15 ป กคนในชมชนของทำนทยงไมเคยเขำโรงเรยนใดเลยใหถำมตวเลขประมำณ จ�ำนวนเดกถำตอบวำไมทรำบหรอตอบไมไดใหกำกบำทในชองวำง
2. มเดกอำยระหวำง 7-15 ปกคนในชมชนของทำนทเขำโรงเรยน แตไมไดมำเรยนนำนเปนเวลำ 30 วนทผำน มำ
3. จำกจ�ำนวนเดกทถงเกณฑเขำเรยนแตไมไดเขำเรยนหรอเดกทไมเขำเรยนประจ�ำมเดกพเศษกคน 4. ใหเขยนจ�ำนวนตวเลขทงหมดลงชองวำงทำงขวำมอ ถำเดกมควำมบกพรองมำกกวำหนงใหระบเฉพำะ ควำมบกพรองหลกทเปนอปสรรคทท�ำใหเดกไมสำมำรถมำโรงเรยนได
5. สำเหตทเดกไมไดเขำเรยน โปรดระบจ�ำนวนเดกในแตละสำเหต
ก. อำจจะมหลำยสำเหตทเดกหนงคนไมเขำโรงเรยนและเดกคนหนงอำจจะถกนบซ�ำหลำยครง หลงจำกกรอกจ�ำนวนในแตละชองเรยบรอยแลว โปรดเรยงล�ำดบสำเหตจำกมำกไปหำนอย เปนระดบ1-5 ท เดกในชมชนนไมเขำเรยนหรอเขำเรยนแตไมสม�ำเสมอ โปรดเลอกแค 5 สำเหต โดย 1เปนสำเหตหลกทเดกไมเขำเรยนหรอเขำเรยนแตไมสม�ำเสมอ และ 5 ไมไดเปนสำเหตหลกทเดกไมเขำ เรยนหรอเขำเรยนแตไมสม�ำเสมอ
เหตผลอนๆ .......................................................................................................................................................................................................................................................................................................................................................................................................................................................................................................................................................................................
สำเหตทเดกไมเขำโรงเรยนจ�ำนวนนกเรยน เรยง
ล�ำดบจำก1-5ชำย หญง
(1) สาเหตทเกดจากเดก เดกท�ำงำน
เดกมควำมบกพรองทำงรำงกำย
เดกมควำมบกพรองทำงสตปญญำ
เดกมปญหำสขภำพอนๆ
มเดกไมสำมำรถพดภำษำไทย
เดกไมสำมำรถเขำกบนกเรยนคนอน
(2) สาเหตทเกดจากบดามารดา/ผปกครอง
บดำมำรดำ/ผปกครองคดวำเดกไมจ�ำเปนตองไปโรงเรยน
เดกตองดแลบดำมำรดำ/ผปกครองหรอพนองทไมสบำย
ครอบครวยำยทอยเปนประจ�ำ
ผปกครองหรอบดำมำรดำไมรขอมลเกยวกบโรงเรยน
(3) สาเหตทเกดจากโรงเรยน โรงเรยนมครไมพอ
โรงเรยนตองกำรทรพยำกรในกำรรบเดก OOSC (เชน หองเรยน นมโรงเรยน อำหำรกลำงวน)
หลกสตรของโรงเรยนไมเหมำะกบเดก
กำรเขำเรยนของเดกอำจจะสงผลกระทบตอคณภำพกำรศกษำหรอภำพลกษณของโรงเรยน
(4) สาเหตอนๆ ไมมเงนในกำรซออปกรณกำรเรยน/ซอชดนกเรยน/ จำยคำเลำเรยน
ไมมโรงเรยนทอยใกลบำน
ไมมยำนพำหนะในกำรไปโรงเรยน
เดกไมมเอกสำรกำรแสดงตว
ไมมชนเรยนทเหมำะสมกบเดกหรอภำษำทเดกเขำใจ
โรงเรยนทเดกเคยเรยนถกปด
บคคลอนทไมใชบดำมำรดำหรอผปกครองไมใหเดกไปโรงเรยน
ถกเลอกปฎบตจำกเดกหรอผปกครองคนอน
66 67
ขอ กลมเปำหมำย ชำย หญง
ก เดกไทย
ข เดกชำตพนธ
ค เดกขำมชำต
ขอ กลมเปำหมำย ชำย หญง
ก เดกไทย
ข เดกชำตพนธ
ค เดกขำมชำต
ควำมบกพรอง ชำย หญง
มควำมบกพรองทำงกำรมองเหน
มควำมบกพรองทำงกำรไดยน
มควำมบกพรองทำงรำงกำยอนๆ
ควำมบกพรองทำงสตปญญำ
โปรดระบสำเหตและบอกจ�ำนวนเดกวำมกคนทไมเขำโรงเรยนเพรำะสำเหตนนๆ และเรยงล�ำดบของแตละสำเหตใน (ข.)โปรดใชพนทดำนลำงเพออธบำยสำเหตททำนคดวำเปนสำเหตหลกทท�ำใหเดกในชมชนของทำนไมเขำโรงเรยน หรอไปโรงเรยนแตไมสม�ำเสมอ:
....................................................................................................................................................................................................
....................................................................................................................................................................................................
....................................................................................................................................................................................................
....................................................................................................................................................................................................
6. เดกทอยนอกระบบโรงเรยนหรอเดกทเขำเรยนไมสม�ำเสมอตองกำรควำมชวยเหลอในดำนใดบำง (เชนควำมชวยเหลอทำงกำรเงน ควำมชวยเหลอในกำรรบสง ควำมชวยเหลอดำนเอกสำร/บตรประจ�ำตว โรงเรยนขำมส�ำหรบเดกขำมชำต กำรเขำถงของเดกทมควำมตองกำรพเศษ)
....................................................................................................................................................................................................
....................................................................................................................................................................................................
....................................................................................................................................................................................................
....................................................................................................................................................................................................
7. ใครในชมชนของทำนมหนำทรบผดชอบในกำรใหควำมชวยเหลอเดกนอกระบบโรงเรยนไดเขำเรยน เชน ครในโรงเรยนในชมชน หรอ ผน�ำชมชน มหนำทใหควำมชวยเหลอเดกใหเขำโรงเรยน
....................................................................................................................................................................................................
....................................................................................................................................................................................................
....................................................................................................................................................................................................
....................................................................................................................................................................................................
68 69
โปรด
ใชตำ
รำงด
ำนลำ
งเพอ
กรอก
ชอแล
ะรำย
ละเอ
ยดขอ
มลตด
ตอขอ
งบดำ
มำรด
ำ/ผป
กครอ
งของ
เดกอ
ำย 7
-15
ปทยง
ไมได
เขำ
โรงเ
รยน
ถาไม
สามา
รถกร
อกขอ
มลทง
หมดไ
ด ให
กรอก
ขอมล
เทาท
มใหไ
ดมาก
ทสด
ชอนำ
มสกล
เพศ
อำย
ชนสด
ทำยท
เรยน
เบอร
โทรศ
พท
ทอย
(ถำม
)เห
ตผลห
ลกทเ
ดกไม
ไดเข
ำโรง
เรยน
ควำม
ชวยเ
หลอท
เดก
ตองก
ำร เพ
อใหเ
ดกสำ
มำรถ
เขำโ
รงเรย
น
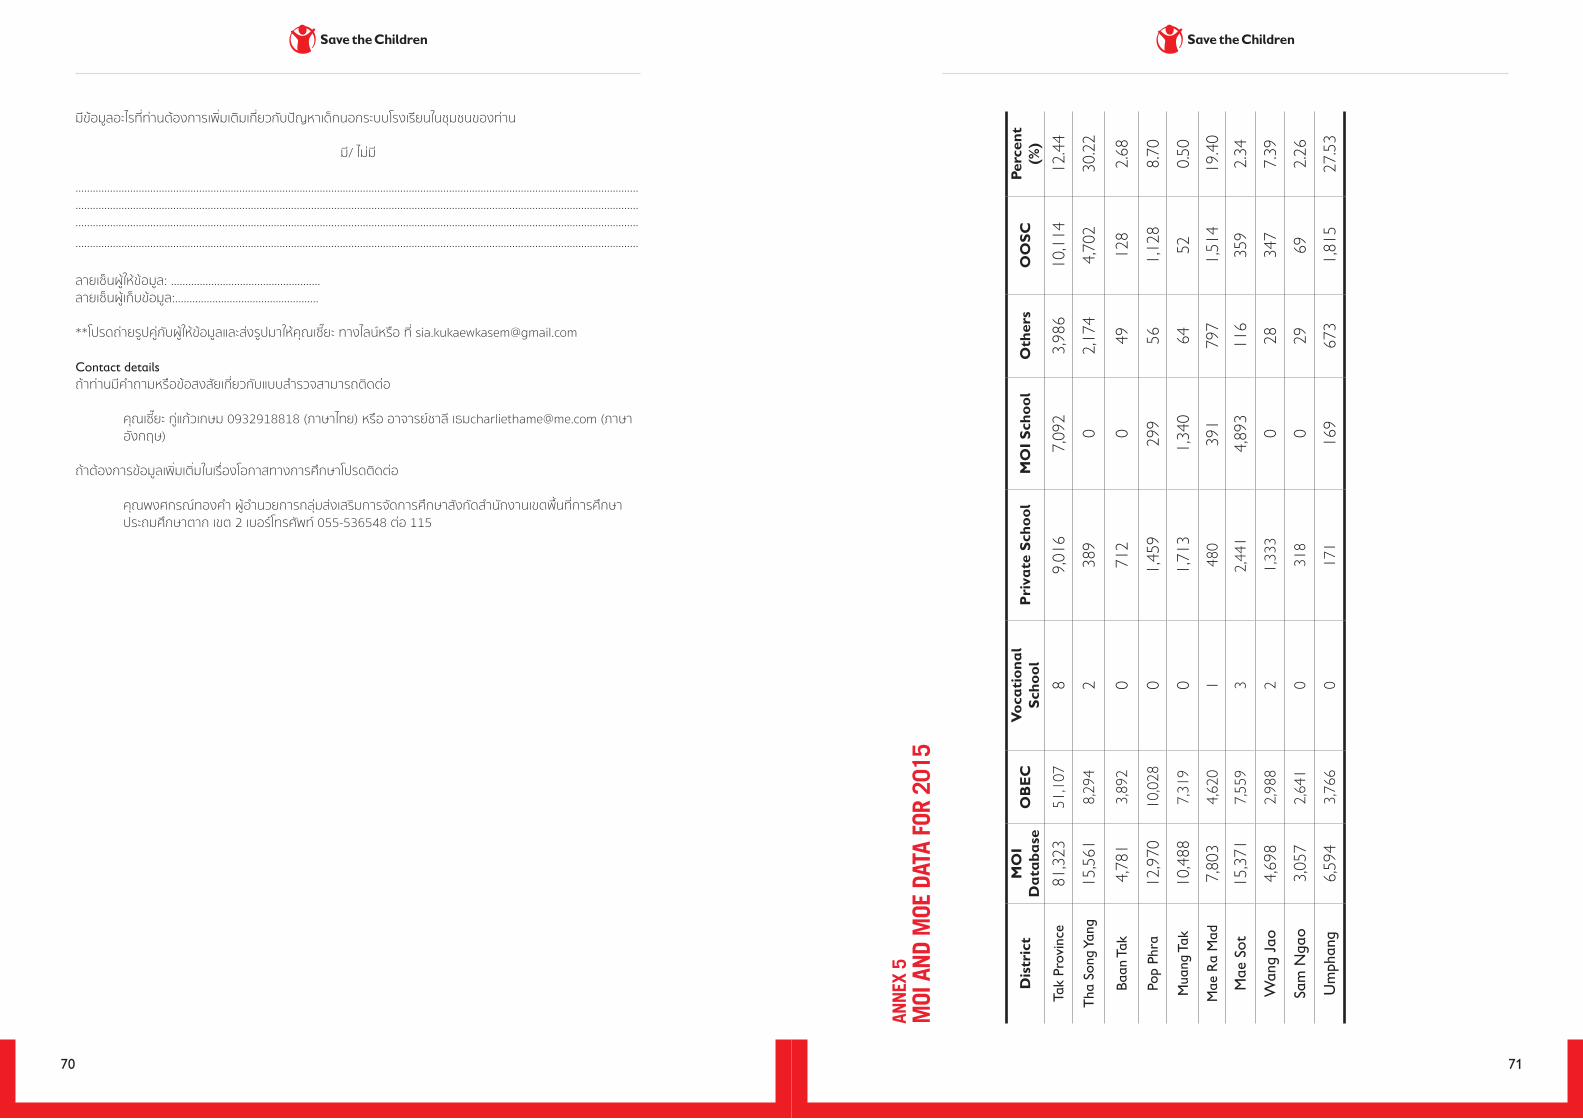
มขอมลอะไรททำนตองกำรเพมเตมเกยวกบปญหำเดกนอกระบบโรงเรยนในชมชนของทำน
ม/ ไมม
....................................................................................................................................................................................................
....................................................................................................................................................................................................
....................................................................................................................................................................................................
....................................................................................................................................................................................................
ลำยเซนผใหขอมล: ....................................................ลำยเซนผเกบขอมล:..................................................
**โปรดถำยรปคกบผใหขอมลและสงรปมำใหคณเซยะ ทำงไลนหรอ ท [email protected]
Contact detailsถำทำนมค�ำถำมหรอขอสงสยเกยวกบแบบส�ำรวจสำมำรถตดตอ
คณเซยะ กแกวเกษม 0932918818 (ภำษำไทย) หรอ อำจำรยชำล เธม[email protected] (ภำษำ องกฤษ)
ถำตองกำรขอมลเพมเตมในเรองโอกำสทำงกำรศกษำโปรดตดตอ
คณพงศกรณทองค�ำ ผอ�ำนวยกำรกลมสงเสรมกำรจดกำรศกษำสงกดส�ำนกงำนเขตพนทกำรศกษำ ประถมศกษำตำก เขต 2 เบอรโทรศพท 055-536548 ตอ 115
ANNE
X 5
MOI
AND
MOE
DAT
A FO
R 20
15
70 71
Dis
tric
tM
OI
Da
taba
seO
BE
CV
oca
tion
al
Scho
olP
riva
te S
choo
lM
OI
Scho
olO
ther
sO
OSC
Perc
ent
(%)
Tak
Prov
ince
81,323
51,107
89,016
7,092
3,986
10,114
12.44
Tha
Son
g Ya
ng15,561
8,294
2389
02,174
4,702
30.22
Baan
Tak
4,781
3,892
0712
049
128
2.68
Pop
Phra
12,970
10,028
01,459
299
561,128
8.70
Mua
ng T
ak10,488
7,319
01,713
1,340
6452
0.50
Mae
Ra
Mad
7,803
4,620
1480
391
797
1,514
19.40
Mae
Sot
15,371
7,559
32,441
4,893
116
359
2.34
Wan
g Ja
o4,698
2,988
21,333
028
347
7.39
Sam
Nga
o3,057
2,641
0318
029
692.26
Um
phan
g6,594
3,766
0171
169
673
1,815
27.53
BIBLIOGRAPHY
72 73
Afridi, M., Anderson, S., & Mundy, K. (2014). Parent and Community Involvement in Education: A Rapid Review of the Literature. https://www.oise.utoronto.ca/cidec/UserFiles/File/ Website/Rapid_Review_-_Parent_Community_June_30_final_2.pdf
Agadjanian, V., & Zotova, N. (2012). Sampling and surveying hard-to-reach populations for demographic research: A study of female labour migrants in Moscow, Russia. Demographic Research, 26, 131–150. https://doi.org/10.4054/DemRes.2012.26.5
Belser, P., de Cock, M., & Mehran, F. (2005). ILO Minimum Estimate of Forced Labour in the World.Ilo.http://www.ilo.org/wcmsp5/groups/public/@ed_norm/@declaration/ documents/publication/wcms_081913.pdf
Bezerra, K. F., Gurgel, R. Q., Ilozue, C., & Castaneda, D. N. (2011).Estimating the number of street children and adolescents in two cities of Brazil using capture-recapture. Journal of Paediatrics and Child Health, 47(8), 524–529. https://doi.org/10.1111/j.1440- 1754.2011.02015.x
Boethel, M. (2003). Diversity School, Family, & Community Connections. SEDL-Advancing Research Improving Education. http://www.sedl.org/connections/resources/diversity- synthesis.pdf
Bouris, S. (2006). Working with communities: a toolbox, (May), 1–8.http://www.ifrc.org/ PageFiles/95747/B.b.01.%20Working%20with%20communities-Tool%20box_IFRC.pdf
Braeye, T., Verheagen, J., Mignon, A., Flipse, W., Pierard, D., Huygen, K., & Hens, N. (2016). Capture-Recapture Estimators in Epidemiology with Applications to Pertussis and Pneumococcal Invasive Disease Surveillance. PloS one, 11(8), e0159832.http://journals. plos.org/plosone/article?id=10.1371%2Fjournal.pone.0165351&utm_ source=feedburner&utm_medium=feed&utm_campaign=Feed%3A+plosone%2FPLoSO NE+(PLOS+ONE+-+New+Articles)
Brittain, S., & Böhning, D. (2009). Estimators in capture-recapture studies with two sources. AStA Advances in Statistical Analysis, 93(1), 23–47. https://doi.org/10.1007/s10182- 008-0085-y
Bryant, J. (2005). CHILDREN OF INTERNATIONAL MIGRANTS IN INDONESIA, THAILAND, AND THE PHILIPPINES: A REVIEW OF EVIDENCE AND POLICIES. file:///C:/Users/Odin%20888/Downloads/gfmd_brussels07_contribution_unicef_irc_ report_children_of_migrants_en%20(1).pdf
C. (2014).Community Planning Toolkit- Community Engagement. Retrieved October 30, 2016, from http://www.communityplanningtoolkit.org/sites/default/files/Engagement.pdf
Caouette, T. M. (n.d.). Small Dreams Beyond Reach: The Lives of Migrant Children and Youth Along the Borders of China, Myanmar and Thailand. A Participatory Action Research Project of Save the Children (UK) http://www.eldis.org/vfile/upload/1/document/0708/ DOC11759.pdf
Chao, A., Tsay, P. K., Lin, S. H., Shau, W. Y., & Chao, D. Y. (2001). The applications of capture- recapture models to epidemiological data. Statistics in Medicine, 20(20), 3123–3157. https://doi.org/10.1002/sim.996
Chevalier, J. M., & Buckles, D. J. (2008). SAS2 social analysis systems: A guide to collaborative inquiry and social engagement. IDRC.http://omec.uab.es/Documentos/coop_ internacional/00110.pdf
Clark, J. (2004). Participatory research with children and young people: Philosophy, possibilities and perils. Action Research Expeditions, 4(Nov), 1–18.http://www.ncl. ac.uk/cflat/documents/Clark%5E2004-Participatory_research_with_children.pdf
Committee for Promotion and Protection of Child Rights (Burma) (2009). Feeling Small in Another Person’s Country: The situation of Burmese migrant children in Mae Sot, Thailand. http://www.burmalibrary.org/docs08/Feeling_Small.pdf
Cooch, E. G., & White, G. (2011). Chapter 14: Closed population capture-recapture models. Program MARK, (i). http://www.phidot.org/software/mark/docs/book/pdf/chap14.pdf
Corrao, G., Bagnardi, V., Vittadini, G., &Favilli, S. (2000). Capture-recapture methods to size alcohol related problems in a population. Journal of Epidemiology and Community Health, 54(8), 603–10.https://doi.org/10.1136/jech.54.8.603
Dare, A. (2015). Beyond Access: Refugee Students’ Experiences of Myanmar State Education. https://www.researchgate.net/publication/285725891_Beyond_Access_Refugee_ Students’_Experiences_of_Myanmar_State_Education
Daróczi, G. (2014). Estimating the Number of Homeless People Living in Hungary between 1999 and 2011. Bulletin of Sociological Methodology/Bulletin de MéthodologieSociologique, 123(1), 56–67.https://doi.org/10.1177/0759106314531896
Fisher, N., Turner, S. W., Pugh, R., & Taylor, C. (1994). Estimating numbers of homeless and homeless mentally ill people in north east Westminster by using capture-recapture analysis. BMJ (Clinical Research Ed.), 308(6920), 27–30. https://doi.org/10.1136/ bmj.308.6920.27
Flicker, S., Savan, B., Kolenda, B., &Mcgrath, M. (2006). A Snapshot of CBR in Canada, (June). http://www.livingknowledge.org/fileadmin/Dateien-Living-Knowledge/Dokumente_ Dateien/Toolbox/LK_A_CBR_snapshot_report_Canada.pdf
Frechtling, J. (2002). An Overview of Quantitative and Qualitative Data Collection Methods. The 2002 User-Friendly Handbook for Project Evaluation, 43–62. Retrieved fromhttp:// www.nsf.gov/pubs/2002/nsf02057/nsf02057.pdf
Giachello, A. (2007). Making Community Partnerships Work: A Toolkit. http://www.aapcho.org/ wp/wp-content/uploads/2012/02/Giachello-MakingCommunityPartnershipsWorkToolk it.pdf
Gourlay-Larour, M. L., Pradel, R., Guillemain, M., Guitton, J. S., L’Hostis, M., Santin-Janin, H., &Caizergues, A. (2014). Movement patterns in a partial migrant: A multi-event capture-recapture approach. PLoS ONE, 9(5).https://doi.org/10.1371/journal. pone.0096478
Gurgel, R. Q., da Fonseca, J. D. C., Neyra-Castañeda, D., Gill, G. V, & Cuevas, L. E. (2004). Capture-recapture to estimate the number of street children in a city in Brazil. Archives of Disease in Childhood, 89(3), 222–4.https://doi.org/10.1136/ adc.2002.023481
74 75
Healthy City (2012).Participatory Asset Mapping. A COMMUNITY RESEARCH LAB TOOLKIT http://www.communityscience.com/knowledge4equity/ AssetMappingToolkit.pdf
Héraud-Bousquet, V., Lot, F., Esvan, M., Cazein, F., Laurent, C., Warszawski, J., &Gallay, A. (2012). A three-source capture-recapture estimate of the number of new HIV diagnoses in children in France from 2003-2006 with multiple imputation of a variable of heterogeneous catchability. BMC Infectious Diseases, 12, 251.https://doi. org/10.1186/1471-2334-12-251
Herzog, T. N. (n.d.). Applications of Capture-Recapture Methods. file:///C:/Users/Odin%20888/ Downloads/arch06v40n1-i%20(1).pdf
Hest, R. .(2007). Capture-recapture Methods in Surveillance of Tuberculosis and Other Infectious Diseases. Retrieved from http://repub.eur.nl/pub/10506/
Hook, E. B., & Regal, R. R. (2000). Accuracy of alternative approaches to capture-recapture estimates of disease frequency: Internal validity analysis of data from five sources. American Journal of Epidemiology, 152(8), 771–779. https://doi.org/10.1093/ aje/152.8.771
ILO. (2012). ILO Global Estimate of Forced Labour: Results and methodology. ILO Publications.file:///C:/Users/Odin%20888/Downloads/ILO%20global%20estimate%20 of%20forced%20labour.pdf
ILO-IPEC (2014). Education for Child Labour and Migrant Children - Information kits for schools and teachers / International Labour Office, International Programme on the Elimination of Child Labour (IPEC) – Geneva and Thailand.file:///C:/Users/Odin%20 888/Downloads/Education_for_migrant_children__CL_kit_Thailand_En%20(2).pdf
Israel, B. A., Schulz, A. J., Parker, E. A., & Becker, A. B. (1998). Review of community-based research: assessing partnership approaches to improve public health. Annual review of public health, 19(1), 173-202.https://depts.washington.edu/ccph/pdf_files/annurev. publhealth.19.1.pdf
Jarvis, S. N., Lowe, P. J., Avery, A., Levene, S., & Cormack, R. M. (2000). Children are not goldfish- -mark/recapture techniques and their application to injury data. InjPrev, 6(1), 46–50. https://doi.org/10.1136/ip.6.1.46
Jones, H. E., Hickman, M., Welton, N. J., De Angelis, D., Harris, R. J., &Ades, A. E. (2014). Recapture or precapture? Fallibility of standard capture-recapture methods in the presence of referrals between sources. American Journal of Epidemiology, 179(11), 1383–1393. https://doi.org/10.1093/aje/kwu056
Kahn, J., Bronte-tinkew, J., &Theokas, C. (2008). HOW CAN I ASSESS THE QUALITY OF MY PROGRAM ? TOOLS FOR OUT-OF-SCHOOL TIME PROGRAM PRACTITIONERS Part 8 in a Series on Practical Evaluation Methods. Evaluation, (February), 1–8. http:// www.childtrends.org/wp-content/uploads/01/Program-Quailty-OST.pdf
KANGASPUNTA, K. (2015). Researching hidden populations: approaches to and methodologies for generating data on trafficking in persons. Forum on Crime and Society (Vol. 8).https://doi.org/10.1163/15718085-12341263
Krishnaswamy, A. (2004). Participatory Research: Strategies and Tools. Practitioner: Newsletter of the National Network of Forest Practitioners, 22(June 2003), 17–22. Retrieved fromhttp://nature.berkeley.edu/community_forestry/Workshops/ powerpoints/tools and strategies of PR.pdf
Kumar, K. (1987). Rapid, low-cost data collection methods for AID (No. 14465).US Agency for International Development.http://pdf.usaid.gov/pdf_docs/PNAAL100.PDF
Lindberg, M., &Rexstad, E. (2006). Capture–recapture sampling designs. Encyclopedia of Environmetrics, 1, 251–262. https://doi.org/10.1002/9780470057339.vac003.pub2
M. J. Taole (2013). Exploring Principals’ Role in Providing Instructional Leadership in Rural High Schools in South Africa. http://www.krepublishers.com/02-Journals/T%20&%20 T/T%20&%20T-11-0-000-13-Web/T%20&%20T-11-1-000-13-ABST-PDF/S-T&T-11-1- 075-13-285-Taole-M-J/S-T&T-11-1-075-13-285-Taole-M-J-Tt.pdf
Macdonald, C. (2012). Understanding Participatory Action Research : a Qualitative Research Methodology Option. Canadian Journal of Action Research, 13(2), 34–50.https://www. researchgate.net/publication/274063607_Understanding_participatory_action_ research_A_qualitative_research_methodology_option
Marpsat, M., & Razafindratsima, N. (2010). Survey methods for hard-to-reach populations: Introduction to the special issue. Methodological Innovations Online, 5(2), 3–16. https://doi.org/10.4256/mio.2010.0014
Martí, J. (2015). Measuring in action research: Four ways of integrating quantitative methods in participatory dynamics Joel.https://ddd.uab.cat/pub/artpub/2015/133470/2015_ Marti_-_Measuring_in_AR_posprint.pdf
McGarvey, C. (2007). “Participatory action research.”Action research involving “all the players” in evaluation and change. Grantcraft Evaluation Techniques: A Series of Brief Guides, 12. Retrieved fromhttp://www.grantcraft.org/assets/content/resources/par.pdf
McTaggart, R. (1994). Participatory Action Research: issues in theory and practice. Educational Action Research, 2(3), 313–337. https://doi. org/10.1080/0965079940020302
Mingoti, S. A., &Caiaffa, W. T. (2006). A capture-recapture technique to estimate the size of the injecting drug user population attending syringe exchange programs: AjUDE-Brasil II Project. Cadernos de SaúdePública, 22(4), 783-789.file:///C:/Users/Odin%20888/ Downloads/A_capture-recapture_technique_to_estimate_the_size.pdf
Minkler, M. (2000).Using Participatory Action Research to build Healthy Communities. Public Health Reports (Washington, D.C. : 1974), 115(2–3), 191–197. https://doi.org/10.1093/ phr/115.2.191
Mpyangu, C. M., Ochen, E. A., Onyango, E. O., Of, L., &Iv, F. (2014). Out of school children study in Uganda, (March).https://www.unicef.org/uganda/OUT_OF_SCHOOL_CHILDREN_ STUDY_REPORT__FINAL_REPORT_2014.pdf
Mumba, E. C. (2000). BASELINE SURVEY AND NEEDS ASSESSMENT FOR A MODEL COMMUNITY SCHOOL IN THE KABWATA COMMUNITY. https://www.unicef.org/ french/evaldatabase/files/2000_Zambia_Baseline_rec_347805.pdf
76 77
Oosterlee, A., Vink, R. M., &Smit, F. (2009). Prevalence of family violence in adults and children: Estimates using the capture-recapture method. European Journal of Public Health, 19(6), 586–591.https://doi.org/10.1093/eurpub/ckp065
Petchot, K. (2011). The Right to Education for Migrant Children in Thailand: Liminal legality and the educational experience of migrant children in SamutSakhon.file:///C:/Users/ Odin%20888/Downloads/SB1126_RP%20(1).pdf
Pollock, K. (2012). Access, Engagement, and Community Connections. Teaching & Learning https://brock.scholarsportal.info/journals/teachingandlearning/home/article/ viewFile/414/357
Powers, C. B., & Allaman, E. (2012). How participatory action research can promote social change and help youth development. The Kinder & Braver World Project: Research Series.http://cyber.harvard.edu/sites/cyber.harvard.edu/files/ KBWParticipatoryActionResearch2012.pdf
Queensland Government Department of Communities. (2009). Engaging Queenslanders: A guide to community engagement methods and techniques, 66. Retrieved fromhttps:// www.qld.gov.au/web/community-engagement/guides-factsheets/documents/engaging- queenslanders-methods-and-techniques.pdf
Research, C. (2011). Participatory Asset Mapping A Short Guide to Community Based Participatory Action Research GUIDE, (December 2011).http://v5.healthycity.org/ sites/hc.v5.live/files/amazon_s3/article_file/cbpar.pdf
Sabin, K.(n.d.). Capture recapture analysis. Retrieved from http://www.powershow.com/ view4/4abdfd-ZTQ5N/Capture_recapture_analysis_-_powerpoint_ppt_presentation Data accessed on 26 September, 2016.
Save the Children (2014). Educating Burmese Children in Thailand.http://resourcecentre. savethechildren.se/sites/default/files/documents/monitoring_reading_report-_ thailand-_december_2014.pdf
Save the Children (2014). Thailand Strategic Plan 2014 – 2015.https://thailand.savethechildren. net/sites/thailand.savethechildren.net/files/library/Save%20the%20Children%20 Thailand%20Strategic%20Plan%202014-2015x_0.pdf
Save the Children (2015). Beyond Access: Refugee Students’ Experiences of Myanmar State Education. https://www.researchgate.net/publication/285725891_Beyond_Access_ Refugee_Students’_Experiences_of_Myanmar_State_Education
Save the Children (n.d.). JOURNEYS – The Life Stories of Twelve Migrant Children in the Mekong Sub-region. http://resourcecentre.savethechildren.se/sites/default/files/ documents/6839.pdf
Save the Children.,& DFID. (2007). Building school based protection for migrant children in Thailand. An Example of Good Practice in the Cross-Border Project against Trafficking and Exploitation of Migrant and Vulnerable Children in the Mekong Sub-region.
Schulz, A. J., Parker, E. A., Israel, B. A., Becker, A. B., Maciak, B. J., & Hollis, R. (1998). Conducting a participatory community-based survey for a community health intervention on
Detroit’s east side. Journal of Public Health Management and Practice : JPHMP, 4(2), 10–24.https://depts.washington.edu/ccph/pdf_files/CEI-5.pdf
Shaghaghi, A., Bhopal, R. S., & Sheikh, A. (2011). Approaches to Recruiting “Hard-To-Reach” Populations into Re-search: A Review of the Literature. Health Promotion Perspectives, 1(2), 86–94.https://doi.org/10.5681/hpp.2011.009
Shallwani, S., & Mohammed, S. (2007). A Training Manual for Community-Based Researchers. http://www.livingknowledge.org/fileadmin/Dateien-Living-Knowledge/Dokumente_ Dateien/Toolbox/LK_A_Training_manual.pdf
Shanker, A., Marian, D., & Swimmer, C. (2015). Effective Interventions Aimed at Reaching Out-of-School Children A Literature Review.https://www.unicef.org/education/files/ LiteratureReview_InterventionsToReach_OOSC_UNICEF-ROSA.pdf
Singh, M. (2015).Global Perspectives on Recognizing Non-formal and Informal Learning. Technical and Vocational Education and Training: Issues, Concerns and Prospectshttp:// unesdoc.unesco.org/images/0023/002336/233655E.pdf
Tandon, D. (n.d.). Community-Based Participatory Research Curriculum for General Pediatrics Fellows.https://depts.washington.edu/ccph/pdf_files/darius%20slides%201.pdf
Thailand Country Report on Education for All (2011). Distributed during the 12th Regional Meeting of National EFA Coordinators Seoul, Republic of Korea, July 2011 http:// www.unescobkk.org/fileadmin/user_upload/efa/EFA_Coordinators_Mtg/12th_EFA_ Coord_Mtg/Country_Report_12th_EFA_Coord_Mtg_THAILAND.pdf
Thomas, M., & Burnett, N. (2015).The Economic Cost of Out-of-School Children in Southeast Asia. http://unesdoc.unesco.org/images/0023/002339/233993e.pdf
Tongliemnak, P. (2015, March). Out-of-School Children in Thailand: Issues and Challenges. http://www.flexlearnstrategies.net/Summit/index.html
Tsay, P. K., & Chao, a. (2001). Population size estimation for capture-recapture models with applications to epidemiological data. Journal of Applied Statistics, 28(August 2015), 25–36.https://doi.org/10.1080/02664760120011572
UNAIDS.(2010). Guidelines on Estimating the Size of Populations Most at Risk to HIV. UNAIDS/WHO Working Group on Global HIV/AIDS and STI Surveillance, 51. Retrieved fromhttp://www.unaids.org/en/media/unaids/contentassets/documents/ epidemiology/2011/2011_estimating_populations_en.pdf
UNESCO Thailand (2016). Executive Summary: Rapid Assessment Survey: Situation and Estimated Number of Out-of-School Children (OOSC) of Primary Education in Mae Sot District, Tak Province. September
UNESCO Institute for Statistics (2005). Children Out of School: Measuring Exclusion from Primary Education. http://www.uis.unesco.org/Library/Documents/oosc05-en.pdf
UNESCO Institute for Statistics (2009).Education Indicators Technical guidelines.http://www. uis.unesco.org/Library/Documents/eiguide09-en.pdf
UNESCO Institute for Statistics (2011). OUT-OF-SCHOOL CHILDREN: NEW DATA REVEAL
78 79
PERSISTENT CHALLENGES. http://www.uis.unesco.org/FactSheets/Documents/ FS12_2011_OOSC_EN.pdf
UNESCO Institute for Statistics (2012).International Standard Classification of Education. http://www.uis.unesco.org/Education/Documents/isced-2011-en.pdf
UNESCO Institute for Statistics (2012). REACHING OUT-OF-SCHOOL CHILDREN IS CRUCIAL FOR DEVELOPMENT. UIS FACT SHEET http://www.uis.unesco.org/ FactSheets/Documents/fs-18-OOSC-2.pdf
UNESCO Institute for Statistics (2013). UNESCO Country Programming Document for Thailand 2013-2016. http://unesdoc.unesco.org/images/0022/002268/226869E.pdf
UNESCO Institute for Statistics (2015). A growing number of children and adolescents are out of school as aid fails to meet the mark. http://unesdoc.unesco.org/ images/0023/002336/233610e.pdf
UNESCO Institute for Statistics (2016). Asia Education Summit on Flexible Learning Strategies for Out-of-School Children.http://unesdoc.unesco.org/images/0024/002464/246431E. pdf
UNESCO Institute for Statistics (2016). Estimating the Number of Out-of-School Children. Methodological Problems and Alternative Approaches India case study http://www.uis. unesco.org/Education/Documents/oosc-statistical-report-india-case-study.pdf
UNESCO Institute for Statistics (n.d.).Global Initiative on Out-of-School Children. All Children in School By 2015 https://www.unicef.org/education/files/OOSCI_flyer_FINAL.pdf
UNESCO Institute for Statistics, & UNICEF. (2012, November ). Global Initiative on Out-of- School Children, REGIONAL SYNTHESIS EAST ASIA AND THE PACIFIC. Retrieved from http://allinschool.org/wp-content/uploads/2014/08/121119-EAPRO.pdf
UNESCO Institute for Statistics.(2014). Country profiles. Retrieved November 10, 2016, from http://www.uis.unesco.org/DataCentre/Pages/country-profile. aspx?regioncode=40515&code=THA
UNESCO, ARUP, Save the Children, GFDRR, & risk RED (2015) Towards Safer School Construction, A community-based approach. Retrieved 2015, fromhttps://www.gfdrr. org/sites/default/files/publication/45179_towardssaferschoolconstruction2015_0.pdf
UNESCO.(2015). Recognition, Validation and Accreditation of Non-formal and Informal Learning in UNESCO Member States. http://unesdoc.unesco.org/ images/0023/002326/232656e.pdf
UNICEF. (2012). All children in school by 2015: Global initiative on out of school children. Ghana Country Study. http://www.uis.unesco.org/Library/Documents/out-of-school- children-ghana-country-study-2012-en.pdf
UNICEF. (2012). Out-of-School Children in Romania: Country Study. A country report, Romania. http://www.uis.unesco.org/Education/Documents/OOSCI%20Reports/ romania-oosci-report-2012-en.pdf
UNICEF. (2012). Out-of-School Children in Turkey: Country Study. A country report, Turkey.
http://education-equity.org/wp-content/uploads/2014/02/country-report-E-14.1.2014. pdf
UNICEF. (2013). Out-of-School Children in Sri Lanka: Country Study. A country report, Colombo. https://www.unicef.org/srilanka/2013_OSS_Summery_E.pdf
UNICEF. (2013). Out-of-School Children in Viet Nam: Country Study. A country report, Ha Noi. http://unesdoc.unesco.org/images/0023/002343/234310e.pdf
United Nations Children’s Fund (UNICEF), Education Section, Programme Division (2015). Global Out-of-School Children Initiative Operational Manual. Global Initiative on Out-of-School Children.http://www.uis.unesco.org/Education/Documents/oosci- operational-manual.pdf
US Census Bureau. (2015). The American Community Survey, 1(607).https://doi.org/http:// dx.doi.org/10.1080/01944360608976768
Vincent, K. S., & Science, A. (2012).Strategies for estimating the size and distribution of hard- to-reach populations with adaptive sampling.https://www.stat.sfu.ca/content/dam/sfu/ stat/alumnitheses/2012/ThesisFINAL.pdf
Vungsiriphisal, P.(2012, December). The challenge and gap of migrant children protection : Case study of Thailand Education Policy. http://www.arcmthailand.com/documents/ documentcenter/The%20challenge%20and%20gap.PDF
Vungsiriphisal, P., Auasalung, S., & Chantavanich, S. (n.d.). Migrant Children in Difficult Circumstances in Thailand. http://www.burmalibrary.org/docs09/ MigChildrenCircumstances.pdf
Vuylsteke, B., Vandenhoudt, H., Langat, L., Semde, G., Menten, J., Odongo, F., …Laga, M. (2010). Capture-recapture for estimating the size of the female sex worker population in three cities in Côte d’Ivoire and in Kisumu, western Kenya. Tropical Medicine & International Health : TM & IH, 15(12), 1537–1543. https://doi.org/10.1111/j.1365- 3156.2010.02654.x
Watters, J., & Comeau, S. (2014). Participatory Action Research: An educational tool for citizen-users of community mental health services. Retrieved, 25, 245.http://umanitoba. ca/rehabsciences/media/par_manual.pdf
Williams, M. (2010). Can we measure homelessness? A critical evaluation of “Capture – Recapture.” Methodological Innovations Online, 5, 49–59. https://doi.org/10.4256/ mio.2010.0018
Wittes, J. T., Colton, T., & Sidel, V. W. (1974).Capture-recapture methods for assessing the completeness of case ascertainment when using multiple information sources. Journal of chronic diseases, 27(1-2), 25-36.https://www.ncbi.nlm.nih.gov/pubmed/4815069
World Education, & Save the Children (2015). Education for All in Action in Thailand: A Case Study of Good Practice. The Bang Khun Tian Model. https://thailand.savethechildren. net/sites/thailand.savethechildren.net/files/library/Education%20for%20All%20in%20 Action%20in%20Thailand_Eng_resized.pdf
World Education, & Save the Children (2015). Pathways to a Better Future: A Review of
80
Education for Migrant Children in Thailand. A Situational Analysis of Two Communities: Bangkok and Mae Sot http://thailand.worlded.org/wp-content/ uploads/2016/04/MESR-Full-Report.pdf
World Health Organization.(2010). Guidelines on estimating the size of populations most at risk to HIV.http://files.unaids.org/en/media/unaids/contentassets/documents/ epidemiology/2011/2011_Estimating_Populations_en.pdf
Save the Children Thailand14th Fl., Maneeya Center Building (South), 518/5 Ploenchit Road, Lumpini, Pathumwan, Bangkok 10330, Thailand+66(0) 2684 [email protected]://thailand.savethechildren.net
Save the Children is the leading independent organisation for children in need, with programmes in 120 countries. We aim to inspire breakthroughs in the way the world treats children, and to achieve immediate and lasting change in their lives by improving their health, education and economic opportunities. In times of acute crisis, we mobilise rapid assistance to help children recover from the effects of war, conflict and natural disasters.