Embed Size (px)
Citation preview
Charles Darwin University
Australia's continental-scale acoustic tracking database and its automated qualitycontrol process
Hoenner, Xavier; Huveneers, Charlie; Steckenreuter, Andre; Simpfendorfer, Colin; Tattersall,Katherine; Jaine, Fabrice; Atkins, Natalia; Babcock, Russ; Brodie, Stephanie; Burgess,Jonathan; Campbell, Hamish; Heupel, Michelle; Pasquer, Benedicte; Proctor, Roger; Taylor,Matthew D.; Udyawer, Vinay; Harco, RobertPublished in:Scientific Data
DOI:10.1038/sdata.2017.206
Published: 30/01/2018
Document VersionPublisher's PDF, also known as Version of record
Link to publication
Citation for published version (APA):Hoenner, X., Huveneers, C., Steckenreuter, A., Simpfendorfer, C., Tattersall, K., Jaine, F., ... Harco, R. (2018).Australia's continental-scale acoustic tracking database and its automated quality control process. ScientificData, 5, 1-10. [170206]. DOI: 10.1038/sdata.2017.206
General rightsCopyright and moral rights for the publications made accessible in the public portal are retained by the authors and/or other copyright ownersand it is a condition of accessing publications that users recognise and abide by the legal requirements associated with these rights.
• Users may download and print one copy of any publication from the public portal for the purpose of private study or research. • You may not further distribute the material or use it for any profit-making activity or commercial gain • You may freely distribute the URL identifying the publication in the public portal
Take down policyIf you believe that this document breaches copyright please contact us providing details, and we will remove access to the work immediatelyand investigate your claim.
Download date: 04. Feb. 2019
Data Descriptor: Australia’scontinental-scale acoustic trackingdatabase and its automated qualitycontrol processXavier Hoenner1, Charlie Huveneers2, Andre Steckenreuter3, Colin Simpfendorfer4,Katherine Tattersall1, Fabrice Jaine3,5, Natalia Atkins1, Russ Babcock6, Stephanie Brodie3,7,Jonathan Burgess1, Hamish Campbell8, Michelle Heupel9, Benedicte Pasquer1,Roger Proctor1, Matthew D. Taylor7,10, Vinay Udyawer9 & Robert Harcourt3,5
Our ability to predict species responses to environmental changes relies on accurate records of animal movementpatterns. Continental-scale acoustic telemetry networks are increasingly being established worldwide, producing largevolumes of information-rich geospatial data. During the last decade, the Integrated Marine Observing System’s AnimalTracking Facility (IMOS ATF) established a permanent array of acoustic receivers around Australia. Simultaneously,IMOS developed a centralised national database to foster collaborative research across the user community andquantify individual behaviour across a broad range of taxa. Here we present the database and quality controlprocedures developed to collate 49.6 million valid detections from 1891 receiving stations. This dataset consists ofdetections for 3,777 tags deployed on 117marine species, with distances travelled ranging from a few to thousands ofkilometres. Connectivity between regions was only made possible by the joint contribution of IMOS infrastructure andresearcher-funded receivers. This dataset constitutes a valuable resource facilitating meta-analysis of animal movement,
distributions, and habitat use, and is important for relating species distribution shifts with environmental covariates.
Design Type(s) observation design • data integration objective
Measurement Type(s) animal activity monitoring
Technology Type(s) Telemetry Equipment Device
Factor Type(s) geographic location • Species
Sample Characteristic(s) Australia • ocean biome
1Australian Ocean Data Network, Integrated Marine Observing System University of Tasmania, Private Bag 110, Hobart,Tasmania 7001, Australia. 2School of Biological Sciences, Flinders University, GPO Box 2100, Adelaide, South Australia5001, Australia. 3Sydney Institute of Marine Science, Mosman, New South Wales 2088, Australia. 4Centre forSustainable Tropical Fisheries and Aquaculture and College of Marine and Environmental Sciences, James CookUniversity, Townsville, Queensland 4811, Australia. 5Department of Biological Sciences, Macquarie University, NewSouth Wales 2109, Australia. 6CSIRO Oceans and Atmosphere, GPO Box 2583, Brisbane 4001, Australia. 7Ecology andEvolution Research Centre, and School of Biological, Earth and Environmental Sciences, University of New South Wales,Sydney, New South Wales 2052, Australia. 8Research Institute for Environment and Livelihoods, School of Environment,Charles Darwin University, Northern Territory 0909, Australia. 9Australian Institute of Marine Science, Townsville,Queensland 4810, Australia. 10Port Stephens Fisheries Institute, New South Wales Department of Primary Industries,Taylors Beach Rd, Taylors Beach, New South Wales 2316, Australia. Correspondence and requests for materials shouldbe addressed to X.H. (email: [email protected]).
OPEN
Received: 23 August 2017
Accepted: 7 December 2017
Published: 30 January 2018
www.nature.com/scientificdata
SCIENTIFIC DATA | 5:180206 | DOI: 10.1038/sdata.2017.206 1
Background & SummaryEnvironmental changes affect the distribution and movements of marine species at differentspatiotemporal scales1,2. Consequently, the long-term monitoring of animal movement is paramountfor predicting behavioural responses under changing environmental conditions. Technological advancesof animal-borne devices over the past two decades (e.g., radio, acoustic, and satellite transmitters) haverevolutionised the field of ethology, enabling ecologists to track a variety of organisms and thereby informpolicy makers as to the changing spatiotemporal patterns of species distributions3.
Underwater passive acoustic telemetry has become a standard tool for fisheries biologists4. A uniquelyID-coded transmitter is attached or implanted in the animal and its high frequency acoustic transmissiondetected by an array of receivers deployed throughout the animals predicted range (Fig. 1). The detectionrange of acoustic receivers is typically between 60 and 950 m depending on local geography, bathymetry,and environmental conditions5, and this has limited studies to addressing regional (1–50 km) scalehypotheses, and preventing the tracking of migratory species4,6. To address this issue, broad-scaleintegrated networks, composed of acoustic receivers deployed by individual research groups, havebecome established including in Australia (Integrated Marine Observing System (IMOS)), North America(Atlantic Cooperative Telemetry, California Fish Tracking Consortium, Florida Acoustic CooperativeTelemetry), and South Africa (Acoustic Tracking Array Platform). Many of these networks are co-invested by the global Ocean Tracking Network (OTN)3,7,8, and have enhanced collaboration betweenscientists both nationally and internationally, and facilitated the study of animals moving over broaddistances and across management jurisdictions9. Any transmitter can be detected on any receiver and thedata are fed back to a central repository, thus the network expands the study area of the individualresearcher up to the continental scale.
These networks consist of a high number of receivers and transmitters. Over sufficient periods of time,tens of millions of detections are collected across the network, resulting in vast data collections. Thesedatasets are inherently complex, as they simultaneously require receiver and tag equipment specificationas well as deployment metadata information. In addition, information infrastructure is often deemednecessary in these collaborative frameworks to facilitate scientific community engagement at such a broad
TAG METADATA
- specifications
- release
MANUFACTURER SOFTWARE
data offload
IMOS ATFWEB APPLICATION
https://animaltracking.aodn.org.au
metadata entry
data upload
IMOS ATF DATABASE
NON QUALITY-CONTROLLED
DATASET
AODNPORTAL
https://portal.aodn.org.au
QUALITY-CONTROLLEDDATASET
QUALITY CONTROL
RECEIVER METADATA- specifications - deployment- recovery
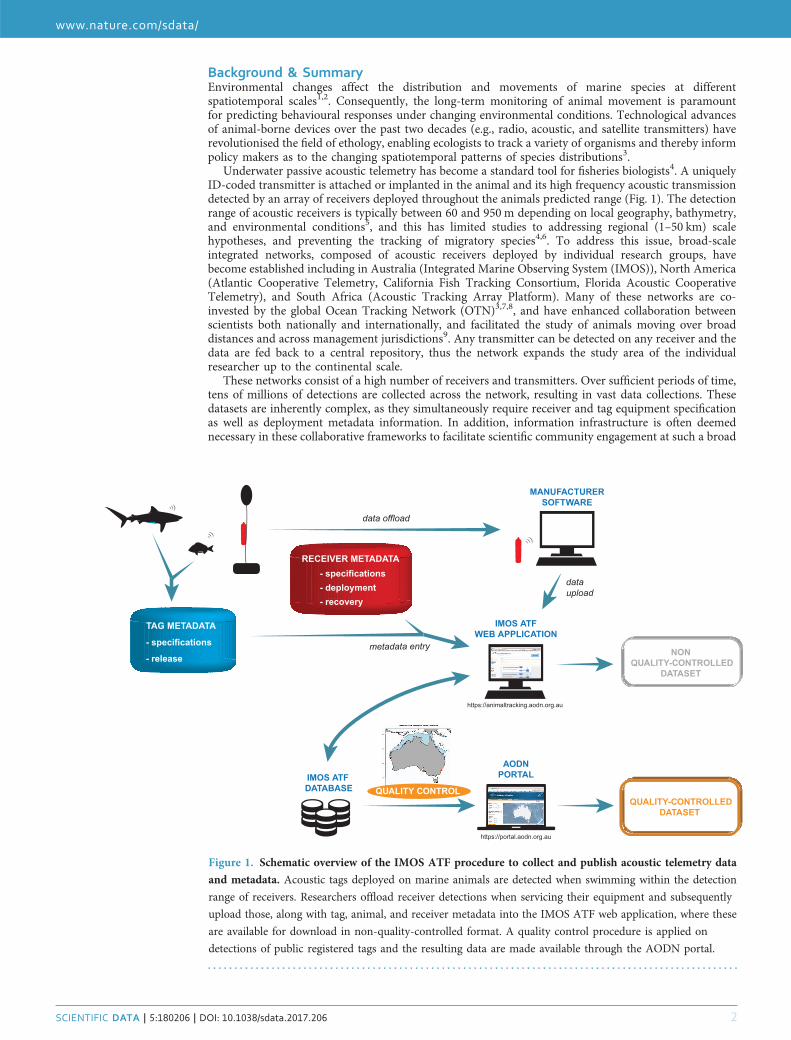
Figure 1. Schematic overview of the IMOS ATF procedure to collect and publish acoustic telemetry data
and metadata. Acoustic tags deployed on marine animals are detected when swimming within the detection
range of receivers. Researchers offload receiver detections when servicing their equipment and subsequently
upload those, along with tag, animal, and receiver metadata into the IMOS ATF web application, where these
are available for download in non-quality-controlled format. A quality control procedure is applied on
detections of public registered tags and the resulting data are made available through the AODN portal.
www.nature.com/sdata/
SCIENTIFIC DATA | 5:180206 | DOI: 10.1038/sdata.2017.206 2
geographical scale. Relational database management systems have been developed to store the resultantlarge volumes of data along with the creation of online graphical user interfaces for user metadata entryand to enhance data discovery and access10,11.
The IMOS monitors coastal waters and open oceans around Australia by deploying observingequipment to address five main research themes: multi-decadal ocean change, climate variability andweather extremes, major boundary currents, continental shelf and coastal processes and marineecosystem responses12,13. The latter theme primarily drives IMOS’ Animal Tracking Facility (ATF),which has deployed acoustic telemetry arrays for over ten years across strategically chosen locationsaround Australia specifically to facilitate connectivity between independent projects and enable detectionof large-scale movements of marine organisms. All observations collected are subsequently made freelyavailable through the Australian Ocean Data Network portal (AODN: https://portal.aodn.org.au/), theprimary national repository for marine and climate science data.
Through the IMOS ATF web interface researchers have access to millions of detections from organismsranging across 117 species tagged throughout Australia. Historical duplicate transmitter IDs and tagtransmission collisions caused by multiple transmitters within range of the same receiver or environmentalnoise14 can, however, generate erroneous data thus entailing the development of statistical methods thatautomatically flag possible invalid detections. Here we present a flexible quality control (QC) procedure foracoustic detection data that assesses, for each individual tag, the validity of detections based on a computedset of metrics. This QC procedure can readily be used for other acoustic telemetry networks. Here we applythis QC algorithm to the raw detections stored in the IMOS ATF back-end database and describe theresulting dataset of detections up until the 11th of April 2017 (Data Citation 1).
MethodsPassive acoustic telemetry datasets are comprised of three main data groups: detection data, transmittermetadata, and receiver metadata. Transmitter and receiver metadata include equipment specifications anddeployment information. For transmitters, this refers to model, type (e.g., pinger versus sensor), transmissioninterval, information about tagged organisms (e.g., species, size, sex), and tagging location and date. Forreceivers, this includes model, mooring type, depth, along with deployment and recovery dates and locations.
The IMOS ATF acoustic network is comprised of discrete arrays of acoustic receivers (installations).Depending on the study objectives installations can be configured as curtains, grids, or have no specificformation around features such as reefs or headlands6. Acoustic curtains are commonly designed tomonitor long-distance migrations or to estimate the fraction of tagged animals that crosses a line ofreceivers. They may be arranged as ‘gates’ between two headlands or across the entrance of a bay orestuary15, or as a cross-shelf curtain16. The typical configuration of acoustic curtains consists of individualstations spaced less than 800 m apart to maximise tag detection probability17, with the distance betweenstations determined by a trade-off between average tag detectability and environmental conditions5.Receivers can also be configured as grids to estimate home range or residency within specific areas6.Spacing between receivers varies from overlapping detection range to infer fine-scale positions18 toreceivers spaced several kilometres apart to monitor large areas. Each station includes an acoustic receivereither bottom mounted and diver deployable if shallower than 20 m19 or on a mooring with an acousticrelease for waters 20–150 m deep5. The design of the entire IMOS ATF network is based on the acousticreceiver manufacturer’s recommendations (VEMCO Acoustic Gate Design, https://vemco.com/wp-content/uploads/2012/11/gate_design.htm, last accessed 22 Nov 2017) in combination with additionalevidence from various scientific studies5,6,17.
Since 2007 the number of receivers held by IMOS ATF (referred to hereafter as ‘IMOS ATF receiverarrays’) has grown from 70 to 855 (Fig. 2a). In addition, the Australian acoustic telemetry network containssignificant co-investment by individual scientists and/or their organisations with 1,305 non-IMOS-fundedreceivers (referred to as ‘independent installations’) (Fig. 2a and Supplementary Material 1). The datagenerated by receivers summarises when individual tag IDs were detected, referred to as ‘detections’.Critically, for detection data to be meaningful to the community, independent researchers are encouragedto provide transmitter metadata to the IMOS ATF web application. The database therefore containsdetections for tags that have been entered voluntarily in the database (‘registered’ tags and detections) anddetections from tags that have not been entered and for which no information is available (‘unregistered’tags and detections). Acoustic receivers can also record additional data (i.e., animal depth and acceleration,water temperature) from tags equipped with sensors (referred to as ‘sensor tags’). In this case, receiversrecord a raw integer ranging 0–255, which can subsequently be converted to physical measurements usingthe sensor’s slope and intercept values following the manufacturers’ standard protocols.
While all data within the ATF database is by default publicly available following IMOS’ open datapolicy20, due to community concerns for data protection during the development of the IMOS ATFweb application21 two higher levels of data security were created within the database. An embargo22, inwhich transmitter and animal metadata are not publicly released for up to three years with the possibilityof annual extensions. This has been implemented to facilitate publication by, in particular, early careerresearchers and students. For protected data23 access to both tag metadata and detections is restricted.Protected status is available only upon application and approval by the IMOS Director and is for projectsin which public availability of detections may present an imminent threat to animals or researchprograms24.
www.nature.com/sdata/
SCIENTIFIC DATA | 5:180206 | DOI: 10.1038/sdata.2017.206 3
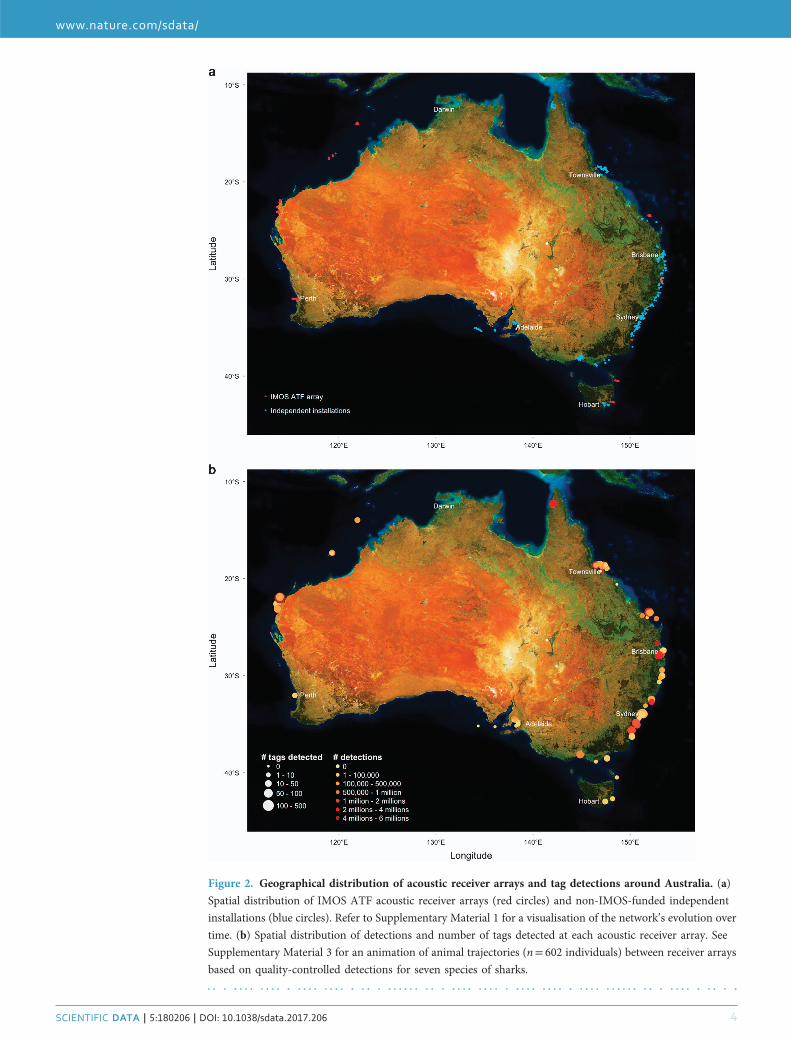
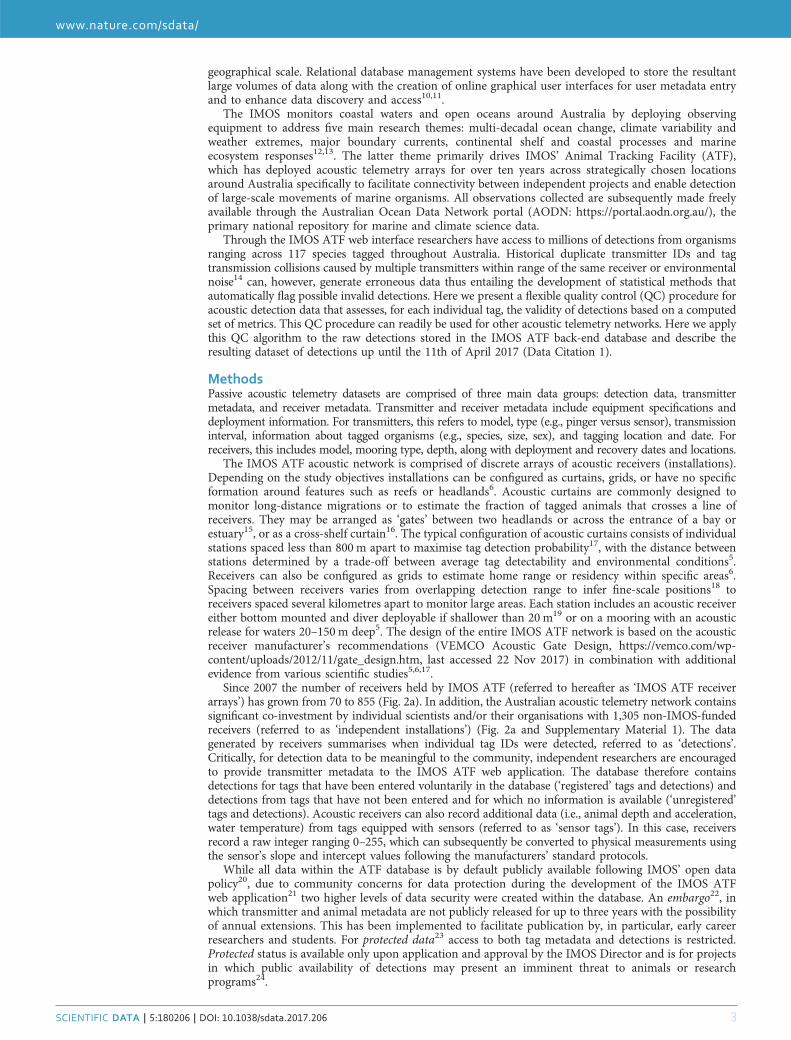
Figure 2. Geographical distribution of acoustic receiver arrays and tag detections around Australia. (a)
Spatial distribution of IMOS ATF acoustic receiver arrays (red circles) and non-IMOS-funded independent
installations (blue circles). Refer to Supplementary Material 1 for a visualisation of the network’s evolution over
time. (b) Spatial distribution of detections and number of tags detected at each acoustic receiver array. See
Supplementary Material 3 for an animation of animal trajectories (n= 602 individuals) between receiver arrays
based on quality-controlled detections for seven species of sharks.
www.nature.com/sdata/
SCIENTIFIC DATA | 5:180206 | DOI: 10.1038/sdata.2017.206 4
The ATF database supports a front-end web application (https://animaltracking.aodn.org.au/) throughwhich users input transmitter and receiver metadata, upload detections from receivers, and maydownload raw (i.e., not quality controlled) detection data in a CSV file format using filtering tools (Fig. 1).User access to information is managed by this graphical user interface and based on the user’s registrationstatus along with their role within a given project.
Code availabilityAll IMOS information infrastructure is open source and thus freely available for others to re-use. Thecode underlying the IMOS ATF web application and database is accessible through the correspondingGitHub repository (https://github.com/aodn/aatams; Supplementary Material 2). The version controlledR25 code used to extract and flag detection data and tag metadata is also available on GitHub (https://github.com/aodn/aatams/tree/master/scripts/R/QC).
Data RecordsReceiver networkSince IMOS’ inception in 2007, receivers have been deployed at 1891 stations across 103 installations fora total of 7,015 deployments ranging from 113.6° to 154.0°E and 11.8° to 43.1°S (Fig. 2a). IMOS accountsfor 40.0% of receivers and 46.9% of all receiver deployments, and represents 30.2 and 21.4% of all stationsand installations, respectively.
Tag networkThe IMOS ATF database holds a total of 60.6 million ‘raw’ detections from tags deployed on 117 species(Fig. 2b and Supplementary Material 3). Of these, ‘unregistered’ tags accounted for 8.1 million detections(13.3%) while embargoed and protected data represented 2.9 million detections (4.7%). We hereinpublish quality-controlled data for 3,777 individual tag deployments totalling 49.6 million detections(Data Citation 1). Of those, 15.1 million (30.5%) and 34.5 million (69.5%) detections occurred on IMOSand non-IMOS installations, respectively.
Data field Description Values or units
transmitter_id Combination of code map and ping ID. Dual sensor tags are associatedwith multiple transmitter IDs.
Alphanumeric sequence, e.g., A69-9002-12345
installation_name Name of installation on which the transmitter was detected. Aninstallation typically consists of multiple receiving stations.
station_name Name of receiving station on which the transmitter was detected.Acoustic receivers typically get deployed multiple times at the samestation.
receiver_name Name of acoustic receiver; combines receiver model with its serialnumber.
Alphanumeric sequence, e.g., VR2W-123456
detection_timestamp Date and time of tag detection. Year-Month-Day Hour:Minute:Second
longitude Longitude at which receiver was deployed and tag was detected. In decimal degrees
latitude Latitude at which receiver was deployed and tag was detected. In decimal degrees
sensor_value Physical measurement recorded by a tag’s sensor, if applicable. If sensor data has not been converted thensensor_unit= ‘ADC’ and values range from 0 to 255
sensor_unit Physical unit associated with sensor values. Either ‘ADC’, ‘°C’, ‘m’ or ‘m/s2’
FDA_QC Quality control flag for the false detection algorithm. 1: passed2: failed
Velocity_QC Velocity from previous and next detections both≤ 10 m.s− 1? 1: yes2: no
Distance_QC Distance from previous and next detections both≤ 1000 km? 1: yes2: no
DetectionDistribution_QC Detection occurred within expert distribution area? 1: yes2: no3: test not performed
DistanceRelease_QC Detection occurred within 500 km of release location? 1: yes2: no
ReleaseDate_QC Detection occurred before tag release date? 1: yes2: no
ReleaseLocation_QC Tag release geographical coordinates within expert distribution areaand/or within 500 km of first detection?
1: yes2: no3: test not performed
Detection_QC Composite detection flag indicating likely validity of detections. 1: valid detection2: probably valid detection3: probably invalid detection4: invalid detection
Table 1. Name, description, and values of each QC detection data field.
www.nature.com/sdata/
SCIENTIFIC DATA | 5:180206 | DOI: 10.1038/sdata.2017.206 5
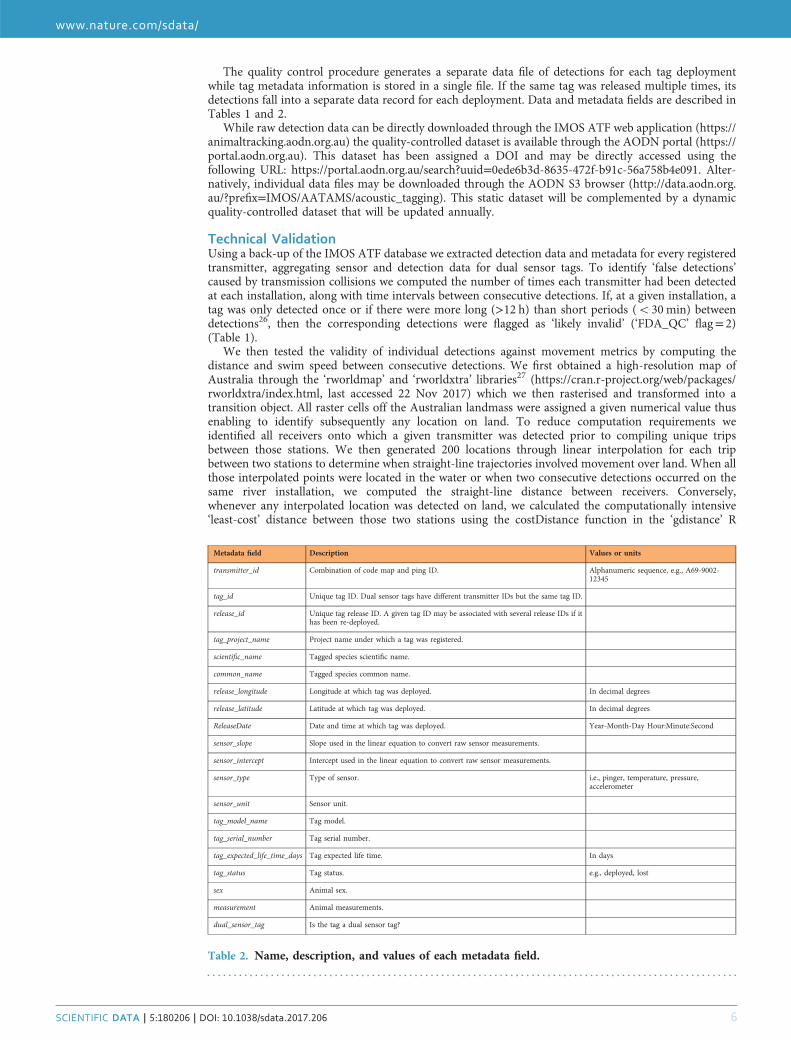
The quality control procedure generates a separate data file of detections for each tag deploymentwhile tag metadata information is stored in a single file. If the same tag was released multiple times, itsdetections fall into a separate data record for each deployment. Data and metadata fields are described inTables 1 and 2.
While raw detection data can be directly downloaded through the IMOS ATF web application (https://animaltracking.aodn.org.au) the quality-controlled dataset is available through the AODN portal (https://portal.aodn.org.au). This dataset has been assigned a DOI and may be directly accessed using thefollowing URL: https://portal.aodn.org.au/search?uuid=0ede6b3d-8635-472f-b91c-56a758b4e091. Alter-natively, individual data files may be downloaded through the AODN S3 browser (http://data.aodn.org.au/?prefix=IMOS/AATAMS/acoustic_tagging). This static dataset will be complemented by a dynamicquality-controlled dataset that will be updated annually.
Technical ValidationUsing a back-up of the IMOS ATF database we extracted detection data and metadata for every registeredtransmitter, aggregating sensor and detection data for dual sensor tags. To identify ‘false detections’caused by transmission collisions we computed the number of times each transmitter had been detectedat each installation, along with time intervals between consecutive detections. If, at a given installation, atag was only detected once or if there were more long (>12 h) than short periods (o30 min) betweendetections26, then the corresponding detections were flagged as ‘likely invalid’ (‘FDA_QC’ flag= 2)(Table 1).
We then tested the validity of individual detections against movement metrics by computing thedistance and swim speed between consecutive detections. We first obtained a high-resolution map ofAustralia through the ‘rworldmap’ and ‘rworldxtra’ libraries27 (https://cran.r-project.org/web/packages/rworldxtra/index.html, last accessed 22 Nov 2017) which we then rasterised and transformed into atransition object. All raster cells off the Australian landmass were assigned a given numerical value thusenabling to identify subsequently any location on land. To reduce computation requirements weidentified all receivers onto which a given transmitter was detected prior to compiling unique tripsbetween those stations. We then generated 200 locations through linear interpolation for each tripbetween two stations to determine when straight-line trajectories involved movement over land. When allthose interpolated points were located in the water or when two consecutive detections occurred on thesame river installation, we computed the straight-line distance between receivers. Conversely,whenever any interpolated location was detected on land, we calculated the computationally intensive‘least-cost’ distance between those two stations using the costDistance function in the ‘gdistance’ R
Metadata field Description Values or units
transmitter_id Combination of code map and ping ID. Alphanumeric sequence, e.g., A69-9002-12345
tag_id Unique tag ID. Dual sensor tags have different transmitter IDs but the same tag ID.
release_id Unique tag release ID. A given tag ID may be associated with several release IDs if ithas been re-deployed.
tag_project_name Project name under which a tag was registered.
scientific_name Tagged species scientific name.
common_name Tagged species common name.
release_longitude Longitude at which tag was deployed. In decimal degrees
release_latitude Latitude at which tag was deployed. In decimal degrees
ReleaseDate Date and time at which tag was deployed. Year-Month-Day Hour:Minute:Second
sensor_slope Slope used in the linear equation to convert raw sensor measurements.
sensor_intercept Intercept used in the linear equation to convert raw sensor measurements.
sensor_type Type of sensor. i.e., pinger, temperature, pressure,accelerometer
sensor_unit Sensor unit.
tag_model_name Tag model.
tag_serial_number Tag serial number.
tag_expected_life_time_days Tag expected life time. In days
tag_status Tag status. e.g., deployed, lost
sex Animal sex.
measurement Animal measurements.
dual_sensor_tag Is the tag a dual sensor tag?
Table 2. Name, description, and values of each metadata field.
www.nature.com/sdata/
SCIENTIFIC DATA | 5:180206 | DOI: 10.1038/sdata.2017.206 6
package (https://cran.r-project.org/web/packages/gdistance/index.html, last accessed 22 Nov 2017) whichaccounted for the shape of Australia’s coastline. While the spatial resolution of our map was appropriatefor representing the ocean’s coastline it was too coarse for small river systems. Thus, for consecutivedetections occurring in two different rivers (or in a river and the adjacent ocean), in addition to the abovedescribed distance calculation, our algorithm also systematically computed the straight-line distancebetween the river receiver and the closest point on the coastline. A given detection was then flagged as‘invalid’ if both the distances with the previous and next receiver were greater than 1,000 km(‘Distance_QC’= 2) or if the corresponding travel velocities were greater than 10 m.s− 1 (‘Velocity_QC’=2) (Table 1). The 1,000 km distance threshold is a conservative value based on the greatest minimumdistance between neighbouring installations (mean± s.d.= 61.3± 148.6 km, range= 0.3–1,005 km,n= 104 installations), while the velocity threshold was assigned from maximum swim speeds recordedfor southern bluefin tuna (Thunnus maccoyii, Castelnau, 1872) and mako shark (Isurus oxyrinchus,Rafinesque, 1810), the two fastest species in the IMOS ATF database28,29. Note that for detectionsoccurring at the same time on two distinct receivers we approximated to one second the correspondingtime interval to be able to compute swim speed.
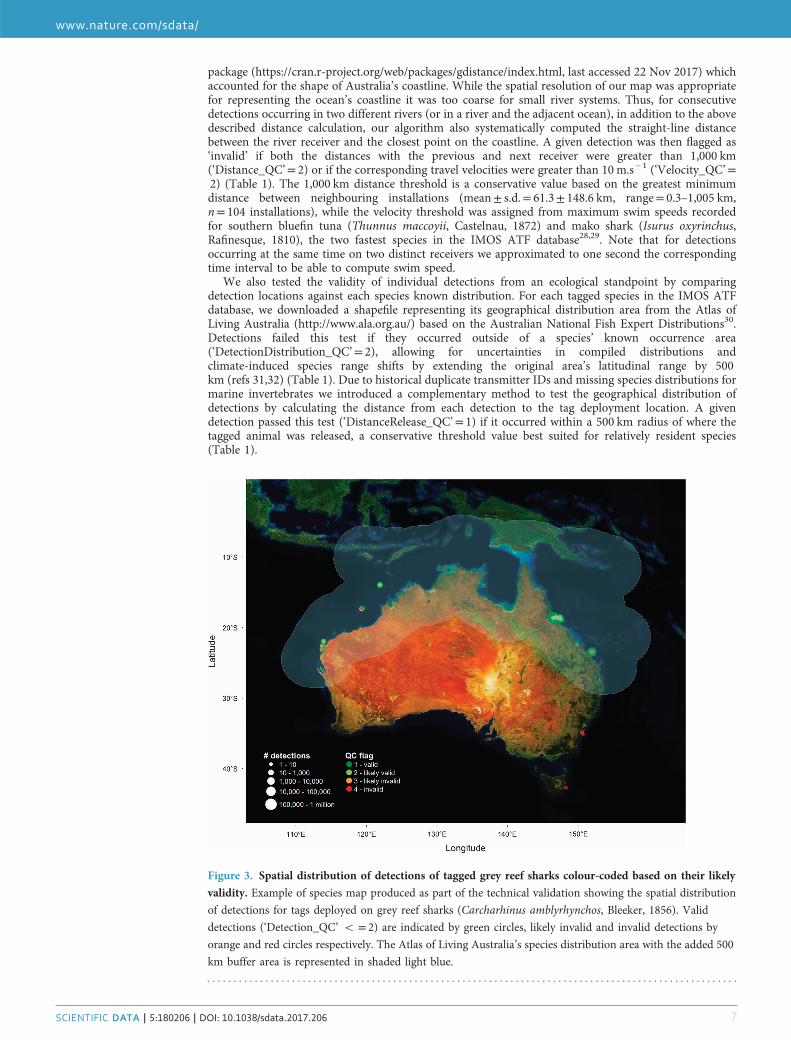
We also tested the validity of individual detections from an ecological standpoint by comparingdetection locations against each species known distribution. For each tagged species in the IMOS ATFdatabase, we downloaded a shapefile representing its geographical distribution area from the Atlas ofLiving Australia (http://www.ala.org.au/) based on the Australian National Fish Expert Distributions30.Detections failed this test if they occurred outside of a species’ known occurrence area(‘DetectionDistribution_QC’= 2), allowing for uncertainties in compiled distributions andclimate-induced species range shifts by extending the original area’s latitudinal range by 500km (refs 31,32) (Table 1). Due to historical duplicate transmitter IDs and missing species distributions formarine invertebrates we introduced a complementary method to test the geographical distribution ofdetections by calculating the distance from each detection to the tag deployment location. A givendetection passed this test (‘DistanceRelease_QC’= 1) if it occurred within a 500 km radius of where thetagged animal was released, a conservative threshold value best suited for relatively resident species(Table 1).
Figure 3. Spatial distribution of detections of tagged grey reef sharks colour-coded based on their likely
validity. Example of species map produced as part of the technical validation showing the spatial distribution
of detections for tags deployed on grey reef sharks (Carcharhinus amblyrhynchos, Bleeker, 1856). Valid
detections (‘Detection_QC’ o = 2) are indicated by green circles, likely invalid and invalid detections by
orange and red circles respectively. The Atlas of Living Australia’s species distribution area with the added 500
km buffer area is represented in shaded light blue.
www.nature.com/sdata/
SCIENTIFIC DATA | 5:180206 | DOI: 10.1038/sdata.2017.206 7
Finally, we also isolated (1) detections occurring before a tag’s release date ('ReleaseDate_QC’= 2)allowing for potential time zone discrepancies, and (2) likely invalid release locations (‘ReleaseLocation’=2) by calculating the straight-line distance with the first detection and testing whether the releasecoordinates were within the ALA species distribution area (Table 1).
For researchers to re-use detection data easily we computed an additional field, ‘Detection_QC’,summarising the output of the five first tests undertaken on individual detections, i.e., ‘FDA_QC’,‘Distance_QC’, ‘Velocity_QC’, ‘DetectionDistribution_QC’, and ‘DistanceRelease_QC’ (Table 1). If five ofthese fields had a valid QC flag of 1, then ‘Detection_QC’ was assigned 1, meaning the detection isdeemed ‘valid’. If only four of these fields had a QC flag of 1 then ‘Detection_QC’= 2, meaning thedetection is ‘likely to be valid’. Detections having three or less than three of these five fields with a QC flagof 1 were considered ‘likely invalid’ or ‘invalid’, respectively.
43.2 million detections (87.1%) were flagged by the quality control process as valid (‘Detection_QC’=1) while 48.9 millions (98.6%) were valid or likely valid (‘Detection_QC’= 1 or 2). As a result, about730,000 detections (1.4%) were identified as invalid or likely invalid (‘Detection_QC’= 3 or 4), with 126tags (3.3%) having all their detections flagged as such, primarily because of potentially inaccurate ormissing species distribution areas.
In addition to the scripts for downloading and analysing detection data, we produced multiple log filesproviding diagnostic information about each tag and a summary of their QC flags. Such validation wasessential to identify metadata content issues and was an invaluable tool to strengthen the robustness ofboth the IMOS ATF web application and underlying database. Furthermore, for each of the 117 speciesdetected on the Australian acoustic receiver network, we plotted the location of valid and invaliddetections (Fig. 3), thus enabling us to visualise how the QC algorithm performed with changingparameters and threshold values. Species occurrence data validated through the present approach willsubsequently be shared with (1) the Atlas of Living Australia, and (2) FishMap experts (http://fish.ala.org.au/) to contribute to existing biodiversity records and thus help refine geographical distribution maps.
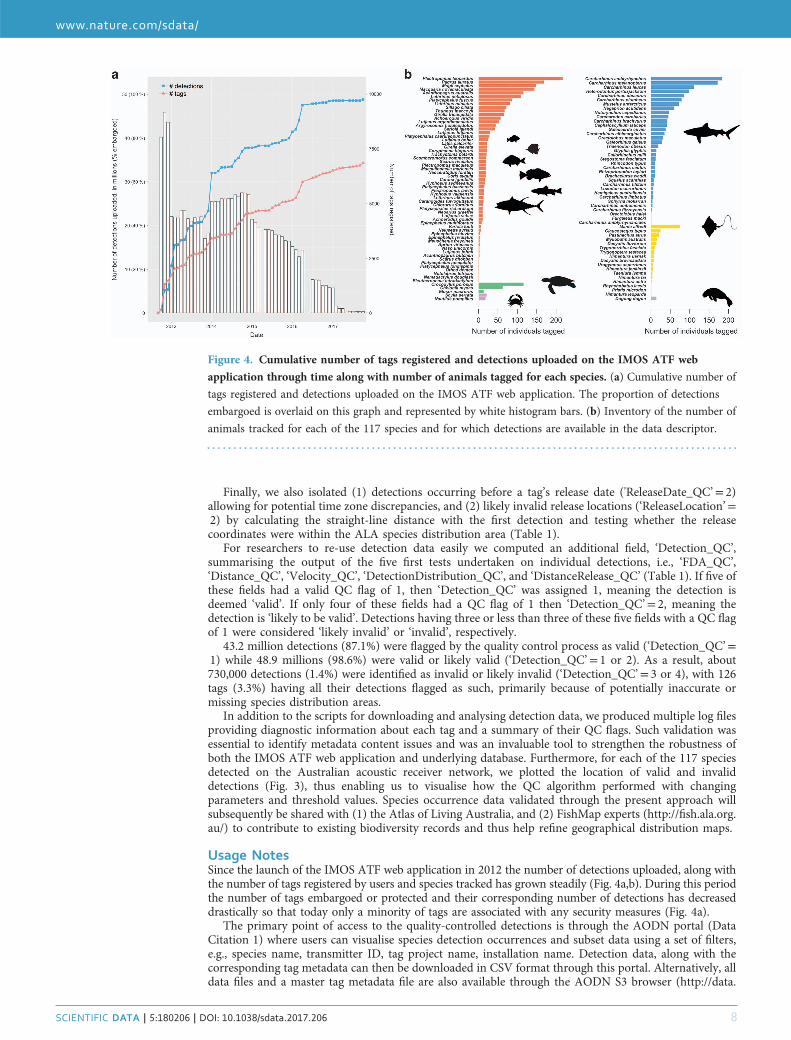
Usage NotesSince the launch of the IMOS ATF web application in 2012 the number of detections uploaded, along withthe number of tags registered by users and species tracked has grown steadily (Fig. 4a,b). During this periodthe number of tags embargoed or protected and their corresponding number of detections has decreaseddrastically so that today only a minority of tags are associated with any security measures (Fig. 4a).
The primary point of access to the quality-controlled detections is through the AODN portal (DataCitation 1) where users can visualise species detection occurrences and subset data using a set of filters,e.g., species name, transmitter ID, tag project name, installation name. Detection data, along with thecorresponding tag metadata can then be downloaded in CSV format through this portal. Alternatively, alldata files and a master tag metadata file are also available through the AODN S3 browser (http://data.
Figure 4. Cumulative number of tags registered and detections uploaded on the IMOS ATF web
application through time along with number of animals tagged for each species. (a) Cumulative number of
tags registered and detections uploaded on the IMOS ATF web application. The proportion of detections
embargoed is overlaid on this graph and represented by white histogram bars. (b) Inventory of the number of
animals tracked for each of the 117 species and for which detections are available in the data descriptor.
www.nature.com/sdata/
SCIENTIFIC DATA | 5:180206 | DOI: 10.1038/sdata.2017.206 8
aodn.org.au/?prefix=IMOS/AATAMS/acoustic_tagging). Data file names use the following convention,whose combination of IDs may be subsequently used to identify the corresponding metadata record inthe tag metadata file: ‘TransmitterID_TagID_ReleaseID.csv’ (Table 2). Note that a given tag ID may beassociated with multiple releases in case of capture/re-deployment and that multiple transmitter IDs maybe associated with the same tag ID for dual sensor tags. Based on our technical validation process werecommend users discard all detections flagged as invalid or likely invalid (‘Detection_QC’= 3 or 4).Although some verification may be required, working with valid and likely valid detections(‘Detection_QC’= 1 and 2) provides the most accurate picture of individual movement while retainingsignificantly more data than valid detections only (‘Detection_QC’= 1) (Supplementary Material 4).
References1. Jaine, F. R. A. et al.When giants turn up: sighting trends, environmental influences and habitat use of the manta ray Manta alfrediat a coral reef. PLOS ONE 7, e46170 (2012).
2. Schlaff, A. M., Heupel, M. R. & Simpfendorfer, C. A. Influence of environmental factors on shark and ray movement, behaviourand habitat use: a review. Reviews in Fish Biology and Fisheries 24, 1089–1103 (2014).
3. Hussey, N. E. et al. Aquatic animal telemetry: A panoramic window into the underwater world. Science 348, 1255642 (2015).4. Heupel, M. & Webber, D. Trends in acoustic tracking: where are the fish going and how will we follow them? Advances in FishTagging and Marking Technology. American Fisheries Society Symposium 76, 219–231 (2012).
5. Huveneers, C. et al. The influence of environmental parameters on the performance and detection range of acoustic receivers.Methods in Ecology and Evolution 7, 825–835 (2016).
6. Heupel, M. R., Semmens, J. M. & Hobday, A. J. Automated acoustic tracking of aquatic animals: scales, design and deployment oflistening station arrays. Marine and Freshwater Research 57, 1–13 (2006).
7. O'Dor, R., Stokesbury, M. J. W., Amiro, P. G. & Halfyard, E. The Ocean Tracking Network: cutting edge technology on aglobal scale. The Journal of Ocean Technology 3, 23–26 (2008).
8. O’Dor, R. K., Stokesbury, M. J. in Tagging and Tracking of Marine Animals with Electronic Devices (eds Nielsen, J. L. et al. )91–100 (Springer, 2009).
9. Heupel, M. R. et al. Conservation challenges of sharks with continental scale migrations. Frontiers in Marine Science 2, 12 (2015).10. Campbell, H. A. et al. Finding our way: on the sharing and reuse of animal telemetry data in Australasia. Sci Total Environ 534,
79–84 (2015).11. Campbell, H. A., Urbano, F., Davidson, S., Dettki, H. & Cagnacci, F. A plea for standards in reporting data collected by animal-
borne electronic devices. Animal Biotelemetry 4, 1 (2016).12. IMOS. National science and implementation plan 2015-25, http://imos.org.au/fileadmin/user_upload/shared/IMOSGeneral/
documents/IMOS/Plans___Reports/Science_Implementation_Plans/IMOS_National_Science_and_Implementation_Plan_Ver-y_FINAL_V2.pdf (2015).
13. Hill, K., Moltmann, T., Proctor, R. & Allen, S. The Australian Integrated Marine Observing System: delivering data streams toaddress national and international research priorities. Marine Technology Society Journal 44, 65–72 (2010).
14. Simpfendorfer, C. A. et al. Ghosts in the data: false detections in VEMCO pulse position modulation acoustic telemetrymonitoring equipment. Animal Biotelemetry 3, 55–64 (2015).
15. Barnett, A., Abrantes, K. G., Stevens, J. D. & Semmens, J. Site fidelity and sex-specific migration in a mobile apex predator:implications for conservation and ecosystem dynamics. Animal Behaviour 81, 1039–1048 (2011).
16. Steckenreuter, A. et al. Optimising the design of large-scale acoustic telemetry curtains. Marine and Freshwater Research 68,1403–1413 (2016).
17. Hobday, A. J., Pincock, D. in American Fisheries Society Symposium 76 (eds McKenzie, J. R. et al. )325–346 (American FisheriesSociety, 2012).
18. Espinoza, M., Farrugia, T., Webber, D., Smith, F. & Lowe, C. G. Testing a new acoustic telemetry technique to quantify long-term,fine-scale movements of aquatic animals. Fisheries Research 108, 364–371 (2011).
19. Lee, K. A., Huveneers, C., Macdonald, T. & Harcourt, R. G. Size isn't everything: movements, home range, and habitat preferencesof eastern blue gropers (Achoerodus viridis) demonstrate the efficacy of a small marine reserve. Aquatic Conservation: Marineand Freshwater Ecosystems 25, 174–186 (2015).
20. IMOS. IMOS Animal Tracking Data Security Policy, http://imos.org.au/fileadmin/user_upload/shared/AATAMS/IMOS-Ani-mal_Tracking_-_Database_Security_Policy.pdf (2016).
21. Meeuwig, J. J., Harcourt, R. G. & Whoriskey, F. G. When science places threatened species at risk. Conservation Letters 8,151–152 (2015).
22. IMOS. IMOS Animal Tracking—Tag Embargo Policy, http://imos.org.au/fileadmin/user_upload/shared/AATAMS/IMOS-Ani-mal_Tracking_-_Tag_Embargo_Policy.pdf (2016).
23. IMOS. IMOS Animal Tracking—Protected Data Policy, http://imos.org.au/fileadmin/user_upload/shared/AATAMS/IMOS-Ani-mal_Tracking_-_Protected_Data_Policy.pdf (2016).
24. Cooke, S. J. et al. Troubling issues at the frontier of animal tracking for conservation and management. Conservation Biology 31,1205–1207 (2017).
25. R Core Team. R: A language and environment for statistical computing. R Foundation for Statistical Computing, Vienna, Austria.https://www.r-project.org/ (2016).
26. Pincock, D. G. False detections: what they are and how to remove them from detection data http://vemco.com/wp-content/uploads/2012/11/false_detections.pdf (2012).
27. South, A. rworldmap: a new R package for mapping global data. The R Journal 3, 35–43 (2011).28. Fitzgibbon, Q. P., Seymour, R. S., Ellis, D. & Buchanan, J. The energetic consequence of specific dynamic action in southern
bluefin tuna Thunnus maccoyii. Journal of Experimental Biology 210, 290–298 (2007).29. Sepulveda, C. A., Kohin, S., Chan, C., Vetter, R. & Graham, J. B. Movement patterns, depth preferences, and stomach tem-
peratures of free-swimming juvenile mako sharks, Isurus oxyrinchus, in the Southern California Bight. Marine Biology 145,191–199 (2004).
30. Lyne, V. D. et al. Analysis of Australian continental shelf provinces and biomes based on fish data http://www.cmar.csiro.au/e-print/open/2009/lynevd_2009.pdf (2009).
31. Davis, M. B. & Shaw, R. G. Range shifts and adaptive responses to quaternary climate change. Science 292, 673–679 (2001).32. Lucas, C., Timbal, B. & Nguyen, H. The expanding tropics: a critical assessment of the observational and modeling studies. Wiley
Interdisciplinary Reviews: Climate Change 5, 89–112 (2014).
Data Citation1. Hoenner, X. et al. Australian Ocean Data Network http://dx.doi.org/10.4225/69/5979810a7dd6f (2017).
www.nature.com/sdata/
SCIENTIFIC DATA | 5:180206 | DOI: 10.1038/sdata.2017.206 9
AcknowledgementsData was sourced from the Acoustic Tracking Database (https://animaltracking.aodn.org.au) of theIntegrated Marine Observing System (IMOS; www.imos.org.au)—IMOS is a national collaborativeresearch infrastructure supported by Australian Government. It is operated by a consortium ofinstitutions as an unincorporated joint venture, with the University of Tasmania as Lead Agent. Thedatabase is a central acoustic telemetry data repository maintained by the IMOS ATF. We acknowledgethe contributions from all collaborators and their institutions to the content of the IMOS ATF database.For use of the contents of the IMOS ATF database, IMOS ATF recommends adhering to the VancouverProtocol and Permission to Publish & Professional Courtesy, guidelines established by the MOTUSWildlife Tracking System (www.motus.org) and summarised here: http://imos.org.au/fileadmin/user_up-load/shared/AATAMS/Recommended_guidelines_for_using_data_from_the_IMOS_ATF_Acoustic_A-nimal_Tracking_Database_July2017.pdf.
Author ContributionsX.H. collated data, developed the QC algorithm and wrote the manuscript. A.S., C.H. wrote themanuscript. A.S., C.S., K.T. helped X.H. conceive the QC study. X.H., F.J., and V. U. designed figures. J.B.developed the web app and database. X.H., N.A., and B.P. published the dataset online. R.H. is theprincipal coordinator and instigated the project. All other co-authors are members of the IMOS ATFacoustic telemetry task team, and have contributed to the funding, design, principles and frameworkunderpinning both data handling and infrastructure deployment for the life of the facility. All co-authorscontributed to the preparation of the manuscript.
Additional InformationSupplementary Information accompanies this paper at http://www.nature.com/sdata
Competing interests: The authors declare no competing financial interests.
How to cite this article: Hoenner, X. et al. Australia’s continental-scale acoustic tracking database and itsautomated quality control process. Sci. Data 5:180206 doi: 10.1038/sdata.2017.206 (2018).
Publisher’s note: Springer Nature remains neutral with regard to jurisdictional claims in published mapsand institutional affiliations.
Open Access This article is licensed under a Creative Commons Attribution 4.0 Interna-tional License, which permits use, sharing, adaptation, distribution and reproduction in any
medium or format, as long as you give appropriate credit to the original author(s) and the source, provide alink to the Creative Commons license, and indicate if changes were made. The images or other third partymaterial in this article are included in the article’s Creative Commons license, unless indicated otherwise ina credit line to the material. If material is not included in the article’s Creative Commons license and yourintended use is not permitted by statutory regulation or exceeds the permitted use, you will need to obtainpermission directly from the copyright holder. To view a copy of this license, visit http://creativecommons.org/licenses/by/4.0/
The Creative Commons Public Domain Dedication waiver http://creativecommons.org/publicdomain/zero/1.0/ applies to the metadata files made available in this article.
© The Author(s) 2018
www.nature.com/sdata/
SCIENTIFIC DATA | 5:180206 | DOI: 10.1038/sdata.2017.206 10