Embed Size (px)
Citation preview
REPUBLIC OF ARMENIAENERGY SECTOR NOTE
October 2011
Sustainable Development DepartmentEurope and Central Asia Region
Charged Decisions: Difficult Choices in Armenia’s Energy
Sector
Charged Decisions: Difficult Choices in Armenia’s Energy Sector
REPUBLIC OF ARMENIAENERGY SECTOR NOTE
Sustainable Development Department
Europe and Central Asia Region
Ani Balabanyan
Arthur Kochnakyan
Gevorg Sargsyan
Denzel Hankinson
Lauren Pierce
THE WORLD BANK

This report is a product of the staff of the International Bank for Reconstruction and Development / The World Bank. The findings, interpretations, and conclusions expressed in this volume do not necessarily reflect the views of the Executive Directors of The World Bank or the governments they represent.
The World Bank does not guarantee the accuracy of the data included in this work. The boundaries, colors, denominations, and other information shown on any map in this work do not imply any judgment on the part of the World Bank concerning the legal status of any territory or the endorsement or acceptance of such boundaries.
UDC 620.9(479.25)
ISBN 978-9939-831-18-3 © The World Bank
CHARGED DECISIONS: DIFFICULT CHOICES IN ARMENIA’S ENERGY SECTOR iii
Table of Contents
ACRONYMS AND ABBREVIATIONS .............................................................VI
EXECUTIVE SUMMARY ............................................................................VIII
1 INTRODUCTION................................................................................ 1
2 OVERVIEW OF ARMENIA’S ENERGY SECTOR REFORMS .................... 22.1 What has Armenia Achieved? ............................................................22.2 What are the Objectives for the Future? ............................................ 62.3 Conclusion .................................................................................. 6
3 PRINCIPAL CHALLENGES IN THE ENERGY SECTOR ........................... 73.1 Emerging Supply Gap .....................................................................73.2 Maintaining Energy Supply Reliability .............................................. 133.3 Affordability of Tariffs ................................................................... 143.4 Conclusions ................................................................................ 15
4 POTENTIAL SOLUTIONS TO THE CHALLENGES ................................164.1 New Capacity .............................................................................. 164.2 Energy Security ...........................................................................294.3 Affordability ................................................................................324.4 Summary ...................................................................................38
APPENDIX A: HISTORY OF ENERGY SECTOR REFORMS IN ARMENIA ......41
APPENDIX B: OVERVIEW OF THE REGULATORY FRAMEWORK................ 45
APPENDIX C: ARMENIA’S ENERGY SECTOR COMPARISONS ................... 48
APPENDIX D: ARMENIA’S ELECTRICITY INFRASTRUCTURE .................... 50
APPENDIX E: DEMAND FORECASTING ................................................... 56
APPENDIX F: SUPPLY SIDE METHODOLOGY ..........................................88
APPENDIX G: RECENT EXPERIENCE WITH CONSTRUCTION OF NEW NUCLEAR PLANTS ............................................................ 92
iv CHARGED DECISIONS: DIFFICULT CHOICES IN ARMENIA’S ENERGY SECTOR
TablesTable 2.1: Improvements in Armenia’s Energy Sector over the Past Decade ............2Table 4.1: Which Types of Plant Have the Lowest Tariff Impact and Why? ............. 21Table 4.2: Strategic Petroleum Reserve Alternatives ......................................... 31Table A.1: Ownership Transfer of Major Power Plants in Armenia .......................42Table C.1: Comparing Armenia’s Reforms ..................................................... 48Table C.2: Armenia’s Energy Sector Compared to Other Countries against Key
Indicators ...................................................................................49Table D.1: Capacity, Age and Ownership of Armenia’s Power Plants ....................50Table D.2: ENA’s Investment Plans (2009-13) ...................................................54Table E.1: Explanation of terms used in econometric model .............................. 60Table E.2: Estimated Residential Model .......................................................... 61Table E.3: Estimated Non-Residential Model ...................................................62Table E.4: Peak Load Forecasts 2011-2029 (MW) .............................................65Table E.5: Generation Forecasts 2011-2029 ....................................................76Table F.1: Physical Assumptions about Specific Power Plants ........................... 89Table F.2: Cost Assumptions about Specific Power Plants ................................. 91Table G.1: MIT Cost Estimates based on Light Water Reactors in Japan ................93Table G.2: Estimates of Capital Cost Escalation from Various Entities ...................95Table G.3: Comparison of Recent Overnight Cost Estimates ...............................95Table G.4: Cost Advantages and Disadvantages of Nuclear versus Natural Gas .......97Table G.5: Cost of reactor grade uranium ..................................................... 100Table G.6: Average Decommissioning Costs ................................................... 101
FiguresFigure 2.1: Organizational Chart of Armenia’s Electricity Sector.............................3Figure 2.2: Historical Generation in Armenia (2003-2010) ................................... 4Figure 2.3: Monthly Generation Profile (2010) ................................................... 4Figure 2.4: Heating fuel mix in Armenia, 2003-2010 ........................................... 5Figure 2.5: Organizational Chart of Armenia’s Gas Sector ................................... 6Figure 3.1: Installed Versus Operating Capacity of Generation ............................. 8Figure 3.2: Gap between Installed Capacity and Peak Winter Demand in 2017
under Three Demand Forecasts ...................................................... 10Figure 3.3: Gap between Electricity Generation and Consumption under
Highest and Lowest Demand Forecasts ............................................ 12Figure 4.1: Comparison of Levelized Energy Cost of Generation Options
(Concessional Financing) ............................................................... 18
CHARGED DECISIONS: DIFFICULT CHOICES IN ARMENIA’S ENERGY SECTOR v
Figure 4.2: Comparison of Levelized Energy Cost of Generation Options (Commercial Financing) ................................................................ 18
Figure 4.3: Real Tariff Impact of New Capacity Options .....................................20Figure 4.4: Adequacy of Supply: Nuclear Options in Meeting Peak ......................23Figure 4.5: Adequacy of Supply: Gas Options in Meeting Peak............................24Figure 4.6: Adequacy of Supply: Nuclear Options in Meeting Reserve Margin ........25Figure 4.7: Adequacy of Supply: Gas Options in Meeting Reserve Margin .............26Figure 4.8: Generation Gap: Nuclear-Only Scenario ..........................................27Figure 4.9: Using HHI to Assess Energy Supply Diversity .....................................29Figure 4.10: Gas Pipeline Utilization and Possible Constraints ..............................32Figure 4.11: Tradeoffs - Cost and Supply Diversity ..............................................38Figure 4.12: Delaying Retirement (Metsamor NPP, Hrazdan TPP and
Yerevan TPP) ..............................................................................40Figure E.1: Total Electricity Sales (1996-2010) ..................................................56Figure E.2: Real Electricity Prices by Consumer Type .........................................57Figure E.3: Real Quarterly GDP ................................................................... 58Figure E.4: Comparison of Historic Quarterly Consumption to Model Estimates ......62Figure E.5: Comparison of Historic Annual Consumption to Model Estimates .........63Figure G.1: Capital Costs of U.S. Reactors Built between 1970 and 2000 .............94
BoxesBox 3.1: Key Assumptions Used to Estimate the Emerging Supply Gap ...............11Box 4.1: A Survey of Recent Nuclear Plant Overnight Costs ............................ 19Box 4.2: Armenia’s Potential for Electricity Exports ........................................34Box 4.3: Energy Efficiency Investments in Armenia .........................................35Box 4.4: Benefits of Pumped Storage in Armenia ..........................................36Box A.1: Privatization of the Distribution Network in Armenia ..........................42
vi CHARGED DECISIONS: DIFFICULT CHOICES IN ARMENIA’S ENERGY SECTOR
Acronyms and Abbreviations
AECLAERCAMDBTUBWRCCGTCEPACHPCJSCDCFDTIEBRDEDC EEENAEPCEPRGCRGDPGEGoAGWhHHIHPPHVENIFCIMFkWhkVLCGPLECm3MITMWNPPNPV
Atomic Energy of Canada LimitedArmenian Energy Regulatory CommissionArmenian dramBritish Thermal UnitBoiling water reactorCombined cycle gas turbineCambridge Economic Research Associates Combined heat and powerClosed joint-stock companyDiscounted cash flowUK Department of Trade and IndustryEuropean Bank for Reconstruction and DevelopmentElectricity Distribution CompanyEnergy efficiencyElectricity Networks of ArmeniaEngineering and procurement contractEuropean pressurized reactorGas-cooled reactorGross Domestic ProductGeneral ElectricGovernment of ArmeniaGigawatt hoursHerfindahl-Hirschman IndexHydropower plantHigh Voltage Electric NetworksInternational Finance CorporationInternational Monetary FundKilowatt hourKilovoltLeast cost generation planLevelized energy costCubic meterMassachusetts Institute of TechnologyMegawattNuclear Power PlantNet present value
CHARGED DECISIONS: DIFFICULT CHOICES IN ARMENIA’S ENERGY SECTOR vii
NRCNSSSO&MOECDPFBPPHWRPSRCPWRRAO UESRERMRMSESWUT&DTcmTPPWWER
US Nuclear Regulatory CommissionNuclear Steam Supply SystemOperation and maintenanceOrganization for Economic Cooperation and DevelopmentPoverty family benefit programPressurized heavy water reactorPublic Services Regulatory CommissionPressurized Water ReactorRussia’s Unified Energy Systems (Russian electricity company)Renewable EnergyReserve marginRoot Mean Square ErrorSeparated Work UnitTransmission and distributionThousand cubic metersThermal Power PlantWater-water energy reactor
viii CHARGED DECISIONS: DIFFICULT CHOICES IN ARMENIA’S ENERGY SECTOR
Executive Summary
Armenia’s energy sector reforms have transformed the sector
Armenia’s energy sector—specifically the electricity, natural gas and heat-ing subsectors—have moved from severe crisis in the 1990s, to a stability more characteristic of developed countries than emerging markets. A mix of policy, legal, regulatory, and institutional reforms has achieved remark-able results.
New chal-lenges are similar to those faced by many developed economies
Thanks to reforms, policymakers can turn their focus to objectives com-mon to many developed economies - optimizing the energy supply mix to provide affordable, reliable and sustainable energy services - rather than the common developing country focus on avoiding total system collapse. However, some serious challenges remain, and new challenges are emerg-ing because much of Armenia’s Soviet-era infrastructure is reaching the end of its useful life.
Armenia’s principal challenges for the next 20 years are to: (i) ensure ad-equate energy supply; (ii) safeguard energy security, and (iii) keep energy supply affordable for customers while maintaining financial sustainability of the sector.
Challenge #1: Supply adequacy
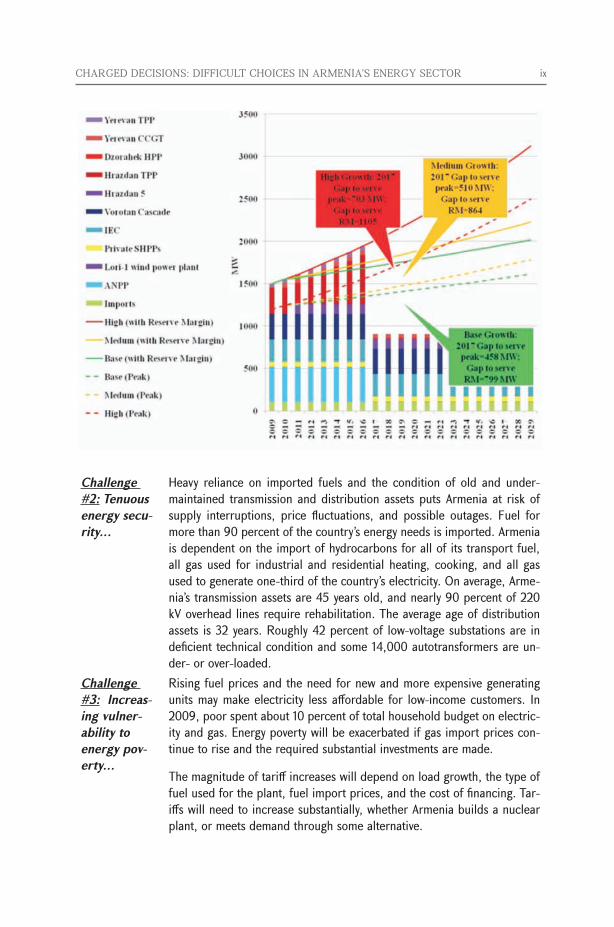
Armenia will need at least 800 MW of new generating capacity when the existing nuclear power plant is decommissioned and the old, under-maintained gas-fired thermal power plants are retired. More than 1,000 MW of capacity (roughly half of the total installed capacity in the system) is expected to be retired by 2016 or shortly thereafter, and annual demand growth is estimated to be at least 1.4 percent. Roughly 1,400 MW of new capacity is in various stages of planning and may be developed. A new 1,100 MW nuclear plant represents the largest share of the planned new capacity, but financing for the plant has yet to be mobilized and Govern-ment may push back the original 2017 commissioning date. The challenge for Government will be to maintain the development schedule for the new nuclear power plant, or replace it with a viable alternative, or identify a stop-gap measure until the new power plant is completed. The figure below illustrates a forecast of installed capacity and winter peak demand until 2029, under three alternative demand scenarios, assuming nuclear and older thermal plants are retired as scheduled.
CHARGED DECISIONS: DIFFICULT CHOICES IN ARMENIA’S ENERGY SECTOR ix
Challenge #2: Tenuous energy secu-rity¼
Heavy reliance on imported fuels and the condition of old and under-maintained transmission and distribution assets puts Armenia at risk of supply interruptions, price fluctuations, and possible outages. Fuel for more than 90 percent of the country’s energy needs is imported. Armenia is dependent on the import of hydrocarbons for all of its transport fuel, all gas used for industrial and residential heating, cooking, and all gas used to generate one-third of the country’s electricity. On average, Arme-nia’s transmission assets are 45 years old, and nearly 90 percent of 220 kV overhead lines require rehabilitation. The average age of distribution assets is 32 years. Roughly 42 percent of low-voltage substations are in deficient technical condition and some 14,000 autotransformers are un-der- or over-loaded.
Challenge #3: Increas-ing vulner-ability to energy pov-erty¼
Rising fuel prices and the need for new and more expensive generating units may make electricity less affordable for low-income customers. In 2009, poor spent about 10 percent of total household budget on electric-ity and gas. Energy poverty will be exacerbated if gas import prices con-tinue to rise and the required substantial investments are made.
The magnitude of tariff increases will depend on load growth, the type of fuel used for the plant, fuel import prices, and the cost of financing. Tar-iffs will need to increase substantially, whether Armenia builds a nuclear plant, or meets demand through some alternative.
x CHARGED DECISIONS: DIFFICULT CHOICES IN ARMENIA’S ENERGY SECTOR
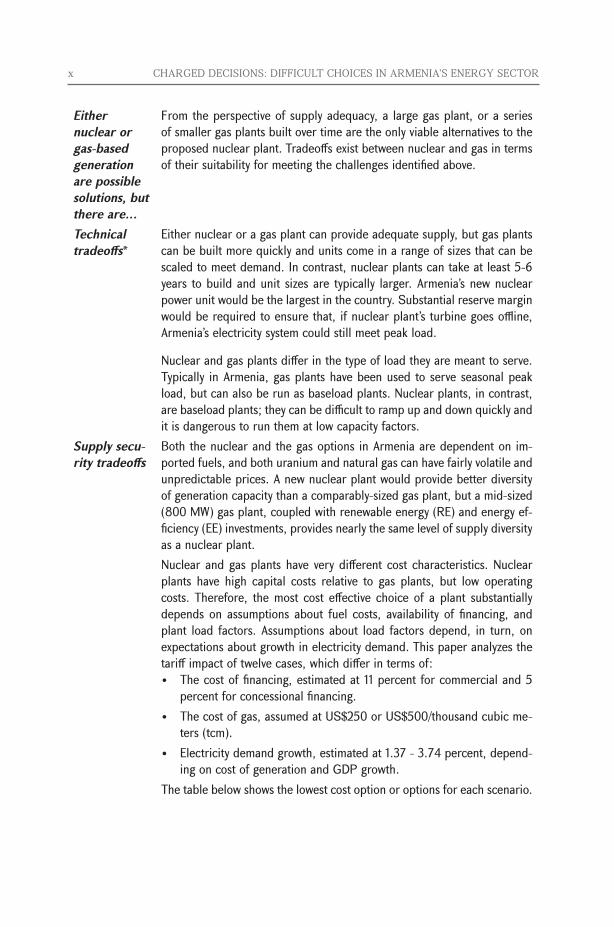
Either nuclear or gas-based generation are possible solutions, but there are¼
From the perspective of supply adequacy, a large gas plant, or a series of smaller gas plants built over time are the only viable alternatives to the proposed nuclear plant. Tradeoffs exist between nuclear and gas in terms of their suitability for meeting the challenges identified above.
Technical tradeoffs*
Either nuclear or a gas plant can provide adequate supply, but gas plants can be built more quickly and units come in a range of sizes that can be scaled to meet demand. In contrast, nuclear plants can take at least 5-6 years to build and unit sizes are typically larger. Armenia’s new nuclear power unit would be the largest in the country. Substantial reserve margin would be required to ensure that, if nuclear plant’s turbine goes offline, Armenia’s electricity system could still meet peak load.
Nuclear and gas plants differ in the type of load they are meant to serve. Typically in Armenia, gas plants have been used to serve seasonal peak load, but can also be run as baseload plants. Nuclear plants, in contrast, are baseload plants; they can be difficult to ramp up and down quickly and it is dangerous to run them at low capacity factors.
Supply secu-rity tradeoffs
Both the nuclear and the gas options in Armenia are dependent on im-ported fuels, and both uranium and natural gas can have fairly volatile and unpredictable prices. A new nuclear plant would provide better diversity of generation capacity than a comparably-sized gas plant, but a mid-sized (800 MW) gas plant, coupled with renewable energy (RE) and energy ef-ficiency (EE) investments, provides nearly the same level of supply diversity as a nuclear plant.Nuclear and gas plants have very different cost characteristics. Nuclear plants have high capital costs relative to gas plants, but low operating costs. Therefore, the most cost effective choice of a plant substantially depends on assumptions about fuel costs, availability of financing, and plant load factors. Assumptions about load factors depend, in turn, on expectations about growth in electricity demand. This paper analyzes the tariff impact of twelve cases, which differ in terms of:• Thecostoffinancing,estimatedat11percentforcommercialand5
percent for concessional financing. • Thecostofgas,assumedatUS$250orUS$500/thousandcubicme-
ters (tcm).• Electricitydemandgrowth,estimatedat1.37-3.74percent,depend-
ing on cost of generation and GDP growth. The table below shows the lowest cost option or options for each scenario.
CHARGED DECISIONS: DIFFICULT CHOICES IN ARMENIA’S ENERGY SECTOR xi
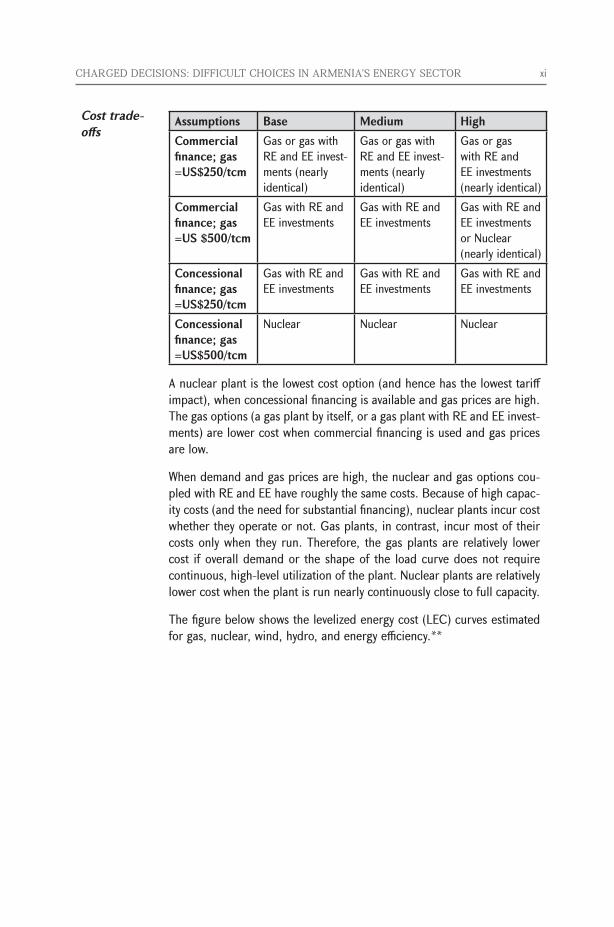
Cost trade-offs
Assumptions Base Medium HighCommercial finance; gas =US$250/tcm
Gas or gas with RE and EE invest-ments (nearly identical)
Gas or gas with RE and EE invest-ments (nearly identical)
Gas or gas with RE and EE investments (nearly identical)
Commercial finance; gas =US $500/tcm
Gas with RE and EE investments
Gas with RE and EE investments
Gas with RE and EE investments or Nuclear (nearly identical)
Concessional finance; gas =US$250/tcm
Gas with RE and EE investments
Gas with RE and EE investments
Gas with RE and EE investments
Concessional finance; gas =US$500/tcm
Nuclear Nuclear Nuclear
A nuclear plant is the lowest cost option (and hence has the lowest tariff impact), when concessional financing is available and gas prices are high. The gas options (a gas plant by itself, or a gas plant with RE and EE invest-ments) are lower cost when commercial financing is used and gas prices are low.
When demand and gas prices are high, the nuclear and gas options cou-pled with RE and EE have roughly the same costs. Because of high capac-ity costs (and the need for substantial financing), nuclear plants incur cost whether they operate or not. Gas plants, in contrast, incur most of their costs only when they run. Therefore, the gas plants are relatively lower cost if overall demand or the shape of the load curve does not require continuous, high-level utilization of the plant. Nuclear plants are relatively lower cost when the plant is run nearly continuously close to full capacity.
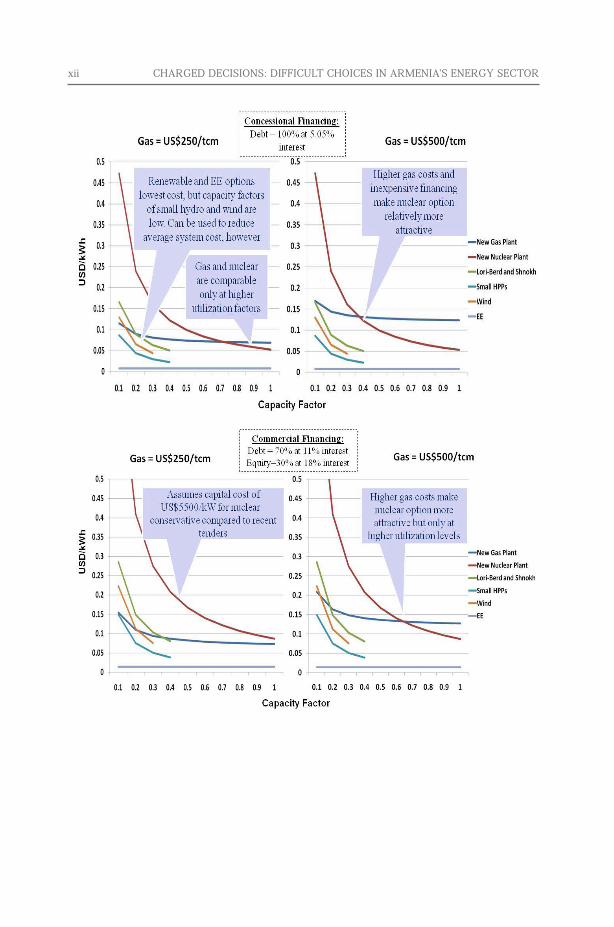
The figure below shows the levelized energy cost (LEC) curves estimated for gas, nuclear, wind, hydro, and energy efficiency.**
xii CHARGED DECISIONS: DIFFICULT CHOICES IN ARMENIA’S ENERGY SECTOR
CHARGED DECISIONS: DIFFICULT CHOICES IN ARMENIA’S ENERGY SECTOR xiii
¼ fiscal im-plications
The Govern-ment needs to take a de-cision NOW
The Govern-ment can take steps to improve on both options, including¼
In addition to tariff implications described above, there are also serious public finance implications that must be considered. The nuclear plant isestimatedtocostaroundUS$6billion.Thisrepresents64percentofArmenia’s 2010 gross domestic product (GDP), and more than three times the cost of the next most expensive supply option considered in this report (a large gas plant with RE and EE investments). The Government borrow-ing of that sum would increase Armenia’s public debt to over 100 percent of estimated 2011 GDP, twice its statutory public debt limit of 50 percent of GDP.*** On the other hand, the Government borrowing for a new gasplantwouldaddroughlyUS$700milliontopublicdebt,keepingthepublic debt to GDP ratio at around 47 percent.
The Government is best placed to decide which set of assumptions are the most realistic. The best choice of generation option for Armenia depends critically on future gas import prices, electricity demand, and availability of financing for new plants. Given the long lead time required to build a new power plant, the decisions need to be made now.
Whichever type of plant is built, the tariff impact will be substantial, and because of Armenia’s dependence on imported fuels, diversity of supply will never be as good as it is now. There are, however, some actions the Government can take to improve both supply security and affordability, whether a new nuclear or gas plant is built. The Government needs to act quickly to improve system load factors, facilitate the use of renew-able resources in electricity generation, and protect the poor from higher energy prices
improving load and capacity fac-tors¼
Armenia can reduce average supply cost of electricity by:
• Fostering higher regional exports during off-peak periods to raisebaseload relative to peak.
• Implementingenergyefficiencymeasures,whichshaveorshiftpeaksto baseload consumption.
• Usingpumpedstorageonexistinghydrocascades.Pumpedstoragecan increase the capacity factor of the nuclear plant, using spare nu-clear capacity to pump water back into higher reservoirs during off-peak hours. The pumped water can be stored and used to generate electricity when it is needed to serve system peaks.
xiv CHARGED DECISIONS: DIFFICULT CHOICES IN ARMENIA’S ENERGY SECTOR
¼ fostering investment in renewable energy¼
Armenia can also reduce overall system costs by investing in or foster-ing private sector investments in renewable energy. As shown above, Ar-menia’s potential renewable energy projects have lower LECs than new nuclear or gas plants. Therefore, running renewables can contribute to reduction of supply costs.
This is true for gas since renewables can be run instead of some gas generation thereby avoiding the fuel costs of gas generation. It is also true for nuclear if demand is high enough to maintain a high load factor at the nuclear plant. However, if demand is insufficient, renewables are unlikely to be dispatched or if they were, a portion of nuclear plant capacity would be left idle, while still incurring substantial costs.
As noted above, investments in RE and EE also improve energy security. Adding RE or EE to either a large gas or large nuclear plant, improves diversity in the supply mix and reduces dependence on imported fuels.
investing in T&D and storage¼
Armenia can improve energy security by rehabilitating and strengthening electricity transmission/ distribution infrastructure, and investing in petro-leum and gas storage capacity.
¼ and pro-tecting the poor.
Substantial increases in end-user tariffs might make electricity and gas consumption unaffordable for a growing proportion of Armenian house-holds, but tariffs must keep pace with future cost increases to maintain sector financial sustainability.
Government can maintain affordable tariffs for low-income customers through earmarked energy subsidies to poor households under the Pov-erty Family Benefits Program (PFBP).
Alternatively, Government could extend the 2011 temporary gas lifeline tariffs into the future and extend lifeline subsidies to the electricity sector. Lifeline tariffs can be funded from Government budget, or (more com-monly) through cross-subsidies.
* This note offers no opinions on safety implications of building or operating a nuclear plant in Armenia.** Many renewable energy generating options in Armenia are cost-effective but cannot provide as much baseload capacity, or firm peaking capacity as Armenia needs.*** Assuming 2011 real GDP growth of 4.6%.
CHARGED DECISIONS: DIFFICULT CHOICES IN ARMENIA’S ENERGY SECTOR 1
1 IntroductionMore than a decade of ambitious sector reform has led to a period of stability in the Ar-menian energy sector. The sector faces challenges more typical of a developed economy than an emerging one: policymakers’ concerns have shifted from avoiding total system collapse to optimizing the energy supply mix to provide affordable, reliable, and sustain-able energy services.
However, some old challenges remain and new ones have arisen. Armenia is still vulner-able to energy supply disruptions; tariffs lag the full cost of service provision; and a significant investment backlog impedes progress in energy infrastructure.
The purpose of this note is to present the analysis of the challenges facing Armenia’s en-ergy sector, specifically, its electricity, natural gas, and heating subsectors.1 The intention of the note is not to prescribe solutions, but to present analysis of options and tradeoffs that the Government can use to inform its decision-making.
The note is structured as follows:
• Section 2 provides a brief overview of the sector in Armenia, the reforms imple-mented, and the Government’s strategic objectives
• Section 3 identifies the principal sector challenges
• Section 4 recommends options to address the challenges.
The appendices present supporting information for the analyses. Appendix A provides background on the history of energy sector reforms in Armenia. Appendix B provides an overview of energy sector regulation, and Appendix C compares Armenia’s energy sector key indicators to those of other countries. Appendix D presents physical characteristics of the Armenian electricity sector. Appendix E and Appendix F describe methodologies used to forecast demand and supply, respectively. Appendix G describes recent international experience with construction of nuclear plants.
1 The note deals primarily with electricity or primary fuels delivered for stationary use (in homes, businesses or public facilities). It deals with transport energy fuels only peripherally, as part of its discussion of natural gas and petroleum use and storage.
2 CHARGED DECISIONS: DIFFICULT CHOICES IN ARMENIA’S ENERGY SECTOR
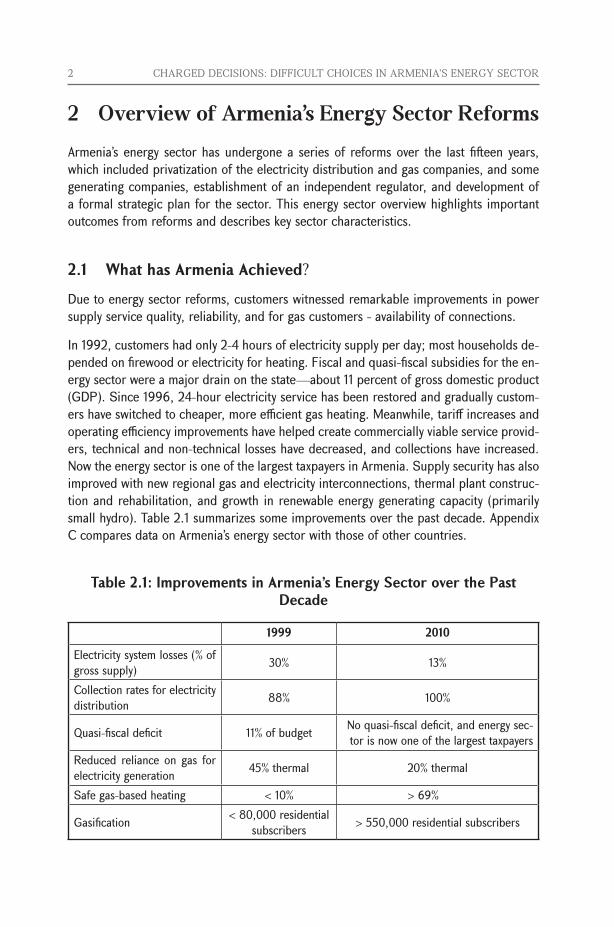
2 Overview of Armenia’s Energy Sector ReformsArmenia’s energy sector has undergone a series of reforms over the last fifteen years, which included privatization of the electricity distribution and gas companies, and some generating companies, establishment of an independent regulator, and development of a formal strategic plan for the sector. This energy sector overview highlights important outcomes from reforms and describes key sector characteristics.
2.1 What has Armenia Achieved?
Due to energy sector reforms, customers witnessed remarkable improvements in power supply service quality, reliability, and for gas customers - availability of connections.
In 1992, customers had only 2-4 hours of electricity supply per day; most households de-pended on firewood or electricity for heating. Fiscal and quasi-fiscal subsidies for the en-ergy sector were a major drain on the state—about 11 percent of gross domestic product (GDP). Since 1996, 24-hour electricity service has been restored and gradually custom-ers have switched to cheaper, more efficient gas heating. Meanwhile, tariff increases and operating efficiency improvements have helped create commercially viable service provid-ers, technical and non-technical losses have decreased, and collections have increased. Now the energy sector is one of the largest taxpayers in Armenia. Supply security has also improved with new regional gas and electricity interconnections, thermal plant construc-tion and rehabilitation, and growth in renewable energy generating capacity (primarily small hydro). Table 2.1 summarizes some improvements over the past decade. Appendix C compares data on Armenia’s energy sector with those of other countries.
Table 2.1: Improvements in Armenia’s Energy Sector over the Past Decade
1999 2010
Electricity system losses (% of gross supply) 30% 13%
Collection rates for electricity distribution 88% 100%
Quasi-fiscal deficit 11% of budget No quasi-fiscal deficit, and energy sec-tor is now one of the largest taxpayers
Reduced reliance on gas for electricity generation 45% thermal 20% thermal
Safe gas-based heating < 10% > 69%
Gasification < 80,000 residential subscribers > 550,000 residential subscribers
CHARGED DECISIONS: DIFFICULT CHOICES IN ARMENIA’S ENERGY SECTOR 3
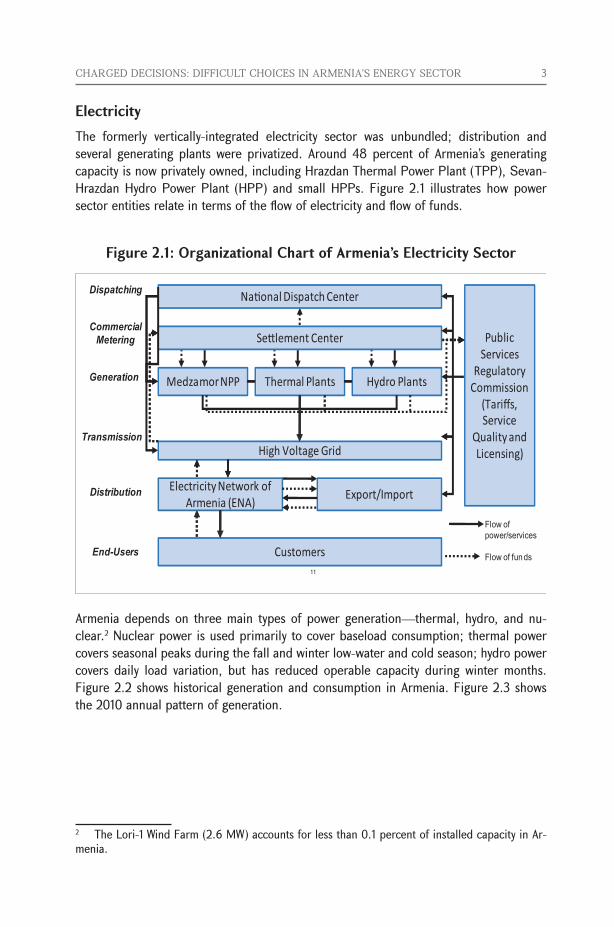
ElectricityThe formerly vertically-integrated electricity sector was unbundled; distribution and several generating plants were privatized. Around 48 percent of Armenia’s generating capacity is now privately owned, including Hrazdan Thermal Power Plant (TPP), Sevan-Hrazdan Hydro Power Plant (HPP) and small HPPs. Figure 2.1 illustrates how power sector entities relate in terms of the flow of electricity and flow of funds.
Figure 2.1: Organizational Chart of Armenia’s Electricity Sector
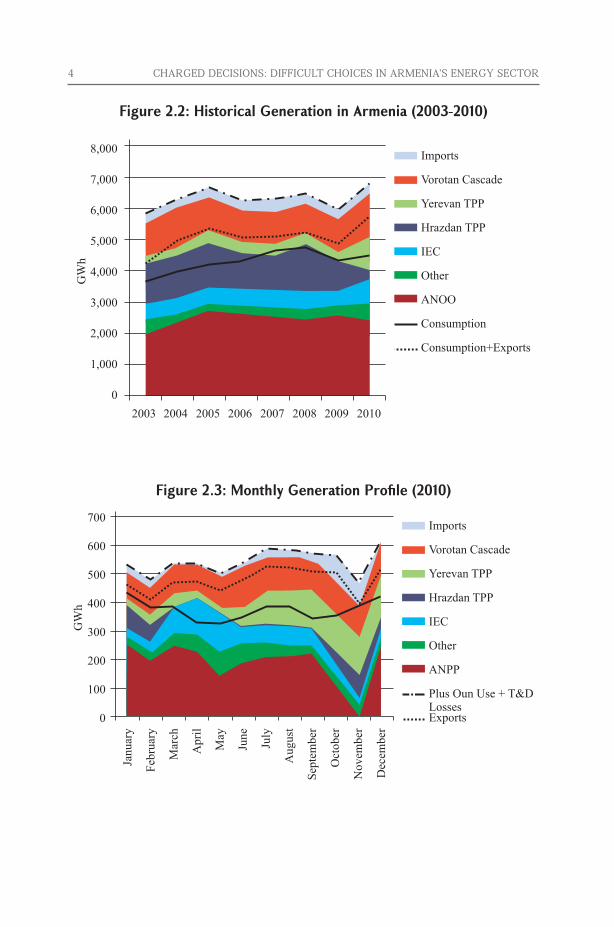
Armenia depends on three main types of power generation—thermal, hydro, and nu-clear.2 Nuclear power is used primarily to cover baseload consumption; thermal power covers seasonal peaks during the fall and winter low-water and cold season; hydro power covers daily load variation, but has reduced operable capacity during winter months. Figure 2.2 shows historical generation and consumption in Armenia. Figure 2.3 shows the 2010 annual pattern of generation.
2 The Lori-1 Wind Farm (2.6 MW) accounts for less than 0.1 percent of installed capacity in Ar-menia.
4 CHARGED DECISIONS: DIFFICULT CHOICES IN ARMENIA’S ENERGY SECTOR
Figure 2.2: Historical Generation in Armenia (2003-2010)
Figure 2.3: Monthly Generation Profile (2010)
CHARGED DECISIONS: DIFFICULT CHOICES IN ARMENIA’S ENERGY SECTOR 5
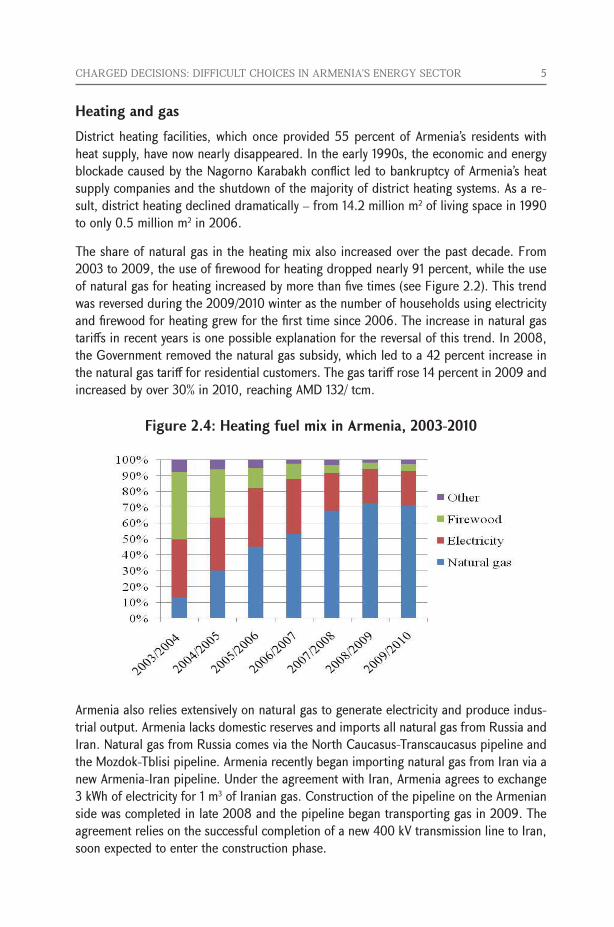
Heating and gasDistrict heating facilities, which once provided 55 percent of Armenia’s residents with heat supply, have now nearly disappeared. In the early 1990s, the economic and energy blockade caused by the Nagorno Karabakh conflict led to bankruptcy of Armenia’s heat supply companies and the shutdown of the majority of district heating systems. As a re-sult, district heating declined dramatically – from 14.2 million m2 of living space in 1990 to only 0.5 million m2 in 2006.
The share of natural gas in the heating mix also increased over the past decade. From 2003 to 2009, the use of firewood for heating dropped nearly 91 percent, while the use of natural gas for heating increased by more than five times (see Figure 2.2). This trend was reversed during the 2009/2010 winter as the number of households using electricity and firewood for heating grew for the first time since 2006. The increase in natural gas tariffs in recent years is one possible explanation for the reversal of this trend. In 2008, the Government removed the natural gas subsidy, which led to a 42 percent increase in the natural gas tariff for residential customers. The gas tariff rose 14 percent in 2009 and increased by over 30% in 2010, reaching AMD 132/ tcm.
Figure 2.4: Heating fuel mix in Armenia, 2003-2010
Armenia also relies extensively on natural gas to generate electricity and produce indus-trial output. Armenia lacks domestic reserves and imports all natural gas from Russia and Iran. Natural gas from Russia comes via the North Caucasus-Transcaucasus pipeline and the Mozdok-Tblisi pipeline. Armenia recently began importing natural gas from Iran via a new Armenia-Iran pipeline. Under the agreement with Iran, Armenia agrees to exchange 3 kWh of electricity for 1 m3 of Iranian gas. Construction of the pipeline on the Armenian side was completed in late 2008 and the pipeline began transporting gas in 2009. The agreement relies on the successful completion of a new 400 kV transmission line to Iran, soon expected to enter the construction phase.
6 CHARGED DECISIONS: DIFFICULT CHOICES IN ARMENIA’S ENERGY SECTOR
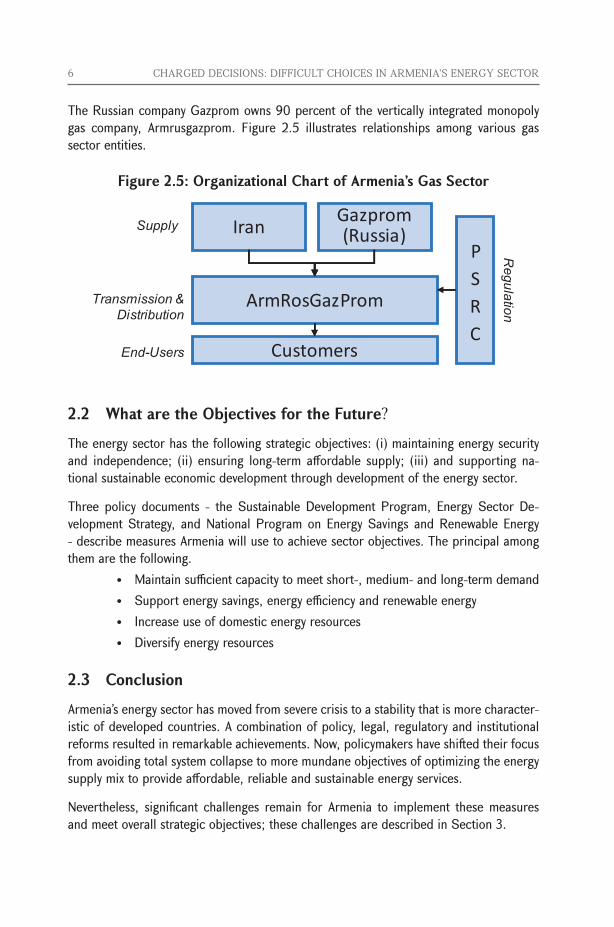
The Russian company Gazprom owns 90 percent of the vertically integrated monopoly gas company, Armrusgazprom. Figure 2.5 illustrates relationships among various gas sector entities.
Figure 2.5: Organizational Chart of Armenia’s Gas Sector
2.2 What are the Objectives for the Future?
The energy sector has the following strategic objectives: (i) maintaining energy security and independence; (ii) ensuring long-term affordable supply; (iii) and supporting na-tional sustainable economic development through development of the energy sector.
Three policy documents - the Sustainable Development Program, Energy Sector De-velopment Strategy, and National Program on Energy Savings and Renewable Energy - describe measures Armenia will use to achieve sector objectives. The principal among them are the following.
• Maintainsufficientcapacitytomeetshort-,medium-andlong-termdemand• Supportenergysavings,energyefficiencyandrenewableenergy• Increaseuseofdomesticenergyresources• Diversifyenergyresources
2.3 Conclusion
Armenia’s energy sector has moved from severe crisis to a stability that is more character-istic of developed countries. A combination of policy, legal, regulatory and institutional reforms resulted in remarkable achievements. Now, policymakers have shifted their focus from avoiding total system collapse to more mundane objectives of optimizing the energy supply mix to provide affordable, reliable and sustainable energy services.
Nevertheless, significant challenges remain for Armenia to implement these measures and meet overall strategic objectives; these challenges are described in Section 3.
CHARGED DECISIONS: DIFFICULT CHOICES IN ARMENIA’S ENERGY SECTOR 7
3 Principal Challenges in the Energy SectorArmenia faces three principal challenges in the energy sector:
• Emerging supply gap. Steady demand growth and old under-maintained en-ergy infrastructure that must be shut down, including several generation facilities (roughly 1,300 MW of operable capacity), means that Armenia must build new plants to meet the supply gap that will be emerging in 2017.
• Maintaining energy supply reliability. Heavy reliance on imported fuels, old and under-maintained electricity transmission and distribution infrastructure, and old gas transmission infrastructure make Armenia prone to supply interruption, price fluctuation, and outage risks.
• Maintaining affordable tariffs. Rising fuel prices and the need for new, more expensive electricity generating units may jeopardize the affordability of gas and electricity for low-income customers.
Sections 3.1 to 3.3 discuss those challenges in further detail.
3.1 Emerging Supply Gap
Unless new plants are commissioned to replace those scheduled for retirement,3 Armenia could fail to meet peak demand as early as 2017 due to aging infrastructure, steady de-mand growth, and a tariff structure that encourages inefficient consumption.
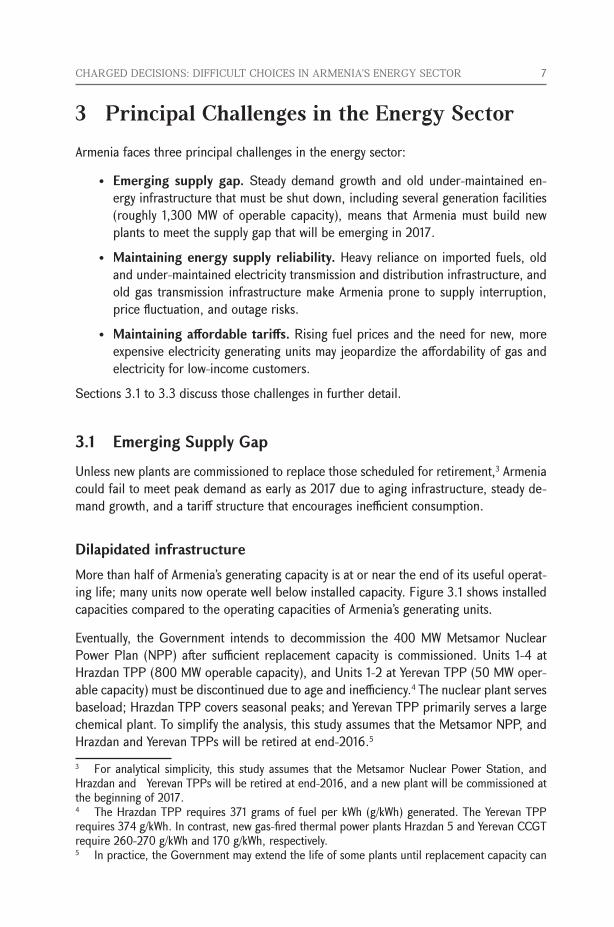
Dilapidated infrastructureMore than half of Armenia’s generating capacity is at or near the end of its useful operat-ing life; many units now operate well below installed capacity. Figure 3.1 shows installed capacities compared to the operating capacities of Armenia’s generating units.
Eventually, the Government intends to decommission the 400 MW Metsamor Nuclear Power Plan (NPP) after sufficient replacement capacity is commissioned. Units 1-4 at Hrazdan TPP (800 MW operable capacity), and Units 1-2 at Yerevan TPP (50 MW oper-able capacity) must be discontinued due to age and inefficiency.4 The nuclear plant serves baseload; Hrazdan TPP covers seasonal peaks; and Yerevan TPP primarily serves a large chemical plant. To simplify the analysis, this study assumes that the Metsamor NPP, and Hrazdan and Yerevan TPPs will be retired at end-2016.5 3 For analytical simplicity, this study assumes that the Metsamor Nuclear Power Station, and Hrazdan and Yerevan TPPs will be retired at end-2016, and a new plant will be commissioned at the beginning of 2017.4 The Hrazdan TPP requires 371 grams of fuel per kWh (g/kWh) generated. The Yerevan TPP requires 374 g/kWh. In contrast, new gas-fired thermal power plants Hrazdan 5 and Yerevan CCGT require 260-270 g/kWh and 170 g/kWh, respectively.5 In practice, the Government may extend the life of some plants until replacement capacity can
8 CHARGED DECISIONS: DIFFICULT CHOICES IN ARMENIA’S ENERGY SECTOR
Figure 3.1: Installed Versus Operating Capacity of Generation
Source: World Bank. Armenia Power Sector General and Investment Overview. November 2009.
In 2010, Armenia added 240 MW of new gas generating capacity with the commissioning of the combined-cycle gas turbine at Yerevan TPP. More new gas capacity, Hrazdan Unit 5, is expected to come online in 2011. However, roughly 75 percent of the new capacity at Yerevan TPP and Hrazdan 5 is expected to be used for the electricity-gas swap with Iran and therefore will not be available for domestic consumption.6
Demand growthElectricity consumption in Armenia grew steadily in 2003 - 2009 (5.72 percent annually in summer, 3.48 percent annually in winter), but fell 7.4 percent between 2008 and 2009. Consumption revived again in 2010 with the revival of the economy, growing by around 3 percent as GDP grew roughly 2 percent.7 Consumption is likely to grow again as Armenia’s economy recovers from the global financial crisis. Official forecasts put real GDP growth at 4.6 percent for 2011.8
be commissioned.6 In May 2004, Armenia signed an agreement with Iran to exchange 3 kWh of electricity from Armenia for 1 m3 of Iranian gas. Gas from Iran is imported via a newly constructed Armenia-Iran gas pipeline. Construction of the pipeline on the Armenian side was completed in late 2008 and the pipeline began transporting gas May 2009. The pipeline has a capacity to transport 7 million m3 of gas daily.7 GDP data from National Statistics Service of the Republic of Armenia (ARMSTAT). (http://www.armstat.am/en/?nid=126&id=01001&submit=Search). Accessed on April 13, 2011.8 Arka News Agency. “Project GDP Growth for 2011 Quite Feasible, MP Says”. (http://www.arka.am/eng/economy/2011/04/01/24953.html). Accessed on April 13, 2011.
CHARGED DECISIONS: DIFFICULT CHOICES IN ARMENIA’S ENERGY SECTOR 9
The need for new generating capacity depends critically on assumptions about demand growth over the next 5-6 years. The planned retirement of the Metsamor NPP, and the age and inefficiency of Hrazdan and Yerevan TPPs create the need for a substantial amount of new generating capacity in the next 5-6 years.9
Armenia needs at least 800 MW of new, operable generating capacity by 2017, under modest demand growth assumptions, in order to meet peak load and maintain 25 percent reserve margin. Higher GDP growth - comparable to Armenia’s sustained double-digit GDP growth between 2003 and 2008 - would require at least 1,100 of new operable capacity in 2017 alone, and substantially more capacity in subsequent years.10
Figure 3.2 shows a forecast of installed capacity and winter peak demand until 2029, under three demand scenarios:
• A“base demand” scenario, which reflects the recent (2011) InternationalMonetary Fund (IMF) GDP forecasts for Armenia
• A“medium demand” scenario, which forecasts GDP based on historicalGDP growth in 2004-2009.
• A“highdemand”scenario,whichforecastsGDPgrowthbasedonhistoricalGDP growth during 2003-2008. This time period excludes 2009 econom-ic downturn, effectively treating the global recession as a macroeconomic anomaly rather than a normal part of the economic cycle.
Box 3.1 describes in more detail the assumptions used to forecast the electricity supply and demand gap in 2017.11 Section 4 shows the estimates of demand depending on the type of new plant to be built and the cost of financing used.
9 This note assumes that the Metsamor Nuclear Power Station will be decommissioned in 2016 but Government stated in 2010 that, because of delays in starting its work on a new nuclear plant, it may keep the plant running beyond 2016, until a new plant can be commissioned.10 These forecasts assume the system maintains a 25 percent margin for reserve capacity. 11 Appendix E provides more detail on the methodology used to produce demand forecasts. Ap-pendix F describes in more detail the assumptions made about electricity supply in Armenia, for the purpose of estimating the generation and capacity gaps.
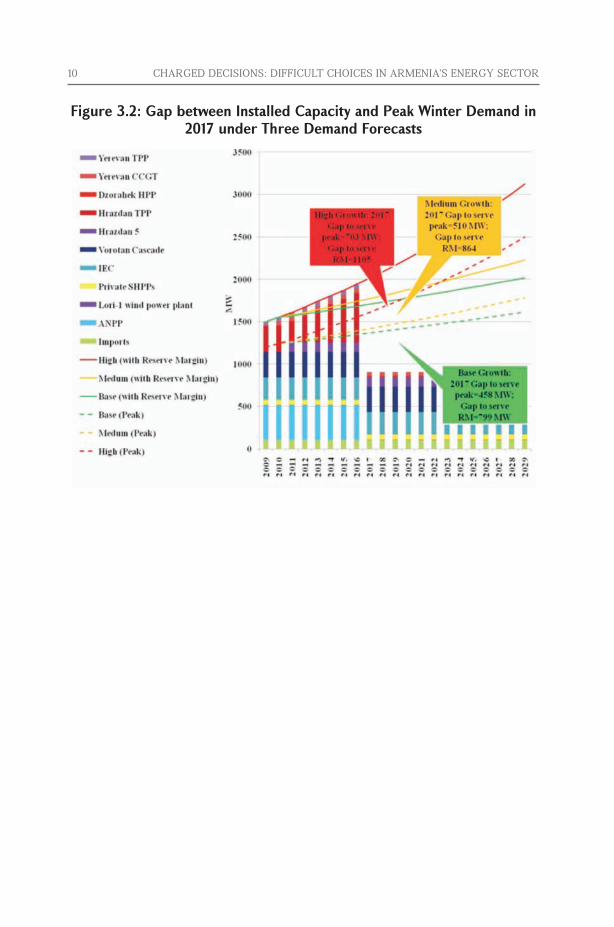
10 CHARGED DECISIONS: DIFFICULT CHOICES IN ARMENIA’S ENERGY SECTOR
Figure 3.2: Gap between Installed Capacity and Peak Winter Demand in 2017 under Three Demand Forecasts
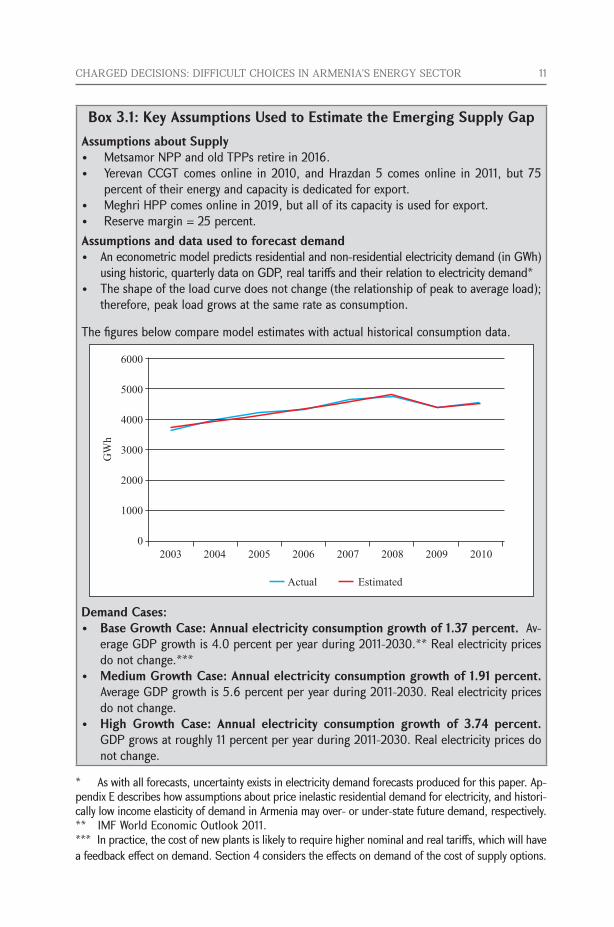
CHARGED DECISIONS: DIFFICULT CHOICES IN ARMENIA’S ENERGY SECTOR 11
Box 3.1: Key Assumptions Used to Estimate the Emerging Supply GapAssumptions about Supply• MetsamorNPPandoldTPPsretirein2016.• YerevanCCGTcomesonline in2010,andHrazdan5comesonline in2011,but75
percent of their energy and capacity is dedicated for export. • MeghriHPPcomesonlinein2019,butallofitscapacityisusedforexport.• Reservemargin=25percent.Assumptions and data used to forecast demand• Aneconometricmodelpredictsresidentialandnon-residentialelectricitydemand(inGWh)
using historic, quarterly data on GDP, real tariffs and their relation to electricity demand*• Theshapeoftheloadcurvedoesnotchange(therelationshipofpeaktoaverageload);
therefore, peak load grows at the same rate as consumption.
The figures below compare model estimates with actual historical consumption data.
Demand Cases:• Base Growth Case: Annual electricity consumption growth of 1.37 percent. Av-
erage GDP growth is 4.0 percent per year during 2011-2030.** Real electricity prices do not change.***
• Medium Growth Case: Annual electricity consumption growth of 1.91 percent. Average GDP growth is 5.6 percent per year during 2011-2030. Real electricity prices do not change.
• High Growth Case: Annual electricity consumption growth of 3.74 percent. GDP grows at roughly 11 percent per year during 2011-2030. Real electricity prices do not change.
* As with all forecasts, uncertainty exists in electricity demand forecasts produced for this paper. Ap-pendix E describes how assumptions about price inelastic residential demand for electricity, and histori-cally low income elasticity of demand in Armenia may over- or under-state future demand, respectively.** IMF World Economic Outlook 2011.*** In practice, the cost of new plants is likely to require higher nominal and real tariffs, which will have a feedback effect on demand. Section 4 considers the effects on demand of the cost of supply options.
12 CHARGED DECISIONS: DIFFICULT CHOICES IN ARMENIA’S ENERGY SECTOR
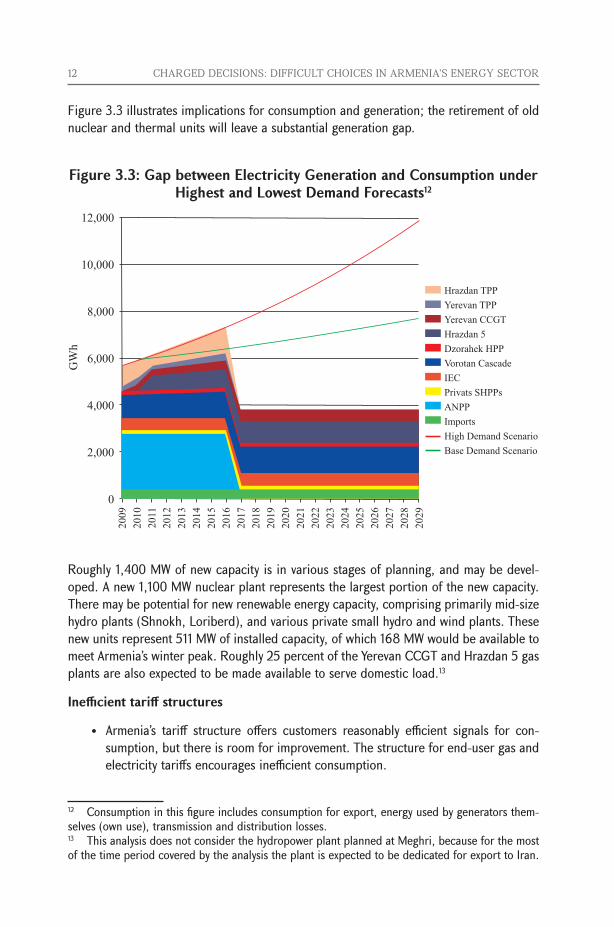
Figure 3.3 illustrates implications for consumption and generation; the retirement of old nuclear and thermal units will leave a substantial generation gap.
Figure 3.3: Gap between Electricity Generation and Consumption under Highest and Lowest Demand Forecasts12
Roughly 1,400 MW of new capacity is in various stages of planning, and may be devel-oped. A new 1,100 MW nuclear plant represents the largest portion of the new capacity. There may be potential for new renewable energy capacity, comprising primarily mid-size hydro plants (Shnokh, Loriberd), and various private small hydro and wind plants. These new units represent 511 MW of installed capacity, of which 168 MW would be available to meet Armenia’s winter peak. Roughly 25 percent of the Yerevan CCGT and Hrazdan 5 gas plants are also expected to be made available to serve domestic load.13
Inefficient tariff structures
• Armenia’s tariff structure offers customers reasonably efficient signals for con-sumption, but there is room for improvement. The structure for end-user gas and electricity tariffs encourages inefficient consumption.
12 Consumption in this figure includes consumption for export, energy used by generators them-selves (own use), transmission and distribution losses.13 This analysis does not consider the hydropower plant planned at Meghri, because for the most of the time period covered by the analysis the plant is expected to be dedicated for export to Iran.
CHARGED DECISIONS: DIFFICULT CHOICES IN ARMENIA’S ENERGY SECTOR 13
• Tariffs fail to reflect the difference in winter/ summer generation costs. About 22 percent of Armenian households use electricity to heat their homes even though natural gas-based heating is more efficient. Old gas-fired thermal plants with lower efficiency must be used to serve peak load created by electricity demand for heating.14 Summer and winter tariffs are identical although average costs for winter generation are higher. Residential customers now pay a daytime tariff of AMD30/kWh(US$0.081/kWh)andanighttimetariffofAMD20/kWh(US$0.054/kWh), year-round. Non-residential customers pay nighttime tariffs of AMD 17/kWh (US$0.046/kWh)anddaytimetariffsthatdependonthevoltagelevelatwhichtheyareservedandtheconnectiontype,rangingfromAMD21/kWh(US$0.057/kWh) for high voltage customers, to AMD 30/kWh for medium-voltage custom-ers. Implementing seasonal tariffs to reflect the higher cost of winter electricity generation would provide an incentive for customers to switch to more efficient heating sources. Instead, now they are virtually subsidized and have no incentive to switch to efficient heating sources.
• Single-part end-user electricity and gas tariffs give utilities no incentive to encour-age energy savings by end-users. Electricity and gas tariffs in Armenia are charged per unit of energy consumed. With these “one part” tariffs, energy service provid-ers have an incentive to sell as much energy as they can in order to recover their fixed costs. In contrast, a two-part tariff, ensures that the utility recovers its fixed costs, regardless of customers’ consumption levels.
• The gas tariff structure induces inefficient consumption for some customers. Natural gas customers are categorized depending on their monthly volume of consumption: those with consumption greater than 10,000 m3/month pay a tar-iff of AMD 88/m3 (US$ 0.24/m3), and those with consumption less than 10,000 m3/month pay a tariff of AMD 132/m3 (US$ 0.35/m3). There is evidence that this structure creates a perverse incentive for customers whose heat consumption is close to 10,000 m3/month.15 In order to obtain the lower price, these customers intentionally use excessive amounts of gas and are disinclined to invest in energy savings measures.
3.2 Maintaining Energy Supply Reliability
Supply reliability is a challenge for Armenia because of the condition of its assets, the emerging supply gap, and geopolitical factors. Supply reliability can be measured in terms of supply adequacy and supply security. Supply adequacy means having enough capacity to serve the customers when they need it. Supply security is the ability to with-stand sudden disturbances such as accidents or fuel supply interruptions. The first threat to supply reliability (the the emerging supply gap) was described in Section 3.1. The con-14 Electric heating conversion efficiency in Armenia is roughly 25 to 30 percent. In contrast, indi-vidual gas heater efficiency is around 90 percent.15 These customers mainly include small heat-only boiler stations supplying one or more buildings or SMEs burning gas for production or heating needs.
14 CHARGED DECISIONS: DIFFICULT CHOICES IN ARMENIA’S ENERGY SECTOR
dition of Armenia’s transmission and distribution assets, and, geopolitical factors further threaten Armenia’s energy supply reliability.
The average age of Armenia’s transmission assets is 45 years. Nearly 90 percent of 220 kV overhead lines require rehabilitation.16 The average age of distribution assets is 32 years. Roughly 42 percent of low voltage substations are in very poor technical condition and 14,000 autotransformers are under- or overloaded.
Geopolitical factors are a persistent threat to Armenia’s energy supply reliability. Main-taining sufficient access to energy markets or, as an alternative, reserves and supply secu-rity pose significant challenges. Supply reliability could be threatened if supply of any of the imported fuels was interrupted. Fuel for more than 90 percent of Armenia’s energy needs is imported. Armenia is dependent on the import of hydrocarbons for transport, all gas used for heating, cooking, and generation of electricity (roughly one-third of the country’s generating capacity), and all of the uranium needed for the Metsamor nuclear power plant.
Losing a single pillar of national electricity generating capacity - nuclear (400 MW), hydro (1,000 MW), or gas-fired thermal (1,700 MW) - would create potential difficulty in meet-ing peak demand. The electricity system is unlikely to fail if a single thermal unit or hydro plant is lost, but since suppliers are limited for any single fuel source, all plants using that fuel would be affected. During the 1993-95 energy crisis, a supply interruption shut down all gas-fired generators in Armenia.17 The new gas pipeline to Iran increases supply security, but does not eliminate potential for import disruptions.
3.3 Affordability of Tariffs
In 2009, poor Armenian households spent roughly 10 percent of their total household budgets on electricity and gas, which is defined as living on the edge of “fuel poverty” (European Bank for Reconstruction and Development (EBRD)). Low-income customers will likely continue to experience fuel poverty due to rising fuel prices and the high capital costs anticipated when new generating plants are built and transmission and distribution lines are rehabilitated, as described below.
Rising fuel pricesImported natural gas prices are likely to increase in Armenia, which will mean higher generationcostsandhigherelectricitytariffs.Armenia’sgasimportprice(US$180/tcm)16 All electrical equipment (for example, switch-gears and circuit breakers) and most power equipment at the high voltage sub-stations were replaced during 1998-04 with World Bank and KfW financing, but a major bottleneck remains at Hrazdan TPP due to the poor condition of the Hrazdan TPP 330 kV substation.17 Gas supply interruption posed an even greater problem during 1993-95 because Armenia lacked capacity from the Metsamor nuclear plant, which was shut down until 1995 due to the 1988 earthquake.
CHARGED DECISIONS: DIFFICULT CHOICES IN ARMENIA’S ENERGY SECTOR 15
iswellbelowthatofWesternEuropeancountries (US$500/tcm in2008).TheglobalrecessionreducednaturalgaspricestoaboutUS$325/tcmin2010,butpricesarelikelyto return gradually to 2008 levels. During the first quarter of 2011, Gazprom’s average wholesalepricewasUS$346.18 It is widely anticipated that Armenia will eventually face Western European prices, which will will substantial increase the costs of gas-fired gen-eration and electricity tariffs.
Rising capital costsThe cost of new generating capacity and rehabilitation of transmission and distribution assets will also require substantial tariff increases. The average nominal cost of genera-tion is likely to increase 2-4 fold if a new nuclear plant is built, depending on the financ-ing arrangements used and the path of demand growth. This will have a direct impact on customers if end-user tariffs are to be maintained at cost recovery levels. Section 4.3 compares the cost implications of different financing options (commercial and conces-sional) under different demand scenarios (high, medium and base). Section 4.3 also compares the levelized cost of a new nuclear plant to the levelized cost of other types of generation.
3.4 Conclusions
Principal challenges for Armenia are closely tied to the strategic objectives of the sector. These include the following:
• An emerging supply gap. By 2017, Armenia will need at least 800 MW of new generating capacity as old under-maintained energy infrastructure is retired and demand grows steadily. By 2016, it is anticipated that nearly 1,300 MW of oper-able capacity will be retired; the annual demand growth is estimated to be at least 1.4 percent during 2011-2016. The Government’s challenge will be to maintain the schedule to bring the new nuclear power plant on line, or identify a viable alternative as a replacement or a stop-gap measure until the new power plant is completed.
• Tenuous energy supply reliability. Security of fuel supply and the poor condi-tion of electricity transmission and distribution assets are critical and persistent threats to energy sector sustainability in Armenia.
• Rising energy poverty. Rising fuel prices and the need for new, more expensive generating units may jeopardize affordability of electricity and gas supply for low-income customers. The lingering effects of the financial crisis and the need for continued tariff increases will increasingly push lower-income Armenians toward the brink of fuel poverty.
18 “Ukraine Looks to Texas for an Energy Path.” May 4, 2011. Andrew E. Kramer. The New York Times. http://www.nytimes.com/2011/05/05/business/global/05shale.html (accessed on May 5, 2011).
16 CHARGED DECISIONS: DIFFICULT CHOICES IN ARMENIA’S ENERGY SECTOR
4 Potential Solutions to the ChallengesArmenia can meet energy sector challenges by coupling investment with careful policy action. The priorities include the following:
• Add new capacity. Armenia needs new capacity that uses domestic resources and maintains diversity in the generation mix, at least cost.
• Improve energy security. Armenia can improve supply reliability by investing in transmission and distribution network rehabilitation and petroleum and gas stor-age.
• Protect low-income customers. Targeted support will be needed for vulnerable customers to cushion the impact of tariff increases.
Section 4.1 evaluates options for new generating capacity. Section 4.2 describes options to improve energy security. Section 4.3 describes options to improve energy supply af-fordability. Section 4.4 summarizes findings.
4.1 New Capacity
By 2017, Armenia will need 800 – 1,100 MW of new generating capacity to meet peak demand and reserve margins, as discussed in Section 3. The Government aims to pro-vide reliable, secure and affordable supply. This can be done by building new generating capacity that:
• Is least-cost. Armenia needs capacity with low life-cycle costs, which will have the lowest impact on tariffs. Higher cost options will aggravate affordability of the electricity tariffs, or - if higher costs are not passed through to customers in the form of higher tariffs - will require substantial government subsidies.
• Provides adequate supply. Armenia needs sufficient capacity to meet peak de-mand and provide a reasonable reserve margin. This analysis rates a new capacity option as adequate if it comes close to meeting peak demand plus the required reserve margin through 2021 (five years after the supply gap emerges).19
• Maintains diversity of the generation mix. Armenia needs new capacity that maintains diversity in the mix of fuels used for electricity generation.
The following subsections evaluate four new capacity options against the aforementioned criteria. The four options include the following:
1. Nuclear-only: The Government plans to build a new 1,000 – 1,100 MW nuclear plant at the site of the Metsamor plant. This note assumes 1,100 MW plant.
19 The study assumes a supply option is adequate if it comes within 100 MW of meeting peak demand plus the required reserve margin.
CHARGED DECISIONS: DIFFICULT CHOICES IN ARMENIA’S ENERGY SECTOR 17
2. Gas-only: The analysis also considers the extent to which a new gas plant would meet the evaluation criteria. Because gas plants are typically available in a wide range of sizes, the analysis below assumes that gas plants are “right sized” to meet each de-mand scenario for 2017: an 800 MW plant is built to meet demand in base and me-dium growth scenarios; an 1100 MW plant is built to meet the demand in high growth scenario.
3. Nuclear + RE + EE: This option combines an 1,100 MW nuclear plant with 550 MW of renewable energy generating capacity (168 MW operable capacity) and 110 MW of energy efficiency measures20
4. Gas + RE + EE: This option combines a “right sized” gas plant with 550 MW of renew-able energy generating capacity (168 MW operable capacity) and 110 MW of energy efficiency measures.
Least-cost supply
Life-cycle costs depend on capital costs and operating costs. Capital costs depend criti-cally on the cost of investments and the cost of financing used (the interest rate paid on loans or the equity return required by investors in the form of dividends). Operating costs depend critically on the cost of fuel. Plant utilization is also an important factor. A plant that operates more frequently and at higher levels of capacity than another identical plant, will have higher operating costs per kilowatt-hour, but lower capital costs, because the capital costs can be spread out over more kilowatt-hours.
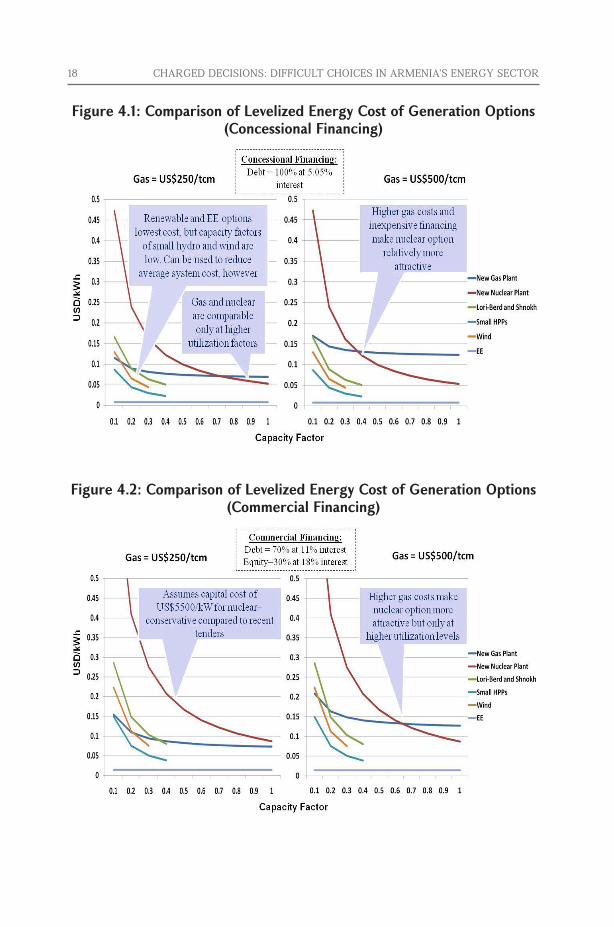
Figure 4.1 and Figure 4.2 compare the LECs of different types of generating capacity under various assumptions for gas import prices and financing arrangements. The LECs show how costs (on the y-axis) change as utilization factors (on the x-axis) change.
20 Estimates of the capacity provided by energy efficiency measures are based on World Bank Energy Efficiency Study estimates from 2008.
18 CHARGED DECISIONS: DIFFICULT CHOICES IN ARMENIA’S ENERGY SECTOR
Figure 4.1: Comparison of Levelized Energy Cost of Generation Options (Concessional Financing)
Figure 4.2: Comparison of Levelized Energy Cost of Generation Options (Commercial Financing)
CHARGED DECISIONS: DIFFICULT CHOICES IN ARMENIA’S ENERGY SECTOR 19
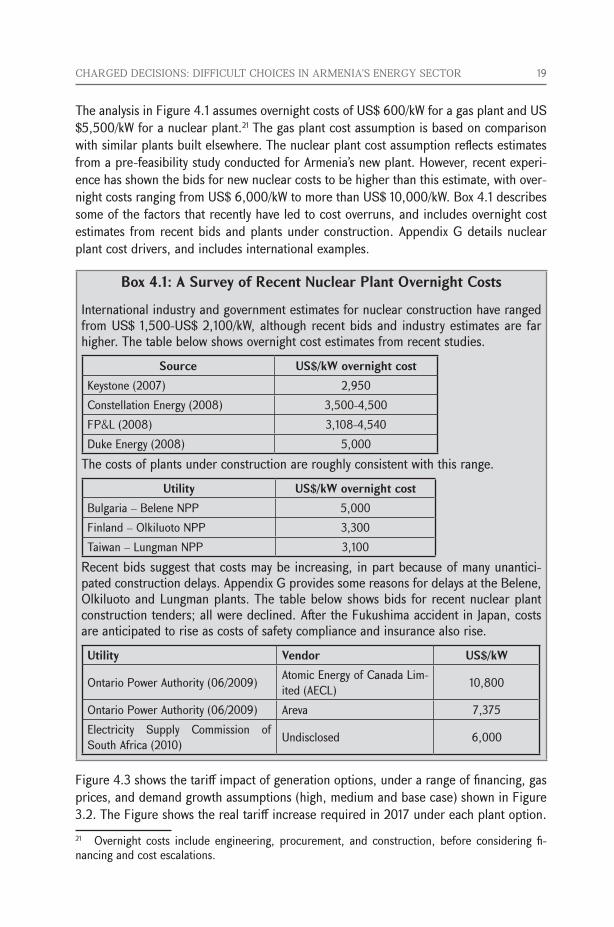
TheanalysisinFigure4.1assumesovernightcostsofUS$600/kWforagasplantandUS$5,500/kWforanuclearplant.21 The gas plant cost assumption is based on comparison with similar plants built elsewhere. The nuclear plant cost assumption reflects estimates from a pre-feasibility study conducted for Armenia’s new plant. However, recent experi-ence has shown the bids for new nuclear costs to be higher than this estimate, with over-nightcostsrangingfromUS$6,000/kWtomorethanUS$10,000/kW.Box4.1describessome of the factors that recently have led to cost overruns, and includes overnight cost estimates from recent bids and plants under construction. Appendix G details nuclear plant cost drivers, and includes international examples.
Box 4.1: A Survey of Recent Nuclear Plant Overnight Costs
International industry and government estimates for nuclear construction have ranged fromUS$1,500-US$2,100/kW,althoughrecentbidsand industryestimatesarefarhigher. The table below shows overnight cost estimates from recent studies.
Source US$/kW overnight costKeystone (2007) 2,950Constellation Energy (2008) 3,500-4,500FP&L (2008) 3,108-4,540Duke Energy (2008) 5,000
The costs of plants under construction are roughly consistent with this range. Utility US$/kW overnight cost
Bulgaria – Belene NPP 5,000Finland – Olkiluoto NPP 3,300Taiwan – Lungman NPP 3,100
Recent bids suggest that costs may be increasing, in part because of many unantici-pated construction delays. Appendix G provides some reasons for delays at the Belene, Olkiluoto and Lungman plants. The table below shows bids for recent nuclear plant construction tenders; all were declined. After the Fukushima accident in Japan, costs are anticipated to rise as costs of safety compliance and insurance also rise. Utility Vendor US$/kW
Ontario Power Authority (06/2009) Atomic Energy of Canada Lim-ited (AECL) 10,800
Ontario Power Authority (06/2009) Areva 7,375Electricity Supply Commission of South Africa (2010) Undisclosed 6,000
Figure 4.3 shows the tariff impact of generation options, under a range of financing, gas prices, and demand growth assumptions (high, medium and base case) shown in Figure 3.2. The Figure shows the real tariff increase required in 2017 under each plant option. 21 Overnight costs include engineering, procurement, and construction, before considering fi-nancing and cost escalations.
20 CHARGED DECISIONS: DIFFICULT CHOICES IN ARMENIA’S ENERGY SECTOR
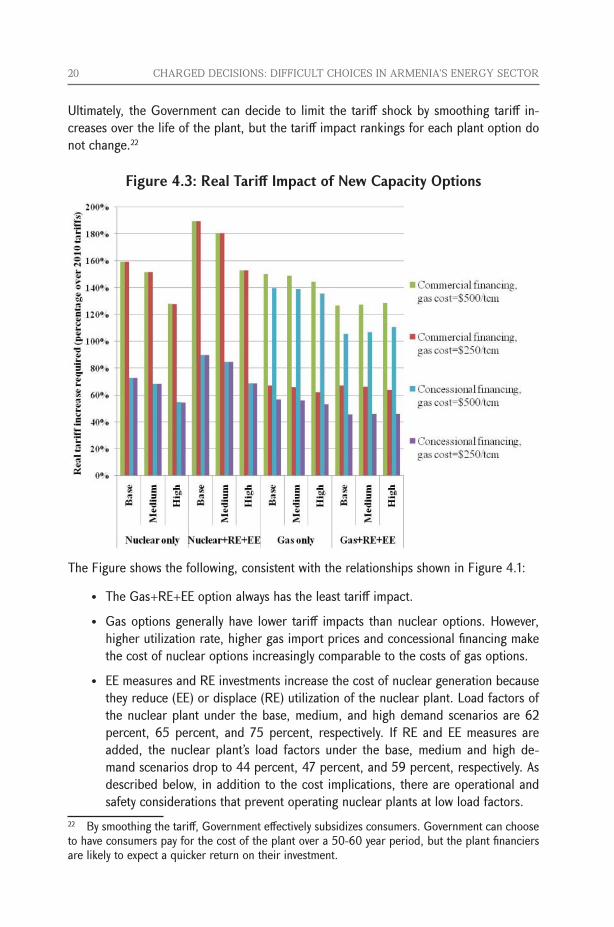
Ultimately, the Government can decide to limit the tariff shock by smoothing tariff in-creases over the life of the plant, but the tariff impact rankings for each plant option do not change.22
Figure 4.3: Real Tariff Impact of New Capacity Options
The Figure shows the following, consistent with the relationships shown in Figure 4.1:
• TheGas+RE+EEoptionalwayshastheleasttariffimpact.
• Gasoptionsgenerallyhave lower tariff impacts thannuclearoptions.However,higher utilization rate, higher gas import prices and concessional financing make the cost of nuclear options increasingly comparable to the costs of gas options.
• EEmeasuresandREinvestmentsincreasethecostofnucleargenerationbecausethey reduce (EE) or displace (RE) utilization of the nuclear plant. Load factors of the nuclear plant under the base, medium, and high demand scenarios are 62 percent, 65 percent, and 75 percent, respectively. If RE and EE measures are added, the nuclear plant’s load factors under the base, medium and high de-mand scenarios drop to 44 percent, 47 percent, and 59 percent, respectively. As described below, in addition to the cost implications, there are operational and safety considerations that prevent operating nuclear plants at low load factors.
22 By smoothing the tariff, Government effectively subsidizes consumers. Government can choose to have consumers pay for the cost of the plant over a 50-60 year period, but the plant financiers are likely to expect a quicker return on their investment.
CHARGED DECISIONS: DIFFICULT CHOICES IN ARMENIA’S ENERGY SECTOR 21
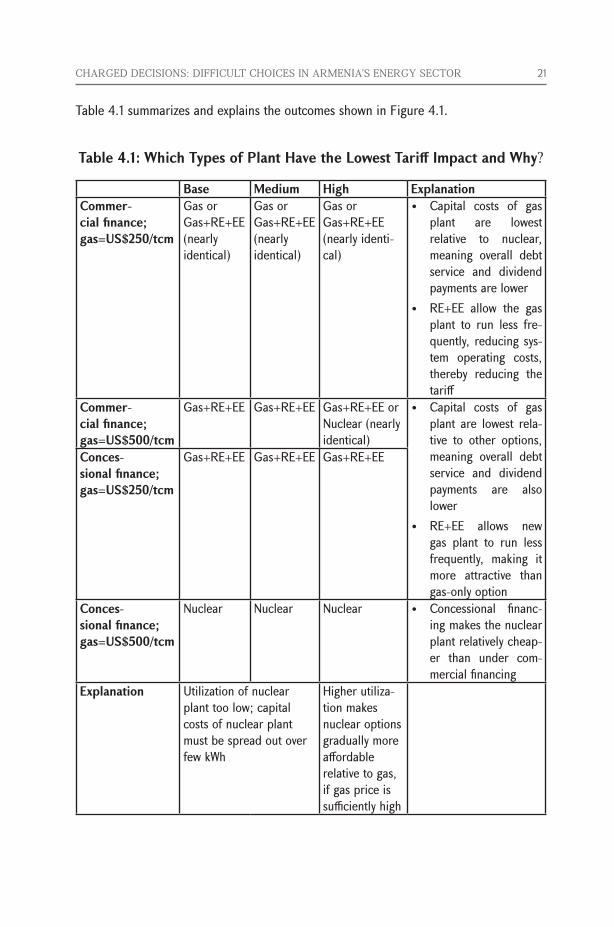
Table 4.1 summarizes and explains the outcomes shown in Figure 4.1.
Table 4.1: Which Types of Plant Have the Lowest Tariff Impact and Why?
Base Medium High ExplanationCommer-cial finance; gas=US$250/tcm
Gas or Gas+RE+EE(nearly identical)
Gas or Gas+RE+EE(nearly identical)
Gas or Gas+RE+EE(nearly identi-cal)
• Capital costs of gasplant are lowest relative to nuclear, meaning overall debt service and dividend payments are lower
• RE+EE allow the gasplant to run less fre-quently, reducing sys-tem operating costs, thereby reducing the tariff
Commer-cial finance; gas=US$500/tcm
Gas+RE+EE Gas+RE+EE Gas+RE+EEorNuclear (nearly identical)
• Capital costs of gasplant are lowest rela-tive to other options, meaning overall debt service and dividend payments are also lower
• RE+EE allows newgas plant to run less frequently, making it more attractive than gas-only option
Conces-sional finance; gas=US$250/tcm
Gas+RE+EE Gas+RE+EE Gas+RE+EE
Conces-sional finance; gas=US$500/tcm
Nuclear Nuclear Nuclear • Concessional financ-ing makes the nuclear plant relatively cheap-er than under com-mercial financing
Explanation Utilization of nuclear plant too low; capital costs of nuclear plant must be spread out over few kWh
Higher utiliza-tion makes nuclear options gradually more affordable relative to gas, if gas price is sufficiently high
22 CHARGED DECISIONS: DIFFICULT CHOICES IN ARMENIA’S ENERGY SECTOR
The analysis above assumes that the Government can find a source of external conces-sional or private financing for each plant. In addition to tariff implications, public finance implications must be considered. The nuclear plant, using the modest cost estimates in thisnote,willcostaroundUS$6.0billion,around64percentofArmenia’s2010GDP,andmore than triple thecostofacomparablysizedgasplant,plusallof theRE+EEoptions considered in this note. The Government borrowing to finance the new nuclear power plant would increase Armenia’s public debt to over 100 percent of estimated 2011 GDP,23 twice its statutory public debt limit of 50 percent of GDP. The Government bor-rowingforanewgasplant,ontheotherhand,wouldaddroughlyUS$700milliontopublic debt, keeping the public debt to GDP ratio at around 47 percent.
Adequacy of SupplyAll of the new plant options provide adequate capacity in the base- and medium- demand scenarios.TheGas+RE+EEandNuclear+RE+EEoptionsprovideadequatecapacity inthe high-demand scenario. Figure 4.4 and Figure 4.5 show how the supply options meet peak demand. 24 Because tariffs are significant determinants of electricity demand (higher real tariffs mean lower demand, and vice-versa), supply adequacy depends on capital costs of the plants, financing terms (concessional or commercial), and gas import price. Therefore, demand forecasts differ by supply option chosen and assumptions about key cost drivers. For example, peak load forecasts for natural gas options are generally slight-ly higher than for nuclear options.25
23 Assuming no other public borrowing takes place.24 The figures assume Government reduces tariff shock by amortizing plant costs over plant life-time. 25 Table E.4: Peak Load Forecasts 2011-2029 (MW)Table E.4 in Appendix E tabulates peak load forecasts for all options, under all gas, financing, and load growth scenariosTable E.5: Generation Forecasts 2011-2029: Table E.5 shows the same for annual load (end-use consumption).
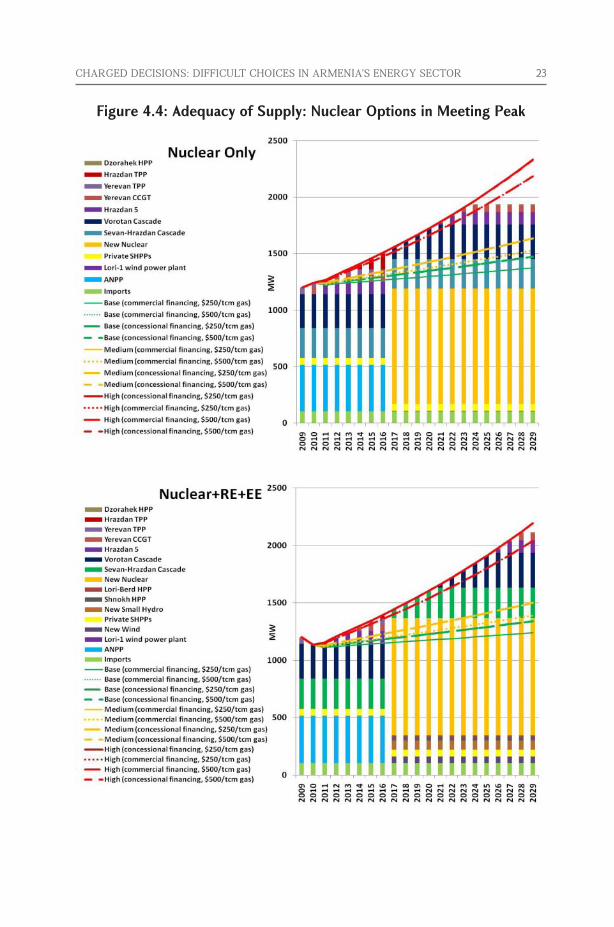
CHARGED DECISIONS: DIFFICULT CHOICES IN ARMENIA’S ENERGY SECTOR 23
Figure 4.4: Adequacy of Supply: Nuclear Options in Meeting Peak
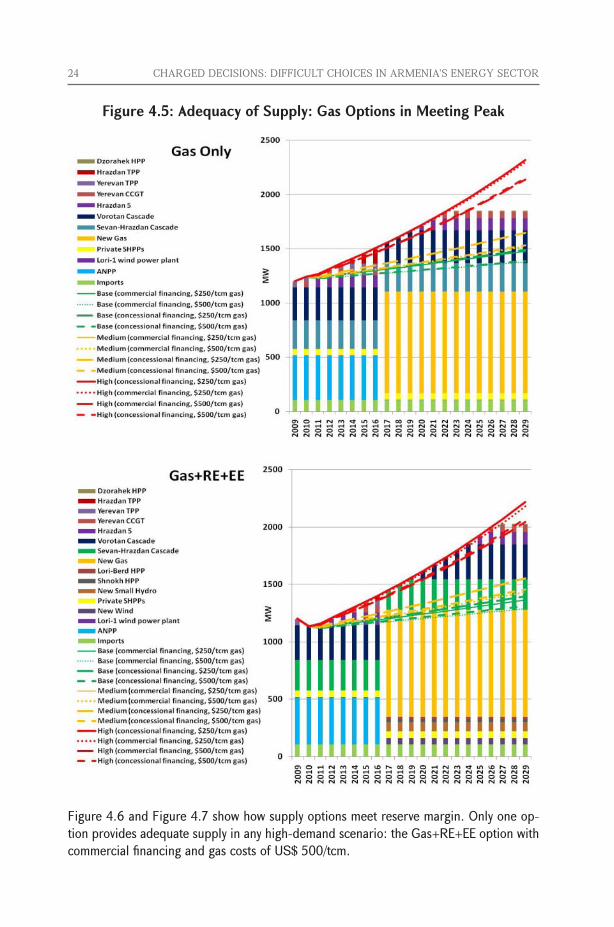
24 CHARGED DECISIONS: DIFFICULT CHOICES IN ARMENIA’S ENERGY SECTOR
Figure 4.5: Adequacy of Supply: Gas Options in Meeting Peak
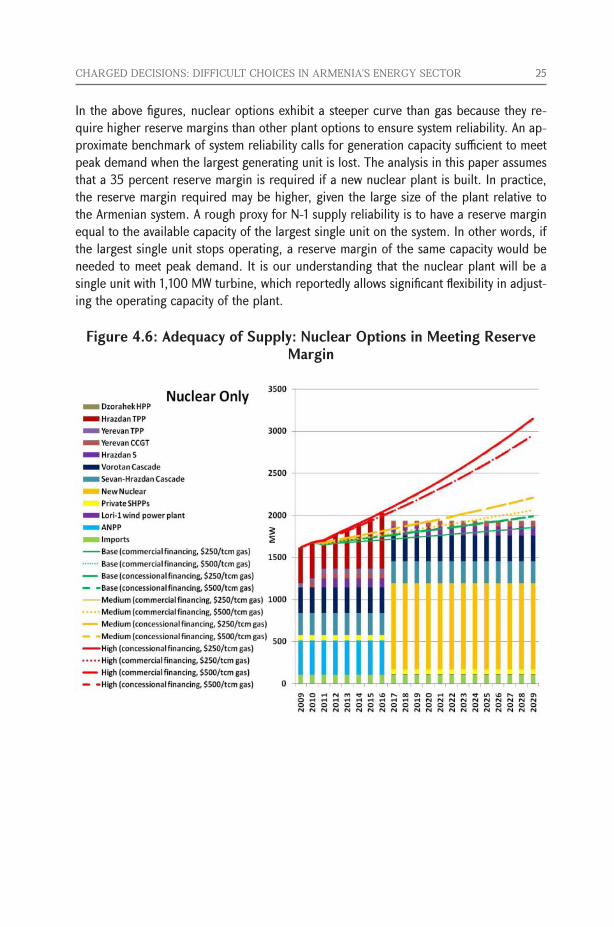
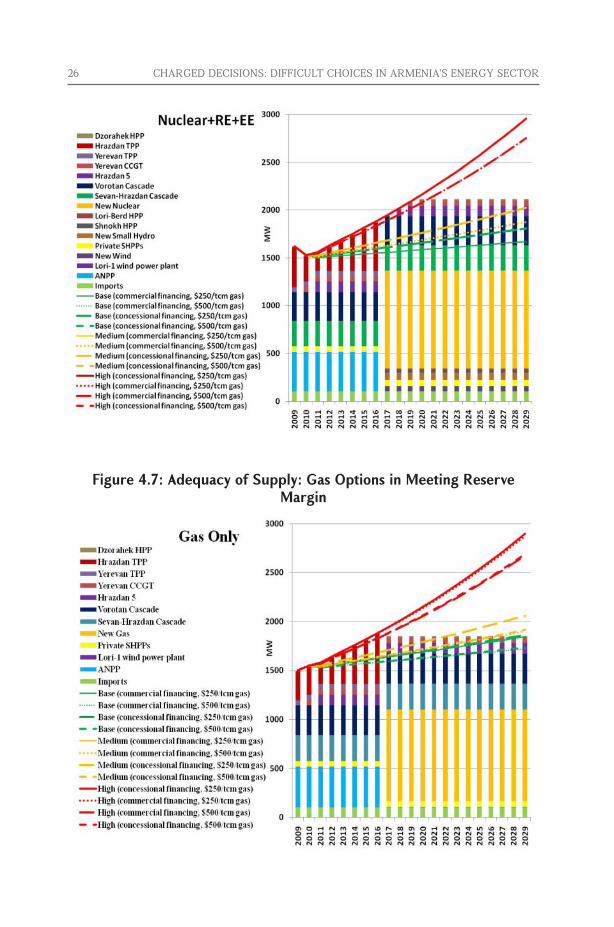
Figure 4.6 and Figure 4.7 show how supply options meet reserve margin. Only one op-tionprovidesadequatesupplyinanyhigh-demandscenario:theGas+RE+EEoptionwithcommercialfinancingandgascostsofUS$500/tcm.
CHARGED DECISIONS: DIFFICULT CHOICES IN ARMENIA’S ENERGY SECTOR 25
In the above figures, nuclear options exhibit a steeper curve than gas because they re-quire higher reserve margins than other plant options to ensure system reliability. An ap-proximate benchmark of system reliability calls for generation capacity sufficient to meet peak demand when the largest generating unit is lost. The analysis in this paper assumes that a 35 percent reserve margin is required if a new nuclear plant is built. In practice, the reserve margin required may be higher, given the large size of the plant relative to the Armenian system. A rough proxy for N-1 supply reliability is to have a reserve margin equal to the available capacity of the largest single unit on the system. In other words, if the largest single unit stops operating, a reserve margin of the same capacity would be needed to meet peak demand. It is our understanding that the nuclear plant will be a single unit with 1,100 MW turbine, which reportedly allows significant flexibility in adjust-ing the operating capacity of the plant.
Figure 4.6: Adequacy of Supply: Nuclear Options in Meeting Reserve Margin
26 CHARGED DECISIONS: DIFFICULT CHOICES IN ARMENIA’S ENERGY SECTOR
Figure 4.7: Adequacy of Supply: Gas Options in Meeting Reserve Margin
CHARGED DECISIONS: DIFFICULT CHOICES IN ARMENIA’S ENERGY SECTOR 27
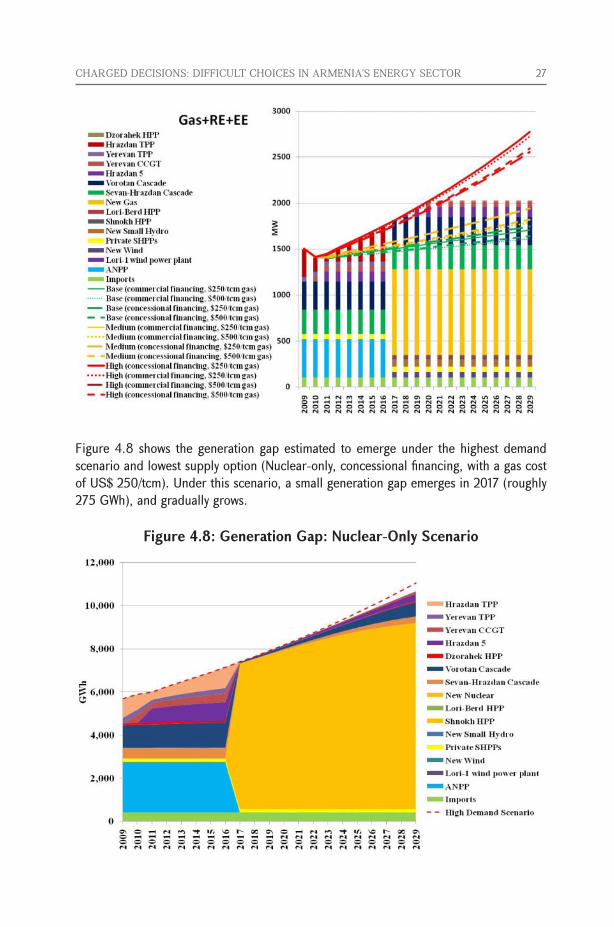
Figure 4.8 shows the generation gap estimated to emerge under the highest demand scenario and lowest supply option (Nuclear-only, concessional financing, with a gas cost ofUS$250/tcm).Underthisscenario,asmallgenerationgapemergesin2017(roughly275 GWh), and gradually grows.
Figure 4.8: Generation Gap: Nuclear-Only Scenario
28 CHARGED DECISIONS: DIFFICULT CHOICES IN ARMENIA’S ENERGY SECTOR
Clearly, the nuclear option clearly provides adequate supply in many of the demand sce-narios, but there are two other important considerations that influence supply adequacy:
• The nuclear options are more difficult to implement under lower demand scenarios. Nuclear plants are meant to be run as baseload plants, generating at relatively high capacity factors when they are in service. Running nuclear plants at lower capacity factors can be hazardous and costly, as described in the previous section.26 In the low- and medium- demand scenarios, it would likely be necessary to back down other, lower cost, generating capacity in order to operate the nucle-ar plant safely. Even in the high demand scenario, the nuclear plant would likely have to displace some of the less expensive hydroelectric and gas units during off-peak hours in order to operate at safe levels. Backing the nuclear plant down substantially, instead of other plants, is more difficult from a technical perspective, and is less advisable economically given the low costs of operating a nuclear plant once it is built.
• The nuclear plant takes longer to build. When considering supply adequacy, it is important to take into account the time required for construction of a new plant. Nuclear plants typically require a minimum of 5-6 years for construction, whereas gas plants can be built in 3-4 years. As shown in Box 4.1 and Appendix G, the risk of delays is substantially higher for nuclear plants and those delays lead to cost increases.
Diversity of the generation mixArmenia has better supply diversity now compared to any of the options for new capacity. The nuclear plant provides better supply diversity than a new gas plant. Supply diversity of either the nuclear or gas option can be improved by adding renewable generation capacityandenergyefficiency.IfRE+EEisadded,thenuclearandmid-sizedgasplantsare nearly identical in terms of supply diversity. The Figure 4.9 compares the Herfindahl-Hirschman Index (HHI) for different supply options by fuel type.27 A lower HHI implies greater supply diversity. The figure also suggests that a right-sized (800 MW) gas plant provides better supply diversity than a larger one.
26 This report does not take any view on the safety implications of building or operating a nuclear plant in Armenia. 27 A measure of the size of firms in relation to their industry and an indicator of the amount of competition among them. HHI is used to measure market concentration of different companies. A lower HHI means greater diversity of supply. The HHI is typically calculated as the sum of the squares of each firm’s market share. This analysis uses HHI as a proxy for the diversity of fuel supply for electricity generation, and calculates “market share” as percentage of generating capacity using each particular fuel type (hydro, nuclear, gas, wind, and imports). In this case, operable capacity is used to measure market share.
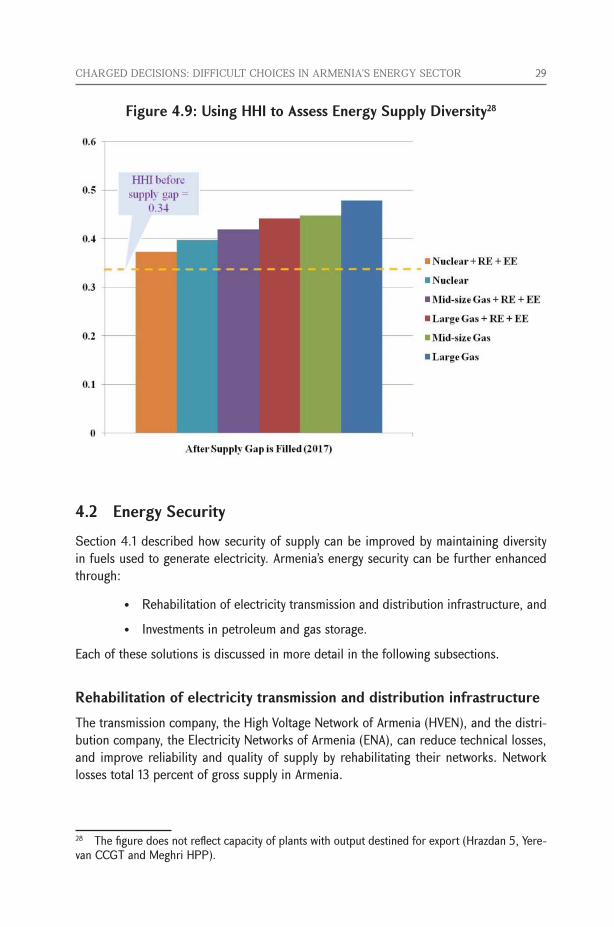
CHARGED DECISIONS: DIFFICULT CHOICES IN ARMENIA’S ENERGY SECTOR 29
Figure 4.9: Using HHI to Assess Energy Supply Diversity28
4.2 Energy Security
Section 4.1 described how security of supply can be improved by maintaining diversity in fuels used to generate electricity. Armenia’s energy security can be further enhanced through:
• Rehabilitationofelectricitytransmissionanddistributioninfrastructure,and
• Investmentsinpetroleumandgasstorage.
Each of these solutions is discussed in more detail in the following subsections.
Rehabilitation of electricity transmission and distribution infrastructureThe transmission company, the High Voltage Network of Armenia (HVEN), and the distri-bution company, the Electricity Networks of Armenia (ENA), can reduce technical losses, and improve reliability and quality of supply by rehabilitating their networks. Network losses total 13 percent of gross supply in Armenia.
28 The figure does not reflect capacity of plants with output destined for export (Hrazdan 5, Yere-van CCGT and Meghri HPP).
30 CHARGED DECISIONS: DIFFICULT CHOICES IN ARMENIA’S ENERGY SECTOR
HVEN has undertaken rehabilitation of the transmission system over the past ten years with the help of development partners. A €14.1 million loan from KfW was used to over-haul the transformer stations in Kamo, Vanadzor and Alaverdi. From 1999 to 2006, the Electricity Transmission and Distribution Project, financed by the World Bank, provided US$ 19.8 million to rehabilitate transmission substations. Despite these investments,HVEN estimates that roughly 20 percent of its lines and pylons (roughly 520 km) are in needofurgentrehabilitation,atanestimatedcostofroughlyUS$80-100million.
ENAhasalsoembarkedonanambitiousinvestmentplan.ItplannedtoinvestUS$164million in 2011-2013 to reduce losses, improve quality of supply, and improve energy system integration programs with other CIS countries.
Intotal,roughlyUS$300millionrequiredinnewtransmissionanddistributioninvest-ments planned will add an extra AMD 2/kWh to tariffs.
Investments in gas and petroleum storageIncreasing gas storage capacity can improve the security of short-term gas supply. Arme-nia has suffered a number of supply interruptions on the gas pipeline that runs through Georgia. In 2009, Armenia had 127-130 million m3 available gas storage capacity, secur-ing around 10 days of gas supply during the winter peak consumption. In 2010, Armrus-gazprominvestedUS$1.6milliontoincreaseitscapacityto140millionm3
.29 It has plans
to further increase capacity to 190-195 million m3 of gas by 2013. These investments would increase the amount of time Armenia could rely on its natural gas reserves by as much as 50 percent.
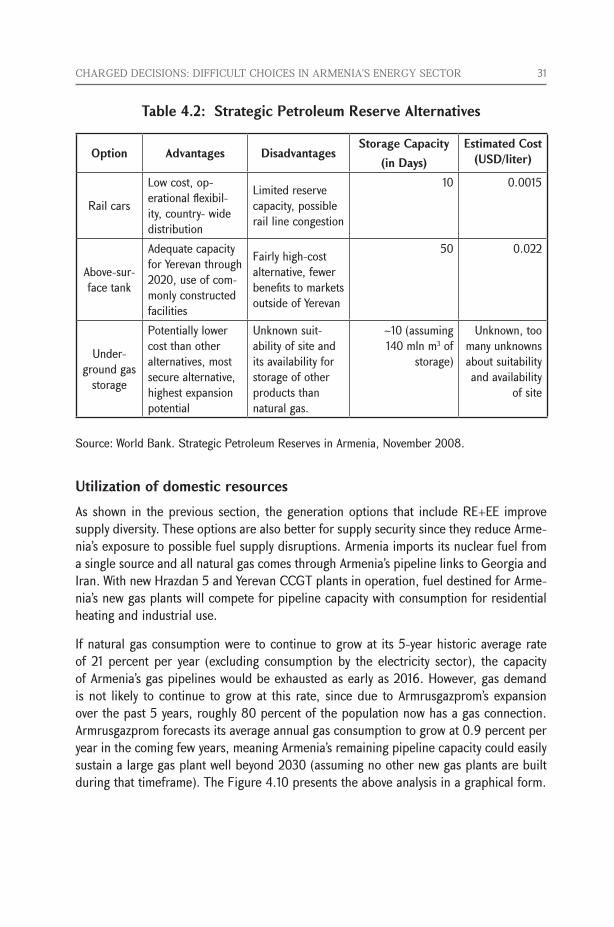
There is also a possibility that Armenia’s underground gas storage facilities could be converted to a strategic petroleum reserve. A World Bank desk study identified three alternatives for the location of a strategic petroleum reserve: rail cars, above-ground tanks, and underground gas storage facilities. Table 4.2 demonstrates the pros and cons of each alternative. A more detailed feasibility study will need to be conducted to identify the appropriate solution.
29 “Armrusgasprom`sinvestmentsinArmenia`sgassector$28millionlastyear”.News.am.April11, 2011. (http://news.am/eng/news/54735.html). Accessed on May 5, 2011.
CHARGED DECISIONS: DIFFICULT CHOICES IN ARMENIA’S ENERGY SECTOR 31
Table 4.2: Strategic Petroleum Reserve Alternatives
Option Advantages DisadvantagesStorage Capacity
(in Days)Estimated Cost
(USD/liter)
Rail cars
Low cost, op-erational flexibil-ity, country- wide distribution
Limited reserve capacity, possible rail line congestion
10 0.0015
Above-sur-face tank
Adequate capacity for Yerevan through 2020, use of com-monly constructed facilities
Fairly high-cost alternative, fewer benefits to markets outside of Yerevan
50 0.022
Under-ground gas
storage
Potentially lower cost than other alternatives, most secure alternative, highest expansion potential
Unknown suit-ability of site and its availability for storage of other products than natural gas.
~10 (assuming 140 mln m3 of
storage)
Unknown, too many unknowns about suitability and availability
of site
Source: World Bank. Strategic Petroleum Reserves in Armenia, November 2008.
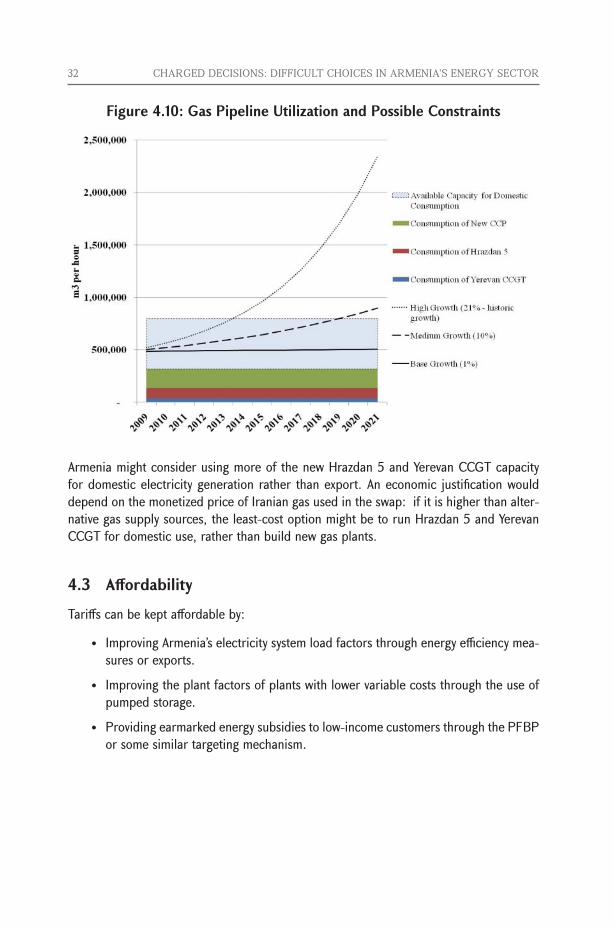
Utilization of domestic resourcesAsshown in theprevioussection, thegenerationoptions that includeRE+EE improvesupply diversity. These options are also better for supply security since they reduce Arme-nia’s exposure to possible fuel supply disruptions. Armenia imports its nuclear fuel from a single source and all natural gas comes through Armenia’s pipeline links to Georgia and Iran. With new Hrazdan 5 and Yerevan CCGT plants in operation, fuel destined for Arme-nia’s new gas plants will compete for pipeline capacity with consumption for residential heating and industrial use.
If natural gas consumption were to continue to grow at its 5-year historic average rate of 21 percent per year (excluding consumption by the electricity sector), the capacity of Armenia’s gas pipelines would be exhausted as early as 2016. However, gas demand is not likely to continue to grow at this rate, since due to Armrusgazprom’s expansion over the past 5 years, roughly 80 percent of the population now has a gas connection. Armrusgazprom forecasts its average annual gas consumption to grow at 0.9 percent per year in the coming few years, meaning Armenia’s remaining pipeline capacity could easily sustain a large gas plant well beyond 2030 (assuming no other new gas plants are built during that timeframe). The Figure 4.10 presents the above analysis in a graphical form.
32 CHARGED DECISIONS: DIFFICULT CHOICES IN ARMENIA’S ENERGY SECTOR
Figure 4.10: Gas Pipeline Utilization and Possible Constraints
Armenia might consider using more of the new Hrazdan 5 and Yerevan CCGT capacity for domestic electricity generation rather than export. An economic justification would depend on the monetized price of Iranian gas used in the swap: if it is higher than alter-native gas supply sources, the least-cost option might be to run Hrazdan 5 and Yerevan CCGT for domestic use, rather than build new gas plants.
4.3 Affordability
Tariffs can be kept affordable by:
• ImprovingArmenia’selectricitysystemloadfactorsthroughenergyefficiencymea-sures or exports.
• Improvingtheplantfactorsofplantswithlowervariablecoststhroughtheuseofpumped storage.
• Providingearmarkedenergysubsidiestolow-incomecustomersthroughthePFBPor some similar targeting mechanism.
CHARGED DECISIONS: DIFFICULT CHOICES IN ARMENIA’S ENERGY SECTOR 33
Improving the load factorArmenia can reduce its need for new generating capacity, and hence overall cost of new generating capacity, by improving the system load factor. The system load factor is the ratio of average consumption to a system peak during a given time period. The load factor can be improved by increasing average consumption relative to peak or reducing peak demand relative to baseload.
Armenia’s historical load factor ranged between 50 and 60 percent. Many advanced electricity systems gravitate toward load factors that range from 60 to 70 percent. As Figure 4.1 and Figure 4.2 illustrate, improving the capacity factor of plants increases their utilization (capacity factors) and lowers their LEC, which can lower the average system costs. Armenia has several options for improving its load factor.
First, Armenia can improve the overall system load factor by exporting more electricity during off-peak periods (for example, during the summer months or during off-peak periods in summer or winter).30 This will increase baseload relative to peak, thereby increasing utilization of the nuclear plant. In the short-term, Armenia’s electricity exports will likely continue to be competitive. In the long-term, however, Armenia’s electricity pro-ducers may have difficulty increasing exports because the region has a number of other competing suppliers with lower cost supplies of energy. Box 4.2 contains a more detailed analysis of Armenia’s potential to become an exporter to the region.
30 As noted in earlier sections, Armenia already has some regional exchange of electricity with Iran and Georgia.
34 CHARGED DECISIONS: DIFFICULT CHOICES IN ARMENIA’S ENERGY SECTOR
Box 4.2: Armenia’s Potential for Electricity Exports
Beyond the short term, Armenia’s electricity producers may have difficulty exporting to the region given the competition against multiple lower-cost energy suppliers. A new 500 kV transmission line planned between Azerbaijan, Georgia and Turkey would allow Turkey to absorb surplus from Azerbaijan and Georgia in summer. Export prices from Armenia will likely be higher than the estimated export prices for electricity from Azerbaijan and Georgia. Azerbaijan has its own oil and gas resources and Georgia has an abundance of cheap hydroelec-tric generating capacity (85 percent of Georgia’s electricity is generated by hydroelectric plants). AzerbaijanisexpectedtobeabletoofferelectricitytoTurkeyatroughlyUS$0.07/kWhin2015.GeorgiaisexpectedtoofferpricesrangingfromUS$0.06/kWh-0.07/kWh.Armenia’saveragesystemgeneratingcostwilllikelybeintherangeofUS$0.06/kWh-0.15/kWh,depending on demand growth and the cost of financing for each plant (the nuclear plant in par-ticular). However, the average system cost understates the likely export costs to Turkey because the average system cost refers to the cost of electricity before delivery (in other words, excluding transmission costs) and because countries will typically serve domestic load with their lower cost plants and export electricity from their higher cost plants.In the short-term, Armenia’s exports will likely continue to be competitive with Azerbaijan and Turkey, and Armenia will continue to have an electricity surplus. The global financial crisis has delayed the threat of a demand gap in many of the countries in the region, but some opportuni-ties for seasonal exchange of electricity will still exist. Armenia’s older plants operate at relatively low cost because from a tariff perspective they are fully depreciated and no longer receive a capacity charge. Moreover, Armenia imports gas from Russia at much lower prices than other countries. Therefore, Armenia’s average generating costs are competitive with its neighbors and, in particular, are currently much lower than in Turkey. Armenia’s average cost of generation is roughlyUS$0.035/kWh-0.045/kWh.TheaveragecostofgenerationinTurkey isaroundUS$0.073/kWh,inAzerbaijan–US$0.03/kWh,andinGeorgia–US$0.015/kWh.
Sources: Econ Poyry AS. “Electricity Export Opportunities from Georgia and Azerbaijan to Tur-key.” Commissioned by the Ministry of Energy of Georgia.
Fichtner. “Regional Power Transmission Extension Plan for Caucasus Countries.” Final Report for KfW. November 2007.
Public Services Regulatory Commission, Armenia.
Second, Armenia can improve its load factor by using EE measures to reduce peak load. A 2008 World Bank study estimated that Armenia could save as much as AMD 132 billion annually, or about 4.95 percent of its 2006 GDP, by making EE investments recom-mended by the National Program on Energy Savings and Renewable Energy.31 Box 4.3 summarizes the study results.
31 The 2008 study did not consider the possibility that Armenia would build a nuclear plant with more capacity than needed to serve peak load. Section 4.1 shows that EE measures could increase cost per kWh of electricity if the already low utilization of a large nuclear plant is further reduced (because capital costs are spread over fewer kWh). The EE measures would add to overall costs in a system that already has surplus capacity.
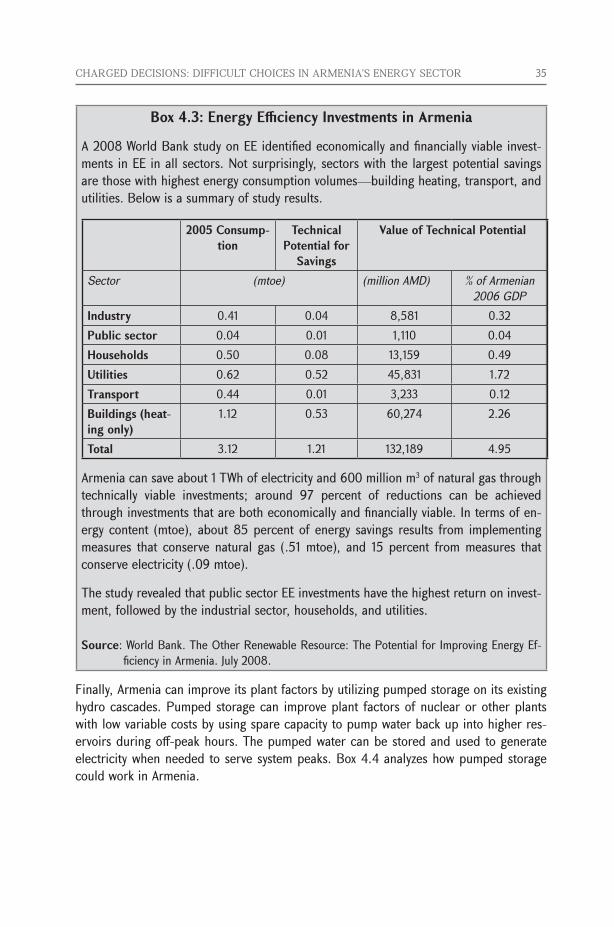
CHARGED DECISIONS: DIFFICULT CHOICES IN ARMENIA’S ENERGY SECTOR 35
Box 4.3: Energy Efficiency Investments in Armenia
A 2008 World Bank study on EE identified economically and financially viable invest-ments in EE in all sectors. Not surprisingly, sectors with the largest potential savings are those with highest energy consumption volumes—building heating, transport, and utilities. Below is a summary of study results.
2005 Consump-tion
Technical Potential for
Savings
Value of Technical Potential
Sector (mtoe) (million AMD) % of Armenian 2006 GDP
Industry 0.41 0.04 8,581 0.32Public sector 0.04 0.01 1,110 0.04Households 0.50 0.08 13,159 0.49Utilities 0.62 0.52 45,831 1.72Transport 0.44 0.01 3,233 0.12Buildings (heat-ing only)
1.12 0.53 60,274 2.26
Total 3.12 1.21 132,189 4.95
Armenia can save about 1 TWh of electricity and 600 million m3 of natural gas through technically viable investments; around 97 percent of reductions can be achieved through investments that are both economically and financially viable. In terms of en-ergy content (mtoe), about 85 percent of energy savings results from implementing measures that conserve natural gas (.51 mtoe), and 15 percent from measures that conserve electricity (.09 mtoe).
The study revealed that public sector EE investments have the highest return on invest-ment, followed by the industrial sector, households, and utilities.
Source: World Bank. The Other Renewable Resource: The Potential for Improving Energy Ef-ficiency in Armenia. July 2008.
Finally, Armenia can improve its plant factors by utilizing pumped storage on its existing hydro cascades. Pumped storage can improve plant factors of nuclear or other plants with low variable costs by using spare capacity to pump water back up into higher res-ervoirs during off-peak hours. The pumped water can be stored and used to generate electricity when needed to serve system peaks. Box 4.4 analyzes how pumped storage could work in Armenia.
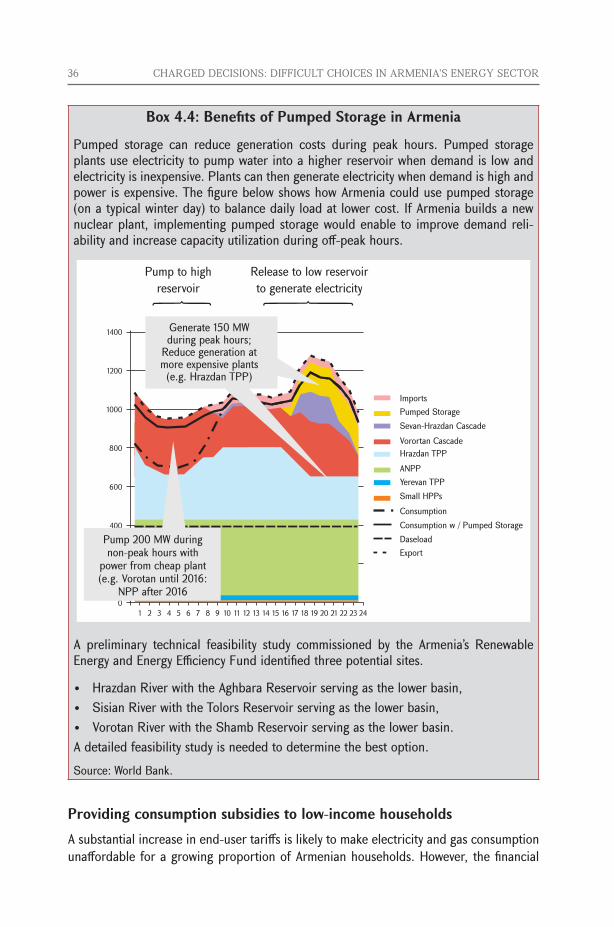
36 CHARGED DECISIONS: DIFFICULT CHOICES IN ARMENIA’S ENERGY SECTOR
Box 4.4: Benefits of Pumped Storage in Armenia
Pumped storage can reduce generation costs during peak hours. Pumped storage plants use electricity to pump water into a higher reservoir when demand is low and electricity is inexpensive. Plants can then generate electricity when demand is high and power is expensive. The figure below shows how Armenia could use pumped storage (on a typical winter day) to balance daily load at lower cost. If Armenia builds a new nuclear plant, implementing pumped storage would enable to improve demand reli-ability and increase capacity utilization during off-peak hours.
A preliminary technical feasibility study commissioned by the Armenia’s Renewable Energy and Energy Efficiency Fund identified three potential sites.
• HrazdanRiverwiththeAghbaraReservoirservingasthelowerbasin,• SisianRiverwiththeTolorsReservoirservingasthelowerbasin,• VorotanRiverwiththeShambReservoirservingasthelowerbasin.A detailed feasibility study is needed to determine the best option. Source: World Bank.
Providing consumption subsidies to low-income householdsA substantial increase in end-user tariffs is likely to make electricity and gas consumption unaffordable for a growing proportion of Armenian households. However, the financial
CHARGED DECISIONS: DIFFICULT CHOICES IN ARMENIA’S ENERGY SECTOR 37
sustainability of the sector requires the tariffs to keep pace with anticipated cost increas-es. There are a number of measures the Government can consider to make electricity affordable for low-income customers, while preserving the financial sustainability of the sector.
Designing a subsidy program requires decisions about:
• Identification of low-income customers. Armenia has a well-established social support program, the PFBP, which provides direct cash transfers to poor house-holds. Households are identified as poor according to a formula with thirteen means-testing variables. The PFBP’s family vulnerability assessment includes a formula which measures energy poverty.
As an alternative, customers could be identified based on their energy consump-tion. So-called lifeline tariffs are tariffs set below the cost of service for some minimum level of energy consumption (for example, 50 kWh and less). Consumers must pay higher (cost recovery) tariffs for any units of energy consumed beyond the minimum lifeline volume. On the one hand, lifeline tariffs allow for only very rough targeting of customers. Customers who use less than the lifeline volume may not be poor (for example, individuals with vacation homes). Customers who use more than the lifeline may not be wealthy (for example, households with many family members). On the other hand, if the poverty rate is high (as it is in Armenia) or the accuracy of alternative targeting mechanisms is low, lifeline tariffs may be the best option.
The Government does have some experience with lifeline tariffs. Lifeline tariffs were used in the electricity sector in the 1990s. Moreover, in March of 2011, the Government introduced a temporary, one-year lifeline tariff for natural gas cus-tomers. However, the low-income customers of electricity and gas service require longer term support.32
• Delivery of the subsidy. Subsidies can be delivered directly to customers, as cash or vouchers, or indirectly, as discounts on customers’ energy bills. The Gov-ernment could deliver the subsidies directly, through the PFBP, or indirectly, by discounting tariffs for certain customer classes or (as with a lifeline tariff) certain volumes of consumption. If the Government decides to use the targeting mecha-nism used by PFBP, it could consider using vouchers instead of cash to ensure that the subsidy is spent on energy.
• How to fund the subsidy. Subsidies may be funded by direct transfer from the Government (to the utility or to the PFBP program), or through cross-subsidies by other customers. Lifeline tariffs are more commonly funded through cross-sub-sidies. The advantage of a cross subsidy is that it avoids using government funds.
32 Under the current gas lifeline tariff, poor customers pay AMD 100/m3 compared to regular tariff of AMD 132/m3. This tariff holds for up to 300 m3 of gas consumed during the 1-year period from April 1, 2011 until March 31, 2012.
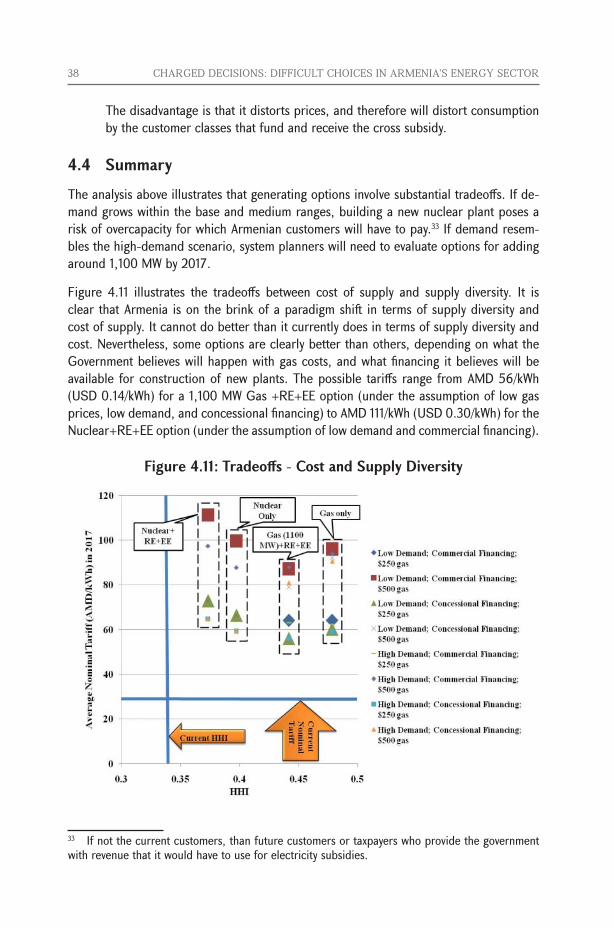
38 CHARGED DECISIONS: DIFFICULT CHOICES IN ARMENIA’S ENERGY SECTOR
The disadvantage is that it distorts prices, and therefore will distort consumption by the customer classes that fund and receive the cross subsidy.
4.4 Summary
The analysis above illustrates that generating options involve substantial tradeoffs. If de-mand grows within the base and medium ranges, building a new nuclear plant poses a risk of overcapacity for which Armenian customers will have to pay.33 If demand resem-bles the high-demand scenario, system planners will need to evaluate options for adding around 1,100 MW by 2017.
Figure 4.11 illustrates the tradeoffs between cost of supply and supply diversity. It is clear that Armenia is on the brink of a paradigm shift in terms of supply diversity and cost of supply. It cannot do better than it currently does in terms of supply diversity and cost. Nevertheless, some options are clearly better than others, depending on what the Government believes will happen with gas costs, and what financing it believes will be available for construction of new plants. The possible tariffs range from AMD 56/kWh (USD0.14/kWh)fora1,100MWGas+RE+EEoption(undertheassumptionoflowgasprices, low demand, and concessional financing) to AMD 111/kWh (USD 0.30/kWh) for the Nuclear+RE+EEoption(undertheassumptionoflowdemandandcommercialfinancing).
Figure 4.11: Tradeoffs - Cost and Supply Diversity
33 If not the current customers, than future customers or taxpayers who provide the government with revenue that it would have to use for electricity subsidies.
CHARGED DECISIONS: DIFFICULT CHOICES IN ARMENIA’S ENERGY SECTOR 39
The Government likely has some certainty with respect to future gas prices and avail-ability of financing, but the path of economic growth, a key driver of electricity demand, is much more difficult to predict.
The high-demand case of 11 percent annual GDP growth seems unlikely, but during 2010 Armenia’s electricity demand growth was 3.0 percent suggesting rapid recovery from the global financial crisis. Demand might continue to grow at pre-crisis rates.
There is also considerable uncertainty surrounding the costs of new units. The cost-effectiveness of the new nuclear plant is very sensitive to capital costs. Even before the events at Fukushima in April 2011, construction costs and construction timeframes for new nuclear plants were difficult to predict. This unpredictability will likely continue as suppliers adjust to the changes of the market.
With such uncertainty, a staged approach is advisable. There seems to be little question that the Government will proceed with its plans to build a nuclear plant, but the Govern-ment also recognizes that the plant might not be ready by the earlier target date of 2017.
In the interim the Government could consider the construction of smaller gas units (200-300 MW each) and investments in EE measures and RE generation as described above. Gas plants can be built in smaller increments and more quickly, offering some flexibility to respond to changes in demand. If within the next several years the nuclear option becomes more difficult or demand comes close to the high-demand scenario range, more gas plants could be built. On the other hand, if demand appears to more closely track the low-demand scenario, less new gas capacity might be sufficient. A smaller gas plant, for example 600 MW, is more affordable and offers better supply diversity than the larger 800 MW and 1,000 MW “right sized” gas plant options described above.
The use of additional capacity at Hrazdan 5 or Yerevan CCGT could also be considered, rather than using these plants entirely for export. The Government could also consider reserving some or all of the capacity of the planned Meghri HPP for domestic use rather than (as currently planned) export to Iran.
Delaying retirements may also be part of the solution, provided these could be done given safety and operational considerations.34 Figure 4.12 shows that, even under the highest demand scenario, Armenia’s electricity system could continue to meet peak and have nearly enough reserve capacity. Some of the thermal plants could conceivably be retired in 2017, as scheduled, if a new, mid-sized gas could be built in the meantime.
34 This note does not take any view on the safety considerations of delaying the shutdown of the Metsamor nuclear power plant.
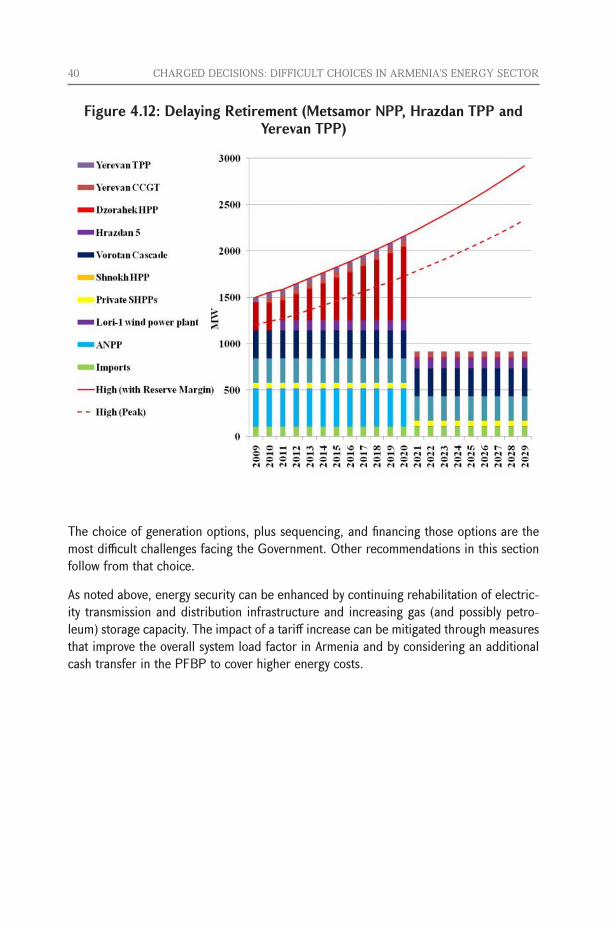
40 CHARGED DECISIONS: DIFFICULT CHOICES IN ARMENIA’S ENERGY SECTOR
Figure 4.12: Delaying Retirement (Metsamor NPP, Hrazdan TPP and Yerevan TPP)
The choice of generation options, plus sequencing, and financing those options are the most difficult challenges facing the Government. Other recommendations in this section follow from that choice.
As noted above, energy security can be enhanced by continuing rehabilitation of electric-ity transmission and distribution infrastructure and increasing gas (and possibly petro-leum) storage capacity. The impact of a tariff increase can be mitigated through measures that improve the overall system load factor in Armenia and by considering an additional cash transfer in the PFBP to cover higher energy costs.
CHARGED DECISIONS: DIFFICULT CHOICES IN ARMENIA’S ENERGY SECTOR 41
Appendix A: History of Energy Sector Reforms in ArmeniaArmenia underwent major reforms of its power sector after a severe electricity crisis that began with the dawn of Armenia’s independence from the Soviet Union. The World Bank provided important support to the reforms. This Appendix discusses the steps Armenia took to reform the sector, why reform was necessary and how the World Bank worked with the Government to implement a successful reform of the sector.
A.1 Why Reform was NecessaryPost-Soviet Armenia gained independence, but faced serious challenges similar to those in other former Soviet republics. Armenia’s electricity system was not autonomous; it had been developed as part of a much larger Trans-Caucasus electrical grid. Armenia relied heavily on imported fuel from neighboring countries and the problems with this system began to show in 1992.
The start of the war over Nagorno Karabakh and the resulting economic blockade by Azerbaijan and Turkey cut off Armenia’s only source of gas and oil for its thermal plants. Four years prior to that, a massive earthquake had forced a shut-down of the Metsamor NPP, a source of roughly one-third of Armenia’s generating capacity. Supply from a new gas pipeline, built in 1993 through neighboring Georgia, was regularly interrupted by acts of sabotage. Armenia was left to rely almost entirely on its hydropower resources, at great expense of Lake Sevan, one of the country’s most precious natural resources. Between 1992 and 1996, customers suffered through several of Armenia’s brutal winters with little more than two hours of electricity per day.
Fiscal and quasi-fiscal subsidies to the power sector had reached a level of roughly 11 per-fiscal subsidies to the power sector had reached a level of roughly 11 per- subsidies to the power sector had reached a level of roughly 11 per-cent of Armenia’s GDP by 1995 (the first year when reliable data are available). Collec-tions were around 50 percent, and nearly 25 percent of all power produced disappeared before the meters as commercial losses (mostly electricity theft). The system remained dilapidated from years of crisis operation and underinvestment and was dependent upon massive public subsidies.
A.2 Steps Taken for ReformMajor reforms in the Armenian power sector included the following.
• Unbundlingandprivatizingthepowersystem
• Establishinganindependentregulator
• Achievingsectoralfinancialsustainability.
The following subsections describe these three reform efforts in detail.
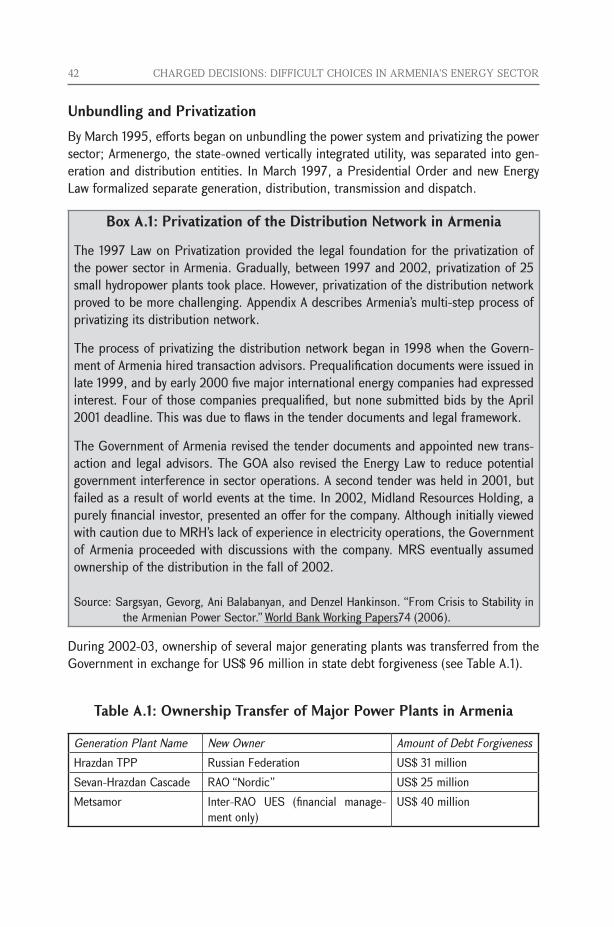
42 CHARGED DECISIONS: DIFFICULT CHOICES IN ARMENIA’S ENERGY SECTOR
Unbundling and PrivatizationBy March 1995, efforts began on unbundling the power system and privatizing the power sector; Armenergo, the state-owned vertically integrated utility, was separated into gen-eration and distribution entities. In March 1997, a Presidential Order and new Energy Law formalized separate generation, distribution, transmission and dispatch.
Box A.1: Privatization of the Distribution Network in Armenia
The 1997 Law on Privatization provided the legal foundation for the privatization of the power sector in Armenia. Gradually, between 1997 and 2002, privatization of 25 small hydropower plants took place. However, privatization of the distribution network proved to be more challenging. Appendix A describes Armenia’s multi-step process of privatizing its distribution network.
The process of privatizing the distribution network began in 1998 when the Govern-ment of Armenia hired transaction advisors. Prequalification documents were issued in late 1999, and by early 2000 five major international energy companies had expressed interest. Four of those companies prequalified, but none submitted bids by the April 2001 deadline. This was due to flaws in the tender documents and legal framework.
The Government of Armenia revised the tender documents and appointed new trans-action and legal advisors. The GOA also revised the Energy Law to reduce potential government interference in sector operations. A second tender was held in 2001, but failed as a result of world events at the time. In 2002, Midland Resources Holding, a purely financial investor, presented an offer for the company. Although initially viewed with caution due to MRH’s lack of experience in electricity operations, the Government of Armenia proceeded with discussions with the company. MRS eventually assumed ownership of the distribution in the fall of 2002.
Source: Sargsyan, Gevorg, Ani Balabanyan, and Denzel Hankinson. “From Crisis to Stability in the Armenian Power Sector.” World Bank Working Papers74 (2006).
During 2002-03, ownership of several major generating plants was transferred from the GovernmentinexchangeforUS$96millioninstatedebtforgiveness(seeTableA.1).
Table A.1: Ownership Transfer of Major Power Plants in Armenia
Generation Plant Name New Owner Amount of Debt ForgivenessHrazdan TPP Russian Federation US$31millionSevan-Hrazdan Cascade RAO “Nordic” US$25millionMetsamor Inter-RAO UES (financial manage-
ment only)US$40million
CHARGED DECISIONS: DIFFICULT CHOICES IN ARMENIA’S ENERGY SECTOR 43
Establishment of the regulatorThe Presidential Order and the Energy Law enacted in 1997 established an independ-ent energy sector regulator, the Armenian Energy Regulatory Commission (AERC). The Law on the Regulatory Body for Public Services, enacted in 2004, changed the name of the regulator to the Public Services Regulatory Commission (PSRC) and expanded its authority to other sectors, including water, drainage and sewage, and telecom. Appendix B describes the functions of the PSRC in further detail.
Financial sustainability Three steps were essential to increase collections, reduce commercial losses and improve the overall financial sustainability of the sector. These included:
• Installing meters. Between 1997 and 1998, twelve thousand new tamper-proof meters were installed throughout the power system at a variety of voltage levels down to 0.4 kV. Residential customer meters were relocated to public areas. An Automated Metering and Data Acquisition System (AMDAS) was installed in 2001 and linked to a settlement center to facilitate accurate meter reading at the 110 kV and above
• Bringing tariffs to cost recovery levels. In 1994, Armenia began a gradual transition to cost-based tariffs by bring household tariffs to the average level of other retail tariffs. A schedule was established for further household tariff hikes. Since 1999, household tariffs have remained well above the overall average tariff
• Increasing transparency in collections and billing. The Electricity Distribu-tion Company (EDC) installed a computerized customer information system to better track utilization and billing. In 1999, the EDC established a new collection scheme requiring bill payments at post offices instead of cash payments at local EDC offices, which reduced opportunities for collusion between customers and EDC inspectors.
A.3 The Role of the World BankThe World Bank worked closely with the Government and sector stakeholders to shape key measures that were critical to the sustainability of the reform process. Key instruments that were critical to the effectiveness of the World Bank strategy in the sector include:
• Themixtureandsequenceofloansprovided.TheWorldBankutilizedtwoloanar-rangements in support of power sector reforms in Armenia. Structural Adjustment Credits (SAC) I-IV influenced sector reforms via the following key conditions:
– Improvement of collection rates;
– Increased tariff levels to cover operating costs;
44 CHARGED DECISIONS: DIFFICULT CHOICES IN ARMENIA’S ENERGY SECTOR
– Development and implementation of a comprehensive financial rehabili-tation program;
– Development and implementation of a privatization strategy.
The World Bank also provided sector-specific investment loans to emphasize cost-effective rehabilitation of the existing power system, as opposed to immediate investment in costly new infrastructure.
• Technicalassistance.TheWorldBankprovided technicalassistance tohelp theGovernment defend its rationale for supporting consolidation and cost-effective reform of the existing power system. For example:
– A World Bank study influenced the Government’s decision to focus first ontheareasofmostsignificantcommerciallossesatacostofUS$20million, (solving 60 percent of the problems with commercial losses), ratherthaninvestingUS$80-100millionimmediatelytosolve100per-cent of commercial losses;
– The World Bank emphasized the cost effectiveness of meter relocation over complete meter replacement.
CHARGED DECISIONS: DIFFICULT CHOICES IN ARMENIA’S ENERGY SECTOR 45
Appendix B: Overview of the Regulatory FrameworkThe 1997 Energy Law established the current regulatory framework for the energy sector in Armenia. This section provides an overview of the regulatory framework and describes how the Government has built upon the existing framework. Section B.1 begins with a general overview of regulation of the electricity sector. Section B.2 continues by de-scribing the development of renewable energy regulation. Section B.3 outlines the tariff setting methodology. Section B.4 concludes with a description of the service quality standards.
B.1 Regulation of the Electricity Sector The 1997 Energy Law is the foundation for electricity sector regulation in Armenia. The Energy Law established the Armenia Energy Regulatory Commission (AERC) as an inde-pendent regulator responsible for technical and economic regulation. In 2004, the Law on the Regulatory Body for Public Services renamed the AERC as the Public Services Regulatory Commission (PSRC) and expanded its regulatory responsibilities to include the water, natural gas, and heating sectors. In 2005, an amendment to the Law on the Regulatory Body for Public Services gave the PSRC regulatory responsibility for the telecommunications sector.
The Energy Law sets the functions and operational procedures of the regulator for the electricity sector. According to the Law, the regulator’s responsibilities include:
• Issuing licenses. All generation, transmission, and distribution operators must obtain a license from the PSRC. The PSRC sets conditions for obtaining a license and has discretion over all procedures and terms of the licensing application pro-cess
• Setting tariffs. The PSRC sets and reviews tariffs for generation, transmission, dispatch and distribution
• Overseeing compliance with licensee obligations. The PSRC reviews the operation of licensees and can penalize operators for not fulfilling license re-quirements through one of four methods—a warning, a tariff reduction, a license suspension, or a license revocation. The licensee can appeal a penalty at a com-mission hearing.
• Defining electricity market rules. The PSRC is in charge of defining rules for the relationship between Licensees operating in the sector
• Mediating disputes between licensees and customers. Licensed operators must submit all customer complaints to PSRC. The PSRC has the authority to rule on disputes
46 CHARGED DECISIONS: DIFFICULT CHOICES IN ARMENIA’S ENERGY SECTOR
• Setting quality of service requirements. The PSRC must set service quality standards for all electricity services provided to customers.
B.2 Regulatory Framework for Renewable EnergyThe following regulations provide incentives for investment in renewable energy genera-tion:
• Electricity Purchase Agreements. The Energy Law mandates that, during the first 15 years of operations, 100 percent of electricity produced from new renew-able energy systems must be purchased at tariff levels set by the PSRC
• Tariff Incentives. The PSRC supports renewable energy investments through fixed-rate feed-in tariffs. As of January 2011, the feed-in tariff for electricity gener-atedfromwindwasUS$0.09/kWh,forbiomass–US$0.10/kWhandUS$0.05/kWh for electricity generated from small hydro-power plants.35
B.3 Tariff Setting MethodologyThe PSRC establishes the procedures for setting and reviewing tariffs. According the Energy Law, the PSRC can either set the specific monetary value of the tariff or establish a clear formula for calculating the tariff based on parameters defined in the Energy Law.
According to the Energy Law, a tariff should cover:
• Justifiedoperationandmaintenancecosts
• Loanservicecosts
• Costsrelatedtoenvironmentalstandards
• Mothballingandpreservationcosts
• Costsofthesafekeepingoftheutilizednuclearfuelandrequisiteallocationsto the Nuclear Plant Decommissioning Fund
• Technicalandcommerciallosses
• OtherjustifiedcostsasprovidedbyLegislation.
The tariff should also provide the operator with the opportunity to make a reasonable profit.
The PSRC or the Licensee can request a tariff review every six months. Once requested, a tariff review must be submitted within 90 days. The PSRC is authorized to set long-term tariffs for more than six-months if it is considered necessary to provide investment security. Once a tariff is set, licensees cannot appeal the amount of a tariff. The only recourse for altering an assigned tariff is to petition the PSRC’s tariff methodology. 35 A small hydro-power plant is a hydro-powered plant with a nameplate capacity of less than 30 MW. The mentioned tariffs are VAT exclusive.

CHARGED DECISIONS: DIFFICULT CHOICES IN ARMENIA’S ENERGY SECTOR 47
B.4 Electricity Service Quality StandardsThe PSRC establishes and monitors service quality standards in the electricity sector. A 2001 amendment to the Law on Electricity Distribution Company Privatization removed a mandatoryinvestmentquota(US$80million)onnewelectricitydistributioncompanies(EDCs); instead, service quality standards were enacted as a method of regulating per-formance. In 2005, the PSRC first developed a list of standards and now licensees are monitored for compliance with these standards, which include the following:
• Systemaverageinterruptionfrequency(interruptions/customer)
• Systemaverageinterruptionduration(minutes/customer)
• Averagefrequencyofnon-standardcustomervoltage.

48 CHARGED DECISIONS: DIFFICULT CHOICES IN ARMENIA’S ENERGY SECTOR
Appendix C: Armenia’s Energy Sector Comparisons
Table C.1: Comparing Armenia’s Reforms
Reform Status Armenia Georgia Azerbaijan Macedonia Hungary Bulgaria Private Sector Participation Y Y N Y Y Y
Regulator Y Y Y Y Y YUnbundled Y Y Y Y Y Y
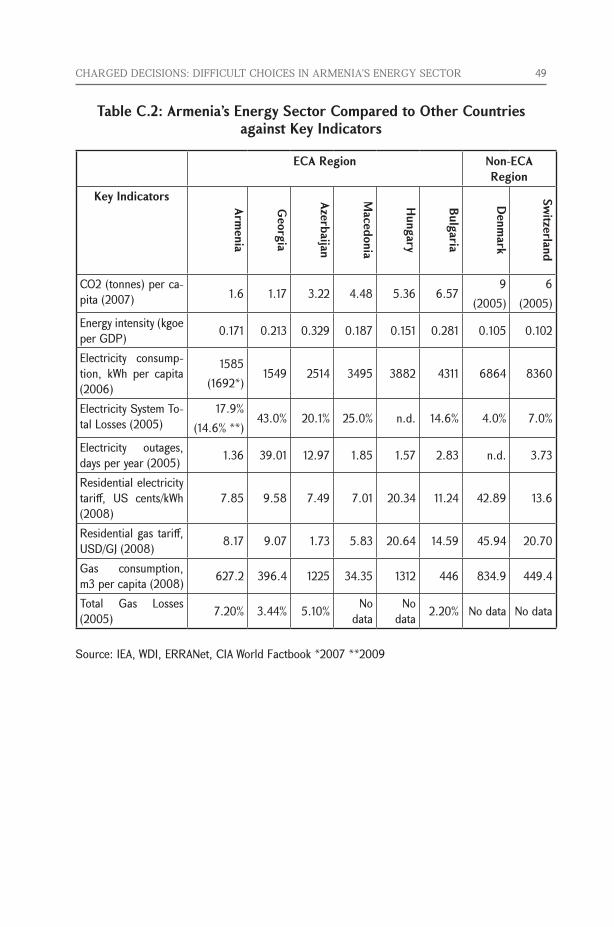
CHARGED DECISIONS: DIFFICULT CHOICES IN ARMENIA’S ENERGY SECTOR 49
Table C.2: Armenia’s Energy Sector Compared to Other Countries against Key Indicators
ECA Region Non-ECA Region
Key Indicators Armenia
Georgia
Azerbaijan
Macedonia
Hungary
Bulgaria
Denm
ark
Switzerland
CO2 (tonnes) per ca-pita (2007) 1.6 1.17 3.22 4.48 5.36 6.57
9(2005)
6(2005)
Energy intensity (kgoe per GDP) 0.171 0.213 0.329 0.187 0.151 0.281 0.105 0.102
Electricity consump-tion, kWh per capita (2006)
1585(1692*)
1549 2514 3495 3882 4311 6864 8360
Electricity System To-tal Losses (2005)
17.9%(14.6% **)
43.0% 20.1% 25.0% n.d. 14.6% 4.0% 7.0%
Electricity outages, days per year (2005) 1.36 39.01 12.97 1.85 1.57 2.83 n.d. 3.73
Residential electricity tariff, US cents/kWh (2008)
7.85 9.58 7.49 7.01 20.34 11.24 42.89 13.6
Residential gas tariff, USD/GJ (2008) 8.17 9.07 1.73 5.83 20.64 14.59 45.94 20.70
Gas consumption, m3 per capita (2008) 627.2 396.4 1225 34.35 1312 446 834.9 449.4
Total Gas Losses (2005) 7.20% 3.44% 5.10% No
dataNo
data 2.20% No data No data
Source: IEA, WDI, ERRANet, CIA World Factbook *2007 **2009
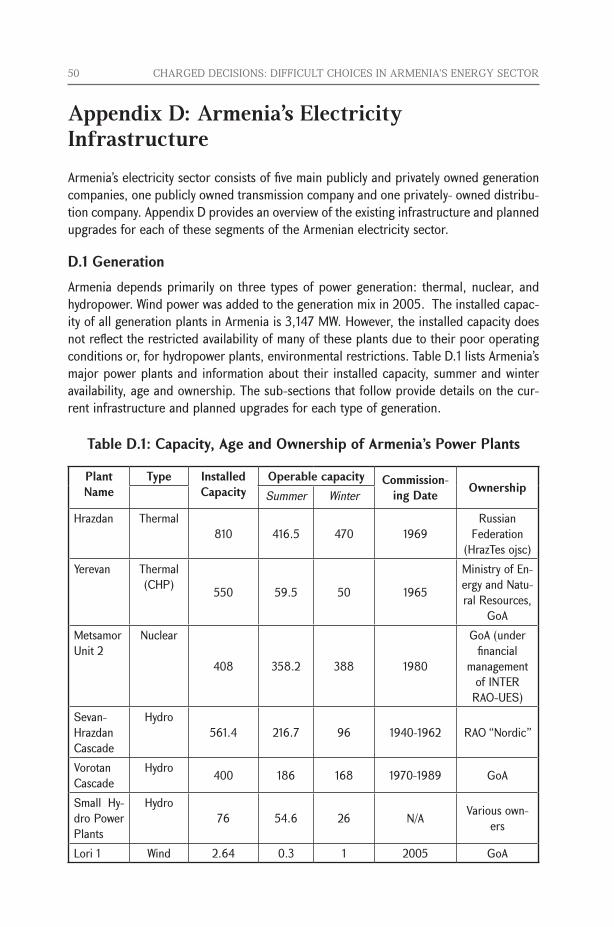
50 CHARGED DECISIONS: DIFFICULT CHOICES IN ARMENIA’S ENERGY SECTOR
Appendix D: Armenia’s Electricity InfrastructureArmenia’s electricity sector consists of five main publicly and privately owned generation companies, one publicly owned transmission company and one privately- owned distribu-tion company. Appendix D provides an overview of the existing infrastructure and planned upgrades for each of these segments of the Armenian electricity sector.
D.1 GenerationArmenia depends primarily on three types of power generation: thermal, nuclear, and hydropower. Wind power was added to the generation mix in 2005. The installed capac-ity of all generation plants in Armenia is 3,147 MW. However, the installed capacity does not reflect the restricted availability of many of these plants due to their poor operating conditions or, for hydropower plants, environmental restrictions. Table D.1 lists Armenia’s major power plants and information about their installed capacity, summer and winter availability, age and ownership. The sub-sections that follow provide details on the cur-rent infrastructure and planned upgrades for each type of generation.
Table D.1: Capacity, Age and Ownership of Armenia’s Power Plants
Plant Name
Type Installed Capacity
Operable capacity Commission-ing Date OwnershipSummer Winter
Hrazdan Thermal810 416.5 470 1969
Russian Federation
(HrazTes ojsc)Yerevan Thermal
(CHP) 550 59.5 50 1965
Ministry of En-ergy and Natu-ral Resources,
GoAMetsamor Unit 2
Nuclear
408 358.2 388 1980
GoA (under financial
management of INTER RAO-UES)
Sevan-Hrazdan Cascade
Hydro561.4 216.7 96 1940-1962 RAO “Nordic”
Vorotan Cascade
Hydro 400 186 168 1970-1989 GoA
Small Hy-dro Power Plants
Hydro76 54.6 26 N/A Various own-
ers
Lori 1 Wind 2.64 0.3 1 2005 GoA
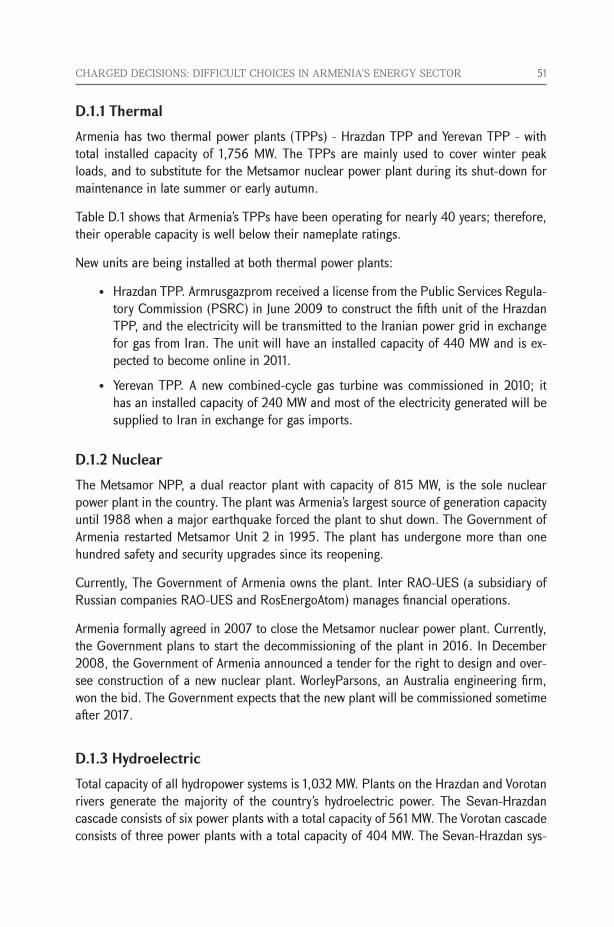
CHARGED DECISIONS: DIFFICULT CHOICES IN ARMENIA’S ENERGY SECTOR 51
D.1.1 ThermalArmenia has two thermal power plants (TPPs) - Hrazdan TPP and Yerevan TPP - with total installed capacity of 1,756 MW. The TPPs are mainly used to cover winter peak loads, and to substitute for the Metsamor nuclear power plant during its shut-down for maintenance in late summer or early autumn.
Table D.1 shows that Armenia’s TPPs have been operating for nearly 40 years; therefore, their operable capacity is well below their nameplate ratings.
New units are being installed at both thermal power plants:
• HrazdanTPP.ArmrusgazpromreceivedalicensefromthePublicServicesRegula-tory Commission (PSRC) in June 2009 to construct the fifth unit of the Hrazdan TPP, and the electricity will be transmitted to the Iranian power grid in exchange for gas from Iran. The unit will have an installed capacity of 440 MW and is ex-pected to become online in 2011.
• YerevanTPP.Anewcombined-cyclegas turbinewascommissioned in2010; ithas an installed capacity of 240 MW and most of the electricity generated will be supplied to Iran in exchange for gas imports.
D.1.2 NuclearThe Metsamor NPP, a dual reactor plant with capacity of 815 MW, is the sole nuclear power plant in the country. The plant was Armenia’s largest source of generation capacity until 1988 when a major earthquake forced the plant to shut down. The Government of Armenia restarted Metsamor Unit 2 in 1995. The plant has undergone more than one hundred safety and security upgrades since its reopening.
Currently, The Government of Armenia owns the plant. Inter RAO-UES (a subsidiary of Russian companies RAO-UES and RosEnergoAtom) manages financial operations.
Armenia formally agreed in 2007 to close the Metsamor nuclear power plant. Currently, the Government plans to start the decommissioning of the plant in 2016. In December 2008, the Government of Armenia announced a tender for the right to design and over-see construction of a new nuclear plant. WorleyParsons, an Australia engineering firm, won the bid. The Government expects that the new plant will be commissioned sometime after 2017.
D.1.3 HydroelectricTotal capacity of all hydropower systems is 1,032 MW. Plants on the Hrazdan and Vorotan rivers generate the majority of the country’s hydroelectric power. The Sevan-Hrazdan cascade consists of six power plants with a total capacity of 561 MW. The Vorotan cascade consists of three power plants with a total capacity of 404 MW. The Sevan-Hrazdan sys-
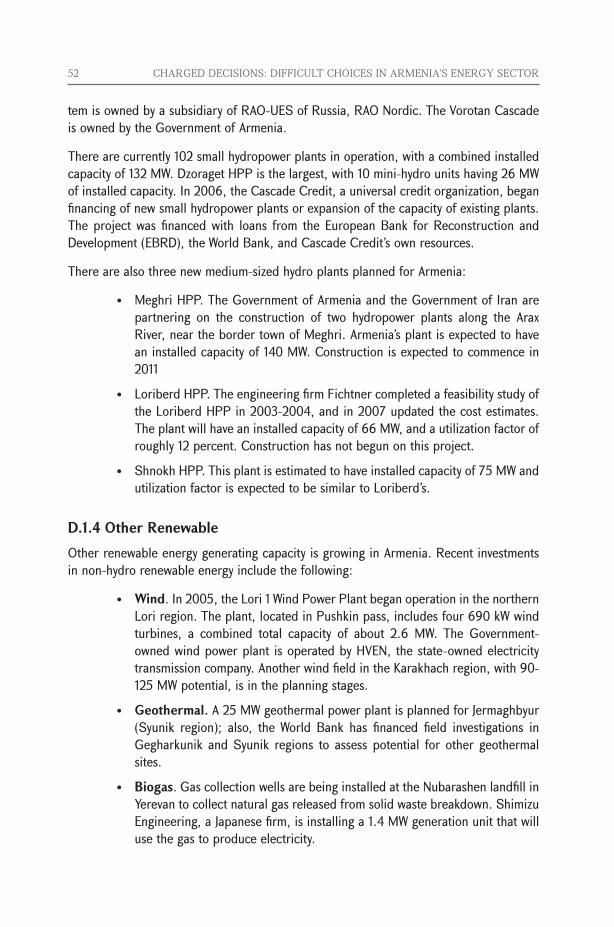
52 CHARGED DECISIONS: DIFFICULT CHOICES IN ARMENIA’S ENERGY SECTOR
tem is owned by a subsidiary of RAO-UES of Russia, RAO Nordic. The Vorotan Cascade is owned by the Government of Armenia.
There are currently 102 small hydropower plants in operation, with a combined installed capacity of 132 MW. Dzoraget HPP is the largest, with 10 mini-hydro units having 26 MW of installed capacity. In 2006, the Cascade Credit, a universal credit organization, began financing of new small hydropower plants or expansion of the capacity of existing plants. The project was financed with loans from the European Bank for Reconstruction and Development (EBRD), the World Bank, and Cascade Credit’s own resources.
There are also three new medium-sized hydro plants planned for Armenia:
• MeghriHPP.TheGovernmentofArmeniaandtheGovernmentofIranarepartnering on the construction of two hydropower plants along the Arax River, near the border town of Meghri. Armenia’s plant is expected to have an installed capacity of 140 MW. Construction is expected to commence in 2011
• LoriberdHPP.TheengineeringfirmFichtnercompletedafeasibilitystudyofthe Loriberd HPP in 2003-2004, and in 2007 updated the cost estimates. The plant will have an installed capacity of 66 MW, and a utilization factor of roughly 12 percent. Construction has not begun on this project.
• ShnokhHPP.Thisplantisestimatedtohaveinstalledcapacityof75MWandutilization factor is expected to be similar to Loriberd’s.
D.1.4 Other RenewableOther renewable energy generating capacity is growing in Armenia. Recent investments in non-hydro renewable energy include the following:
• Wind. In 2005, the Lori 1 Wind Power Plant began operation in the northern Lori region. The plant, located in Pushkin pass, includes four 690 kW wind turbines, a combined total capacity of about 2.6 MW. The Government-owned wind power plant is operated by HVEN, the state-owned electricity transmission company. Another wind field in the Karakhach region, with 90-125 MW potential, is in the planning stages.
• Geothermal. A 25 MW geothermal power plant is planned for Jermaghbyur (Syunik region); also, the World Bank has financed field investigations in Gegharkunik and Syunik regions to assess potential for other geothermal sites.
• Biogas. Gas collection wells are being installed at the Nubarashen landfill in Yerevan to collect natural gas released from solid waste breakdown. Shimizu Engineering, a Japanese firm, is installing a 1.4 MW generation unit that will use the gas to produce electricity.
CHARGED DECISIONS: DIFFICULT CHOICES IN ARMENIA’S ENERGY SECTOR 53
D.2 Transmission The High Voltage Electricity Network CJSC (HVEN) owns the transmission network in Armenia, 36 and is responsible for maintaining infrastructure, extending, and developing the transmission network. Armenia’s high-voltage system infrastructure consists of the following:
• 164kmof330kVline,1substation
• 1,323kmof220kVline,14substations
• 3,169kmof110kVline,119substations.
Over the past ten years, HVEN has undertaken significant transmission system rehabilita-tion works with help from development partners. A €14.1 million loan from KfW was used to overhaul transformer stations in Kamo, Vanadzor and Alaverdi. During 1999-2004, the Electricity Transmission and Distribution Project, financed by the World Bank, provided US$19.75milliontorehabilitateeighttransmissionsubstations.
D.3 Power system operator and dispatch centerPower System Operator CJSC, owned by the Ministry of Energy and Natural Resources, is responsible for operation and dispatch of the high voltage network. A recently installed control and data automation system monitors grid performance and controls electricity dispatch.
D.4 Settlement centerThe Ministry of Energy and Natural Resources owns the Settlement Center CJSC, found-ed in October 2002, and responsible for commercial settlements between power produc-ers and purchasers.
D.5 Distribution Electricity Networks of Armenia (ENA), a subsidiary of RAO-UES, owns and operates Ar-menia’s distribution system. ENA owns the low-voltage distribution infrastructure and 110 kV high-voltage transmission components. The distribution system infrastructure consists of the following:
• 2,675kmof35kVlines,278substations
• 9,740kmoverheadand4,955kmcableof6(10)kVlines,13,570kmover-head and 2,160 km cable of 0.4 kV lines
36 The transmission network infrastructure includes 330 kV and 220 kV lines and substations. HVEN transferred its 100 kV lines and substations to the distribution system operator, ENA, when transmission and distribution were unbundled during sector reforms.
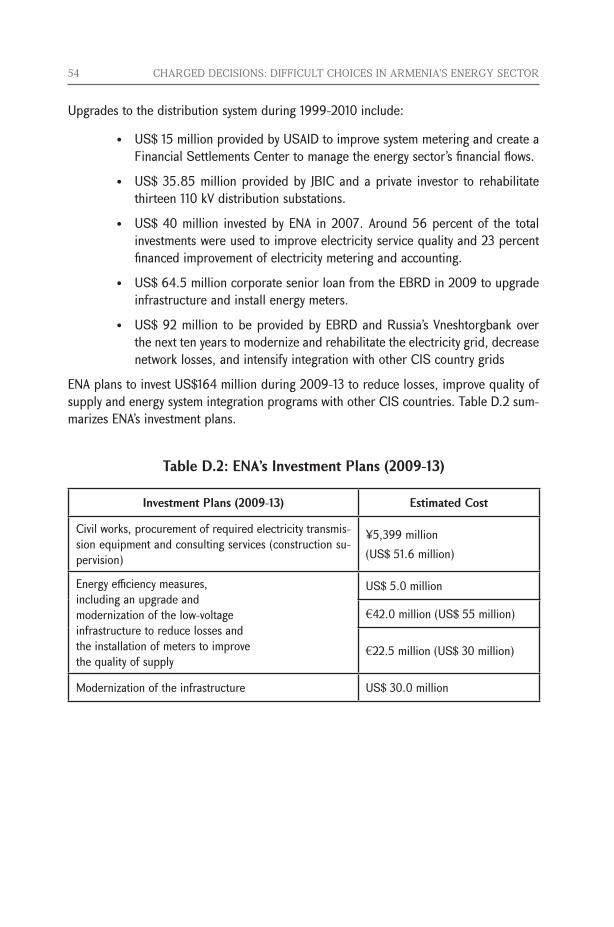
54 CHARGED DECISIONS: DIFFICULT CHOICES IN ARMENIA’S ENERGY SECTOR
Upgrades to the distribution system during 1999-2010 include:
• US$15millionprovidedbyUSAIDtoimprovesystemmeteringandcreateaFinancial Settlements Center to manage the energy sector’s financial flows.
• US$35.85millionprovidedby JBICandaprivate investor torehabilitatethirteen 110 kV distribution substations.
• US$40million investedbyENA in2007.Around56percentof the totalinvestments were used to improve electricity service quality and 23 percent financed improvement of electricity metering and accounting.
• US$64.5millioncorporateseniorloanfromtheEBRDin2009toupgradeinfrastructure and install energy meters.
• US$92milliontobeprovidedbyEBRDandRussia’sVneshtorgbankoverthe next ten years to modernize and rehabilitate the electricity grid, decrease network losses, and intensify integration with other CIS country grids
ENAplanstoinvestUS$164millionduring2009-13toreducelosses,improvequalityofsupply and energy system integration programs with other CIS countries. Table D.2 sum-marizes ENA’s investment plans.
Table D.2: ENA’s Investment Plans (2009-13)
Investment Plans (2009-13) Estimated Cost
Civil works, procurement of required electricity transmis-sion equipment and consulting services (construction su-pervision)
¥5,399 million (US$51.6million)
Energy efficiency measures,including an upgrade andmodernization of the low-voltageinfrastructure to reduce losses andthe installation of meters to improvethe quality of supply
US$5.0million
€42.0million(US$55million)
€22.5million(US$30million)
Modernization of the infrastructure US$30.0million
CHARGED DECISIONS: DIFFICULT CHOICES IN ARMENIA’S ENERGY SECTOR 55
D.6 Regional interconnectionsArmenia has installed interconnections with all neighboring countries, but so far only Georgia and Iran lines are operational. The following system components are in opera-tion:
• 65kmofHVL-220kVline(Armenia-Georgia)
• 35.8kmofHVL-110kVline(Armenia-Georgia)
• 19kmofHVL-110kVline(Armenia-Georgia)
• 78.8kmofHVL-220kVline(Armenia-Iran)
There are two additional interconnection improvement projects in pipeline:
• A400kVsingle-circuitlinewithGeorgia;constructiontobeginin2012.
• A300kmArmenia-Iran400kVdouble-circuitline.Constructiontobeginin 2011.
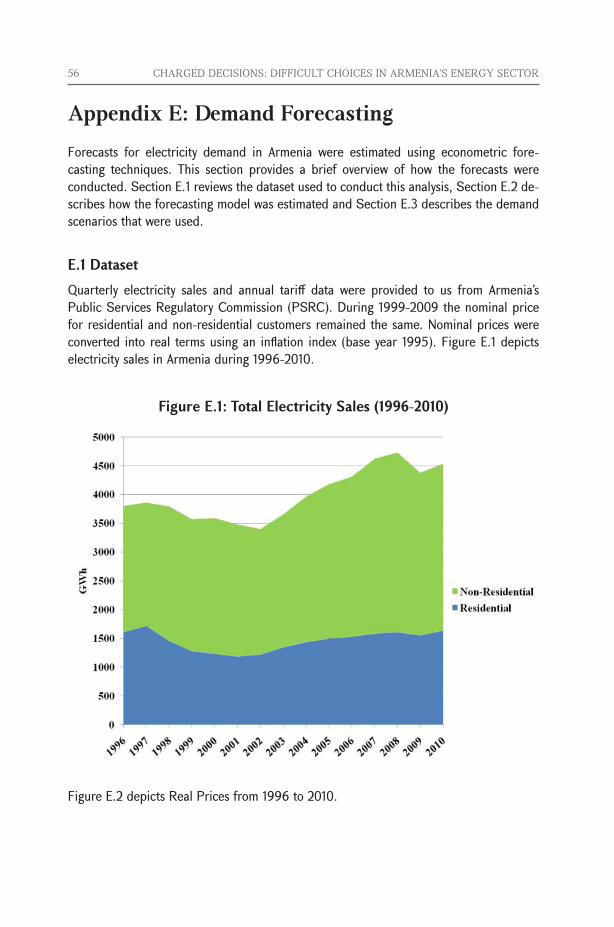
56 CHARGED DECISIONS: DIFFICULT CHOICES IN ARMENIA’S ENERGY SECTOR
Appendix E: Demand ForecastingForecasts for electricity demand in Armenia were estimated using econometric fore-casting techniques. This section provides a brief overview of how the forecasts were conducted. Section E.1 reviews the dataset used to conduct this analysis, Section E.2 de-scribes how the forecasting model was estimated and Section E.3 describes the demand scenarios that were used.
E.1 DatasetQuarterly electricity sales and annual tariff data were provided to us from Armenia’s Public Services Regulatory Commission (PSRC). During 1999-2009 the nominal price for residential and non-residential customers remained the same. Nominal prices were converted into real terms using an inflation index (base year 1995). Figure E.1 depicts electricity sales in Armenia during 1996-2010.
Figure E.1: Total Electricity Sales (1996-2010)
Figure E.2 depicts Real Prices from 1996 to 2010.
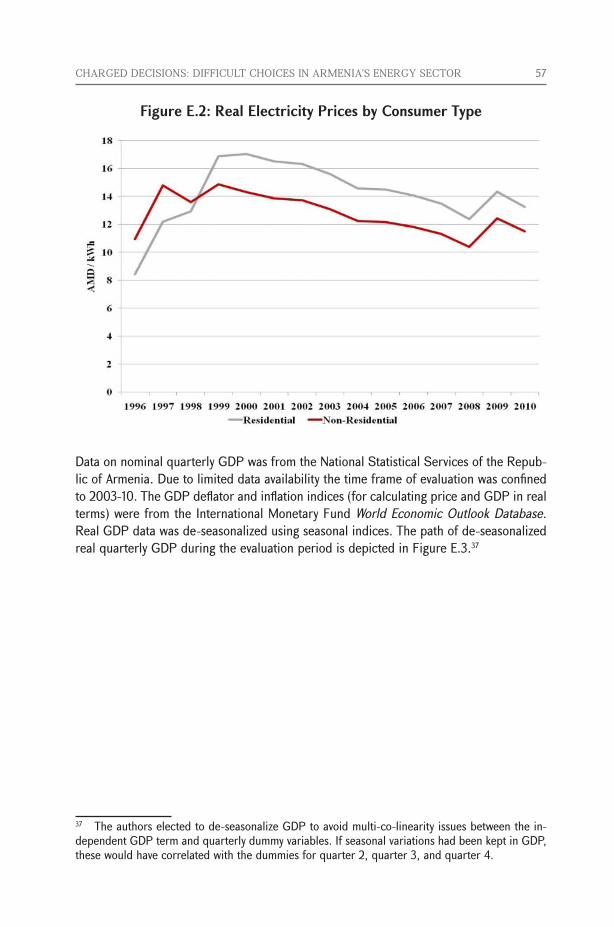
CHARGED DECISIONS: DIFFICULT CHOICES IN ARMENIA’S ENERGY SECTOR 57
Figure E.2: Real Electricity Prices by Consumer Type
Data on nominal quarterly GDP was from the National Statistical Services of the Repub-lic of Armenia. Due to limited data availability the time frame of evaluation was confined to 2003-10. The GDP deflator and inflation indices (for calculating price and GDP in real terms) were from the International Monetary Fund World Economic Outlook Database. Real GDP data was de-seasonalized using seasonal indices. The path of de-seasonalized real quarterly GDP during the evaluation period is depicted in Figure E.3.37
37 The authors elected to de-seasonalize GDP to avoid multi-co-linearity issues between the in-dependent GDP term and quarterly dummy variables. If seasonal variations had been kept in GDP, these would have correlated with the dummies for quarter 2, quarter 3, and quarter 4.
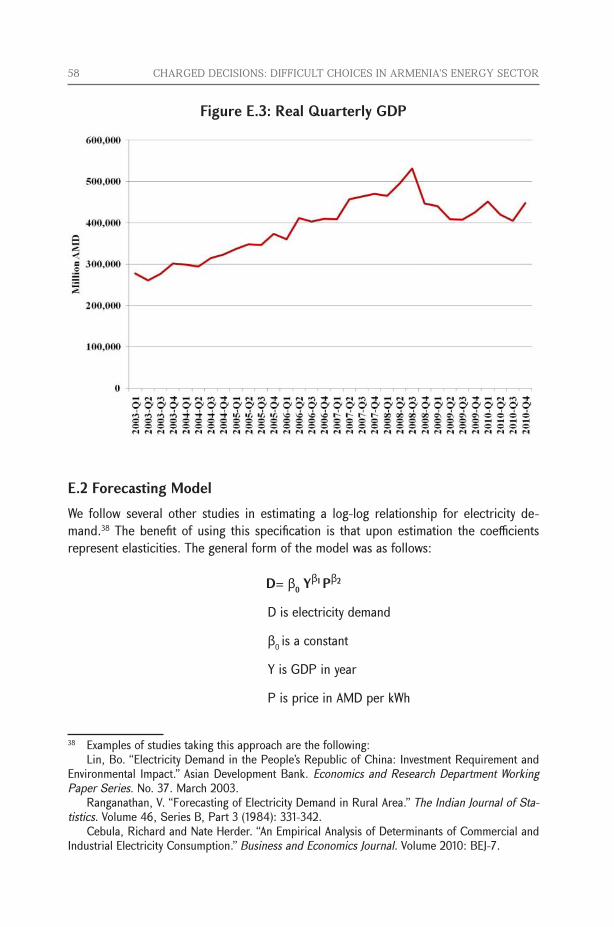
58 CHARGED DECISIONS: DIFFICULT CHOICES IN ARMENIA’S ENERGY SECTOR
Figure E.3: Real Quarterly GDP
E.2 Forecasting ModelWe follow several other studies in estimating a log-log relationship for electricity de-mand.38 The benefit of using this specification is that upon estimation the coefficients represent elasticities. The general form of the model was as follows:
D= β0 Yβ1 Pβ2
D is electricity demand
β0 is a constant
Y is GDP in year
P is price in AMD per kWh
38 Examples of studies taking this approach are the following: Lin, Bo. “Electricity Demand in the People’s Republic of China: Investment Requirement and Environmental Impact.” Asian Development Bank. Economics and Research Department Working Paper Series. No. 37. March 2003. Ranganathan, V. “Forecasting of Electricity Demand in Rural Area.” The Indian Journal of Sta-tistics. Volume 46, Series B, Part 3 (1984): 331-342. Cebula, Richard and Nate Herder. “An Empirical Analysis of Determinants of Commercial and Industrial Electricity Consumption.” Business and Economics Journal. Volume 2010: BEJ-7.
CHARGED DECISIONS: DIFFICULT CHOICES IN ARMENIA’S ENERGY SECTOR 59
β1 is income elasticity of demand
β2 is price elasticity of demand
After logarithmic transformation, the functional form of our model was:
LnD = Lnβ0+β1LnY+β2LnP
In its general form the model cannot be estimated using the ordinary least squares method because it is non-linear. Logarithmic transformation makes the model linear and allows us to conduct simple regression.
Sections E.2.1 to E.2.3 discuss how we selected the exact model specifications.
E.2.1 Model SpecificationWe estimated separate models for both residential and non-residential categories. The benefit of estimating two models is that we could capture how each customer group re-sponds to changes differently. This design provided forecasts that better represent how different customers respond to changes in price and income over time.
For each model we tested different model specifications using a combination of alterna-tive explanatory variables as well as inclusion of a lagged demand term.39 Dummy vari-ables for each quarter were also included in order to capture the seasonal changes in electricity demand.40
The preferred models were selected based on which performed best out-of-sample. Each model was fit to data for the 24 quarters from 2003 to 2008 and the results were used to forecast the known 2009 and 2010 quarterly demand levels. We evaluated models based on the Root Mean Square Error (RMSE) for the forecast years.41 The model with the low-est RMSE was selected and then re-fit for all available quarters (2003 to 2010). Table E.1 provides an explanation for the terms used in the models described in the sections below.
39 A lag is the use of the dependent variable from the previous period (t-1) as an independent variable. The assumption when this type of variable is included is that demand in one period is affected by the changes in the previous period. The effects from a change in one period can have a carry-over effect. Because the use of a lag model introduces the effects of another time period, these models are considered dynamic.40 We test dummy variables for the second, third, and fourth quarters (Q2, Q3, and Q4). Dummy variables are intercept shifters. The intercept is represented by the constant term in an econometric model. In our model the constant represents the average consumption prior to taking into consid-eration price or income. Including a dummy variable allows testing for systematic differences in average consumption between seasons. 41 Root Mean Square Error (RMSE) is the square root of the average squared errors (each pre-dicted value subtracted by the actual value, squared)
60 CHARGED DECISIONS: DIFFICULT CHOICES IN ARMENIA’S ENERGY SECTOR
Table E.1: Explanation of terms used in econometric model
Term DescriptionY Variable for Gross Domestic Product (GDP) PRES Variable for residential tariffPNON Variable for non-residential tariffQ2 Dummy variable for quarter 2, takes on value of 1 if observation is quarter
2 and 0 if otherwise Q3 Dummy variable for quarter 3, takes on value of 1 if observation is quarter
3 and 0 if otherwiseQ4 Dummy variable for quarter 4, takes on value of 1 if observation is quarter
4 and 0 if otherwiseDRES Variable for residential electricity demandDNON Variable for non-residential electricity demandLn Natural logarithm (logarithm to the base e), used in the equation to show
that each variable takes on a logarithmic transformationβ A beta coefficient represents the model parameter estimates obtained when
conducting regression analysis e The disturbance or error term includes additional independent factors that
are not accounted for in the model. Inclusion of a disturbance terms in the mathematical form of an econometric model is done to reflect that all models are estimates and do not represent a perfect relationship
t The “t” subscript represents the observation time period.
E.2.2 Residential ModelModels of residential demand were tested at both the aggregate and per capita level. For each of these models we conducted specification tests on whether a lagged term should be included.
The aggregate model without a lagged demand term performed best. For this model the coefficient on price was found to be statistically insignificant. We estimated an alternative model without price and used an F-test to compare the fit of the two models. The model without price as an independent variable performed best in this test.
As a result, we selected a residential model without price as follows:
Ln DRESt = Ln β0+β1Ln Yt+β2Q2+β3Q3+β4Q4+et
Overall the model explains 91.6 percent of the total variation in residential demand for the period 2003 to 2010. GDP and seasonal dummy variables were found to be statisti-cally significant. The resulting income elasticity is 0.31. Table E.2: below shows the out-come of the estimated residential model.
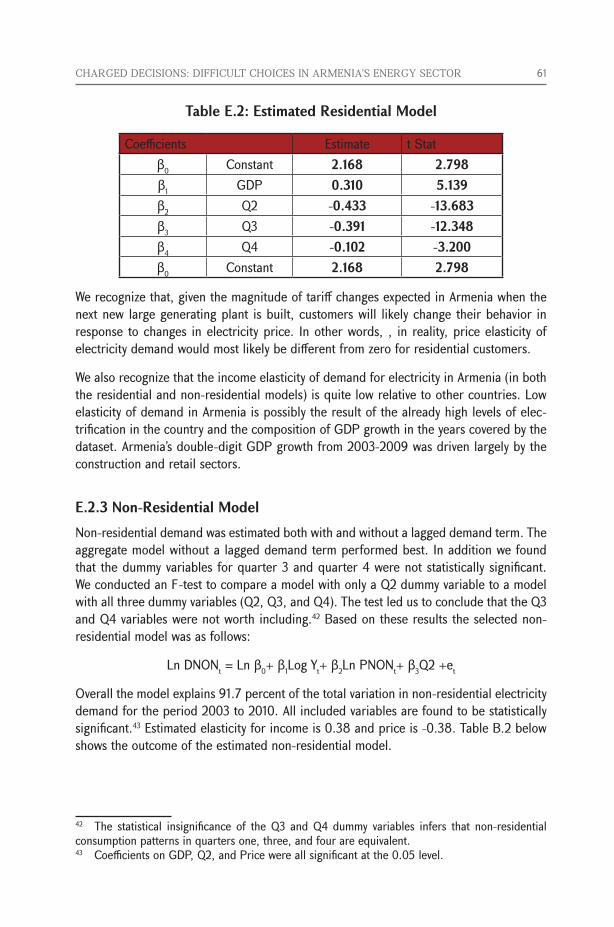
CHARGED DECISIONS: DIFFICULT CHOICES IN ARMENIA’S ENERGY SECTOR 61
Table E.2: Estimated Residential Model
Coefficients Estimate t Statβ0 Constant 2.168 2.798β1 GDP 0.310 5.139β2 Q2 -0.433 -13.683β3 Q3 -0.391 -12.348β4 Q4 -0.102 -3.200β0 Constant 2.168 2.798
We recognize that, given the magnitude of tariff changes expected in Armenia when the next new large generating plant is built, customers will likely change their behavior in response to changes in electricity price. In other words, , in reality, price elasticity of electricity demand would most likely be different from zero for residential customers.
We also recognize that the income elasticity of demand for electricity in Armenia (in both the residential and non-residential models) is quite low relative to other countries. Low elasticity of demand in Armenia is possibly the result of the already high levels of elec-trification in the country and the composition of GDP growth in the years covered by the dataset. Armenia’s double-digit GDP growth from 2003-2009 was driven largely by the construction and retail sectors.
E.2.3 Non-Residential Model Non-residential demand was estimated both with and without a lagged demand term. The aggregate model without a lagged demand term performed best. In addition we found that the dummy variables for quarter 3 and quarter 4 were not statistically significant. We conducted an F-test to compare a model with only a Q2 dummy variable to a model with all three dummy variables (Q2, Q3, and Q4). The test led us to conclude that the Q3 and Q4 variables were not worth including.42 Based on these results the selected non-residential model was as follows:
Ln DNONt = Ln β0+β1Log Yt+β2Ln PNONt+β3Q2+et
Overall the model explains 91.7 percent of the total variation in non-residential electricity demand for the period 2003 to 2010. All included variables are found to be statistically significant.43 Estimated elasticity for income is 0.38 and price is -0.38. Table B.2 below shows the outcome of the estimated non-residential model.
42 The statistical insignificance of the Q3 and Q4 dummy variables infers that non-residential consumption patterns in quarters one, three, and four are equivalent. 43 Coefficients on GDP, Q2, and Price were all significant at the 0.05 level.
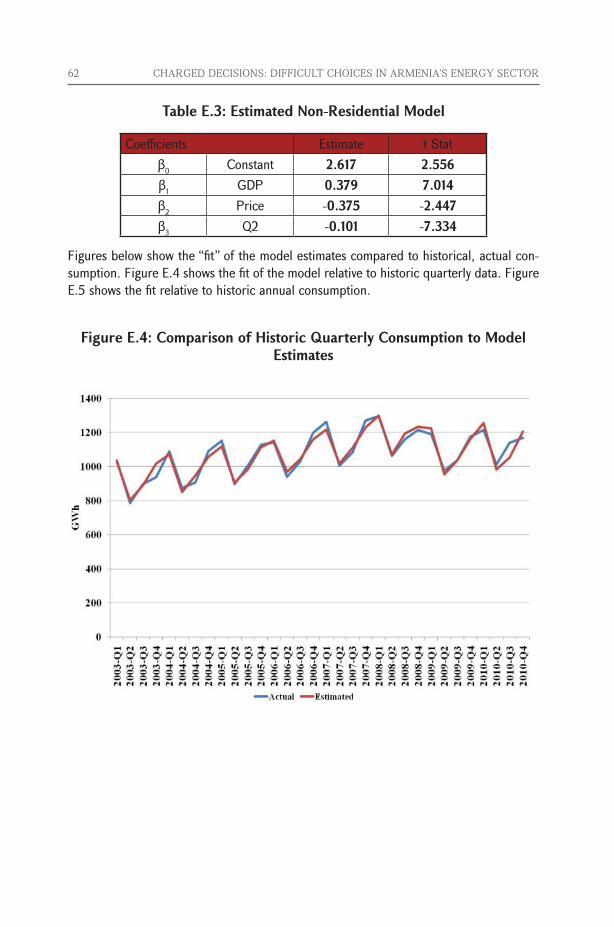
62 CHARGED DECISIONS: DIFFICULT CHOICES IN ARMENIA’S ENERGY SECTOR
Table E.3: Estimated Non-Residential Model
Coefficients Estimate t Statβ0 Constant 2.617 2.556β1 GDP 0.379 7.014β2 Price -0.375 -2.447β3 Q2 -0.101 -7.334
Figures below show the “fit” of the model estimates compared to historical, actual con-sumption. Figure E.4 shows the fit of the model relative to historic quarterly data. Figure E.5 shows the fit relative to historic annual consumption.
Figure E.4: Comparison of Historic Quarterly Consumption to Model Estimates
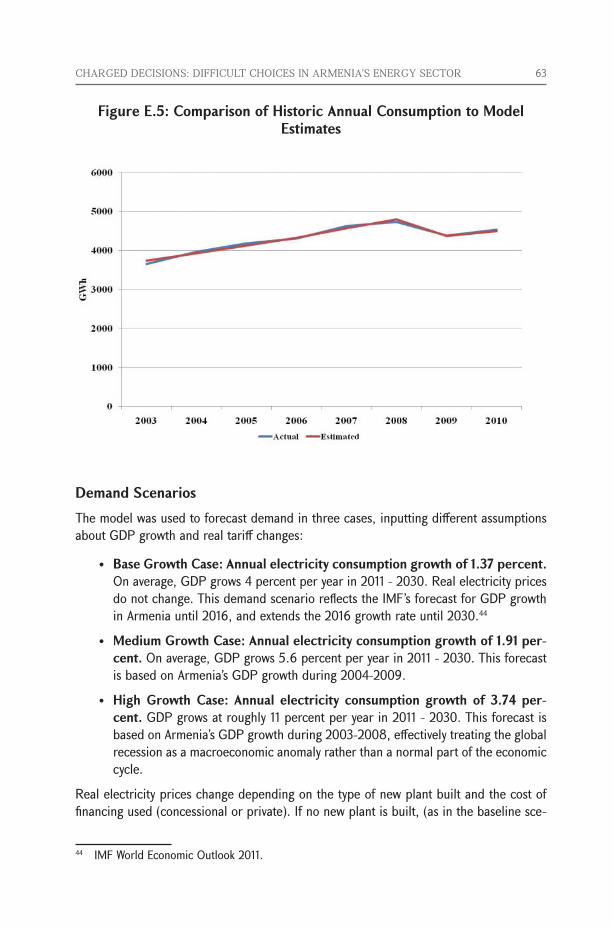
CHARGED DECISIONS: DIFFICULT CHOICES IN ARMENIA’S ENERGY SECTOR 63
Figure E.5: Comparison of Historic Annual Consumption to Model Estimates
Demand ScenariosThe model was used to forecast demand in three cases, inputting different assumptions about GDP growth and real tariff changes:
• Base Growth Case: Annual electricity consumption growth of 1.37 percent. On average, GDP grows 4 percent per year in 2011 - 2030. Real electricity prices do not change. This demand scenario reflects the IMF’s forecast for GDP growth in Armenia until 2016, and extends the 2016 growth rate until 2030.44
• Medium Growth Case: Annual electricity consumption growth of 1.91 per-cent. On average, GDP grows 5.6 percent per year in 2011 - 2030. This forecast is based on Armenia’s GDP growth during 2004-2009.
• High Growth Case: Annual electricity consumption growth of 3.74 per-cent. GDP grows at roughly 11 percent per year in 2011 - 2030. This forecast is based on Armenia’s GDP growth during 2003-2008, effectively treating the global recession as a macroeconomic anomaly rather than a normal part of the economic cycle.
Real electricity prices change depending on the type of new plant built and the cost of financing used (concessional or private). If no new plant is built, (as in the baseline sce-
44 IMF World Economic Outlook 2011.

64 CHARGED DECISIONS: DIFFICULT CHOICES IN ARMENIA’S ENERGY SECTOR
narios in Section 3.1), real electricity prices are assumed to remain constant. Appendix F describes the methodology used in modeling supply options.
Annual demand (from the econometrics forecast) was shaped to an historic (2009) hourly load curve. Thus, the load curve shape does not change between 2009 and 2029 - peak demand is assumed to grow at the same rate as electricity consumption.
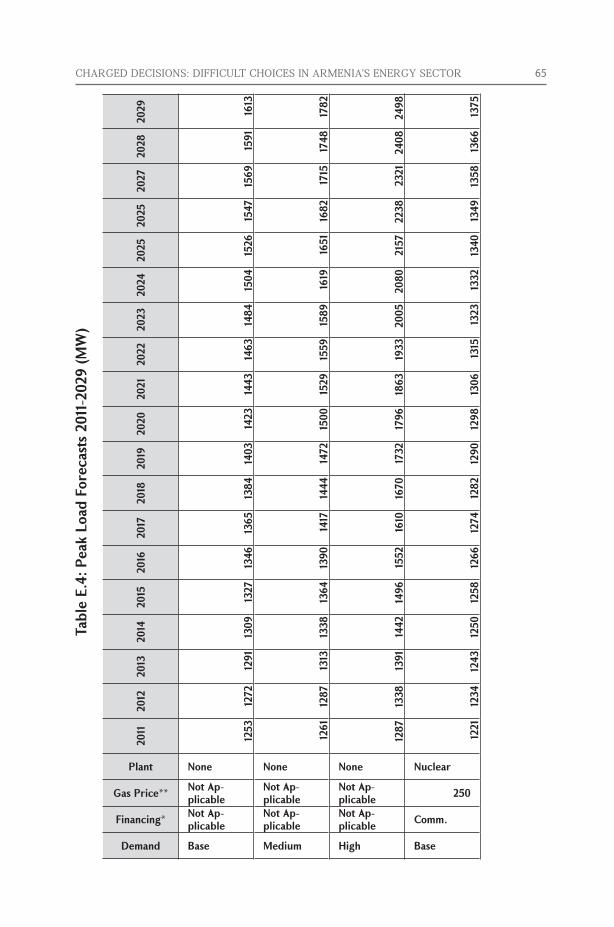
CHARGED DECISIONS: DIFFICULT CHOICES IN ARMENIA’S ENERGY SECTOR 65Ta
ble
E.4:
Pea
k Lo
ad F
orec
asts
201
1-20
29 (M
W)
Demand
Financing*
Gas Price**
Plant
2011
2012
2013
2014
2015
2016
2017
2018
2019
2020
2021
2022
2023
2024
2025
2025
2027
2028
2029
Base
Not Ap-plicable
Not Ap-plicable
None
1253
1272
1291
1309
1327
1346
1365
1384
1403
1423
1443
1463
1484
1504
1526
1547
1569
1591
1613
Medium
Not Ap-plicable
Not Ap-plicable
None
1261
1287
1313
1338
1364
1390
1417
1444
1472
1500
1529
1559
1589
1619
1651
1682
1715
1748
1782
High
Not Ap-plicable
Not Ap-plicable
None
1287
1338
1391
1442
1496
1552
1610
1670
1732
1796
1863
1933
2005
2080
2157
2238
2321
2408
2498
Base
Comm.
250
Nuclear
1221
1234
1243
1250
1258
1266
1274
1282
1290
1298
1306
1315
1323
1332
1340
1349
1358
1366
1375
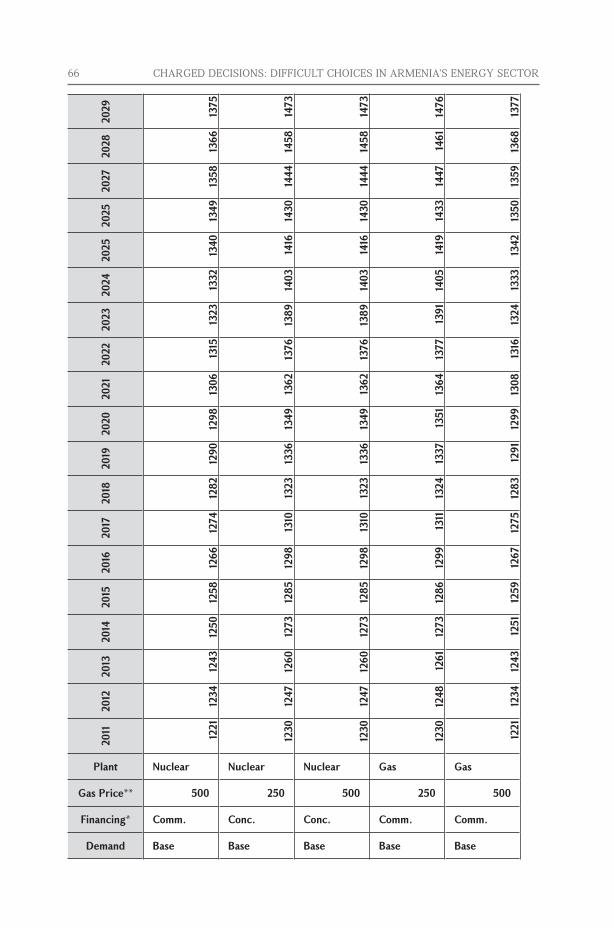
66 CHARGED DECISIONS: DIFFICULT CHOICES IN ARMENIA’S ENERGY SECTOR
Demand
Financing*
Gas Price**
Plant
2011
2012
2013
2014
2015
2016
2017
2018
2019
2020
2021
2022
2023
2024
2025
2025
2027
2028
2029
Base
Comm.
500
Nuclear
1221
1234
1243
1250
1258
1266
1274
1282
1290
1298
1306
1315
1323
1332
1340
1349
1358
1366
1375
Base
Conc.
250
Nuclear
1230
1247
1260
1273
1285
1298
1310
1323
1336
1349
1362
1376
1389
1403
1416
1430
1444
1458
1473
Base
Conc.
500
Nuclear
1230
1247
1260
1273
1285
1298
1310
1323
1336
1349
1362
1376
1389
1403
1416
1430
1444
1458
1473
Base
Comm.
250
Gas
1230
1248
1261
1273
1286
1299
1311
1324
1337
1351
1364
1377
1391
1405
1419
1433
1447
1461
1476
Base
Comm.
500
Gas
1221
1234
1243
1251
1259
1267
1275
1283
1291
1299
1308
1316
1324
1333
1342
1350
1359
1368
1377
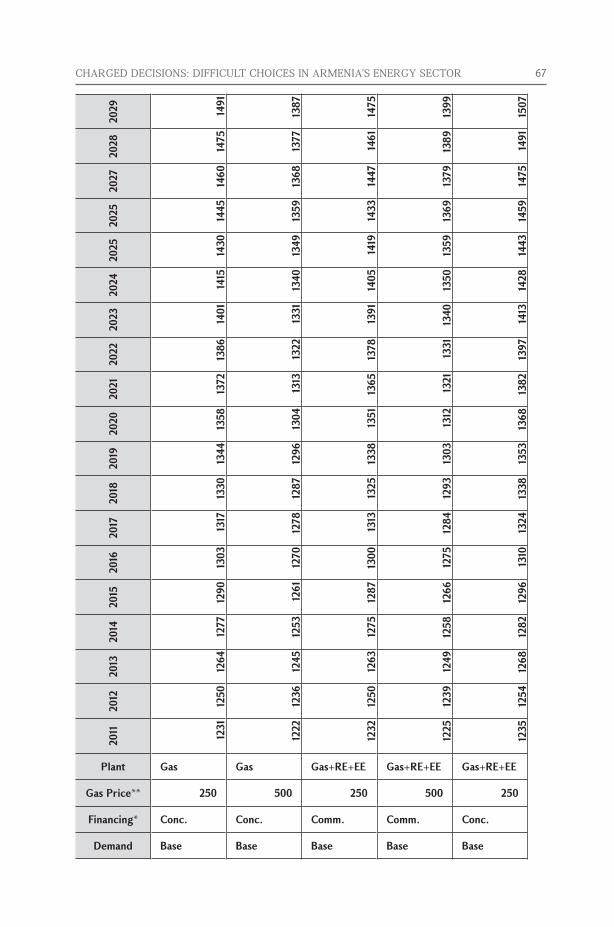
CHARGED DECISIONS: DIFFICULT CHOICES IN ARMENIA’S ENERGY SECTOR 67
Demand
Financing*
Gas Price**
Plant
2011
2012
2013
2014
2015
2016
2017
2018
2019
2020
2021
2022
2023
2024
2025
2025
2027
2028
2029
Base
Conc.
250
Gas
1231
1250
1264
1277
1290
1303
1317
1330
1344
1358
1372
1386
1401
1415
1430
1445
1460
1475
1491
Base
Conc.
500
Gas
1222
1236
1245
1253
1261
1270
1278
1287
1296
1304
1313
1322
1331
1340
1349
1359
1368
1377
1387
Base
Comm.
250
Gas+RE+EE
1232
1250
1263
1275
1287
1300
1313
1325
1338
1351
1365
1378
1391
1405
1419
1433
1447
1461
1475
Base
Comm.
500
Gas+RE+EE
1225
1239
1249
1258
1266
1275
1284
1293
1303
1312
1321
1331
1340
1350
1359
1369
1379
1389
1399
Base
Conc.
250
Gas+RE+EE
1235
1254
1268
1282
1296
1310
1324
1338
1353
1368
1382
1397
1413
1428
1443
1459
1475
1491
1507
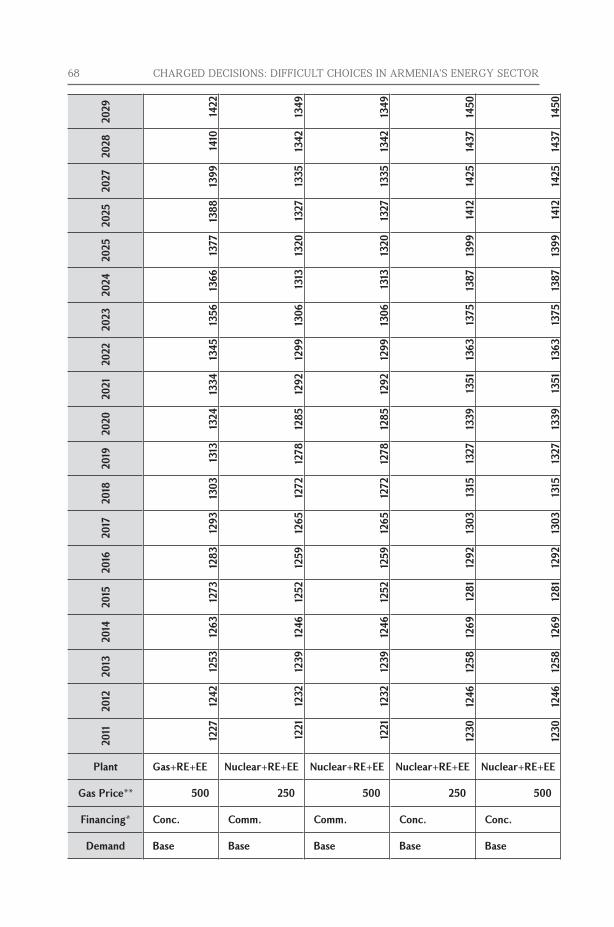
68 CHARGED DECISIONS: DIFFICULT CHOICES IN ARMENIA’S ENERGY SECTOR
Demand
Financing*
Gas Price**
Plant
2011
2012
2013
2014
2015
2016
2017
2018
2019
2020
2021
2022
2023
2024
2025
2025
2027
2028
2029
Base
Conc.
500
Gas+RE+EE
1227
1242
1253
1263
1273
1283
1293
1303
1313
1324
1334
1345
1356
1366
1377
1388
1399
1410
1422
Base
Comm.
250
Nuclear+RE+EE
1221
1232
1239
1246
1252
1259
1265
1272
1278
1285
1292
1299
1306
1313
1320
1327
1335
1342
1349
Base
Comm.
500
Nuclear+RE+EE
1221
1232
1239
1246
1252
1259
1265
1272
1278
1285
1292
1299
1306
1313
1320
1327
1335
1342
1349
Base
Conc.
250
Nuclear+RE+EE
1230
1246
1258
1269
1281
1292
1303
1315
1327
1339
1351
1363
1375
1387
1399
1412
1425
1437
1450
Base
Conc.
500
Nuclear+RE+EE
1230
1246
1258
1269
1281
1292
1303
1315
1327
1339
1351
1363
1375
1387
1399
1412
1425
1437
1450
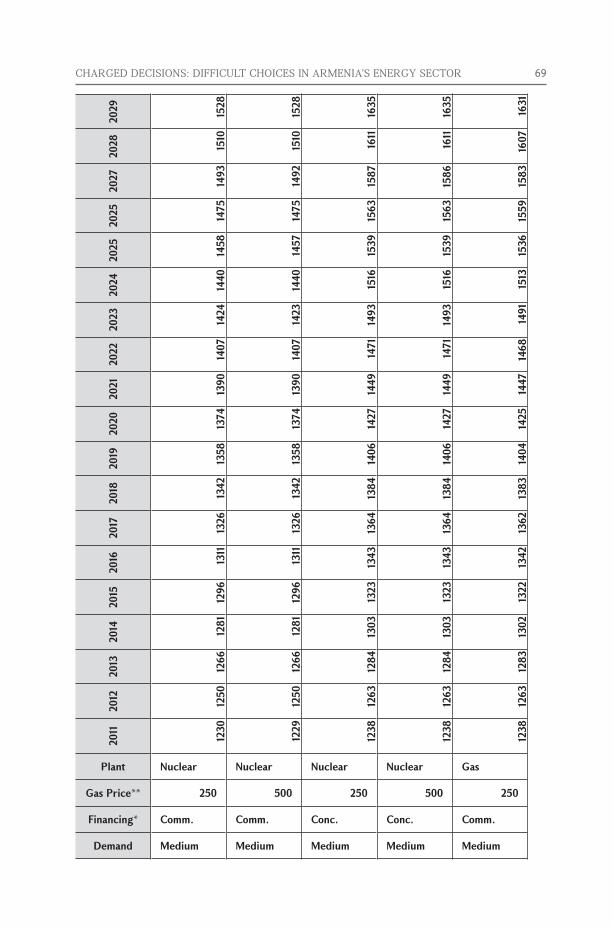
CHARGED DECISIONS: DIFFICULT CHOICES IN ARMENIA’S ENERGY SECTOR 69
Demand
Financing*
Gas Price**
Plant
2011
2012
2013
2014
2015
2016
2017
2018
2019
2020
2021
2022
2023
2024
2025
2025
2027
2028
2029
Medium
Comm.
250
Nuclear
1230
1250
1266
1281
1296
1311
1326
1342
1358
1374
1390
1407
1424
1440
1458
1475
1493
1510
1528
Medium
Comm.
500
Nuclear
1229
1250
1266
1281
1296
1311
1326
1342
1358
1374
1390
1407
1423
1440
1457
1475
1492
1510
1528
Medium
Conc.
250
Nuclear
1238
1263
1284
1303
1323
1343
1364
1384
1406
1427
1449
1471
1493
1516
1539
1563
1587
1611
1635
Medium
Conc.
500
Nuclear
1238
1263
1284
1303
1323
1343
1364
1384
1406
1427
1449
1471
1493
1516
1539
1563
1586
1611
1635
Medium
Comm.
250
Gas
1238
1263
1283
1302
1322
1342
1362
1383
1404
1425
1447
1468
1491
1513
1536
1559
1583
1607
1631

70 CHARGED DECISIONS: DIFFICULT CHOICES IN ARMENIA’S ENERGY SECTOR
Demand
Financing*
Gas Price**
Plant
2011
2012
2013
2014
2015
2016
2017
2018
2019
2020
2021
2022
2023
2024
2025
2025
2027
2028
2029
Medium
Comm.
500
Gas
1229
1249
1265
1279
1294
1309
1324
1339
1355
1370
1386
1402
1419
1435
1452
1469
1486
1504
1521
Medium
Conc.
250
Gas
1239
1264
1285
1305
1326
1347
1368
1389
1411
1433
1455
1478
1501
1524
1548
1572
1597
1622
1647
Medium
Conc.
500
Gas
1230
1250
1266
1281
1296
1312
1327
1343
1359
1376
1392
1409
1425
1443
1460
1477
1495
1513
1531
Medium
Comm.
250
Gas+RE+EE
1240
1264
1284
1304
1323
1343
1363
1384
1404
1425
1447
1468
1490
1513
1536
1559
1582
1606
1630
Medium
Comm.
500
Gas+RE+EE
1233
1254
1270
1285
1301
1317
1333
1349
1366
1382
1399
1416
1434
1451
1469
1487
1506
1524
1543
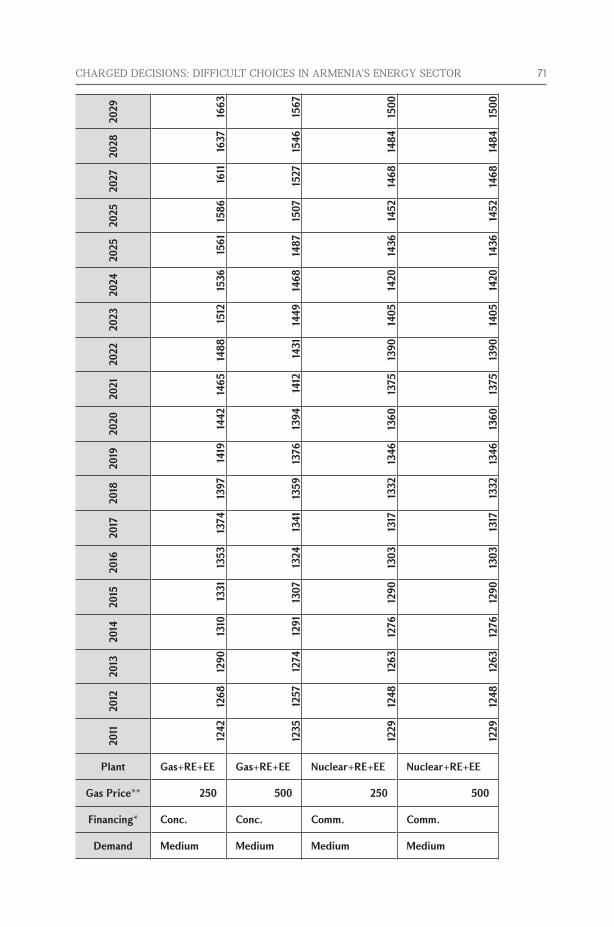
CHARGED DECISIONS: DIFFICULT CHOICES IN ARMENIA’S ENERGY SECTOR 71
Demand
Financing*
Gas Price**
Plant
2011
2012
2013
2014
2015
2016
2017
2018
2019
2020
2021
2022
2023
2024
2025
2025
2027
2028
2029
Medium
Conc.
250
Gas+RE+EE
1242
1268
1290
1310
1331
1353
1374
1397
1419
1442
1465
1488
1512
1536
1561
1586
1611
1637
1663
Medium
Conc.
500
Gas+RE+EE
1235
1257
1274
1291
1307
1324
1341
1359
1376
1394
1412
1431
1449
1468
1487
1507
1527
1546
1567
Medium
Comm.
250
Nuclear+RE+EE
1229
1248
1263
1276
1290
1303
1317
1332
1346
1360
1375
1390
1405
1420
1436
1452
1468
1484
1500
Medium
Comm.
500
Nuclear+RE+EE
1229
1248
1263
1276
1290
1303
1317
1332
1346
1360
1375
1390
1405
1420
1436
1452
1468
1484
1500
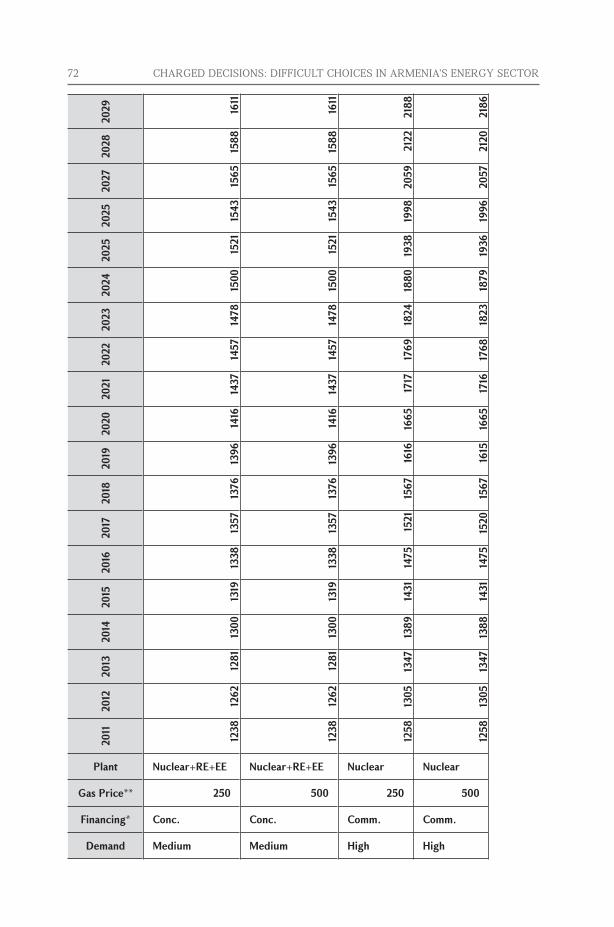
72 CHARGED DECISIONS: DIFFICULT CHOICES IN ARMENIA’S ENERGY SECTOR
Demand
Financing*
Gas Price**
Plant
2011
2012
2013
2014
2015
2016
2017
2018
2019
2020
2021
2022
2023
2024
2025
2025
2027
2028
2029
Medium
Conc.
250
Nuclear+RE+EE
1238
1262
1281
1300
1319
1338
1357
1376
1396
1416
1437
1457
1478
1500
1521
1543
1565
1588
1611
Medium
Conc.
500
Nuclear+RE+EE
1238
1262
1281
1300
1319
1338
1357
1376
1396
1416
1437
1457
1478
1500
1521
1543
1565
1588
1611
High
Comm.
250
Nuclear
1258
1305
1347
1389
1431
1475
1521
1567
1616
1665
1717
1769
1824
1880
1938
1998
2059
2122
2188
High
Comm.
500
Nuclear
1258
1305
1347
1388
1431
1475
1520
1567
1615
1665
1716
1768
1823
1879
1936
1996
2057
2120
2186
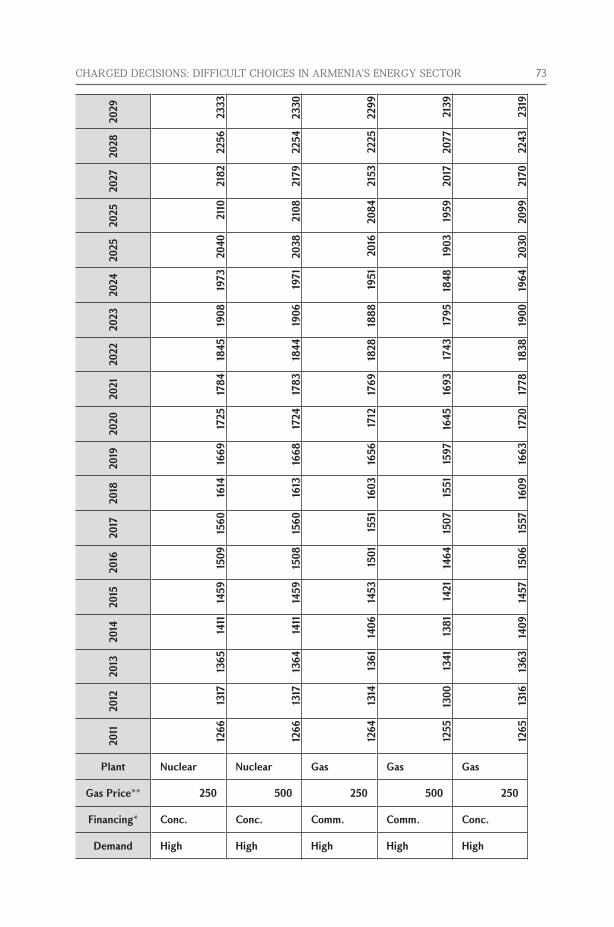
CHARGED DECISIONS: DIFFICULT CHOICES IN ARMENIA’S ENERGY SECTOR 73
Demand
Financing*
Gas Price**
Plant
2011
2012
2013
2014
2015
2016
2017
2018
2019
2020
2021
2022
2023
2024
2025
2025
2027
2028
2029
High
Conc.
250
Nuclear
1266
1317
1365
1411
1459
1509
1560
1614
1669
1725
1784
1845
1908
1973
2040
2110
2182
2256
2333
High
Conc.
500
Nuclear
1266
1317
1364
1411
1459
1508
1560
1613
1668
1724
1783
1844
1906
1971
2038
2108
2179
2254
2330
High
Comm.
250
Gas
1264
1314
1361
1406
1453
1501
1551
1603
1656
1712
1769
1828
1888
1951
2016
2084
2153
2225
2299
High
Comm.
500
Gas
1255
1300
1341
1381
1421
1464
1507
1551
1597
1645
1693
1743
1795
1848
1903
1959
2017
2077
2139
High
Conc.
250
Gas
1265
1316
1363
1409
1457
1506
1557
1609
1663
1720
1778
1838
1900
1964
2030
2099
2170
2243
2319
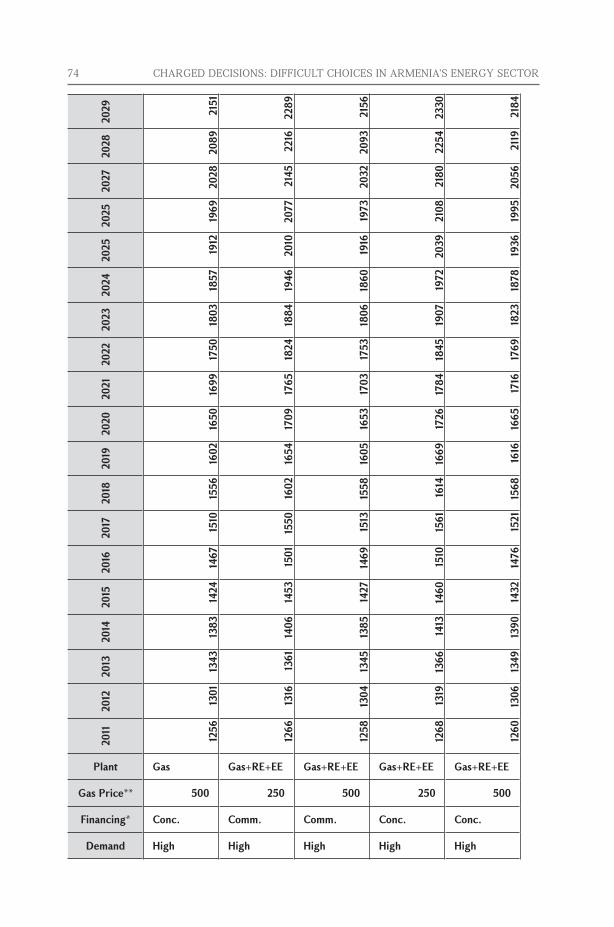
74 CHARGED DECISIONS: DIFFICULT CHOICES IN ARMENIA’S ENERGY SECTOR
Demand
Financing*
Gas Price**
Plant
2011
2012
2013
2014
2015
2016
2017
2018
2019
2020
2021
2022
2023
2024
2025
2025
2027
2028
2029
High
Conc.
500
Gas
1256
1301
1343
1383
1424
1467
1510
1556
1602
1650
1699
1750
1803
1857
1912
1969
2028
2089
2151
High
Comm.
250
Gas+RE+EE
1266
1316
1361
1406
1453
1501
1550
1602
1654
1709
1765
1824
1884
1946
2010
2077
2145
2216
2289
High
Comm.
500
Gas+RE+EE
1258
1304
1345
1385
1427
1469
1513
1558
1605
1653
1703
1753
1806
1860
1916
1973
2032
2093
2156
High
Conc.
250
Gas+RE+EE
1268
1319
1366
1413
1460
1510
1561
1614
1669
1726
1784
1845
1907
1972
2039
2108
2180
2254
2330
High
Conc.
500
Gas+RE+EE
1260
1306
1349
1390
1432
1476
1521
1568
1616
1665
1716
1769
1823
1878
1936
1995
2056
2119
2184
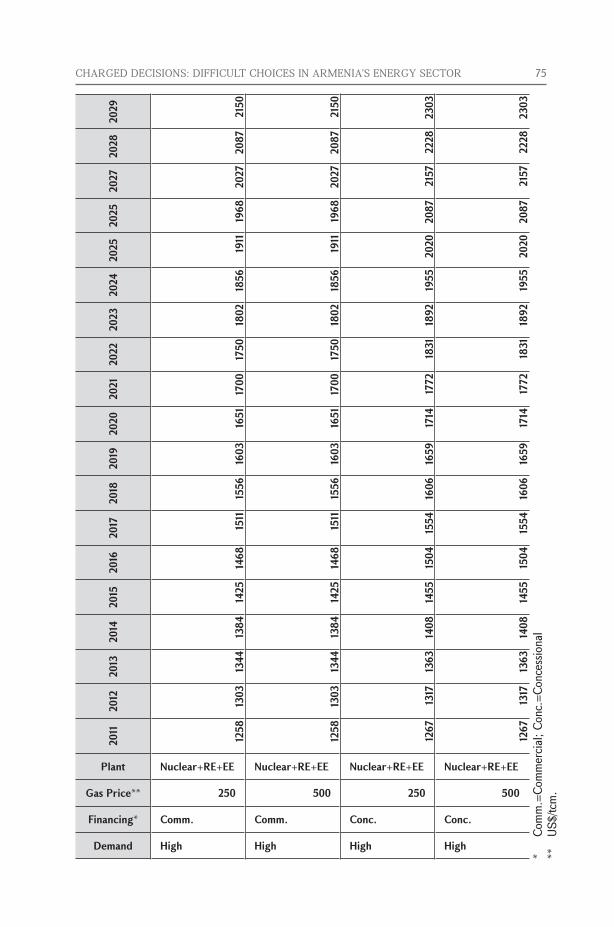
CHARGED DECISIONS: DIFFICULT CHOICES IN ARMENIA’S ENERGY SECTOR 75
Demand
Financing*
Gas Price**
Plant
2011
2012
2013
2014
2015
2016
2017
2018
2019
2020
2021
2022
2023
2024
2025
2025
2027
2028
2029
High
Comm.
250
Nuclear+RE+EE
1258
1303
1344
1384
1425
1468
1511
1556
1603
1651
1700
1750
1802
1856
1911
1968
2027
2087
2150
High
Comm.
500
Nuclear+RE+EE
1258
1303
1344
1384
1425
1468
1511
1556
1603
1651
1700
1750
1802
1856
1911
1968
2027
2087
2150
High
Conc.
250
Nuclear+RE+EE
1267
1317
1363
1408
1455
1504
1554
1606
1659
1714
1772
1831
1892
1955
2020
2087
2157
2228
2303
High
Conc.
500
Nuclear+RE+EE
1267
1317
1363
1408
1455
1504
1554
1606
1659
1714
1772
1831
1892
1955
2020
2087
2157
2228
2303
* C
omm
.=Co
mm
ercia
l; Co
nc.=
Conc
essio
nal
**US
$/tcm
.
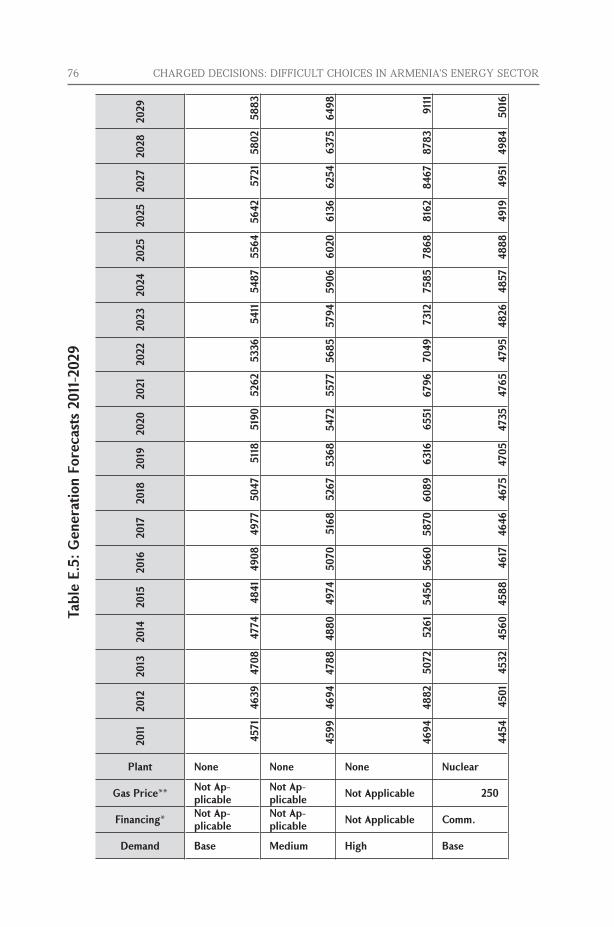
76 CHARGED DECISIONS: DIFFICULT CHOICES IN ARMENIA’S ENERGY SECTORTa
ble
E.5:
Gen
erat
ion
Fore
cast
s 20
11-2
029
Demand
Financing*
Gas Price**
Plant
2011
2012
2013
2014
2015
2016
2017
2018
2019
2020
2021
2022
2023
2024
2025
2025
2027
2028
2029
Base
Not Ap-plicable
Not Ap-plicable
None
4571
4639
4708
4774
4841
4908
4977
5047
5118
5190
5262
5336
5411
5487
5564
5642
5721
5802
5883
Medium
Not Ap-plicable
Not Ap-plicable
None
4599
4694
4788
4880
4974
5070
5168
5267
5368
5472
5577
5685
5794
5906
6020
6136
6254
6375
6498
High
Not Applicable
Not Applicable
None
4694
4882
5072
5261
5456
5660
5870
6089
6316
6551
6796
7049
7312
7585
7868
8162
8467
8783
9111
Base
Comm.
250
Nuclear
4454
4501
4532
4560
4588
4617
4646
4675
4705
4735
4765
4795
4826
4857
4888
4919
4951
4984
5016

CHARGED DECISIONS: DIFFICULT CHOICES IN ARMENIA’S ENERGY SECTOR 77
Demand
Financing*
Gas Price**
Plant
2011
2012
2013
2014
2015
2016
2017
2018
2019
2020
2021
2022
2023
2024
2025
2025
2027
2028
2029
Base
Comm.
500
Nuclear
4454
4501
4532
4560
4588
4617
4646
4675
4705
4735
4765
4795
4826
4857
4888
4919
4951
4983
5016
Base
Conc.
250
Nuclear
4485
4549
4597
4642
4687
4733
4779
4826
4873
4920
4968
5017
5066
5116
5166
5216
5267
5319
5371
Base
Conc.
500
Nuclear
4485
4549
4597
4642
4687
4733
4779
4826
4873
4920
4968
5017
5066
5116
5166
5216
5267
5319
5371
Base
Comm.
250
Gas
4486
4551
4599
4644
4690
4736
4783
4830
4878
4926
4974
5024
5073
5123
5174
5225
5277
5329
5382
Base
Comm.
500
Gas
4454
4502
4533
4562
4590
4619
4649
4678
4708
4738
4769
4799
4830
4862
4893
4925
4957
4990
5023
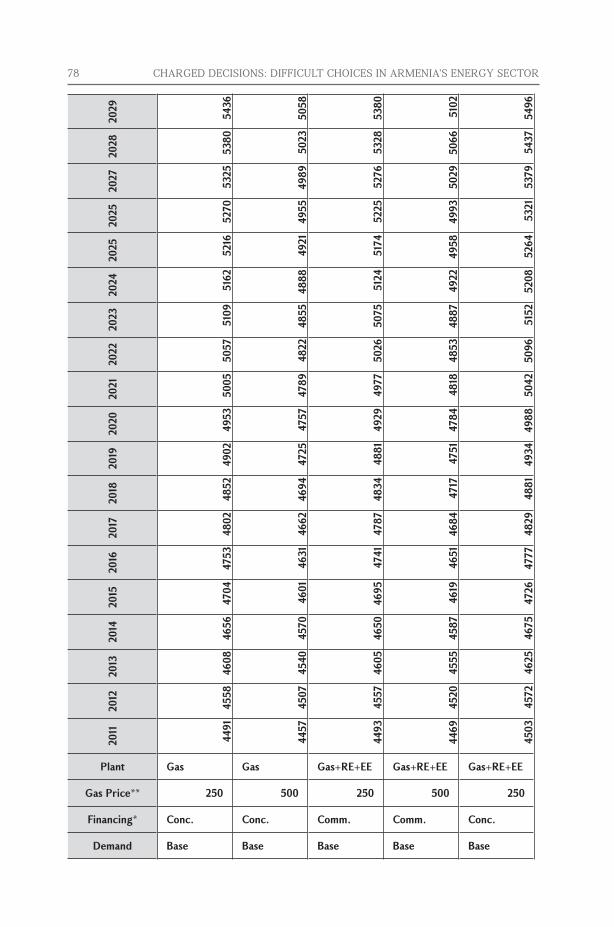
78 CHARGED DECISIONS: DIFFICULT CHOICES IN ARMENIA’S ENERGY SECTOR
Demand
Financing*
Gas Price**
Plant
2011
2012
2013
2014
2015
2016
2017
2018
2019
2020
2021
2022
2023
2024
2025
2025
2027
2028
2029
Base
Conc.
250
Gas
4491
4558
4608
4656
4704
4753
4802
4852
4902
4953
5005
5057
5109
5162
5216
5270
5325
5380
5436
Base
Conc.
500
Gas
4457
4507
4540
4570
4601
4631
4662
4694
4725
4757
4789
4822
4855
4888
4921
4955
4989
5023
5058
Base
Comm.
250
Gas+RE+EE
4493
4557
4605
4650
4695
4741
4787
4834
4881
4929
4977
5026
5075
5124
5174
5225
5276
5328
5380
Base
Comm.
500
Gas+RE+EE
4469
4520
4555
4587
4619
4651
4684
4717
4751
4784
4818
4853
4887
4922
4958
4993
5029
5066
5102
Base
Conc.
250
Gas+RE+EE
4503
4572
4625
4675
4726
4777
4829
4881
4934
4988
5042
5096
5152
5208
5264
5321
5379
5437
5496
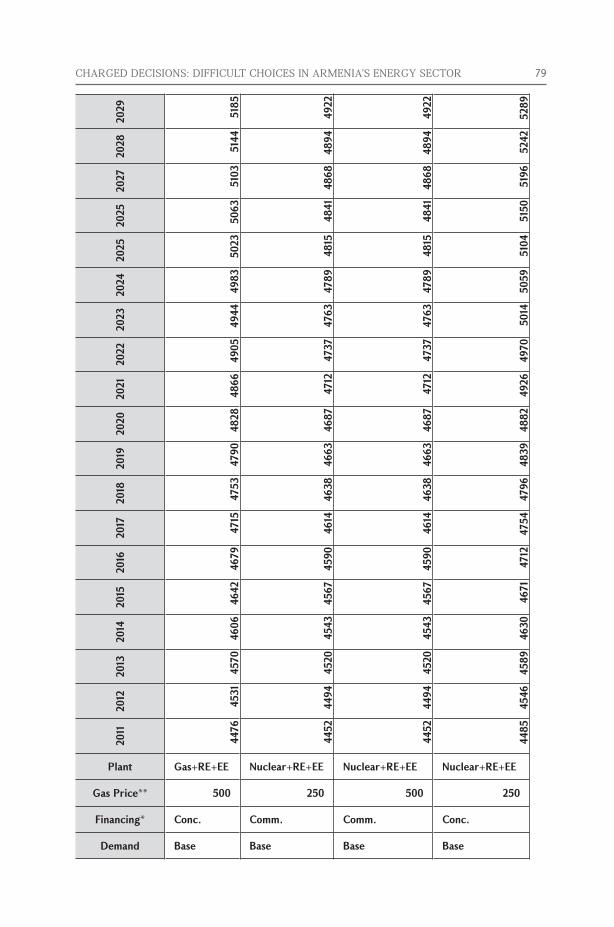
CHARGED DECISIONS: DIFFICULT CHOICES IN ARMENIA’S ENERGY SECTOR 79
Demand
Financing*
Gas Price**
Plant
2011
2012
2013
2014
2015
2016
2017
2018
2019
2020
2021
2022
2023
2024
2025
2025
2027
2028
2029
Base
Conc.
500
Gas+RE+EE
4476
4531
4570
4606
4642
4679
4715
4753
4790
4828
4866
4905
4944
4983
5023
5063
5103
5144
5185
Base
Comm.
250
Nuclear+RE+EE
4452
4494
4520
4543
4567
4590
4614
4638
4663
4687
4712
4737
4763
4789
4815
4841
4868
4894
4922
Base
Comm.
500
Nuclear+RE+EE
4452
4494
4520
4543
4567
4590
4614
4638
4663
4687
4712
4737
4763
4789
4815
4841
4868
4894
4922
Base
Conc.
250
Nuclear+RE+EE
4485
4546
4589
4630
4671
4712
4754
4796
4839
4882
4926
4970
5014
5059
5104
5150
5196
5242
5289
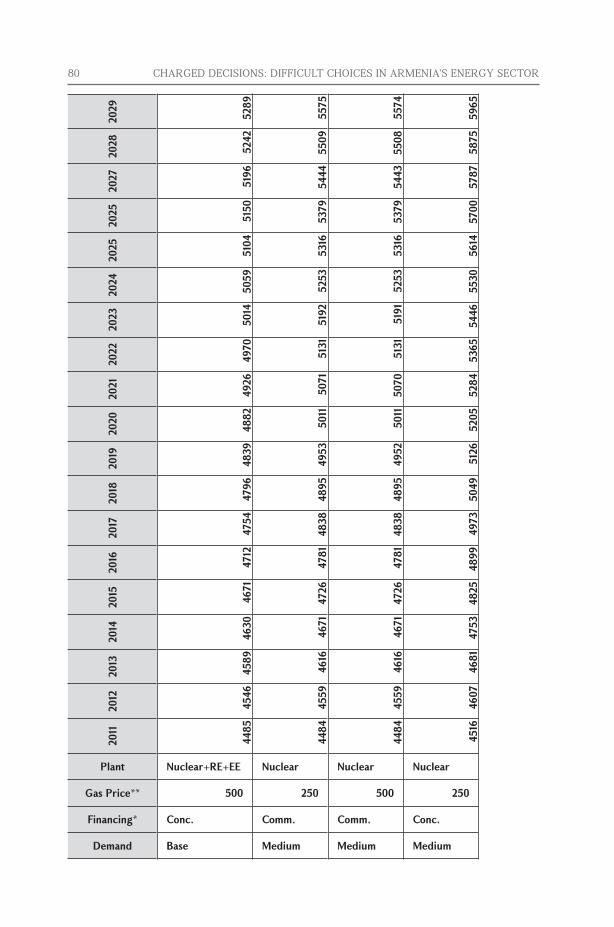
80 CHARGED DECISIONS: DIFFICULT CHOICES IN ARMENIA’S ENERGY SECTOR
Demand
Financing*
Gas Price**
Plant
2011
2012
2013
2014
2015
2016
2017
2018
2019
2020
2021
2022
2023
2024
2025
2025
2027
2028
2029
Base
Conc.
500
Nuclear+RE+EE
4485
4546
4589
4630
4671
4712
4754
4796
4839
4882
4926
4970
5014
5059
5104
5150
5196
5242
5289
Medium
Comm.
250
Nuclear
4484
4559
4616
4671
4726
4781
4838
4895
4953
5011
5071
5131
5192
5253
5316
5379
5444
5509
5575
Medium
Comm.
500
Nuclear
4484
4559
4616
4671
4726
4781
4838
4895
4952
5011
5070
5131
5191
5253
5316
5379
5443
5508
5574
Medium
Conc.
250
Nuclear
4516
4607
4681
4753
4825
4899
4973
5049
5126
5205
5284
5365
5446
5530
5614
5700
5787
5875
5965
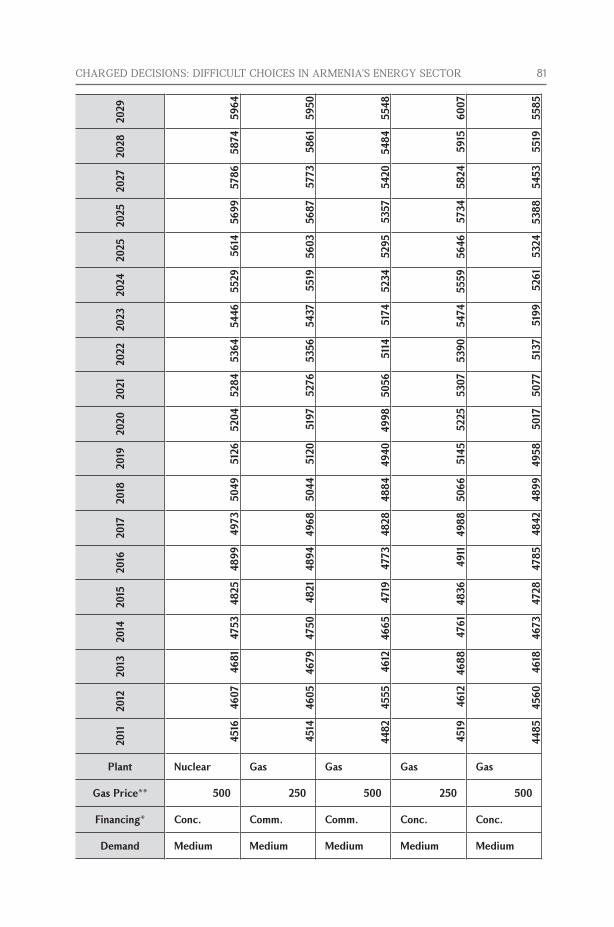
CHARGED DECISIONS: DIFFICULT CHOICES IN ARMENIA’S ENERGY SECTOR 81
Demand
Financing*
Gas Price**
Plant
2011
2012
2013
2014
2015
2016
2017
2018
2019
2020
2021
2022
2023
2024
2025
2025
2027
2028
2029
Medium
Conc.
500
Nuclear
4516
4607
4681
4753
4825
4899
4973
5049
5126
5204
5284
5364
5446
5529
5614
5699
5786
5874
5964
Medium
Comm.
250
Gas
4514
4605
4679
4750
4821
4894
4968
5044
5120
5197
5276
5356
5437
5519
5603
5687
5773
5861
5950
Medium
Comm.
500
Gas
4482
4555
4612
4665
4719
4773
4828
4884
4940
4998
5056
5114
5174
5234
5295
5357
5420
5484
5548
Medium
Conc.
250
Gas
4519
4612
4688
4761
4836
4911
4988
5066
5145
5225
5307
5390
5474
5559
5646
5734
5824
5915
6007
Medium
Conc.
500
Gas
4485
4560
4618
4673
4728
4785
4842
4899
4958
5017
5077
5137
5199
5261
5324
5388
5453
5519
5585
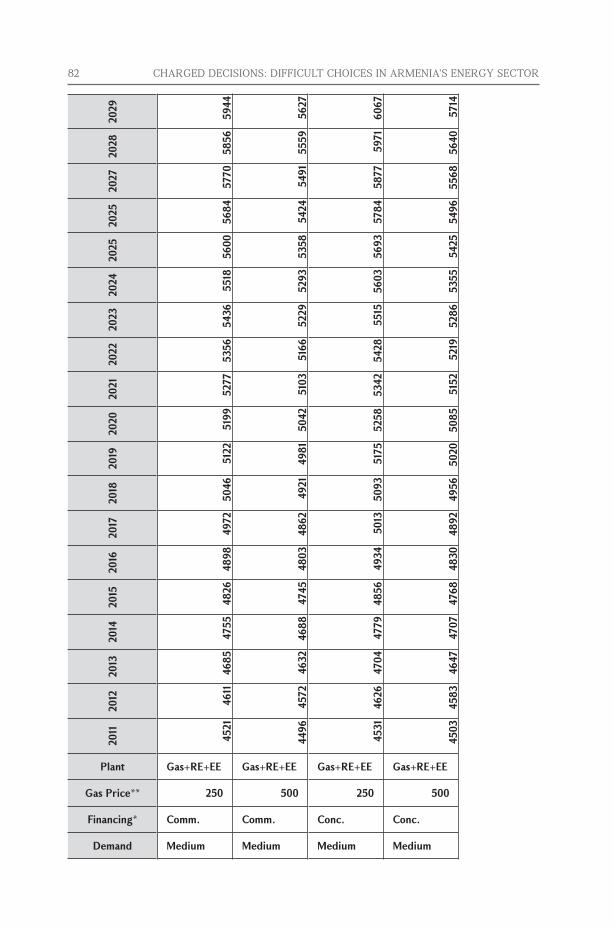
82 CHARGED DECISIONS: DIFFICULT CHOICES IN ARMENIA’S ENERGY SECTOR
Demand
Financing*
Gas Price**
Plant
2011
2012
2013
2014
2015
2016
2017
2018
2019
2020
2021
2022
2023
2024
2025
2025
2027
2028
2029
Medium
Comm.
250
Gas+RE+EE
4521
4611
4685
4755
4826
4898
4972
5046
5122
5199
5277
5356
5436
5518
5600
5684
5770
5856
5944
Medium
Comm.
500
Gas+RE+EE
4496
4572
4632
4688
4745
4803
4862
4921
4981
5042
5103
5166
5229
5293
5358
5424
5491
5559
5627
Medium
Conc.
250
Gas+RE+EE
4531
4626
4704
4779
4856
4934
5013
5093
5175
5258
5342
5428
5515
5603
5693
5784
5877
5971
6067
Medium
Conc.
500
Gas+RE+EE
4503
4583
4647
4707
4768
4830
4892
4956
5020
5085
5152
5219
5286
5355
5425
5496
5568
5640
5714
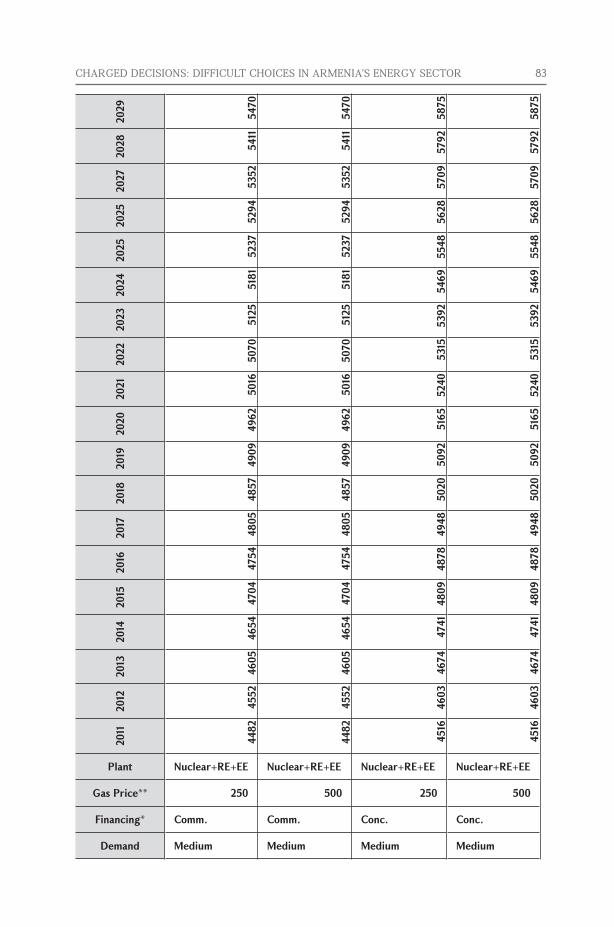
CHARGED DECISIONS: DIFFICULT CHOICES IN ARMENIA’S ENERGY SECTOR 83
Demand
Financing*
Gas Price**
Plant
2011
2012
2013
2014
2015
2016
2017
2018
2019
2020
2021
2022
2023
2024
2025
2025
2027
2028
2029
Medium
Comm.
250
Nuclear+RE+EE
4482
4552
4605
4654
4704
4754
4805
4857
4909
4962
5016
5070
5125
5181
5237
5294
5352
5411
5470
Medium
Comm.
500
Nuclear+RE+EE
4482
4552
4605
4654
4704
4754
4805
4857
4909
4962
5016
5070
5125
5181
5237
5294
5352
5411
5470
Medium
Conc.
250
Nuclear+RE+EE
4516
4603
4674
4741
4809
4878
4948
5020
5092
5165
5240
5315
5392
5469
5548
5628
5709
5792
5875
Medium
Conc.
500
Nuclear+RE+EE
4516
4603
4674
4741
4809
4878
4948
5020
5092
5165
5240
5315
5392
5469
5548
5628
5709
5792
5875
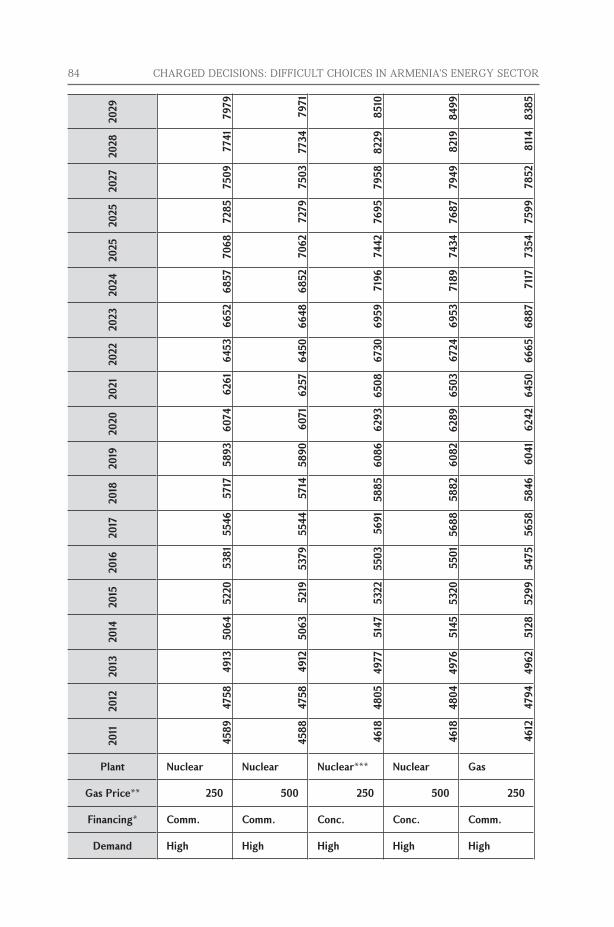
84 CHARGED DECISIONS: DIFFICULT CHOICES IN ARMENIA’S ENERGY SECTOR
Demand
Financing*
Gas Price**
Plant
2011
2012
2013
2014
2015
2016
2017
2018
2019
2020
2021
2022
2023
2024
2025
2025
2027
2028
2029
High
Comm.
250
Nuclear
4589
4758
4913
5064
5220
5381
5546
5717
5893
6074
6261
6453
6652
6857
7068
7285
7509
7741
7979
High
Comm.
500
Nuclear
4588
4758
4912
5063
5219
5379
5544
5714
5890
6071
6257
6450
6648
6852
7062
7279
7503
7734
7971
High
Conc.
250
Nuclear***
4618
4805
4977
5147
5322
5503
5691
5885
6086
6293
6508
6730
6959
7196
7442
7695
7958
8229
8510
High
Conc.
500
Nuclear
4618
4804
4976
5145
5320
5501
5688
5882
6082
6289
6503
6724
6953
7189
7434
7687
7949
8219
8499
High
Comm.
250
Gas
4612
4794
4962
5128
5299
5475
5658
5846
6041
6242
6450
6665
6887
7117
7354
7599
7852
8114
8385
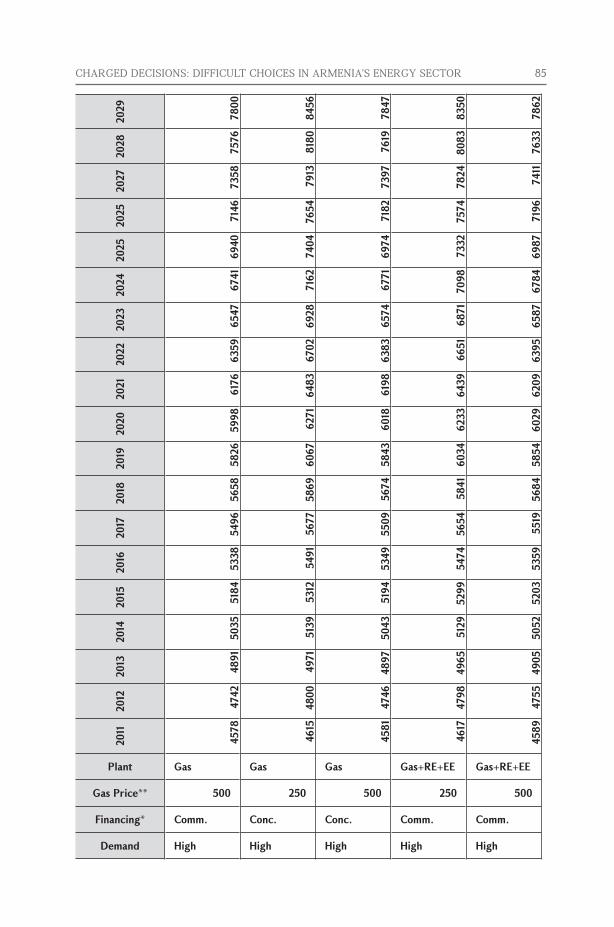
CHARGED DECISIONS: DIFFICULT CHOICES IN ARMENIA’S ENERGY SECTOR 85
Demand
Financing*
Gas Price**
Plant
2011
2012
2013
2014
2015
2016
2017
2018
2019
2020
2021
2022
2023
2024
2025
2025
2027
2028
2029
High
Comm.
500
Gas
4578
4742
4891
5035
5184
5338
5496
5658
5826
5998
6176
6359
6547
6741
6940
7146
7358
7576
7800
High
Conc.
250
Gas
4615
4800
4971
5139
5312
5491
5677
5869
6067
6271
6483
6702
6928
7162
7404
7654
7913
8180
8456
High
Conc.
500
Gas
4581
4746
4897
5043
5194
5349
5509
5674
5843
6018
6198
6383
6574
6771
6974
7182
7397
7619
7847
High
Comm.
250
Gas+RE+EE
4617
4798
4965
5129
5299
5474
5654
5841
6034
6233
6439
6651
6871
7098
7332
7574
7824
8083
8350
High
Comm.
500
Gas+RE+EE
4589
4755
4905
5052
5203
5359
5519
5684
5854
6029
6209
6395
6587
6784
6987
7196
7411
7633
7862
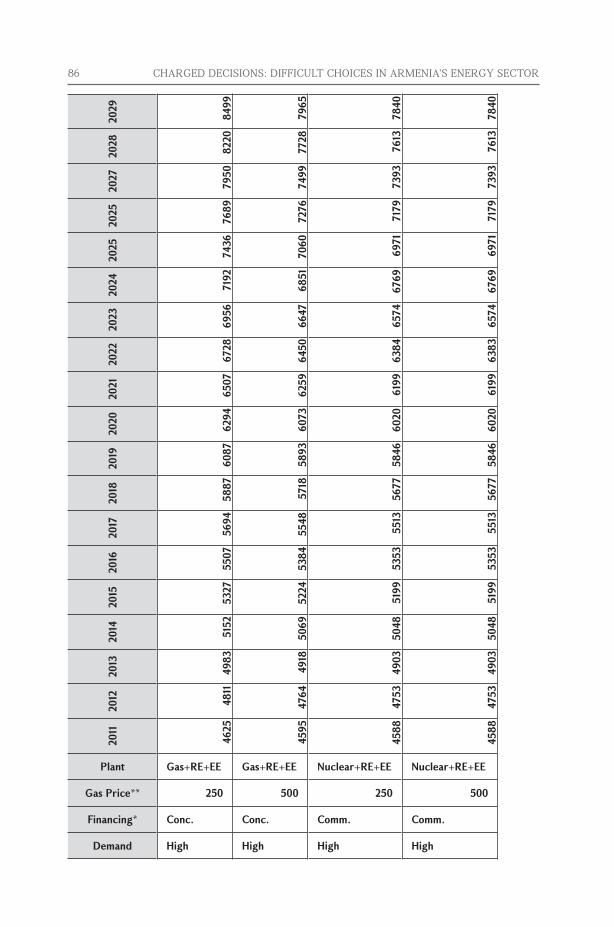
86 CHARGED DECISIONS: DIFFICULT CHOICES IN ARMENIA’S ENERGY SECTOR
Demand
Financing*
Gas Price**
Plant
2011
2012
2013
2014
2015
2016
2017
2018
2019
2020
2021
2022
2023
2024
2025
2025
2027
2028
2029
High
Conc.
250
Gas+RE+EE
4625
4811
4983
5152
5327
5507
5694
5887
6087
6294
6507
6728
6956
7192
7436
7689
7950
8220
8499
High
Conc.
500
Gas+RE+EE
4595
4764
4918
5069
5224
5384
5548
5718
5893
6073
6259
6450
6647
6851
7060
7276
7499
7728
7965
High
Comm.
250
Nuclear+RE+EE
4588
4753
4903
5048
5199
5353
5513
5677
5846
6020
6199
6384
6574
6769
6971
7179
7393
7613
7840
High
Comm.
500
Nuclear+RE+EE
4588
4753
4903
5048
5199
5353
5513
5677
5846
6020
6199
6383
6574
6769
6971
7179
7393
7613
7840
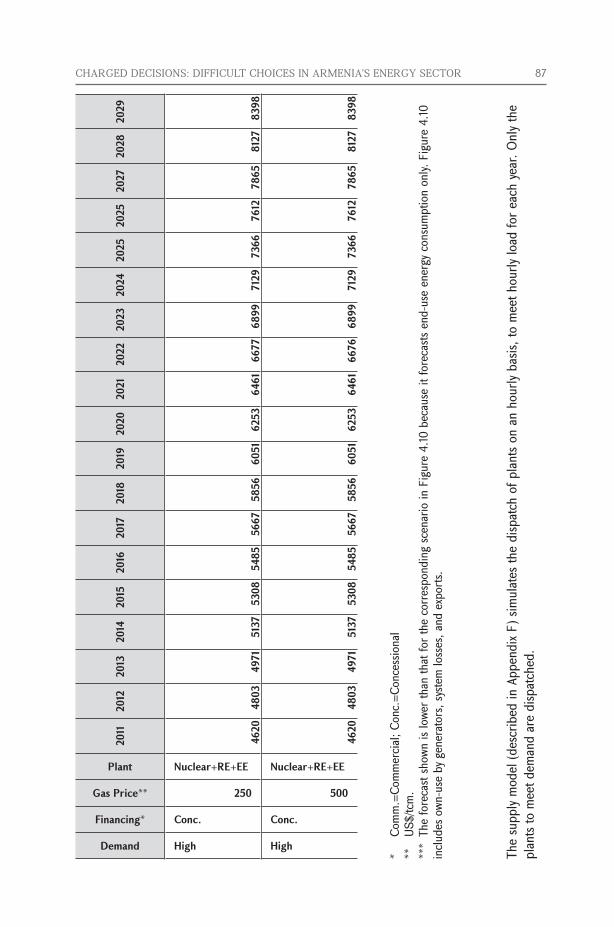
CHARGED DECISIONS: DIFFICULT CHOICES IN ARMENIA’S ENERGY SECTOR 87
Demand
Financing*
Gas Price**
Plant
2011
2012
2013
2014
2015
2016
2017
2018
2019
2020
2021
2022
2023
2024
2025
2025
2027
2028
2029
High
Conc.
250
Nuclear+RE+EE
4620
4803
4971
5137
5308
5485
5667
5856
6051
6253
6461
6677
6899
7129
7366
7612
7865
8127
8398
High
Conc.
500
Nuclear+RE+EE
4620
4803
4971
5137
5308
5485
5667
5856
6051
6253
6461
6676
6899
7129
7366
7612
7865
8127
8398
* C
omm
.=Co
mm
ercia
l; Co
nc.=
Conc
essio
nal
**US
$/tcm
.**
* Th
e fo
reca
st sh
own
is lo
wer t
han
that
for t
he c
orre
spon
ding
scen
ario
in F
igure
4.10
bec
ause
it fo
reca
sts e
nd-u
se e
nerg
y con
sum
ptio
n on
ly. F
igure
4.10
in
clude
s own
-use
by g
ener
ator
s, sy
stem
loss
es, a
nd e
xpor
ts.
The
supp
ly m
odel
(des
crib
ed in
App
endi
x F) s
imul
ates
the
disp
atch
of p
lants
on a
n ho
urly
basis
, to
mee
t hou
rly lo
ad fo
r eac
h ye
ar. O
nly t
he
plan
ts to
mee
t dem
and
are
disp
atch
ed.
88 CHARGED DECISIONS: DIFFICULT CHOICES IN ARMENIA’S ENERGY SECTOR
Appendix F: Supply Side MethodologyA spreadsheet model was created to achieve the following:
• Simulatethedispatchofexistingandnewpowerplantsunderdifferentde-mand scenarios to year 2029.
• Forecasttheaveragesystemtarifftoyear2019.
Section F.1 explains how dispatch of power plants was simulated to meet demand. Sec-tion F.2 explains how the average system tariff was calculated.
F.1 Dispatch SimulationThe dispatch simulation adds as many MW of capacity as needed to meet peak demand under demand scenarios specified in Appendix E.
The model allows for flexibility in specifying which new plants are added, and when, and which existing plants are retired, and when. Also, the model allows for flexibility in setting the system reserve margin and plant dispatch hierarchy (the order in which plants are dispatched). All scenarios in this study assume the following:
• NuclearandoldTPPsretirein2016
• YerevanCCGTcomesonlinein2010
• MeghriHPPcomesonlinein2019,butcapacityandenergyareusedforexportonly
• YerevanCCGTcomesonline in2010andHrazdan5comesonline in2011,but75 percent of energy and capacity are for export (25 percent of plant capacity is available for domestic energy needs).
• Reservemargins = 25 percent, unless it is assumed that a new nuclear plantcomes online, in which case the reserve margin = 35 percent
• Transmissionanddistribution losses total13percent;ownusebygenerators isroughly 5.0 percent
• Plantsaredispatchedaccordingtothefollowinghierarchyandonlyiftheyareinservice:
– Imports – Metsamor Nuclear Power Plant– Lori-1 wind power plant – New Wind Plant– Existing Small Hydro Plants– New Small Hydro Plants
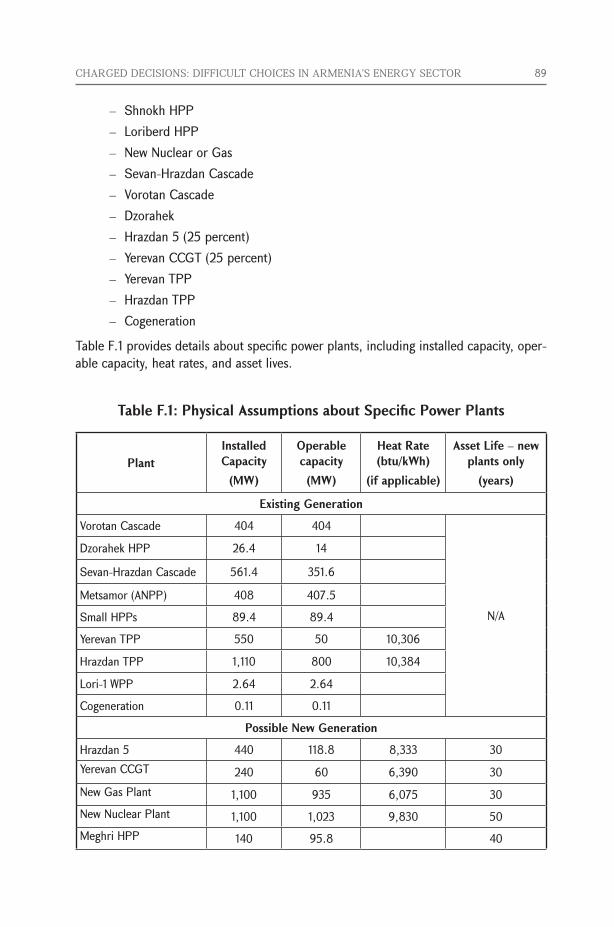
CHARGED DECISIONS: DIFFICULT CHOICES IN ARMENIA’S ENERGY SECTOR 89
– Shnokh HPP – Loriberd HPP – New Nuclear or Gas – Sevan-Hrazdan Cascade– Vorotan Cascade – Dzorahek – Hrazdan 5 (25 percent)– Yerevan CCGT (25 percent) – Yerevan TPP– Hrazdan TPP– Cogeneration
Table F.1 provides details about specific power plants, including installed capacity, oper-able capacity, heat rates, and asset lives.
Table F.1: Physical Assumptions about Specific Power Plants
PlantInstalled Capacity
(MW)
Operable capacity(MW)
Heat Rate (btu/kWh)
(if applicable)
Asset Life – new plants only
(years)
Existing Generation
Vorotan Cascade 404 404
N/A
Dzorahek HPP 26.4 14
Sevan-Hrazdan Cascade 561.4 351.6
Metsamor (ANPP) 408 407.5
Small HPPs 89.4 89.4
Yerevan TPP 550 50 10,306
Hrazdan TPP 1,110 800 10,384
Lori-1 WPP 2.64 2.64
Cogeneration 0.11 0.11
Possible New Generation
Hrazdan 5 440 118.8 8,333 30Yerevan CCGT 240 60 6,390 30New Gas Plant 1,100 935 6,075 30New Nuclear Plant 1,100 1,023 9,830 50Meghri HPP 140 95.8 40
90 CHARGED DECISIONS: DIFFICULT CHOICES IN ARMENIA’S ENERGY SECTOR
Shnokh HPP 70 35 40Lori-Berd HPP 66 23.5 30Small HPPs 200 80 40Wind 175 52.5 40
F.2 Tariff CalculationsTariffs were estimated or calculated for each generating plant included in the simulated dispatch. Existing plants’ tariffs were assumed equal to tariffs set by the PSRC. For new plants, LEC was calculated using a discounted cash flow (DCF) model for each new plant. The levelized cost is calculated as the minimum required tariff (AMD/kWh) that would en-able plant owners to cover all O&M costs, and all debt and equity costs. In other words, the levelized cost is the full cost of service.
These DCF models included assumptions about the following:
• Plant costs. Armenia’s Least Cost Generating Plan (LCGP), internal World Bank estimates, and international industry benchmarks were used as sources for estimates of capital costs, variable O&M, fixed O&M, and decommission-ing costs (for the nuclear plant).
• Capacity: Installed capacity and operable capacity. To estimate operable ca-pacity, existing plants were rated downward based on their historic capacity factors, (reflecting various technical reasons that they cannot run all the time), For new plants, capacity was de-rated based on how much other new plants of the same type are able to operate.
• Asset life (different for each plant).
• Loan tenures. Twenty-year loan terms for all new plants.
• Cost of capital (cost of debt and equity). The cost of debt was assumed to be 10.39 percent for commercial financing and 5.05 percent for concessional financing. The cost of equity was assumed to be 18 percent. Two scenarios were simulated for the structure of financing: (i) all-debt financing (“conces-sional financing”); and (ii) 70/30 debt/equity mix (“commercial financing”).
• Corporate tax. The model assumes 20 percent corporate tax in all cases.
• Load factor. The load factor depends on the level of plant operation required to meet forecast demand (which depends on the dispatch hierarchy). If the plant is lower in dispatch hierarchy (dispatched later, for economic reasons), and demand is low, the plant has a lower load factor.
The DCF calculations for new plants were completed only after dispatch had been simu-lated and a load factor estimated for each plant. A weighted average tariff was then cal-
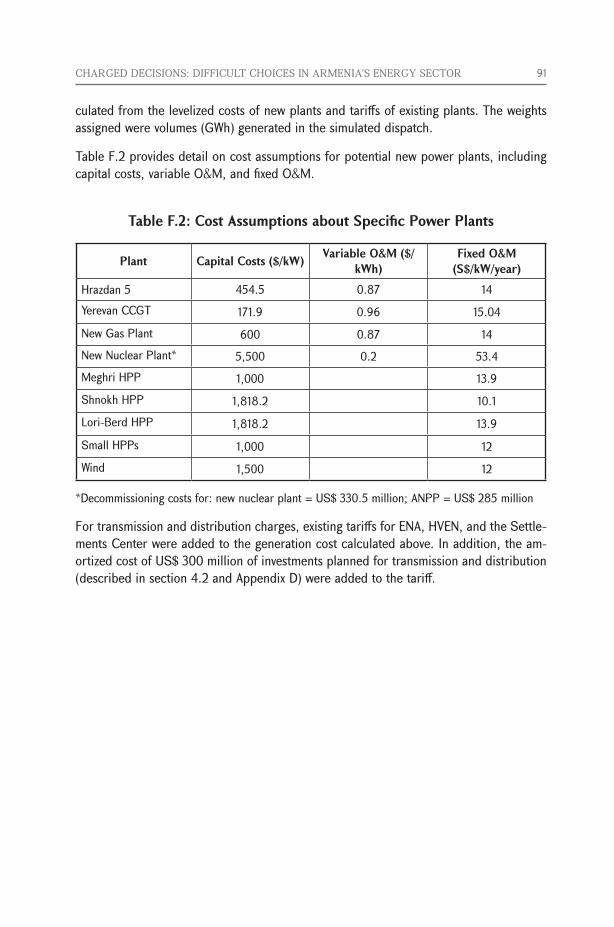
CHARGED DECISIONS: DIFFICULT CHOICES IN ARMENIA’S ENERGY SECTOR 91
culated from the levelized costs of new plants and tariffs of existing plants. The weights assigned were volumes (GWh) generated in the simulated dispatch.
Table F.2 provides detail on cost assumptions for potential new power plants, including capital costs, variable O&M, and fixed O&M.
Table F.2: Cost Assumptions about Specific Power Plants
Plant Capital Costs ($/kW) Variable O&M ($/kWh)
Fixed O&M (S$/kW/year)
Hrazdan 5 454.5 0.87 14Yerevan CCGT 171.9 0.96 15.04New Gas Plant 600 0.87 14New Nuclear Plant* 5,500 0.2 53.4Meghri HPP 1,000 13.9Shnokh HPP 1,818.2 10.1Lori-Berd HPP 1,818.2 13.9Small HPPs 1,000 12Wind 1,500 12
*Decommissioningcostsfor:newnuclearplant=US$330.5million;ANPP=US$285million
For transmission and distribution charges, existing tariffs for ENA, HVEN, and the Settle-ments Center were added to the generation cost calculated above. In addition, the am-ortizedcostofUS$300millionofinvestmentsplannedfortransmissionanddistribution(described in section 4.2 and Appendix D) were added to the tariff.
92 CHARGED DECISIONS: DIFFICULT CHOICES IN ARMENIA’S ENERGY SECTOR
Appendix G: Recent Experience with Construction of New Nuclear PlantsThis appendix analyzes recent international experience in nuclear plant procurement and construction for the purpose of informing the Government’s thinking about some of the potential challenges it may face and the cost implications of those challenges.
G.1 IntroductionArmenia has a power system able to meet peak demand in the short-term, but the planned decommissioning of the Metsamor NPP in 2016 is expected to leave a substantial gap in baseload capacity. The Government plans to fill this gap with a new, 1000-1100 MW nuclear power plant on the same site.
For the most part, nuclear technology has not changed over the past 25 years. Light water reactors dominate the scene, though heavy-water natural uranium CANDU reactors are also available. Estimating the cost of a new reactor is a daunting exercise. The database of reactors underway or completed is small, almost entirely in Asia, and mostly accumulated in the 1990s, however, there has been significant real escalation in worldwide materials costs since 2002. The supply chain - key materials, components, skilled labor - is very tight.
Total cost or life-cycle costs of a nuclear reactor can be broken down into three catego-ries:
• Capitalorconstructioncosts
• Operating,maintenance,andfuelcosts
• Decommissioningandwasteremovalcosts
Cost figures can be reported in several formats. Capital costs are typically presented as “overnight costs” or the costs of engineering, procurement, and construction prior to tak-ing financing and cost escalations into consideration. These figures are given in per kW or MW units by dividing by the total capacity of the plant. Total costs can also be given in levelized terms, in which costs are divided by total lifetime output of the plant in per kWh or MWh units.
G.2 Capital CostsThe main factor in the life-cycle cost of a nuclear reactor is construction or capital cost. This represents 80-90 percent of overall life-cycle cost.
For the most part one must turn to South Korea and Japan for construction costs. These are nations that maintained a nuclear building program in the 1990s, and, therefore, have experienced construction crews and other forms of indigenous infrastructure. The
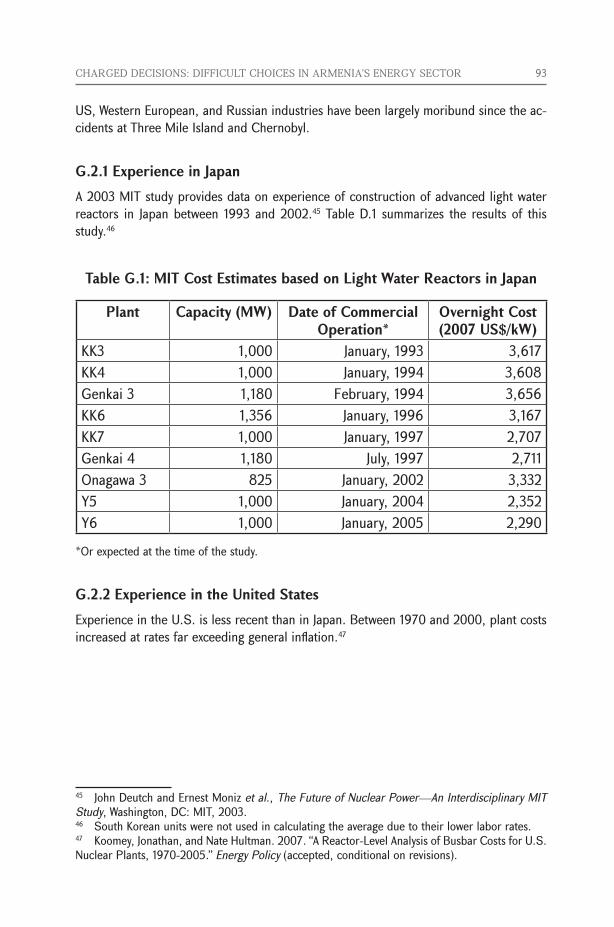
CHARGED DECISIONS: DIFFICULT CHOICES IN ARMENIA’S ENERGY SECTOR 93
US, Western European, and Russian industries have been largely moribund since the ac-cidents at Three Mile Island and Chernobyl.
G.2.1 Experience in JapanA 2003 MIT study provides data on experience of construction of advanced light water reactors in Japan between 1993 and 2002.45 Table D.1 summarizes the results of this study.46
Table G.1: MIT Cost Estimates based on Light Water Reactors in Japan
Plant Capacity (MW) Date of Commercial Operation*
Overnight Cost (2007 US$/kW)
KK3 1,000 January, 1993 3,617KK4 1,000 January, 1994 3,608Genkai 3 1,180 February, 1994 3,656KK6 1,356 January, 1996 3,167KK7 1,000 January, 1997 2,707Genkai 4 1,180 July, 1997 2,711Onagawa 3 825 January, 2002 3,332Y5 1,000 January, 2004 2,352Y6 1,000 January, 2005 2,290
*Or expected at the time of the study.
G.2.2 Experience in the United StatesExperience in the U.S. is less recent than in Japan. Between 1970 and 2000, plant costs increased at rates far exceeding general inflation.47
45 John Deutch and Ernest Moniz et al., The Future of Nuclear Power—An Interdisciplinary MIT Study, Washington, DC: MIT, 2003.46 South Korean units were not used in calculating the average due to their lower labor rates.47 Koomey, Jonathan, and Nate Hultman. 2007. “A Reactor-Level Analysis of Busbar Costs for U.S. Nuclear Plants, 1970-2005.” Energy Policy (accepted, conditional on revisions).
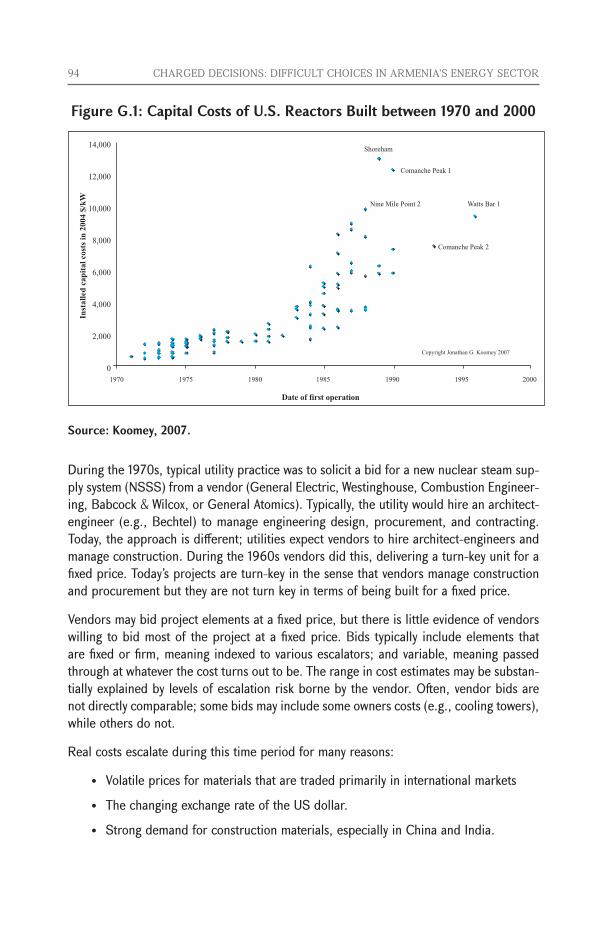
94 CHARGED DECISIONS: DIFFICULT CHOICES IN ARMENIA’S ENERGY SECTOR
Figure G.1: Capital Costs of U.S. Reactors Built between 1970 and 2000
Source: Koomey, 2007.
During the 1970s, typical utility practice was to solicit a bid for a new nuclear steam sup-ply system (NSSS) from a vendor (General Electric, Westinghouse, Combustion Engineer-ing, Babcock & Wilcox, or General Atomics). Typically, the utility would hire an architect-engineer (e.g., Bechtel) to manage engineering design, procurement, and contracting. Today, the approach is different; utilities expect vendors to hire architect-engineers and manage construction. During the 1960s vendors did this, delivering a turn-key unit for a fixed price. Today’s projects are turn-key in the sense that vendors manage construction and procurement but they are not turn key in terms of being built for a fixed price.
Vendors may bid project elements at a fixed price, but there is little evidence of vendors willing to bid most of the project at a fixed price. Bids typically include elements that are fixed or firm, meaning indexed to various escalators; and variable, meaning passed through at whatever the cost turns out to be. The range in cost estimates may be substan-tially explained by levels of escalation risk borne by the vendor. Often, vendor bids are not directly comparable; some bids may include some owners costs (e.g., cooling towers), while others do not.
Real costs escalate during this time period for many reasons:
• Volatilepricesformaterialsthataretradedprimarilyininternationalmarkets
• ThechangingexchangerateoftheUSdollar.
• Strongdemandforconstructionmaterials,especiallyinChinaandIndia.
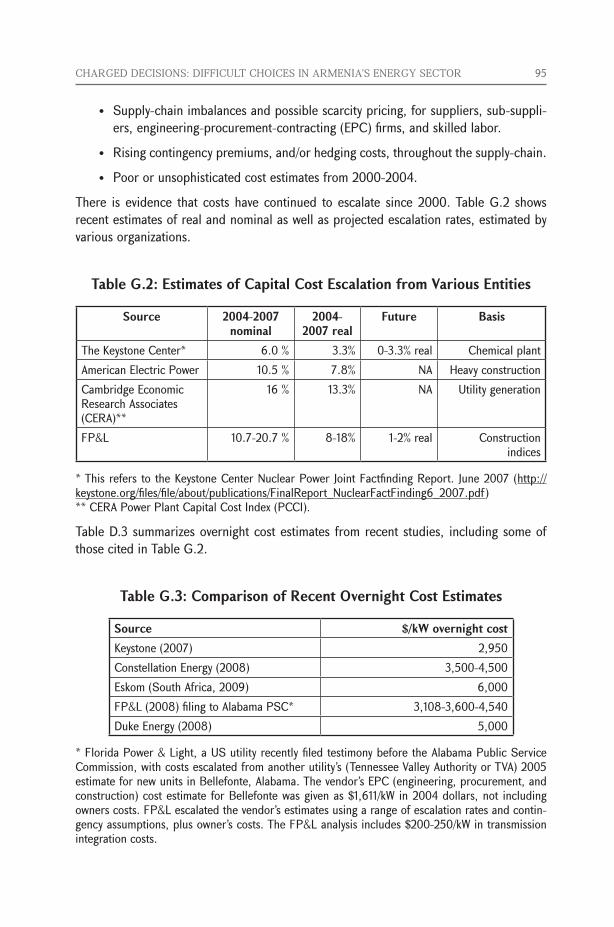
CHARGED DECISIONS: DIFFICULT CHOICES IN ARMENIA’S ENERGY SECTOR 95
• Supply-chainimbalancesandpossiblescarcitypricing,forsuppliers,sub-suppli-ers, engineering-procurement-contracting (EPC) firms, and skilled labor.
• Risingcontingencypremiums,and/orhedgingcosts,throughoutthesupply-chain.
• Poororunsophisticatedcostestimatesfrom2000-2004.
There is evidence that costs have continued to escalate since 2000. Table G.2 shows recent estimates of real and nominal as well as projected escalation rates, estimated by various organizations.
Table G.2: Estimates of Capital Cost Escalation from Various Entities
Source 2004-2007 nominal
2004-2007 real
Future Basis
The Keystone Center* 6.0 % 3.3% 0-3.3% real Chemical plantAmerican Electric Power 10.5 % 7.8% NA Heavy constructionCambridge Economic Research Associates (CERA)**
16 % 13.3% NA Utility generation
FP&L 10.7-20.7 % 8-18% 1-2% real Construction indices
* This refers to the Keystone Center Nuclear Power Joint Factfinding Report. June 2007 (http://keystone.org/files/file/about/publications/FinalReport_NuclearFactFinding6_2007.pdf)** CERA Power Plant Capital Cost Index (PCCI).
Table D.3 summarizes overnight cost estimates from recent studies, including some of those cited in Table G.2.
Table G.3: Comparison of Recent Overnight Cost Estimates
Source $/kW overnight costKeystone (2007) 2,950Constellation Energy (2008) 3,500-4,500Eskom (South Africa, 2009) 6,000FP&L (2008) filing to Alabama PSC* 3,108-3,600-4,540Duke Energy (2008) 5,000
* Florida Power & Light, a US utility recently filed testimony before the Alabama Public Service Commission, with costs escalated from another utility’s (Tennessee Valley Authority or TVA) 2005 estimate for new units in Bellefonte, Alabama. The vendor’s EPC (engineering, procurement, and construction)costestimateforBellefontewasgivenas$1,611/kWin2004dollars,notincludingowners costs. FP&L escalated the vendor’s estimates using a range of escalation rates and contin-gencyassumptions,plusowner’scosts.TheFP&Lanalysisincludes$200-250/kWintransmissionintegration costs.
96 CHARGED DECISIONS: DIFFICULT CHOICES IN ARMENIA’S ENERGY SECTOR
G.2.3 International experience Recently, industry and government estimates for nuclear construction around the world rangedfromUS$1,500-2,100/kW,expressedindollarvaluesfordifferentyears.48 How-ever, recent bids and industry estimates are far higher. In June 2009, the Ontario Power AuthoritydeclinedtoacceptbidsfortworeactorsfromeitherAECL(US$10,800/kW)orAreva(US$7,375/kW).Arevawas“non-conforming,”whichpresumablymeansthatsub-stantial risk of delay and cost escalation was placed on the utility. The Electricity Supply Commission of South Africa also declined to accept bids in 2010, the lowest of which was reportedlyUS$6,000/kW.
G.2.4 Future escalation of capital costs Long construction periods and high capital intensity are the primary reasons for escala-tion of nuclear power costs. Planning and construction delays can amplify nuclear plant costs due to accruing interest. The United Kingdom (UK) Department of Trade and In-dustry (DTI) estimates that planning can take up to eight years and construction can take 5-8 years.49 Because nuclear plants are more capital intensive, factors that affect capital costs will be more acute than for other generating options.
The cost of delaysA 2007 study by the UK DTI compared several planning period scenarios for a nuclear plant using a gas plant as a base case. Table D.4 displays DTI analysis of the penalties and advantages of nuclear generation under various scenarios. Under the long planning period,thenetpresentvalue(NPV)ofthegasoptionisUS$96.3milliongreaterthanif nuclear power is installed. However, when shorter and less expensive planning stages are considered nuclear is clearly the best generation option. For the short (5.5 years) andlowcost(US$150million)planningperiod,nuclearpowerhasaUS$233.1millionbenefit over gas generation.
48 This covers the range estimated in studies by the University of Chicago and MIT, and the U.S. Energy Information Administration estimate for advanced US light water reactors. 49 Department of Trade and Industry. “The Future of Nuclear Power”. 2007. Interest during con-struction depends on several key factors including duration of construction, shape of outlays, debt-to-equity ratio, and returns on both debt and equity. The U.S. Energy Information Administration assumes a six-year construction period for a new reactor. Some vendors believe it can be done in four years.
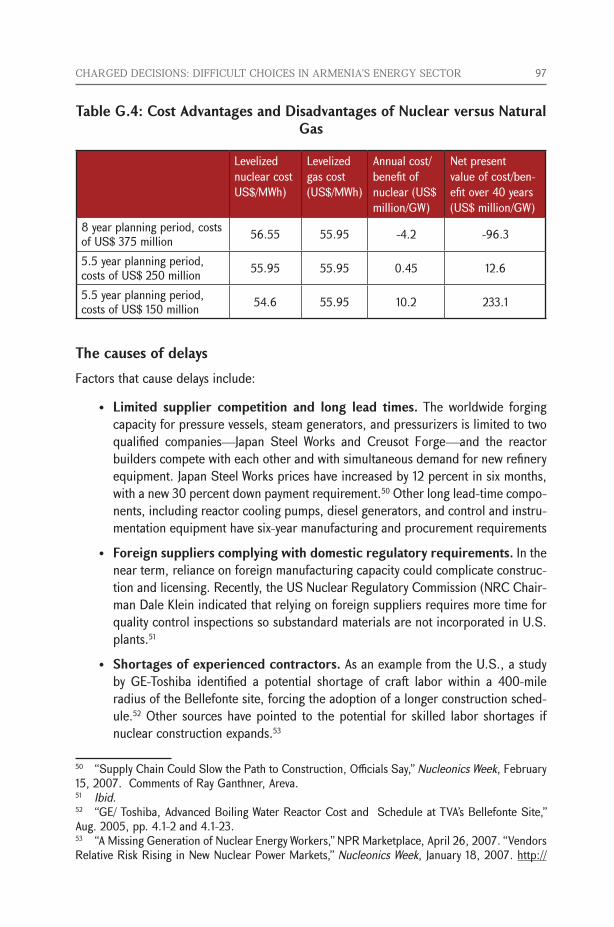
CHARGED DECISIONS: DIFFICULT CHOICES IN ARMENIA’S ENERGY SECTOR 97
Table G.4: Cost Advantages and Disadvantages of Nuclear versus Natural Gas
Levelized nuclear cost US$/MWh)
Levelized gas cost (US$/MWh)
Annual cost/benefit of nuclear(US$million/GW)
Net present value of cost/ben-efit over 40 years (US$million/GW)
8 year planning period, costs ofUS$375million 56.55 55.95 -4.2 -96.3
5.5 year planning period, costsofUS$250million 55.95 55.95 0.45 12.6
5.5 year planning period, costsofUS$150million 54.6 55.95 10.2 233.1
The causes of delaysFactors that cause delays include:
• Limited supplier competition and long lead times. The worldwide forging capacity for pressure vessels, steam generators, and pressurizers is limited to two qualified companies—Japan Steel Works and Creusot Forge—and the reactor builders compete with each other and with simultaneous demand for new refinery equipment. Japan Steel Works prices have increased by 12 percent in six months, with a new 30 percent down payment requirement.50 Other long lead-time compo-nents, including reactor cooling pumps, diesel generators, and control and instru-mentation equipment have six-year manufacturing and procurement requirements
• Foreign suppliers complying with domestic regulatory requirements. In the near term, reliance on foreign manufacturing capacity could complicate construc-tion and licensing. Recently, the US Nuclear Regulatory Commission (NRC Chair-man Dale Klein indicated that relying on foreign suppliers requires more time for quality control inspections so substandard materials are not incorporated in U.S. plants.51
• Shortages of experienced contractors. As an example from the U.S., a study by GE-Toshiba identified a potential shortage of craft labor within a 400-mile radius of the Bellefonte site, forcing the adoption of a longer construction sched-ule.52 Other sources have pointed to the potential for skilled labor shortages if nuclear construction expands.53
50 “Supply Chain Could Slow the Path to Construction, Officials Say,” Nucleonics Week, February 15, 2007. Comments of Ray Ganthner, Areva.51 Ibid.52 “GE/ Toshiba, Advanced Boiling Water Reactor Cost and Schedule at TVA’s Bellefonte Site,” Aug. 2005, pp. 4.1-2 and 4.1-23.53 “A Missing Generation of Nuclear Energy Workers,” NPR Marketplace, April 26, 2007. “Vendors Relative Risk Rising in New Nuclear Power Markets,” Nucleonics Week, January 18, 2007. http://
98 CHARGED DECISIONS: DIFFICULT CHOICES IN ARMENIA’S ENERGY SECTOR
Several of these problems have surfaced at the Olkiluoto 3 site, where the French vendor Areva is building a 1,600 megawatt advanced European pressurized reactor (EPR). Areva originally estimated a four-year construction period, but the plant has fallen 18 months behind schedule, and is substantially over budget. Analysts estimate that Areva’s share of thelossonthe“turn-key”contractwillexceedUS$1.0billion.Concretepouredforthefoundation of the nuclear island was found to be more porous than the Finnish regula-tor would accept. Hot and cold legs of the reactor cooling system required re-forging. Recently, construction has been suspended, based on escalating friction between Areva and STUK, the Finnish safety regulator.
At a recent conference in Nice, France, Areva NP President Luc Oursel indicated that the company had underestimated what it would take to reactivate the global supply chain for a new nuclear plant. In particular, they were not “100 percent assured to have a good quality of supply,” were not sufficiently familiar with the “specific regulatory context” in Finland, and began building without a complete design. Some 1,360 workers from 28 nations are now at work at the site. The STUK project manager added that, “a complete design would be the ideal. But I don’t think there’s a vendor in the world that would do it before knowing whether they would get a contract. That’s real life.”54
Recent examples of project delaysThe following nuclear projects suffered delays over the past decade:
• Olkiluoto-3 (Finland). Anticipated completion date for the third (1,600 MW) unit of Finland’s Olkiluoto NPP was 2009. Repeated delays extended this from 2011 to mid-2012 to 2013. Longer-than-expected civil works are cited as a source of delay: (i) foundation irregularities slowed many construction tasks for months until the problem was corrected; (ii) technical issues arose with the reactors unique double containment system; and (iii) the state regulator ordered welding of the cooling system to be stopped after it determined the welding of pipes was not properly. TheoriginallyexpectedtocostsomeUS$4.2billion,thepricehasnowincreasedtooverUS$5.3billion.Areportanalyzingtheconstructionproblemscitesunre-alistic budgets and time-tables as one of the leading causes.
• Flamanville-3 (France). The Flamanville-3 plant in France is a copy of the Olki-luoto-3 plant being constructed in Finland. This plant has also been affected by delays. Safety inspectors have found cracks in the concrete base and steel rein-forcements installed in the wrong place. The project is now more than 25 percent over budget.
• Lungman NPP (Taiwan). Since construction at the Lungman NPP project began in 1997, the project has been delayed due to political and contractual issues.
marketplace.publicradio.org/shows/2007/04/26/PM200704265.html.54 Lack of Complete Design Blamed for Problems at Olkiluoto 3, Nucleonics Week, May 17, 2007. Areva Official Says Olkiluoto 3 Provides Lessons for Future Work, Nucleonics Week, May 3, 2007.
CHARGED DECISIONS: DIFFICULT CHOICES IN ARMENIA’S ENERGY SECTOR 99
Originally planned to be completed in 2004 and 2005, the two 1,350 MW reactors are now not expected to come on-line until 2011 and 2012. Political disagreement over the project caused construction to be suspended for four months in 2000. The project was further delayed when contractors (GE) would not resume work until they were compensated for the four month construction suspension. Overall, thedelayintheprojectcausedTaiwanPoweranestimatedUS$394millionduetocontractor compensation costs and foregone revenue.
• Belene NPP (Bulgaria). The Belene NPP in Bulgaria has been delayed several times since it was started in 1987. Construction was originally stopped following the collapse of the Soviet Union in 1990. The project was re-started in 2002, but trouble attracting financing delayed the start of construction. Delays have resulted in estimated costs escalating from €4 billion in 2004 to €8 billion in 2008.
G.3 Operating, maintenance, and fuel costsOne of the most important parameters affecting life-cycle cost is reactor performance, or capacity factor. U.S. average nuclear capacity factors have increased from below 60% during most of the 1980s to nearly 90% in the post-2000 period.55 Some of the increase is attributable to changes in technical specifications that require equipment to operate within a wider range and to higher fuel enrichments. The first reduces the number of equipment related reactor trips and shutdowns. The second reduces the number of refu-eling outages. It may also be true that outages are more frequent in early years (“teeth-ing”) and later years (“aging”). Seventy five to eighty five percent is a reasonable lifetime range for future units.
Advanced light water reactors may have lower operations and maintenance costs than current units, based on the use of more passive safety systems. Including capital ad-ditions (essentially capitalized operations and maintenance), the current US average is aboutUS$0.011toUS$0.012perkWhinO&Mcosts.56 There is no recent history of real escalation in the value, and it is probably appropriate for both a low and high estimate.
Nuclear fuel costs have many components—uranium mining and milling, conversion to UF6, enrichment, reconversion, fuel fabrication, shipping costs, interest costs on fuel in inventory, and spent fuel management and disposition.
Uranium conversion, enrichment, and fuel fabrication represent some 90 percent of total fuel costs. A January 2010 study by the World Nuclear Association estimates that total fuel costsareapproximatelyUS$0.071perkWh.Thisestimateisbasedonanaverageburnrate of 360,000 kWh per kg of reactor grade uranium. Table D.5 below details the cost component of each step in fuel modification.
55 MIT, “The Future of Nuclear Power,” 2003; and Joskow, “Future Prospects for Nuclear-A US Perspective,” Presentation at University of Paris, Dauphine, May 2006.56 Inclusive of administrative and other general operating costs
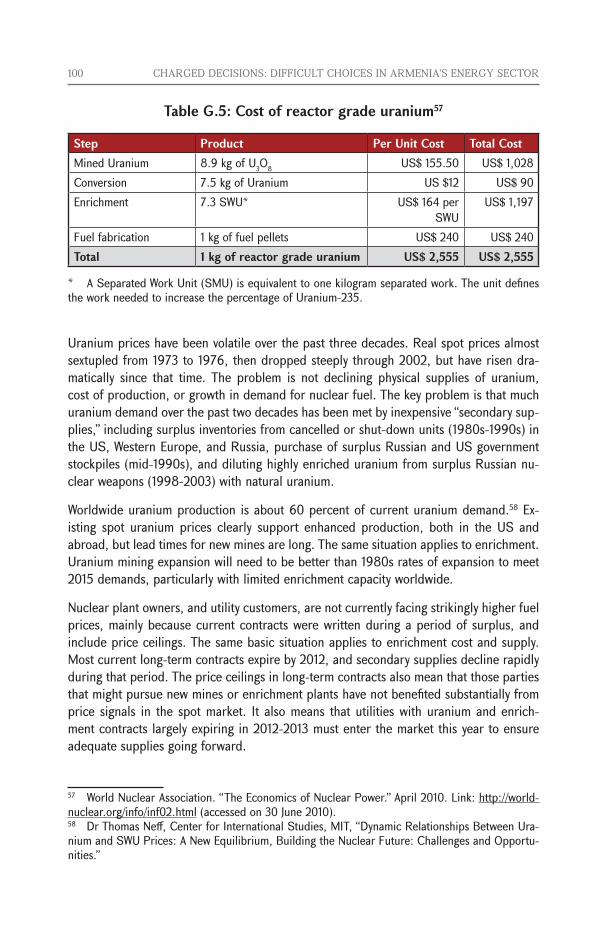
100 CHARGED DECISIONS: DIFFICULT CHOICES IN ARMENIA’S ENERGY SECTOR
Table G.5: Cost of reactor grade uranium57
Step Product Per Unit Cost Total Cost Mined Uranium 8.9 kg of U3O8 US$155.50 US$1,028Conversion 7.5 kg of Uranium US$12 US$90Enrichment 7.3 SWU* US$164per
SWUUS$1,197
Fuel fabrication 1 kg of fuel pellets US$240 US$240Total 1 kg of reactor grade uranium US$ 2,555 US$ 2,555
* A Separated Work Unit (SMU) is equivalent to one kilogram separated work. The unit defines the work needed to increase the percentage of Uranium-235.
Uranium prices have been volatile over the past three decades. Real spot prices almost sextupled from 1973 to 1976, then dropped steeply through 2002, but have risen dra-matically since that time. The problem is not declining physical supplies of uranium, cost of production, or growth in demand for nuclear fuel. The key problem is that much uranium demand over the past two decades has been met by inexpensive “secondary sup-plies,” including surplus inventories from cancelled or shut-down units (1980s-1990s) in the US, Western Europe, and Russia, purchase of surplus Russian and US government stockpiles (mid-1990s), and diluting highly enriched uranium from surplus Russian nu-clear weapons (1998-2003) with natural uranium.
Worldwide uranium production is about 60 percent of current uranium demand.58 Ex-isting spot uranium prices clearly support enhanced production, both in the US and abroad, but lead times for new mines are long. The same situation applies to enrichment. Uranium mining expansion will need to be better than 1980s rates of expansion to meet 2015 demands, particularly with limited enrichment capacity worldwide.
Nuclear plant owners, and utility customers, are not currently facing strikingly higher fuel prices, mainly because current contracts were written during a period of surplus, and include price ceilings. The same basic situation applies to enrichment cost and supply. Most current long-term contracts expire by 2012, and secondary supplies decline rapidly during that period. The price ceilings in long-term contracts also mean that those parties that might pursue new mines or enrichment plants have not benefited substantially from price signals in the spot market. It also means that utilities with uranium and enrich-ment contracts largely expiring in 2012-2013 must enter the market this year to ensure adequate supplies going forward.
57 World Nuclear Association. “The Economics of Nuclear Power.” April 2010. Link: http://world-nuclear.org/info/inf02.html (accessed on 30 June 2010). 58 Dr Thomas Neff, Center for International Studies, MIT, “Dynamic Relationships Between Ura-nium and SWU Prices: A New Equilibrium, Building the Nuclear Future: Challenges and Opportu-nities.”
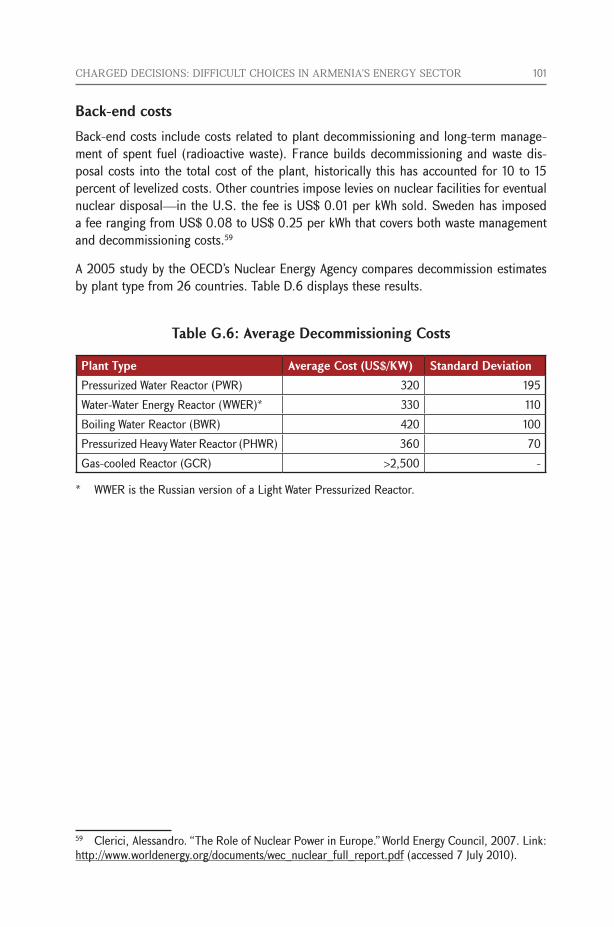
CHARGED DECISIONS: DIFFICULT CHOICES IN ARMENIA’S ENERGY SECTOR 101
Back-end costsBack-end costs include costs related to plant decommissioning and long-term manage-ment of spent fuel (radioactive waste). France builds decommissioning and waste dis-posal costs into the total cost of the plant, historically this has accounted for 10 to 15 percent of levelized costs. Other countries impose levies on nuclear facilities for eventual nucleardisposal—intheU.S.thefeeisUS$0.01perkWhsold.SwedenhasimposedafeerangingfromUS$0.08toUS$0.25perkWhthatcoversbothwastemanagementand decommissioning costs.59
A 2005 study by the OECD’s Nuclear Energy Agency compares decommission estimates by plant type from 26 countries. Table D.6 displays these results.
Table G.6: Average Decommissioning Costs
Plant Type Average Cost (US$/KW) Standard DeviationPressurized Water Reactor (PWR) 320 195Water-Water Energy Reactor (WWER)* 330 110Boiling Water Reactor (BWR) 420 100Pressurized Heavy Water Reactor (PHWR) 360 70Gas-cooled Reactor (GCR) >2,500 -
* WWER is the Russian version of a Light Water Pressurized Reactor.
59 Clerici, Alessandro. “The Role of Nuclear Power in Europe.” World Energy Council, 2007. Link: http://www.worldenergy.org/documents/wec_nuclear_full_report.pdf (accessed 7 July 2010).