Embed Size (px)
Citation preview
J. ElectroanaL Chem., 126 (1981) 105-119 105 Elsevier Sequoia S.A., Lausanne--Printed in The Netherlands
CHARGE TRANSFER BETWEEN TWO IMMISCIBLE ELECTROLYTE SOLUTIONS
PART VII. CONVOLUTION POTENTIAL SWEEP VOLTAMMETRY OF Cs + ION TRANSFER AND OF ELECTRON TRANSFER BETWEEN FERROCENE AND HEXACYANOFERRATE(III) ION ACROSS THE WATER/NITROBENZENE INTERFACE
Z. SAMEC, V. MARECEK, J. WEBER and D. HOMOLKA
J. Heyrovskj~ Institute of Physical Chemistry and Electrochemistry, Czechoslovak Academy of Sciences, U tov~ren 254, 102 00 Prague l O--Hostiva~ (Czechoslovakia)
(Received 9th March 1981)
ABSTRACT
Convolution analysis was used in the evaluation of the thermodynamic and kinetic parameters of two charge-transfer systems at the water/nitrobenzene interface: Cs + ion transfer and the electron transfer between ferrocene in nitrobenzene and hexacyanoferrate(III) in water. Attention was focused in particular on the potential dependence of the rate constant of the ion or electron transfer. The apparent rate constant was corrected for the double-layer effect using the capacity data and the Gouy-Chapman theory. It is concluded that the observed potential dependence of the apparent rate constant of Cs + ion transfer arises from the effect of the total potential difference on "the concentration of reactants at the reaction planes. In the electron transfer the analysis is considerably complicated by the possibility of ion-pairing, the bridge mechanism of electron transfer and the existence of the different planes of the closest approach for the reactants and the base electrolyte ions. Nevertheless, an attempt at analysis indicates that an intrinsic potential dependence of the rate constant is involved.
INTRODUCTION
The transfer of Cs + ion (I) across the water(w)/nitrobenzene(n) interface:
Cs + (w) = Cs +" (n) (I)
and the electron transfer (II) between the hexacyanoferrate redox couple in water and ferrocene in nitrobenzene:
Fe(CN)36-(w) + (CsHs)zFe(n)= Fe(CN)~-(w) + (CsHs)2Fe + (n) (II)
were investigated by cyclic voltammetry with a four-electrode system [1,2]. Quantita- tive analysis of the voltammetric behaviour has so far been possible only in the case of the monomolecular reaction (I) using the available theory of the stationary electrode voltammetry [3,4].
0022-0728/81/0000-0000/$02.50 © 1981 Elsevier Sequoia S.A.
106
The phenomenological relations drawn from the voltammetric experiments on reaction (II) were discussed [2] on the basis of the theory of the stationary current-potential curves [5], which provides a qualitative understanding of the phenomena observed. However, linear potential sweep or cyclic voltammograms of both ion and electron transfer across the interface between two immiscible electro- lyte solutions (ITIES) can be analysed quantitatively by the convolution analysis [6], which consists in computing the integral (1)
m = ~r-1 /2 f / I ( , r ) ( t - "r)- l/2d,r (1)
directly from the experimental current-time ( l - t ) data. This procedure, which is known as convolution potential sweep voltammetry (CPSV), has been introduced by Imbeaux and Sav6ant [7] (cf. also the method of semi-integral electroanalysis [8]).
In the report, the results of the convolution analysis of the voltammetric data on reactions (I) and (II) will be presented.
E X P E R I M E N T A L
Most of the experimental material considered here has been presented previously; details of the measurements of Cs ÷ ion transfer (I) or the electron transfer (II) can be found in refs. 1 or 2 respectively. We shall recall only that in these experiments
t h e potential E is the Galvani potential difference AW~ = ~ ( w ) - ~(n) between the aqueous and nitrobenzene phases related to the formal potential difference for the tetrabutylammonium cation transfer, w e ~ T B A + [1,2]: E = AW~b w e
- - /~ n ~ TBA + ( 2 )
In addition, the voltammetric behaviour of ferrocene and of hexacyanoferrate redox couple at a gold electrode was investigated, using the classical three-electrode voltanunetry under the same experimental conditions as in the measurements of electron transfer (II).
The cyclic voltammograms of ferrocene were measured at the stationary gold electrode (geometric area 0.79 mm 2) in an 0.05 M nitrobenzene solution of tetra- butylammonium tetraphenylborate (TBATPB). The auxiliary electrode was an Au spiral placed around the working electrode in the same solution and the reference electrode was an Ag/AgC1 electrode immersed in an 0.05 M aqueous solution of tetrabutylammonium chloride (TBAC1). The reference electrode was connected to the nitrobenzene phase by means of the Luggin capillary inside which a water/nitrobenzene interface.was formed. Thus, the potential of the gold electrode is related to the potential of the reference Ag/AgCI electrode which involves the sum of the potential difference at the silver/water interface and the formal potential
'~TBA+ • difference for TBA + ion transfer across the water/nitrobenzene interface w e
The voltammetric curves of the hexacyanoferrate redox couple were measured at the gold rotating disc electrode (geometric area 7.1 mm 2) in an 0.05 M deaerated aqueous solution of LiC1. In this case the auxiliary electrode was the same as above, but the reference electrode was a saturated calomel electrode.
107
The gold electrodes were pretreated electrochemically in an 0.5 M deaerated solution of H2SO 4 by periodic polarization with triangular voltage pulses (10 V s-1) between the onsets of the hydrogen and oxygen evolution until the reproducible current-potential profile of the surface oxidation and reduction was observed. The gold electrodes were then rinsed in twice-distilled water and used immediately.
RESULTS AND DISCUSSION
The current data I(t) were read at equally spaced time intervals A = 519 -1 or 10v -1 (v is the polarization rate in mV s - l ) from the voltammograms of Cs + ion transfer (I) [1] or electron transfer (II) [2]. The convoluted current m was computed according to the algorithm (3) [8]:
m(t)=(A/~r) '/2 E [I( jA)+ I( jA--A)] -•--j+ 1) 1/2 ,/2 j = l
CPS V of Cs + ion transfer
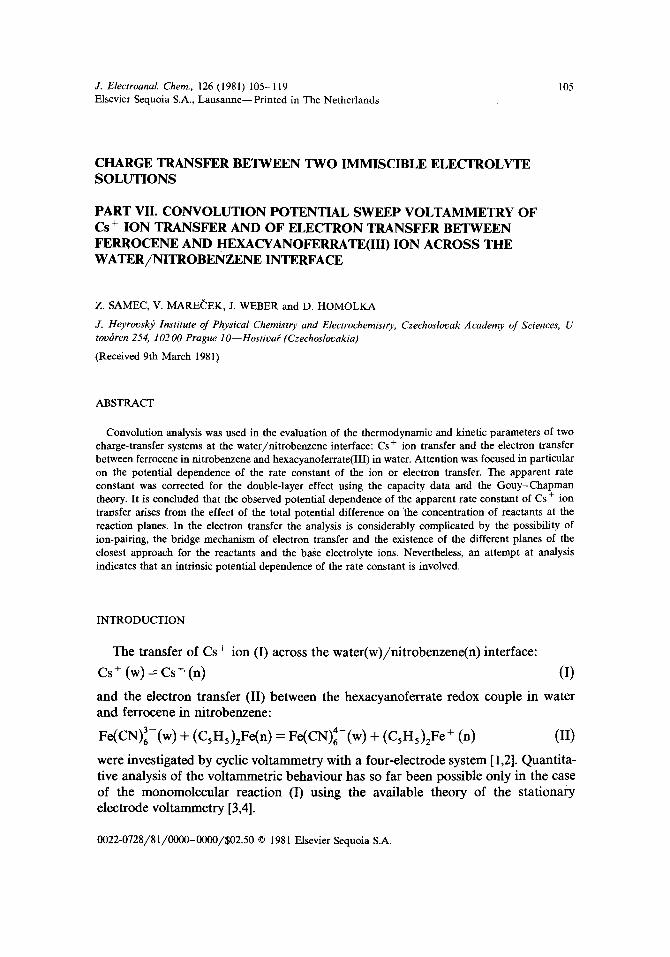
Figure 1 shows the convoluted current-potential (m-E) curves of Cs + ion transfer from water to nitrobenzene at two different polarization rates. At 1 m M concentration of Cs + ion in the aqueous phase the convoluted current approaches the limiting value m a = 816 #A s 1/2.
The m-E curves of the simple ion transfer can be analysed using eqn. (4) [6,7]
md(w)--m D(w)~/2I D(w) 1/2 -- t exp [ - z F ( E - E e )/RT] (4)
m ki~onnm D(n) 1/2
l o ' . / A , ~
, i r ,
Y I Y
1 60© 2
4O¢ 0
20C -I
0.3 0.4 0.5 E/V Fig. i. Convolution (m) and logarithmic analysis(Y) of the convoluted current-potential curve of Cs + ion transfer from water to nitrobenzene at the polarization rate: (1) 0.005V s - l ; (2) 10V s -1. Composition of the aqueous phase 1 m M Cs + and 0.05 M LiC1; the nitrobenzene phase 0.05 M tetrabutylammonium tetraphenylborate. Area of interface ! 80 mm 2.
108
where the limiting convoluted current md(w ) = z F A D ( w ) l / 2 c ° ( w ) , z is the charge number of the transferred ion, A the interfacial area, D the diffusion coefficient of Cs + [D(w) in water, D(n) in the nitrobenzene phase], c o the bulk concentration, kiWn n the potential dependent rate constant of the ion transfer from water to nitrobenzene and E e the formal potential of the equilibrium ion partition between water and nitrobenzene.
However, the use of eqn. (4) in the case of Cs + ion transfer may not be justified as the ion transfer (I) itself is coupled to the association [9,10]:
ka Cs + + T P B - ~ C s T P B (Ia)
ka
The association constant K a -- 170 M - 1 (20oC) was obtained from the voltammetry of Cs + ion transfer in the presence and in the absence of T P B - in the nitrobenzene [9], while the extraction measurements [10] yield the value K a = 120 M - l (25oc). If excess T P B - ions are present, the association may be considered as the pseudo-first- order reaction characterized by the rate constant k ' a = kaC°pB - and kd, and by the equilibrium constant K~ = K~C°pB - . We can deduce from the theoretical treatment of the EC mechanism [3] that analysis of the experimental data is greatly simplified if the equilibrium in reaction (Ia) is quickly established. More specifically, if K a e x p [ - ( k a + k a ) A ] ~<0.01, eqn. (4) may be used with sufficient accuracy, but E should be replaced by E e - ( R T / z F ) l n ( 1 + K' ) . Because in our experiments the minimum value of A was 5 × 10 -4 s, the above inequality implies that the kinetics of the association (Ia) need not be taken into account unless (k'~ + kd)~< 104 s-1. In the subsequent analysis we assume that (k a + kd)~> 10 4 S - 1.
At low polarization rates the first term on the rhs of eqn. (4) reduces to zero [6] so that the transfer process is controlled by the diffusion of the ion and the plot of Y = log[(rn a - rn) / rn] vs. potential E, i.e. the logarithmic analysis is a straight line with a reciprocal slope of (59 /z) mV.
This is in fact the case of Cs + ion transfer at polarization rates < 0.5 V s -1 [1]. The logarithmic analysis at 5 mV s -~ (see plot 1 in Fig. 1) is a straight line with a reciprocal slope of 59 InV. It yields the half-wave potential El~ 2 = 0.413 V corre- sponding to m = 0.5 m d, from which E e = 0.404 V, provided that Dcs+ (w)/Dcs+ (n) = 2 [1]. From the limiting convoluted current m d = 816 #A s x/2 we obtain the value of the diffusion coefficient of Cs + ion in the aqueous phase Dcs+(w ) = 2.2 × 10 -9 m 2 s -1. The values of both E e and Dcs+(w ) obtained by the convolution analysis are in very good agreement with those obtained in ref. 1 by the Nicholson-Shain analysis.
For polarization rates > 0.5 V s - 1, the Cs + ion transfer is controlled in par t by the rate of the ion transfer" across the interface [1] and the logarithmic analysis declines from that corresponding to the diffusion-controlled process (cf. plot 2 in Fig. 1).
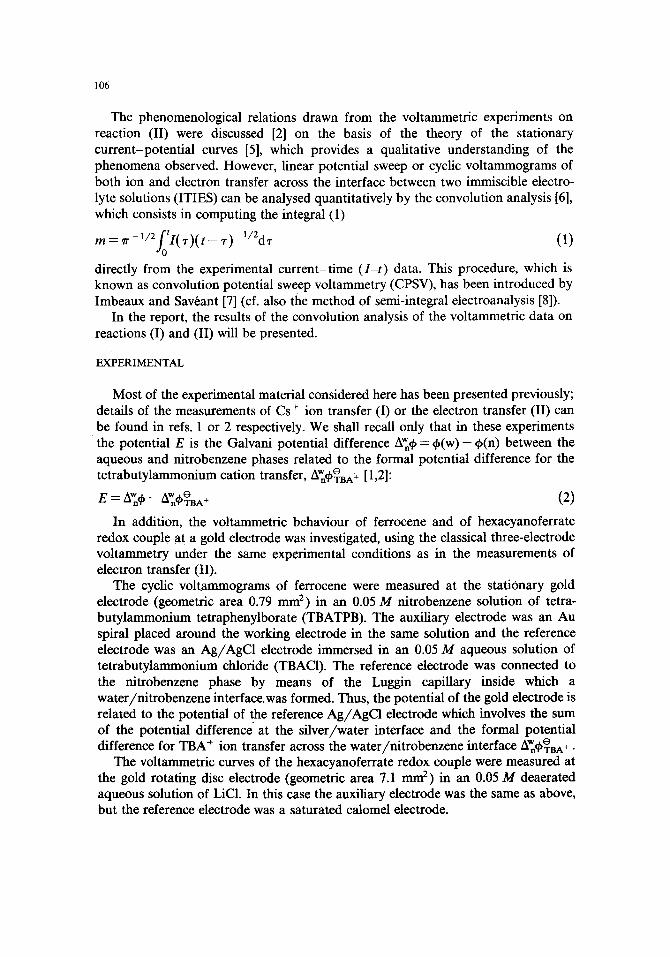
The potential dependences of the rate constant kiW~ 'n are shown in Fig. 2 for three different concentrations of Cs + ion in the aqueous phase. The data are the averages from measurements at the polarization rates 0.5, 1, 2, 5 and 10 V s-~, except for the
109
log ~Vonb
-3.0
-3.5
-4.0
! I ! / / / / / ~..,.,Tr---. 2 v / ,
. / " -UI I I I " / / / /
/ / / i /
/
0.35 0.40 0.45 E/V
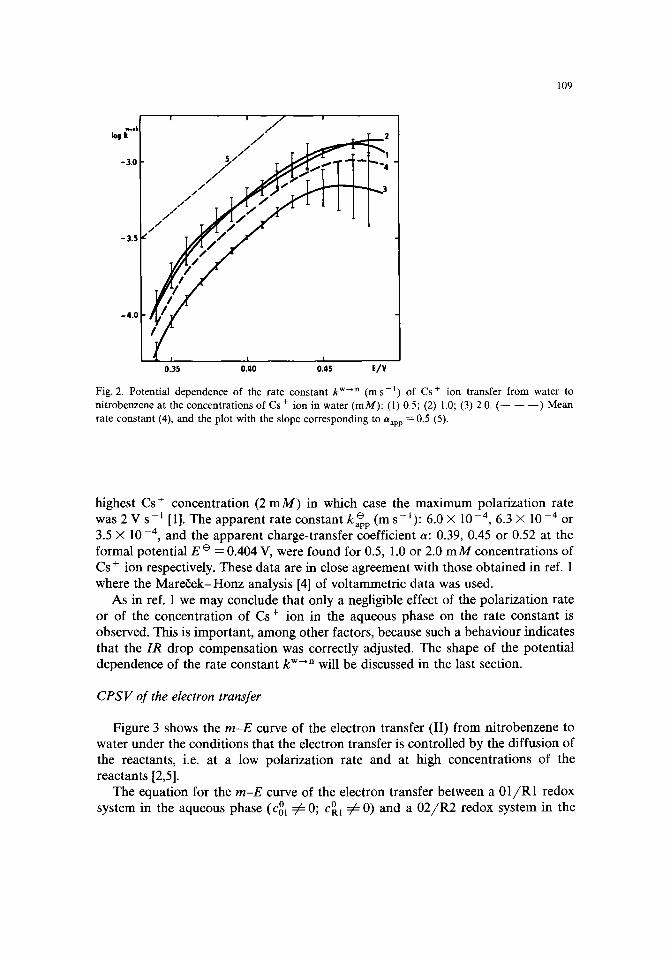
Fig. 2. Potential dependence of the rate constant k w~n ( m s -1) of Cs + ion transfer from water to nitrobenzene at the concentrations of Cs + ion in water (mM) : (l) 0.5; (2) 1.0; (3) 2.0. ( - - - - - - ) Mean rate constant (4), and the plot with the slope corresponding to Otap p ~ 0.5 (5).
highest Cs + concentration (2 m M ) in which case the maximum polarization rate was 2 V s - l [1]. The apparent rate constant ka~pp (m s- t ) : 6.0 X 10 -4, 6.3 X 10 -4 or 3.5 X 10⁻⁴, and the apparent charge-transfer coefficient a: 0.39, 0.45 or 0.52 at the formal potential E e = 0.404 V, were found for 0.5, 1.0 or 2.0 m M concentrations of Cs + ion respectively. These data are in close agreement with those obtained in ref. 1 where the Mare~ek-Honz analysis [4] of voltammetric data was used.
As in ref. 1 we may conclude that only a negligible effect of the polarization rate or of the concentration of Cs + ion in the aqueous phase on the rate constant is observed. This is important, among other factors, because such a behaviour indicates that the IR drop compensation was correctly adjusted. The shape of the potential dependence of the rate constant k w--'~ will be discussed in the last section.
CPSV of the electron transfer
Figure 3 shows the m-E curve of the electron transfer (II) from nitrobenzene to water under the conditions that the electron transfer is controlled by the diffusion of the reactants, i.e. at a low polarization rate and at high concentrations of the reactants [2,5].
The equation for the m-E curve of the electron transfer between a 01/R1 redox system in the aqueous phase (c°l =/: 0; c°l =/= 0) and a 02 /R2 redox system in the
110
non-aqueous phase (cO = 0; c ° =)a 0) is [6]
(md,Ol -- m)(md,R2 -- m) = Imd,O,md,R2 (md,R1 + m ) m n .w 0 0 nFAk CoICR1(md,R1 + m)m
-]- ( DRIDo2/DolDR2) 1/2 e x p [ - - n F ( E -- E ° ) /RT] (5)
where rod, i = nFAD~/2c °, n is the number of the electrons transferred in the reaction, k n-ow the potential-dependent rate constant of the electron transfer from nitroben- zene to water, E e the formal potential of the electron-transfer reaction and other symbols have the same meaning as in eqn. (4).
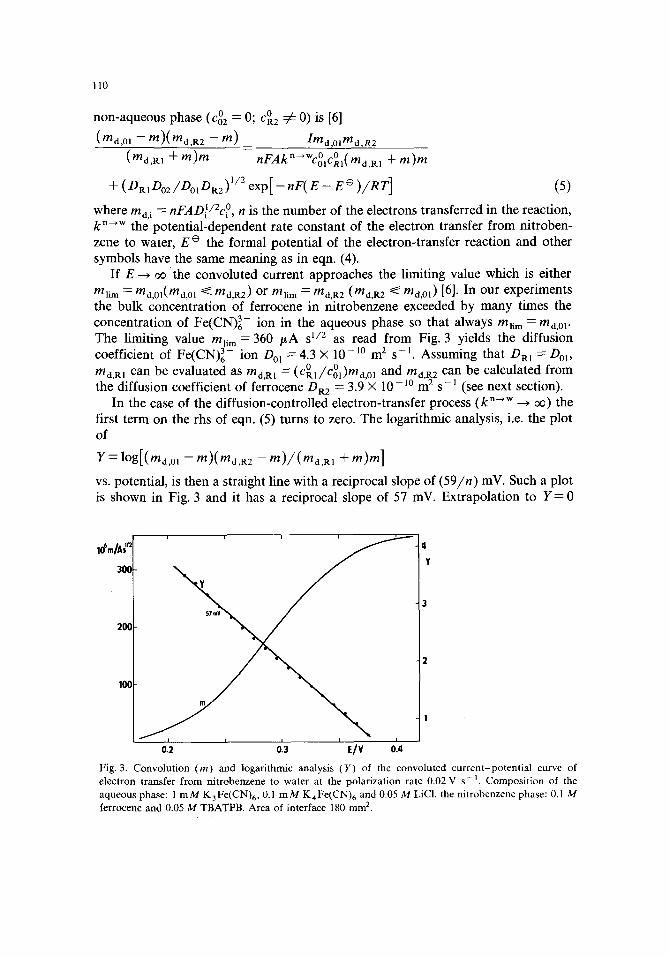
If E ~ oo the convoluted current approaches the limiting value which is either mli m = ma,m(rnd,ol ~ md,R.2) or mli m = md,R2 (md,R2 ~ md,01 ) [6]. In our experiments the bulk concentration o f ferrocene in nitrobenzene exceeded by many times the concentration of Fe(CN)63- ion in the aqueous phase so that always mnm = md,01- The limiting value mnm = 360 /zA s 1/2 as read from Fig. 3 yields the diffusion coefficient of Fe(CN) 3- ion D01 = 4.3 × 10 - l0 m 2 s - 1. Assuming that D R I ----- D m, rod,R1 can be evaluated as m d R1 = (cOl/cOl)rod01 and rn o RE can be calculated from the diffusion coefficient of ferrocene DR2 = 3.9'× 10-10 m ~ s-1 (see next section).
In the case of the diffusion-controlled electron-transfer process (k n- '* -~ oe) the first term on the rhs of eqn. (5) turns to zero. The logarithmic analysis, i.e. the plot of
Y = 1og[(md, m -- m)(md,R2 -- m)/(md,R1 + re)m]
vs. potential, is then a straight line with a reciprocal slope of (59 /n) mV. Such a plot is shown in Fig. 3 and it has a reciprocal slope of 57 inV. Extrapolation to Y = 0
lO~m/A#: 4 Y
30C
3
20(
2
100
I
0.2 0.3 E/V 0.4
Fig. 3. Convolution (m) and logarithmic analysis (Y) of the convoluted current-potential curve of electron transfer from nitrobenzene to water at the polarization rate 0.02 V s - I . Composition of the aqueous phase: 1 m M K3Fe(CN)6, 0.1 m M K4Fe(CN)6 and 0.05 M LiCI, the nitrobenzene phase: 0.1 M ferrocene and 0.05 M TBATPB. Area of interface 180 mm 2.
111
i , i
Y
3
o z ~ • e 2 o ~ e o
o ~ e o o o A ~
1
0.2 0 3 0.4 E /V
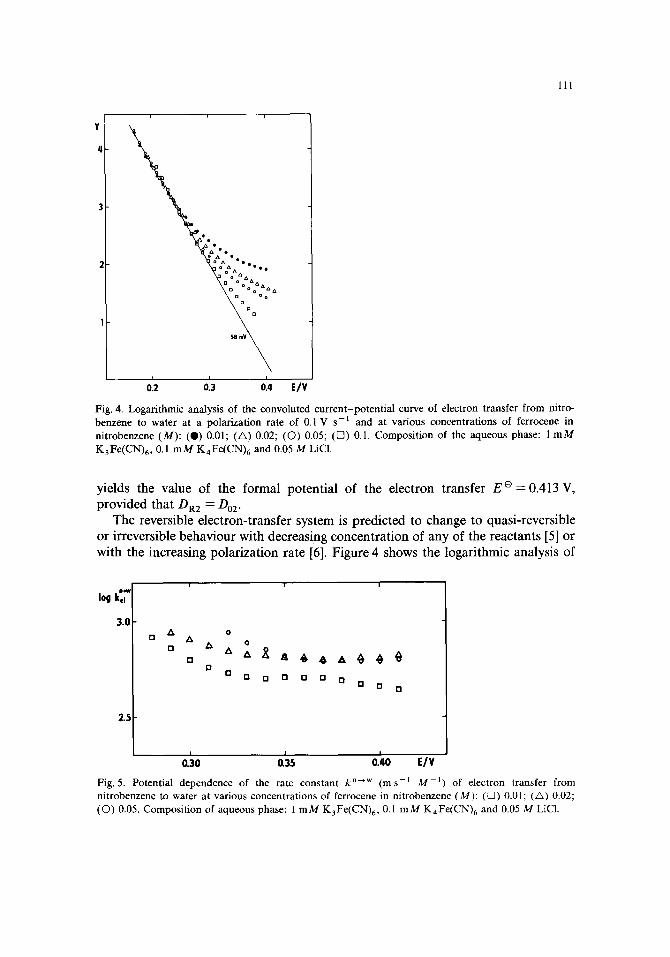
Fig. 4. Logarithmic analysis of the convoluted current-potent ia l curve of electron transfer from nitro- benzene to water at a polarization rate of 0.1 V s - ~ and at various concentrations of ferrocene in nitrobenzene (M): (O) 0.01; (A) 0.02; (O) 0.05; (V7) 0.1. Composit ion of the aqueous phase: 1 m M KaFe(CN)6 , 0.1 m M K4Fe(CN)6 and 0.05 M LiC1.
yields the value of the formal potential of the electron transfer E e =0.413V, provided that DR2 ---- 1)02.
The reversible dectron-transfer system is predicted to change to quasi-reversible or irreversible behaviour with decreasing concentration of any of the reactants [5] or with the increasing polarization rate [6]. Figure 4 shows the logarithmic analysis of
log kel
3 .0
2.5
A O
n A o
12 0 13 0 0 [] 0 0 [] D [3
I I I
0.30 0.35 0.40 E / V
Fig. 5. Potential dependence of the rate constant k n~w ( m s - I M - j ) of electron transfer from nitrobenzene to water at various concentrations of ferrocene in nitrobenzene (M): ([]) 0.01; (/x,) 0.02; (C)) 0.05. Composit ion of aqueous phase: 1 m M K 3 Fe(CN)6, 0.1 m M K 4 Fe(CN)6 and 0.05 M LiCl.
112
log k"e~ w
3J0
2.5
A [] D ~ D O O D D O 0
A A A A A A A A
0 0 0
0 0 0 0 0 0 0 0 0 0
I i I
0.30 0.35 0.40 E/V
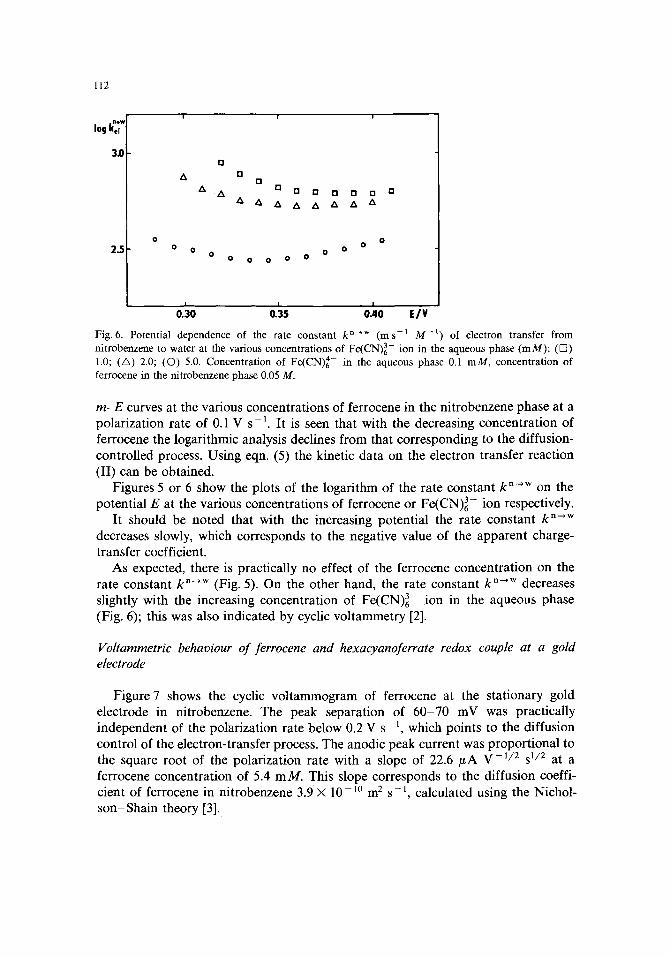
Fig. 6. Potential dependence of the rate constant k n~w (ms -t M -I) of electron transfer from nitrobenzene to water at the various concentrations of Fe(CN)63- ion in the aqueous phase (mM): ([2) 1.0; (A) 2.0; (©) 5.0. Concentration of Fe(CN) 4- in the aqueous phase 0.1 mM, concentration of ferrocene in the nitrobenzene phase 0.05 M.
m - E curves at the various concentrations of ferrocene in the nitrobenzene phase at a polarization rate of 0.1 V s-1. It is seen that with the decreasing concentration of ferrocene the logarithmic analysis declines from that corresponding to the diffusion- controlled process. Using eqn. (5) the kinetic data on the electron transfer reaction (II) can be obtained.
Figures 5 or 6 show the plots of the logarithm of the rate constant k n--,w on the potential E at the various concentrations of ferrocene or Fe(CN)~- ion respectively.
It should be noted that with the increasing potential the rate constant k n-+w decreases slowly, which corresponds to the negative value of the apparent charge- transfer coefficient.
As expected, there is practically no effect of the ferrocene concentration on the rate constant k n--+w (Fig. 5). On the other hand, the rate constant k n-,w decreases slightly with the increasing concentration of Fe(CN)63- ion in the aqueous phase (Fig. 6); this was also indicated by cyclic voltammetry [2].
Voltammetric behaviour of ferrocene and hexacyanoferrate redox couple at a gold electrode
Figure 7 shows the cyclic voltammogram of ferrocene at the stationary gold electrode in nitrobenzene. The peak separation of 60-70 mV was practically independent of the polarization rate below 0.2 V s-1, which points to the diffusion control of the electron-transfer process. The anodic peak current was proportional to the square root of the polarization rate with a slope of 22.6 /+A V -1/2 s 1/2 at a ferrocene concentration of 5.4 mM. This slope corresponds to the diffusion coeffi- cient of ferrocene in nitrobenzene 3 .9× 10-10 m 2 s - t , calculated using the Nichol- son-Shain theory [3].
113
lO
I/~uA
012 0.4 o16
IhA
o
-IC
E/V -20
I I I
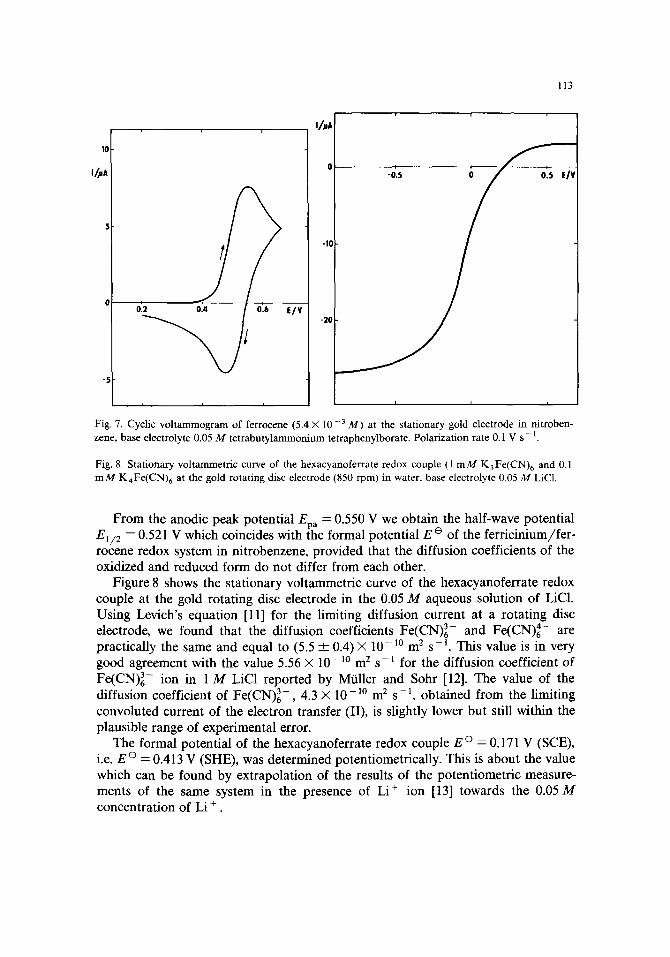
Fig. 7. Cyclic voltammogram of ferrocene (5.4 × 10 -3 M) at the stationary gold electrode in rfitroben- zene, base electrolyte 0.05 M tetrabutylammonium tetraphenylborate. Polarization rate 0.1 V s - 1.
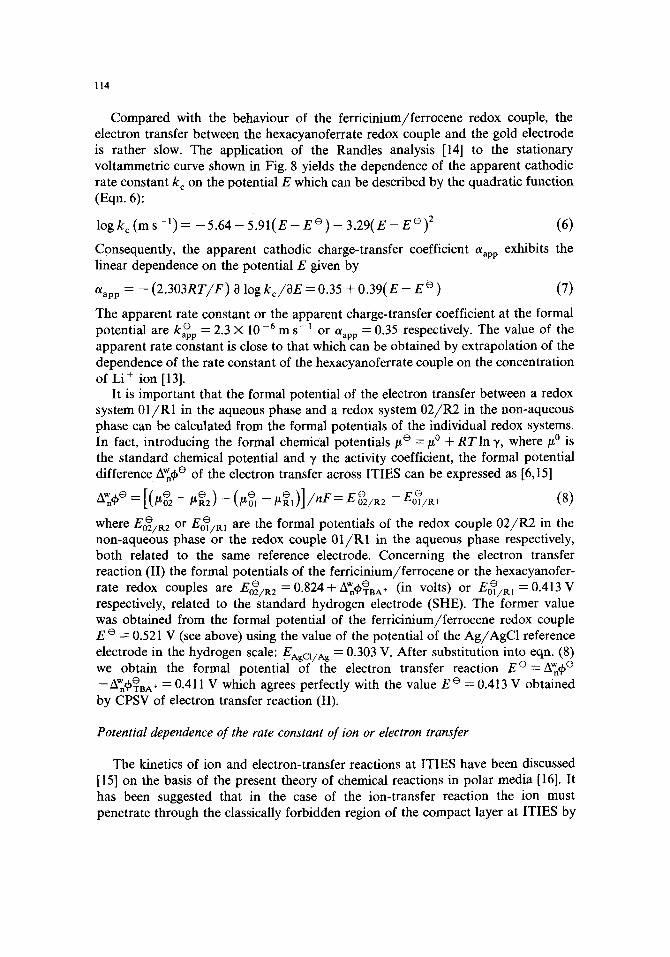
Fig. 8. Stationary voltammetric curve of the hexacyanoferrate redox couple (1 m M K3Fe(CN)6 and 0.1 m M KaFe(CN)6 at the gold rotating disc electrode (850 rpm) in water, base electrolyte 0.05 M LiC1.
From the anodic peak potential Epa = 0.550 V we obtain the half-wave potential El~ 2 = 0.521 V which coincides with the formal potential E e of the ferricinium/fer- rocene redox system in nitrobenzene, provided that the diffusion coefficients of the oxidized and reduced form do not differ from each other.
Figure 8 shows the stationary voltammetric curve of the hexacyanoferrate redox couple at the gold rotating disc electrode in the 0.05 M aqueous solution of LiC1. Using Levich's equation [11] for the limiting diffusion current at a rotating disc electrode, we found that the diffusion coefficients Fe(CN) 3- and Fe(CN)~- are practically the same and equal to (5.5 ___ 0.4)X 10 -]° m 2 s - l . This value is in very good agreement with the value 5.56 X 10 - lo m 2 s - ~ for the diffusion coefficient of Fe(CN) 3- ion in 1 M LiC1 reported by MOiler and Solar [12]. The value of the diffusion coefficient of Fe(CN) 3- , 4.3 X 10 - l ° m 2 s -1, obtained from the limiting convoluted current of the electron transfer (II), is slightly lower but still within the plausible range of experimental error.
The formal potential of the hexacyanoferrate redox couple E e = 0.171 V (SCE), i.e. E e = 0.413 V (SHE), was determined potentiometrically. This is about the value which can be found by extrapolation of the results of the potentiometric measure- ments of the same system in the presence of Li + ion [13] towards the 0.05 M concentration of Li +.
114
Compared with the behaviour of the ferricinium/ferrocene redox couple, the electron transfer between the hexacyanoferrate redox couple and the gold electrode is rather slow. The application of the Randles analysis [14] to the stationary voltammetric curve shown in Fig. 8 yields the dependence of the apparent cathodic rate constant k c on the potential E which can be described by the quadratic function (Eqn. 6):
log k c (m s - ' ) = - 5.64 - 5.91(E - E e ) _ 3.29(E - E e )2 (6)
Consequently, the apparent cathodic charge-transfer coefficient 0tap p exhibits the linear dependence on the potential E given by
Otap p = - - (2.303RT/F) 8 log kc /SE = 0.35 + 0.39(E - E e ) (7)
The apparent rate constant or the apparent charge-transfer coefficient at the formal potential a r e kaepp = 2.3 X 1 0 - 6 m S -I o r otap p = 0.35 respectively. The value of the apparent rate constant is close to that which can be obtained by extrapolation of the dependence of the rate constant of the hexacyanoferrate couple on the concentration of Li + ion [13].
It is important that the formal potential of the electron transfer between a redox system 01/R1 in the aqueous phase and a redox system 02/R2 in the non-aqueous phase can be calculated from the formal potentials of the individual redox systems. In fact, introducing the formal chemical potentials tte =/x ° + RTln y, where/x ° is the standard chemical potential and 1' the activity coefficient, the formal potential difference A~¢ e of the electron transfer across ITIES can be expressed as [6,15]
AW~q~ e = [(/x~ --/x~2 ) -- (/x0 e, -- i.t~,)]/nF= Eoez/R2 -- Eg/R, (8)
where E~/Rz or E~/R1 are the formal potentials of the redox couple 02 /R2 in the non-aqueous phase or the redox couple 01/R1 in the aqueous phase respectively, both related to the same reference electrode. Concerning the electron transfer reaction (II) the formal potentials of the ferricinium/ferrocene or the hexacyanofer-
@ w O = /~n~TBA + or Eol/R I = 0.413 V rate redox couples a r e E~Z/R 2 0.824 + (in volts) e
respectively, related to the standard hydrogen electrode (SHE). The former value was obtained from the formal potential of the ferricinium/ferrocene redox couple E e = 0.521 V (see above) using the value of the potential of the Ag/AgC1 reference electrode in the hydrogen scale: EAga/Ag = 0.303 V. After substitution into eqn. (8) we obtain the formal potential of the electron transfer reaction E e = AWq, e - - W e Z~q, TBA+ = 0.411 V which agrees perfectly with the value E e = 0.413 V obtained by CPSV of electron transfer reaction (II).
Potential dependence of the rate constant of ion or electron transfer
The kinetics of ion and electron-transfer reactions at ITIES have been discussed [15] on the basis of the present theory of chemical reactions in polar media [16]. It has been suggested that in the case of the ion-transfer reaction the ion must penetrate through the classically forbidden region of the compact layer at ITIES by
115
quantum-mechanical tunnelling. This idea might be objected to since the probability of tunnelling can be expected to be very low owing to the large mass of the transferred ion. Although the probability of tunnelling does not depend only on the particle mass but also on the height and width of the potential-energy barrier, which are unknown, the classical path over this potential-energy barrier is a reasonable alternative of ion transfer through the compact layer, i.e. from the plane of closest approach in one phase to the plane of closest approach in the other.
Compared with ion tunnelling, where the preexponential factor in the rate equation is reduced, the classical motion of the ion inside the compact layer results in a contribution to the activation energy. Using the same formalism as for the solvent (i.e. the harmonic aigproximation) and assuming that the gradient of the electrical potential inside the compact layer is constant in the direction of the motion, the expression for the activation energy takes the form of eqn. (13) in ref. 15.
In the normal region of transition (-~, < A J* < X) the rate constant of the ion transfer from the aqueous to the non-aqueous phase, kiW~ n, is given by eqn. (9):
In k W; " + zVdPrp(W)/RT• In k t + ( A J * / R T ) ( 0 . 5 + AJ*/4X) (9)
where A J* practically coincides with the change in the electrochemical Gibbs energy AG* during the one-ion transfer [15],
A J* ~ AG* = z F ( E - E ° +~rp(W)- d~rp(n)) (10)
k t = Z e x p ( - ) t / 4 R T ) is the true rate constant and h is the reorganization energy of the classical subsystem which may involve a contribution from the reorganization of the ion as a whole. The quantities q,w(w) or q%(n) are the electrical potentials at the planes of the closest approach (the reaction planes) in the aqueous or non-aqueous phases respectively, related to the electrical potentials if(w) or q~(n) in the bulk of the respective phases.
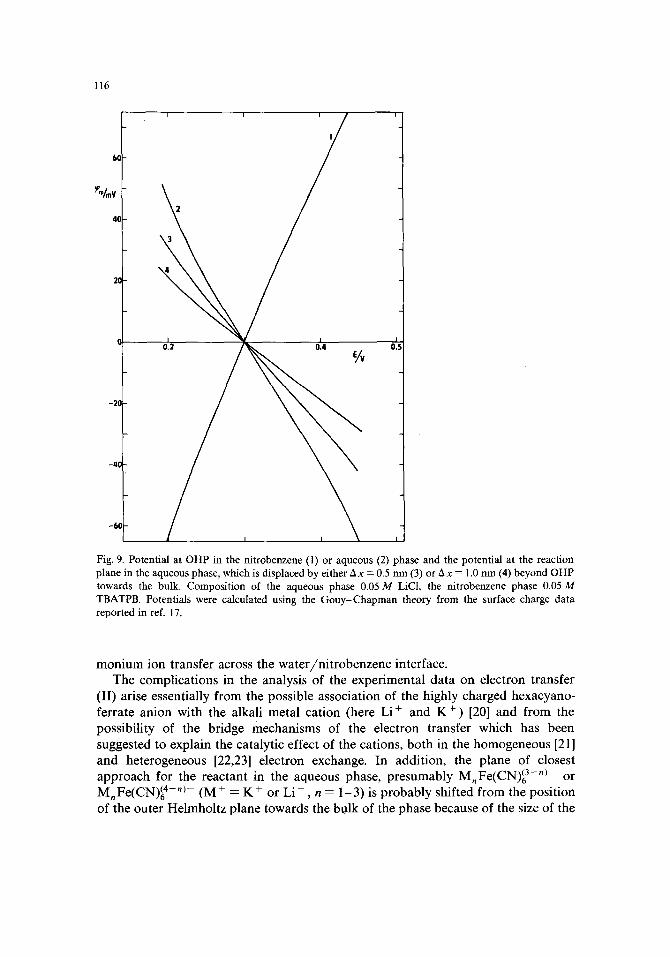
We assume that in both phases the plane of closest approach for Cs + ion coincides with the outer Helmholtz plane. The potentials q~2(w) or ~2(n) at outer Helmholtz planes in the aqueous or nitrobenzene phase respectively, were calculated from the capacity data [17] using the Gouy-Chapman theory and they are plotted vs. the potential E in Fig. 9.
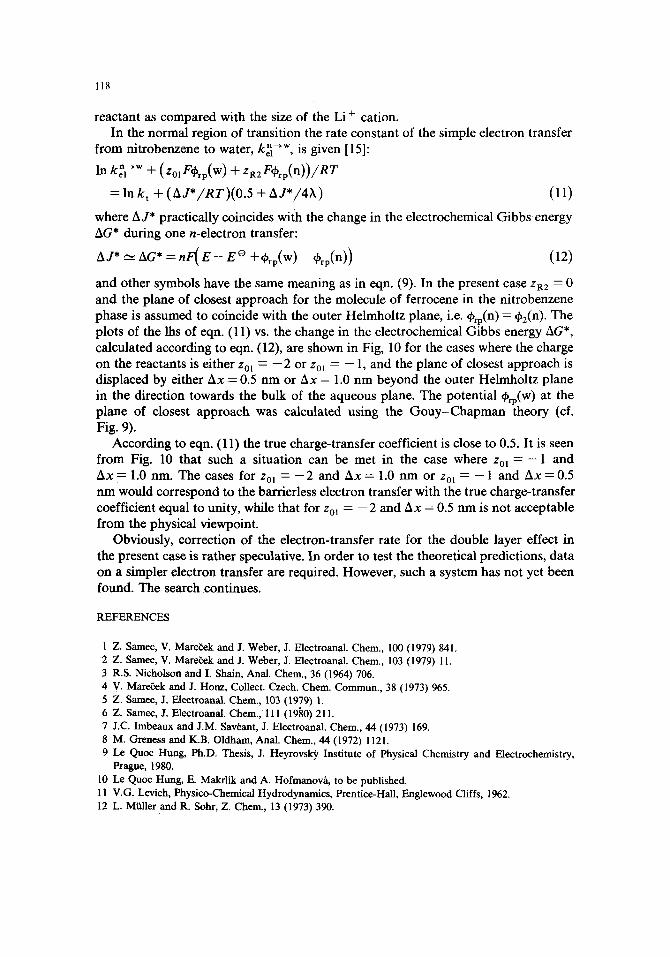
Table 1 compares the dependence of the rate constant kiWn n o n the potential E (cf. Fig. 2) with the dependence of the rate constant corrected for the double-layer effect (i.e. of the lhs of eqn. 9) on AG* calculated using eq. (10). It should be noted that neither AG* nor the corrected rate constant varies with the potential E. The former independence may be expected from the negligible change of the potential drop across the compact layer with the potential E [ 17,18]. If, however, AG* does not change with the potential E it follows from eqn. (9) that the corrected rate constant is also constant, which is actually the case. Consequently, the observed potential dependence of the rate constant kiWn n of Cs + ion transfer (Fig. 2, Table 1) arises from the indirect effect of the potential E through the double-layer structure. Gavach et al. [19] reached a similar conclusion in the case of the tetraalkylam-
116
q.v
\
0.2 /~b~ 0.4 0,5
Fig. 9. Potential at OHP in the nitrobenzene (1) or aqueous (2) phase and the potential at the reaction plane in the aqueous phase, which is displaced by either Ax = 0.5 nm (3) or Ax = 1.0 nm (4) beyond OHP towards the bulk. Composition of the aqueous phase 0.05 M LiCl, the nitrobenzene phase 0.05 M TBATPB. Potentials were calculated using the Gouy-Chapman theory from the surface charge data reported in ref. 17.
monium ion transfer across the water/nitrobenzene interface. The complications in the analysis of the experimental data on electron transfer
(II) arise essentially from the possible association of the highly charged hexacyano- ferrate anion with the alkali metal cation (here Li + and K +) [20] and from the possibility of the bridge mechanisms of the electron transfer which has been suggested to explain the catalytic effect of the cations, both in the homogeneous [21] and heterogeneous [22,23] electron exchange. In addition, the plane of closest approach for the reactant in the aqueous phase, presumably MnFe(CN)(63-nl or MnFe(CN)(6 4 . m - (M + = K + or Li +, n = 1-3) is probably shifted from the position of the outer Helrnholtz plane towards the bulk of the phase because of the size of the
l l 7
T A B L E 1
Potent ia l dependence of the ra te cons tan t k iWn n (m s - 1 ) of Cs + ion t ransfer f rom wa te r to n i t robenzene
and its correct ion for the double- layer effect
AG* E/V F / V log kiW~ n '~ log kiW~ 'n + q~2(w)/0.059
0.340 -- 0.103 -- 4.06 -- 4.32
0.350 -- 0.103 - 3.87 -- 4.21
0.360 -- 0.102 -- 3.72 -- 4.13
0.370 -- 0.101 -- 3.61 -- 4.08
0.380 -- 0.101 -- 3.51 -- 4.05
0.390 -- 0.100 - 3.42 -- 4.03
0.400 -- 0.100 -- 3.34 -- 4.02
0.410 -- 0.099 -- 3.26 -- 4.01
0.420 -- 0.099 - 3.18 -- 4.02
0.430 -- 0.100 -- 3.12 -- 4.04
0.440 -- 0.102 -- 3.02 -- 4.08
a M e a n f rom Fig. 2.
| I I I I
D
~ 3.0 N &
U
2.
I I I I I - 0 . 1 2 - 0 . 1 0 - 0 . 0 8
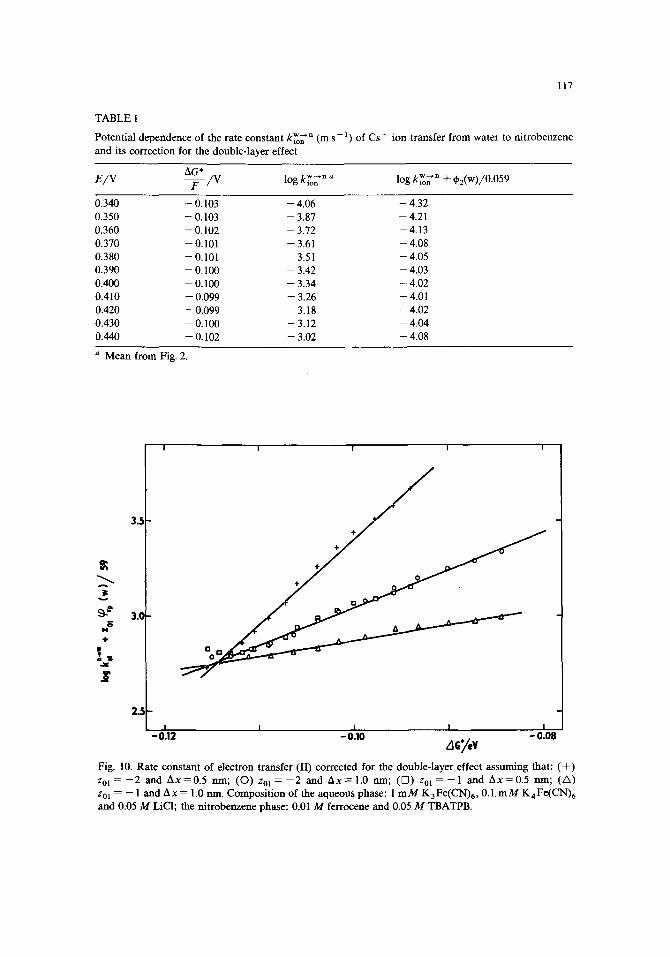
AGy, v Fig. 10. Ra te cons tan t of e lectron t ransfer ( I I ) correc ted for the double- layer effect a ssuming that : ( + )
zol = - 2 and A x = 0 . 5 rim; ( O ) Zol = - 2 and A x = 1.0 rim; ( D ) zol = - - 1 an d A x = 0 . 5 rim; (/X)
Zo] = -- 1 and A x = 1.0 nm. Compos i t ion of the aqueous phase: l m M K 3 F e ( C N ) 6 , 0.1. m M K 4 F e ( C N ) 6
a n d 0.05 M LiC1; the n i t robenzene phase: 0.01 M ferrocene and 0.05 M TBATPB.
118
reactant as compared with the size of the Li + cation. I n the normal region of transit ion the rate constant of the simple electron transfer
f rom ni trobenzene to water, ke~ -~w, is given [15]:
In kenl - ~ + (zo, FePrp(W ) + zR2FqJrp(n))/RT
: I n k t + (AJ*//RT)(0.5 + AJ*//4)~) (11)
where A J* practically coincides with the change in the electrochemical Gibbs energy AG* during one n-electron transfer:
A J* "~ AG* : nF(E-- E @ -[-¢~rp(W)- ~rp(n)) (12)
and other symbols have the same meaning as in eqn. (9). In the present case zR2 = 0 and the plane of closest approach for the molecule of ferrocene in the ni t robenzene phase is assumed to coincide with the outer Helmhol tz plane, i.e. ~rp(n) = q~2(n). The plots of the lhs of eqn. (11) vs. the change in the electrochemical Gibbs energy AG*, calculated according to eqn. (12), are shown in Fig, 10 for the cases where the charge on the reactants is either z0~ = - 2 or z01 = - 1, and the plane of closest approach is displaced by either Ax = 0.5 n m or Ax = 1.0 nm beyond the outer Helmhol tz plane in the direction towards the bulk of the aqueous plane. The potential ~rp(W) at the plane of closest approach was calculated using the G o u y - C h a p m a n theory (cf. Fig. 9).
According to eqn. (11) the true charge-transfer coefficient is close to 0.5. It is seen f rom Fig. 10 that such a situation can be met in the case where z01 -- - 1 and A x = 1.0 nm. The cases for z01 = - 2 and A x = 1.0 nm or z01 -- - 1 and Ax = 0.5 n m would correspond to the barrierless electron transfer with the true charge-transfer coefficient equal to unity, while that for Zo~ = - 2 and Ax -- 0.5 n m is not acceptable f rom the physical viewpoint.
Obviously, correction of the electron-transfer rate for the double layer effect in the present case is rather speculative. In order to test the theoretical predictions, data on a simpler electron transfer are required. However, such a system has not yet been found. The search .continues,
REFERENCES
1 Z. Samec, V. Mare~ek and J. Weber, J. Electroanal. Chem., 100 (1979) 841. 2 Z. Samec, V. Mare~ek and J. Weber, J. Electroanal. Chem., 103 (1979) 11. 3 R.S. Nicholson and I. Shain, Anal. Chem., 36 (1964) 706. 4 V. Mare~ek and J. Honz, Collect. Czech. Chem. Commun., 38 (1973) 965. 5 Z. Samec, J. Electroanal. Chem., 103 0979) 1. 6 Z. Samec, J. Electroanal. Chem., 111 (1980) 211. 7 J.C. Imbeaux and J.M. Sav6ant, J. Electroanal. Chem., 44 (1973) 169. 8 M. Greness and K.B. Oldham, Anal. Chem., 44 (1972) 1121. 9 Le Quoc Hung, Ph.D. Thesis, J. Heyrovsk~, Institute of Physical Chemistry and Electrochemistry,
Prague, 1980. 10 Le Quoc Hung, E. Makrlik and A. Hofmanov~, to be published. 11 V.G. Levich, Physico-Chemical Hydrodynamics, Prentice-Hall, Englewood Cliffs, 1962. 12 L. Milller and R. Solar, Z. Chem., 13 (1973) 390.
119
13 L.M. Peter, W. Diirr, P. Bindra and H. Gerischer, J. Electroanal. Chem., 71 (1976) 31. 14 J.E.B. Randles, Can. J. Chem., 37 (1959) 238. 15 Z. Samec, J. Electroanal. Chem., 99 (1979) 197. 16 P.P. Schmidt in H.R. Thirsk (Senior Reporter), Specialist Periodical Report: Electrochemistry, Vol. 5,
The Chemical Society, London, 1975, p. 21. 17 Z. Samec, V. Mare~ek and D. Homolka, J. Electroanal. Chem, 126 (1981) 121. 18 M. Gros, S. Gromband and C. Gavach, J. Electroanal. Chem., 89 (1978) 29. 19 B. d'Epenoux, P. Seta, G. Amblard and C. Gavach, J. Electroanal. Chem., 99 (1979) 77. 20 W.A. Eaton, P. George and G.I.H. Hahania, J. Phys. Chem., 71 (1967) 2016 and 2022. 21 M. Shporer, G. Ron, A. Loevenstein and G. Navon, Inorg. Chem., 4 (1965) 361. 22 R.R. Dogonadze, J. Ulstrup and Yu.I. Kharkats, J. Electroanal. Chem., 39 (1972) 47. 23 V. Mare~ek, Z. Samec and J. Weber, J. Electroanal. Chem., 94 (1978) 169.