Embed Size (px)
Citation preview
1
Charge, diffusion, and current fluctuations of single-stranded DNA trapped in an MspA nanopore
Stephen J. Fleming1, Bo Lu1, Jene A. Golovchenko1,2*
1Department of Physics, Harvard University, Cambridge, MA 02138 USA 2School of Engineering and Applied Sciences, Harvard University, Cambridge, MA 02138 USA *Corresponding Author. To whom correspondence may be addressed. Email: [email protected]. Stephen Fleming and Bo Lu contributed equally to this work.
Condensed running title: Properties of trapped DNA in MspA pore
2
Abstract We report effective charges and diffusion constants of several different single-stranded DNA oligonucleotides trapped in an MspA nanopore. Nucleotide identity is found to have a substantial influence on effective charges and diffusion constants. These quantities are determined from escape time experiments for a DNA molecule attached to a NeutrAvidin molecule that, unlike the DNA, does not pass through the pore. Correlations are reported between oligonucleotide effective charges and current blockages, and between their diffusion constants and DNA-induced current blockage fluctuations. We also report an unanticipated source of current fluctuations that reflects a discrete blockage current level structure. We posit that this is associated with interactions between the NeutrAvidin molecule and the MspA nanopore.
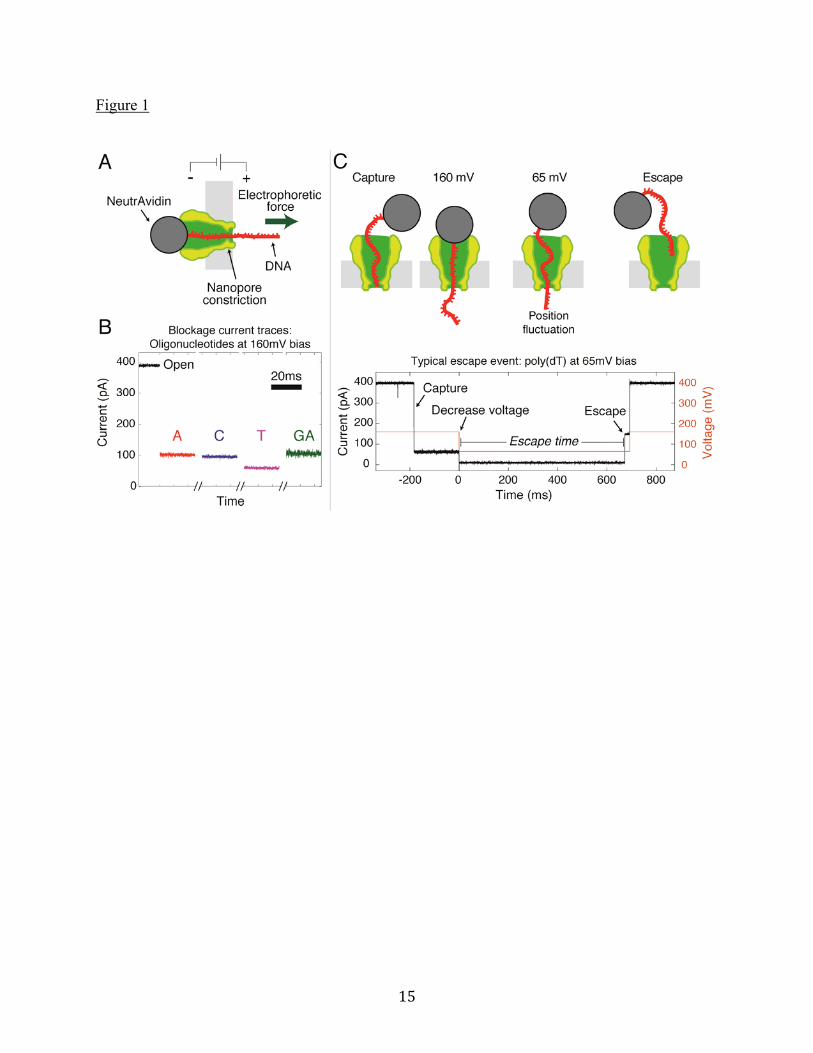
Introduction This work demonstrates how electrical measurements on a Mycobacterium smegmatis porin A [MspA] nanopore, in which protein-terminated single-stranded DNA [ssDNA] is trapped, can reveal fundamental and oligonucleotide-specific aspects of the interacting system of molecules. MspA is a pore-forming membrane protein that is well suited for single-molecule DNA experiments due to its geometry and stability (1–3). The narrowest constriction of MspA is about 1.2nm in diameter, barely large enough for ssDNA to pass through. When a single MspA pore is established in a lipid membrane and a voltage bias is applied across it, a detectable ionic current flows through the pore from the surrounding electrolyte solution. Nanopore DNA experiments measure the blockage of this ionic current when a DNA molecule is threaded through the pore. Figure 1A illustrates how a charged ssDNA molecule with a molecular stop attached can be threaded through and trapped in a nanopore by applying a voltage bias across the pore. In previous work, molecular stops such as an enzyme (4–8), bound protein (9–13), or a DNA double strand (2, 14, 15) have been used to assist in DNA trapping. The magnitude of the ssDNA-induced ionic current blockage depends on the sequence of ssDNA nucleotides near the pore’s constriction (4, 8, 16, 17). It has been determined that 4 - 5 nucleotides contribute to the measured current blockage at any given time (9). This is significantly larger than the two nucleotides that can be simultaneously accommodated within MspA’s narrowest constriction. A factor accounting for averaging over neighboring nucleotide contributions is the thermal motion of the ssDNA in the pore (10). Measurement of mean ionic current as ssDNA is advanced through the nanopore was first proposed (18) and later successfully used (6, 8, 16) to distinguish different nucleotides in nanopore sequencing. Current fluctuations during this process play a major role in the accuracy of the method, but they are not yet well studied or understood. Here, from measurements of nanopore currents, we determine effective charges, diffusion constants, current blockages, and ionic current fluctuations for ssDNA-NeutrAvidin complexes trapped in an MspA pore. We find that these experimental quantities show significant sensitivity to nucleotide identity.
3
Two different kinds of current fluctuations are observed. For small voltage bias (< 100mV) across the pore, “Gaussian white noise” is dominant. The magnitude of this noise depends on nucleotide identity. At high voltage bias (> 100mV), the current also contains telegraph-like current fluctuations between different current levels. We posit that these fluctuations are caused by the NeutrAvidin molecular stop interacting with the MspA pore rather than by the DNA in the pore’s constriction. In addition, we identify nucleotide-dependent correlations between effective charges and current blockages, as well as between current fluctuations and diffusion constants. These correlations provide insight into the physical processes involved. Recently, we presented a preliminary study focused on extracting the effective charge and diffusion constant of the single DNA oligonucleotide poly(dA) trapped in an MspA pore (10). A first-passage, drift-diffusion model was used to extract these constants. Here we significantly extend this study to a range of DNA oligonucleotides, and determine for the first time the intrinsic nanopore current fluctuations for each case. See references (10, 11, 15, 19–22) for earlier related work.
Materials and Methods The specific MspA protein mutant used in these experiments is the G75S/G77S/L88N/D90N/D91N/D93N/D118R/Q126R/D134R/E139K mutant of wild-type MspA, the same pore used in Lu et al. (10). Single-channel recordings of MspA in a lipid bilayer were carried out as previously described in the literature. Briefly, a lipid bilayer of 1,2-diphytanoyl-sn-glycero-3-phosphocholine [DPhPC] (Avanti Polar Lipids, Inc.) was established across a 30 micron diameter aperture in Teflon, separating two Teflon reservoirs containing 1M KCl and 10mM HEPES at pH 8.0. 1-hexadecene was used as the lipid solvent to form an annulus connecting the bilayer to the Teflon support. A single pore was characterized by approximately 2.3nS conductance at 100mV at 25°C. The correct orientation of the pore is essential for these measurements, and was ensured by measuring the ionic current as a function of voltage (details in Supporting Material, Figure S2). Electrical contact was made to the solution on each side of the membrane using Ag/AgCl pellet electrodes. Currents were measured using an Axopatch 200B (Molecular Devices, Sunnydale, CA) with a 10kHz filter, and recorded with a sampling frequency of 100kHz. The ssDNA oligonucleotides used in this work were purchased from Integrated DNA Technologies, Inc. (Coralville, IA) with dual HPLC purification. The sequences used here are (dA)27, (dC)27, (dT)27, and (dGdA)13(dG), all with 3’ biotinylation. The GA sequence was chosen as an alternative to homopolymer (dG) to avoid G-tetrad formation. Even so, it seems that G self-association still caused some notable differences during the (dGdA)13(dG) measurement (see Supporting Material F). ssDNA-NeutrAvidin complexes were formed by adding a dilute solution of ssDNA to a concentrated solution of NeutrAvidin (Thermo Scientific) dropwise, with rapid stirring. The final concentration of NeutrAvidin was three times that of the final concentration of ssDNA. The intention was to bias the complexes toward having only one

4
ssDNA attached to a given NeutrAvidin. During an experimental run, one of the DNA complexes was loaded at a concentration of approximately 10pM into the grounded side of the experimental setup. Escape experiments were performed using an Arduino Uno microcontroller to switch and cycle through the various bias voltages used. This is achieved by setting the external command voltage of the Axopatch 200B. The several millisecond delay time of the microcontroller does not influence the temporal resolution of our measurements. In general, 160mV was applied until an ssDNA-NeutrAvidin complex was captured in the pore (accompanied by a characteristic current blockage). The complex would be held in the pore for ~200ms at 160mV, and then the voltage would be reduced to a low clamping voltage in the range of 30mV to 70mV. When the complex escaped from the pore (characterized by a return to the full open-pore conductance), the voltage would be increased to 160mV to await another ssDNA-NeutrAvidin capture. All experiments were temperature controlled at 25.0°C, except for the set of experiments shown in Figure 6C, where experiments were performed at temperatures of 10.0°C, 15.0°C, 20.0°C, 25.0°C, 30.0°C, and 35.0°C.
Results and Discussion Here ssDNA-NeutrAvidin escape time experiments are described for (dA)27, (dC)27, (dT)27, and (dGdA)13(dG) ssDNA oligonucleotides (all 27 nucleotides long) escaping from an MspA pore. Effective charges and diffusion constants are extracted from these experiments for each oligonucleotide. Ionic blockage currents and their fluctuations are measured. Correlations are pointed out between the effective charges and the ionic current blockages, and between the diffusion constants and the blockage current fluctuations. We also present and discuss an unanticipated contribution to current fluctuations at high voltage bias. DNA escape times Figure 1A contains a schematic illustration of the experiment. The ssDNA, shown in red, is linked via a 3’ biotin to a NeutrAvidin protein shown in gray. This ssDNA-NeutrAvidin complex is captured in the MspA nanopore from solution by applying a 160mV bias across the pore via electrodes in the surrounding electrolyte. This orients the ssDNA in the pore in the same direction used in nanopore sequencing experiments, 5’ first (16). In Figure 1B, typical current traces are shown for the open pore current and for currents observed after ssDNA oligonucleotides have been trapped in the pore, blocking ionic current. Poly(dA), poly(dC), and poly(dGdA) have slightly different current blockage levels, while poly(dT) exhibits a far greater blockage. Note that poly(dGdA) has a noisier current trace than the other oligonucleotides. The effective charges and diffusion constants are deduced from “escape time” experiments illustrated in Figure 1C. The ssDNA-NeutrAvidin complex is first attracted, captured, and trapped in the MspA pore at 160mV bias. The bias is then reduced to a value such that the diffusion process leads to an eventual escape of the ssDNA back out through the pore on a time scale that can be easily measured (here 100μs to 5s). Figure 1C, bottom, shows one such event for a single poly(dT) molecule held at 65mV. The escape time is the time interval between the
5
voltage bias reduction and the return of the nanopore current to its open pore value (at the reduced bias), which occurs when the ssDNA leaves the MspA pore constriction. For the case shown, the escape time is 680ms. The escape time depends on the bias voltage and the statistical diffusion process, so the escape times will not be the same even for identical single-molecule experiments. With larger bias voltages applied during the escape process, the escape time is expected to increase. Escape time distributions are obtained from repeated (many hundreds to approximately a thousand) single-molecule events for each oligonucleotide at each of eight clamping voltages. Escape time distributions for each of the four oligonucleotides at 60mV bias are shown in Figure 2A. The first-passage model we use predicts an exponentially decaying distribution of escape times. The distribution of escape times in Figure 2A agrees with this prediction, except at long times where there are very few events. The origin of the infrequent, non-exponentially distributed events with long escape times has been discussed in previous work (11, 22, 23), and we believe these events are likely caused by infrequent, specific ssDNA-nanopore interactions in our case, but interactions between MspA and NeutrAvidin might also contribute. The exponential distribution function is characterized by a decay constant called the “average escape time.” Its value is determined by a least-square fit to each data set’s short-time exponential region, as explained in Supporting Material A. The average escape times depend on both oligonucleotide identity and the applied bias voltage, and they are plotted as data points in Figure 2B. Extraction of effective charges and diffusion constants The dotted curves in Figure 2B are least-square fits of our first-passage dynamical model for the voltage dependence of the average escape time for each oligonucleotide to the data points in Figure 2B. The fits have been obtained for each oligonucleotide by adjusting a voltage-independent effective charge and diffusion constant, which are the only parameters in the drift-diffusion model. (Details of the first-passage model are contained in Supporting Material B.) The agreement obtained is excellent over many orders of magnitude of average escape times, as is evident from Figure 2B. In the model, ssDNA is taken to be a rod of charge diffusing in one dimension through the pore. The effective charge per base, Qeff , is given by Qeff eff / b0, where eff is the effective linear
charge density of the ssDNA in MspA, and b0 is the distance between bases, taken to be 0.5nm
(24). The effective charge per base, Qeff , and effective charge density, eff , take into account
both the force from the electric field acting on the negatively-charged ssDNA phosphate backbone and the opposing force of electro-osmotic drag acting on the ssDNA, both of which are proportional to the applied voltage, V . The electrophoretic driving force used in the model can then be written as F effV , which includes both of these forces. When discussing diffusion
constants, we normalize their values to D0 3.311010 m2 / s, which is the diffusion constant of
a 1.5nm diameter sphere (the approximate Kuhn length of ssDNA used in this study (25)) freely diffusing in solution at 25°C.
6
The effective charges and diffusion constants for each oligonucleotide are obtained by fitting the model to the data in Figure 2B. The values for these constants are shown in Table 1. Error bars are determined from the fitting procedure. These values are reproducible in repeated experiments, as shown in Supporting Material C. The long average escape times measured for poly(dT) are explained by a high effective charge and a relatively small diffusion constant, both of which prolong the diffusive escape process. The experiments reported here were all carried out at pH 8.0, and so we would expect each phosphate of the ssDNA backbone to have a single negative charge, and the nucleobases themselves to be neutral (26). The observation of differences in effective charges for different nucleotides results from the fact that the effective charge in our model subsumes both the direct electric force on the ssDNA and the opposite viscous electro-osmotic drag force caused by the flow of positive potassium counter ions past the ssDNA in the pore (27). Effective charges less than a single electronic charge result from the sum of these two opposing forces. We demonstrate later that the correlation between effective charge and current blockage levels also supports this argument. Recent molecular dynamics simulations have obtained driving forces in agreement with the measured values we report in Table 1 (28). The extracted diffusion constants belong in principle to the entire ssDNA-NeutrAvidin complex trapped in the MspA nanopore. As an estimate for comparison, if we assume NeutrAvidin behaves as a 3nm radius sphere in free solution, its diffusion constant would be approximately 0.25 D0 at 25°C, which is similar to the value of the diffusion constant measured here for
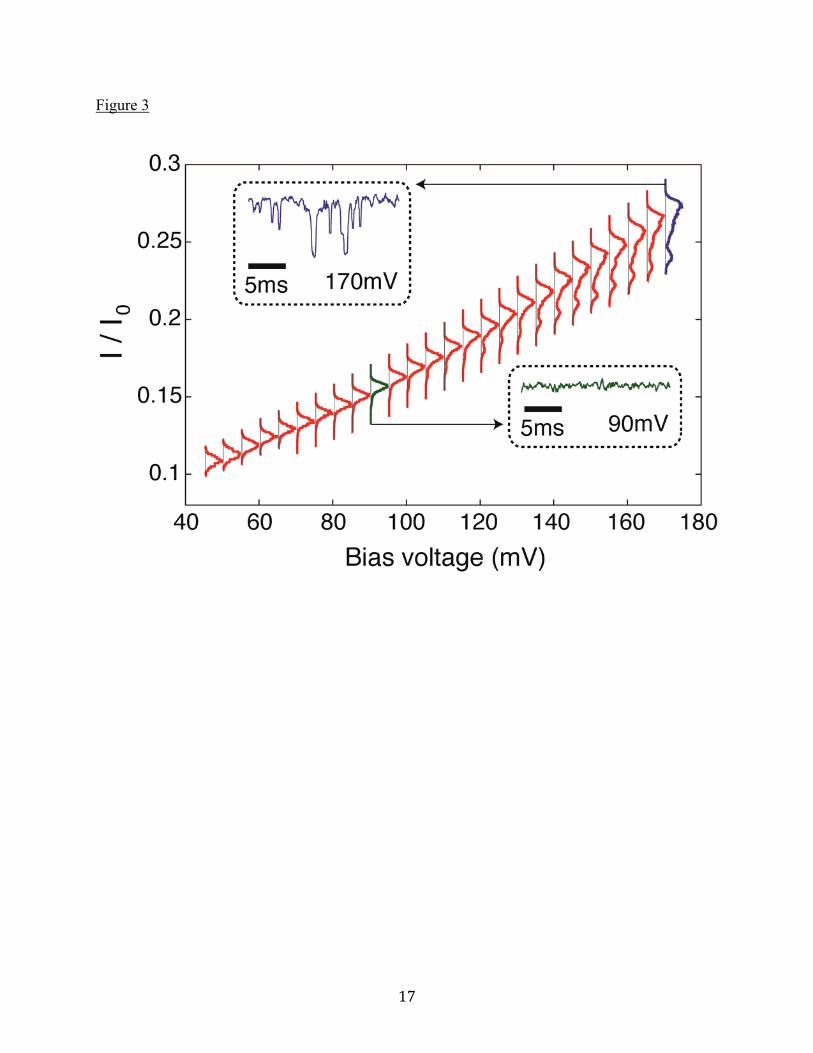
poly(dC) in MspA. Nevertheless, the diffusion constants clearly depend on ssDNA nucleotide identity, indicating that the NeutrAvidin does not completely dominate the ssDNA diffusion process. Additionally, the diffusion constants measured for poly(dA), poly(dT), and poly(dGdA) are all smaller than we would predict for free NeutrAvidin itself, indicating that the diffusion is indeed limited by the ssDNA and not the protein. Although the ssDNA is bound to NeutrAvidin, the flexibility of ssDNA should allow it to escape MspA’s constriction without commensurate motion of the NeutrAvidin (see schematic in Figure 1C, top). Current blockage and its fluctuations A study of the current signals measured while the ssDNA-NeutrAvidin complex is trapped in MspA is shown in Figure 3, using poly(dC) as an example. Plotted in the figure are the distributions of observed fractional current blockages as a function of bias voltage. The fractional current blockage I / I0 normalizes the blockage current I to the open pore current I0
at each voltage. (Note that I0 is itself a slightly nonlinear function of voltage. See Supporting
Material D.) We observe that I / I0 distributions have a dominant, most probable peak that
increases significantly as the bias voltage is increased. This behavior holds for all the oligonucleotides studied here and indicates that the ionic conductivity of the pore blocked by ssDNA is not constant but increases with increasing bias voltage. We attribute this effect to a reduction in the number of ssDNA bases between the NeutrAvidin and the constriction of MspA with increasing voltage due to an increased tension on ssDNA in this region. The increased tension straightens out the thermal entropic fluctuating geometry of the molecule in this region

7
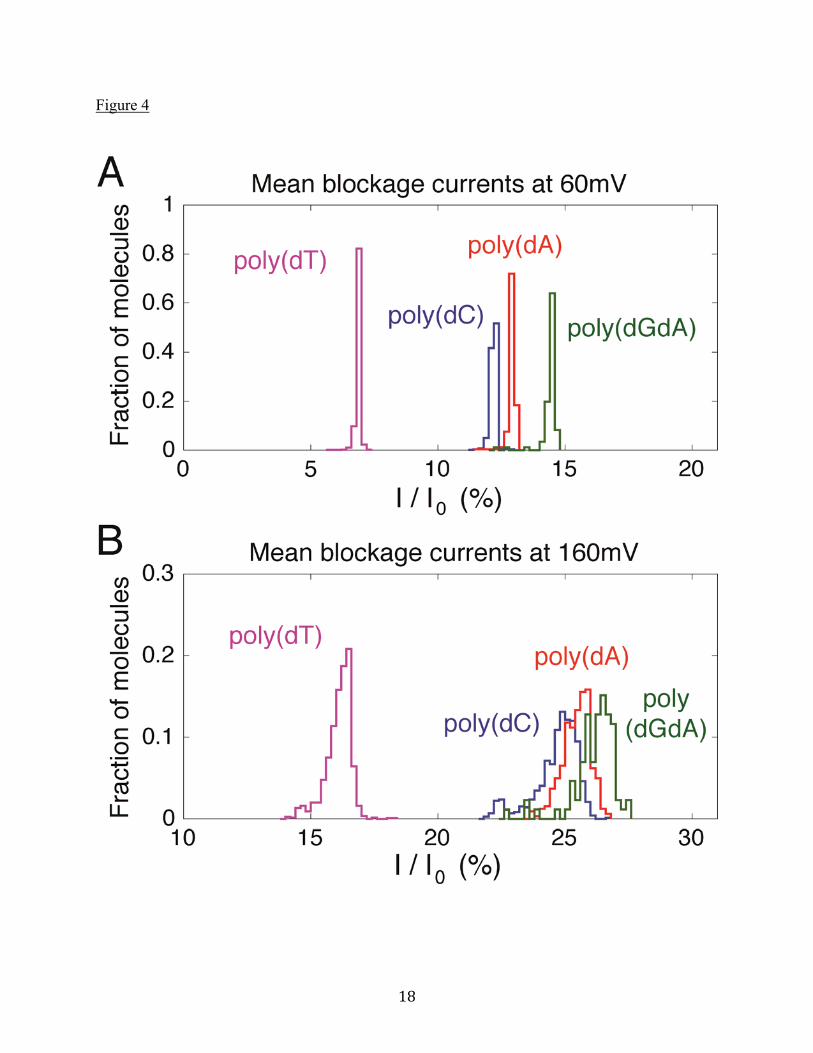
and decreases the number of bases there. Previously, ssDNA elongation by stretching in a nanopore was reported by Stoddart et al. in the α-hemolysin nanopore (29). For voltages below ~100 mV, the current distributions are approximately Gaussian with a single, central peak. For voltages greater than ~100mV, the current blockages develop an additional feature below the main peak that suggests the current fluctuates between two (or possibly more) current states, resulting in distribution functions with more than one peak. The additional peaks get stronger as the bias voltage is increased, as can be seen in the individual red and blue histograms in Figure 3. (These features are not observed at the same voltage for lipid alone, or for open MspA in lipid without the ssDNA-NeutrAvidin complex.) We hypothesize that this additional peak structure is caused by an additional current blockage that arises when the NeutrAvidin is in a tightly clamped configuration at the top of the MspA pore (shown schematically in Figure 1C, top, labeled 160mV) due to the high tension in the ssDNA at high bias. A discrete current state may occur e.g. because of prolonged electrostatic protein-protein interactions between the NeutrAvidin and the MspA that decreases the conductivity of the pore. Such interactions have previously been put forth as an explanation for broad, unresolved current distributions measured with NeutrAvidin and MspA (9). At low bias voltages, the NeutrAvidin tends to be farther away from the MspA pore more of the time due to the reduced tension in the DNA molecule (refer to Figure 1C, top, labeled 60mV). This reduces the likelihood of the NeutrAvidin being in the tightly clamped state, with its additional structure, and the spectrum of blockage currents becomes Gaussian. This picture is also consistent with the measured current fluctuation power spectra to be discussed shortly. An alternative explanation for the discrete peaks in current blockage at high bias is that the ssDNA has some specific, transient binding interaction with the MspA pore that manifests at high bias. Recent molecular dynamics simulations have indicated that specific interactions between ssDNA phosphates and the pore constriction can stabilize high-tension states of the ssDNA (28). However, the simulations show that these states have lifetimes of approximately one microsecond, while the states we observe in experiments last for milliseconds. Due to the long times that the oligonucleotides are trapped in the pore and the large number of molecules measured, it is possible to extract extremely accurate and sharp distribution functions for the average fractional blockage currents for each nucleotide. These are shown in Figure 4A at 60mV bias. Shown in Figure 4B are the much broader distributions obtained at 160mV bias for the same individual molecules. The values of I / I0 we report largely agree with those
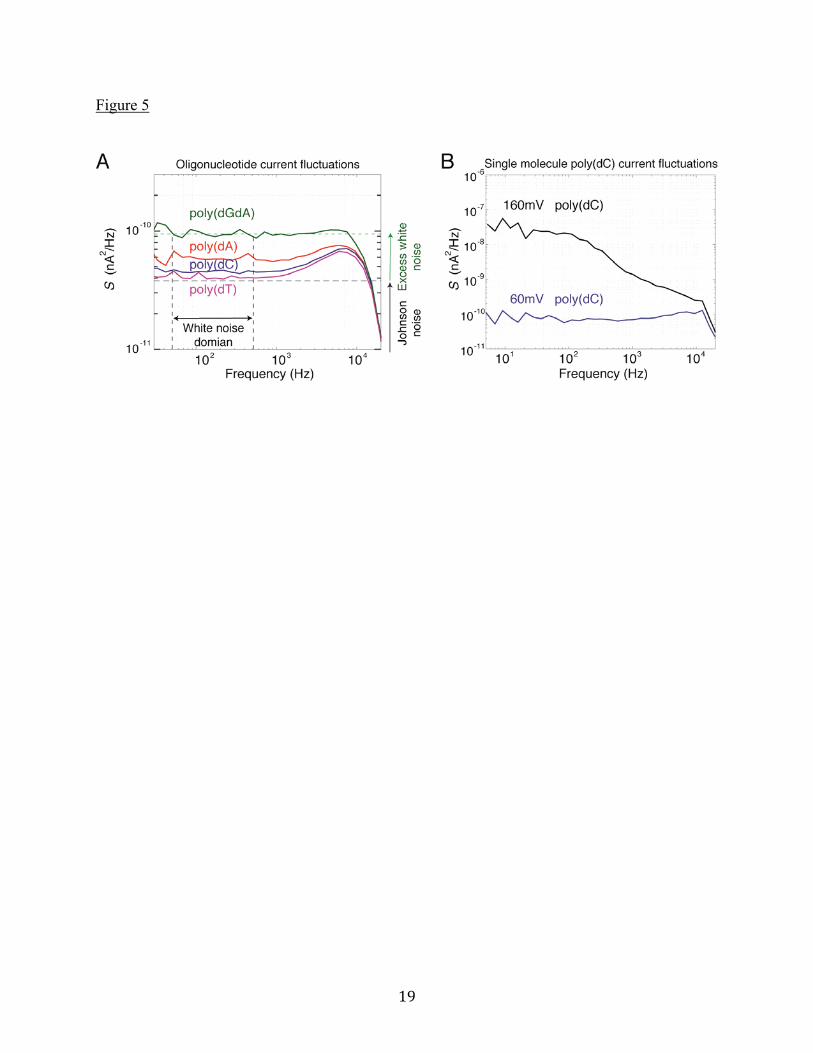
obtained by others at high voltage biases (see, for example, Manrao et al. (9)) using the M1-MspA mutant, which is different from the one used in this work (see Materials and Methods). Figure 5A shows the frequency power spectrum of current fluctuations obtained at 60mV bias for each oligonucleotide. Notice that they are all different and substantially “white” below about 1kHz. Figure 5B compares the power spectra for poly(dC) at biases of 60mV and 160mV. There is a significant increase in the low frequency part of the spectrum at the higher bias. The difference correlates with the current fluctuations for poly(dC) shown in Figure 3, in particular the enhancement expected at low frequencies associated with telegraph noise.
8
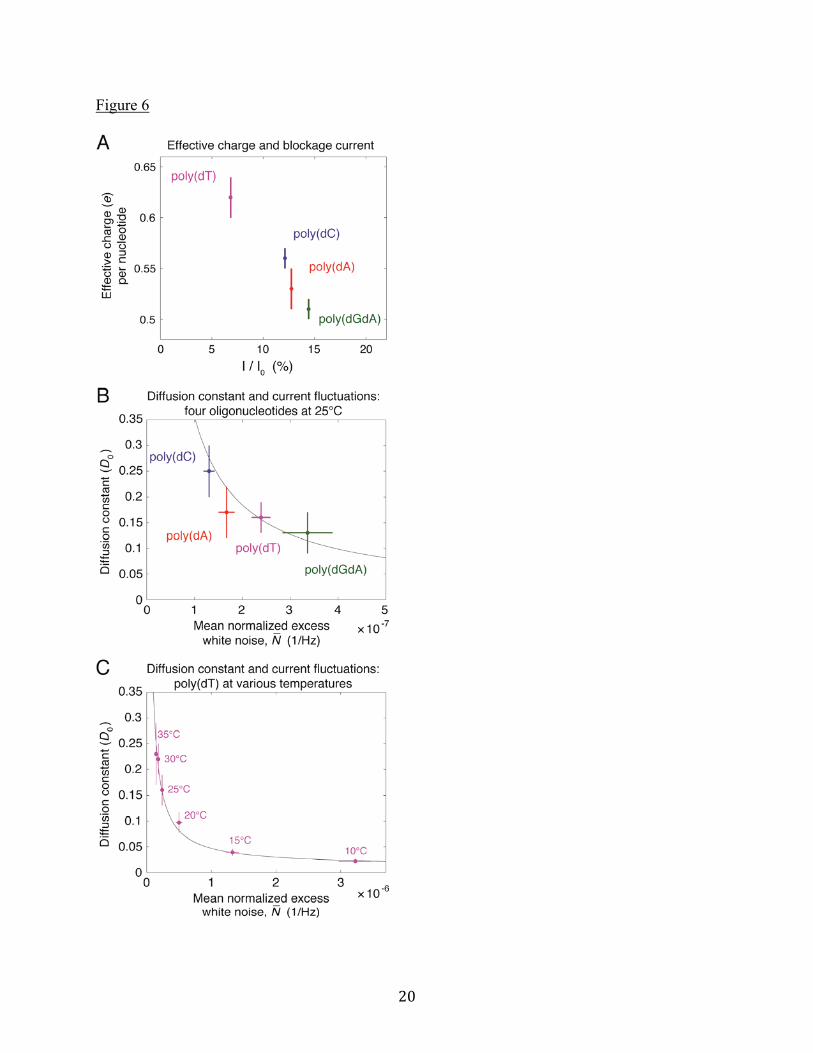
Correlation between current blockages and effective charges We now point out a relationship between effective charge and current blockage for each oligonucleotide at low bias voltage. We restrict the discussion to 60mV bias to avoid the complicated features attributed to NeutrAvidin-MspA interactions at higher voltages. Figure 6A shows the oligonucleotide-dependent relationship between the effective charge and the mean current blockage. The oligonucleotides with larger effective charges, i.e. electrophoretic driving forces, have larger blockages of ionic current (smaller I / I0). We note
that this correlation is consistent with our earlier discussion about the effective charge being related to the electro-osmotic force. Increased current blockage reduces the flow of counter ions through the pore and hence reduces the electro-osmotic contribution to the total force on the ssDNA, which increases the effective charge. Correlation between ionic current fluctuations and diffusion constants Figure 6B shows the diffusion constant for the different oligonucleotides at 60mV bias plotted against the “mean normalized excess white noise,” which we describe here. We use the notion of “excess white noise,” which is shown in Figure 5A on the right side vertical axis for poly(dGdA). By “excess white noise,” we mean the difference between the measured power spectral density and that expected from Johnson noise for the resistance of the pore blocked by a given oligonucleotide. The measured current fluctuation power spectrum, or current noise, S , presumably includes three contributions: [1] thermal Johnson noise, SJ , [2] noise caused by electrolyte ion number
fluctuations in the pore Sion , and [3] excess current fluctuations induced by the ssDNA itself,
SDNA. These contributions can be written as S SJ Sion SDNA. For solid state pores (30), the
OmpF membrane channel (31), and MspA (data not shown), the excess white noise in the open
pore, Sion , depends quadratically on the mean ionic current, Sion I2. This relationship is the
result of ion number fluctuations in the pore (32), i.e. a resistance fluctuation. We define
“normalized excess white noise” as N (S SJ ) / I2, where I is the mean ionic current for each
oligonucleotide. It follows that N (Sion SDNA ) / I2C SDNA / I
2, where C is approximately
constant and independent of nucleotide identity. We have divided by the square of the mean ionic current in order to show the oligonucleotide dependence of SDNA in N . Averaging N
over a 50Hz - 500Hz bandwidth yields N with dimension 1/Hz that we compare for all four oligonucleotides in Figure 6B. We hypothesize, inspired by the studies of particle-induced noise investigated by Bezrukov and colleagues (33–35), that current fluctuations caused by ssDNA in MspA should have the form SDNA (I )2 / D , where I is the range of current changes due to fluctuations in ssDNA
conformation or position inside MspA, and D is the diffusion constant of the ssDNA in MspA. A simple physical description of telegraph noise for a fluctuating current signal explains this
9
relation, as described in Supporting Material D. Since N is proportional to SDNA, we expect
N 1/ D . Figure 6B reveals that, for the four oligonucleotides measured at 25°C, the correlation is plausible (black line). Additional measurements were made for poly(dT) at 10°C, 15°C, 20°C, 25°C, 30°C, and 35°C. These measurements are plotted in Figure 6C, and confirm the N 1/ D correlation. Understanding the nucleotide-dependence of ionic current fluctuations when ssDNA is trapped in an MpsA nanopore could prove beneficial for sequencing experiments. For sequences with levels that are nearly indistinguishable based on blockage current alone, N provides additional information to aid in sequence determination.
Conclusion In this work, we report effective charges and diffusion constants deduced from escape time measurements of ssDNA oligonucleotides in an MspA nanopore. We show that nucleotide identity has a significant influence on these quantities, as well as on the observed current blockages and fluctuations. Correlations between the effective charges and the current blockages, as well as between the diffusion constants and the current fluctuations, are identified and found to be qualitatively in agreement with simple physical arguments. We observe the presence of an extra source of current fluctuations when ssDNA is held in the pore at high voltages, and we argue that this is caused by the molecular stop, here NeutrAvidin, interacting with the MspA nanopore. The various contributions to the current fluctuations display different power spectral densities: the current fluctuations associated with the molecular stop occur on long timescales measurable on our current amplifier and exhibit power spectra consistent with a telegraph noise process, while the current fluctuations associated with specific nucleotides in the constriction exhibit power spectra that are “white” within our observed frequency window of 1Hz to about 1kHz. Clearly, avoiding current fluctuations associated with the NeutrAvidin or another molecular stop, or attempting to obtain useful information from these fluctuations, can be important for improving accuracies in nanopore sequencing. These fluctuations can also provide microscopic information about specific interactions between the protein molecular stop and the nanopore. Nucleotide-specific current fluctuations, on the other hand, can be utilized as an additional source of information about the nucleotide sequence in the pore’s constriction. In future work, it would be helpful to further explore and clarify the microscopic physical phenomena reported here. Heteropolymer DNA would present a different landscape of potential energies than the homopolymer oligonucleotides studied here. Homopolymer measurements shed light on the behavior of ssDNA with a relatively flat potential energy landscape, and are only a first step toward understanding the properties of heteropolymer DNA in nanopore sequencing conditions. Molecular dynamics calculations over long enough timescales would provide further insight into the atomic scale processes that influence the parameters that describe the experimental results reported here. Given the already demonstrated success of nanopore

10
science in sequencing, and given the potential for other applications to nanoscale molecular science, such efforts would seem manifestly worthwhile.
Author Contributions S.J.F. and B.L. contributed equally to this work. B.L., S.J.F., and J.A.G. designed the experiment. S.J.F. performed the measurements. B.L. and S.J.F. analyzed data. S.J.F., J.A.G., and B.L. wrote the paper.
Acknowledgments The authors would like to thank Eric Brandin for help with preparation of the ssDNA-NeutrAvidin complexes, and Tamas Szalay for developing the Arduino analog-output functionality (MightIO board) used here for dynamic voltage bias control. In addition, the authors thank Daniel Branton and Lene Hau for advice and enlightening discussions. This research was supported by the National Genome Research Institute of the National Institutes of Health under award number R01HG003703. Stephen Fleming was supported by the National Science Foundation Graduate Research Fellowship under grant no. DGE1144152.
Supporting Citations Reference 36 appears in the Supporting Material.
References 1. Butler, T.Z., M. Pavlenok, I.M. Derrington, M. Niederweis, and J.H. Gundlach. 2008.
Single-molecule DNA detection with an engineered MspA protein nanopore. Proc. Natl. Acad. Sci. U.S.A. 105: 20647–20652.
2. Derrington, I.M., T.Z. Butler, M.D. Collins, E. Manrao, M. Pavlenok, M. Niederweis, and J.H. Gundlach. 2010. Nanopore DNA sequencing with MspA. Proc. Natl. Acad. Sci. U.S.A. 107: 16060–16065.
3. Faller, M., M. Niederweis, and G.E. Schulz. 2004. The structure of a mycobacterial outer-membrane channel. Science. 303: 1189–1192.
4. Olasagasti, F., K.R. Lieberman, S. Benner, G.M. Cherf, J.M. Dahl, D.W. Deamer, and M. Akeson. 2010. Replication of individual DNA molecules under electronic control using a protein nanopore. Nat. Nanotechnol. 5: 798–806.
5. Lieberman, K.R., G.M. Cherf, M.J. Doody, F. Olasagasti, Y. Kolodji, and M. Akeson. 2010. Processive replication of single DNA molecules in a nanopore catalyzed by phi29 DNA polymerase. J. Am. Chem. Soc. 132: 17961–17972.
6. Cherf, G.M., K.R. Lieberman, H. Rashid, C.E. Lam, K. Karplus, and M. Akeson. 2012. Automated forward and reverse ratcheting of DNA in a nanopore at 5-Å precision. Nat. Biotechnol. 30: 344–348.
7. Derrington, I.M., J.M. Craig, E. Stava, A.H. Laszlo, B.C. Ross, H. Brinkerhoff, I.C. Nova,
11
K. Doering, B.I. Tickman, M. Ronaghi, J.G. Mandell, K.L. Gunderson, and J.H. Gundlach. 2015. Subangstrom single-molecule measurements of motor proteins using a nanopore. Nat. Biotechnol. 33: 1073–1075.
8. Manrao, E.A., I.M. Derrington, A.H. Laszlo, K.W. Langford, M.K. Hopper, N. Gillgren, M. Pavlenok, M. Niederweis, and J.H. Gundlach. 2012. Reading DNA at single-nucleotide resolution with a mutant MspA nanopore and phi29 DNA polymerase. Nat. Biotechnol. 30: 349–353.
9. Manrao, E.A., I.M. Derrington, M. Pavlenok, M. Niederweis, and J.H. Gundlach. 2011. Nucleotide discrimination with DNA immobilized in the MspA nanopore. PLoS One. 6: e25723.
10. Lu, B., S. Fleming, T. Szalay, and J. Golovchenko. 2015. Thermal Motion of DNA in an MspA Pore. Biophys. J. 109: 1439–1445.
11. Wiggin, M., C. Tropini, V. Tabard-Cossa, N.N. Jetha, and A. Marziali. 2008. Nonexponential kinetics of DNA escape from alpha-hemolysin nanopores. Biophys. J. 95: 5317–5323.
12. Stoddart, D., A.J. Heron, E. Mikhailova, G. Maglia, and H. Bayley. 2009. Single-nucleotide discrimination in immobilized DNA oligonucleotides with a biological nanopore. Proc. Natl. Acad. Sci. U. S. A. 106: 7702–7707.
13. Purnell, R.F., K.K. Mehta, and J.J. Schmidt. 2008. Nucleotide identification and orientation discrimination of DNA homopolymers immobilized in a protein nanopore. Nano Lett. 8: 3029–3034.
14. Ashkenasy, N., J. Sánchez-Quesada, H. Bayley, and M.R. Ghadiri. 2005. Recognizing a single base in an individual DNA strand: A step toward DNA sequencing in nanopores. Angew. Chemie - Int. Ed. 44: 1401–1404.
15. Mathé, J., A. Aksimentiev, D.R. Nelson, K. Schulten, and A. Meller. 2005. Orientation discrimination of single-stranded DNA inside the alpha-hemolysin membrane channel. Proc. Natl. Acad. Sci. 102: 12377–12382.
16. Laszlo, A.H., I.M. Derrington, B.C. Ross, H. Brinkerhoff, A. Adey, I.C. Nova, J.M. Craig, K.W. Langford, J.M. Samson, R. Daza, K. Doering, J. Shendure, and J.H. Gundlach. 2014. Decoding long nanopore sequencing reads of natural DNA. Nat. Biotechnol. 32: 829–834.
17. Vercoutere, W., S. Winters-Hilt, H. Olsen, D. Deamer, D. Haussler, and M. Akeson. 2001. Rapid discrimination among individual DNA hairpin molecules at single-nucleotide resolution using an ion channel. Nat. Biotechnol. 19: 248–252.
18. Kasianowicz, J.J., E. Brandin, D. Branton, and D.W. Deamer. 1996. Characterization of individual polynucleotide molecules using a membrane channel. Proc. Natl. Acad. Sci. U.S.A. 93: 13770–13773.
19. Lathrop, D.K., E.N. Ervin, G. a. Barrall, M.G. Keehan, R. Kawano, M. a. Krupka, H.S. White, and A.H. Hibbs. 2010. Monitoring the escape of DNA from a nanopore using an alternating current signal. J. Am. Chem. Soc. 132: 1878–1885.
20. Wanunu, M., B. Chakrabarti, J. Mathé, D.R. Nelson, and A. Meller. 2008. Orientation-dependent interactions of DNA with an α-hemolysin channel. Phys. Rev. E. 77: 031904.
21. Bates, M., M. Burns, and A. Meller. 2003. Dynamics of DNA molecules in a membrane channel probed by active control techniques. Biophys. J. 84: 2366–2372.
22. Jetha, N.N., C. Feehan, M. Wiggin, V. Tabard-Cossa, and A. Marziali. 2011. Long dwell-time passage of DNA through nanometer-scale pores: kinetics and sequence dependence
12
of motion. Biophys. J. 100: 2974–2980. 23. Bian, Y., Z. Wang, A. Chen, and N. Zhao. 2015. Fluctuating bottleneck model studies on
kinetics of DNA escape from α-hemolysin nanopores. J. Chem. Phys. 143: 184908. 24. Chi, Q., G. Wang, and J. Jiang. 2013. The persistence length and length per base of single-
stranded DNA obtained from fluorescence correlation spectroscopy measurements using mean field theory. Physica A. 392: 1072–1079.
25. Smith, S.B., Y. Cui, and C. Bustamante. 1996. Overstretching B-DNA: The Elastic Response of Individual Double-Stranded and Single- Stranded DNA Molecules. Science (80-. ). 271: 795–799.
26. Verdolino, V., R. Cammi, B.H. Munk, and H.B. Schlegel. 2008. Calculation of pKa values of nucleobases and the guanine oxidation products guanidinohydantoin and spiroiminodihydantoin using density functional theory and a polarizable continuum model. J. Phys. Chem. B. 112: 16860–16873.
27. Bhattacharya, S., I.M. Derrington, M. Pavlenok, M. Niederweis, J.H. Gundlach, and A. Aksimentiev. 2012. Molecular dynamics study of MspA arginine mutants predicts slow DNA translocations and ion current blockades indicative of DNA sequence. ACS Nano. 6: 6960–6968.
28. Bhattacharya, S., J. Yoo, and A. Aksimentiev. 2016. Water Mediates Recognition of DNA Sequence via Ionic Current Blockade in a Biological Nanopore. ACS Nano. 10: 4644–4651.
29. Stoddart, D., L. Franceschini, A. Heron, H. Bayley, and G. Maglia. 2015. DNA stretching and optimization of nucleobase recognition in enzymatic nanopore sequencing. Nanotechnology. 26: 84002.
30. Hoogerheide, D.P., S. Garaj, and J. a. Golovchenko. 2009. Probing surface charge fluctuations with solid-state nanopores. Phys. Rev. Lett. 102: 5–8.
31. Queralt-Martín, M., M.L. López, and A. Alcaraz. 2015. Excess white noise to probe transport mechanisms in a membrane channel. Phys. Rev. E. 91: 062704.
32. Hoogerheide, D.P. 2010. Stochastic Processes in Solid State Nanopores. Harvard University Dissertation.
33. Rostovtseva, T.K., and S.M. Bezrukov. 1998. ATP transport through a single mitochondrial channel, VDAC, studied by current fluctuation analysis. Biophys. J. 74: 2365–2373.
34. Berezhkovskii, A.M., M. a. Pustovoit, and S.M. Bezrukov. 2002. Effect of binding on particle number fluctuations in a membrane channel. J. Chem. Phys. 116: 6216.
35. Rostovtseva, T.K., A. Komarov, S.M. Bezrukov, and M. Colombini. 2002. Dynamics of nucleotides in VDAC channels: structure-specific noise generation. Biophys. J. 82: 193–205.
36. Dutta, P., and P.M. Horn. 1981. Low-frequency fluctuations in solids: 1/f noise. Rev. Mod. Phys. 53: 497-516.
13
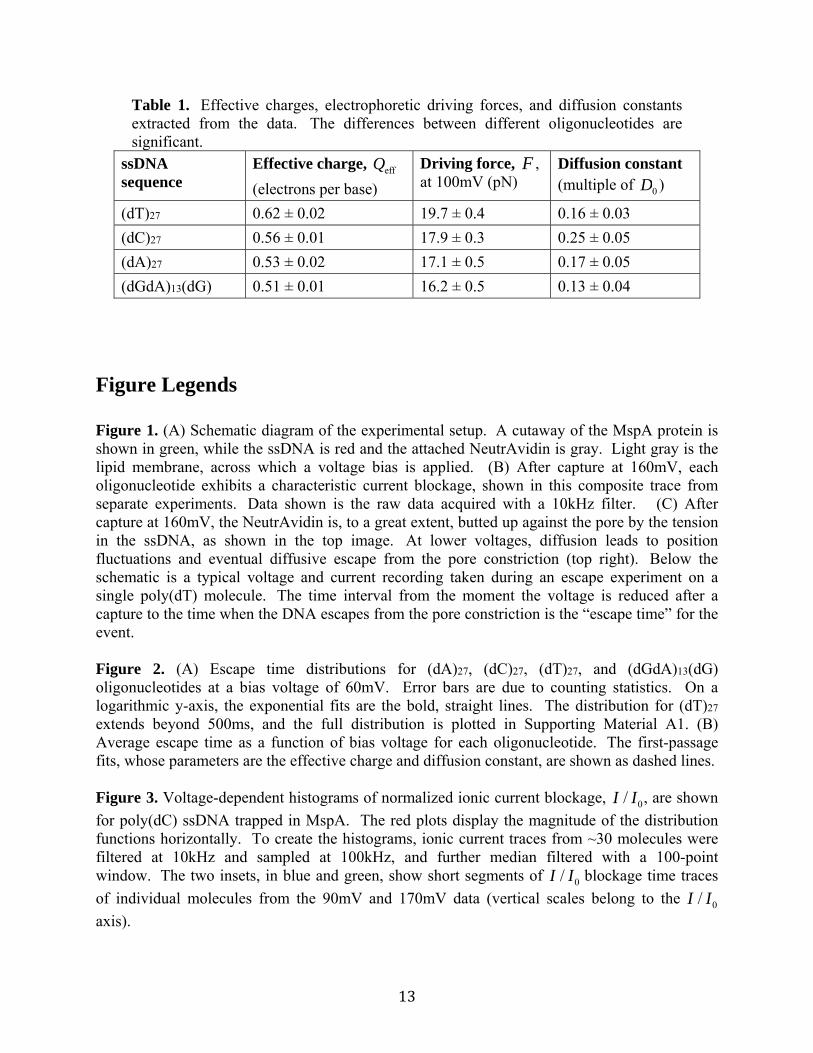
Table 1. Effective charges, electrophoretic driving forces, and diffusion constants extracted from the data. The differences between different oligonucleotides are significant.
ssDNA sequence
Effective charge, Qeff
(electrons per base)
Driving force, F , at 100mV (pN)
Diffusion constant (multiple of D0 )
(dT)27 0.62 ± 0.02 19.7 ± 0.4 0.16 ± 0.03
(dC)27 0.56 ± 0.01 17.9 ± 0.3 0.25 ± 0.05
(dA)27 0.53 ± 0.02 17.1 ± 0.5 0.17 ± 0.05
(dGdA)13(dG) 0.51 ± 0.01 16.2 ± 0.5 0.13 ± 0.04
Figure Legends Figure 1. (A) Schematic diagram of the experimental setup. A cutaway of the MspA protein is shown in green, while the ssDNA is red and the attached NeutrAvidin is gray. Light gray is the lipid membrane, across which a voltage bias is applied. (B) After capture at 160mV, each oligonucleotide exhibits a characteristic current blockage, shown in this composite trace from separate experiments. Data shown is the raw data acquired with a 10kHz filter. (C) After capture at 160mV, the NeutrAvidin is, to a great extent, butted up against the pore by the tension in the ssDNA, as shown in the top image. At lower voltages, diffusion leads to position fluctuations and eventual diffusive escape from the pore constriction (top right). Below the schematic is a typical voltage and current recording taken during an escape experiment on a single poly(dT) molecule. The time interval from the moment the voltage is reduced after a capture to the time when the DNA escapes from the pore constriction is the “escape time” for the event. Figure 2. (A) Escape time distributions for (dA)27, (dC)27, (dT)27, and (dGdA)13(dG) oligonucleotides at a bias voltage of 60mV. Error bars are due to counting statistics. On a logarithmic y-axis, the exponential fits are the bold, straight lines. The distribution for (dT)27 extends beyond 500ms, and the full distribution is plotted in Supporting Material A1. (B) Average escape time as a function of bias voltage for each oligonucleotide. The first-passage fits, whose parameters are the effective charge and diffusion constant, are shown as dashed lines. Figure 3. Voltage-dependent histograms of normalized ionic current blockage, I / I0, are shown
for poly(dC) ssDNA trapped in MspA. The red plots display the magnitude of the distribution functions horizontally. To create the histograms, ionic current traces from ~30 molecules were filtered at 10kHz and sampled at 100kHz, and further median filtered with a 100-point window. The two insets, in blue and green, show short segments of I / I0 blockage time traces
of individual molecules from the 90mV and 170mV data (vertical scales belong to the I / I0
axis).
14
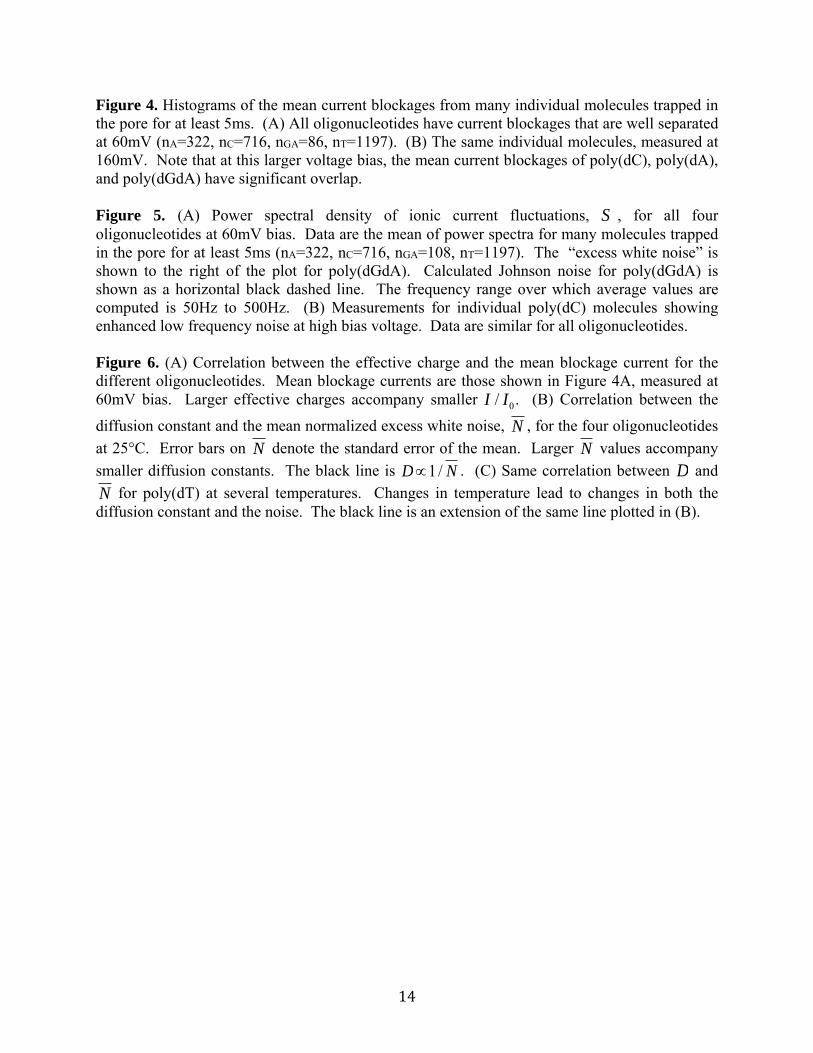
Figure 4. Histograms of the mean current blockages from many individual molecules trapped in the pore for at least 5ms. (A) All oligonucleotides have current blockages that are well separated at 60mV (nA=322, nC=716, nGA=86, nT=1197). (B) The same individual molecules, measured at 160mV. Note that at this larger voltage bias, the mean current blockages of poly(dC), poly(dA), and poly(dGdA) have significant overlap. Figure 5. (A) Power spectral density of ionic current fluctuations, S , for all four oligonucleotides at 60mV bias. Data are the mean of power spectra for many molecules trapped in the pore for at least 5ms (nA=322, nC=716, nGA=108, nT=1197). The “excess white noise” is shown to the right of the plot for poly(dGdA). Calculated Johnson noise for poly(dGdA) is shown as a horizontal black dashed line. The frequency range over which average values are computed is 50Hz to 500Hz. (B) Measurements for individual poly(dC) molecules showing enhanced low frequency noise at high bias voltage. Data are similar for all oligonucleotides. Figure 6. (A) Correlation between the effective charge and the mean blockage current for the different oligonucleotides. Mean blockage currents are those shown in Figure 4A, measured at 60mV bias. Larger effective charges accompany smaller I / I0. (B) Correlation between the
diffusion constant and the mean normalized excess white noise, N , for the four oligonucleotides
at 25°C. Error bars on N denote the standard error of the mean. Larger N values accompany
smaller diffusion constants. The black line is D1/ N . (C) Same correlation between D and
N for poly(dT) at several temperatures. Changes in temperature lead to changes in both the diffusion constant and the noise. The black line is an extension of the same line plotted in (B).
15
Figure 1

16
Figure 2
17
Figure 3
18
Figure 4
19
Figure 5
20
Figure 6

1
Supporting Material A. Chi-square fitting of exponential escape time curves A histogram of measured escape times shows that most of the events follow an exponential distribution; however, there are some extra events with long escape times. Around ten percent of the total number of events consist of these longer escape-time events, which have previously been hypothesized to be caused by DNA-pore sticking interactions (1). In order to estimate the time constant of the exponential distribution, we first estimate the time constant as 0 median(tesc ) / ln(2), where median(tesc ) is the median escape time. The exponential time
constant is then obtained by performing a chi-square fit to a histogram of the data shorter than
2.5 0 , using a bin width of 0.25 0 and error bars from Poisson counting statistics, N .
Because the full histogram for poly(dT) does not fit in Figure 2A in the main text, we have included it here. As can be seen, the data fit an exponential for the shortest ~90% of events.
Figure A1. Histogram of escape times for (dT)27. Same data as in main text Figure 2A, but with an extended time axis so that the full distribution can be clearly seen. As mentioned, the exponential distribution (solid line) is a good fit for about ninety percent of the events.
2
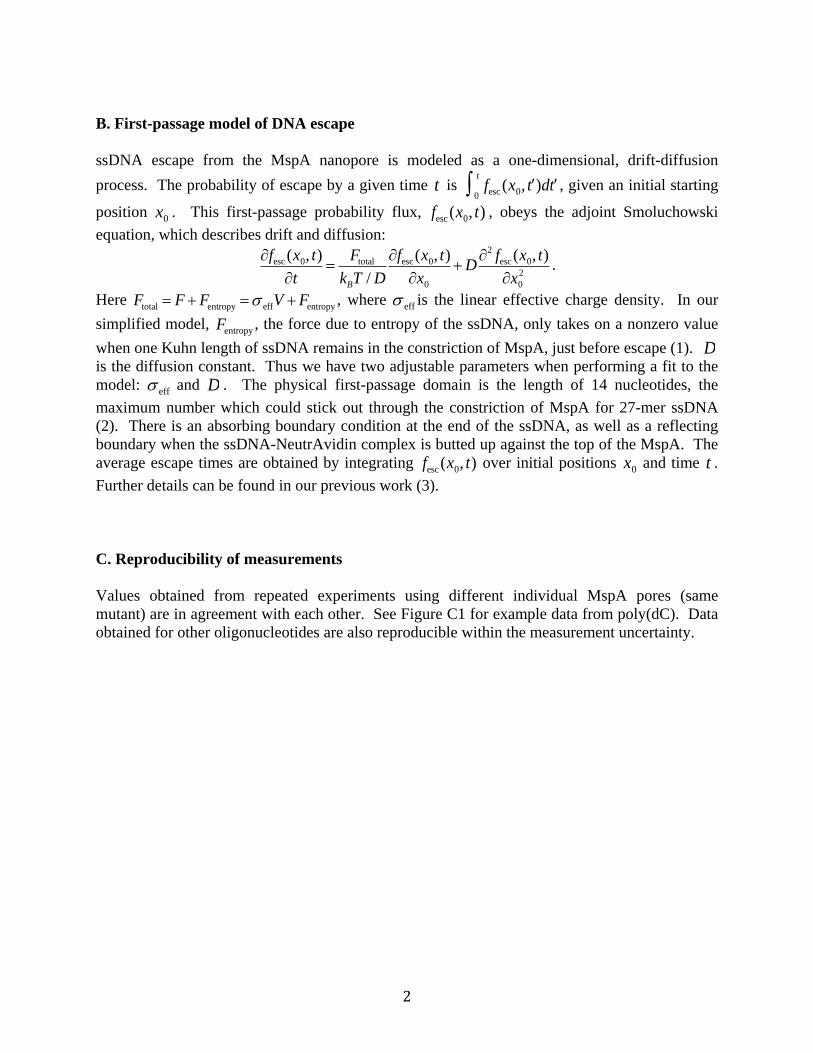
B. First-passage model of DNA escape ssDNA escape from the MspA nanopore is modeled as a one-dimensional, drift-diffusion
process. The probability of escape by a given time t is fesc0
t (x0, t )d t , given an initial starting
position x0 . This first-passage probability flux, fesc (x0, t) , obeys the adjoint Smoluchowski
equation, which describes drift and diffusion: fesc (x0, t)
t Ftotal
kBT / D
fesc (x0, t)
x0
D2 fesc (x0, t)
x02
.
Here Ftotal F Fentropy effV Fentropy , where eff is the linear effective charge density. In our
simplified model, Fentropy , the force due to entropy of the ssDNA, only takes on a nonzero value
when one Kuhn length of ssDNA remains in the constriction of MspA, just before escape (1). D is the diffusion constant. Thus we have two adjustable parameters when performing a fit to the model: eff and D . The physical first-passage domain is the length of 14 nucleotides, the
maximum number which could stick out through the constriction of MspA for 27-mer ssDNA (2). There is an absorbing boundary condition at the end of the ssDNA, as well as a reflecting boundary when the ssDNA-NeutrAvidin complex is butted up against the top of the MspA. The average escape times are obtained by integrating fesc (x0, t) over initial positions x0 and time t .
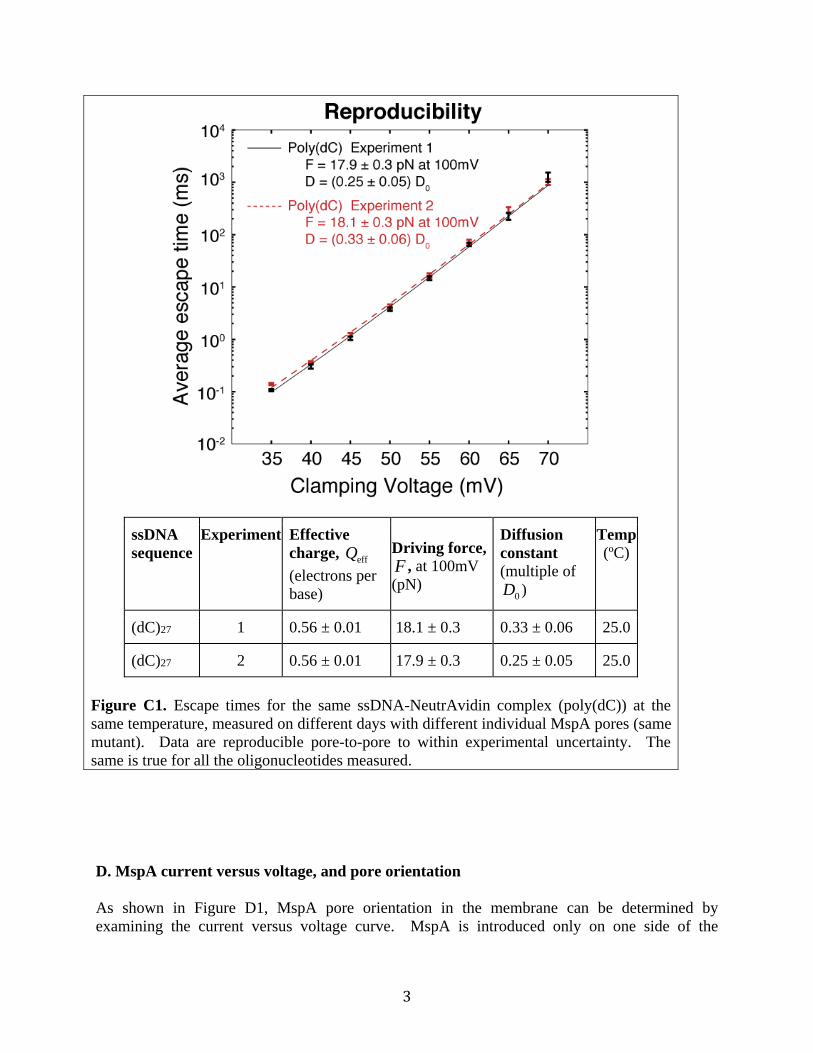
Further details can be found in our previous work (3). C. Reproducibility of measurements Values obtained from repeated experiments using different individual MspA pores (same mutant) are in agreement with each other. See Figure C1 for example data from poly(dC). Data obtained for other oligonucleotides are also reproducible within the measurement uncertainty.
3
ssDNA sequence
Experiment Effective charge, Qeff
(electrons per base)
Driving force, F , at 100mV (pN)
Diffusion constant (multiple of D0 )
Temp (ºC)
(dC)27 1 0.56 ± 0.01 18.1 ± 0.3 0.33 ± 0.06 25.0
(dC)27 2 0.56 ± 0.01 17.9 ± 0.3 0.25 ± 0.05 25.0
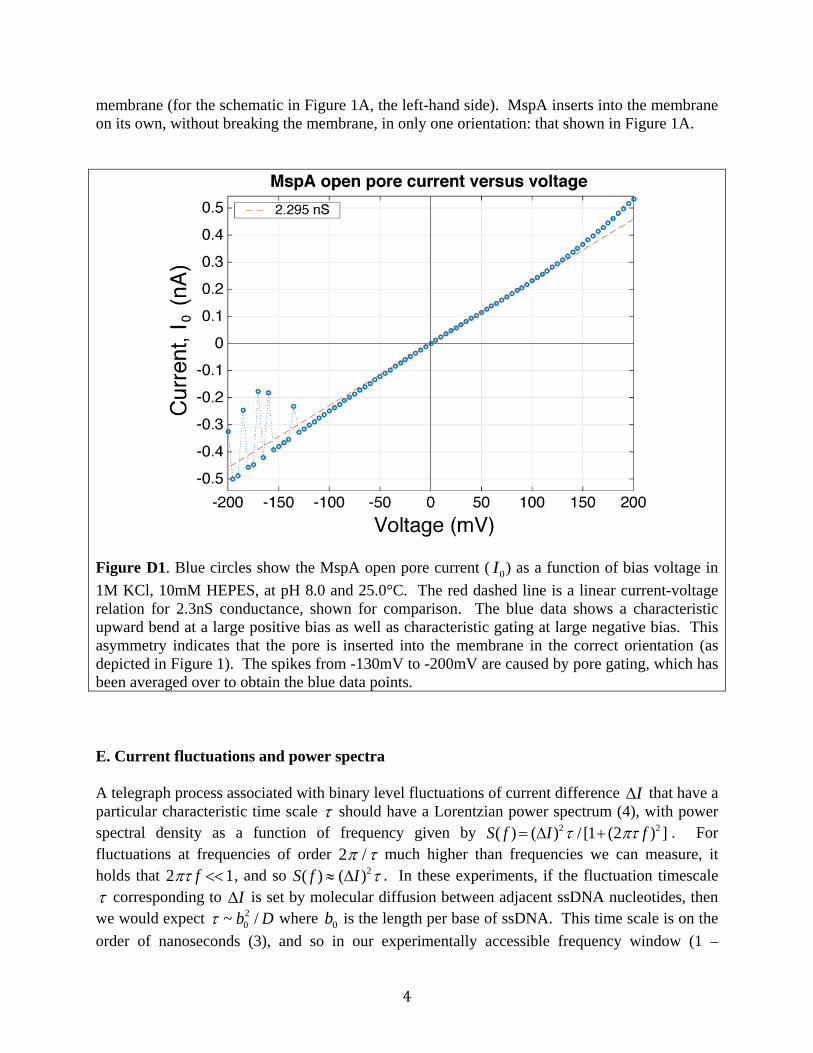
Figure C1. Escape times for the same ssDNA-NeutrAvidin complex (poly(dC)) at the same temperature, measured on different days with different individual MspA pores (same mutant). Data are reproducible pore-to-pore to within experimental uncertainty. The same is true for all the oligonucleotides measured. D. MspA current versus voltage, and pore orientation As shown in Figure D1, MspA pore orientation in the membrane can be determined by examining the current versus voltage curve. MspA is introduced only on one side of the
4
membrane (for the schematic in Figure 1A, the left-hand side). MspA inserts into the membrane on its own, without breaking the membrane, in only one orientation: that shown in Figure 1A.
Figure D1. Blue circles show the MspA open pore current ( I0) as a function of bias voltage in
1M KCl, 10mM HEPES, at pH 8.0 and 25.0°C. The red dashed line is a linear current-voltage relation for 2.3nS conductance, shown for comparison. The blue data shows a characteristic upward bend at a large positive bias as well as characteristic gating at large negative bias. This asymmetry indicates that the pore is inserted into the membrane in the correct orientation (as depicted in Figure 1). The spikes from -130mV to -200mV are caused by pore gating, which has been averaged over to obtain the blue data points. E. Current fluctuations and power spectra A telegraph process associated with binary level fluctuations of current difference I that have a particular characteristic time scale should have a Lorentzian power spectrum (4), with power spectral density as a function of frequency given by S( f ) (I )2 / [1 (2 f )2 ] . For fluctuations at frequencies of order 2 / much higher than frequencies we can measure, it holds that 2 f 1, and so S( f ) (I )2 . In these experiments, if the fluctuation timescale
corresponding to I is set by molecular diffusion between adjacent ssDNA nucleotides, then we would expect ~ b0
2 / D where b0 is the length per base of ssDNA. This time scale is on the
order of nanoseconds (3), and so in our experimentally accessible frequency window (1 –
5
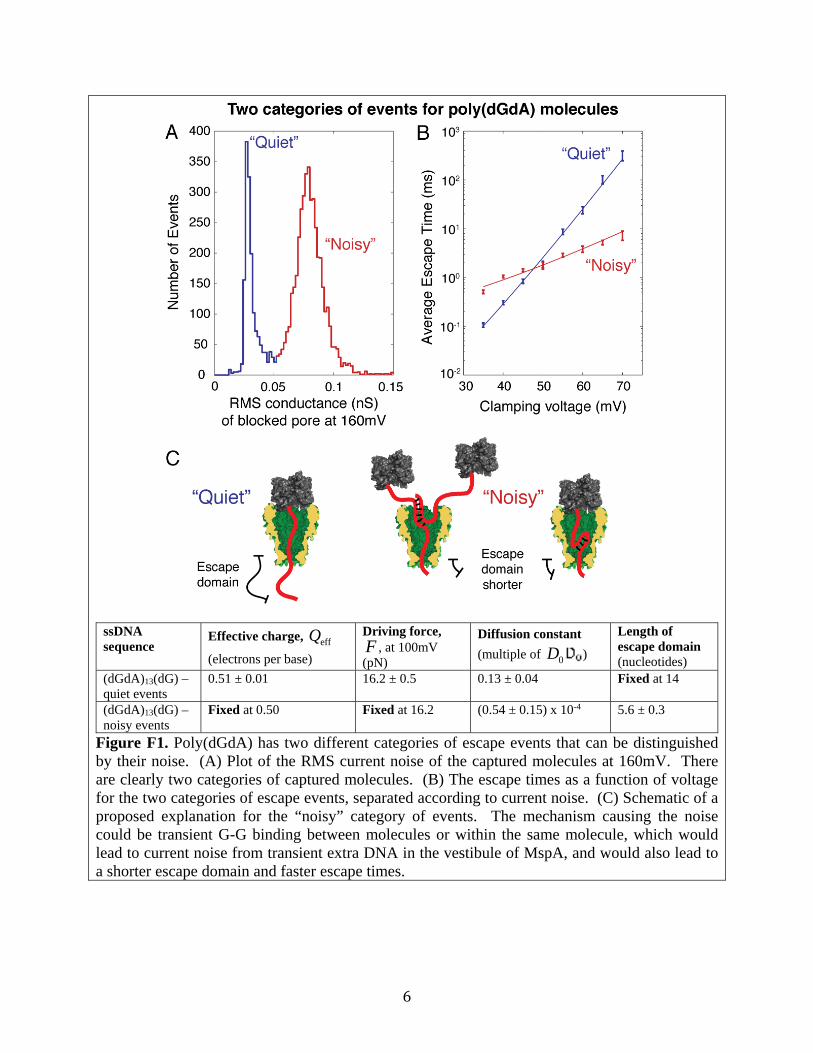
10kHz), the power spectral density of current fluctuations appears to be S( f ) (I )2 / D , independent of frequency. On the other hand, for the data recorded at higher voltages when NeutrAvidin – MspA interactions become more prominent, there is no reason, a priori, that we would expect the interactions between NeutrAvidin and MspA to have only one characteristic time scale. Thus we could expect to see a superposition of one or more Lorentzians in the power spectrum, leading to a falloff S( f ) f with 0 2, depending on all the complicated protein-protein interactions that can occur. A superposition of many such processes could even give rise to a power spectrum with 1 / f character. F. Qualitatively different escape events for poly(dGdA) Poly(dGdA) exhibits escape events that show qualitative differences and fall into two categories, “quiet” and “noisy,” shown in Figure F1. The table in Figure F1 shows that if we make the assumption that the quiet and noisy events have the same driving force, then for the noisy events we can fit the diffusion constant and another parameter, the length of the “escape domain”: the length of ssDNA that sticks out past the constriction of MspA (see Figure F1, panel C). Fit in this way, the noisy events have a far shorter escape domain, indicating that the noisy events may be caused by G-G association between or within ssDNA molecules, whose interactions prevent them from completely threading through the pore. In the main text, we limit our analysis to the quiet events, roughly one-third of the total, which correspond to ssDNA properly threaded through the constriction of MspA.
6
ssDNA sequence
Effective charge, Qeff
(electrons per base)
Driving force, F , at 100mV (pN)
Diffusion constant
(multiple of D0 )
Length of escape domain (nucleotides)
(dGdA)13(dG) – quiet events
0.51 ± 0.01 16.2 ± 0.5 0.13 ± 0.04 Fixed at 14
(dGdA)13(dG) – noisy events
Fixed at 0.50 Fixed at 16.2 (0.54 ± 0.15) x 10-4 5.6 ± 0.3
Figure F1. Poly(dGdA) has two different categories of escape events that can be distinguished by their noise. (A) Plot of the RMS current noise of the captured molecules at 160mV. There are clearly two categories of captured molecules. (B) The escape times as a function of voltage for the two categories of escape events, separated according to current noise. (C) Schematic of a proposed explanation for the “noisy” category of events. The mechanism causing the noise could be transient G-G binding between molecules or within the same molecule, which would lead to current noise from transient extra DNA in the vestibule of MspA, and would also lead to a shorter escape domain and faster escape times.
7
Supporting References 1. Wiggin, M., C. Tropini, V. Tabard-Cossa, N.N. Jetha, and A. Marziali. 2008.
Nonexponential kinetics of DNA escape from alpha-hemolysin nanopores. Biophys. J. 95: 5317–23.
2. Manrao, E.A., I.M. Derrington, M. Pavlenok, M. Niederweis, and J.H. Gundlach. 2011. Nucleotide discrimination with DNA immobilized in the MspA nanopore. PLoS One. 6: e25723.
3. Lu, B., S. Fleming, T. Szalay, and J. Golovchenko. 2015. Thermal Motion of DNA in an MspA Pore. Biophys. J. 109: 1439–1445.
4. Dutta, P., and P.M. Horn. 1981. Low-frequency fluctuations in solids: 1/f noise. Rev. Mod. Phys. 53: 497–516.