Embed Size (px)
Citation preview

Characterizing the Phylogenetic Tree-
Search ProblemDaniel Money And Simon Whelan
~Anusha Sura

What is this?
A phylogenetic tree or evolutionary tree is a branching diagram or "tree" showing the inferred evolutionary relationships among various biological species or other entities.

Why do we need to know about this?• Motivation The problem of explaining the evolutionary history of today's speciesHow do species relate to one another in terms of common ancestors
• Approaches People who are curious to know the origin of Fossil Records Phylogenetic Trees is the best head start

Brief Overview
• In Phylogenetic trees • Leaves represent present
day species • Interior nodes represent
hypothesized ancestors

Key Idea
• Phylogenetic studies frequently use some form of optimality criterion to assess how well specific tree topologies describe the observed sequence data. • Optimality methods typically work by finding the best scoring tree for
a sequence alignment, which is taken to be the best estimate of the evolutionary relationships between a set of sequences
Why not Hill-climbing?
• Hill-climbing can produce many different optimal trees depending where the algorithm starts.• Only the optimal tree with the highest likelihood, the global optimum,
has the appealing properties of the ML estimator• Tree-search is NP-hard.

Goals?
• Learn about the factors that affect the topography of tree-space, and to provide pragmatic suggestions that will aid phylogenetic inference with existing methods• Investigate how the difficulty of tree-search differs between
alignments and use correlation analyses to identify predictors for the difficulty of tree-search. • Also examine whether optima share any properties, such as their
relative size or their location in tree-space.

Data Sets
• Phylogenomic data sets consisting of 8-, 20- and 40-taxa. • Phylogenomic datasets consist of a series of genes taken from the
same set of taxa, leading us to expect a single tree relating the taxa, and enabling us to compare results between genes to highlight similarities and differences in tree-space caused by alignment properties.
Observation from the Data Set
• 8 taxa – ungapped nucleotide sequence alignments (106 genes)• 20 and 40 taxa – gapped amino acid sequence alignments (146 genes)• Genes with more than 10% unknown character or gap are excluded• 40 taxa – 20 different genes• 20 taxa – 52 different genes
Exhaustive tree search(8 taxa data set) (i) assign a start tree to the current tree object (ii) use a rearrangement operation to define the neighborhood of the current tree, (iii) calculate likelihoods for the trees in the neighborhood and assign the highest scoring as the new current tree, and (iv) if no improvement in likelihood occurs, then tree-search reaches an optimum and stops, otherwise go to (ii)

Number and size of optima
1. Assume the number of different optima to be a suitable proxy for the difficulty of tree-search problem
2. The number of optima identified during tree-search under a specific rearrangement strategy from all possible starting points in tree-space
3. The size of an optimum is defined as the number of start trees that reach that specific optimum when performing tree-search

Statistical comparison of optima
Assess whether each local optimum is significantly different to the global optimum using the SH test (Shimodaira and Hasegawa 1999), implemented in PAML (Yang 1997).

Optima Clustering
• Compute the mean NNI distance between ‘n’ identified optima and assess the significance of any clustering observed using a bootstrap approach• Take 1000 draws from the null distribution of no significant clustering
by sampling n randomly chosen trees, with the condition that none is a neighbor to any other, and computing their mean NNI distance

Correlating the number of optima with gene and tree properties• Spearman correlation coefficients between specific properties and
the number of optima identifiedI. tree length, defined as the sum of all branches of the globally
optimal treeII. alignment length, defined as the length of the gapped sequence
alignment associated with a gene III. the difference in likelihood between the fully resolved globally
optimal tree and the unresolved star-tree (Δ ln L^ )

Parameter distributions
• Investigate the estimates of tree length and the α parameter of the Γ-distributed rates-across-sites model (by examining their distribution across the 10,395 bifurcating trees relating 8 taxa for all 106 genes)• Calculate the mean rank of the global optimum and the skewness of
the distribution for each gene
Heuristic Tree-Search Using Sampling for the 20- and 40-taxa Phylogenomic and Bench marking Data Set
Number and size of optima1. The relative numbers of optima discovered by phyml and RAxML
from the randomly sampled start trees should be indicative of the difficulty of tree-search
2. The relative size of the sampled optima are calculated as the number of start trees that lead to them
Statistical comparison of optima
• The best tree identified during tree-search is taken as a proxy for the global optimum• Compare the 95% confidence interval of this best tree with the other
optima, identified using the SH test
Optima Clustering
Robinson–Foulds (RF) distance metric 1. The average RF distance between the ‘n’ sampled optima is
calculated 2. a bootstrap procedure used to assign P values of clustering by
comparing the observed distance to distribution of average RF-distances between n randomly sampled trees

Correlating the number of optima with gene and tree properties• Ignore minor variations in gene tree topology that can result from
(e.g.,) incomplete lineage sorting or model misspecification• Spearman correlation coefficients are calculated between the
observed number of optima and gene length, tree length, and likelihood difference between the star-tree and the best optimum identified
Parameter distributions
The distribution of tree length and rates-across-sites parameter, α, across trees are approximated by taking estimates from random start trees, for both the simple and complex model

Exhaustive Analysis of Eight-taxa Yeast Phylogenomic Data Set
The global optimum is frequently the largest optimum1. There is a strong tendency for the global optimum to be larger than
other less good optima2. The global optimum is on average 2.37 times larger than expected
under JC, and 2.16 times larger than expected under GTR+Γ

Comparison of ordered rank with average size
Statistical comparison of optima
• Of the 91 genes with multiple optima under GTR+Γ, 28 have local optima that the SH test finds significantly different from the global optima.• When averaged across all 91 genes, 14.6% of the locally optima found
are significantly different to the global optima

Clustering of optima
• The likelihood decreases as the NNI distance from the global optimum increases, but the slope is less steep• bootstrap analyses show that for the overwhelming majority of
genes, the mean NNI distance between optima was less than expected by chance and under JC (GTR+Γ), 49/92(50/91) genes display significant clustering

Representation of tree-space for the genes YBR198C and YLR389C
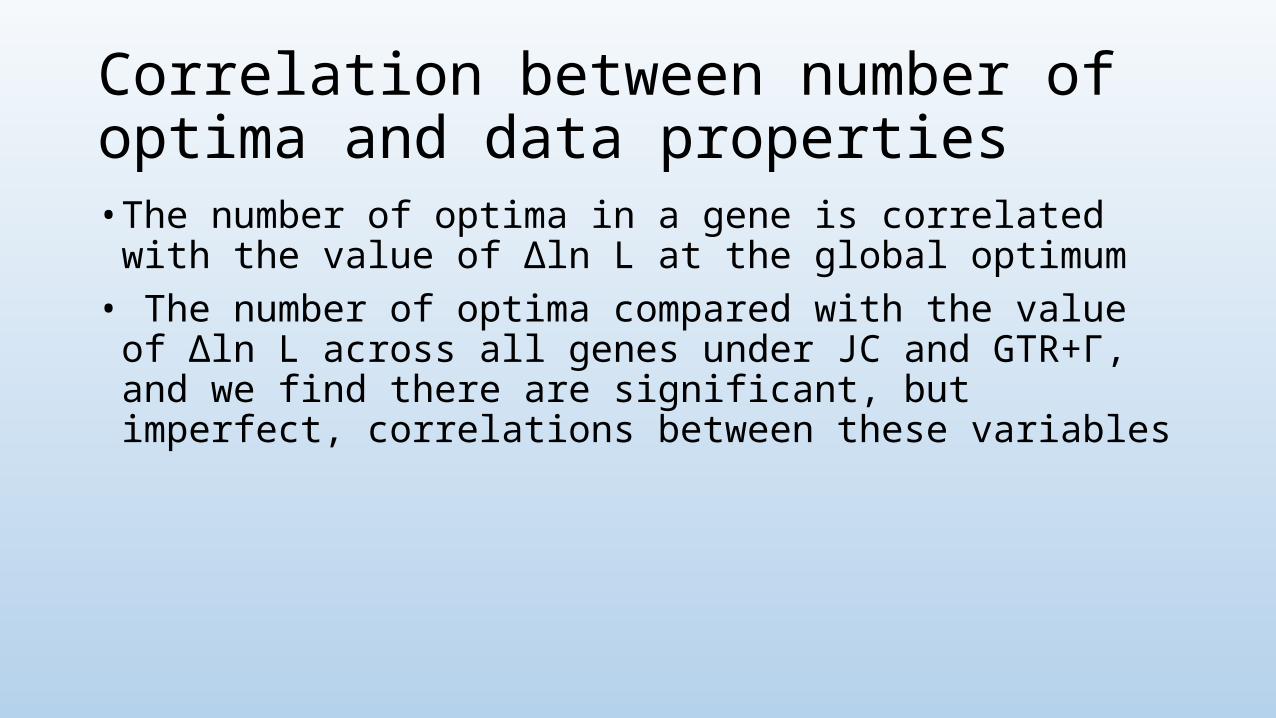
Correlation between number of optima and data properties• The number of optima in a gene is correlated with the value of Δln L
at the global optimum• The number of optima compared with the value of Δln L across all
genes under JC and GTR+Γ, and we find there are significant, but imperfect, correlations between these variables

Correlations between Δ ln Lˆ and the number of optima per gene
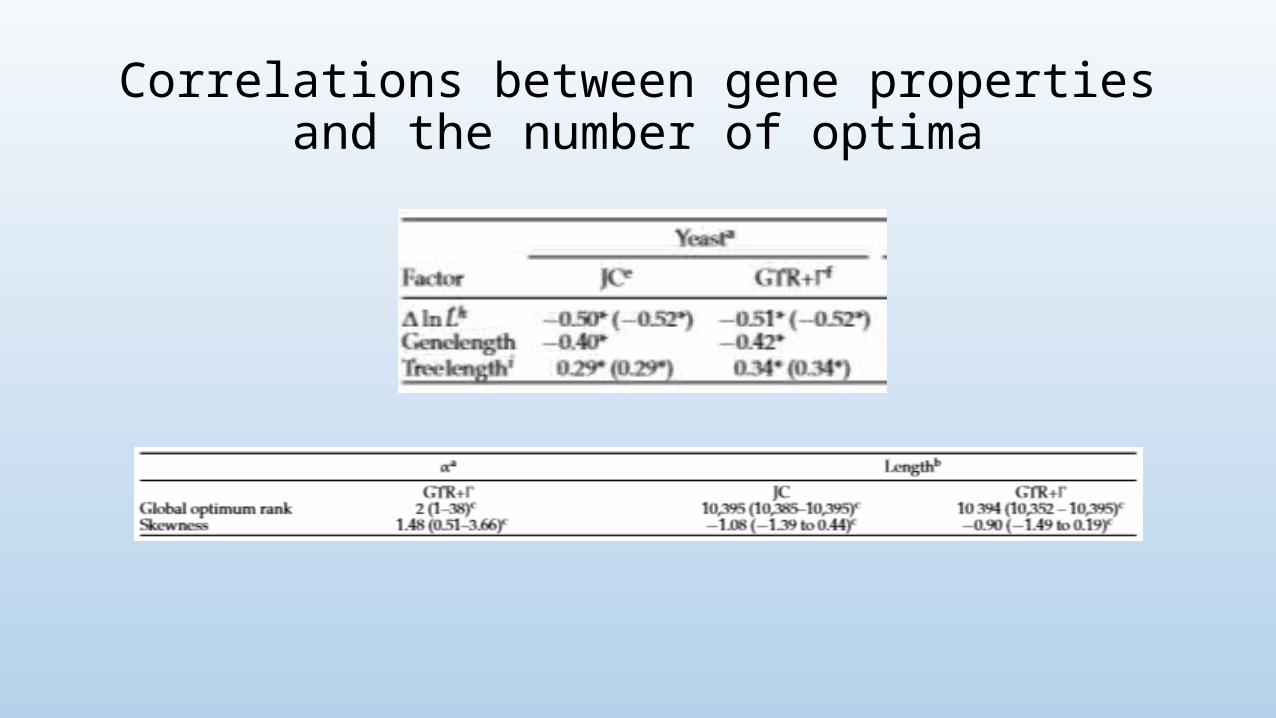
Correlations between gene properties and the number of optima
Parameter distributions
• Globally optimal trees tend to have relatively high estimates of α from Γ-distributed rates-across-sites and low estimates of tree length• There is positive skew for α, with the majority of trees having low
parameter estimates, in contrast to the high estimate in the globally optimal tree• Negative skew for tree length, with the majority of trees having
longer estimates
Conclusions
• Major differences in the topography of tree search.• The global optimum tends to have the greatest number of trees
attracted to it.• Model choice affects tree-space.• The difference in log likelihood between a well-resolved topology and
the star topology provides a proxy for the phylogenetic information in an alignment.• NNI tree-search performs poorly on real data• No single program is likely to yield the best tree estimate
References
• Morrison D.A. 2007. Increasing the efficiency of searches for the maximum likelihood tree in a phylogenetic analysis of up to 150 nucleotide sequences. • Felsenstein J. 2003. Inferring phylogenies. Sunderland (MA): Sinauer
Associates.• Stamatakis A. 2006. RAxML-VI-HPC: maximum likelihood-based phylogenetic
analyses with thousands of taxa and mixed models. • Shimodaira H., Hasegawa M. 1999. Multiple comparisons of loglikelihoods
with applications to phylogenetic inference. • Morell V. 1996. TreeBASE: the roots of phylogeny. • Guindon S., Gascuel O. 2003. A simple, fast, and accurate algorithm to
estimate large phylogenies by maximum likelihood.