Embed Size (px)
Citation preview
Rese aRch Fe atuRe
76 computer Published by the IEEE Computer Society 0018-9162/13/$31.00 © 2013 IEEE
is integrated into a system on chip (SoC) consisting of the core processor, the digital signal processor, and many peripheral controllers. This tight chip integration makes it infeasible to physically isolate and measure the SoC’s graphics hardware.
Moreover, because smartphone graphics hardware is less competent relative to desktop PCs, the smartphone’s general-purpose processor still plays a substantial role in mobile graphics computing. As a result, many aspects of the SoC are involved in 3D graphics computing, which ex-acerbates the task of isolating and quantifying graphics bottlenecks on smartphones.
To tackle these challenges, we used a five-stage, abstracted graphics pipeline, inspired by the OpenGL for Embedded Systems (OpenGL ES 2.0) graphics pipeline, to measure the performance of two game benchmarks. We compared five game versions—one corresponding to the original source code and the other four corresponding to four conditions in which we selectively disabled one or more pipeline stages. Then, using empirically measured performance and power consumption data for three mainstream smart-phones—the Motorola Droid, HTC EVO, and Motorola Atrix 4G—we performed an in-depth quantitative bottleneck analysis on performance and power con-sumption among the pipeline’s five stages.
D espite the phenomenal growth of mobile applica-tions in novel categories, such as education and lifestyle, gaming applications remain the most popular category by a wide margin, according
to the latest Apple App Store statistics (http://148apps.biz/app-store-metrics).
Although 3D entertainment is gaining a market foothold in other media, including desktop computing, 3D games are still a relative rarity on smartphones, in part because mobile and desktop segments differ considerably in feature and performance requirements. For example, rendering effects such as aliasing and imperfect shading can result in reduced image quality because the smartphone screen is viewed closer to the observer’s eyes compared with a PC.1 Also, 3D graphics and games are power-hungry applications in general, which can be a major limitation for battery-powered smartphones.
To improve the performance and energy efficiency of 3D mobile games, a clear research priority is to identify and quantify bottlenecks in the games’ 3D graphics pipeline. Intensive efforts have attempted to characterize the per-formance and power consumption of desktop 3D games,2 but undertaking the same task for smartphones is much more challenging. Unlike PCs, mobile architectures are designed for small dies, low hardware cost, and low power consumption. As such, smartphones’ graphics hardware
A preliminary study using the Quake 3 and XRace games as benchmarks on three mainstream mobile system-on-chip architectures reveals that the geometry stage is the main bottleneck in 3D mobile games and confirms that game logic significantly affects power consumption.
Characterizing the Performance and Power Consumption of 3D Mobile Games Xiaohan Ma and Zhigang Deng, University of Houston
Mian Dong and Lin Zhong, Rice University

April 2013 77
Our analysis revealed that the geometry stage is the main bottleneck in 3D mobile games and confirmed that game logic significantly affects power consumption.
SMARTPHONE PLATFORMS Efforts to characterize the performance and power con-
sumption of 3D desktop games include dynamic workload characterization on graphics architecture features,2 3D graph-ics performance modeling,3 and the power modeling of 3D graphics architecture.4,5 Modern smartphones use signifi-cantly different graphics hardware, which makes it extremely difficult to apply these study results to smartphones.
Unlike previous work that has attempted to break down power at the system level,6 our work focuses on the per-formance and energy characterization of mobile graphics in the context of mobile SoC architectures that represent state-of-the-art design.
Table 1 lists the technical specifications of the three smartphone platforms in our study: the Droid was equipped with Texas Instruments’ Open Multimedia Application Plat-form (OMAP 3430), the EVO with Qualcomm’s Snapdragon S2, and the Atrix with Nvidia’s Tegra 2.
The OMAP PowerVR GPU architecture consists of three main modules:
• a tile accelerator, which stores the scene data and di-vides the screen into tiles;
• an image synthesis processor, which performs hidden surface removal to determine visible pixels; and
• a texturing and shading processor, which uses a uni-fied shader architecture with programmable functions.
The Snapdragon Adreno GPU offers a similar program-mable graphics pipeline. However, the memory controller in the PowerVR GPU is a 32-bit low-power double-data-rate interface (LPDDRI) and can run at up to 200 MHz, which offers a 56 percent increase in memory bandwidth, com-pared to the Adreno GPU’s 128 MHz. Moreover, although the Adreno GPU’s streaming texture unit can combine video and images with 3D graphics, it has only two such texture
units, relative to the PowerVR GPU’s four. Therefore, the theoretical fill rate of the texture units in the Adreno GPU is lower than that in the PowerVR GPU (133 to 250 million versus 250 to 300 million texels per second).
The GeForce ULV (ultralow voltage) GPU in Nvidia’s Tegra 2 has a different architecture than either the PowerVR or Adreno GPU. First, it uses an immediate mode renderer instead of a tile accelerator. Second, it uses completely separate vertex and pixel cores with different core archi-tectures, rather than a unified shader architecture.
Immediate mode renderers have dominated PC appli-cations, while tile-based renderers have been prevalent in embedded or low-power devices. Relative to immediate mode GPU architectures, tile-based renderers fetch only the visible texels, while immediate mode renderers fetch texels for every pixel in a polygon. Tile-based renderers require only one frame-buffer access to output final color; immedi-ate mode renderers need multiple buffer accesses to output final color. However, as geometric complexity increases, immediate mode renderers are the better option because tile-based renderers must process all the polygons in a tile for each pixel. Immediate mode renderers use explicit Z-buffering to resolve this issue.7
CHARACTERIZATION DESIGNSimilar to the OpenGL ES 2.0 pipeline, we use a logical,
abstracted graphics pipeline to describe mobile graphics ar-chitecture. Unlike previous efforts to quantitatively analyze power consumption using a mobile 3D graphics pipeline,1 we measure both performance and power consumption in real-world 3D games or graphics applications.
As Figure 1 shows, the abstracted graphics pipeline con-tains five stages, consecutively executed:
• Application. The CPU executes the 3D graphics ap-plication. This stage also involves the graphics system driver running on the CPU and calling OpenGL APIs into actions that the GPU executes.
• Geometry. The processor calculates the vertex attri-butes and positions within the 3D scene according to
Table 1. Technical specifications summary for three smartphone SoC models.
Specification OMAP 3430 Snapdragon S2 Tegra 2
CPU ARM Cortex A8 QSD 8650 Dual-core ARM Cortex 9
GPU PowerVR SGX 530 Adreno 200 GeForce ULV
CPU clock (MHz) 600 800 1,000
GPU clock (MHz) 200 256 128
GPU memory (MHz) 200 128 600
Polygon fill rate (millions of triangles per sec) ~90 ~70 ~80
Pixel fill rate (megapixels per sec) ~250 ~133 ~1,200

78 computer
Rese aRch Fe atuRe
performs fetching, mapping, and filtering operations on texture data only on that size, which minimizes the texturing workload.
• Disablefragmentshading. Instead of running every complex shader for each pixel, as in the original graph-ics program, we run only a simple stub shader, thus removing most of the pixel-shading workload.
We performed all these isolation and disabling trans-formations without using profiler tools, primarily because profiler tools typically have their own associated runtime and energy consumption overhead, which is extremely difficult to eliminate in data postprocessing.
Experimental setup and procedure We chose Quake3, a first-person shooter game, and
XRace, a car race game, as our representative 3D mobile game benchmarks. In the past several years, both game categories have dominated the top 10 list of preferred An-droid 3D games.
Quake3, which uses OpenGL or OpenGL ES as its graph-ics engine, has been one of the most successful 3D desktop games in the past few decades.8 The latest release of Quake3 uses predominantly state-of-the-art vertex and pixel pro-grams, which extensively exploit the capability of modern mobile graphics processors.
XRace uses OpenGL ES 2.0 for rendering and is repre-sentative of optimized graphics on modern mobile SoCs.
We believe that characterizing these cutting-edge games sheds significant light on how real-world 3D graphics and game applications run on modern mobile platforms.
For both Quake3 and XRace, we generated five game versions: one that corresponds to the original source code
the scene organization. Tasks include multiplying ver-tices by model view and projection matrices, executing vertex shaders, and so on.
• Texturefetching. The processor performs texture data fetch workloads.
• Fragmentshading. The processor executes various pixel shaders to process fragments and screen pixels, as well as operations that use textures.
• Pixelprocessing. The processor performs the fixed function operations to further process pixels after fragment shading, such as reading and writing color components, reading and writing depth and stencil buffers, and alpha blending.
Disabling pipeline stagesSimilar to graphics performance profilers such as gDEBugger,
we used a scheme to evaluate the selected benchmarks in which we disabled some or all graphics pipeline stages. Our scheme consists of four possible code transformations:
• Disablegraphics. We disable all the pipeline stages by disabling all the OpenGL commands that push vertices or texture data into the graphics pipeline.
• Disablerasterization. We disable all the stages except the geometry stage by forcing all W-coordinates in the scene to be negative (changing W to –|W|) after model-view and projection transformations. Geometric operations proceed as usual before rasterization, but there are no rasterization and follow-up operations because all vertices now have negative W-coordinates and are thus culled.
• Disable texture fetching. We force OpenGL to use 2 × 2 pixel stub textures. Consequently, the pipeline
Figure 1. (a) Abstracted mobile graphics pipeline, which consists of five stages, and (b) experimental setup. The pipeline is designed to measure both performance and power consumption in actual 3D games by isolating pipeline stages and analyzing them to identify bottlenecks. The study used the Quake 3 and XRace 3D games as benchmarks
3D application (game logic)
Primitiveprocessing
Driver
Primitiveassembly
Vertexshader
Fragment shading
Vertexstream
Pretransformed vertices
(a) (b)
LIT verticesRasterized pixels Updated pixels
Data stream
Rasterizer
Assembledpolygons Frame
bu�er
Pixelstream
Pixel processingTexture fetching
Host PC Data acquisition system
V = 3.7V; I = 0.2 A
Smartphone

April 2013 79
battery’s voltage and current, with a sampling rate of 1 kHz, and used a host PC to store the collected data. We then calculated instant power consumption by multiplying the voltage and current every 1 ms. Finally, we computed the average every 100 ms to reduce random noise and potential errors from the measuring process.
We ran each version of Quake3 and XRace on the three smartphones, measured its game demo running time, and recorded its associated power trace. To eliminate any system caching effect, we rebooted the smartphones before measure-ment. We repeated the measurement of each version of Quake3 and XRace 10 times and computed the average.
and four that correspond to the four stage-disabling conditions. To make our characterization process repeatable, for each stage-disabled version, we ran a traced gamedemo on smartphones to measure its per-formance and power consumption. Figure 2 shows select snapshots for each game.
A game demo is a recorded se-quence of game playing, such as FOUR.dm 89 for Quake3 (available from the original package file in the game CD), that we can reproduce on different runs. We first read each frame in the recorded game sequence—map type, character positions, weapon information, number of enemies, and so on. We then reconstructed this sequence in the 3D scene and ren-dered it on the screen using the mobile CPU and GPU. We could then consecutively read and render the subsequent frames.
To force the game engine to exhaust CPU and GPU re-sources, we ran the game demo as fast as possible without dropping any frame. Hence, completion time is a sound performance measure or indicator.
To measure each smartphone’s power consumption, we first hacked its battery and inserted a sensing resistor to measure the current from the battery. We used a data acquisition (DAQ) system to simultaneously measure the
Figure 2. Snapshots of the game demos for Quake 3 (top) and XRace (bottom) with different graphics pipeline stages disabled. The study involved five versions of each game—the original and four versions that correspond to four stage-disabling conditions.
Original Texture fetching disabledXR
ace
Quak
e 3Fragment shading disabled
Table 2. Raw running time and power consumption for original code and four transformations (stage-disabled program versions).
Code version
Motorola Droid HTC EVO Motorola Atrix 4G
Quake 3 XRace Quake 3 XRace Quake 3 XRace
Original Time (s) Power (mW)
44.9944.2
15.5460.9
64.71,005.7
24.5490.1
40.8918.9
14.6377.2
Disable graphics Time (s) Power (mW)
20.3417.2
6.3260.5
20.2402.5
6.8273.5
18.6432.4
5.8216.5
Disable rasterization Time (s) Power (mW)
31.7653.6
10.1378.2
45.2669.9
15.2366.6
31.4648.9
8.9302.9
Disable texture fetching Time (s) Power (mW)
39.2869.4
13.4411.1
53.0892.7
19.4401.4
38.4846.6
12.8291.7
Disable fragment shading Time (s) Power (mW)
39.0815.0
13.5447.3
59.0873.8
21.9466.4
38.7833.4
13.6367.8

Rese aRch Fe atuRe
80 computer
CHARACTERIZATION RESULTS Table 2 shows the raw running time and power mea-
sured with different code transformations. We calculated the running time and power consumption of each pipe-line stage using simple subtraction operations between the original and the stage-disabled versions, or between two stage-disabled versions. Table 3 and Figure 3 show the performance and power consumption breakdown as well as bottlenecks we identified. Our results point to several patterns in the pipeline stages.
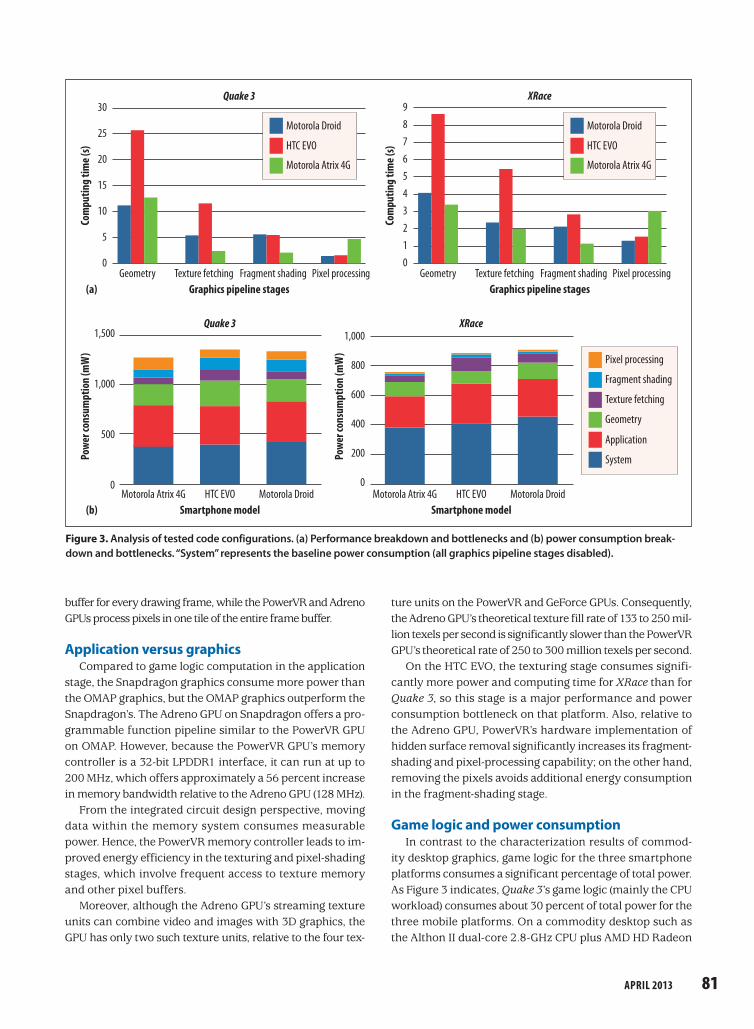
Impact of geometry stage As Table 3 shows, the geometry stage uses a major
portion of power and computing time, consuming more than 40 percent of total computing time and more than 35 percent of total power on all three platforms. Arguably, scene complexity makes the geometry stage a boundary on performance and energy consumption, even with scene organization techniques such as binary space partition-ing, which both games use. Quake3 uses highly complex scenes, which could account for its high power consump-tion relative to XRace.
Fragment shading versus pixel processingTable 3 also shows that the fragment shading stage
consumes a larger portion of power and computing time than the pixel processing stage on both the Motor-ola Droid and HTC EVO. On modern mobile GPUs, such as the PowerVR and Adreno, pixel-processing work-loads in the GPU frame buffer are dispatched to on-chip hardware units. These modern mobile GPUs employ a programmable shader architecture so that graphics and game developers can use software to create more realistic and rich shading effects. However, hardware implementation avoids most of the software implemen-tation instruction fetching, decoding, and execution overhead, which results in power consumption and performance gains over the chip.
On the Motorola Atrix 4G platform, consumption is just the opposite: pixel processing consumes a larger portion of computing time and power than the fragment-shading stage. One possible explanation is the architectural differ-ence between the Atrix 4G and the other two platforms, which use a tile-based graphics architecture. The GeForce ULV GPU must perform pixel-processing operations over the entire frame
Table 3. Running time and power consumption for each pipeline stage.
Pipeline stage
Motorola Droid HTC EVO Motorola Atrix 4G
Quake 3 XRace Quake 3 XRace Quake 3 XRace
Application Time (s) Power (mW)
20.3417.2-
6.3260.5
20.2402.5
6.8273.5
18.6432.4
5.8216.5
Geometry Time (s) Percentage total time Power (mW) Percentage total power
11.446.3
236.444.6
3.841.3
117.758.7
25.056.2
267.444.3
8.447.593.142.9
12.857.7
213.543.9
3.135.286.453.8
Texture fetching Time (s) Percentage total time Power (mW) Percentage total power
5.723.274.814.2
2.122.859.829.8
11.726.3
113.018.7
5.128.888.741.0
2.410.872.314.9
1.820.552.132.4
Fragment shading Time (s) Percentage total time Power (mW) Percentage total power
5.923.9
129.224.5
2.021.713.6
6.8
5.712.8
131.921.9
2.614.723.711.0
2.19.5
85.517.6
1.011.49.45.8
Pixel processing Time (s) Percentage total time Power (mW) Percentage total power
1.66.5
86.616.4
1.314.3
9.34.6
2.14.7
90.915.0
1.69.0
11.15.1
4.922.1
115.223.7
2.933.012.8
8.0
System (power only, all stages disabled)
466.6 mW 419.9 mW 420.4 mW
April 2013 81
ture units on the PowerVR and GeForce GPUs. Consequently, the Adreno GPU’s theoretical texture fill rate of 133 to 250 mil-lion texels per second is significantly slower than the PowerVR GPU’s theoretical rate of 250 to 300 million texels per second.
On the HTC EVO, the texturing stage consumes signifi-cantly more power and computing time for XRace than for Quake3, so this stage is a major performance and power consumption bottleneck on that platform. Also, relative to the Adreno GPU, PowerVR’s hardware implementation of hidden surface removal significantly increases its fragment-shading and pixel-processing capability; on the other hand, removing the pixels avoids additional energy consumption in the fragment-shading stage.
Game logic and power consumptionIn contrast to the characterization results of commod-
ity desktop graphics, game logic for the three smartphone platforms consumes a significant percentage of total power. As Figure 3 indicates, Quake3’s game logic (mainly the CPU workload) consumes about 30 percent of total power for the three mobile platforms. On a commodity desktop such as the Althon II dual-core 2.8-GHz CPU plus AMD HD Radeon
buffer for every drawing frame, while the PowerVR and Adreno GPUs process pixels in one tile of the entire frame buffer.
Application versus graphicsCompared to game logic computation in the application
stage, the Snapdragon graphics consume more power than the OMAP graphics, but the OMAP graphics outperform the Snapdragon’s. The Adreno GPU on Snapdragon offers a pro-grammable function pipeline similar to the PowerVR GPU on OMAP. However, because the PowerVR GPU’s memory controller is a 32-bit LPDDR1 interface, it can run at up to 200 MHz, which offers approximately a 56 percent increase in memory bandwidth relative to the Adreno GPU (128 MHz).
From the integrated circuit design perspective, moving data within the memory system consumes measurable power. Hence, the PowerVR memory controller leads to im-proved energy efficiency in the texturing and pixel-shading stages, which involve frequent access to texture memory and other pixel buffers.
Moreover, although the Adreno GPU’s streaming texture units can combine video and images with 3D graphics, the GPU has only two such texture units, relative to the four tex-
Figure 3. Analysis of tested code configurations. (a) Performance breakdown and bottlenecks and (b) power consumption break-down and bottlenecks. “System” represents the baseline power consumption (all graphics pipeline stages disabled).
(a)Geometry
30
25
20
15
10
5
0
Graphics pipeline stages
Quake 3Co
mpu
ting
time (
s)
Fragment shadingTexture fetching Pixel processing
(b)Motorola Atrix 4G
1,500
1,000
500
0
Smartphone model
Quake 3
Powe
r con
sum
ptio
n (m
W)
HTC EVO Motorola Droid Motorola Atrix 4G
1,000
800
600
400
200
0
Smartphone model
XRacePo
wer c
onsu
mpt
ion
(mW
)
HTC EVO Motorola Droid
Geometry
9876543210
Graphics pipeline stages
XRace
Com
putin
g tim
e (s)
Fragment shadingTexture fetching Pixel processing
System
Application
Geometry
Texture fetching
Fragment shading
Pixel processing
Motorola Droid
HTC EVO
Motorola Atrix 4G
Motorola Droid
HTC EVO
Motorola Atrix 4G

Rese aRch Fe atuRe
82 computer
References 1. B. Mochocki, K. Lahiri, and S. Cadambi, “Power Analysis
of Mobile 3D Graphics,” Proc.Conf.Design,AutomationandTestinEurope(DATE 06), ACM, 2006, pp. 502-507.
2. T. Mitra and T. Chiueh, “Dynamic 3D Graphics Workload Characterization and the Architectural Implications,” Proc.Int’lSymp.Microarchitectures(Micro-32), IEEE, 1999, pp. 62-71.
3. M. Wimmer and P. Wonka, “Rendering Time Estimation for Real-Time Rendering,” Proc.EurographicsWorkshopRen-dering (EGWR 03), Eurographics Assoc., 2003, pp. 118-129.
4. X. Ma et al., “Statistical Power Consumption Analysis and Modeling for GPU-Based Computing,” Proc.ACMSOSPWorkshoponPower-AwareComputingandSystems (Hot-Power 09), ACM, 2009; www.sigops.org/sosp/sosp09/papers/hotpower_6_ma.pdf.
5. J.W. Sheaffer, D. Luebke, and K. Skadron, “A Flexible Simu-lation Framework for Graphics Architectures,” Proc.ACMSIGGRAPH/EurographicsConf.GraphicsHardware (GH 04), ACM, 2004, pp. 85-94.
6. A. Carroll and G. Heiser, “An Analysis of Power Con-sumption in a Smartphone,” Proc.UsenixAnn.Tech.Conf.(UsenixATC 10), Usenix, 2010, pp. 21-34.
7. S. Molnar et al., “A Sorting Classification of Parallel Render-ing,” IEEEComputerGraphicsandApplications, IEEE CS, vol. 14, no. 4, 1994, pp. 23-32.
8. I. Antochi et al., “Graalbench: A 3D Graphics Benchmark Suite for Mobile Phones,” Proc.ACMSIGPlan/SIGBedConf.Languages,Compilers,andToolsforEmbeddedSystems(LCTES 04), ACM, 2004, pp. 1-9.
Xiaohan Ma isaPhDstudentintheDepartmentofComputerScienceattheUniversityofHouston.Hisresearchinterestsincludecomputergraphics,computeranimation,andGPUcom-puting.MareceivedanMSincomputersciencefromZhejiangUniversity,[email protected].
Zhigang Deng isanassociateprofessorintheDepartmentofComputerScienceanddirectoroftheComputerGraphicsandInteractiveMediaLaboratoryattheUniversityofHouston.Hisresearchinterestsincludecomputergraphics,computeranimation,andvisualization.DengreceivedaPhDincomputersciencefromtheUniversityofSouthernCalifornia.Contacthimatzdeng@cs.uh.edu.
Mian Dong isaPhDstudentintheDepartmentofElectricalandComputerEngineeringatRiceUniversity.Hisresearchinterestsincludeenergy-efficientgraphicsanddisplaysystems,powercharacterizationandmanagementofmobilesystems,andcomputingarchitecturesforemergingnanometerdevices.DongreceivedanMSinelectronicengineeringfromTsinghuaUniversity,[email protected].
Lin Zhong isanassociateprofessorintheDepartmentofElectricalandComputerEngineeringatRiceUniversity.Hisresearchinterestsincludemobileandembeddedsystemdesign,human-computerinteraction,andnanoelectronics.ZhongreceivedaPhDinelectricalengineeringfromPrincetonUni-versity.Contacthimatlzhong@rice.edu.
4200 GPU, the same game logic consumes only 15.12 per-cent of total power.
The CPU might still be the bound for mobile graph-ics computing. For example, the OMAP CPU and ARM Cortex-A8 that we studied can hit 1-GHz clock frequency; however, compared with multicore desktop CPUs, the rela-tive amount of on-die resources dedicated to the CPU is still limited for computation-intensive game logic such as optimal path search.
The main findings in our preliminary study to characterize the performance and power consumption of 3D mobile games are that the geometry stage is
the leading bottleneck and the game logic (application) consumes a significant portion of power. However, the power dissipated in a pipeline stage might be a function of the scene complexity: given a game with lower primitive complexity, the energy breakdown might be significantly different.
One limitation of our current work is that we did not remove the impact of disabling stages on the GPU inter-connections and bus. For example, when we disable the fragment-shading stage, the fragment color could be dif-ferent from the normal case because we use stub shaders. Bit toggling on the bus would be affected, so the resultant running time and power of the fragment shading would not be perfectly accurate.
Finally, two 3D game benchmarks might not be enough to expose all the game characterizations of mobile GPU architectures.
To address these limitations, future work could apply the same methodology to focus on 3D games with high primi-tive complexity and low primitive processing requirements and to conduct studies that further break down the geom-etry stage to better understand performance and power bottlenecks.
In addition to studying more games, we plan to use microbenchmarks such as GLBenchmark to expose the performance and energy characteristics of specific units in the graphics pipeline. In addition, we did not study flash videogames that can be played using a Web browser. It would be useful to study the performance and energy char-acterization of these games as well.
Acknowledgments This work is supported in part by Texas NHARP 003652-0058-2007, NSF IIS-0914965, NSF-0751173, NSF-0713249, and NSF-0923479. Any opinions, findings, and conclusions or recommendations expressed in this article are those of the authors and do not necessarily reflect the views of the funding agencies.