Embed Size (px)
Citation preview

Characterizing the interrupt latency of your code
Slide 2
Agenda
• Why do we miss interrupts ?
– How do we currently manage them
• Why is latency characterization a problem.
• Characterizing Interrupt Latency using simulators

Slide 3
Interrupt Latency
• Duration between receiving an interrupt and
processing the same.

Slide 4
Necessary Conditions for Interrupt
Service
• Common across all DSPs
– GIE is enabled.
– NMI is enabled.
– Individual Interrupts are enabled.
– No higher priority interrupt is blocking the lower priority interrupt.
• C6000
– Should not be in branch delay slot
• C64+
– Interruptible but with a delay, which is variable and can be roughly upto 150
cycles.
– Branch delay slots still not interruptible.
• C54xx
– RPT
Slide 5
Why do we miss interrupts
• Possible Causes
• Programmatic error
– missed enabling all relevant bits (GIE, NMI)
• In a non interruptible loop for a long time.
– did not use –min compiler option..
– Hand assembled code in branch delay slot.
• Lot of code between HWI_Disable and HWI_Restore
– Used to lock scratch mem, rather than operating on local
variables for reentrancy.
Slide 6
Joule Interruptability
• Compiler won’t generate the sploop when
– -ms3 compiler switch is used
– Iteration interval > 14
– Dynamic length > 48
– Things that disqualify normal software pipelining (call in
loop, complex control code in loop, etc)
– Optimizer completely unrolls the loop
• would be interruptible.

Slide 7
When is the problem caught
– May not be caught.
– Caught mostly at the system integration stage.
– Cost of Correction is high
a) Full System Debug.
b) Identify Component.
c) Component Debug.

Managing Interrupt Latency

Slide 9
1. Wasteful Jump to ISR, Slows down the execution. Program behaves differently.
2. Can at best measure down to timer period (threshold (least count)).
3. Falsely, may report very small latency
Interuptible
Non Interuptible
Program Counter
Interrupts
Main Code ISR
Finding Interruptability

Slide 10
Problems with this approach
1. Intrusive
• The act of measuring changes the application behavior.
2. Measurement Time α
(1 / Threshold) code keeps jumping to the ISR and the code could become
unnecessarily slower while measuring
3. Needs a lot of automation support to be built. Not
Trivial

Characterizing Interrupt Latency using Simulators

Slide 12
Approach in Simulation
• Observe the Cause, not the symptom
– Monitor GIE disables, branch delay slots, NMI disables.
– Get the worst case latency for a test vector.
– Characterize the interrupt latency of the algorithm.
Slide 13
Inputs to the system
• Inputs
– Test Vector (Program File)
– Measurement Parameters
• Interrupt latency threshold
• Non Inputs– Interrupts (Need not give interrupts to measure the latency)
Slide 14
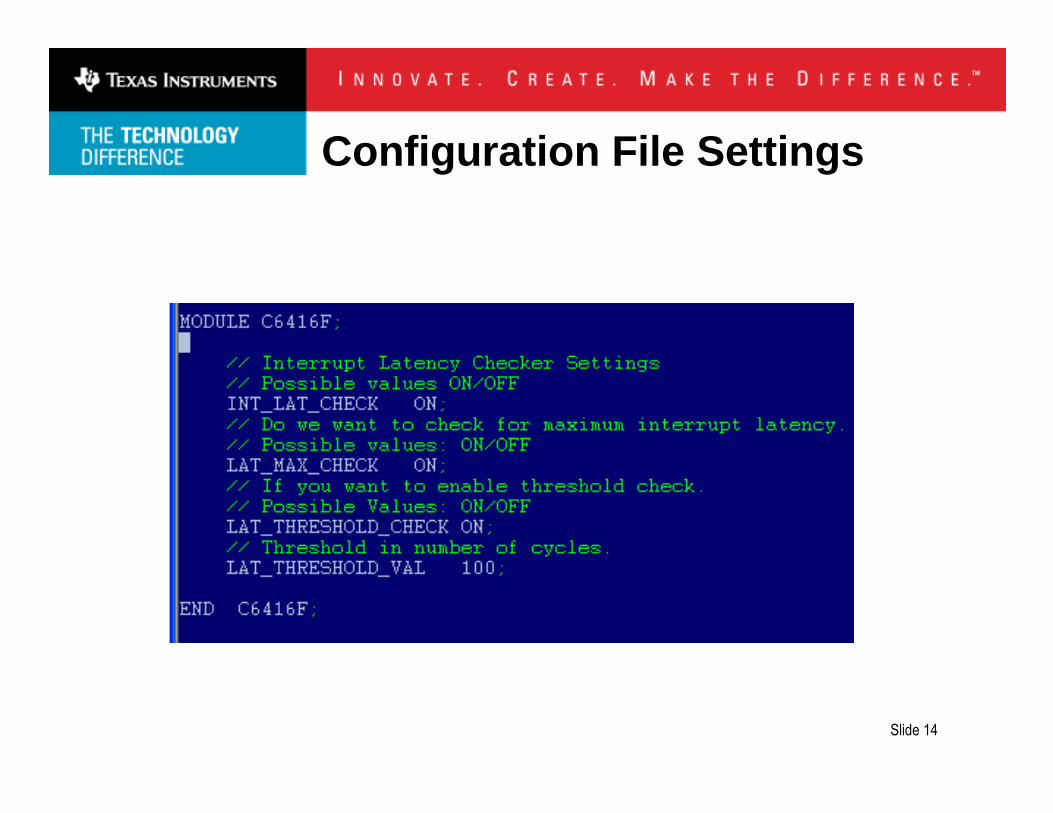
Configuration File Settings
Slide 15
Slide 16
Output
• Summary Output– Maximum interrupt latency of the code
• Start and end PC
• Start and end cycle
• Trace Output– Instances when the interrupt latency exceeds the given threshold
• A trace of all instances of threshold access, with start and end pc and start and end cycle
• Debug Mode– Break the execution when the interrupt latency exceeds the specified threshold.

Slide 17
Interval 0, multiple such start and
stop are possible
Maximum Latency Data
Interrupt State at the start and end of the
measurement
Trace of All Instances when the
latency exceeds specified threshold

Slide 18
Summary of the tool
• Specify the initial settings in
– Simulator Configuration file.
• Load the Application.
• Load the int_lat_measure.gel file
• Identify your profile points and put breakpoints
• Run to BP. Start the profile of interrupt latency through gel command.
• Run to next BP and stop.
• Check the data obtained in the interrupt_trace.csv

Case Study
Slide 20
Problem
• Customer reports Interrupt latency >125� sec
(sampling rate of 8KHz).
• The algorithm supplier quotes <10� sec based on
information from developers

Slide 21
Criticality
• Resulted in loss of interrupts – customer’s
application cannot work in real time
Slide 22
Previous ways to solve it
• First assume that the problem is due to GIE being disabled in one of the 100 scheduled assembly functions.
– (However, if GIE is properly restored, then profile all functions where interrupts are disabled – this might take 2-3 hours)
• Automate the test harness to detect the frame in which status of GIE is not restored
• Manually step through the code for that frame to detect the problem causing function (this might take an hour or so)
Slide 23
Using the tool
• Use the tool to get the Trace Output for instances
where Interrupt Latency exceeds 10� sec (6000
cycles)
• Able to directly get to the problem causing
function within 10 minutes irrespective of the
nature of the cause

Slide 24
Advantages
• Although in this case the assumption about GIE was true,
it may not necessarily be the case. Using the tool, no
such assumption is required
• No dependency on developer to know the Interrupt
Latency – such problems can be detected before release
• Interrupt latency can be quoted confidently

Q&A