Embed Size (px)
Citation preview

University of Pennsylvania University of Pennsylvania
ScholarlyCommons ScholarlyCommons
Summer Program for Undergraduate Research (SPUR) Wharton Undergraduate Research
2018
Characterizing the Economic Analysis of Technology Appraisal in Characterizing the Economic Analysis of Technology Appraisal in
Global Health Systems Global Health Systems
Hoyt Gong University of Pennsylvania
Follow this and additional works at: https://repository.upenn.edu/spur
Part of the Business Commons, Econometrics Commons, and the Health Economics Commons
Recommended Citation Recommended Citation Gong, H. (2018). "Characterizing the Economic Analysis of Technology Appraisal in Global Health Systems," Summer Program for Undergraduate Research (SPUR). Available at https://repository.upenn.edu/spur/24
This paper is posted at ScholarlyCommons. https://repository.upenn.edu/spur/24 For more information, please contact [email protected].
Characterizing the Economic Analysis of Technology Appraisal in Global Health Characterizing the Economic Analysis of Technology Appraisal in Global Health Systems Systems
Abstract Abstract Global Health Technology Assessment (HTA) bodies vary in their scope and approach in Cost Effective Analyses (CEA) evaluating the clinical and economic efficacy of a proposed therapeutic against established metrics. This study characterized specific CEA approaches of various countries across standardized development indices and tested conditions of regression correlation against respective country health outcomes of interest. Additionally, we validate the existence of implicit and explicit values in country willingness-to-pay (WTP) thresholds and its statistically significance with country health expenditure and quality of care. Our multivariate regression models show that while CEA characteristics vary across countries, ultimate health outcomes are not dictated by CEA approach factors but rather in the broader context of country GDPPC development.
Keywords Keywords Comparative Effectiveness Research, Pharmacoeconomics, Health Technology Assessment, cost-effective analysis, outcomes research
Disciplines Disciplines Business | Econometrics | Health Economics
This working paper is available at ScholarlyCommons: https://repository.upenn.edu/spur/24

Characterizing the Economic Analysis of
Technology Appraisal in Global Health Systems
Abstract
Global Health Technology Assessment (HTA) bodies vary in their scope and approach in Cost
Effective Analyses (CEA) evaluating the clinical and economic efficacy of a proposed therapeutic
against established metrics. This study characterized specific CEA approaches of various countries
across standardized development indices and tested conditions of regression correlation against
respective country health outcomes of interest. Additionally, we validate the existence of implicit
and explicit values in country willingness-to-pay (WTP) thresholds and its statistically significance
with country health expenditure and quality of care. Our multivariate regression models show that
while CEA characteristics vary across countries, ultimate health outcomes are not dictated by CEA
approach factors but rather in the broader context of country GDPPC development.
Keywords: Comparative Effectiveness Research, Pharmacoeconomics, Health Technology
Assessment, cost-effective analysis, outcomes research

1
Characterizing the Economic Analysis of
Technology Appraisal in Global Health Systems
Hoyt Gong
The Wharton School, University of Pennsylvania
Faculty Advisor:
Dr. Abby Alpert, PhD
Assistant Professor of Health Care Management
The Wharton School, University of Pennsylvania
August 5, 2018

2
1 Introduction
As the emergence of value based care replaces traditional fee-for-service healthcare delivery
models in provider settings, both public and private payers alike are turning to Evidence Based
Medicine (EBM) to optimize reimbursement and approval decision making. EBM’s use of
formal, analytical methods to align research evidence with medical practice has extended to
policy makers in referencing quality and cost efficacy of potential therapeutics. As these payers
have limited budgets, it is thus necessary to assess the allocation of resources when reviewing
any novel health technology*, despite a common public aversity to ration patient access when
considering therapeutic choices. Payer interest in the value of new health technologies is further
underpinned in controlling increases in price and health consumption if decision making is
transferred to the physician and patient.
The field of Health Technology Assessment (HTA) concerns the investigation and
evaluation of novel health technologies from the payer standpoint when market access requests
are submitted for approval. HTA bodies, created in nations worldwide in the 1970s, reflected the
emergence and advancement of biological technologies challenging conventional social, ethical,
and political status quo (e.g. artificial organs, genetic therapy, stem cell research)1. HTA
techniques are wide in scope in order to most-holistically examine the character of a novel health
technology before decision making occurs. Many components exist to its multidisciplinary
evaluation including societal, economic, and organization implications of the therapy in
appraisal. This paper concerns the particular economic approach of HTA, Cost Effective
*A health technology is defined by the World Health Organization as “the application of organized knowledge and skills in the form of devices, medicines, vaccines, procedures and systems developed to solve a health problem and improve quality of lives.”
3
Analysis (CEA), that countries conduct in the decision making process as HTA bodies across
different countries use different CEA modeling strategies in the evaluation of a novel health
technology. By understanding how variability among CEA approach characteristics affect
country health outcomes including health spending and health quality, we are better able to
model the impact of critical economic decision making factors in policy guidelines of country
health cost containment and health quality improvement.
2 Background
2.1 Cost Effective Analysis (CEA)
Under HTA, the economic analysis of the technology is carried out through a cost effective
analysis (CEA). The objective of CEA is notably summed up through a health equity lens: a
quasi-utilitarian approach to maximize the total health of a population given limited resources. A
CEA measures the cost per outcome unit gained of a treatment against a comparator:
𝐶𝑜𝑠𝑡
𝑂𝑢𝑡𝑐𝑜𝑚𝑒=
Δ𝐶
Δ𝐸 (1)
where costs are presented in monetary units and outcomes are described using quantitative non-
monetary metrics of health quality2. Most commonly, the quality-adjusted life year (QALY) has
been recognized as an internationally used metric when referencing measurements of disease
burden3. The QALY measures the health outcome of a patient through an index combining the
length of life and the patient’s health related quality of life (HRQoL) based on surveys and
various patient reported outcomes4. By standardizing such weights, payers are able to apply
quantitative value to assess the cost-per-QALY of a given health technology, using the
incremental cost-effectiveness ratio (ICER):
4
𝐼𝐶𝐸𝑅 =𝐶𝑛𝑒𝑤 − 𝐶𝑜𝑙𝑑
𝐸𝑛𝑒𝑤 − 𝐸𝑜𝑙𝑑 (2)
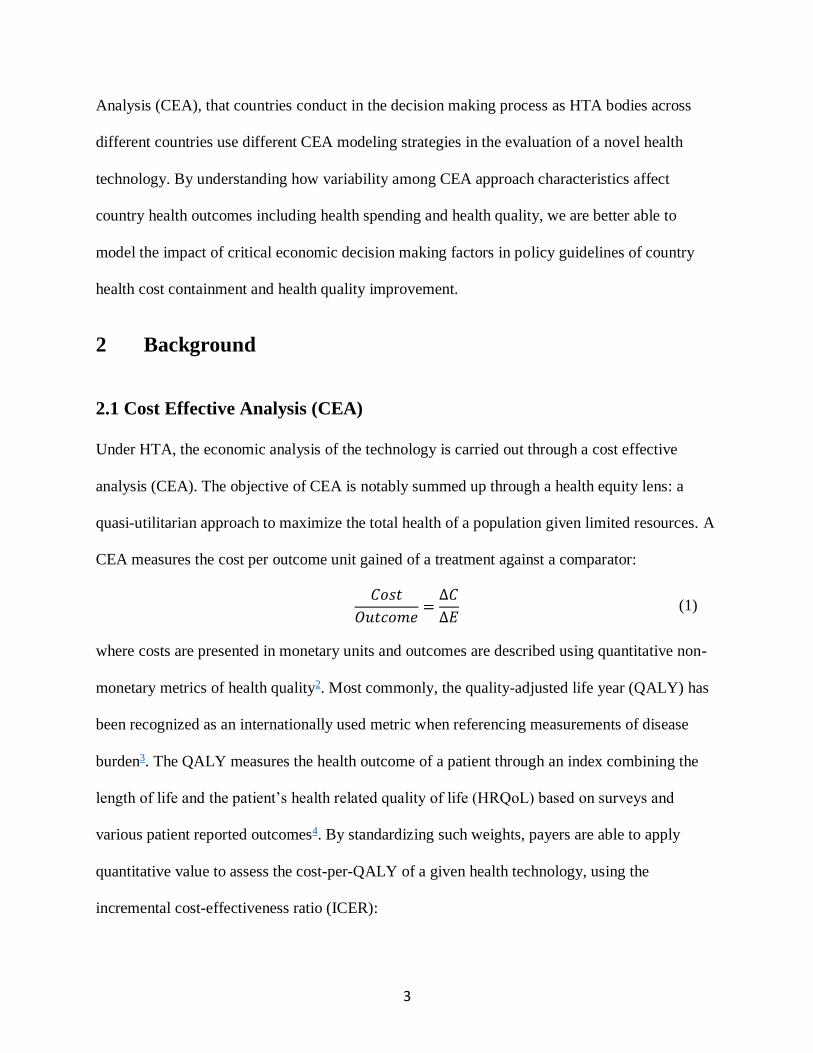
which shows the quantitative benefit of the new treatment against the comparator5. Through
measuring the cost-effectiveness of a novel technology using a ICER, health systems are able to
recognize optimal treatments for patients and enhance the delivery of care based on therapies that
offer maximum incremental value. CEA has potential to both identify and validate potentially
less-complex or cheaper therapies than current standard of care, bringing novel recommendations
to health care payers and providers.
Figure 1: A cost-effectiveness matrix organizing the potential outcomes for a novel technology
against a comparator6. Novel health treatments as points that fall past the threshold are deemed
overall more cost-effective.
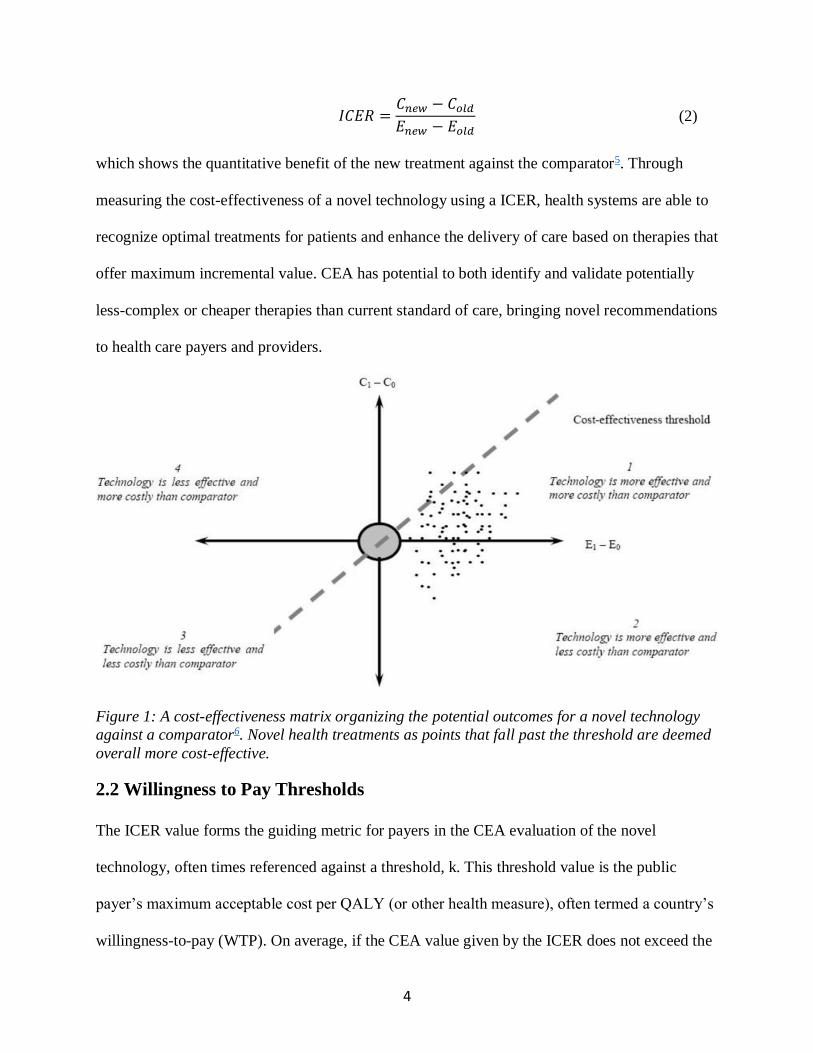
2.2 Willingness to Pay Thresholds
The ICER value forms the guiding metric for payers in the CEA evaluation of the novel
technology, often times referenced against a threshold, k. This threshold value is the public
payer’s maximum acceptable cost per QALY (or other health measure), often termed a country’s
willingness-to-pay (WTP). On average, if the CEA value given by the ICER does not exceed the
5
threshold, the health technology has a stronger likelihood of payer approval reluctance7. This
threshold value, however, is often times nondisclosed, as the metric grants incentives for
pharmaceutical and biotechnology companies to tailor ICER estimates given by
𝑃𝑚𝑎𝑥 = 𝑃𝑜𝑙𝑑 + 𝑘∆𝐸 − ∆𝐶 (3)
in which companies are thus able to compute the max price at which the technology will be
approved, triggering funding. The above maximum price value would thus be a private and
societal gain fully captured, subsequently negotiated down in the healthcare supply chain.
Importantly, each country has distinct thresholds, which then influences the selection of
therapeutics in their respective health system. There exists a threshold either explicitly stated by
the public payer, or implicitly based on the payer’s aggregate data on historical approval price
patterns in cases when the threshold is nondisclosed. Implicitly, it is thought that if many
decisions are observed, it is possible to infer the cost per QALY under which approvals occur,
thereby acting as the implicit cost-effectiveness threshold. These differences in WTP are, in
recent years, known to correlate to the respective country’s ability-to-pay (ATP) for novel health
technologies8, 9.
2.3 Approaches to CEA
Although international structures exist to country-specific pharmacoeconomic guidelines, the
approach to CEA of national HTA bodies vary across countries. The process in which CEA
variables are measured require considerations that are varying by nature as shown in the table
below.

6
Approach Variables of Interest
Units of Effectiveness
Cost Perspectives
Outcome Perspectives
Choice of Comparator
Discount Rate
Time Horizon
Figure 2: Potential variations to a CEA in terms of factors in consideration, detailing the key
attributes to account for costs and outcomes in a cost-effective analysis
These attributes are critical in an investigation and evaluation of a CEA given the different
methods in which the same technology’s costs and outcomes can be measured. Slight variations
in the input attributes can have significant effects on the resulting estimate of a cost-effectiveness
ratio, particularly fragile for ICERs near a country’s WTP.
All studies of novel health technologies conducted by national HTA bodies thus make
clear their methodology in a CEA approach as to validate an analysis compared to another HTA
body. Importantly, while classification of CEA approaches as guided by the International Society
for Pharmacoeconomics and Outcomes (ISPOR) are documented across each country’s HTA
body, no existing literature comparing approaches to health outcomes and health expenditures.
The objective of our research was to investigate the characteristics of cost-effectiveness
approaches for each country, identify variability across CEA approaches, and assess the
correlation between country-specific approaches to CEA and country health and spending related
metrics.
By understanding the role that CEA plays in affecting healthcare spending and quality,
we are able to gain insight into the optimal CEA modeling strategies that will guide efficient
resource allocation of health interventions. At large, identifying CEA approaches that correlate

7
with healthcare outcomes will help inform policy makers and payers on key decisions of
therapeutic choice to advance healthcare cost containment and quality improvement.
2.4 Economic Evaluation Implications
It is important to acknowledge the broader framework of a CEA in the HTA decision making
process. An ICER value from a CEA alone compared against a country’s cost-effectiveness
threshold can only be, at most, an aid in the decision making process. The economic analysis
comprises only one component of a larger technology assessment process and thus may not be
used as the sole factor in a complete decision-making procedure. There must be careful
examinations surrounding the use of threshold values and deriving cost-effectiveness ratios from
a CEA, discussed in later sections.
3 Research Methodology
3.1 Data Sources
The data sources used in the study consists of the following:
1. UN Human Development Index spread (2015)
2. OECD healthcare spending (2017)
3. WHO world health statistics (2016)
4. Implicit and explicit ICER threshold values
5. CEA ISPOR country-specific pharmacoeconomic guidelines
6. IMF GDP per capita, World Economic Outlook (2018)
8
3.1.1 United Nations Human Development Report (2015)10
The United Nations Development Programme contains reference information regarding the
capital and development of global nations in addition to economic growth. This metric, termed
the human development index (HDI), summarizes aggregate dimension indices serving as
measurements for a country’s development: life expectancy index, education index, and gross
national income (GNI) index.
The HDI spread from the 2015 Human Development Index report thus presents an
outline to identify varied countries of interest for further investigation in CEA. Countries for
CEA analysis were selected from the list based on spread of development indices as well as
feasibility for data collection based on previous data points from literature reviews. The resulting
group of selected countries fell within very high human development (VHHD), high human
development (HHD), and medium human development (MHD). VHHD countries consisted of
the G7 nations: Canada, UK, US, France, Germany, Italy, Japan. HHD countries included China,
Brazil, Mexico, and Thailand. MHD countries of analysis included South Africa and India.
3.1.2 OECD Health Expenditure and Financing Database (2017)11
Metrics for country health expenditure data were pulled from the Organisation for Economic Co-
operation and Development’s health spending database. The OECD defines healthcare
expenditure as the “final consumption of health care goods and services” which includes both
individual care consumption and collective health administration and public health spending, but
excludes spending on investments (e.g. pharmaceutical R&D dollars and bench research). For
each country, the aggregate health spending value was taken with respect to voluntary, out-of-
pocket, and government/compulsory expenditures.
9
3.1.3 WHO World Health Statistics12
Life expectancy data from the World Health Organization served as a proxy for individual
country’s health outcomes. Life expectancy as measured by the average number of years of
lifetime survival, applied to both males and females, serves as a reflection of a country’s overall
mortality level in its population. Driven by public health and medical interventions, the
numerical lifespan acts as a quantitative value representing the quality of care within a country.
Thus, mortality and health expenditure data serve as outcome variables of interest when
examining correlations with respect to CEA approach.
3.1.3 Implicit and Explicit ICER Threshold Values
In order to locate data on country WTP, often an implicit value, an assessment of both academic
literature and country-specific government health insurance programs allowed for source
reliability and information cross-checking. Comparative effectiveness thresholds for all countries
selected were gathered based on persistent, similar line-item values from secondary sources in
academic literature and payer HTA process documents. Final data inputs relied upon an average
of upper and lower threshold values (when available) converted to 2017 USD.
Specifically, only the United Kingdom’s and Thailand’s HTA bodies, the National
Institute for Health and Care Excellence (NICE) and the Health Intervention and Technology
Assessment Program (HITAP) respectively, explicitly mention a threshold value used to guide
decision making. These threshold values were sourced directly from online HTA website
literature for both the two countries. The remaining countries do not delineate set values for a
threshold on official HTA-related released literature; thus requiring further investigation into
historic patterns of approval prices to arrive at an implicit WTP threshold. Implicit country
threshold values were thus cross checked on multiple sources of academic literature and country-
10
specific health technology economic assessment bodies to derive repeatable estimates. The
articles used are cited in the threshold column of Figure 3 below in the results section. Of
particular note is the usage of Wood’s approach13 to derive threshold estimates for less
developed nations without well-established HTA bodies that lacked detailed cost-effectiveness
analysis explanations. Woods creates a predictive model extrapolating from the United Kingdom
cost-effectiveness threshold to estimate opportunity-cost-based WTP for low/middle income
countries, for which there had previously been no values available.
3.1.4 CEA ISPOR Country-specific Pharmacoeconomic Guidelines14
The International Society for Pharmacoeconomics and Outcomes (ISPOR) specializes in health
economics & outcomes research (HEOR) and includes data on variables related to cost-
effectiveness approaches in assessing a novel technology. ISPOR’s data system includes
information on guidelines used as an “analytical tool used with increasing frequency to assist
decision making in the financing and management of pharmaceutical products.” These guidelines
for each selected country serve as the regression inputs for comparison against health outcomes
of interest. In situations where CEA approach data was not available through ISPOR’s
pharmacoeconomic guidelines, academic literature was referenced for specific data points.
3.1.5 IMF GDP Per Capita Prices, World Economic Outlook (2018)15
In order to account for the effect that inherent country development holds on the country’s ATP,
GDP per capita and population statistics were gathered from the International Monetary Fund’s
World Economic Outlook report for each selected country. The regression is controlled for these
other, non-CEA approach-related factors that may impact healthcare spending, effectively
isolating the interaction of CEA attributes on outcomes of interest.

11
3.2 First Round Regression
To examine the role of WTP threshold data in a country’s HTA, univariate linear regression
models of WTP were tested against outcomes of interest. Country WTP threshold data is noted to
proportionally relate to health expenditure and health quality. By determining the correlation
between WTP threshold data and regression outcomes, we are able to determine if such
relational factors exist and maintain WTP threshold data in further regression analysis as a
controlling variable in later regressions with all CEA approach characters as explanatory
variables of interest. This controls for the influence of the threshold variable on outcomes of
interest, isolating potential effect of CEA attributes on outcomes further.
Upon confirming WTP relationship, multivariate least squares regression were run on
country approach factors against outcomes of interest. This phase two of first round regression
gives insight into the strength of the correlation between CEA approach variables and outcomes,
modeling both continuous and dummy variable effects on country health expenditure and life
expectancy.
3.3 Second Round Regression In order to test conditions of correlation between CEA attributes and outcome variables of
interest, we construct various multiple regression linear models with stepwise ANOVA trials. To
control for other country-specific factors, we include variables with significant effect on
outcomes of interest from first round regressions. Through stepwise analysis, multivariate model
selection based on a minimum Bayesian Information Criterion (BIC) stopping rule determine
CEA attribute effect on outcomes of interest. The stepwise regression fit serves to maximize the
likelihood function, L(), through estimating the variable parameters, , that maximize the

12
probability density functions at the observed data points. The BIC perspective to assess stepwise
model fit is defined as:
𝐵𝐼𝐶 = −2𝐿𝑜𝑔(𝐿()) + 𝑘𝑙𝑛(𝑛) (4)
where k is the number of estimated parameters and n is the number of model observations in
reframing likelihood maximization as minimizing negative log-likelihood. Thus a BIC stepwise
fit maximizes parameter fit of potential multivariable effects on outcomes of interest.
4 Results
4.1 Threshold Values Both explicit and implicit WTP values were collected for selected countries through identifying
data from each country’s established public health economics and outcomes research (HEOR) or
HTA body. Final ICER thresholds were based on selected upper and lower threshold values,
converted to USD and adjusted for inflation to 2017 prices. Explicit thresholds, consisting of
only the United Kingdom and Thailand, were gathered from public government disclosures.
Implicit thresholds determined through literature reviews on academic journals and government
databases formed the upper and lower threshold bounds, of which the mean formed the threshold
value. The thresholds used in the study are listed in Figure 3.
Table 1 Established ICER Thresholds by Country
Country HEOR or HTA Body HDI T-L USD T-U USD ICER Threshold
Canada
Canadian Agency for Drugs and Technology in Health (CADTH)
Very High $38,199 $38,19916
UK National Institute for Health and Care Excellence (NICE)
Very High $26,576 $39,864 $33,22017

13
US Agency for Healthcare Research and Quality (AHRQ)
Very High $50,000 $150,000 $100,00018, 19
France Haute Autorité de Santé (HAS)
Very High $35,263 $35,26320, 21
Germany
Institute for Quality and Efficiency in Health Care (IQWiG)
Very High $133,881 $5,228 $69,55422
Italy Italian National Health Services (NHS)
Very High $29,363 $29,36323
Japan Central Social Insurance Medical Council
Very High $45,259 $54,311 $49,78524
China China Ministry of Health (MoH) High $4,210 $5,814 $5,01225
Brazil Brazil Ministry of Health High $2,153 $23,016 $12,58526
Mexico Mexico General Health Council High $24,083 $6,953 $15,51813
Thailand
Health Intervention and Technology Assessment Program (HITAP) High $4,826 $4,82627
S. Africa Republic of South Africa Department of Health Medium $1,211 $4,857 $3,03413
India Medical Technology Assessment Board (MTAB) Medium $118 $793 $45613
Figure 3: List of collected threshold values by country in inflation adjusted 2018 USD prices.
4.2 CEA Approaches
The following table documents the CEA approach of each country based on Figure 2’s list of
attributes on cost-effective variables. Attributes consist of both categorical and numeric data,
referring to the methods and perspectives taken in the CEA calculations when assessing value of
a novel health technology.

14
Tab
le 2
C
ost
-eff
ecti
ven
ess
Ap
pro
ach
Co
un
try
Life
Ex
pec
tan
cy
Hea
lth
Ex
pen
dit
ure
C
ost
Per
spec
tive
O
utc
om
es
Per
spec
tive
Ef
fect
iven
ess
Un
its
Dis
cou
nt
Rat
e
Can
ada28
79
.3
$4,8
26
P
ub
licly
fu
nd
ed h
ealt
h c
are
pay
er
Dir
ect
hea
lth
aff
ects
+
Car
etak
ers
QA
LYs
3%
UK
29
81.2
$4
,26
4
Pu
blic
ly f
un
ded
hea
lth
car
e p
ayer
D
irec
t h
ealt
h a
ffec
ts +
C
aret
aker
s Q
ALY
s 4%
US30
82
.2
$10,
209
P
ub
licly
fu
nd
ed H
ealt
h c
are
pay
er
Dir
ect
hea
lth
aff
ects
+
Car
etak
ers
QA
LYs
2%
Fran
ce31
, 32
82.4
$4
,90
2
Wid
est
po
ssib
le p
ersp
ecti
ve (
all
pay
ers)
In
div
idu
al
Pat
ien
t re
leva
nt
ou
tco
mes
4%
Ger
man
y33
81
$5,7
28
P
ub
licly
fu
nd
ed h
ealt
h c
are
pay
er
Ind
ivid
ual
P
atie
nt
rele
van
t o
utc
om
es
3%
Ital
y34
82.7
$3
,54
2
Soci
etal
So
ciet
al
QA
LYs
3%
Jap
an35
83
.7
$4,7
17
P
ub
licly
fu
nd
ed h
ealt
h c
are
pay
er
Ind
ivid
ual
Q
ALY
s 2%
Ch
ina36
76
.1
$762
So
ciet
al
Ind
ivid
ual
Q
ALY
s 4%
Bra
zil37
75
$1
,40
2
Pu
blic
ly f
un
ded
hea
lth
car
e p
ayer
In
div
idu
al
QA
LYs
5%
Mex
ico
38
76.7
$1
,03
4
Pu
blic
ly f
un
ded
hea
lth
car
e p
ayer
H
eal
th s
yste
m
QA
LYs
5%
Thai
lan
d3
9
74.9
$2
16
Soci
ety
Ind
ivid
ual
Q
ALY
s 3%
Sou
th
Afr
ica40
62
.9
$1,0
90
Th
ird
-par
ty p
ayer
So
ciet
al
QA
LYs
5%
Ind
ia41
68
.3
$238
So
ciet
al
Soci
etal
Q
ALY
s 5%
F
igure
4:
Appro
ach
vari
ab
les
coll
ecte
d f
or
CE
A a
ttri
bute
analy
sis.
Choic
e o
f co
mpara
tor
and t
ime
hori
zon c
ate
gori
es w
ere
rem
oved
fro
m t
he
data
set
as
ther
e w
as
min
imal
vari
ati
on a
cross
sel
ecte
d c
ountr
ies;
all
ref
eren
ced t
he
sam
e ch
oic
e fo
r co
mpara
tor
and s
am
e ti
me h
ori
zon.
15
4.3 First Round Regressions
Least squares regression were run for all variables of interest on two principal health outcomes:
health expenditures per capita and life expectancy from the country level of observation. The
resulting coefficient estimates from multivariate models are shown below.
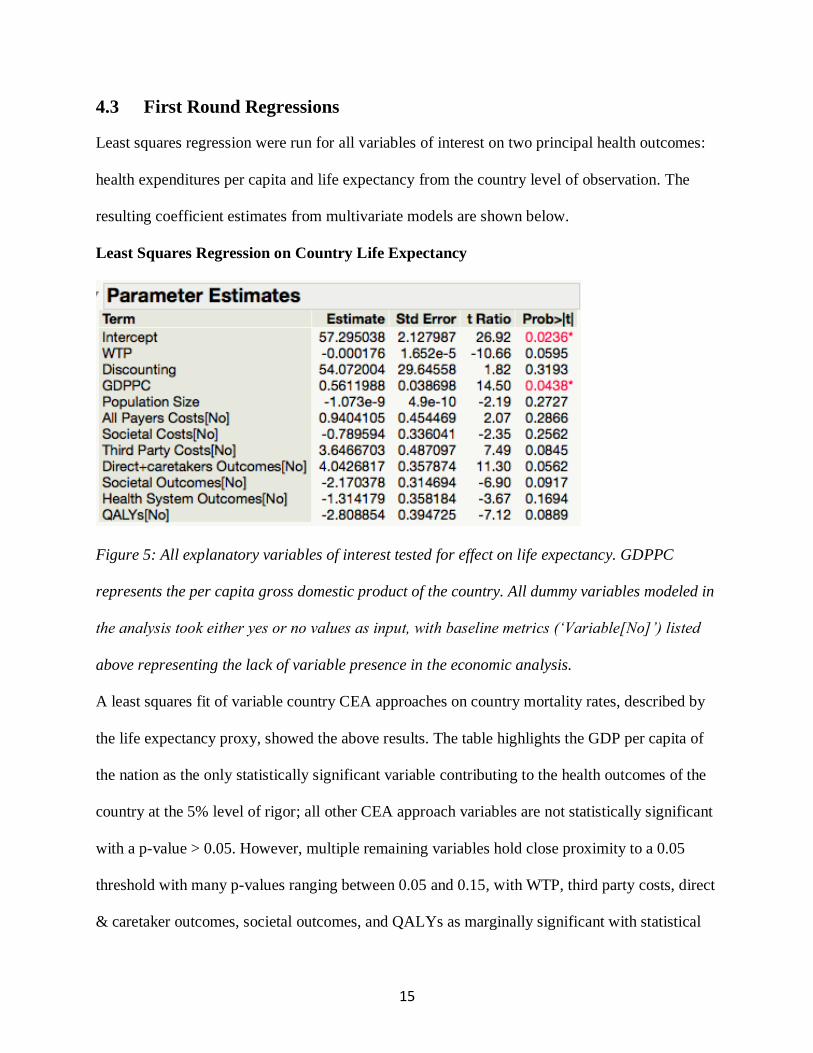
Least Squares Regression on Country Life Expectancy
Figure 5: All explanatory variables of interest tested for effect on life expectancy. GDPPC
represents the per capita gross domestic product of the country. All dummy variables modeled in
the analysis took either yes or no values as input, with baseline metrics (‘Variable[No]’) listed
above representing the lack of variable presence in the economic analysis.
A least squares fit of variable country CEA approaches on country mortality rates, described by
the life expectancy proxy, showed the above results. The table highlights the GDP per capita of
the nation as the only statistically significant variable contributing to the health outcomes of the
country at the 5% level of rigor; all other CEA approach variables are not statistically significant
with a p-value > 0.05. However, multiple remaining variables hold close proximity to a 0.05
threshold with many p-values ranging between 0.05 and 0.15, with WTP, third party costs, direct
& caretaker outcomes, societal outcomes, and QALYs as marginally significant with statistical

16
significance at the 10% level. This poses near significant variables that should be investigated
more closely in stepwise second round ANOVA regressions.
According to the data table, GDPPC serves as the best predictor of life expectancy, given
that it was used as a controlling factor for the country’s development status. The predictor thus
illustrates that while approach characteristics vary across all countries selected in the analysis,
ultimate health outcomes are not dictated by CEA approach factors but rather in the broader
context of country development. No clear correlation exists between country CEA approach and
life expectancy, signaling that variability among factors in economic analysis calculations do not
significantly correlate with a country’s health outcomes.
Least Squares Regression on Country Health Expenditure
Figure 6: All explanatory variables of interest tested for effect on health expenditure
The least squares fit of CEA approach variables on country health expenditure show minimal
correlation with no variables holding statistically significant effect on per capita health
expenditures. The explanatory variables used in the analysis include all economic factor
approaches in cost-effectiveness while removing country population as the health expenditure
outcome accounts for per capita effect. Given no p-value < 0.05, the model results suggest that
CEA approach factors do not significantly correlate with health expenditure. Both least square

17
regression fits serve to validate that heterogeneity indeed exists within country CEA approaches
with minimal correlation to health outcomes.
4.4 Second Round Regressions The second analysis conducted on the dataset relied on a multivariate stepwise ANOVA study
with a minimum BIC approach set on a forward direction. This stepwise regression model
functions as a method for identification of the optimal parameters in each regression, maximizing
the likelihood function given in equation 4.
Stepwise Regression on Country Life Expectancy
Figure 7: A minimum BIC stepwise regression of multivariate character on life expectancy
The maximization of probability density for parameter fit given by the stepwise analysis show
that all CEA approach variables fall within the optimal model. P-values of explanatory variables
show distinct differences in strength from least squares regression but all fall within a general
range of 0.05 to 0.30. Such resulting values demonstrate that we are unable to form a correlation
of CEA approach variables on country life expectancy with 95% confidence. Rather, a lower
18
confidence level assumed in the model is taken in stepwise regression with greater density
distribution fit.
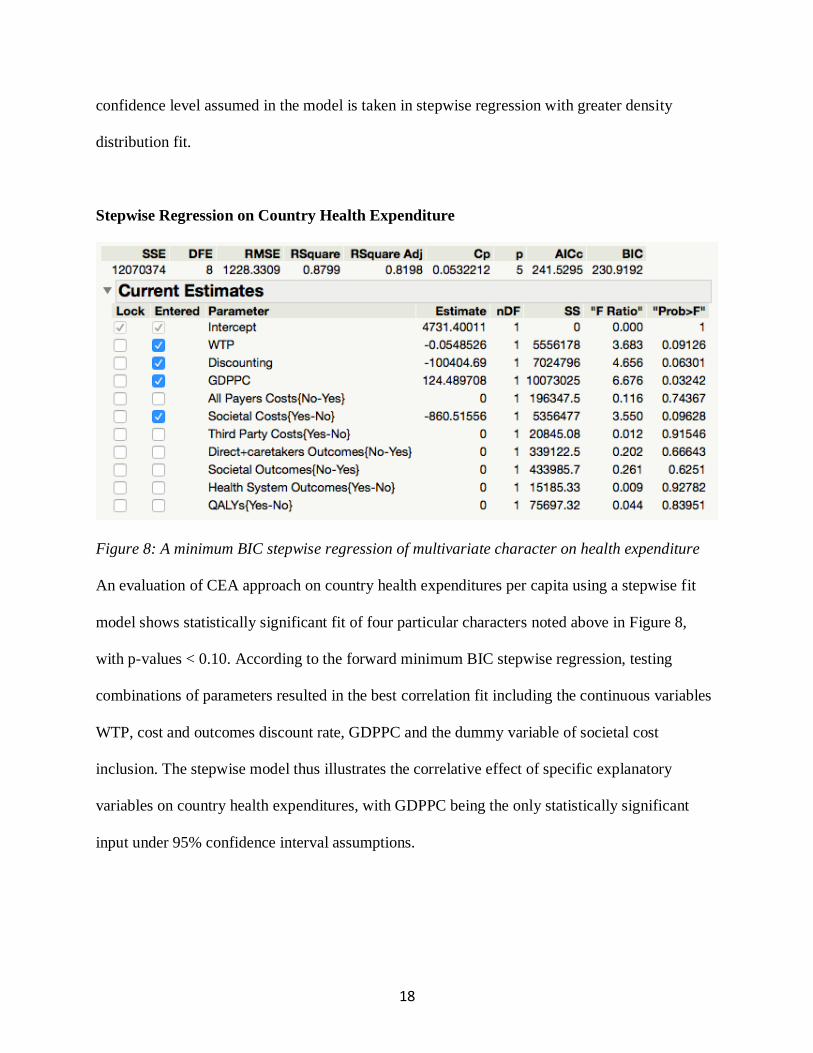
Stepwise Regression on Country Health Expenditure
Figure 8: A minimum BIC stepwise regression of multivariate character on health expenditure
An evaluation of CEA approach on country health expenditures per capita using a stepwise fit
model shows statistically significant fit of four particular characters noted above in Figure 8,
with p-values < 0.10. According to the forward minimum BIC stepwise regression, testing
combinations of parameters resulted in the best correlation fit including the continuous variables
WTP, cost and outcomes discount rate, GDPPC and the dummy variable of societal cost
inclusion. The stepwise model thus illustrates the correlative effect of specific explanatory
variables on country health expenditures, with GDPPC being the only statistically significant
input under 95% confidence interval assumptions.
19
4.5 Discussion
The motivation behind the research question presented in this paper relies on the heterogeneous
approach factors in a cost-effectiveness economic analysis of each country. Through literature
reviews and pulling metrics from datasets, we were able to run multivariate regressional analyses
testing correlative strength of CEA approach characteristics. By modeling correlations of country
economic approach variables with health related outcomes of interest, the strength of each
variable’s effect on country health outcomes is measured. It was hypothesized that CEA
approach variability would demonstrate correlation to health outcomes in line with different
economic perspectives in an HTA corresponding to different health outcomes. To control for
tests of interest with CEA approach and health outcome variables in addition to country-specific
economic character, univariate fit lines constructed for WTP on outcome variables demonstrated
valid inclusion of a country’s threshold value in the CEA approach regression analysis.
Results from the first round multivariate regression tests show minimal variable
correlation with outcomes of interest. Using a p-value threshold of 0.05, country GDP per capita
is the only statistically significant value to correlate with life expectancy. The basis behind the
correlation can be explained through country development status where a higher GDPPC
signifies a more overall developed country, including its healthcare system thus correlating with
quality of healthcare given by the life expectancy proxy. A similar model applied to health
expenditure shows minimal correlation, with no variables in the analysis showing statistically
significant p-values. These results from first round suggest that while CEA approach variables
are heterogenous across countries, they hold no significant effect on influencing country health
outcomes.

20
A second round multivariate regression using a stepwise fitting method maximized the
likelihood function, L(),and formed correlative fits based on optimization models. The stepwise
fit against country life expectancy registered all CEA approach variables in the model, fitting all
economic perspective variation to explain quality of healthcare. This direct contrast to the first
round regression in which only GDPPC was significantly correlated with life expectancy
demonstrate the need for further statistical examinations and methods to pinpoint effect.
Similarly, a contrast was observed to first round regressions in a fit on health expenditure in
which key variables held statistical significance whereas no correlation was observed in the least
squares model.
Nonetheless, as the stepwise regression holds a lower confidence interval of significance
and includes variables with p-values of lower strength than the least squares multivariate fit, the
results of first round regression hold greater precision and acts as a more robust analysis. Thus
we infer from our data reports that while stepwise regression contributes a separate perspective
in a cost-effectiveness approach model, the least squares models holds greater probability of
explanation in which GDPPC correlates with country life expectancy and no approach variation
correlate with country health expenditure.

21
4.6 Limitations
The study faces limitations in scope due to data-collection constraints. As WTP threshold metrics
are non-disclosed points kept within government records, it is difficult to pinpoint precision
behind the values used in the analysis. A general scope of public literature is not as accurate as
primary research from source officials, requiring broader research methods and further direct
investigation with government data reports. Additionally, similar issues arose in data collection
of cost-effectiveness approach variables as report information is not clearly delineated across
country government reports. The variables used in the analysis consisted of all heterogenous
approach variations despite some similarities across country economic approaches. Other
variables to control for country-specific characteristics in affecting outcomes of interest may be
required as the usage of GDPPC and population size are only nominally correlative with health
expenditure and life expectancy.
22
5 Summary and Recommendations
5.1 Summary
Through an investigation of country specific cost-effective approaches, the study aimed to derive
correlations between variability across country CEA approach attributes and health outcomes of
interest. A least squares regression supported with a stepwise multivariate method showed that
while heterogeneity exists among a government’s HTA economic analysis, CEA approach
differences do not significantly correlate directly with country health expenditure nor quality of
care delivered. Additionally, the study was able to successfully characterize country WTP
thresholds and correlate the threshold values, both implicit and explicit, with outcomes of
interest. It was determined that both these threshold values exist for each country and such values
held relationships with country health outcomes. Overall, despite proper characterization of
country WTP and CEA approach attributes across a country’s HTA or Health Economics &
Outcomes Research (HEOR) body, there are no statistically significant effects of a variable in
CEA approach on country related health outcomes.

23
5.2 Recommendations for Further Studies
In further investigation of HTA economic approach, two primary recommendations are offered:
First, it is recommended that economic approach characteristics are broken down further
across countries to capture greater perspective variation. While the current study captured
various categorical and continuous variables across government systems, breakdown of
economic analysis approaches can be categorized into greater segments. Through assessing
greater variability across country methods, one is able to add additional explanatory effect into a
regression analysis and capture greater detail in country differences to CEA approach.
Second, emphasis must be placed on this study as a correlative analysis and not causal. It
is suggested that in order to study causal links of a CEA approach on health outcomes of interest,
one must track cross-sectional time points by tracking data over multiple years to account for
how a country’s change in CEA approach affects its respective health system. More data points
across a greater number of countries may be utilized in a future analysis to expand the
explanatory strength of the regression tests. Through incorporating further statistical models on
both a greater n and a causal analysis, researchers may be able to derive optimal CEA approach
links to health outcomes.
24
References
1. Goodman, Clifford. HTA 101: introduction to health technology assessment. US National
Library of Medicine, National Institutes of Health, National Information Center on
Health Services Research and Health Care Technology (NICHSR), 2004.
2. Weinstein, Milton C., and William B. Stason. "Foundations of cost-effectiveness analysis
for health and medical practices." New England journal of medicine 296, no. 13 (1977):
716-721.
3. Weinstein, Milton C., George Torrance, and Alistair McGuire. "QALYs: the
basics." Value in health 12 (2009): S5-S9.
4. Torrance, George W., and David Feeny. "Utilities and quality-adjusted life
years." International journal of technology assessment in health care 5, no. 4 (1989):
559-575.
5. Siegel, Joanna E., Milton C. Weinstein, Louise B. Russell, and Marthe R. Gold.
"Recommendations for reporting cost-effectiveness analyses." JOURNAL-AMERICAN
MEDICAL ASSOCIATION 276 (1996): 1339-1341.
6. Simoens, Steven. "Health economic assessment: a methodological primer." International
journal of environmental research and public health 6, no. 12 (2009): 2950-2966.
7. Neumann, Peter J., Joshua T. Cohen, and Milton C. Weinstein. "Updating cost-
effectiveness—the curious resilience of the $50,000-per-QALY threshold." New England
Journal of Medicine 371, no. 9 (2014): 796-797.
8. Schwarzer, Ruth, Ursula Rochau, Kim Saverno, Beate Jahn, Bernhard Bornschein,
Nikolai Muehlberger, Magdalena Flatscher-Thoeni et al. "Systematic overview of cost–

25
effectiveness thresholds in ten countries across four continents." Journal of comparative
effectiveness research 4, no. 5 (2015): 485-504.
9. Mwamburi, Mkaya, Anagha Gogate, and M. B. A. John Proach. "The Use of Incremental
Cost-Effectiveness Ratio Thresholds in Health Technology Assessment Decisions."
10. United Nations Development Programme (Kenya). Kenya Human Development Report.
United Nations Development Programme, 2001.
11. OECD (2018), Health spending (indicator).
12. World Health Organization. World health statistics 2016: monitoring health for the SDGs
sustainable development goals. World Health Organization, 2016.
13. Woods, Beth, Paul Revill, Mark Sculpher, and Karl Claxton. "Country-level cost-
effectiveness thresholds: initial estimates and the need for further research." Value in
Health 19, no. 8 (2016): 929-935.
14. Eldessouki R, Smith MD, Health Care System Information Sharing: A Step Toward
Better Health Globally. Value Health Regional Issues 2012; 1:118-129
15. International Monetary Fund. World Economic Outlook (April 2018). IMF, 2018.
16. Canada 2020 Analytical Commentary: No. 3. Valuing Health in Canada – Who, How,
and How Much? Canada 2020, 2013.
17. McCabe, Christopher, Karl Claxton, and Anthony J. Culyer. "The NICE cost-
effectiveness threshold." Pharmacoeconomics26, no. 9 (2008): 733-744.
18. Grosse, Scott D. "Assessing cost-effectiveness in healthcare: history of the $50,000 per
QALY threshold." Expert review of pharmacoeconomics & outcomes research 8, no. 2
(2008): 165-178.
26
19. Institute for Clinical and Economic Review. ICER Value Framework Discussion of
Revision Options (2017). ICER, 2017.
20. Roussel, Ronan, Luc Martinez, Tom Vandebrouck, Habiba Douik, Patrick Emiel,
Matthieu Guery, Barnaby Hunt, and William J. Valentine. "Evaluation of the long-term
cost-effectiveness of liraglutide therapy for patients with type 2 diabetes in
France." Journal of medical economics 19, no. 2 (2016): 131-144.
21. Thokala, Praveen, and Alejandra Duenas. "Multiple criteria decision analysis for health
technology assessment." Value in Health 15, no. 8 (2012): 1172-1181.
22. Institute for Quality and Efficiency in Health Care. "General methods for the assessment
of the relation of benefits to costs." (2009).
23. Mencacci, Claudio, Guido Di Sciascio, Pablo Katz, and Claudio Ripellino. "Cost-
effectiveness evaluation of escitalopram in major depressive disorder in
Italy." ClinicoEconomics and outcomes research: CEOR 5 (2013): 87.
24. Shiroiwa, Takeru, Ataru Igarashi, Takashi Fukuda, and Shunya Ikeda. "WTP for a QALY
and health states: More money for severer health states?." Cost Effectiveness and
Resource Allocation 11, no. 1 (2013): 22.
25. Zhao, Fei-Li, Ming Yue, Hua Yang, Tian Wang, Jiu-Hong Wu, and Shu-Chuen Li.
"Willingness to pay per quality-adjusted life year: is one threshold enough for decision-
making? results from a study in patients with chronic prostatitis." Medical care(2011):
267-272.
26. Ribeiro, R. A., J. L. Neyeloff, M. A. Marcolino, F. S. Falcetta, M. Hauck, R. D. Plentz,
and C. A. Polanczyk. "Cost-Effectiveness Threshold in Brazil Through A League-Table
Approach: Systematic Review." Value in Health 20, no. 9 (2017): A859-A860.
27
27. Health Intervention and Technology Assessment Program. Thailand’s Perspective on
Cost-effectiveness and Financing of Vaccines. International Rotavirus Symposium, 2016.
28. CADTH Methods and Guidelines. Guidelines for the Economic Evaluation of Health
Technologies: Canada 4th Edition. Canadian Agency for Drugs and Technologies in
Health (CADTH), 2017.
29. National Institute for Health and Care Excellence. The Guidelines Manual: Process and
Methods. NICE, 2012.
30. Institute for Clinical and Economic Review. Overview of the ICER Assessment
Framework and Update for 2017-2019. ICER, 2017.
31. Haute Autorité de Santé. A Methodological Guide: Choices in Methods for Economic
Evaluation. Department of Economics and Public Health Assessment, 2012.
32. Massetti, Marc, Samuel Aballéa, Yann Videau, Cécile Rémuzat, Julie Roïz, and Mondher
Toumi. "A comparison of HAS & NICE guidelines for the economic evaluation of health
technologies in the context of their respective national health care systems and cultural
environments." Journal of market access & health policy 3, no. 1 (2015): 24966.
33. Ivandic, Victor. "Requirements for benefit assessment in Germany and England–
overview and comparison." Health economics review 4, no. 1 (2014): 12.
34. Capri, Stefano, Adriana Ceci, Lorenzo Terranova, Franco Merlo, Lorenzo Mantovani,
and Members of the Italian Group for Pharmacoeconomic. "Guidelines for economic
evaluations in Italy: recommendations from the Italian group of pharmacoeconomic
studies." Drug information journal 35, no. 1 (2001): 189-201.
35. Kennedy-Martin, Tessa, Beth D. Mitchell, Kristina S. Boye, Wen Chen, Bradley H.
Curtis, Jennifer A. Flynn, Shunya Ikeda et al. "The health technology assessment

28
environment in mainland China, Japan, South Korea, and Taiwan—implications for the
evaluation of diabetes mellitus therapies." Value in Health Regional Issues 3 (2014): 108-
116.
36. Liu, G. E., S. L. Hu, J. H. Wu, J. Wu, L. Yang, and H. C. Li. "China guidelines for
pharmacoeconomic evaluations." China. J Pharmaceut Econ 3 (2011): 1-48.
37. De Mello Vianna, C. M., and R. Caetano. "Methodological Guidelines: Economic
Evaluation of Health Technologies." Brazil: Ministry of Health (2009).
38. Augustovski, Federico, Osvaldo Ulises Garay, Andres Pichon-Riviere, Adolfo
Rubinstein, and Joaquín E. Caporale. "Economic evaluation guidelines in Latin America:
a current snapshot." Expert review of pharmacoeconomics & outcomes research 10, no. 5
(2010): 525-537.
39. Teerawattananon, Yot. "Thai health technology assessment guideline
development." Journal of the Medical Association of Thailand 91, no. 6 (2011): 11.
40. Gray, Andy, and Fatima Suleman. "Pharmaceutical pricing in South Africa."
In Pharmaceutical Prices in the 21st Century, pp. 251-265. Adis, Cham, 2015.
41. Gupta, S. K. "Proposed pharmacoeconomics guidelines for India (PEG-I)." IPSOR
India 79 (2013): 100.