Embed Size (px)
Citation preview

CHARACTERIZING LIQUID AND SOLID WASTES IN THE MARCELLUS:
Paul Ziemkiewicz, PhD, DirectorWater Research InstituteWest Virginia University
ETD26 WVU/KU Workshop18, 19 July 2017

MARCELLUS SHALE ENERGY AND ENVIRONMENT LABORATORY
MSEEL

WATER WITHDRAWALS
Major sources:
surface watermunicipalitiesrecycled produced water
Water Withdrawals
West Virginia University 3

THREE WELL PADS: GREENE CO. PA
Well spacing
~ 2,500 ft

PRODUCING WELL SITE: 4 WELLS
• 2 hectares total• access/service road• Out slopes
• 1.2 hectares pad• well heads• separators• condensate tanks

PRODUCING WELL SITE WITH FLOWBACK POND6 HECTARES
• access/service road
• well heads• separators• condensate tanks

Terminology: liquids• Makeup water-impoundments/tanks
– fresh water– Produced water
• Hydraulic fracturing fluid-frac fluid~ 4 to 6 MM gal injected– Makeup water +– Proprietary mixture of chemicals– Proppant
• Flowback-produced waterFluids returned from the well after frac~70-90% lost in formation
• Recycle– Flowback-produced water used for makeup

Fluids at the well site

MSEEL Chemical Characterization
•Flowback/produced water•Sampled at upstream end of separators
•Hydraulic fracturing fluid•Drilling mud

PRODUCED WATER VOLUME
From Northeast Natural Energy’s production logs
Two well sets on the MIP well pad• 4H, 6H-completed in 2011• 3H, 5H-completed in 2015

Produced water volumes: ~ 6.4 bbl/day1 bbl = 0.16 m3
1 m3 = 6.29 bbl

Water/gas production ratioaverage: 4H, 6H = 4.2 bbl/MMCF
Average 3H, 5H Average 4H, 6H

Water production
days post HF injectedcompletion gal % injected gal
MIP 3H 392 274,102 2.6% 10,404,198 MIP 5H 392 192,134 2.0% 9,687,888 MIP 4H 1844 501,396 12.0% 4,160,982 MIP 6H 1844 229,183 7.5% 3,042,396
cumulative produced water

Evolution of produced water

Ion composition old wellsCumulative water prod. All wells

Flowback day 1246 (% TDS)
Major (98%)
and
Minor ions

In produced water Chloride is the dominant anion:solubility vs. sulfate and carbonate minerals

TDS and radiumTDS levels off between
100 and 150 g/L
Rads: 226 Ra increases in 3H, 5H.
Declines to ~ 350 pCi/L in 4H, 6H

Nearly all parameters were higher in flowback than frac fluid
Date 10-Nov-15 10-Nov-15 18-May-16well MW 3H HF 3H MIP 3H
analyte FB days -30 -30 160Na mg/L 31.0 62.0 29,000 Ca mg/L 36.0 35.0 11,000 Ba mg/L 0.1 0.0 4,500 Sr mg/L 0.4 0.3 2,300 Mg mg/L 9.7 9.7 1,100 Fe mg/L 0.1 3.9 320 K mg/L 2.5 4.3 180
Mn mg/L 0.0 0.2 13.0Zn mg/L 0.0 0.1 0.6Ni mg/L 0.0 0.0 0.2As mg/L 0.0 0.0 0.1Cr mg/L 0.0 0.0 0.1Pb mg/L 0.0 0.0 0.0Al mg/L 0.0 0.8 BDLSe mg/L 0.0 0.0 BDLAg mg/L 0.0 0.0 BDLCl mg/L 15 48 72,000 Br mg/L 0 BDL 693
Alk mg/L 60 80 330 SO4 mg/L 130 120 BDLTDS mg/L 260 420 120,000

Organic Compounds: low concentrations, dry gas
MW: Makeup water, HF: Hydraulic fracturing fluid, MIP: produced water
Date 10-Nov-15 10-Nov-15 18-May-16well MW 3H HF 3H MIP 3H
analyte FB days -30 -30 160 pH 6.8 6.7 6.2
Benzene µg/L 0.1 0.1 5.1Ethylbenze µg/L 0.1 0.1 0.3m,p-Xylene µg/L 0.2 0.2 1.0
o-Xylene µg/L 0.1 0.1 0.7Toluene µg/L 0.0 0.8 7.4Xylene t µg/L 0.3 0.3 1.7
α act pCi/L 2 3 41,290 β act pCi/L 2 5 11,170
226+228 Ra act pCi/L 1 3 17,521

Flowback evolution-organics
Hayes, 2009 MSEEL
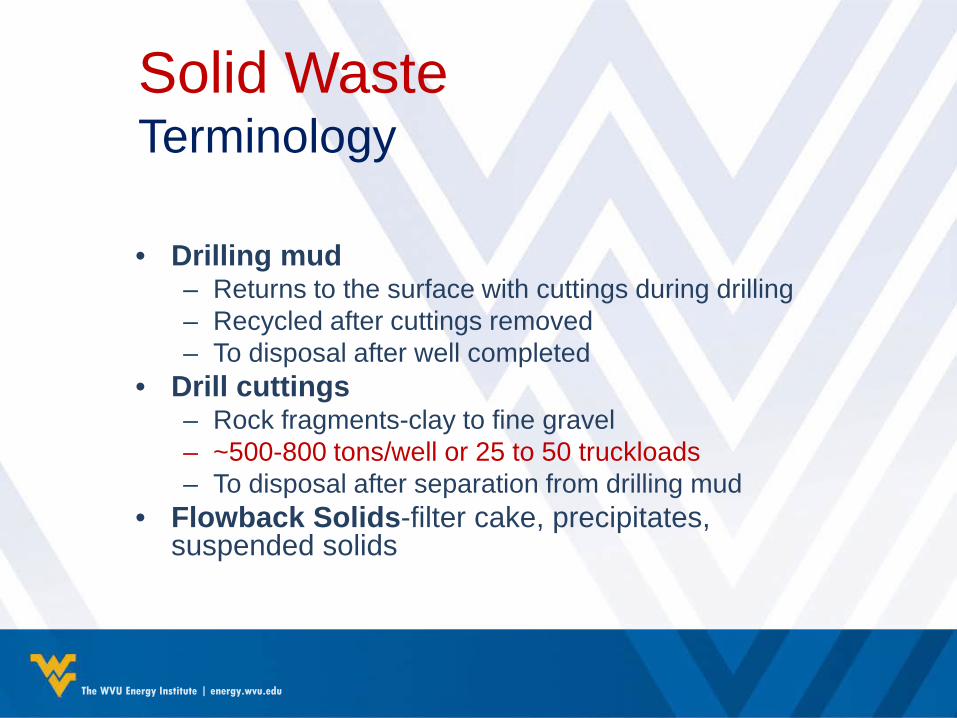
Solid WasteTerminology
• Drilling mud– Returns to the surface with cuttings during drilling– Recycled after cuttings removed– To disposal after well completed
• Drill cuttings– Rock fragments-clay to fine gravel– ~500-800 tons/well or 25 to 50 truckloads– To disposal after separation from drilling mud
• Flowback Solids-filter cake, precipitates, suspended solids

Drilling wastes
Mud Cuttings

Solids separation
Cuttings pit
Flowback pit
Plate and frame filter press
Bag filters
Flowback tanks
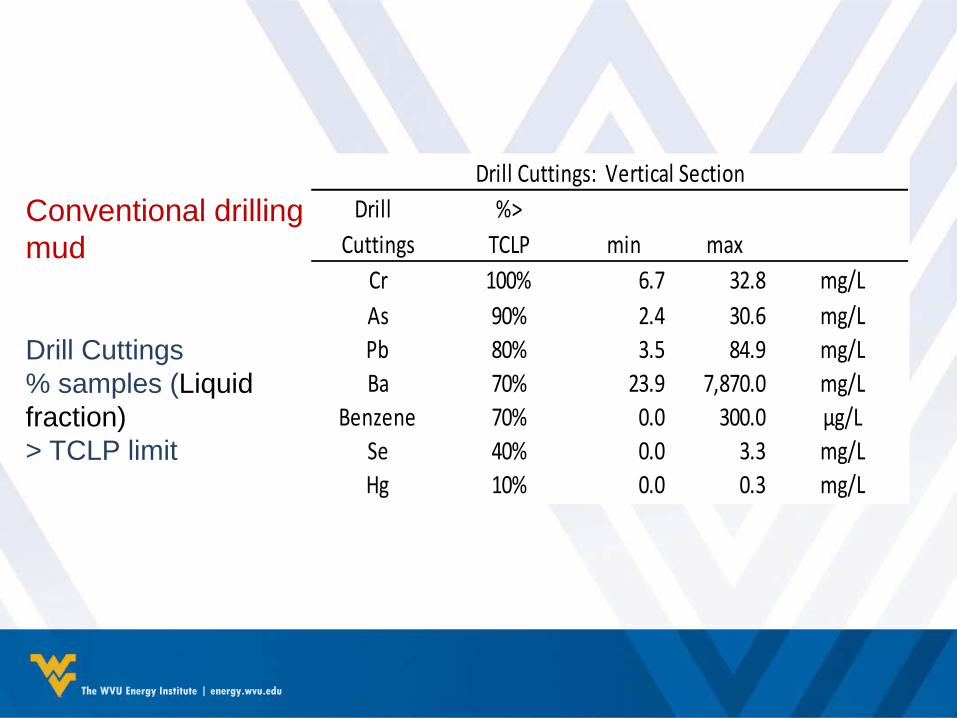
Conventional drilling mud
Drill Cuttings% samples (Liquid fraction)> TCLP limit
Drill %>Cuttings TCLP min max
Cr 100% 6.7 32.8 mg/LAs 90% 2.4 30.6 mg/LPb 80% 3.5 84.9 mg/LBa 70% 23.9 7,870.0 mg/L
Benzene 70% 0.0 300.0 µg/LSe 40% 0.0 3.3 mg/LHg 10% 0.0 0.3 mg/L
Drill Cuttings: Vertical Section

Using ‘Green’ Drilling Muds no parameters exceeded TCLP
Bio-Base 365: Shrieve Chemical ProductsABS 40: AES Drilling Fluids-non MSEEL well
In the Vertical and Horizontal (Marcellus) sections:
– TCLP organics-no exceedances– TCLP inorganics-no exceedances

Drilling mud: Bio-Basetm 365aliphatic-paraffin range synthetic
based mudProperty Unit Value Test Method
Physical state Liquid Visual Biodegradation, 28 days %m 55-60 OECD 301 Potential carcinogenic label - No -
BTEX** mg/kg < 1 * ASTM 5790 mod. PAH mg/kg < 0.1 * EPA 8100
*Below the detection level of the method. **BTEX (Benzene, Ethylbenzene, Toluene, Xylene).

At MSEEL: Schlumberger/Mi SWACO Megadrill P System
Product Description FunctionBio Base 365 Paraffin Blend Base Fluid
VG Plus Organophilic Clay Viscosifier
Lime Calcium Hydroxide Alkalinity Control
Megamul/ Actimul RD
Emulsifier Package
Emulsification & Oil-Wetting
CaCl2Calcium
Chloride BrineInternal Phase,
Aw Control
M-I Wate API Barite Density Control
Megadril P:
Unweighted & 10.0 – 13.0 ppg, 70/30 SWR

Synthetic based mud: Biobase 365 • Lower friction coefficient than OBM or WBM• 75% more expensive than OBM• 200% more expensive than WBM• ~$100k more per well• If state requires all cuttings to be taken to a
landfill anyway, there is little incentive to use SBM
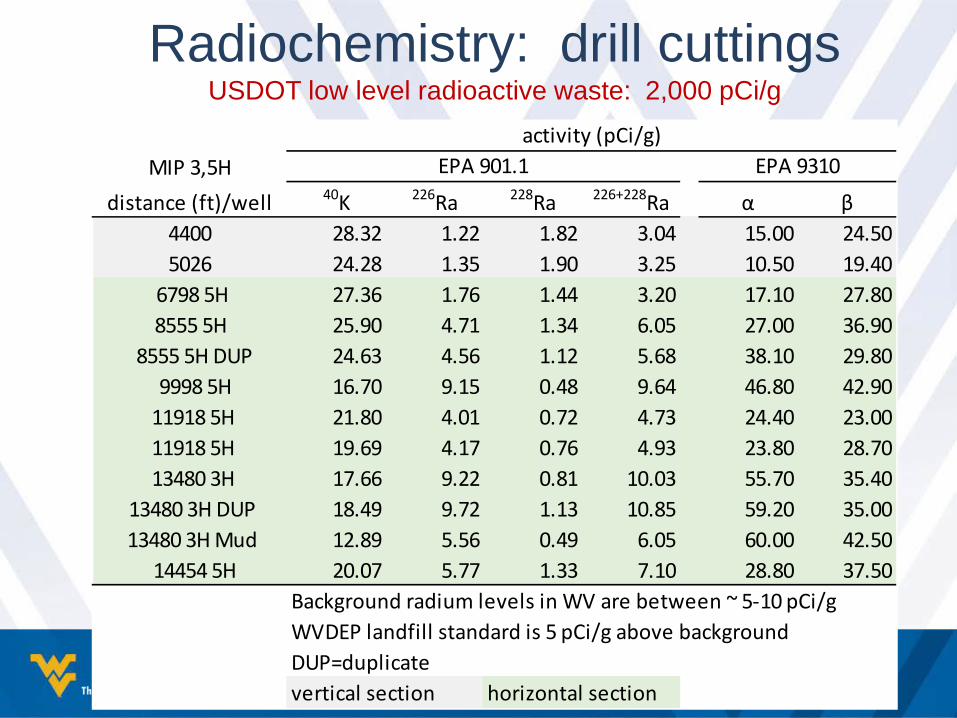
Radiochemistry: drill cuttingsUSDOT low level radioactive waste: 2,000 pCi/g
MIP 3,5Hdistance (ft)/well 40K 226Ra 228Ra 226+228Ra α β
4400 28.32 1.22 1.82 3.04 15.00 24.505026 24.28 1.35 1.90 3.25 10.50 19.40
6798 5H 27.36 1.76 1.44 3.20 17.10 27.80 8555 5H 25.90 4.71 1.34 6.05 27.00 36.90
8555 5H DUP 24.63 4.56 1.12 5.68 38.10 29.80 9998 5H 16.70 9.15 0.48 9.64 46.80 42.90 11918 5H 21.80 4.01 0.72 4.73 24.40 23.00 11918 5H 19.69 4.17 0.76 4.93 23.80 28.70 13480 3H 17.66 9.22 0.81 10.03 55.70 35.40
13480 3H DUP 18.49 9.72 1.13 10.85 59.20 35.00 13480 3H Mud 12.89 5.56 0.49 6.05 60.00 42.50
14454 5H 20.07 5.77 1.33 7.10 28.80 37.50Background radium levels in WV are between ~ 5-10 pCi/gWVDEP landfill standard is 5 pCi/g above backgroundDUP=duplicatevertical section horizontal section
activity (pCi/g)EPA 901.1 EPA 9310

West Virginia’s Solid Waste Management Rule: Drill cuttings and associated drilling wastes
• Prior to permitting:– Composite vertical and horizontal
samples– Testing: TCLP-metals, VOC, VOC, TPH
• Disposal in lined cells• Leachate collection/testing

West Virginia’s Solid Waste Management Rule: Drill cuttings and associated drilling wastes
At the landfill
• If incoming load exceeds 10 µR/hrabove local background (~24+10=37 µR/hr)– R=Roentgen= γ, x radiation only
• Then determine 226+228Ra• Must be less than 5 pCi/g above local
background• If greater, reject load

Conclusions• Produced water is highly contaminated
– Saline– Organics (much less in dry gas wells)– Radiochemicals– All increase through production cycle– Managed through recycle as makeup water
• Drill cutting toxicity is controlled by drilling fluids• Exposure control via approved disposal methods• Drill cuttings radioactivity is low

Flowback/Produced Water• Extremely saline: 10,000 to 300,000 mg
TDS/L• Inorganics: Na, Mg, Ca, Sr, Ba, Cl, Br• Organics: BTEX• NORMs: α,β,226Ra, 228Ra, • During flowback cycle
– Discharge drops off rapidly • Initially 1,800 bpd to 52 bpd after 60 days, 6 bpd after
160 days – Ion concentrations increase
• Most of the contaminants come from the formation-not frac fluid
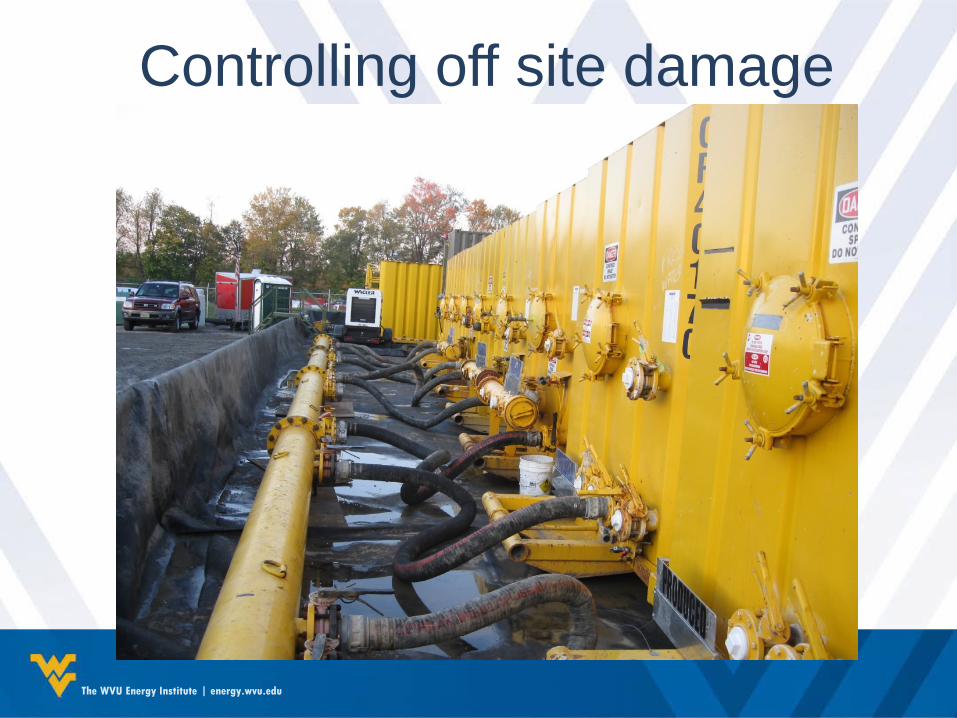
Controlling off site damage
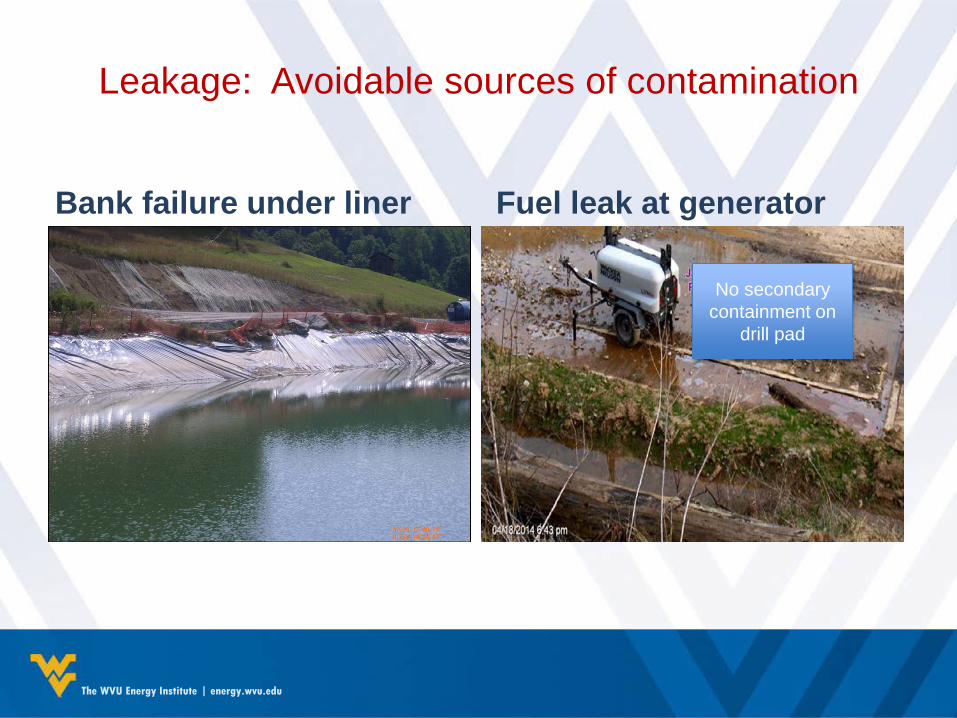
Leakage: Avoidable sources of contamination
Bank failure under liner Fuel leak at generator
No secondary containment on
drill pad

Roll-off container leaking drill cuttings and fluid onto unlined drill pad

Good: A properly – constructed impoundment

Bad: Poorly installed plastic liner

Unsupported pipe may break

Explosions are rare but this one resulted in a major release and fish kill-No secondary containment

Practical Risk Reduction:Polymer liner across drill pad covered with gravel.
Secondary Containment around tanks
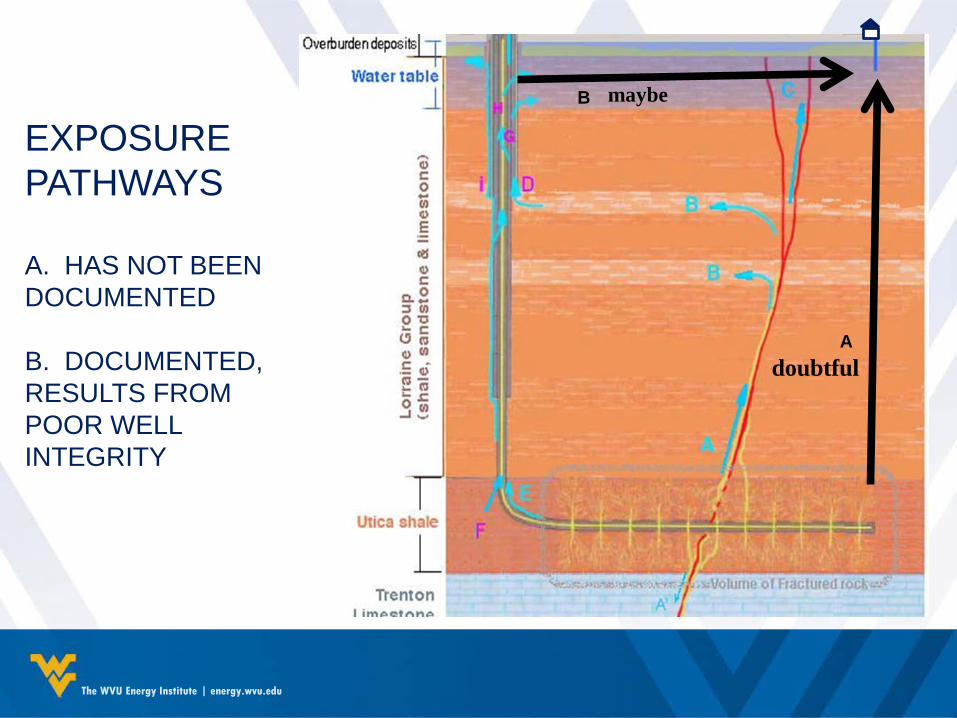
EXPOSURE PATHWAYS
A. HAS NOT BEEN DOCUMENTED
B. DOCUMENTED, RESULTS FROM POOR WELL INTEGRITY
maybe
doubtfulA
B

Domesticwell ~30 m
Well site spills and pit leakage
Flowback pit
Spring
Well
Most likely human/environmental exposure pathways
Casing/cement failure

FOR MORE INFORMATION PLEASE CONTACT:
Paul Ziemkiewicz, DirectorWVU Water Research Institute304 293 [email protected]

Risk Reduction: leakage at the well site
Issues1. Discharge of produced
water to local water supply2. Shallow groundwater
contamination 3. On site spillage4. Blowout during completion5. Vertical well leakage6. Deep contamination from
horizontal leg
Solutions1-3. Onsite containment, double HDPE liner, bermed, adequate to store 2 x maximum stage volume
4. Double BOPs5. Well bore integrity6. Never documented

Recommendations: reducing accidental releases of Produced Water
• Recycle/reuse flowback and produced water for frac water makeup• On site containment:
– Production casing integrity-testing prior to well completion– Drill pad-lined and bermed– Pits-construction/design/inspection according to State standards– Flowback lines to be properly installed/protected
• Transportation:– Tracking and accountability
• Solid waste characterization and disposal according to protective standards (RCRA?)