Embed Size (px)
Citation preview
1
A Technologies Company
WAVECRESTA Technologies Company
WAVECREST
Characterizing Jitter Histograms for Clock and DataCom Applications
John Patrin, Ph.D.Mike Li, Ph. D
2
A Technologies Company
WAVECREST
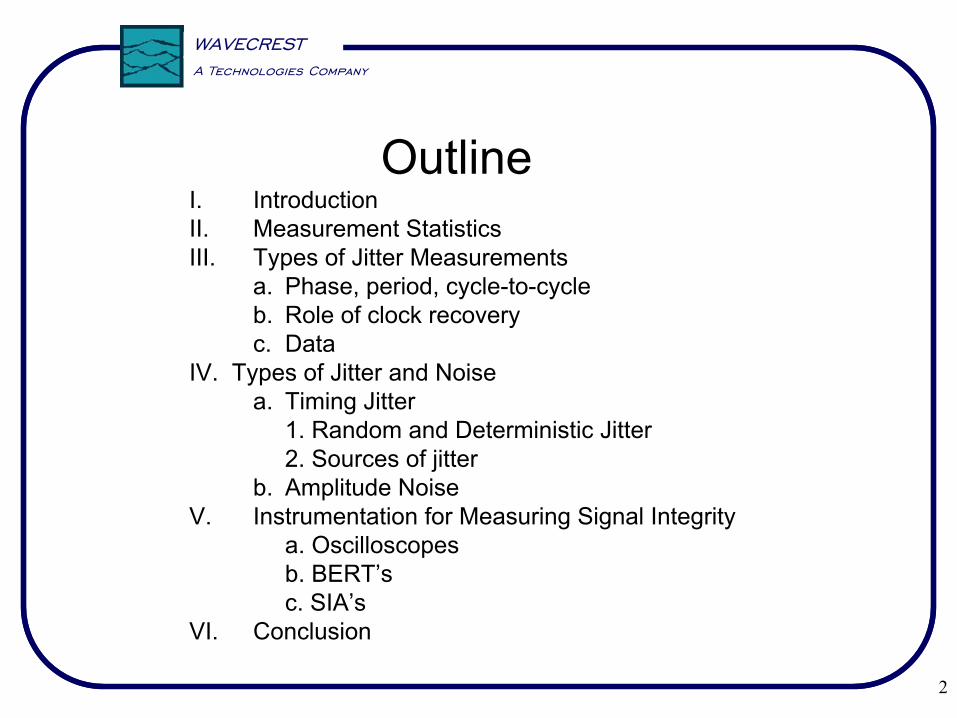
OutlineI. IntroductionII. Measurement StatisticsIII. Types of Jitter Measurements
a. Phase, period, cycle-to-cycleb. Role of clock recoveryc. Data
IV. Types of Jitter and Noisea. Timing Jitter
1. Random and Deterministic Jitter2. Sources of jitter
b. Amplitude NoiseV. Instrumentation for Measuring Signal Integrity
a. Oscilloscopesb. BERT’sc. SIA’s
VI. Conclusion
A Technologies Company
WAVECREST

3
A Technologies Company
WAVECREST
Motivation
Desire to have a system with the lowest BER
• Statistics• Jitter and Noise
• Types of Measurements• Instrumentation
Determining if a system meets your BER specifications, requires an understanding of:
BER contour

4
A Technologies Company
WAVECREST
I. Measurement Statistics• How do you characterize a histogram?• Is pk-pk a good metric?• Is the standard deviation a good metric?• How do different shaped distributions affect the
Total Jitter value?• How do you accurately determine device
performance and reliability?

5
A Technologies Company
WAVECREST
Clock Statistics
0
2
4
6
8
10
12
1 2 3 4 5 6 7 8 9 10 11
Sam
ples
(k)
0
2
4
6
8
10
12
14
1 2 3 4 5 6 7 8 9 10 11
Sam
ples
(k)
Both histograms have 48,000 hits, mean and a pk-pk of 10
Is pk-pk a good metric for characterizing histograms?
6
A Technologies Company
WAVECREST
0
2
4
6
8
10
1000 10000 100000
# of Hits in Histogram
0
0.02
0.04
0.06
0.08
0.1
1000 10000 100000
# of Hits in Histogram
pk-pk pk-pk
σσ
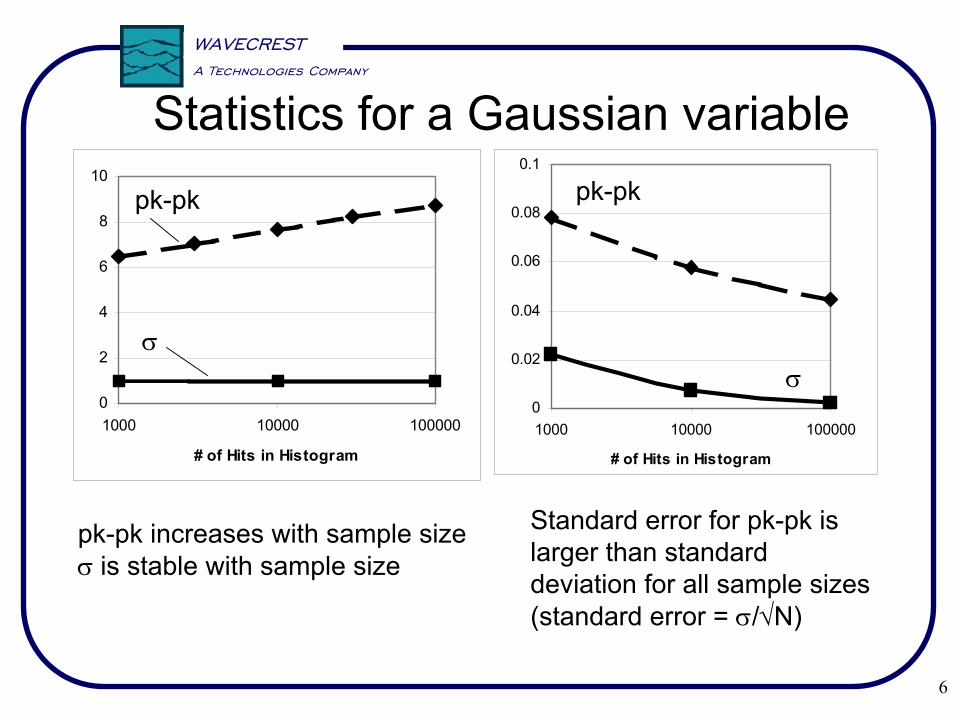
pk-pk increases with sample sizeσ is stable with sample size
Statistics for a Gaussian variable
Standard error for pk-pk is larger than standard deviation for all sample sizes (standard error = σ/√N)

7
A Technologies Company
WAVECREST
If the distribution is Gaussian, you can determine TJ for a given BER
The standard deviation provides information on the characteristics of the distribution: “width parameter”
8
A Technologies Company
WAVECREST
-5 -4 -3 -2 -1 0 1 2 3 4 50
0.2
0.4
0.6
0.8
1
1.2
1.4
1.6
1.8
2
2.2x 10¹⁶
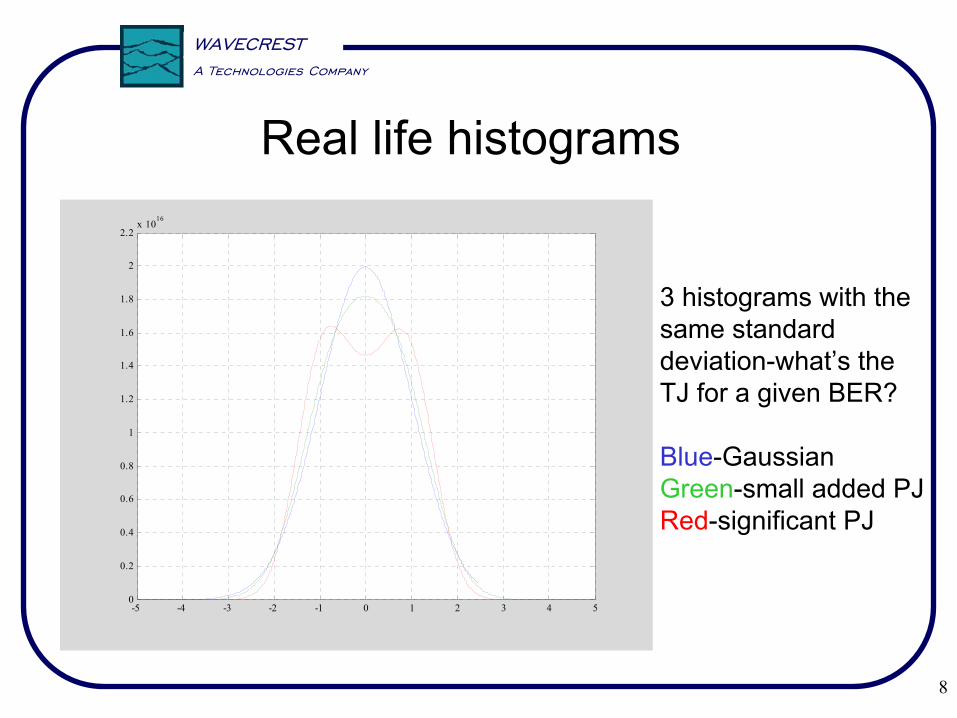
Real life histograms
3 histograms with the same standard deviation-what’s the TJ for a given BER?
Blue-GaussianGreen-small added PJRed-significant PJ
9
A Technologies Company
WAVECREST
4 4.5 5 5.5 6 6.5 7 7.5 810-45
10-40
10-35
10-30
10-25
10-20
10-15
10-10
10-5
100
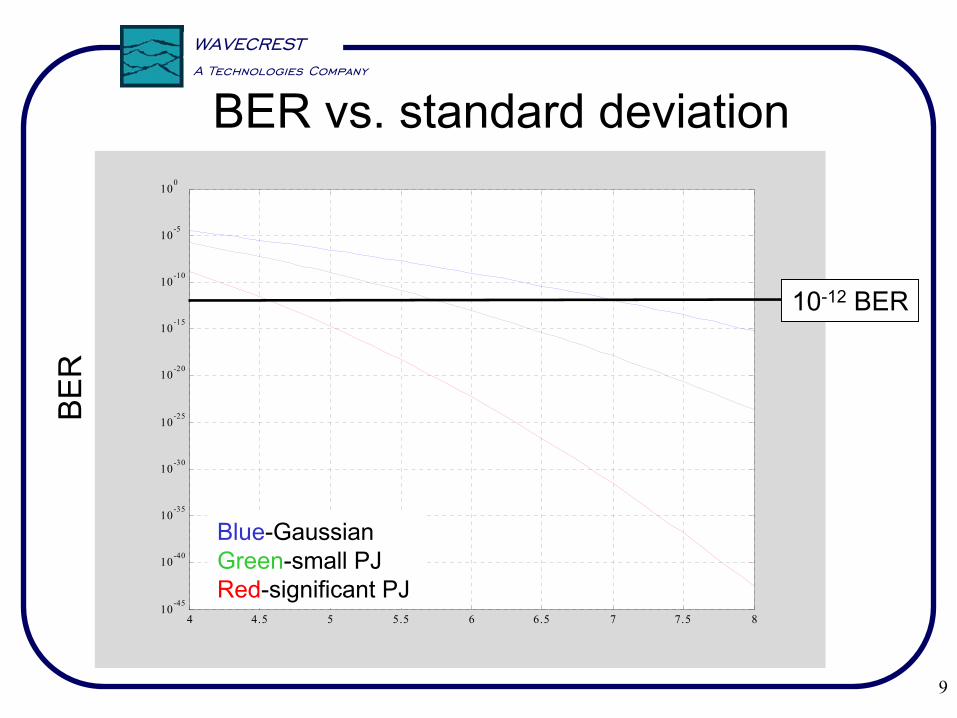
10-12 BER
BER
BER vs. standard deviation
Blue-GaussianGreen-small PJRed-significant PJ

10
A Technologies Company
WAVECRESTA Technologies Company
WAVECREST
Clock with RJ
Clock with DJ
What clock has better performance?
10-6 10-12
BER

11
A Technologies Company
WAVECRESTA Technologies Company
WAVECREST
Why are statistics so important? Because with insufficient statistics you can pass BAD parts
PCI Express Spec
1x10⁻³
1x10-12
• Add in card example• Card B had link training problems
• Sample size of 1000 from software compliance measurement on a real time oscilloscope-bothparts PASS
• Comprehensive test to actual BER specification indicates part B FAILS
Card A Card B
BER

12
A Technologies Company
WAVECREST
Examples of Crystal Oscillator Specifications
And some companies do not specify jitter!!!

13
A Technologies Company
WAVECREST
Parameter Benefits Drawbacks
pk-pk measurement of a histogram
•Provides a number •Measurement must be stated with sample size and setup conditions.•Measurement less repeatable than σ
Standard deviation (σ) •Measurement parameter is repeatable•Can be used to calculate pk-pk jitter as a function of BER or probability level
•Useful only for Gaussian distributions
Quantifying random and deterministic components
•Can be used to calculate pk-pk jitter as a function of BER or probability level for any shape of histogram.•The magnitude of the components provides diagnostic information

14
A Technologies Company
WAVECREST
• How do you characterize a histogram? By quantifying its components
• Is pk-pk a good metric? In general, No• Is the standard deviation a good metric? For
Gaussian distributions• How do different shaped distributions affect the
Total Jitter value? It depends on the contribution from the jitter components
• How do you accurately determine device performance and reliability? By quantifying its components and calculating long term performance

15
A Technologies Company
WAVECRESTA Technologies Company
WAVECREST
• Should I perform a phase (accumulated jitter), period or cycle-to-cycle jitter measurement?
• Why do these measurements give different numbers for the same signal?
• Does the measurement emulate the device?
Phase, Period and Cycle-to-Cycle Jitter
II. Types of Jitter measurements

16
A Technologies Company
WAVECREST
• Assume test instrument that measures threshold crossings
• A sinusoidal term has been added to the ideal waveform
• 400 ps ideal time intervals (PCI Express)
X X Xt

17
A Technologies Company
WAVECRESTA Technologies Company
WAVECREST
Types of Jitter measurements: Phase Jitter
Ideal waveform and one with a sinusoidal term added
18
A Technologies Company
WAVECRESTA Technologies Company
WAVECREST
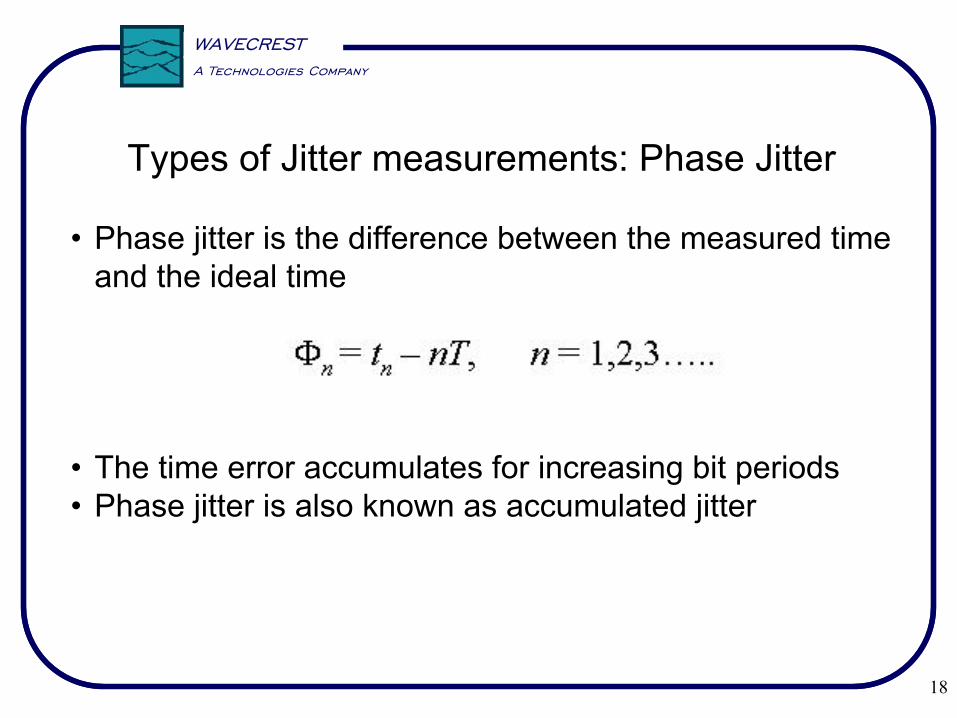
Types of Jitter measurements: Phase Jitter
• Phase jitter is the difference between the measured time and the ideal time
• The time error accumulates for increasing bit periods• Phase jitter is also known as accumulated jitter
19
A Technologies Company
WAVECRESTA Technologies Company
WAVECREST
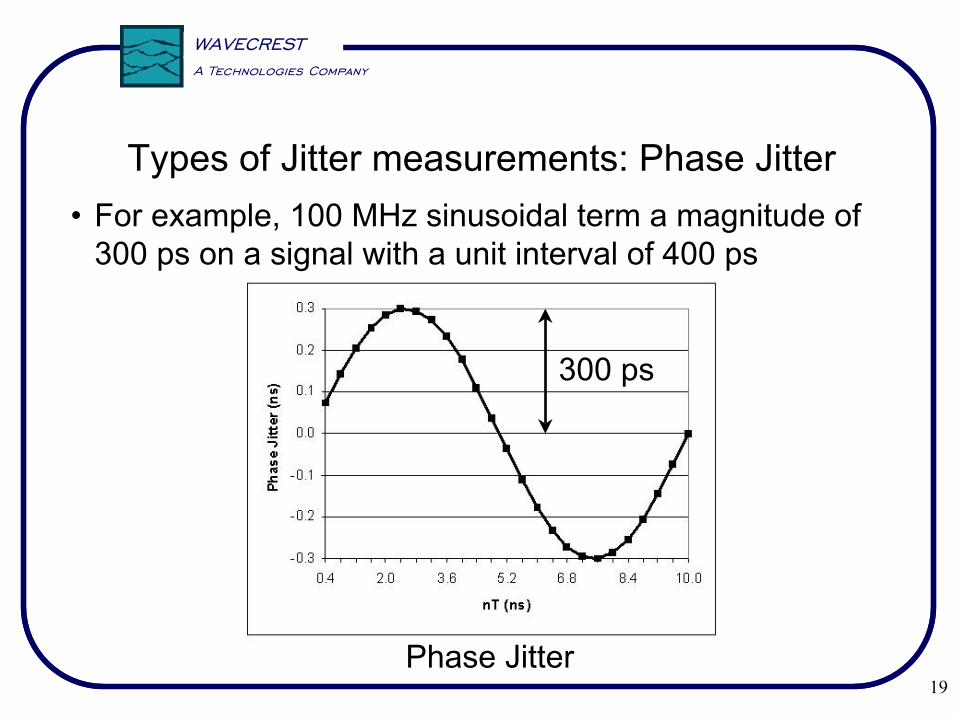
Types of Jitter measurements: Phase Jitter• For example, 100 MHz sinusoidal term a magnitude of
300 ps on a signal with a unit interval of 400 ps
300 ps
Phase Jitter
20
A Technologies Company
WAVECREST
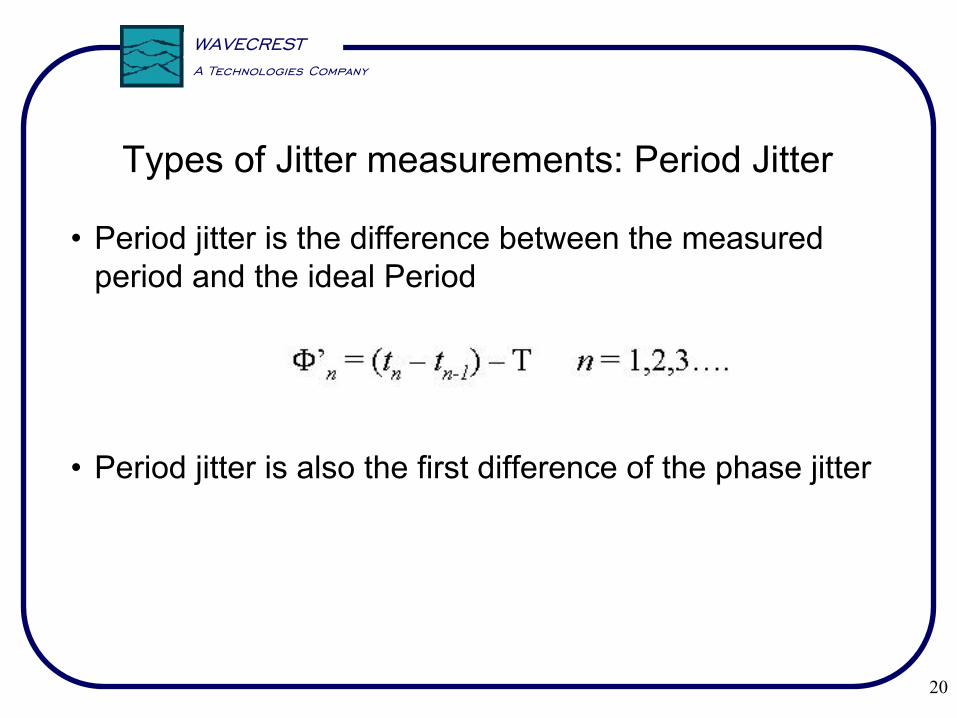
Types of Jitter measurements: Period Jitter
• Period jitter is the difference between the measured period and the ideal Period
• Period jitter is also the first difference of the phase jitter
21
A Technologies Company
WAVECREST
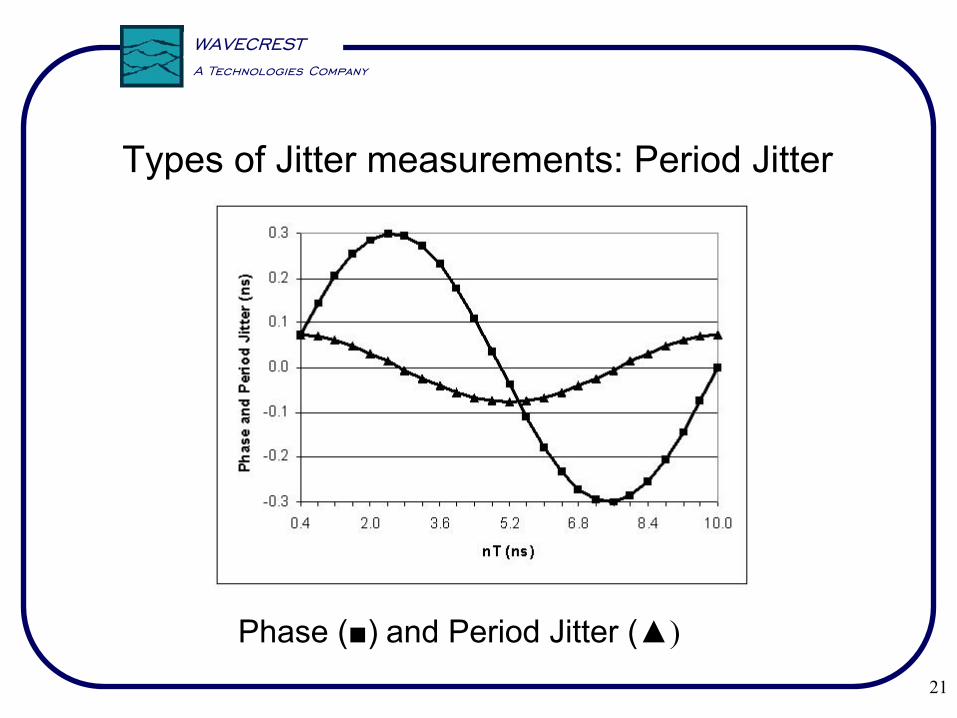
Types of Jitter measurements: Period Jitter
Phase (■) and Period Jitter (▲)

22
A Technologies Company
WAVECREST
Types of Jitter measurements: Cycle-to-Cycle Jitter
• Cycle-to-cycle jitter is the difference between the consecutive bit periods
• Cycle-to-cycle jitter is also the first difference of period jitter and second difference of phase jitter

23
A Technologies Company
WAVECREST
Types of Jitter measurements: Cycle-to-Cycle Jitter
Phase (■) and Period Jitter (▲) and cycle-to-cycle jitter (♦)
The magnitude of the sinusoidal error decreases from phase to period to cycle-to-cycle jitter

24
A Technologies Company
WAVECREST
Types of Jitter measurements
Each measurement type has a different frequency response
•Period jitter rolls off at
~20 dB/decade
•Cycle-to-cycle rolls off at ~40 dB/decade

25
A Technologies Company
WAVECREST
Types of Jitter measurements• The three preceding examples show different
representations of the same data
• The measurement you make depends on your application
• For clocks and PLL’s phase jitter would be appropriate because the output is proportional to the phase error of the reference and output signal
• For diagnosing modulation or crosstalk phase and/or period jitter is appropriate
• Applications for cycle-to-cycle jitter????
26
A Technologies Company
WAVECREST
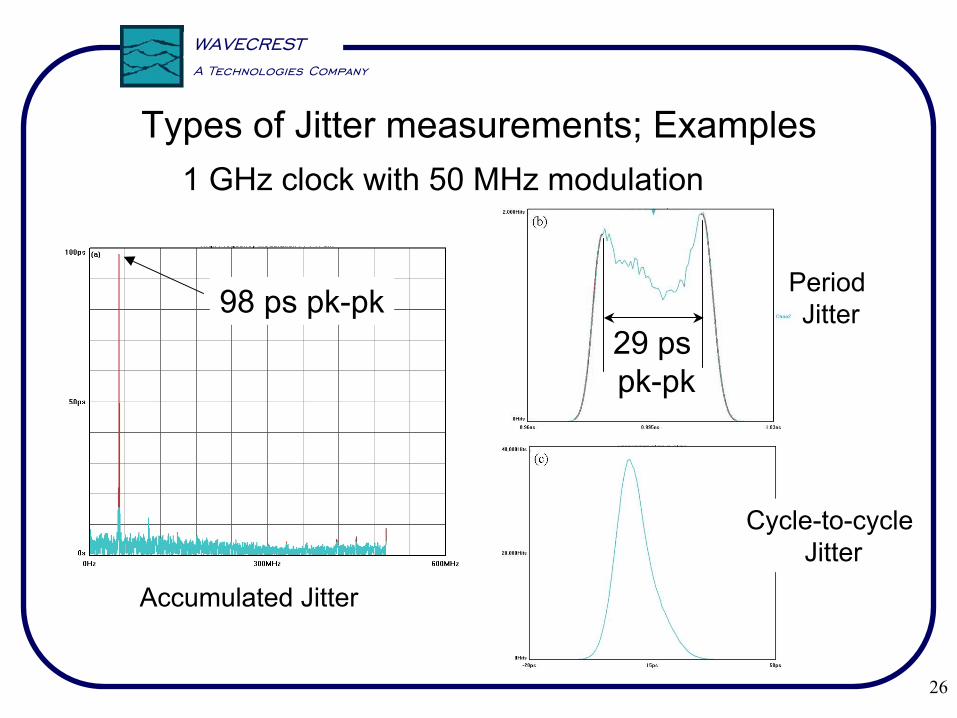
Types of Jitter measurements; Examples
Accumulated Jitter
1 GHz clock with 50 MHz modulation
Cycle-to-cycleJitter
Period Jitter98 ps pk-pk
29 ps pk-pk

27
A Technologies Company
WAVECREST
The effect of clock recovery in a system
• Jitter seen by the receiver will have a high pass jitter transfer function
• The receiver will tolerate more low frequency jitter than high frequency jitter
• The frequency at which the PLL begins to track is the 3 dB or corner frequency, Fc
• For many serial data standards it is Fc = Data Rate/1667• A system with clock recovery changes the Phase Jitter
measurement

28
A Technologies Company
WAVECREST
ideal
with a PLL
no PLL
The magnitude of phase jitter is reduced or rejected by the clock recovery scheme-this has implications for the measurements and instrumentation

29
A Technologies Company
WAVECREST
With a compliant clock
Without a compliant clock
Effect of clock recovery on your measurements
DJ=12.6 ps DJ=138 ps

30
A Technologies Company
WAVECREST
Types of Jitter measurements: Data• There are a variety of jitter measurement methods available
today and they may not provide the same answer
• Test instruments may perform a jitter measurement with a software based clock, a noncompliant or compliant clock
• The measurement could be accomplished on two channels (clock and data) or the data alone
• For datacom applications, typically the clock is recovered from the data and used for timing the data, perform the analysis thatemulates your device
• The methodology with the lowest jitter is not necessarily the best

31
A Technologies Company
WAVECREST
Types of Datacom Measurements
Data Clock

32
A Technologies Company
WAVECREST
• Should I perform a phase (accumulated jitter), period or cycle-to-cycle jitter measurement? Depends on the application
• Why do these measurements give different numbers for the same signal? Each measurement has a different frequency response
• Does the measurement emulate the device? Choose a measurement that fits your application

33
A Technologies Company
WAVECREST
IV. Types of Jitter and Noise
34
A Technologies Company
WAVECREST
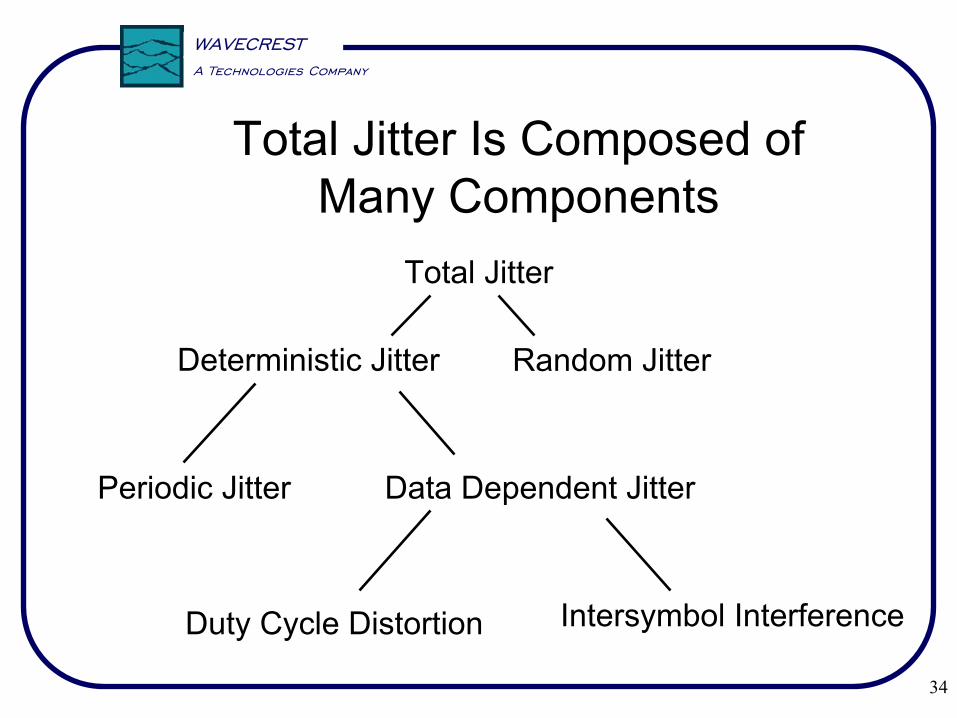
Total Jitter Is Composed of Many Components
Total Jitter
Deterministic Jitter Random Jitter
Periodic Jitter Data Dependent Jitter
Duty Cycle Distortion Intersymbol Interference

35
A Technologies Company
WAVECREST
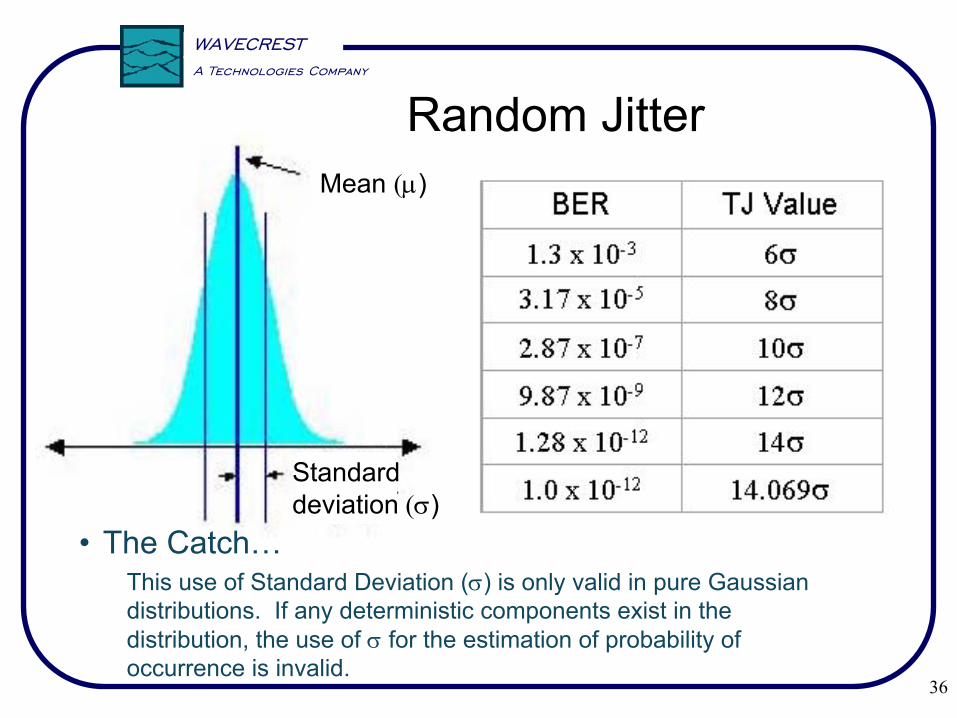
Random Jitter• Random jitter (RJ) is characterized by a Gaussian
distribution and assumed to be unbounded
• The distribution is quantified by the standard deviation (σ) and mean (µ)
• Since RJ can be modeled as a Gaussian distribution it can be used to predict pk-pk jitter as a function of BER
36
A Technologies Company
WAVECREST
Random JitterMean (µ)
Standard deviation (σ)
• The Catch…This use of Standard Deviation (σ) is only valid in pure Gaussian distributions. If any deterministic components exist in the distribution, the use of σ for the estimation of probability of occurrence is invalid.
37
A Technologies Company
WAVECREST
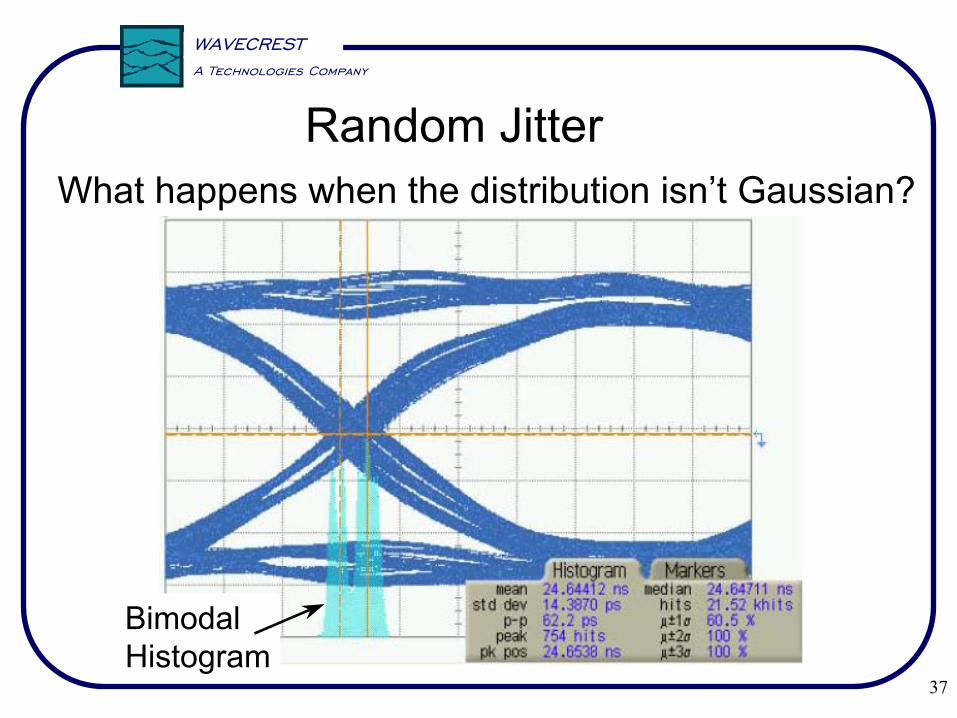
Random JitterWhat happens when the distribution isn’t Gaussian?
Bimodal Histogram

38
A Technologies Company
WAVECREST
Measuring Random JitterFit Gaussian tails to left and right side of distribution, TailFitTM
Keep adjusting σ, mean and magnitude until tails obtain best fit with the data
39
A Technologies Company
WAVECREST
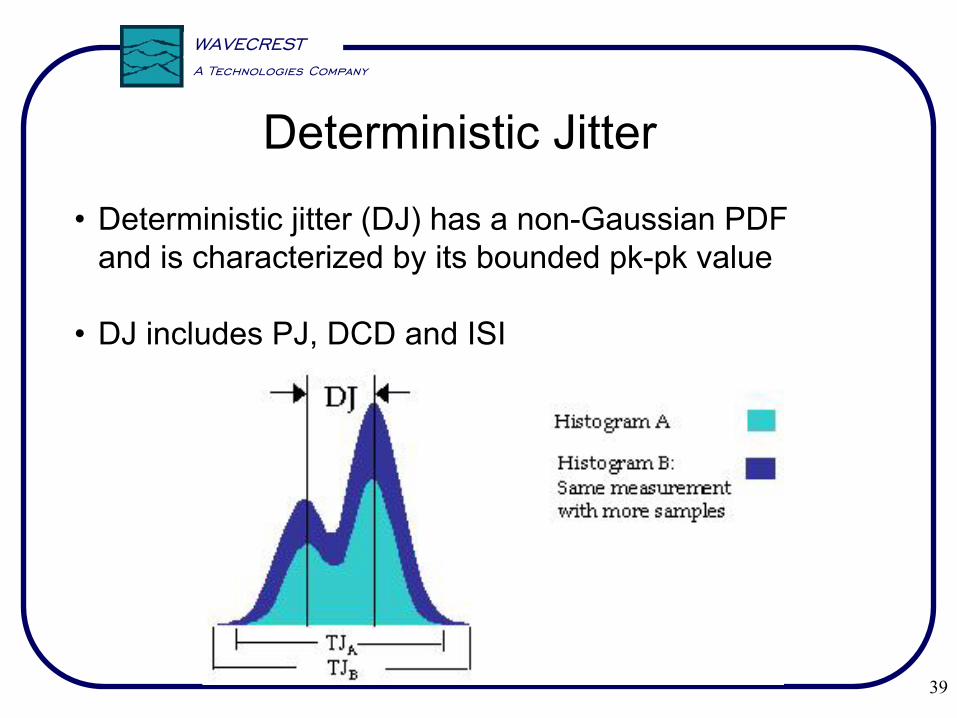
Deterministic Jitter• Deterministic jitter (DJ) has a non-Gaussian PDF
and is characterized by its bounded pk-pk value
• DJ includes PJ, DCD and ISI
40
A Technologies Company
WAVECREST
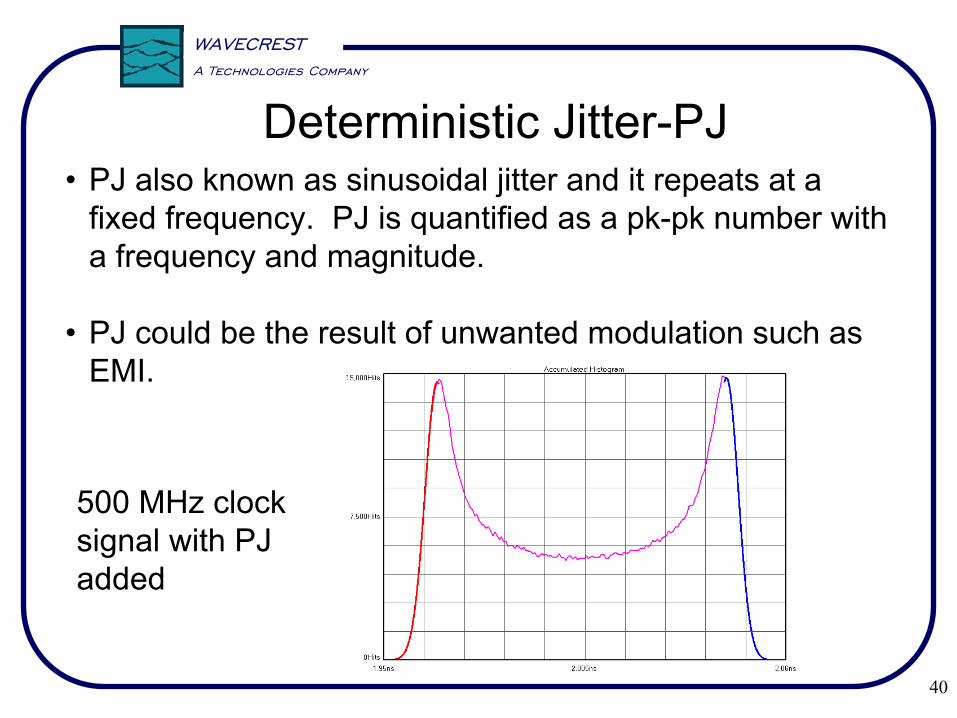
Deterministic Jitter-PJ• PJ also known as sinusoidal jitter and it repeats at a
fixed frequency. PJ is quantified as a pk-pk number with a frequency and magnitude.
• PJ could be the result of unwanted modulation such as EMI.
500 MHz clock signal with PJ added
41
A Technologies Company
WAVECREST
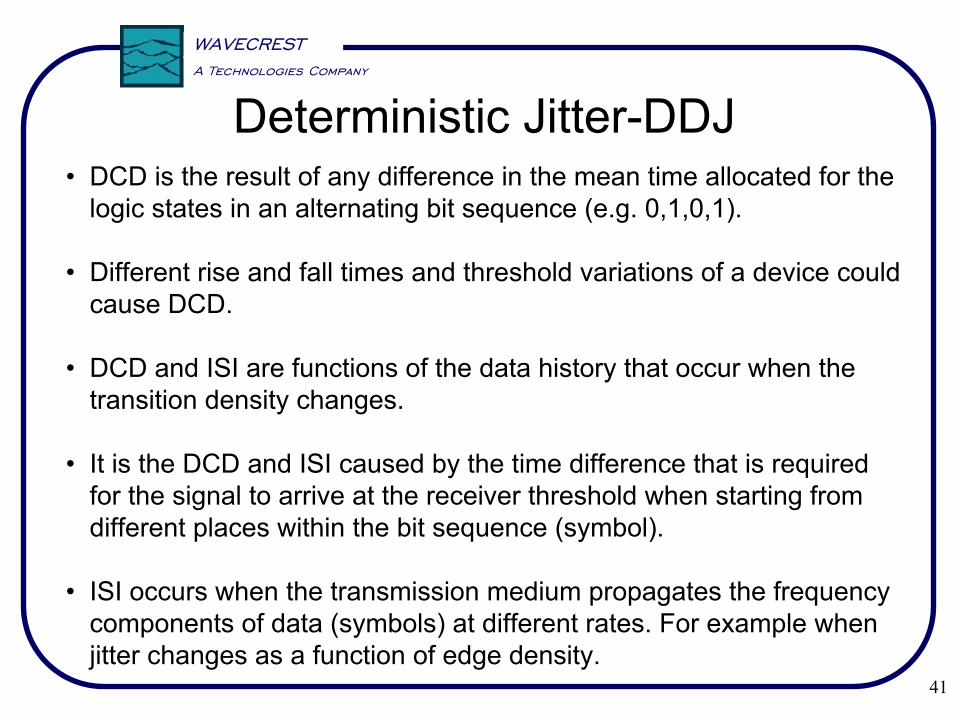
Deterministic Jitter-DDJ• DCD is the result of any difference in the mean time allocated for the
logic states in an alternating bit sequence (e.g. 0,1,0,1).
• Different rise and fall times and threshold variations of a device could cause DCD.
• DCD and ISI are functions of the data history that occur when the transition density changes.
• It is the DCD and ISI caused by the time difference that is required for the signal to arrive at the receiver threshold when starting from different places within the bit sequence (symbol).
• ISI occurs when the transmission medium propagates the frequencycomponents of data (symbols) at different rates. For example when jitter changes as a function of edge density.

42
A Technologies Company
WAVECREST
Measuring Deterministic Jitter• TJ histograms represents the TJ PDF, therefore if the DJ
and RJ process are independent the total PDF is the convolution of the DJ and RJ PDF.
• Removing DJ would produce a Gaussian distribution
• Adding DJ to the histogram broadens the distribution while maintaining Gaussian tails, effectively separating the mean of the left and right distributions.
• Difference between the two means is the DJ and the tail portions represent the RJ component.

43
A Technologies Company
WAVECREST
Measuring Deterministic Jitter
µL µR
RJ
DJ= µL-µR
DJ is the difference between the two means µLand µR

44
A Technologies Company
WAVECREST
Sources of Jitter-EMI• Common sources of DJ include EMI, crosstalk and reflections
• EMI is the result of unwanted radiated or conducted emissions from a local device or system. For example a switching type power supply.
• EMI may also corrupt a ground reference plane or supply voltage plane by introducing transient noise currents.
SwitchingPower Supply
Victim LineCurrent
Mag Field
Mag Field

45
A Technologies Company
WAVECREST
Sources of Jitter-Crosstalk and Reflections• Crosstalk occurs when the magnetic or electric fields of
a conductor are inadvertently coupled to an adjacent signal.
Driver LineCurrent
Victim LineCurrent
Mag Field
Mag Field
Mag Field
Mag Field
• Reflections in a data signal create DJ due to the signal interfering with itself. Reflections could be caused from impedance mismatches, uncontrolled stubbing and incorrect terminations.

46
A Technologies Company
WAVECREST
Sources of Jitter-RJ• Common sources of RJ include shot noise, flicker noise and thermal
noise
• Shot noise is broadband “white” noise generated when electrons and holes move in a semiconductor. Shot noise amplitude is a function of average current flow.
• Flicker noise has a spectral distribution that is proportional to 1/f. The origin of flicker noise is a surface effect due to fluctuations in the carrier density as electrons are randomly captured and emitted from oxide interface traps.
• Thermal noise can be represented by broadband “white” noise, and has flat spectral density. It is generated by the transfer of energy between “free” electrons and ions in a conductor.

47
A Technologies Company
WAVECREST
Amplitude Noise
error
• Amplitude noise is present in all data signals and has random and deterministic sources. Common sources of random amplitude noise are thermal noise, shot noise, flicker noise and in optical systems noise due to lasers
• Random amplitude noise is assumed to have a Gaussian distribution and is unbounded. Random amplitude noise will become more dominant in low amplitude signals such as LVDS or signals at thereceiver

48
A Technologies Company
WAVECREST
Amplitude Noise• Effect of only random amplitude noise. What is the probability that a 1
will be below the sampling point and a 0 above the sampling point?
Ideal sampling point
Pe = ½ erfc(A/√2*σ)
Where erfc is the complementary error function, A is the amplitude and σ is the standard deviation
Pe depends on the ratio of the amplitude to noise, i.e. the signal-to-rms noise ratio

49
A Technologies Company
WAVECREST
Amplitude Noise• Deterministic noise sources may also be present. Typical deterministic
noise sources include crosstalk, reflections, EMI, periodics and bandwidth limitations (ISI)
Example of a 2.5 Gb/s signal through 16” of a backplane
50
A Technologies Company
WAVECREST
V. Instrumentation for Measuring Signal Integrity
• Oscilloscopes• Sampling• Real time
• BERTs
• SIA’s

51
A Technologies Company
WAVECREST
Instrumentation for Measuring Signal Integrity-Sampling Oscilloscopes• Digital sampling oscilloscopes-generally have a very high
bandwidth, 30-50 GHz.
• For repetitive sampling oscilloscopes the input signal is sampled at a time interval to obtain the voltage level. The waveform is “built up” after repetitive samples of the signal.
• This type of oscilloscope requires a trigger signal to control the timing of the sampling process. Digital sampling oscilloscopes measure voltage and timing accurately and can create “eye diagrams” for tolerance testing.

52
A Technologies Company
WAVECREST
Determine:TJ for small sample size, std. dev., pk-pk
Voltage levels, rise and fall times, eye diagrams and eye mask
Instrumentation for Measuring Signal Integrity-Sampling Oscilloscopes

53
A Technologies Company
WAVECREST
For a comprehensive analysis of horizontal andvertical eye opening for a
to 10-16 BER use other software packages
Instrumentation for Measuring Signal Integrity-Sampling Oscilloscopes

54
A Technologies Company
WAVECREST
Vertical Eye opening to 10-16 BER
Instrumentation for Measuring Signal Integrity-Sampling Oscilloscopes

55
A Technologies Company
WAVECREST
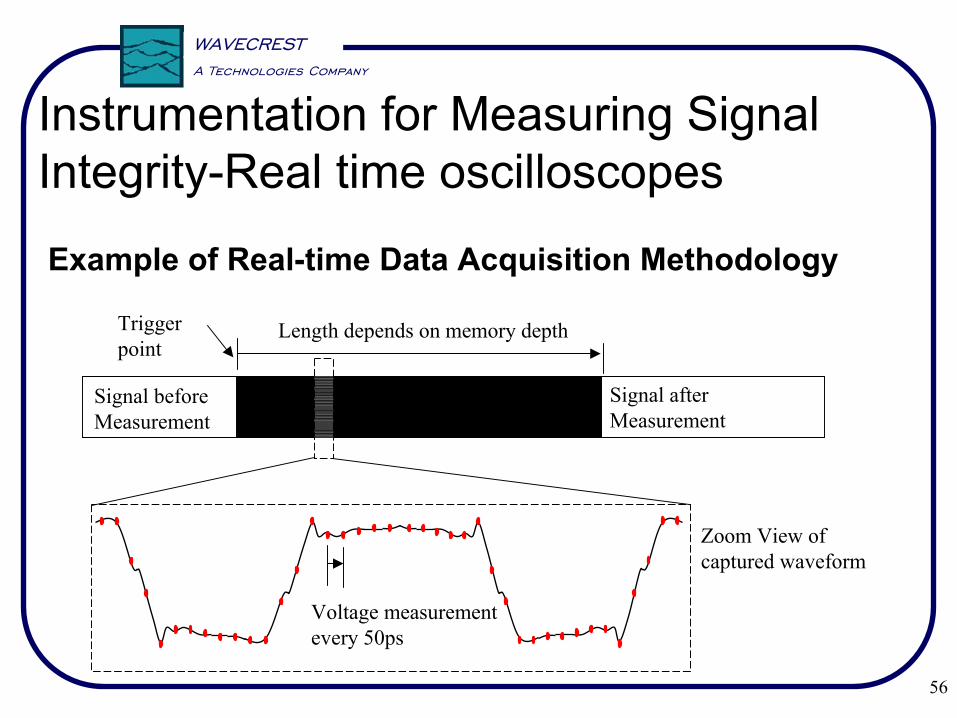
Instrumentation for Measuring Signal Integrity-Real time oscilloscopes• Real time oscilloscopes have bandwidths upto 6 GHz and
acquire data upto 20 GSa/Sec (50 ps intervals). Bandwidth and sample rate sufficient for data upto 2.5 - 3 Gb/s.
• Maximum memory length of 96M or ~5 ms.
• Many companies claim capability of determining RJ, DJ, DCD, ISI, TJ. No correlation data or white papers on methodology yet.
56
A Technologies Company
WAVECREST
Signal after Measurement
Signal beforeMeasurement
Zoom View of captured waveform
Length depends on memory depth
Voltage measurement every 50ps
Trigger point
Example of Real-time Data Acquisition Methodology
Instrumentation for Measuring Signal Integrity-Real time oscilloscopes
57
A Technologies Company
WAVECREST
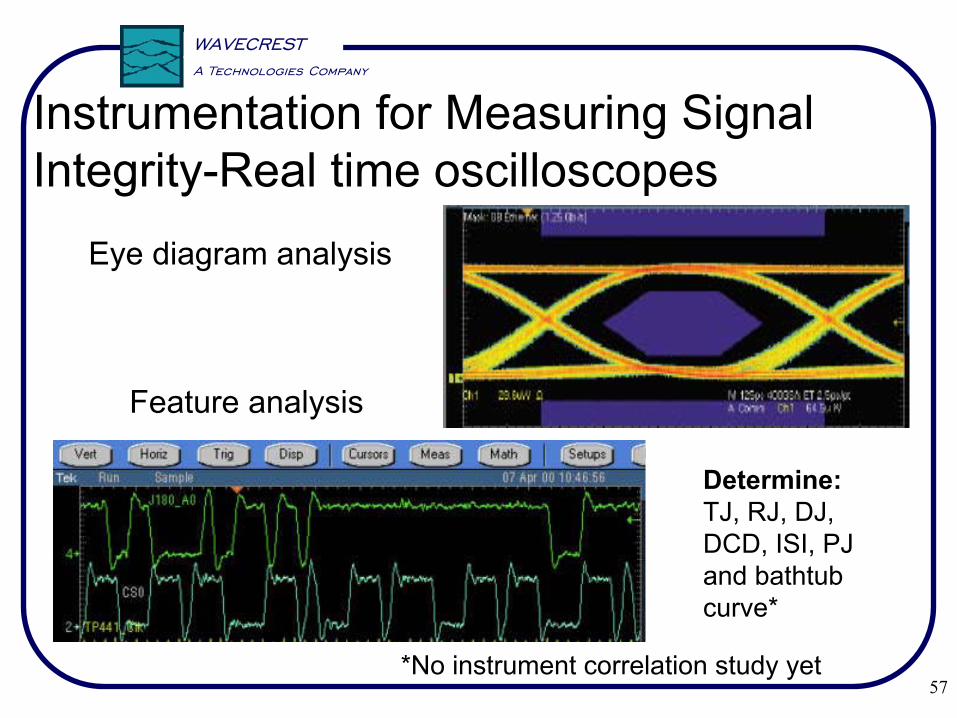
Instrumentation for Measuring Signal Integrity-Real time oscilloscopes
Eye diagram analysis
Feature analysis
Determine:TJ, RJ, DJ, DCD, ISI, PJ and bathtub curve*
*No instrument correlation study yet

58
A Technologies Company
WAVECREST
Instrumentation for Measuring Signal Integrity-Bit Error Ratio Testers (BERTs)
• BERTs are comprised of two components, a pattern generator and an analyzer or error detector.
• BERT operates by transmitting a pattern to the device under test and the error detector analyzes and records the differences between the transmitted and received pattern.
• In order to obtain the amount of eye closure as a function of BER, the BERT must vary the data edge placement with respect to the clock edge in order to obtain a BER, this is commonly called the BERT scan technique.

59
A Technologies Company
WAVECREST
Typical data set from a BERT
A bathtub curve showing BER as a function of eye closure
clock
data
Eye opening at 10-8 BER
Determine:TJ vs. BER, post processing software can determine RJ & DJ assuming double delta model

60
A Technologies Company
WAVECREST
Instrumentation for Measuring Signal Integrity-Signal Integrity Analyzers (SIA’s)• SIA’s integrate capabilities from a variety of test instruments
to provide application solutions. SIA’s have the capabilities of an oscilloscope, time interval analyzer, can count bit errors and estimate BER. Can analyze up to 10 channels.
• The statistics of these measurements along with algorithms provide information on total jitter, deterministic jitter, random jitter, BER, propagation delay, skew, amplitude, rise/fall times…for clock and data applications

61
A Technologies Company
WAVECREST
Jitter, spectral analysis, jitter vs. time, PLL characterization…
Instrumentation for Measuring Signal Integrity-Signal Integrity Analyzers (SIA’s)-Clocks/PLLs jitter
Poles and zerosTransfer function
Bode Plot
Jitter Histogram
Spectral View

62
A Technologies Company
WAVECREST
Repeating pattern and marker
Determine:TJ, RJ, DJ, DCD&ISI, PJ and bathtub curve
Due to EMI or crosstalk?
Instrumentation for Measuring Signal Integrity-Signal Integrity Analyzers (SIA’s)-DataCom Jitter

63
A Technologies Company
WAVECREST
SIA-Clock to data
Determine:TJ, RJ, DJ, bathtub curve and histograms for rising and falling edges, skew between clock and data
Instrumentation for Measuring Signal Integrity-Signal Integrity Analyzers (SIA’s)-DataCom jitter

64
A Technologies Company
WAVECREST
Instrumentation for Measuring Signal Integrity-Signal Integrity Analyzers (SIA’s)- Voltage
Eye diagram analysis
Timing and Voltage
compliance measurements

65
A Technologies Company
WAVECREST
Test Instrumentation Bandwidth

66
A Technologies Company
WAVECREST
Is bandwidth a good metric for determining instrument performance?
Should a time domain instrument be specified in the frequency domain?
67
A Technologies Company
WAVECREST
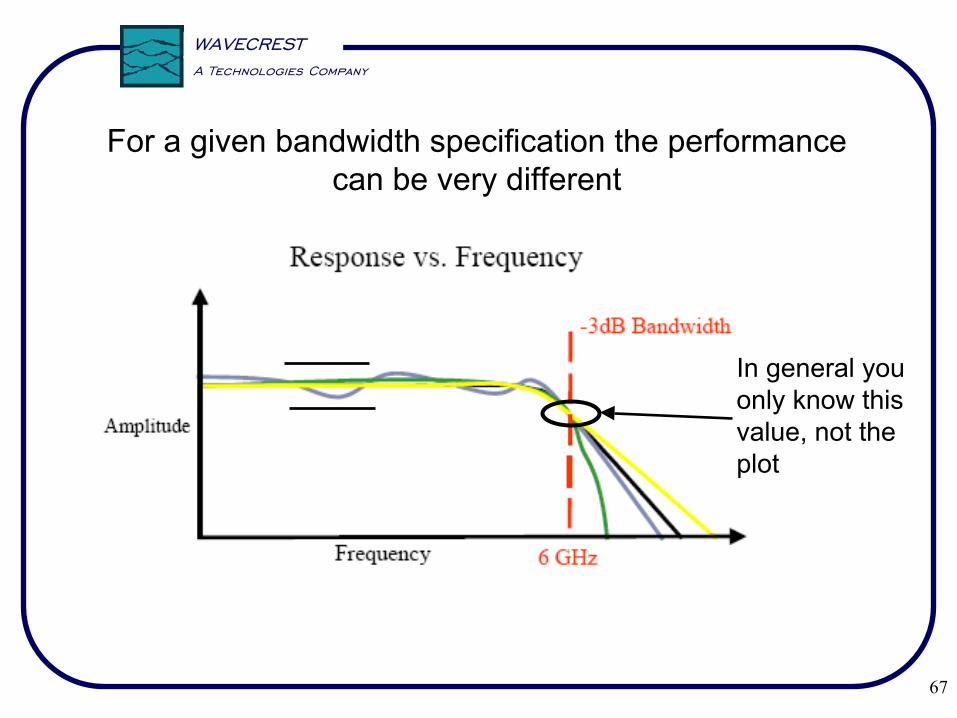
For a given bandwidth specification the performance can be very different
In general you only know this value, not the plot

68
A Technologies Company
WAVECREST
4 Different Oscilloscopes Analyze the Same 2.125 Gb/s Signal
All Four Oscilloscopes have 6 GHz Bandwidth!

69
A Technologies Company
WAVECREST
4 Different 6 GHz Oscilloscopes Analyze the Same 4.25 Gb/s Signal
20 GHz sampling
oscilloscope

70
A Technologies Company
WAVECREST
20 GHz sampling
oscilloscope
6 GHz sampling
oscilloscope
6 GHz realtime
oscilloscope
Feature Analysis
71
A Technologies Company
WAVECREST
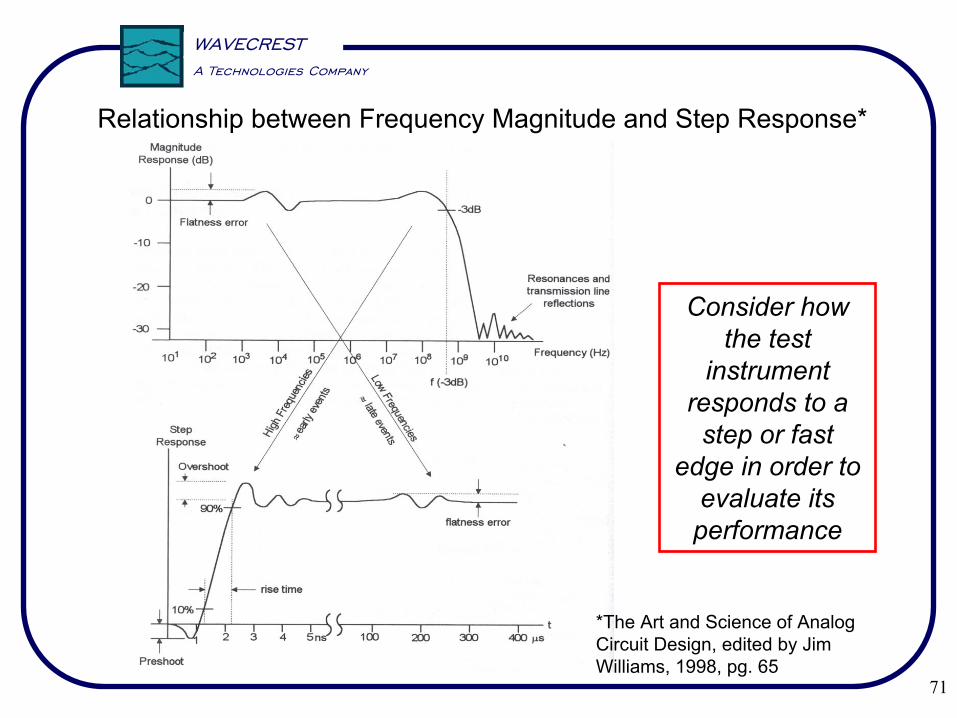
Relationship between Frequency Magnitude and Step Response*
Consider how the test
instrument responds to a
step or fast edge in order to
evaluate its performance
*The Art and Science of Analog Circuit Design, edited by Jim Williams, 1998, pg. 65

72
A Technologies Company
WAVECREST
Bandwidth is not the only metric for determining instrument performance
Evaluate the test instrument in your application and compare it to a known standard

73
A Technologies Company
WAVECREST
SummaryI. Measurement Statistics-Quantify and Characterize the HistogramII. Types of Jitter Measurements
a. Phase, period, cycle-to-cycle-Determine the Applicationb. Role of clock recovery-CR affects your measurementc. Data-Different Jitter Analysis methods
III. Types of Jitter and Noisea. Timing Jitter-Types and Sourcesb. Amplitude Noise
IV. Instrumentation for Measuring Signal Integritya. Oscilloscopesb. BERT’sc. SIA’sd. Bandwidth-It’s not the only metric for performance
They all perform different functions

74
A Technologies Company
WAVECREST
More Signal Integrity Presentations
Statistical and System Transfer Function Based Method for Jitter and Noise in Communication Design and Test-Track 4, 2:00 pm Tuesday, Mike Li and Jan Wilstrup, Wavecrest

75
A Technologies Company
WAVECRESTA Technologies Company
WAVECREST
“The old concept of histogram based peak-to-peak jitter has been replaced by the concept of total jitter that is associated with a certain bit error rate for the serial link (typically 10-12)”
ITRS Roadmap for Semiconductors: 2003
One final thought