Embed Size (px)
Citation preview
Characterizing drug interactions in the substrate binding pocket of the
P-glygoprotein multidrug efflux pump
by
David Ward
A Thesis
presented to
The University of Guelph
In partial fulfilment of requirements
for the degree of
Master of Science
in
Biophysics
Guelph, Ontario, Canada
© David Ward, February, 2012
ABSTRACT
CHARACTERIZING DRUG INTERACTIONS IN THE SUBSTRATE BINDING
POCKET OF THE P-GLYCOPROTEIN MULTIDRUG EFFLUX PUMP
David Ward Advisor: University of Guelph, 2012 Professor F.J. Sharom
P-glycoprotein (Pgp, ABCB1) is a polyspecific efflux transporter implicated in
multidrug resistance in human cancers. In this study, tetramethylrhodamine-5-carbonyl
azide (AzTMR) was covalently crosslinked to the Pgp drug binding pocket with a
stoichiometry of 1. The Pgp-AzTMR adduct was functionally equivalent to unlabelled
Pgp and retained its ability to transport Hoechst 33342. The binding site of AzTMR in
Pgp was nonpolar, with a similar environment to that of propanol. Pgp-AzTMR could
bind a second drug molecule, with a higher affinity for H-site drugs and lower affinity for
other R-site drugs. Unlabelled Pgp interacted with dimeric versions of known Pgp
modulators, binding them with higher affinity than the monomer. These compounds were
also found to either stimulate or inhibit Pgp ATPase activity depending on the
concentration. Pgp-AzTMR was able to bind dimeric drugs, indicating that 3 substrate
moieties can fit into the binding pocket.
iii
ACKNOWLEDGMENTS
I would like to thank my advisor, Dr. Frances Sharom, for the opportunity to
complete the research contained in this thesis and very helpful suggestions throughout the
drafting phase and defence preparation. I would also like to thank the members of my
advisory committee, Dr. Rod Merrill and Dr. Leonid Brown, for their support throughout
my research phase and for contributing to the editing of my thesis and Dr. George Hauraz
for reading my thesis and serving on my examination committee. I would like to extend
my gratitude to our collaborators, Dr. Christine Hrycyna and Dana Emmert at Purdue
University, who provided samples used in this research and were always eager to discuss
our experimental results. I am grateful to the many past and present members of our
laboratory, who provided much technical guidance and friendship.
Last but by no means least is the recognition of the continuous support and
encouragement throughout my undergraduate and graduate studies given by my parents,
grandparents, family and many friends. This thesis would not have been possible without
them and I am extremely grateful for their contributions to my life.
iv
TABLE OF CONTENTS
ABSTRACT
ACKNOWLEDGMENTS ................................................................................................. iii
TABLE OF CONTENTS ................................................................................................... iv
LIST OF TABLES ........................................................................................................... viii
LIST OF FIGURES ........................................................................................................... ix
GLOSSARY OF ABBREVIATIONS .............................................................................. xii
1 INTRODUCTION..................................................................................................... 1
1.1 P-glycoprotein ................................................................................................. 2
1.1.1 ABC superfamily of proteins .................................................................. 2
1.1.2 Physiological role of P-glycoprotein ....................................................... 3
1.1.3 P-glycoprotein and multidrug resistance ................................................. 4
1.2 Structure of Pgp ............................................................................................... 6
1.2.1 Topology of Pgp ...................................................................................... 6
1.2.2 Conserved regions of Pgp ....................................................................... 6
1.2.3 X-ray crystal structure of Pgp ................................................................. 8
1.3 Interaction of drugs and nucleotides with Pgp .............................................. 12
1.3.1 Pgp substrate specificity: substrates and modulators ............................ 12
1.3.2 Nature of the Pgp drug binding pocket ................................................. 15
1.3.3 Binding and hydrolysis of nucleotides .................................................. 17
1.4 Transport of drugs by Pgp ............................................................................. 20
1.4.1 Models of drug transport: hydrophobic vacuum cleaner and flippase .................................................................................................. 20
1.4.2 Catalytic cycle of Pgp ........................................................................... 22
1.4.3 Pgp drug transport sites ......................................................................... 25
v
1.5 Rationale and research objectives ................................................................. 27
2 MATERIALS AND METHODS ........................................................................... 30
2.1 Materials ........................................................................................................ 31
2.2 Pgp purification ............................................................................................. 31
2.2.1 Plasma membrane (PM) isolation from CHRB30 cells ......................... 32
2.2.2 Detergent extraction of Pgp .................................................................. 33
2.2.3 Pgp purification ..................................................................................... 34
2.2.4 Protein assays ........................................................................................ 34
2.3 Determination of Pgp ATPase activity ......................................................... 35
2.4 Preparation and characterization of Pgp-AzTMR ......................................... 37
2.4.1 Crosslinking of AzTMR to Pgp ............................................................ 37
2.4.2 Optimization of crosslinking conditions ............................................... 38
2.4.3 Stoichiometry of AzTMR linkage ......................................................... 38
2.4.4 Fluorescence properties of Pgp-AzTMR drug adduct .......................... 39
2.4.5 Polarity of the AzTMR binding site in Pgp .......................................... 39
2.5 Determination of Pgp drug binding affinity .................................................. 40
2.5.1 Pgp intrinsic Trp fluorescence quenching ............................................. 40
2.5.2 Enhanced H33342 and H33258 fluorescence on Pgp binding .............. 42
2.6 Pgp transport assay ........................................................................................ 43
2.6.1 Functional reconstitution of Pgp ........................................................... 43
2.6.2 Real-time fluorescence transport assay ................................................. 44
3 CROSSLINKING OF AZTMR TO PURIFIED PGP .... .....................................45
3.1 Introduction ................................................................................................... 47
3.2 Covalent crosslinking of AzTMR to Pgp ...................................................... 49
3.3 Optimization of crosslinking conditions ....................................................... 50
vi
3.4 Stoichiometry of covalent linkage of AzTMR to Pgp .................................. 57
3.5 Discussion ..................................................................................................... 60
4 BIOCHEMICAL CHARACTERIZATION OF PGP-AZTMR ......................... 63
4.1 Introduction ................................................................................................... 65
4.2 Determining the polarity of the local environment of bound AzTMR in Pgp .............................................................................................. 68
4.3 Interaction of R-site drugs with Pgp and Pgp-AzTMR ................................. 70
4.3.1 Effect on Pgp ATPase activity .............................................................. 70
4.3.2 Binding affinity of Pgp for R-site drugs ............................................... 72
4.4 Interaction of H-site drugs with Pgp and Pgp-AzTMR ................................ 76
4.4.1 Effects on Pgp ATPase activity ............................................................ 76
4.4.2 Binding affinity of Pgp for H-site drugs ............................................... 76
4.5 Binding of clinically important drugs to Pgp and Pgp-AzTMR ................... 80
4.6 Pgp-AzTMR drug transport .......................................................................... 81
4.7 Discussion ..................................................................................................... 83
5 BINDING OF DRUG MONOMERS AND DIMERS TO PGP/PGP-AZTMR AND EFFECTS ON ATPASE ACTIVITY .......................................... 86
5.1 Introduction ................................................................................................... 88
5.2 Abacavir monomer and dimers ..................................................................... 91
5.2.1 Binding affinity of Pgp and Pgp-AzTMR for abacavirs ....................... 91
5.3 Quinine monomer and dimers ....................................................................... 95
5.3.1 Binding affinity of Pgp and Pgp-AzTMR for quinines ......................... 95
5.3.2 Effect on ATPase activity ..................................................................... 95
5.4 Quetiapine monomer and dimers .................................................................. 99
5.4.1 Binding affinity of Pgp and Pgp-AzTMR for quetiapines .................... 99
5.4.2 Effect on ATPase activity ................................................................... 103
vii
5.5 Discussion ................................................................................................... 107
6 SUMMARY AND CONCLUSIONS ................................................................... 110
6.1 Summary and conclusions ........................................................................... 112
6.2 Suggestions for future work ........................................................................ 115
REFERENCES .............................................................................................................. 117
viii
LIST OF TABLES
Table 1.1 Representative Pgp substrates ................................................................. 13
Table 1.2 Representative modulators of Pgp activity .............................................. 13
Table 4.1 Binding affinity of Pgp and Pgp-AzTMR for R-site drugs ........................................................................................................ 74
Table 4.2 Binding affinity of Pgp and Pgp-AzTMR for Hoechst compounds ............................................................................................... 78
Table 4.3 Binding affinity of Pgp and Pgp-AzTMR for clinically important drugs ........................................................................................ 80
Table 5.1 Binding affinity of Pgp and Pgp-AzTMR for abacavirs ......................... 93
Table 5.2 Binding affinity of Pgp and Pgp-AzTMR for quinines ........................... 97
Table 5.3 Binding affinity of Pgp and Pgp-AzTMR for quetiapines ............................................................................................. 101
Table 5.4 IC50 values for inhibition of Pgp and Pgp-AzTMR ATPase activity by quetiapines ............................................................. 107
ix
LIST OF FIGURES
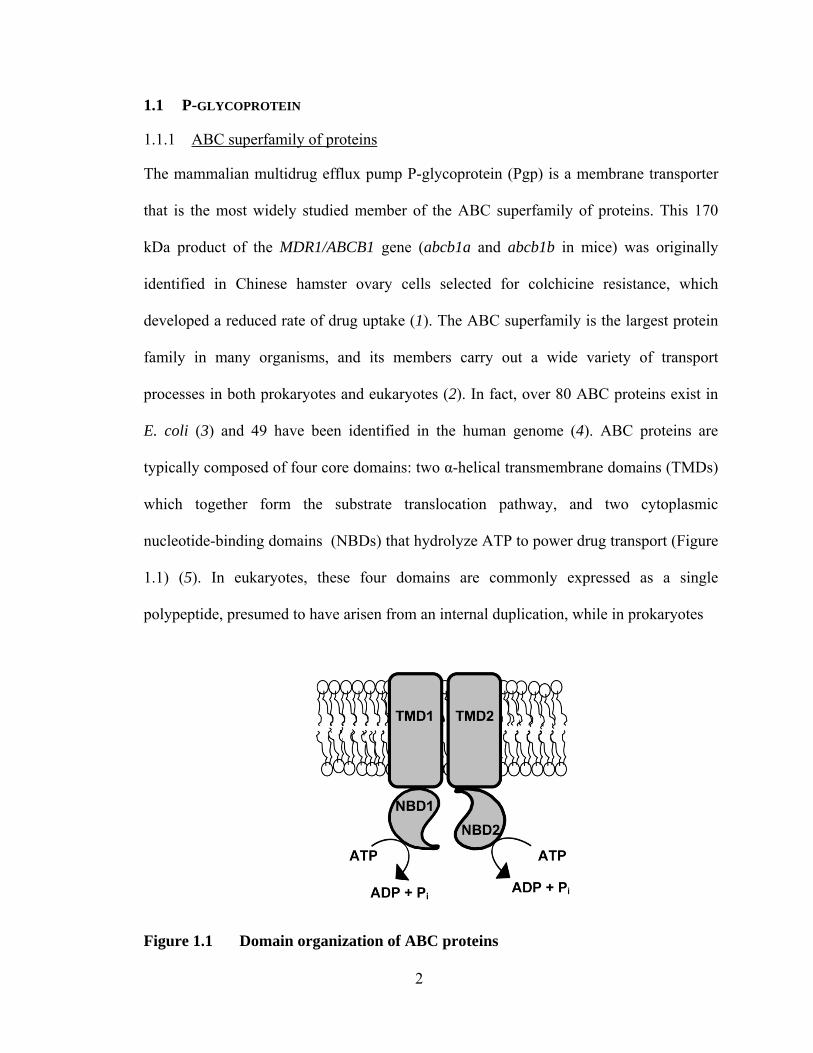
Figure 1.1 Domain organization of ABC proteins ................................................... 2
Figure 1.2 Topology of Pgp showing 11 Trp residues ............................................. 7
Figure 1.3 X-ray crystal structures of full length ABC transporters ..................... 10
Figure 1.4 Coordination of ATP in the NBDs of ABC transporters ...................... 18
Figure 1.5 The role of Pgp as a hydrophobic vacuum cleaner and a flippase ................................................................................................. 21
Figure 1.6 Summary of the Pgp transport cycle..................................................... 26
Figure 2.1 SDS-PAGE of Pgp purified from CHRB30 cells .................................. 35
Figure 3.1 Fluorescence properties of Pgp and Pgp-AzTMR ................................ 51
Figure 3.2 Crosslinking timecourse of AzTMR to Pgp ......................................... 53
Figure 3.3 Effect of different initial AzTMR concentrations on crosslinking ........................................................................................... 55
Figure 3.4 Effect of ATP and DTE on Pgp-AzTMR crosslinking ........................ 56
Figure 3.5 Stoichiometry of AzTMR labelling of Pgp .......................................... 58
Figure 4.1 Some Pgp substrates used in experiments with Pgp and Pgp-AzTMR ......................................................................................... 67
Figure 4.2 Lippert plot of AzTMR in solvents of varying polarity ....................... 69
Figure 4.3 Effect of AzTMR on ATPase activity and binding of Pgp and Pgp-AzTMR ........................................................................... 71
Figure 4.4 Effect of TMR and TMR-E on ATPase activity of Pgp and Pgp-AzTMR .................................................................................. 73
Figure 4.5 TMR and TMR-E binding to Pgp and Pgp-AzTMR ............................ 75
Figure 4.6 Effect of H33342 on ATPase activity of Pgp and Pgp-AzTMR ................................................................................................. 77
Figure 4.7 Binding affinity of Pgp for H33342 determined by Trp quenching and Hoechst fluorescence enhancement ............................. 79
x
Figure 4.8 H33342 transport by Pgp and Pgp-AzTMR proteoliposomes ....................................................................................... 82
Figure 5.1 Structures of monomers and dimers used in this study ........................... 89
Figure 5.2 Quenching of Pgp and Pgp-AzTMR Trp fluorescence by abacavirs ............................................................................................. 92
Figure 5.3 Drug dimer binding to Pgp-AzTMR ....................................................... 94
Figure 5.4 Quenching of Pgp and Pgp-AzTMR Trp fluorescence by quinines .............................................................................................. 96
Figure 5.5 Effect of quinines on ATPase activity of Pgp and Pgp-AzTMR .................................................................................................... 98
Figure 5.6 Binding of quetiapine monomer and dimers to Pgp .............................. 100
Figure 5.7 Binding of quetiapine monomer and dimers to Pgp-AzTMR .................................................................................................. 102
Figure 5.8 ATPase activity profiles of quetiapine C2 and C7 dimers with Pgp and Pgp-AzTMR ........................................................ 105
Figure 5.9 ATPase activity of quetiapine and IC50 of quetiapine dimers .................................................................................................... 106
xi
GLOSSARY OF ABBREVIATIONS
ABC ATP-binding cassette AMP-PNP 5'-adenylimido-diphosphate ATP-γ-S adenosine-5'-O-(3-thio-triphosphate) AzTMR tetramethylrhodamine-5-carbonyl azide BBB blood-brain barrier BCRP breast cancer resistance protein (ABCG2) BSA bovine serum albumin CHAPS 3-[(3-cholamidopropyl)-dimethylammonio]-1-propanesulfonate CNS central nervous system ConA concanavalin A DMF dimethylformamide DMPC dimyristoylphosphatidylcholine DTE dithiothreitol ECL extracellular loop FRET Förster resonance energy transfer H33258 Hoechst 33258 H33342 Hoechst 33342 H-site Hoechst 33342 transport site HEPES 4-(2-hydroxyethyl)-1-piperazineethanesulfonic acid ICL intracellular loop IAAP iodoarylazidoprazosin LDS-751 2-[4-(4-[dimethylamino]phenyl)-1,3-butadienyl]-3-
ethylbenzothiazolium perchlorate MDR multidrug resistance α-MEM minimal essential medium MRP1 multidrug resistance-associated protein 1 (ABCC1) MTS methanethiosulfonate NATA N-acetyl-L-tryptophanamide NB nucleotide-binding NBD nucleotide-binding domain Pi inorganic phosphate PBS phosphate-buffered saline Pgp P-glycoprotein Pgp-AzTMR Pgp-AzTMR covalent adduct
xii
Pgp-mock mock crosslinked Pgp PM plasma membrane PMSF phenylmethylsulfonyl fluoride QSAR quantitative structure-activity relationship R101 rhodamine 101 R110 rhodamine 110 R123 rhodamine 123 R6G rhodamine 6G R-site rhodamine 123 transport site SNP single nucleotide polymorphism TM transmembrane TMD transmembrane domain TMEA tris-(2-maleimidoethyl)amine TMR tetramethylrosamine TMR-E tetramethylrhodamine ethyl ester TMR-M tetramethylrhodamine methyl ester Vi ortho-vanadate

1
Chapter 1
INTRODUCTION
2
1.1 P-GLYCOPROTEIN
1.1.1 ABC superfamily of proteins
The mammalian multidrug efflux pump P-glycoprotein (Pgp) is a membrane transporter
that is the most widely studied member of the ABC superfamily of proteins. This 170
kDa product of the MDR1/ABCB1 gene (abcb1a and abcb1b in mice) was originally
identified in Chinese hamster ovary cells selected for colchicine resistance, which
developed a reduced rate of drug uptake (1). The ABC superfamily is the largest protein
family in many organisms, and its members carry out a wide variety of transport
processes in both prokaryotes and eukaryotes (2). In fact, over 80 ABC proteins exist in
E. coli (3) and 49 have been identified in the human genome (4). ABC proteins are
typically composed of four core domains: two α-helical transmembrane domains (TMDs)
which together form the substrate translocation pathway, and two cytoplasmic
nucleotide-binding domains (NBDs) that hydrolyze ATP to power drug transport (Figure
1.1) (5). In eukaryotes, these four domains are commonly expressed as a single
polypeptide, presumed to have arisen from an internal duplication, while in prokaryotes
Figure 1.1 Domain organization of ABC proteins
3
they can be synthesized as two or four separate subunits.
Bacterial ABC proteins can be importers or exporters, while mammalian ABC
proteins are exclusively exporters; all are active transporters, moving their substrates up a
concentration gradient (6). Some ABC transporters have broad substrate specificity, such
as the mammalian multidrug efflux pumps, Pgp, multidrug resistance-associated protein 1
(MRP1) and breast cancer resistance protein (BCRP). Others, however, specialize in the
transport of a specific substrate; for example, maltose permease, which imports maltose
in bacteria. Several ABC proteins have been studied extensively because of their role in
human health and disease; mutations in 17 different human ABC transporters have been
implicated in specific disease processes (7). However, the physiological role of many
human ABC proteins remains unknown.
1.1.2 Physiological role of P-glycoprotein
Low levels of Pgp expression have been observed in most tissues, however, it is
most abundant in the apical membranes of polarized epithelial cells with excretory
functions, such as those in the intestine, kidney, liver and pancreas (8;9). Pgp is also
located in the endothelial cell membranes of blood-tissue barriers, including the blood-
brain barrier (BBB), placenta, blood-testis, blood-ovary and blood-nerve barriers (10).
The exact physiological role of Pgp in each of these tissues is not known with certainty,
and is complicated by the multiplicity of apparent substrates, however, it may play a role
in protecting the body from toxic compounds, both endogenous and xenobiotics. Pgp can
prevent substrates from being absorbed in the intestine, and mediates their excretion via
the kidney/liver/pancreatic ducts. In the barrier tissues, Pgp is oriented such that it would
expel substrates into the blood, which also supports the idea that Pgp prevents cytotoxic
4
compounds from entering sensitive organs (11). Double-knockout mice (abcb1a/b(-/-)) that
are null for Pgp display a normal phenotype and are fertile, however, when exposed to
the anti-parasitic agent ivermectin, they die from its toxicity, while wild-type mice do not
(12). The knockout mice could not expel the neurotoxic ivermectin which accumulated in
their brains, whereas wild-type mice were protected by the presence of Pgp in the BBB.
Moreover, collie dogs with a naturally occurring frameshift mutation that results in lack
of Pgp expression display high sensitivity to ivermectin relative to wild-type dogs (13).
The tissues where Pgp is found are important barriers in the absorption, distribution and
elimination of drugs, and it is therefore not surprising that Pgp affects the bioavailability
and pharmacokinetics of many clinically important drugs, including those used in
chemotherapy treatments for a variety of human diseases and cancers.
1.1.3 P-glycoprotein and multidrug resistance
Tumour cells can become simultaneously resistant to a wide range of anti-cancer
drugs in a condition known as multidrug resistance (MDR). Thirteen ABC transporters,
including Pgp, have been reported to be involved in its development (14). MDR can arise
from a variety of cellular mechanisms including altered drug metabolism, p53 mutation
and altered DNA repair processes, but drug efflux resulting from Pgp overexpression is
thought to be one of the main causes (15;16). In fact, Pgp expression levels are correlated
with resistance to several anti-cancer drugs in the U.S. National Cancer Institute’s
collection of tumour cell lines, and it is believed to contribute to chemotherapy drug
resistance in at least 50% of human cancers (17;18). Some cancers, including those of the
colon, liver, pancreas and kidney, tend to be inherently drug-resistant, while others such
as leukemias, myelomas, ovarian and breast cancers most often develop MDR subsequent
5
to chemotherapy treatment. Pgp has been reported in many of these tumours and in some
cases, its expression increases after one or more rounds of chemotherapy (19).
Following retroviral transfer of the human MDR1 gene into the bone marrow cells
of mice, the cells became resistant to the cytoxic drug taxol, demonstrating the ability of
Pgp to confer drug resistance in vivo (20). Since Pgp is the most prevalent cause of MDR,
it soon emerged as an attractive target of drugs aimed at reversing MDR in human
cancers. This led to the development of Pgp modulators, compounds that are capable of
reversing drug resistance. Modulators used in combination with chemotherapy drugs
would improve the uptake and distribution of those compounds into tumour cells, making
them more cytotoxic. The early use of modulators in clinical cancer treatment was
somewhat disappointing as poor clinical trial design, patient selection and toxicity led to
sub-optimal outcomes for patients (21). Modulators have shown some positive effects in
a few cases, including the treatment of acute myeloid leukemia with the Pgp modulator
cyclosporin A in combination with cytarabine and daunorubicin (22), and more selective,
less cytotoxic agents have been developed (23;24). Tumours expressing elevated levels
of Pgp prior to chemotherapy tend to be less responsive to Pgp inhibitors than tumours
that develop MDR over the course of treatment (25), highlighting the need for more
research into the role of Pgp in MDR and the design of modulators to combat it.
However, many recent clinical trials with new “third generation” modulators have failed,
leading to doubt about the ability of this strategy to improve the outcome of
chemotherapy treatment (26).
6
1.2 STRUCTURE OF PGP
1.2.1 Topology of Pgp
Pgp is a “full transporter”, a single 1280 amino acid polypeptide organized into two
homologous halves thought to have arisen from gene duplication. The two halves are
connected by a cytoplasmic 60-amino acid flexible linker region which can be
phosphorylated, and both the N- and C-termini face the cytoplasm. The topology of Pgp
(Figure 1.2) was confirmed biochemically by analyzing the immunofluorescence of
inserted epitope tags and extensive biotinylation of cysteines inserted at specific locations
in Cys-less Pgp (27;28). Each half of the protein was found to contain 6 membrane
embedded α-helices connected by intracellular loops (ICL) and extracellular loops (ECL),
which form the substrate translocation pathway, followed by a cytosolic NBD. Pgp is N-
glycosylated on its first ECL, and glycosylation plays a role in trafficking of Pgp to the
cell surface (29). However, it is not necessary for transport, since unglycosylated Pgp
mutants are able to transport substrates normally (30;31). Pgp contains 11 Trp residues
(Figure 1.2) distributed throughout the protein, with 8 in the N-terminal half and 3 in the
C-terminal half (32), which provide a source of intrinsic protein fluorescence. In addition,
there are 7 Cys residues in Pgp, including one in each NBD, which are useful for
labelling Pgp with specific Cys-reactive probes (33).
1.2.2 Conserved regions of Pgp
In light of the common transport and ATP hydrolysis functions of ABC proteins, it
is not surprising that they share common features. There is a low level of sequence
similarity in the TMDs, which is likely due to each one having evolved as the
translocation pathway for a particular substrate(s). However, the NBDs are very well
7
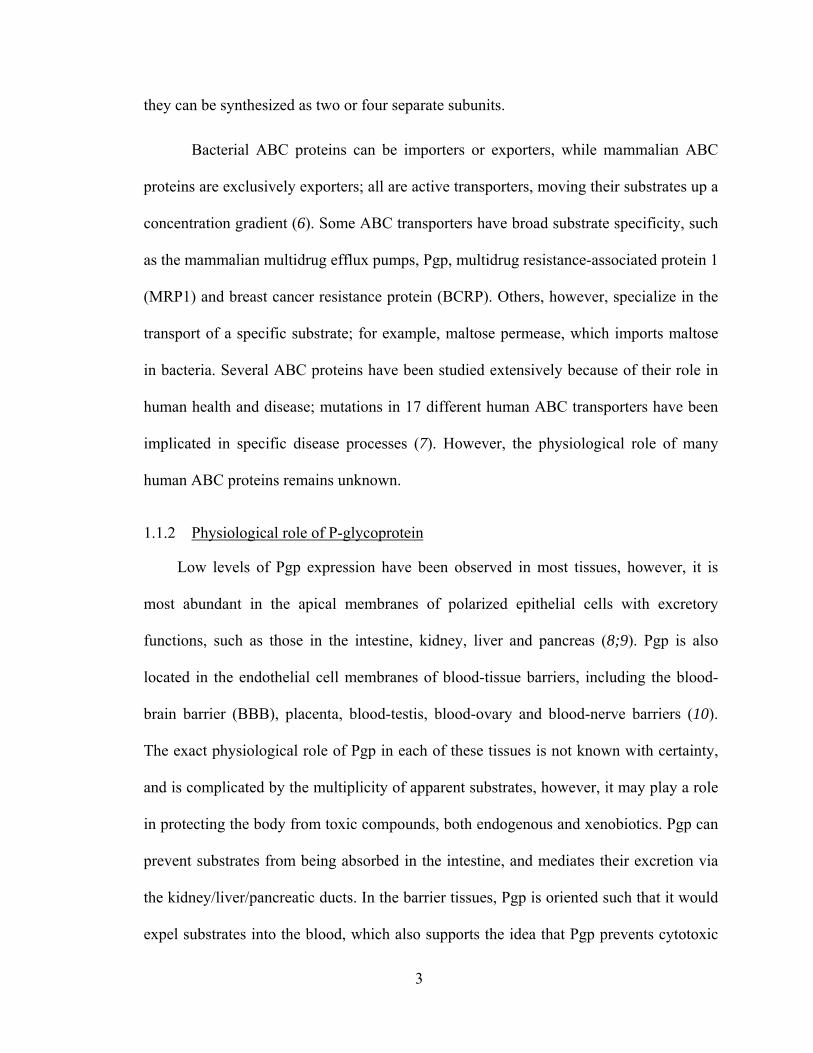
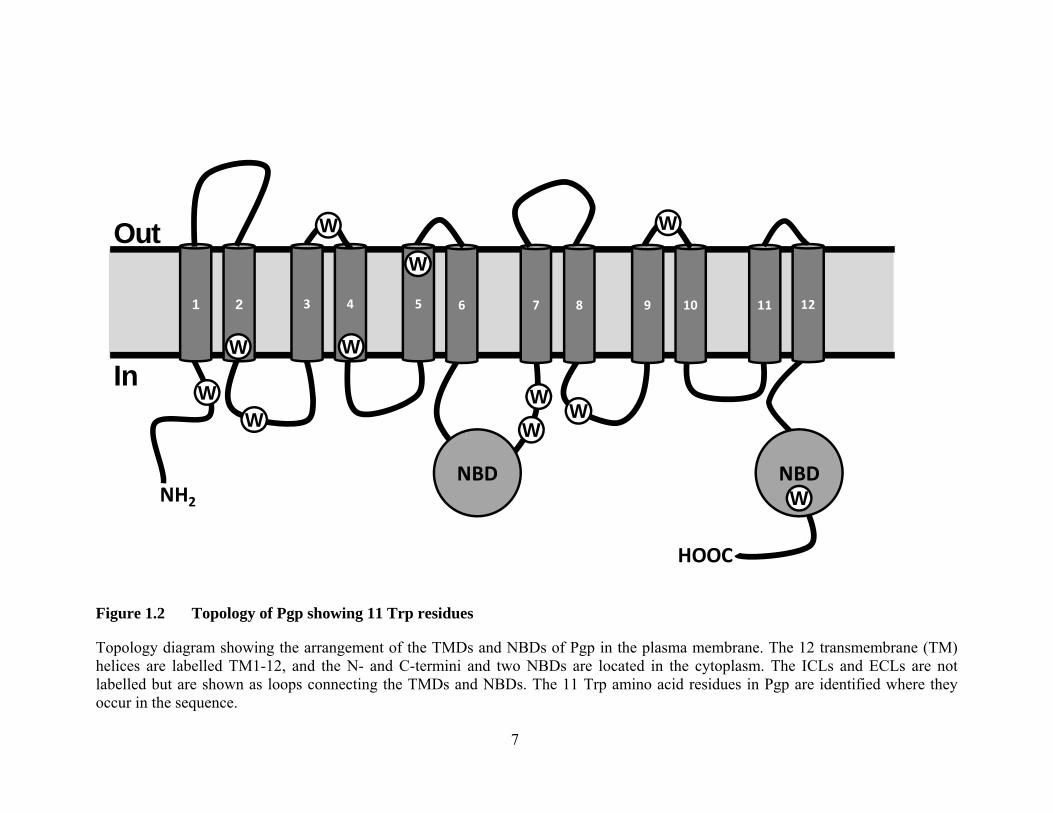
Figure 1.2 Topology of Pgp showing 11 Trp residues
Topology diagram showing the arrangement of the TMDs and NBDs of Pgp in the plasma membrane. The 12 transmembrane (TM) helices are labelled TM1-12, and the N- and C-termini and two NBDs are located in the cytoplasm. The ICLs and ECLs are not labelled but are shown as loops connecting the TMDs and NBDs. The 11 Trp amino acid residues in Pgp are identified where they occur in the sequence.
1 2 3 4 5 6 7 8 9 10 11 12
NBD NBD
Out
In
NH2
HOOC
WW
W
W
W
W
WW
W
W
W
8
conserved between different transporters and across species, which is expected given the
common mechanism of ATP-driven transport. NBD1 and NBD2 have 25% and 28%
sequence identity, and 50% similarity, respectively, across all ABC proteins, and a
number of conserved motifs are present (34;35). The NBDs of many proteins that bind or
hydrolyze ATP or GTP contain a Walker A (GXXGXGKS/T) and Walker B (hhhhD;
h=hydrophobic amino acid) motif (36), but the signature C motif (LSGGQQ/R/KQR) of
Pgp is unique to the ABC superfamily (37). Pgp also contains highly conserved amino
acids in the A-loop, Q-loop, H-loop, D-loop and Pro-loop of its NBDs. These loops,
along with the Walker A, Walker B and signature C motifs, are involved in the binding
and coordination of ATP, its divalent cation Mg2+, and the water molecule involved in
ATP hydrolysis (38). The Q-loop and Pro-loop may also be involved in interdomain
communication, coupling ATP hydrolysis to the TMDs (39).
1.2.3 X-ray crystal structure of Pgp
Until recently, there was no high resolution structural information available for Pgp,
and researchers had to rely on comparisons to known bacterial ABC transporter structures
and low resolution electron microscopic structures. However, in 2009, the first medium-
high resolution X-ray crystal structure of Pgp was published, showing the apo- and drug-
bound states at 3.8-4.4 Å resolution (40). The crystal structures validate many findings of
the Pgp homology models and lower resolution structures, but have been criticized
widely for physiological relevance.
High resolution X-ray crystallographic structures are available for the bacterial lipid
A flippase MsbA in several nucleotide-bound states (41), and the transporter Sav1866
from S. aureus with bound ADP and 5'-adenylimido-diphosphate (AMP-PNP) (Figure
9
1.3A and B) (42;43). Both MsbA and Sav1866 show the highest sequence similarity with
Pgp out of all ABC transporters with known high resolution structures, and each contain
12 TM helices which enclose their central cavity. The structures of both bacterial
transporters indicate that some TM helices (TM1-2 in Sav1866 and TM4-5 in MsbA) in
each half of the protein associate with those in the other half, which introduces a twist
into the overall structure. When nucleotides are present, the NBDs of both transporters
are closely associated, and the TMD bundles form a funnel that is closed at the
cytoplasmic side. However, in the absence of nucleotide, two states were observed for
MsbA, in which the NBDs were separated to varying degrees, and the TMD bundle
appeared to open to the cell interior (41). These findings led to a proposal that the TM
helices can exist in an outward- or inward-facing conformation in the presence or absence
of nucleotide, respectively, and provided for a mechanism whereby the binding of ATP
drives the structural reorganization necessary for substrate translocation (44). Indeed, it is
now believed that ATP binding induces NBD dimerization, and reorientation of the
TMDs so they face the extracellular environment to release their substrates. ATP
hydrolysis is proposed to return the TMDs to the inward-facing state to start the transport
process over again (45). Homology models of Pgp were constructed based on the
structures of bacterial transporters, and predicted that Pgp could also undergo
rearrangement of its TMDs in a nucleotide-dependent manner (46;47). Moreover,
biochemical cross-linking experiments with Pgp showed that TMD2 contacts NBD1,
indicating that it likely has a domain architecture similar to that of Sav1866 (48).
Several EM structures of Pgp have been reported over the years (49-53), with the
use of 2D crystals (50) and cryo-EM leading to increased resolution (51). These
10
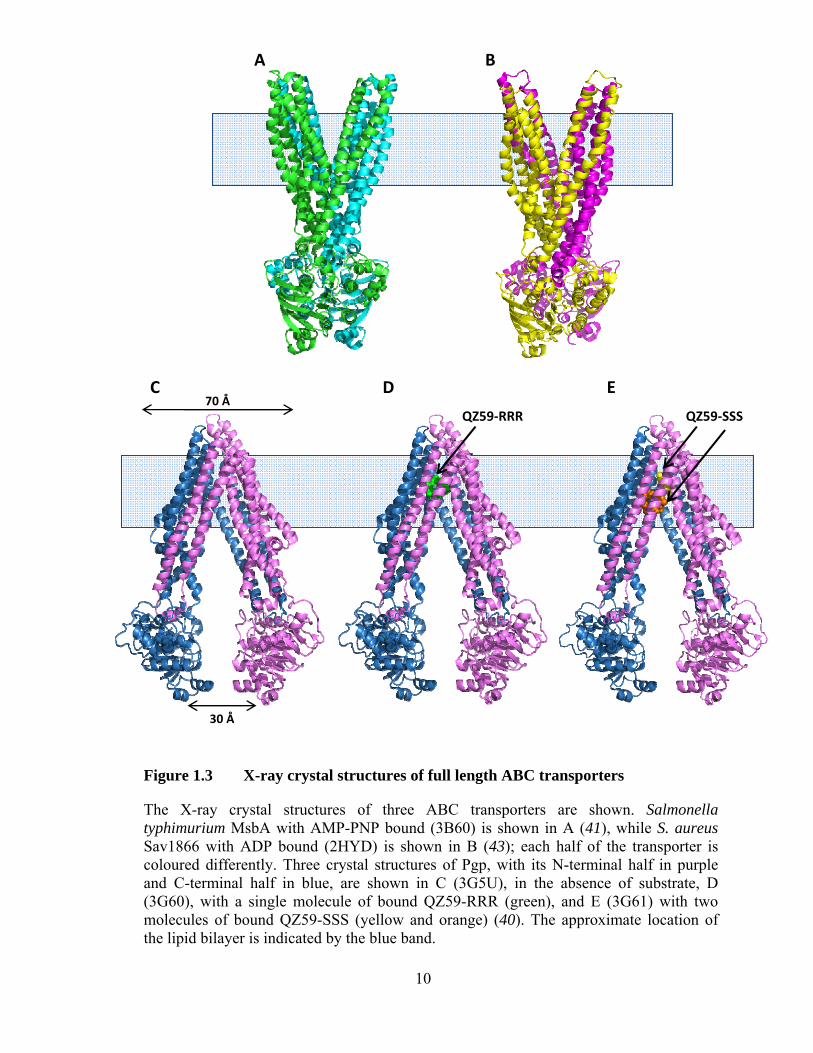
Figure 1.3 X-ray crystal structures of full length ABC transporters
The X-ray crystal structures of three ABC transporters are shown. Salmonella typhimurium MsbA with AMP-PNP bound (3B60) is shown in A (41), while S. aureus Sav1866 with ADP bound (2HYD) is shown in B (43); each half of the transporter is coloured differently. Three crystal structures of Pgp, with its N-terminal half in purple and C-terminal half in blue, are shown in C (3G5U), in the absence of substrate, D (3G60), with a single molecule of bound QZ59-RRR (green), and E (3G61) with two molecules of bound QZ59-SSS (yellow and orange) (40). The approximate location of the lipid bilayer is indicated by the blue band.
30 Å
QZ59‐RRR QZ59‐SSS70 Å
C D E
A B
11
structures have confirmed many conclusions from the homology models, specifically,
that the NBDs close in the presence of ATP and that the TM helices reorganize during
this process. One of the added discoveries was that further conformational changes in the
TMDs may take place after ATP hydrolysis, as shown in an EM structure of the ADP-
vanadate post-hydrolysis state (50).
The recent 3.8-4.4 Å X-ray crystal structures of mouse Pgp provided a new template
to validate all the prior biochemical and structural evidence (40). The protein was
crystallized nucleotide-free in the apo form and in complex with two stereoisomers of a
cyclic peptide inhibitor, cyclic-tris-(R)-valineselenazole (QZ59-RRR) and cyclic-tris-(S)-
valineselenazole (QZ59-SSS) (Figure 1.3C-E). All three forms were catalytically active.
All structures were inward-facing and showed the two 6-helix bundles enclosing a large
6000 Å3 internal cavity with pseudo-two-fold symmetry. Interestingly, the two helical
bundles contained TMs 1-3, 6, 10, 11 and 4, 5, 7-9, 12, confirming that “helix-swapping”
takes place in the two halves, as with MsbA and Sav1866. The Pgp structures agree with
much of the prior work on ABC transporter structure, along with the biochemical and
biophysical data on Pgp. The crystal structure showed one molecule of QZ59-SSS bound
at a “middle” site in the binding pocket (Figure 1.3D), and two molecules of QZ59-RRR
bound at “upper” and “lower” sites which overlapped the middle site (Figure 1.3E).
These structures confirm earlier reports that two drug molecules can bind to Pgp
simultaneously (54;55). The binding pocket is made up of a core set of hydrophobic and
aromatic amino acid residues from both TMDs, yet each binding site contains several
unique residues specific to that site. An ~9 Å wide “portal” is found on each side of the
12
protein, embedded within the membrane, possibly providing access for the entry of
hydrophobic substrates directly from the inner leaflet.
All three crystal structures show that the NBDs are widely separated by ~30 Å,
which is perhaps not surprising given the absence of nucleotide, but raises questions as to
the physiological validity of this state. Indeed, reactions towards this structure have been
mixed, and criticisms have arisen directed at the absence of ATP, and the absence of any
significant conformational changes on drug binding (56). Additional structures with
bound nucleotide will be needed to piece together a deeper understanding of Pgp’s
catalytic and transport mechanism.
1.3 INTERACTION OF DRUGS AND NUCLEOTIDES WITH PGP
1.3.1 Pgp substrate specificity: substrates and modulators
Pgp can transport hundreds of structurally diverse substrates across the membrane
using the energy from ATP hydrolysis, and theoretical studies suggest its substrates could
number into the thousands (57). A Pgp substrate is typically a large, hydrophobic,
amphipathic, polyaromatic compound with a positively-charged quaternary nitrogen
atom, although not all of its substrates meet these requirements (11;58;59). Most
substrates were identified by their reduced cytotoxicity in cells overexpressing Pgp,
rather than by direct binding or transport measurements. Substrates include Vinca
alkaloids and other chemotherapeutic drugs, peptides, steroids, natural products, HIV
protease inhibitors, and fluorescent dyes (11;59;60) (Table 1.1). When binding of these
structurally unrelated compounds is measured, the range in Kd values spans several
orders of magnitude, indicating that Pgp can discriminate between its substrates (61).
13
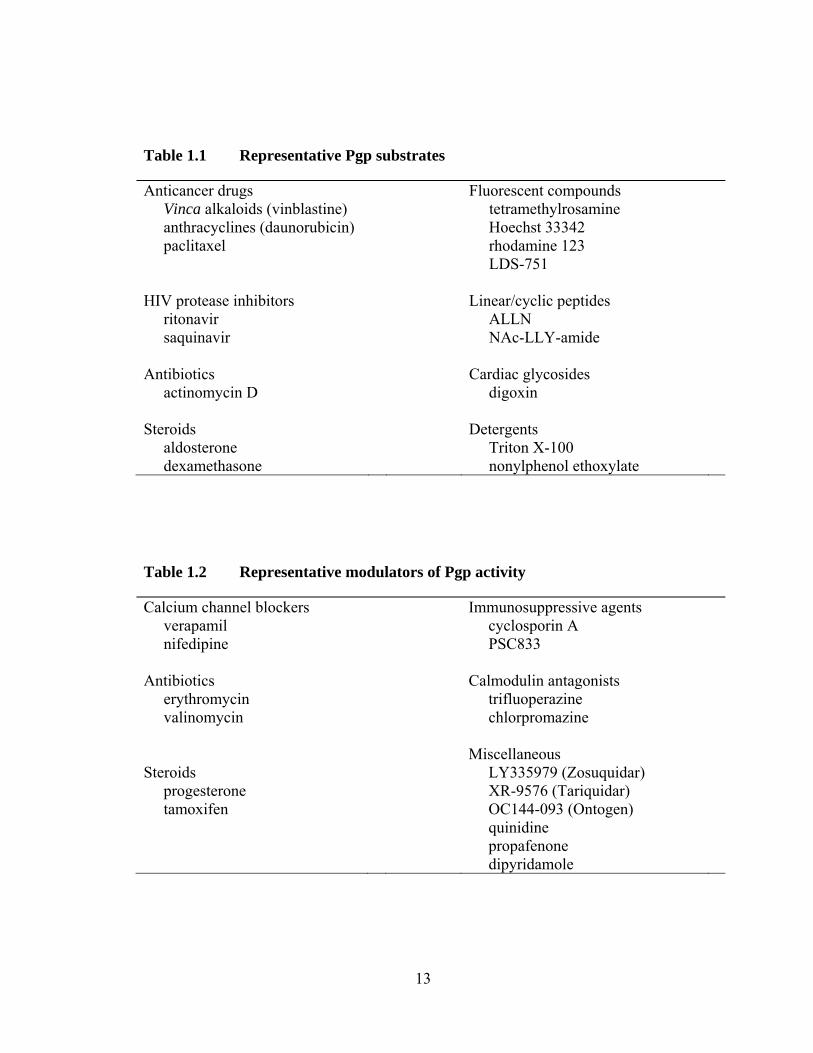
Table 1.1 Representative Pgp substrates
Anticancer drugs Fluorescent compounds Vinca alkaloids (vinblastine) tetramethylrosamine anthracyclines (daunorubicin) Hoechst 33342 paclitaxel rhodamine 123 LDS-751 HIV protease inhibitors Linear/cyclic peptides ritonavir ALLN saquinavir NAc-LLY-amide Antibiotics Cardiac glycosides actinomycin D digoxin Steroids Detergents aldosterone Triton X-100 dexamethasone nonylphenol ethoxylate
Table 1.2 Representative modulators of Pgp activity
Calcium channel blockers Immunosuppressive agents verapamil cyclosporin A nifedipine PSC833 Antibiotics Calmodulin antagonists erythromycin trifluoperazine valinomycin chlorpromazine Miscellaneous Steroids LY335979 (Zosuquidar) progesterone XR-9576 (Tariquidar) tamoxifen OC144-093 (Ontogen) quinidine propafenone dipyridamole
14
The large number and structural variability of Pgp substrates have made it difficult
to explain how so many compounds can interact with a single protein. Substrates have
been proposed to bind to Pgp mainly through van der Waals forces, hydrophobic
interactions, H-bonding and π-π stacking interactions with Trp and Tyr residues (62).
Indeed, in the Pgp X-ray crystal structure, interactions between the hexapeptide substrate
and aromatic side chains from the TMDs are evident (40). Genetic mutations at specific
amino acid residues have been shown to alter the binding affinity of one substrate to Pgp,
but have no effect on others (63;64). These findings led to a proposed induced-fit
mechanism for drug binding to Pgp: the substrate enters the large binding pocket and
establishes a small core set of interactions, followed by small TM helix and side chain
movements to create a sub-set of specific interactions unique to that substrate (65). This
proposal is supported by the X-ray structure of Pgp, where each of the three substrate
molecules are bound to different overlapping locations, and contain both common and
unique binding contacts (40).
Attempts have been made to establish a pharmacophore model for Pgp, but because
of the great diversity of substrates, this has proved difficult. The presence of H-bond
donors (66) and aromatic Trp residues (some of which are sensitive to substrate binding
(32)) in the TM regions of Pgp suggested that interactions with these residues might be
common to substrate binding (62). A quantitative structure-activity relationship (QSAR)
for Pgp substrates was proposed, where two or three H-bond acceptors/electron donors
and certain hydrophobic groups with a fixed spatial arrangement form a basal set of
common structural features (66;67).
15
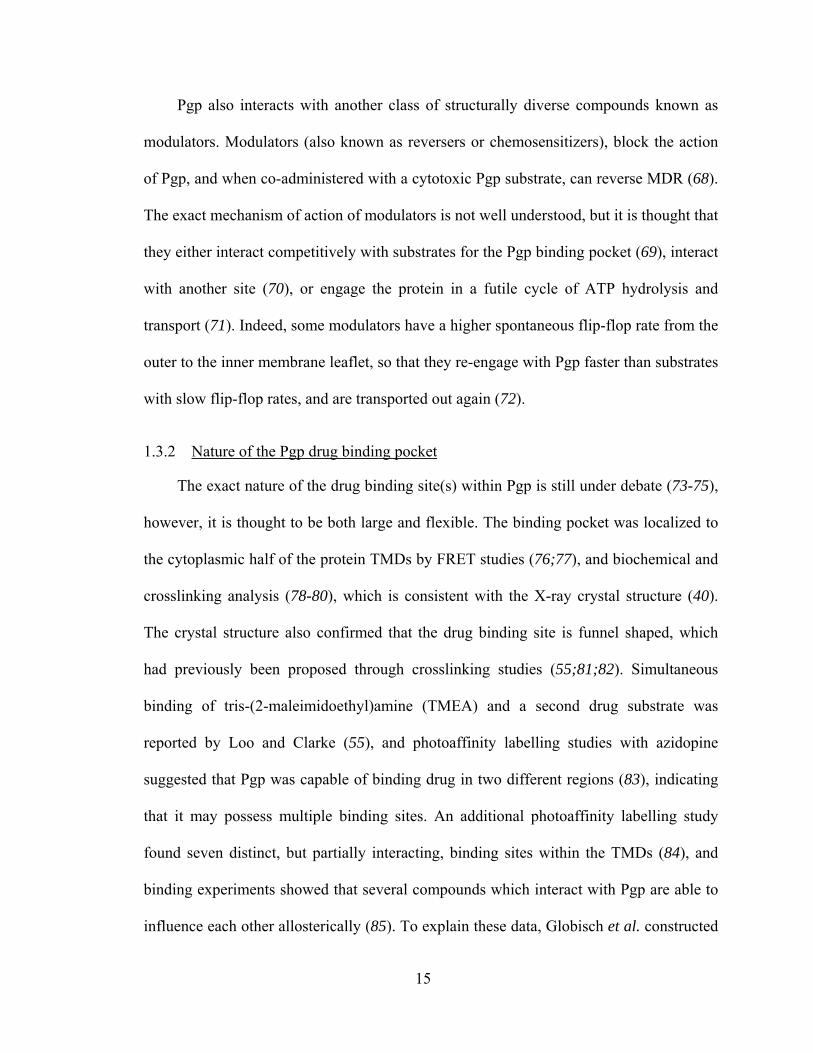
Pgp also interacts with another class of structurally diverse compounds known as
modulators. Modulators (also known as reversers or chemosensitizers), block the action
of Pgp, and when co-administered with a cytotoxic Pgp substrate, can reverse MDR (68).
The exact mechanism of action of modulators is not well understood, but it is thought that
they either interact competitively with substrates for the Pgp binding pocket (69), interact
with another site (70), or engage the protein in a futile cycle of ATP hydrolysis and
transport (71). Indeed, some modulators have a higher spontaneous flip-flop rate from the
outer to the inner membrane leaflet, so that they re-engage with Pgp faster than substrates
with slow flip-flop rates, and are transported out again (72).
1.3.2 Nature of the Pgp drug binding pocket
The exact nature of the drug binding site(s) within Pgp is still under debate (73-75),
however, it is thought to be both large and flexible. The binding pocket was localized to
the cytoplasmic half of the protein TMDs by FRET studies (76;77), and biochemical and
crosslinking analysis (78-80), which is consistent with the X-ray crystal structure (40).
The crystal structure also confirmed that the drug binding site is funnel shaped, which
had previously been proposed through crosslinking studies (55;81;82). Simultaneous
binding of tris-(2-maleimidoethyl)amine (TMEA) and a second drug substrate was
reported by Loo and Clarke (55), and photoaffinity labelling studies with azidopine
suggested that Pgp was capable of binding drug in two different regions (83), indicating
that it may possess multiple binding sites. An additional photoaffinity labelling study
found seven distinct, but partially interacting, binding sites within the TMDs (84), and
binding experiments showed that several compounds which interact with Pgp are able to
influence each other allosterically (85). To explain these data, Globisch et al. constructed
16
a homology model of Pgp based on Sav1866 to predict the number and nature of Pgp
drug binding sites (86). Interestingly, they proposed that Pgp contained 40 different
binding sites clustered into 3 larger binding regions: one at the TMD-cytoplasm interface
and the other two in the TMDs in the membrane interior. Amino acid mutations in the
TMD-cytoplasm region showed that this location is important in substrate specificity
(63;87-89), and the other two TMD regions are important for drug binding and allosteric
communication with the NBDs (90;91).
Early reports indicated that the drug binding pocket may be accessible to the
aqueous environment (50;92), however, fluorescence techniques have shown that the H-
and R-sites are hydrophobic in nature (54;77). Extensive crosslinking studies carried out
with Cys-less Pgp suggested that the binding pocket was formed at the interface between
the two TMDs, with residues contributed mainly from TM helices 4, 5, and 6 from the N-
terminal TMD, and TM helices 9, 10, 11, and 12 from the C-terminal TMD (79;93). In
the X-ray crystal structure of Pgp, both peptide stereoisomers bind between TM helices 6
and 12 (40). The binding of QZ59-RRR to the middle site takes place mostly through
hydrophobic interactions with residues in TMs 1, 5, 6, 7, 11, and 12. The molecule of
QZ59-SSS occupying the upper site is also surrounded by hydrophobic amino acids from
TMs 1, 2, 6, 7, 11, and 12, while the molecule occupying the lower site is surrounded by
residues from TMs 1, 5, 6, 7, 8, 9, 11, and 12, including three polar residues (40). Many
of the interactions with nearby amino acids are common to all three bound drug
molecules, but each site has a small subset of unique contacts, and it is likely that even
within the large membrane-embedded binding pocket, there are polarity differences in
each of the local environments.
17
1.3.3 Binding and hydrolysis of nucleotides
The binding and hydrolysis of nucleotides by ABC transporters occurs at the
catalytic and helical domains of the NBDs, which are separated by the Q- and Pro-loops
(39). The catalytic domain of each NBD contains the Walker A, Walker B, and H-loop,
while the signature C motif is located in the helical domain (Figure 1.4A). The catalytic
events that take place in the NBDs include the binding of ATP, NBD dimerization, ATP
hydrolysis, separation of the NBDs, release of Pi and lastly, release of ADP. Several
different models have been developed, based on many structural, biochemical and
mutational studies, to explain these events and how they are coupled to the TMDs to
drive the transport of substrates.
Since the overall architecture of ABC transporter NBDs is conserved among the
ABC superfamily, the X-ray crystal structure of the E. coli toxin transporter, haemolysin
B (HlyB) has been used as a model of ATP binding (39). The binding of ATP is mediated
by the Walker A and Walker B motif of one NBD and the signature C motif of the other
NBD, so that two molecules of ATP bind along the interface of the two NBDs to form a
nucleotide sandwich dimer (Figure 1.4B). Residues in the signature C motif are thought
to stabilize the formation of the NBD dimer in the presence of ATP by interacting with
the γ-phosphate. It is generally thought that the NBDs are closely associated in the
absence of ATP (52;94;95) so that only small conformational changes take place during
ATP-driven dimerization, however, the NBDs of MsbA are apparently widely separated
(41). The NBD subunit from MJ0796, made catalytically inactive through mutation
(E171Q), was still able to bind two molecules of ATP (96), as was HlyB (97). Mutation
of a conserved His residue in the H-loop of HlyB (H662A) confirmed that it is essential
18
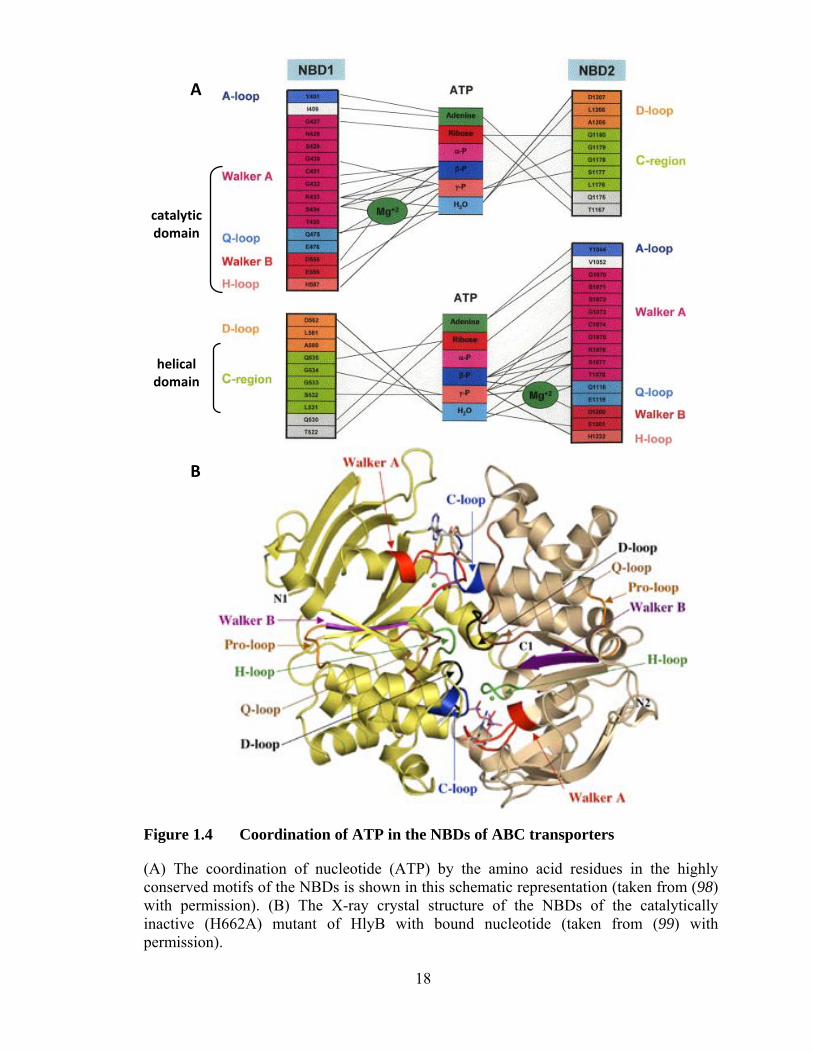
Figure 1.4 Coordination of ATP in the NBDs of ABC transporters
(A) The coordination of nucleotide (ATP) by the amino acid residues in the highly conserved motifs of the NBDs is shown in this schematic representation (taken from (98) with permission). (B) The X-ray crystal structure of the NBDs of the catalytically inactive (H662A) mutant of HlyB with bound nucleotide (taken from (99) with permission).
A
B
catalytic domain
helical domain
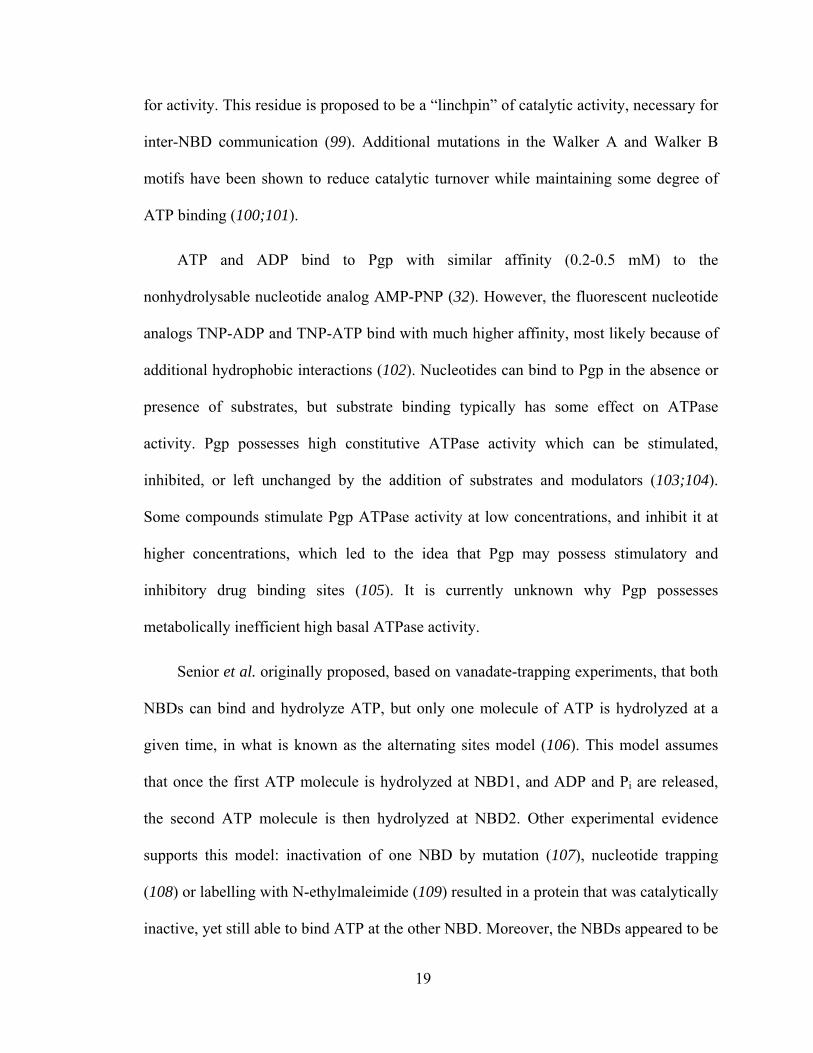
19
for activity. This residue is proposed to be a “linchpin” of catalytic activity, necessary for
inter-NBD communication (99). Additional mutations in the Walker A and Walker B
motifs have been shown to reduce catalytic turnover while maintaining some degree of
ATP binding (100;101).
ATP and ADP bind to Pgp with similar affinity (0.2-0.5 mM) to the
nonhydrolysable nucleotide analog AMP-PNP (32). However, the fluorescent nucleotide
analogs TNP-ADP and TNP-ATP bind with much higher affinity, most likely because of
additional hydrophobic interactions (102). Nucleotides can bind to Pgp in the absence or
presence of substrates, but substrate binding typically has some effect on ATPase
activity. Pgp possesses high constitutive ATPase activity which can be stimulated,
inhibited, or left unchanged by the addition of substrates and modulators (103;104).
Some compounds stimulate Pgp ATPase activity at low concentrations, and inhibit it at
higher concentrations, which led to the idea that Pgp may possess stimulatory and
inhibitory drug binding sites (105). It is currently unknown why Pgp possesses
metabolically inefficient high basal ATPase activity.
Senior et al. originally proposed, based on vanadate-trapping experiments, that both
NBDs can bind and hydrolyze ATP, but only one molecule of ATP is hydrolyzed at a
given time, in what is known as the alternating sites model (106). This model assumes
that once the first ATP molecule is hydrolyzed at NBD1, and ADP and Pi are released,
the second ATP molecule is then hydrolyzed at NBD2. Other experimental evidence
supports this model: inactivation of one NBD by mutation (107), nucleotide trapping
(108) or labelling with N-ethylmaleimide (109) resulted in a protein that was catalytically
inactive, yet still able to bind ATP at the other NBD. Moreover, the NBDs appeared to be
20
functionally equivalent, as inactivation took place equally at each NBD. More recent
work showed, however, that Pgp is able to simultaneously bind two molecules of the non-
hydrolysable analogue adenosine-5'-O-(3-thio-triphosphate) (ATP-γ-S) with different
affinities (Kd = 0.74 mM and 6 μM) demonstrating asymmetric “occlusion” of ATP
during the catalytic cycle (110). It is proposed that two molecules of ATP initially bind
loosely at each NBD. The NBDs then dimerize into the occluded conformation, with the
tightly bound ATP committed to hydrolysis (101;111). The tightly bound ATP passes
through the transition state and is hydrolyzed, and transport results from either formation
of the occluded state or ATP hydrolysis, via the coupling helices (111). The next
molecule of ATP is hydrolyzed at the other NBD, completing the cycle of ATP
hydrolysis.
1.4 TRANSPORT OF DRUGS BY PGP
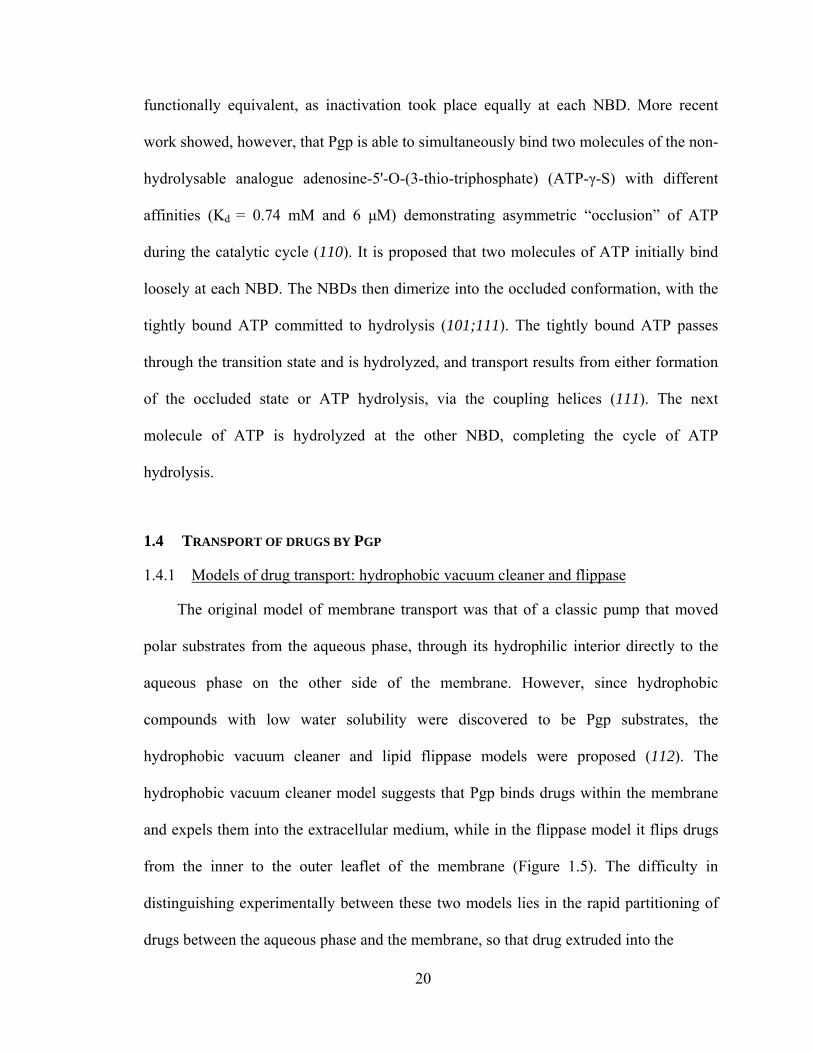
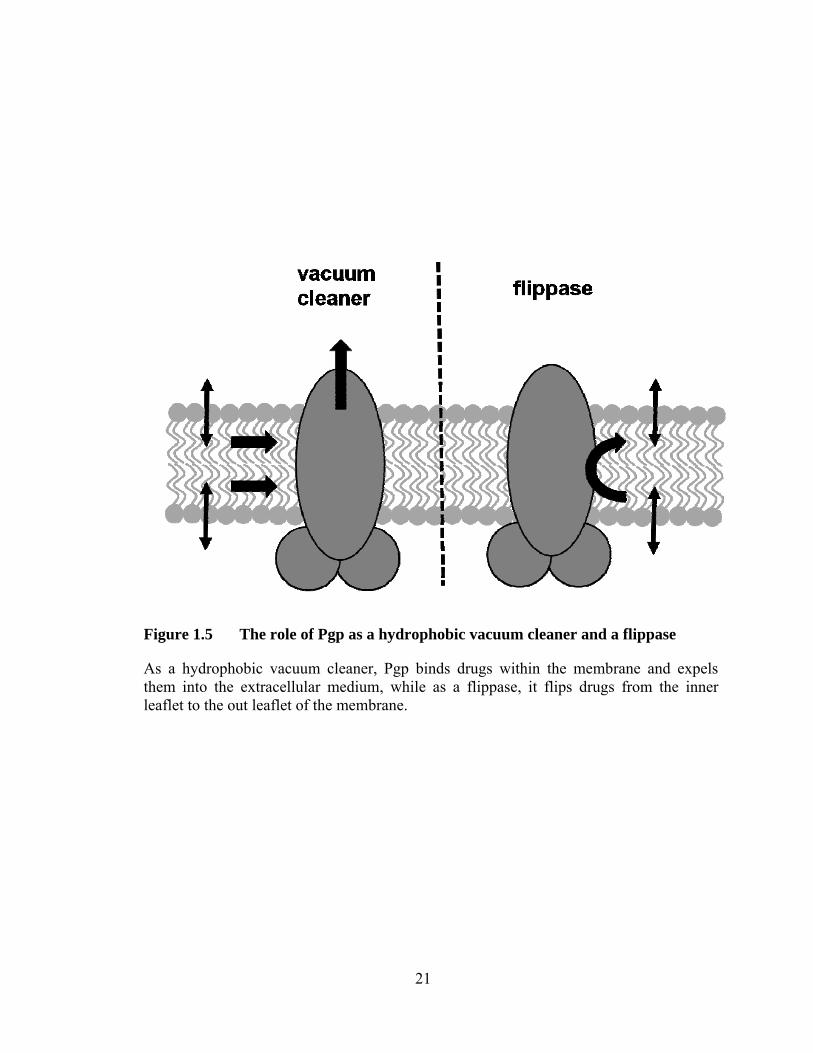
1.4.1 Models of drug transport: hydrophobic vacuum cleaner and flippase
The original model of membrane transport was that of a classic pump that moved
polar substrates from the aqueous phase, through its hydrophilic interior directly to the
aqueous phase on the other side of the membrane. However, since hydrophobic
compounds with low water solubility were discovered to be Pgp substrates, the
hydrophobic vacuum cleaner and lipid flippase models were proposed (112). The
hydrophobic vacuum cleaner model suggests that Pgp binds drugs within the membrane
and expels them into the extracellular medium, while in the flippase model it flips drugs
from the inner to the outer leaflet of the membrane (Figure 1.5). The difficulty in
distinguishing experimentally between these two models lies in the rapid partitioning of
drugs between the aqueous phase and the membrane, so that drug extruded into the
21
Figure 1.5 The role of Pgp as a hydrophobic vacuum cleaner and a flippase
As a hydrophobic vacuum cleaner, Pgp binds drugs within the membrane and expels them into the extracellular medium, while as a flippase, it flips drugs from the inner leaflet to the out leaflet of the membrane.
22
extracellular medium will immediately re-partition into the outer leaflet.
Both models are supported by the finding that substrates gain access to the Pgp
binding site from the cytoplasmic leaflet of the membrane (76;77) and the X-ray crystal
structure, which shows a side portal that could provide direct access to the membrane
(40). The polarity of the local environment around LDS-751 bound to Pgp is also not
compatible with an aqueous channel of the type found in the classic pump model (76).
Furthermore, drugs with high lipid-water partition coefficients seem to have higher Pgp
binding affinity (113), suggesting that the membrane may serve to concentrate substrates
for presentation to Pgp, and the movement of drugs from the membrane into the binding
pocket is a nearly isoenergetic process (114).
In support of the flippase model, Pgp shares 78% sequence similarity with MDR3
(ABCB4), a PC lipid flippase found in the liver that is able to transport some Pgp
substrates (115). Pgp has also been shown to flip various fluorescently-labelled
phospholipids (116) and simple glycospingolipids (117) in a process that is dependent on
ATP and inhibited by vanadate. Moreover, drugs appear to compete with Pgp lipid
flippase activity, suggesting that lipids and drugs may follow the same transport pathway.
More sophisticated time-resolved techniques will be needed to determine with absolute
certainty whether Pgp is actually a lipid flippase or hydrophobic vacuum cleaner.
1.4.2 Catalytic cycle of Pgp
The transport cycle of Pgp involves coupling ATP turnover with substrate
translocation and its exact nature is still the subject of much controversy. Several steps
23
have been studied individually, but how they work together to actively transport many
different types of compounds is not yet known. The binding and hydrolysis of ATP, the
release of ADP/Pi, and the binding of substrates have all been shown to result in
conformational changes in the TMDs of Pgp (118;119). Furthermore, covalent
crosslinking of the TMDs was found to reversibly inhibit ATPase activity, indicating that
the TMDs and NBDs are somehow coupled (120). The presence of a high affinity
stimulatory drug binding site (“on”) and a low affinity inhibitory binding site (“off”) has
been suggested to explain how drug binding can either stimulate or inhibit ATPase
activity (121). However, it is not known whether the conformational changes in the
TMDs are driven by ATP binding or ATP hydrolysis.
The X-ray crystal structures of many ABC proteins show short α-helices extending
from the TMDs into the interface between the helical and catalytic subdomains of the
NBDs. These coupling helices are thought to be the link in transmitting conformational
changes in the NBDs resulting from ATP hydrolysis to the TMDs. In Pgp, the coupling
helix from one half interacts with the opposing NBD, and could be responsible for
changing the TMDs to the outward-facing conformation upon NBD dimerization (40;45).
The conformational changes could be initiated either through the binding of ATP, or
formation/breakdown of the ATP hydrolysis transition state. Deletion mutations in these
regions resulted in Pgp that could not transport substrates and did not show drug-
stimulated increases in ATPase activity (122).
The ATP switch model, which was proposed as a mechanism for substrate
translocation by all ABC proteins, suggests that resting state Pgp has a high affinity for
substrates and low affinity for ATP, and that ATP binding, not hydrolysis, provides the
24
energy for drug transport (123). In this model, drug binding induces ATP binding by
communicating with the NBDs, resulting in NBD dimerization and formation of the
occluded nucleotide state. This in turn, causes conformational changes in the TMDs that
expose the substrate to the extracellular environment. The affinity of Pgp for substrate is
lower in this conformation, resulting in substrate release. Hydrolysis of ATP and
dissociation of ADP/Pi would then reset Pgp back to its resting inward-facing state to
repeat the process again. However, Pgp substrates are not absolutely required for NBD
dimerization and ATP hydrolysis (102;124) and other studies have suggested that ATP
hydrolysis, rather than ATP binding, causes reorientation of the drug binding site (125).
Therefore, the ATP switch model may not be an accurate description for transport
mediated by Pgp.
The alternating sites model, suggested by Senior et al., proposes that the energy for
drug transport is provided by relaxation of the high-energy transition state formed during
ATP hydrolysis. The NBDs are suggested to bind and hydrolyze ATP in an alternating
fashion, with one ATP used to transport one substrate molecule (106). The partition
model, which was developed by al-Shawi and co-workers from steady-state
thermodynamic analyses of ATP hydrolysis in the presence and absence of substrates, is
an expanded view of the alternating sites model (124). It suggests that Pgp participates in
either a basal ATPase activity cycle, which is uncoupled from drug transport, or a drug-
coupled catalytic cycle that results in drug transport. In both the coupled and basal cycles,
the rate-limiting step was ATP hydrolysis, and the energy released from one round of
ATP hydrolysis was sufficient to rehydrate a single drug molecule. The hydrolysis of
ATP was proposed to move substrates from a high affinity “on” site to a drug-unloading
25
“off” site, equivalent to the inward-facing and outward-facing conformations of the Pgp
TMDs, respectively (124). Similar free energy analysis was used to explain drug-induced
inhibition of Pgp ATPase activity, and suggested that it could result from inhibition of
drug release from the lower affinity “off” site in the presence of high drug concentrations
(124).
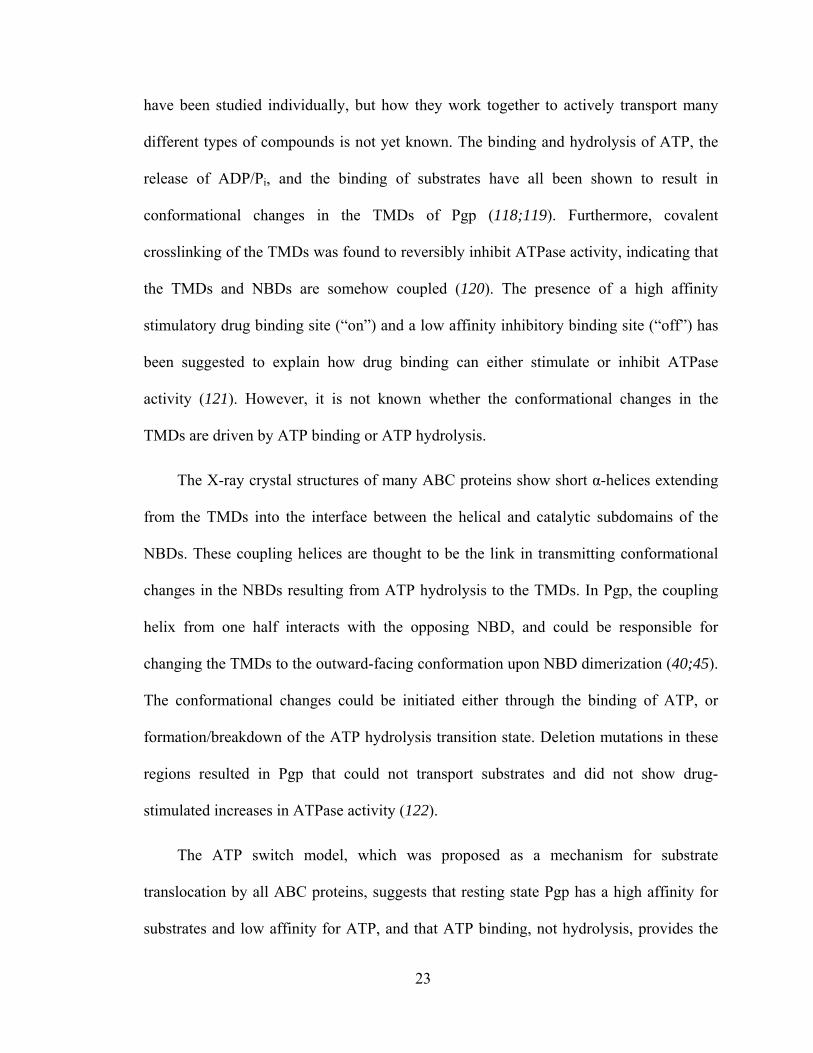
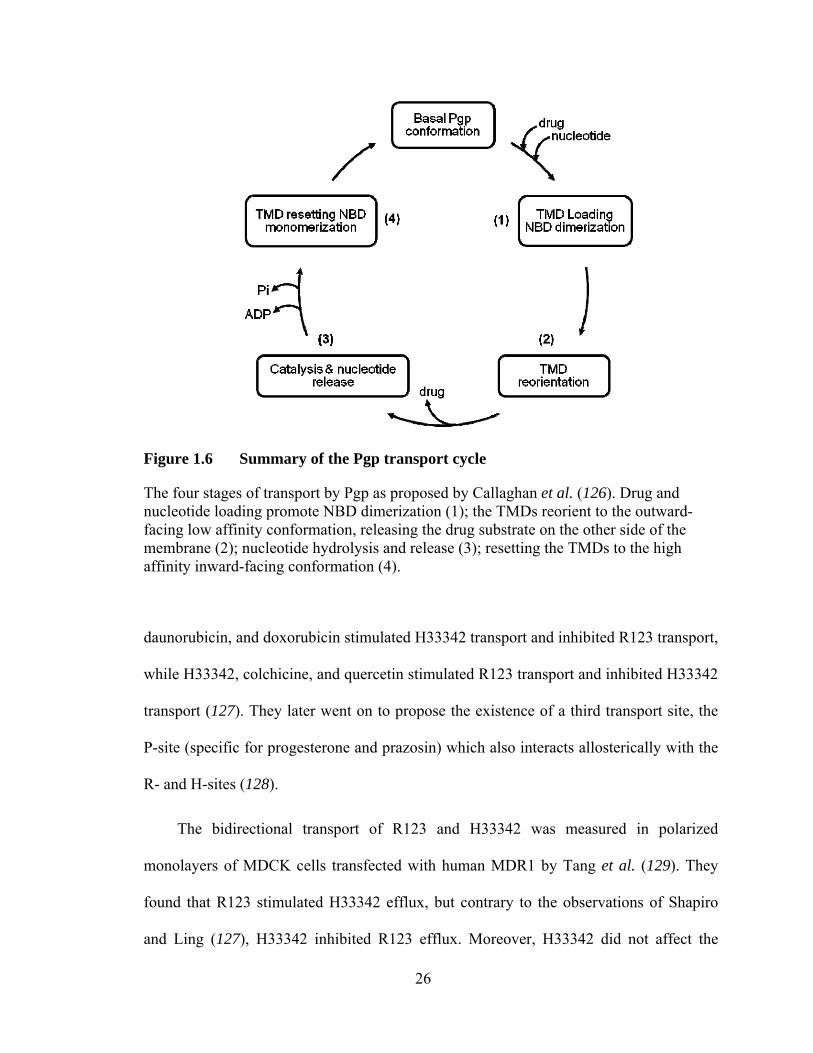
A summary of the Pgp drug translocation pathway (Figure 1.6) was published by
Callaghan et al. and describes four key stages (126). The first step is loading of Pgp with
drug and nucleotide; it is suggested that drug binding occurs first and enhances ATP
binding, consistent with the ATP switch model, resulting in NBD dimerization. In the
second step, the TMDs reorient from a high- to low-affinity binding site (or inward- to
outward- facing conformation), resulting in substrate release (i.e. transport). ATP
hydrolysis occurs in the third step and finally, ADP and Pi are released causing the NBDs
to separate and the TMDs return to the inward-facing (high-affinity) conformation.
Despite many studies on drug translocation by Pgp, the structural mechanism by which
the NBDs and TMDs are coupled, and whether ATP binding or hydrolysis provides the
energy for transport, are still controversial.
1.4.3 Pgp drug transport sites
The ability of Pgp to transport so many structurally dissimilar compounds has
resulted in its binding site(s) being the subject of much investigation. Shapiro and Ling
demonstrated the presence of two functional drug transport sites by measuring the
transport kinetics of rhodamine 123 (R123) and Hoechst 33342 (H33342) in native PM
vesicles (127). The R-site, which showed a preference for R123 transport, and the H-site,
which had a preference for H33342, exhibited positive cooperativity for transport. R123,
26
Figure 1.6 Summary of the Pgp transport cycle
The four stages of transport by Pgp as proposed by Callaghan et al. (126). Drug and nucleotide loading promote NBD dimerization (1); the TMDs reorient to the outward-facing low affinity conformation, releasing the drug substrate on the other side of the membrane (2); nucleotide hydrolysis and release (3); resetting the TMDs to the high affinity inward-facing conformation (4).
daunorubicin, and doxorubicin stimulated H33342 transport and inhibited R123 transport,
while H33342, colchicine, and quercetin stimulated R123 transport and inhibited H33342
transport (127). They later went on to propose the existence of a third transport site, the
P-site (specific for progesterone and prazosin) which also interacts allosterically with the
R- and H-sites (128).
The bidirectional transport of R123 and H33342 was measured in polarized
monolayers of MDCK cells transfected with human MDR1 by Tang et al. (129). They
found that R123 stimulated H33342 efflux, but contrary to the observations of Shapiro
and Ling (127), H33342 inhibited R123 efflux. Moreover, H33342 did not affect the
27
cellular uptake of R123, and R123 actually decreased H33342 uptake. It is not known
why this study was unable to confirm positive cooperativity between the R- and H-sites.
LDS-751 was shown by Shapiro and Ling to stimulate H33342 transport, suggesting
that it interacted with the R-site (130), however, when both LDS-751 and R123 were
found to simultaneously bind to Pgp (54), this cast some doubt on its previous
classification. It is possible that the R-site is a large binding region capable of binding
both drugs. Recent work in our laboratory with Pgp reconstituted into DMPC liposomes
found that H33342 could stimulate tetramethylrosamine (TMR) transport, but H33342
transport was not stimulated or inhibited by several rhodamine dyes (Balpreet Vinepal,
2008, M.Sc. thesis, University of Guelph). Furthermore, H33342 was found to inhibit
TMR transport at higher concentrations, suggesting a complex interaction between the
two substrates. LDS-751 was also shown to inhibit both TMR and H33342 transport,
indicating it may not bind exclusively to the R-site as previously proposed.
These conflicting observations may be due to the different environment of Pgp in
each case, but they do indicate that the allosteric interactions in the Pgp drug binding
pocket are likely much more complex than the original R-site/H-site model had
suggested.
1.5 RATIONALE AND RESEARCH OBJECTIVES
Pgp can bind a number of substrates from the Hoechst and rhodamine families of
compounds that are chemically and structurally distinct. In addition, the transport of
LDS-751 and the somewhat contradictory results obtained in R123 and H33342 transport
competition experiments suggest that the original H- and R-site model is overly
28
simplistic. Therefore, a better understanding of how multiple substrates are
accommodated simultaneously in the Pgp binding pocket, and how they affect each
other’s binding and transport is needed. The interactions between drug combinations are
especially important for chemotherapy treatment, where drug cocktails of Pgp substrates
are frequently used.
The goals of this project were to better characterize the drug-drug interactions inside
the substrate binding pocket of Pgp, and to better understand how the pocket
accommodates multiple drugs, and how they mutually affect each other’s binding (and
transport). Specifically, a drug molecule was covalently crosslinked to a defined site in
the substrate-binding pocket, and the interactions with a second drug were examined.
This approach avoids the problem of multiple reversible drug equilibria that was a
complication in previous studies. Moreover, drug monomers and dimers were used to
provide information on the size and capacity of the binding pocket. In order to
accomplish this, Pgp was purified in detergent solution or reconstituted into
proteoliposomes. Drug binding was determined by fluorescence spectroscopy, where
both the intrinsic Trp fluorescence of Pgp, and the fluorescence of the drug molecules
were measured.

29

30
Chapter 2
MATERIALS AND METHODS
31
2.1 MATERIALS
Disodium ATP, N-acetyl-L-tryptophanamide (NATA), dithioerythritol (DTE),
sodium ortho-vanadate (Vi) and 4-(2-hydroxyethyl)-1-piperazineethanesulfonic acid
(HEPES) were purchased from Sigma-Aldrich (Oakville, ON). Concanavalin A (ConA)-
Sepharose 4B was obtained from GE Healthcare (Baie d’Urfé, QC). The Econo10-DG
pre-packed gel filtration columns were purchased from Bio-Rad (Mississauga, ON).
Protease inhibitors and bovine serum albumin (BSA) (crystallized and lyophilized) were
obtained from Roche Diagnostics (Laval, QC). Liquid scintillation vials, DMSO and
acrylamide were purchased from Fisher Scientific (Whitby, ON). Hoechst 33342
(H33342), Hoechst 33258 (H33258), 2-[4-(4-[dimethylamino]phenyl)-1,3-butadienyl]-3-
ethylbenzothiazolium perchlorate (LDS-751), rhodamine 123 (R123), rhodamine 6G
(R6G), rhodamine 101 (R101), rhodamine 110 (R110), tetramethylrosamine (TMR),
tetramethylrhodamine methyl ester (TMR-M), tetramethylrhodamine ethyl ester (TMR-
E), tetramethylrhodamine-5-carbonyl azide (AzTMR) were purchased from Molecular
Probes (Eugene, OR). 3-[(3-Cholamidopropyl)-dimethylammonio]-1-propanesulfonate
(CHAPS) was obtained from MP Biomedicals (Solon, OH).
Dimyristoylphosphatidylcholine (DMPC) was purchased from Avanti Polar Lipids
(Alabaster, AL). The abacavir (131), quinine (132) and quetiapine dimers were
synthesized and provided by Christine Hrycyna (Purdue University, Richmond, IN). All
solvents used were of HPLC grade.
2.2 PGP PURIFICATION
The Pgp used in all experiments was obtained from Chinese hamster ovary cells
(CHRB30) which were selected for resistance to colchicine (133) using a modification of
32
a 3-step purification procedure, as previously described (32;134;135). The amount of
protein and ATPase activity were determined after each purification step, and samples
were kept on ice throughout the entire process unless otherwise indicated.
2.2.1 Plasma membrane (PM) isolation from CHRB30 cells
The CHRB30 cells were grown in the presence of 30 μg/mL colchicine, 2 mM L-
glutamine, streptomycin (1 mg/mL) and penicillin (1000 i.u./mL) in α-minimal essential
medium (α-MEM) containing 10% heat-inactivated bovine calf serum (Hyclone
Laboratories, Logan, UT) at 37°C in a humidified atmosphere of 5% CO2. Cells were
harvested, resuspended in freezing medium (α-MEM/10% DMSO) and stored at -80°C
until their use. Cells were stored no more than 6 months before use. For each batch of PM
prepared, approximately 6 tubes of 1 × 10¹⁰ CHRB30 cells each were thawed and each
tube was washed 3 times with cold phosphate-buffered saline (PBS; 140 mM NaCl, 2.7
mM KCl, 1.0 mM Na2HPO4, 1.8 mM KH2PO4, pH 7.4) and centrifuged for 5 min at
4,000g at 4°C. The supernatant washes were discarded and the pellets resuspended in ~15
mL of homogenizing buffer (10 mM Tris, 0.25 M sucrose, 0.2 mM CaCl2, 0.02% (w/v)
NaN3, pH 7.5), combined into 3 tubes and centrifuged for 5 min at 4,000g at 4°C. The
pellet in each tube was resuspended in ~20 mL cold homogenizing buffer containing
protease inhibitors (1 μg/mL aprotinin, 1 μg/mL leupeptin, 1 μg/mL pepstatin A, 50
μg/mL phenylmethylsulfonylfluoride (PMSF)).
The 3 tubes of cells were lysed using nitrogen cavitation by passage through a
Yeda press for 2 min at 400-500 psi. After 3 passes, 2 mL of 10 mM EDTA and ~15 mL
of post-homogenizing buffer (10 mM Tris, 0.025 M sucrose, 0.02% (w/v) NaN3, pH 7.5)
was added to each tube of cell lysate. Each ~36 mL tube of cell homogenate was divided

33
evenly between two open-top polycarbonate ultracentrifuge tubes and layered on top of
10 mL of a 35% sucrose cushion buffer (10 mM Tris, 35% (w/w) sucrose, 1 mM EDTA,
0.02% (w/v) NaN3, pH 7.5). The six tubes were ultracentrifuged in an SW-32 Ti rotor at
27,400 rpm (128,000g) for 1 h at 4°C. Following centrifugation, the PM layer that settled
at the interface was collected with a glass pipette and pooled into two 70 Ti screw-cap
polycarbonate centrifuge tubes. The PM was washed twice with ~20 mL of freezing
buffer (10 mM Tris, 0.25 M sucrose, 0.02% (w/v) NaN3, pH 7.5) and centrifuged for 35
min at 41,000 rpm (173,000g) at 4°C in a 70 Ti rotor. The supernatant washes were
discarded and the final pellet resuspended in ~6 mL of freezing buffer using a 1 mL
syringe and 26⅝G needle. Aliquots were removed to determine protein concentration and
ATPase activity and the purified PM was stored at -80°C.
2.2.2 Detergent extraction of Pgp
Pgp was extracted from the isolated CHRB30 PM by a 3-step detergent extraction
with the zwitterionic detergent CHAPS. The frozen PM was thawed and centrifuged for
35 min at 41,000 rpm (173,000g) at 4°C in a 70 Ti rotor. The PM pellet was resuspended
in 100 μL of solubilization buffer I (15 mM CHAPS, 20 mM HEPES, 100 mM NaCl, 5
mM MgCl2, pH 7.4) for every 1 mg of PM protein and incubated on ice for 30 min with
periodic swirling. The CHAPS-extracted PM was centrifuged for 30 min at 41,000 rpm
(173,000g) at 4°C in a 70 Ti rotor. The supernatant was collected (S1) and the remaining
pellet resuspended in 1 mL of solubilization buffer II (45 mM CHAPS, 20 mM HEPES,
100 mM NaCl, 5 mM MgCl2, pH 7.4) for every 10 mg of PM protein using a 1 mL
syringe and 26⅝G needle. The solution was transfered to microfuge tubes, mixed gently
on a Nutator for 30 min and centrifuged for 15 min at 13,000 rpm at 4°C in a
34
microcentrifuge. The supernatants were collected and pooled (S2). The S1 and S2
fractions were assayed for protein content and ATPase activity. The S2 fraction was
diluted to a final CHAPS concentration of 15 mM, aliquoted into 1 mL fractions and
frozen at -80°C until purification.
2.2.3 Pgp purification
Pgp was purified from the S2 fraction by affinity chromatography. The ConA-
Sepharose 4B column (1 × 20 cm) was blocked with ~35 mL of α-MEM and washed with
~100 mL equilibration buffer (2 mM CHAPS, 20 mM HEPES, 100 mM NaCl, 5 mM
MgCl2, 5 mM DTE, pH 7.4); 8 mL of S2 was loaded and run through with the same
buffer. The flow rate was 1 drop/5 s and approximately 20-25 0.5 mL fractions were
collected. The column was then washed with ~100 mL 20 mM HEPES buffer, ~50 mL of
0.5 M glucose in 20 mM HEPES buffer, ~50 mL of 20% ethanol in storage buffer (0.1 M
sodium acetate, 1 mM CaCl2, 1 mM MgCl2, 0.02% (w/v) NaN3, pH 6.0) to remove bound
glycoproteins, and ~100 mL of storage buffer in which it was then stored.
The column fractions were monitored for absorbance at 280 nm, protein content,
and ATPase assay. Fractions with A280>1 were pooled and assayed again for protein
content and ATPase activity. The pooled Pgp was 90-95% pure, with a concentration of
0.2-0.3 mg/mL and ATPase activity of 1.5-2.5 μmol/min/mg (Figure 2.1). The purified
protein was aliquoted and stored at 4°C.
2.2.4 Protein assays
The protein concentration was determined at various stages of Pgp purification and
in the experiments thereafter by the methods of Bradford (136) and Peterson (137), which
35
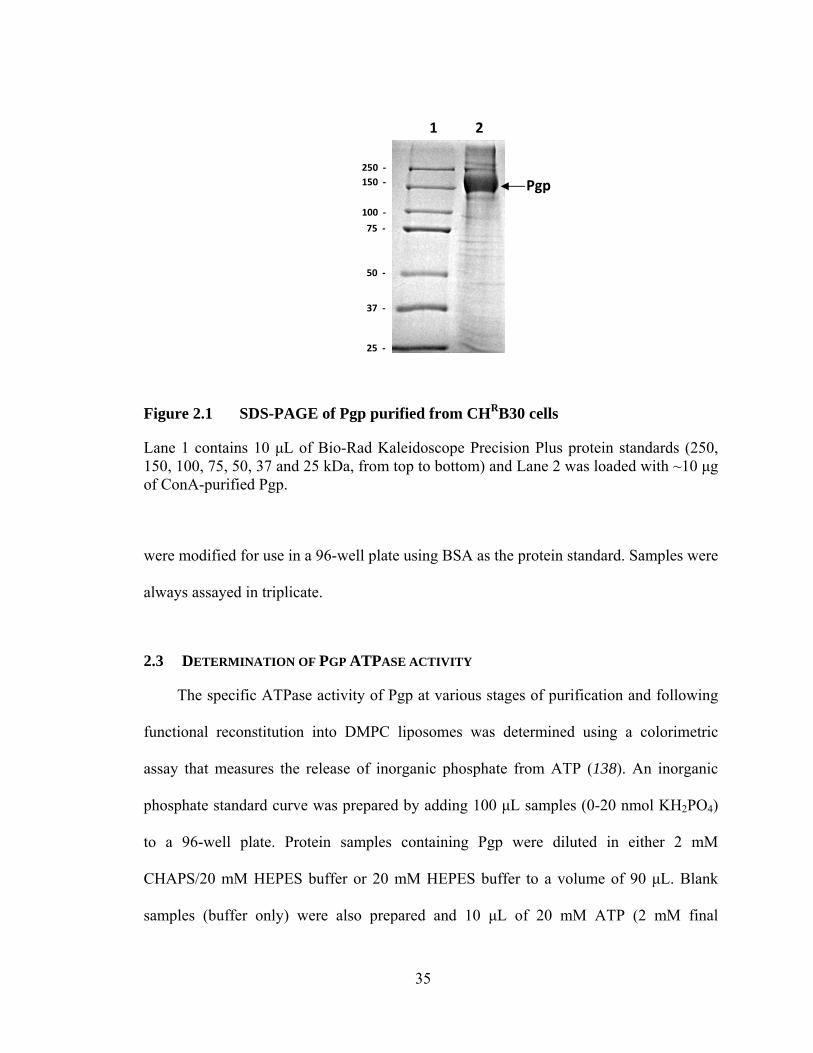
Figure 2.1 SDS-PAGE of Pgp purified from CHRB30 cells
Lane 1 contains 10 μL of Bio-Rad Kaleidoscope Precision Plus protein standards (250, 150, 100, 75, 50, 37 and 25 kDa, from top to bottom) and Lane 2 was loaded with ~10 μg of ConA-purified Pgp.
were modified for use in a 96-well plate using BSA as the protein standard. Samples were
always assayed in triplicate.
2.3 DETERMINATION OF PGP ATPASE ACTIVITY
The specific ATPase activity of Pgp at various stages of purification and following
functional reconstitution into DMPC liposomes was determined using a colorimetric
assay that measures the release of inorganic phosphate from ATP (138). An inorganic
phosphate standard curve was prepared by adding 100 μL samples (0-20 nmol KH2PO4)
to a 96-well plate. Protein samples containing Pgp were diluted in either 2 mM
CHAPS/20 mM HEPES buffer or 20 mM HEPES buffer to a volume of 90 μL. Blank
samples (buffer only) were also prepared and 10 μL of 20 mM ATP (2 mM final
1 2
Pgp 250 ‐150 ‐
100 ‐
75 ‐
50 ‐
37 ‐
25 ‐
36
concentration) was added to each protein or blank well to initiate ATPase activity. The
plate was incubated in a 37°C water bath for 20 min, after which the reaction was stopped
by the addition of 100 μL of stop reagent (3% (w/v) ascorbic acid, 0.5% (w/v)
ammonium molybdate, 6% (w/v) SDS in 0.5 M HCl). After another 6 min, 100 μL of
developing reagent (2% (w/v) sodium citrate, 2% (w/v) sodium arsenite, 2% (w/v) acetic
acid) was added to each well. The colour was allowed to develop for 20 min and the
absorbance of each well was measured at 750 nm. The A750 of the blank samples were
subtracted from each sample value prior to calculating ATPase activity. All standard
curve, blank, and protein samples were measured in triplicate.
To measure the effect of certain drugs on Pgp and Pgp-AzTMR ATPase activity at
different drug concentrations, a 14-point ATPase profile was generated using a slightly
modified 96-well plate assay. Drugs were serially diluted in DMSO to produce ~15 μL of
drug at each concentration, ranging from 3 μM to 10 mM. Protein samples were diluted
up to 88 μL in each well with 2 mM CHAPS/20 mM HEPES buffer, and 2 μL of drug at
each concentration was added. To initiate the reaction, 10 μL of 20 mM ATP was added
to each protein and control well. A 100% activity control, containing only protein and
ATP, and a DMSO control, with 2 μL of DMSO in addition to protein and ATP were also
tested. A single blank sample was made at each drug concentration and contained 88 μL
of buffer, 2 μL of drug and 10 μL of 20 mM ATP. The plates were treated as above and
all protein samples, the 100% and DMSO controls were assayed in triplicate. The
absorbance values of each of the 14 blank samples were collectively averaged and this
blank average was subtracted from each of the other samples prior to calculating the
ATPase activity. The ATPase activity of the sample at each drug concentration was
37
divided by that of the DMSO control to obtain the % ATPase activity. The protein
concentration in each well was appropriately diluted beforehand to ensure that the A750 of
the DMSO control sample was always approximately equal to the A750 of the sixth point
(10 nmol) in the Pi standard curve to ensure reproducibility.
2.4 PREPARATION AND CHARACTERIZATION OF PGP-AZTMR
All fluorescence measurements were carried out on a PTI QuantaMaster QM-8/2005
with Peltier temperature control, or a PTI QuantaMaster C-61 steady-state fluorimeter, at
a constant temperature of 22°C, with excitation and emission slits set to 2 nm and 4 nm,
respectively, unless otherwise stated.
2.4.1 Crosslinking of AzTMR to Pgp
Preparation of the Pgp-AzTMR adduct involved crosslinking AzTMR to ConA
purified Pgp in a Stratalinker 1800 UV crosslinker with 365 nm bulbs (Stratagene, La
Jolla, CA). A total reaction volume of 550 μL was prepared in a 6 dram acid-washed
liquid scintillation vial (28 × 70 mm) on ice, containing 75-90 μg of purified Pgp in 2
mM CHAPS/20 mM HEPES buffer, 5 mM DTE, 2 mM ATP and 100 μM AzTMR in
DMSO. The mixture was incubated on ice (in the dark) for 10 min, crosslinked in the
Stratalinker 1800 for 20 min and incubated at 4°C for 10 min. The control, Pgp-mock,
was prepared the same way, except the reaction mixture did not contain AzTMR and the
volume was made up with buffer. The crosslinked and control samples were each loaded
on to an Econo10-DG gel filtration column (1 × 6 cm) which had been pre-equilibrated
with 2 mM CHAPS/20 mM HEPES buffer, and eluted with the same buffer. Fractions of
20 drops were collected and analyzed for absorbance at 280 nm, protein content, and
38
ATPase activity. Typically, one high protein concentration fraction (50 μg/mL) and one
low concentration fraction of ~0.5 mL were collected, which were either pooled, or only
the high concentration fraction was used, depending on the experiment.
2.4.2 Optimization of crosslinking conditions
The optimum conditions for crosslinking AzTMR to Pgp were determined by
measuring the effect on Pgp-AzTMR formation of different initial AzTMR
concentrations, time of UV exposure, and the presence of DTE or ATP. Samples were
prepared as above and the UV exposure time was set at 0, 5, 10, 20, or 30 min. Controls
were also performed where the samples were incubated for 20 min in the dark on ice and
at room temperature. In addition, the optimal initial concentration of AzTMR was
determined by crosslinking in the presence of 0, 10, 50, 100, 200, or 300 μM AzTMR. In
a separate experiment, samples with and without 5 mM DTE or 2 mM ATP were
crosslinked to determine the effect of both agents on labelling outcome. In all cases, the
ATPase activity (relative to Pgp-mock), intrinsic Trp fluorescence (290 nm/330 nm),
AzTMR fluorescence (545 nm/579 nm), and labelling stoichiometry were monitored to
assess the outcome of the different sets of conditions.
2.4.3 Stoichiometry of AzTMR linkage
The stoichiometry of AzTMR covalently bound to Pgp was determined by
interpolating the AzTMR concentration in Pgp-AzTMR samples from an AzTMR
standard curve. Samples of AzTMR (0, 0.1, 0.25, 0.75 and 1.0 μM) were made in 2 mM
CHAPS/20 mM HEPES buffer and subjected to the same treatment as Pgp-AzTMR
samples (10 min on ice, 20 min UV treatment, 10 min on ice). The fluorescence of
AzTMR at 579 nm was measured following excitation at 545 nm for the standard and
39
Pgp-AzTMR samples. Linear regression (Sigmaplot, Systat Software, Chicago, IL) of the
plotted standard points allowed calculation of the AzTMR concentration in the Pgp-
AzTMR samples. This was compared to the molar protein concentration (determined by
Bradford assay), to estimate the stoichiometry of labelling.
2.4.4 Fluorescence properties of Pgp-AzTMR drug adduct
The excitation (λem = 579 nm) and emission spectra (λex = 545 nm) of Pgp-AzTMR
were each recorded 3 times and averaged. The spectra were automatically corrected by
the instrument for lamp intensity variations. The background buffer spectra were
subtracted and the spectra were normalized.
2.4.5 Polarity of the AzTMR binding site in Pgp
The polarity of the binding site of AzTMR within Pgp was characterized according
to the Lippert equation, which relates the general solvent effects to the Stokes shift for a
fluorophore in a particular environment (76;139):
2 1
2 11
2 1
where and are the frequency (in cm-1) of the absorption and emission maxima
(Stokes shift), respectively, h is Planck’s constant (6.626 × 10⁻²⁷ J·s), c is the speed of
light (2.9979 × 1010 cm/s), is the dielectric constant, n is the refractive index of the
medium, a (in cm) is the radius of cavity in which the fluorophore resides, and and
are the dipole moments of the ground and excited states, respectively. The Lippert
equation can be rearranged to a simpler form :
∆
40
so that can be plotted against the orientation polarizability, ∆ , and give a slope,
m, which is known as the solvent sensitivity of the fluorophore. The orientation
polarizability was calculated for each solvent according to :
∆1
2 11
2 1
and is directly related to both the dielectric constant and refractive index of each
environment. The Stokes shift of AzTMR solutions (0.3 μM) made in chloroform,
methylene chloride, dimethylformamide (DMF), DMSO, 2-propanol, methanol and
buffer was measured (in cm-1) and plotted against the calculated ∆ value for each
solvent. Linear regression of the data provided a Lippert plot from which the ∆ was
calculated for AzTMR based on the measured Stokes shift of Pgp-AzTMR.
2.5 DETERMINATION OF PGP DRUG BINDING AFFINITY
2.5.1 Pgp intrinsic Trp fluorescence quenching
The binding of various drug substrates to Pgp and Pgp-AzTMR was determined by
measuring the saturable, concentration-dependent quenching of the intrinsic Trp
fluorescence of Pgp. A 250 μL sample of Pgp (50 μg/mL) in 2 mM CHAPS/20 mM
HEPES buffer was added to a quartz microcuvette (0.5 cm path length, 1 mL total
volume) and allowed to equilibrate for 5 min in the fluorimeter. Drug aliquots (dissolved
in DMSO) of 0.5 μL were added, then the sample was mixed 20 times and allowed to
equilibrate for 40 s. The steady-state Trp fluorescence of Pgp was measured by excitation
at 290 nm, to avoid interference from Tyr fluorescence, and the emission was recorded at
330 nm for 10 s. The final concentration of DMSO was never more than 2.5% and
control titrations with DMSO alone were performed to ensure the solvent was not
41
affecting Trp fluorescence. To correct for non-specific quenching of Trp fluorescence, an
identical titration was performed with NATA, a soluble Trp analog. The starting
concentration of NATA was typically 20 μg/mL, however, the concentration was
adjusted for each experiment so the fluorescence emission intensity at 330 nm matched
that of Pgp.
The experimentally measured fluorescence emission intensities (Fi) were corrected
for the inner filter effect, light scattering and dilution (33;139) using the following
equation:
F F BVV
F NATA B VV
F NATA B VV
where Ficorr is the corrected fluorescence intensity at any point (after the ith drug
addition), B is the background fluorescence intensity of the buffer, V0 is the initial
volume, Vi is the volume at any point in the titration, F0NATA is the initial uncorrected
NATA fluorescence and FiNATA is the NATA fluorescence after the ith addition. Thus, the
dilution factor, Vi/V0, and inner filter factor, [(F0NATA-B)(Vi/V0)]/[(FiNATA-B)(Vi/V0)], are
both accounted for in calculating Ficorr. The change in fluorescence, ΔF, is calculated as
Ficorr-F0, where F0 is the initial fluorescence intensity, for the ith drug addition, plotted
against the concentration of drug, and fitted to the following hyperbolic equation :
∆FF 100
∆FF 100 S
K S
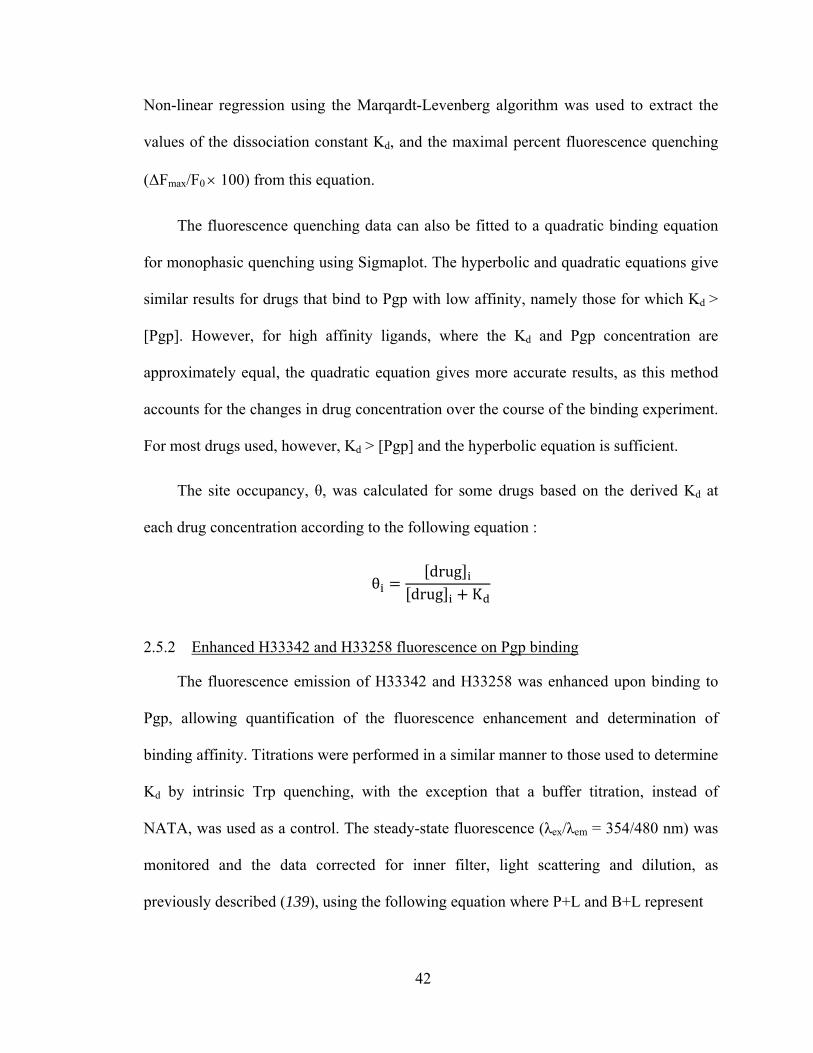
42
Non-linear regression using the Marqardt-Levenberg algorithm was used to extract the
values of the dissociation constant Kd, and the maximal percent fluorescence quenching
(ΔFmax/F0 × 100) from this equation.
The fluorescence quenching data can also be fitted to a quadratic binding equation
for monophasic quenching using Sigmaplot. The hyperbolic and quadratic equations give
similar results for drugs that bind to Pgp with low affinity, namely those for which Kd >
[Pgp]. However, for high affinity ligands, where the Kd and Pgp concentration are
approximately equal, the quadratic equation gives more accurate results, as this method
accounts for the changes in drug concentration over the course of the binding experiment.
For most drugs used, however, Kd > [Pgp] and the hyperbolic equation is sufficient.
The site occupancy, θ, was calculated for some drugs based on the derived Kd at
each drug concentration according to the following equation :
θdrug
drug K
2.5.2 Enhanced H33342 and H33258 fluorescence on Pgp binding
The fluorescence emission of H33342 and H33258 was enhanced upon binding to
Pgp, allowing quantification of the fluorescence enhancement and determination of
binding affinity. Titrations were performed in a similar manner to those used to determine
Kd by intrinsic Trp quenching, with the exception that a buffer titration, instead of
NATA, was used as a control. The steady-state fluorescence (λex/λem = 354/480 nm) was
monitored and the data corrected for inner filter, light scattering and dilution, as
previously described (139), using the following equation where P+L and B+L represent
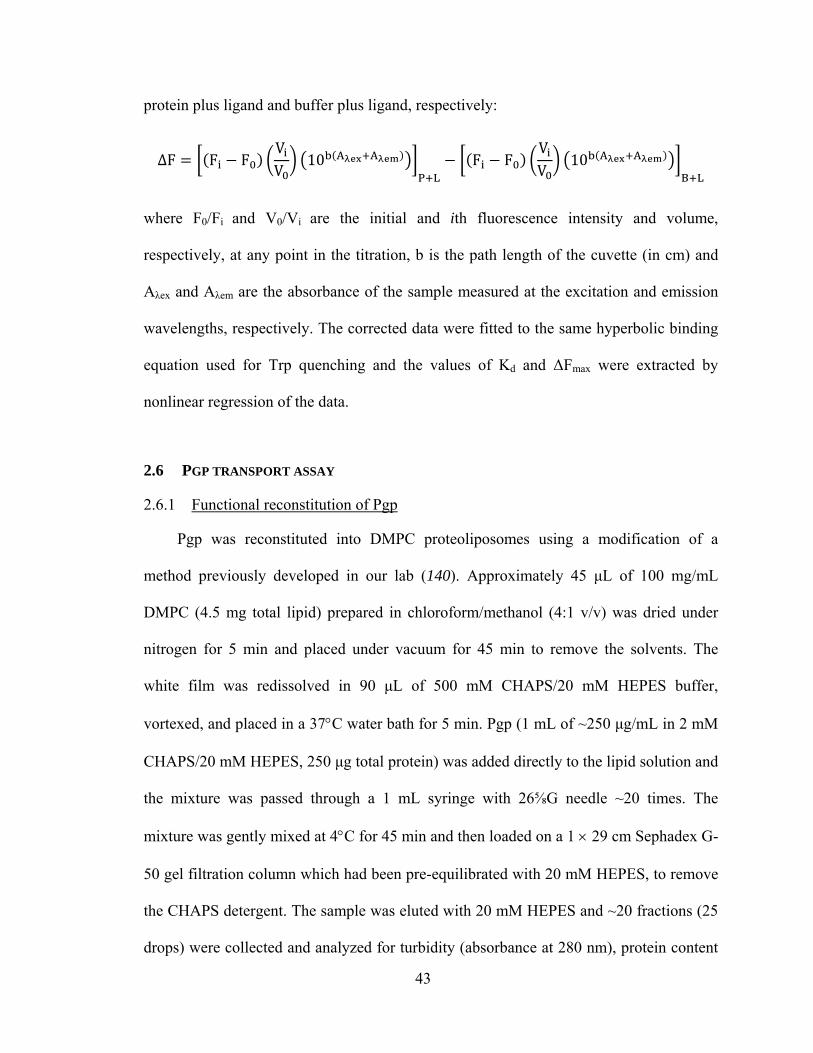
43
protein plus ligand and buffer plus ligand, respectively:
∆F F FVV 10 A A
P LF F
VV 10 A A
B L
where F0/Fi and V0/Vi are the initial and ith fluorescence intensity and volume,
respectively, at any point in the titration, b is the path length of the cuvette (in cm) and
Aλex and Aλem are the absorbance of the sample measured at the excitation and emission
wavelengths, respectively. The corrected data were fitted to the same hyperbolic binding
equation used for Trp quenching and the values of Kd and ΔFmax were extracted by
nonlinear regression of the data.
2.6 PGP TRANSPORT ASSAY
2.6.1 Functional reconstitution of Pgp
Pgp was reconstituted into DMPC proteoliposomes using a modification of a
method previously developed in our lab (140). Approximately 45 μL of 100 mg/mL
DMPC (4.5 mg total lipid) prepared in chloroform/methanol (4:1 v/v) was dried under
nitrogen for 5 min and placed under vacuum for 45 min to remove the solvents. The
white film was redissolved in 90 μL of 500 mM CHAPS/20 mM HEPES buffer,
vortexed, and placed in a 37°C water bath for 5 min. Pgp (1 mL of ~250 μg/mL in 2 mM
CHAPS/20 mM HEPES, 250 μg total protein) was added directly to the lipid solution and
the mixture was passed through a 1 mL syringe with 26⅝G needle ~20 times. The
mixture was gently mixed at 4°C for 45 min and then loaded on a 1 × 29 cm Sephadex G-
50 gel filtration column which had been pre-equilibrated with 20 mM HEPES, to remove
the CHAPS detergent. The sample was eluted with 20 mM HEPES and ~20 fractions (25
drops) were collected and analyzed for turbidity (absorbance at 280 nm), protein content
44
(Bradford assay) and ATPase activity. The three most turbid fractions were pooled to
give a final volume of ~2 mL, with a final protein concentration of 108 μg/mL, an
estimated lipid concentration of ~1.94 mg/mL, and lipid:protein ratio of 18:1 (w/w).
For the reconstitution of Pgp-AzTMR, the protein was first concentrated from its
initial concentration of 50 μg/mL to a desired 250 μg/mL. Several batches of Pgp-
AzTMR were prepared as described above (section 2.4.1) and the column fractions were
concentrated using Amicon Ultra-0.5 centrifugal filter devices (Millipore, Billerica, MA).
Briefly, three filter devices were used simultaneously with 500 μL of Pgp-AzTMR, and a
spin time of 9 min at 4°C and 14,000g. The filters were continuously loaded with fresh
aliquots of protein, and the concentrate from each was pooled to give a final volume of
~1 mL of ~250 μg/mL Pgp-AzTMR. Concentration of Pgp-AzTMR did not affect the
ATPase activity of the protein, and the reconstitution was carried out as with Pgp, but a
separate Sephadex G-50 column was used only for Pgp-AzTMR samples. The final
protein concentration in Pgp-AzTMR proteoliposomes was ~85 μg/mL.
2.6.2 Real-time fluorescence transport assay
All fluorescence measurements for transport using DMPC proteoliposomes were
carried out at 26°C. The proteoliposomes were diluted by adding 100 μL of 20 mM
HEPES buffer pH 7.4 to 100 μL proteoliposomes and 10 μL of 125 μM H33342 (5.95
μM final H33342 concentration) and incubated for 10 min at 26°C (final Pgp
concentration = 51.2 μg/mL, final Pgp-AzTMR concentration = 40.5 μg/mL and lipid
concentration = 142 μg/mL). To measure transport, 200 μL of the sample was added to a
quartz microcuvette (0.5 cm path length, 1 mL total volume), excited at 355 nm and
continuously monitored for H33342 emission at 450 nm. After a 150 s equilibration, 50
45
μL of ATP plus an ATP regenerating system (5 mM ATP, 11.5 mg/mL creatine
phosphate, 0.3 mg/mL creatine kinase in 20 mM HEPES pH 7.4) was added and the
solution mixed 10 times (final ATP concentration = 1 mM, final H33342 concentration =
4.76 μM). Fluorescence monitoring was continued for a total of 10 min and the slope of
the line for the first 10-20 s of transport was used to determine the initial transport rate
(μM/min). A vanadate control, in which 5 μL of 5 mM sodium ortho-vanadate was added
at the proteoliposome dilution stage (final vanadate concentration = 93 μM), was also
analyzed to ensure that fluorescence changes did not result from dynamic repartitioning
of the drug, and the vanadate spectrum subtracted from those without vanadate prior to
calculating the slope. The sodium ortho-vanadate solution was heated at 100°C for 10
min prior to its addition to the proteoliposomes.
46
Chapter 3
CROSSLINKING OF AZTMR TO PURIFIED PGP
47
3.1 INTRODUCTION
Biochemical studies have revealed much useful information about the interaction of
drugs with Pgp. The binding of drugs likely occurs by an induced-fit mechanism,
whereby the drug molecule first enters the large binding pocket and then reorients in a
specific sub-site to allow the most favourable interactions with the polypeptide. Drugs are
thought to gain access to Pgp from the cytoplasmic leaflet of the membrane (76;77;141)
and bind at the interface of the two TMDs, with residues contributed from both halves
(142).
A number of studies have been completed by Loo and Clarke, who used covalent
linkage of maleimide and MTS-drug derivatives to Pgp engineered with specific Cys
mutations (55;80;91;143) to determine drug binding sites and measure changes in
ATPase activity. However, none of these studies determined the binding affinity of
unmodified and modified Pgp for individual drugs. Moreover, the Pgp used in these
experiments had very low ATPase activity and the labelling sites were non-physiological.
The conclusions from these experiments should be taken lightly due to the low basal
ATPase activity, as they are probably under-estimations of the true activity (124).
The bacterial soluble transcriptional repressor, QacR, was crystallized in the
presence of several different drugs (144), and some crystal structures showed two drugs
bound at the same time in its large drug-binding pocket. In addition, the recent X-ray
crystal structure of Pgp confirmed that it is also possible for multidrug efflux pumps to
simultaneously interact with more than one drug (40). Pgp was crystallized in the absence
and presence of the cyclic peptide inhibitor QZ59-RRR and its stereoisomer QZ59-SSS.
The structure with QZ59-RRR was found to have one molecule of the peptide bound at a
48
sub-site near the middle of the large drug-binding pocket. Surprisingly, the structure with
QZ59-SSS contained two bound molecules of peptide, found in unique binding sites
above and below that of its stereoisomer. While there are doubts about the validity of this
structure physiologically, it does provide the first structural description of two substrate
molecules bound to Pgp at the same time.
Fluorescence spectroscopy and changes in ATPase activity have been extremely
useful tools in studying the interaction of drugs with Pgp. They have allowed for the
determination of drug binding affinity (Kd) and even demonstrated the ability of two
drugs to bind simultaneously to Pgp (54;55;77;141). In one study carried out in the
Sharom lab, the binding of rhodamine 123 and LDS-751 showed a reciprocal negative
interaction, with each drug reducing the binding affinity of the other by 5-fold (54). The
two substrates in this case had complementary fluorescence properties, and because the
free and bound drugs could not be separated, a complex global fitting analysis had to be
used to determine the Kd values. This specialized approach does not allow for the study
of simultaneous binding of a range of other Pgp substrates. Therefore, a new and more
generally applicable approach was needed to look at simultaneous binding of two drugs.
One objective of this thesis was to explore and measure the binding of a second
drug to Pgp with another drug covalently linked to the binding pocket, to understand how
binding of the first drug molecule affects the subsequent binding of the second drug
molecule. To achieve this, we sought to covalently link AzTMR, a fluorescent azido-
derivative of the Pgp substrate TMR, to the drug-binding pocket of Pgp and analyze the
biochemical and fluorescence properties of the drug adduct. The hope is that the drug
would crosslink to the site within Pgp where it normally binds, which offers a significant
49
advantage over probes which link non-specifically or to engineered cysteine residues.
The azido group is activated by UV light and reacts with protein side chains via a free
radical mechanism. Thus, it was necessary to thoroughly study the adduct after
crosslinking to ensure the highly reactive AzTMR did not cause any negative effects on
Pgp. By labelling Pgp in this manner, unbound probe can be removed from Pgp-AzTMR
by chromatography so the equilibrium between free and bound drug need not be
considered. The Pgp-drug adduct can then be used to determine how the presence of
covalently-bound TMR affects binding of a second drug molecule.
3.2 COVALENT CROSSLINKING OF AZTMR TO PGP
To establish crosslinking of AzTMR to purified Pgp in CHAPS detergent, AzTMR
was activated by UV irradiation in a Stratalinker 1800 UV crosslinker. ATP was added to
the reaction mixture to protect the ATP binding site during UV activation. DTE was also
added to the mixture in order to preserve as much ATPase activity as possible. The
reaction mixture, consisting of Pgp, ATP, DTE, AzTMR and CHAPS buffer, was first
incubated on ice in the dark for 10 min, followed by 20 min of crosslinking with 365 nm
UV light. The crosslinked mixture was then incubated at 4°C for another 10 min and
finally separated by gel filtration chromatography. A Pgp-mock sample (Pgp, ATP, DTE
and CHAPS buffer) was prepared under the same conditions as Pgp-AzTMR to gauge
whether the crosslinking procedure had any effect on the catalytic activity of Pgp. The
ATPase activity of Pgp-mock was similar to that of Pgp, indicating that UV treatment
alone did not affect ATPase activity. The ATPase activity of the Pgp-AzTMR drug
adduct was approximately 55-75% of that of native Pgp; a similar decrease in ATPase
activity was seen for unlabelled Pgp in the presence of 100 μM free AzTMR.
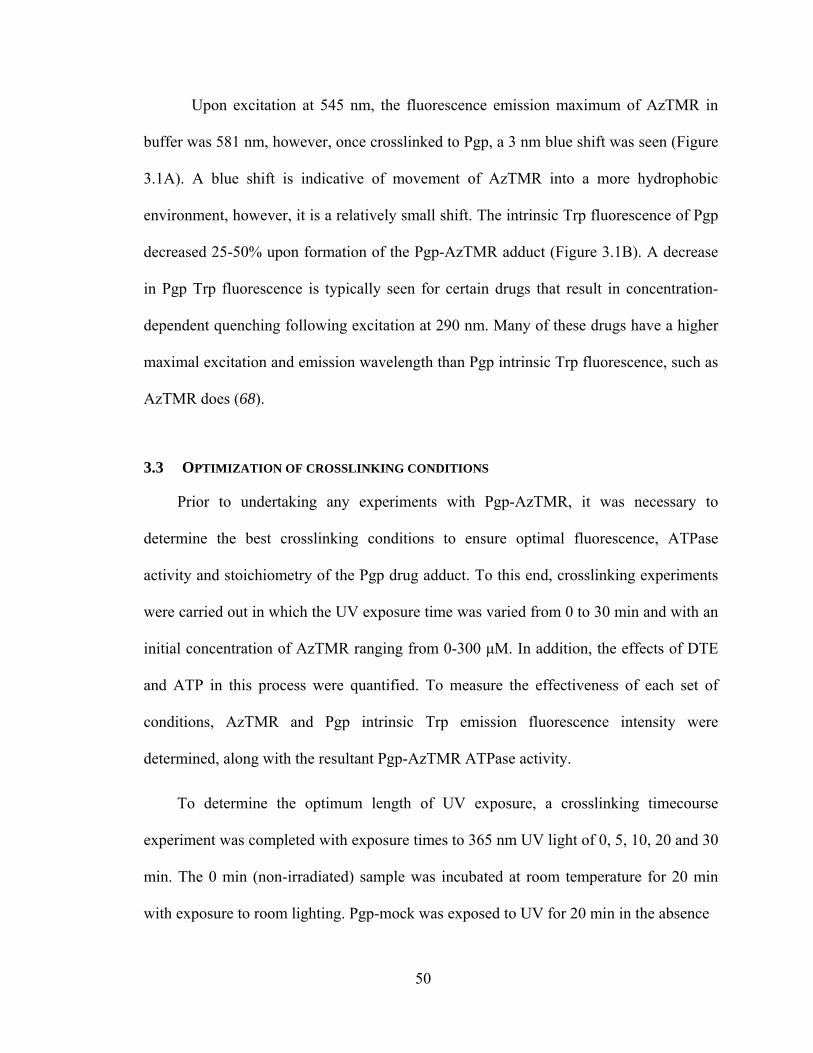
50
Upon excitation at 545 nm, the fluorescence emission maximum of AzTMR in
buffer was 581 nm, however, once crosslinked to Pgp, a 3 nm blue shift was seen (Figure
3.1A). A blue shift is indicative of movement of AzTMR into a more hydrophobic
environment, however, it is a relatively small shift. The intrinsic Trp fluorescence of Pgp
decreased 25-50% upon formation of the Pgp-AzTMR adduct (Figure 3.1B). A decrease
in Pgp Trp fluorescence is typically seen for certain drugs that result in concentration-
dependent quenching following excitation at 290 nm. Many of these drugs have a higher
maximal excitation and emission wavelength than Pgp intrinsic Trp fluorescence, such as
AzTMR does (68).
3.3 OPTIMIZATION OF CROSSLINKING CONDITIONS
Prior to undertaking any experiments with Pgp-AzTMR, it was necessary to
determine the best crosslinking conditions to ensure optimal fluorescence, ATPase
activity and stoichiometry of the Pgp drug adduct. To this end, crosslinking experiments
were carried out in which the UV exposure time was varied from 0 to 30 min and with an
initial concentration of AzTMR ranging from 0-300 μM. In addition, the effects of DTE
and ATP in this process were quantified. To measure the effectiveness of each set of
conditions, AzTMR and Pgp intrinsic Trp emission fluorescence intensity were
determined, along with the resultant Pgp-AzTMR ATPase activity.
To determine the optimum length of UV exposure, a crosslinking timecourse
experiment was completed with exposure times to 365 nm UV light of 0, 5, 10, 20 and 30
min. The 0 min (non-irradiated) sample was incubated at room temperature for 20 min
with exposure to room lighting. Pgp-mock was exposed to UV for 20 min in the absence
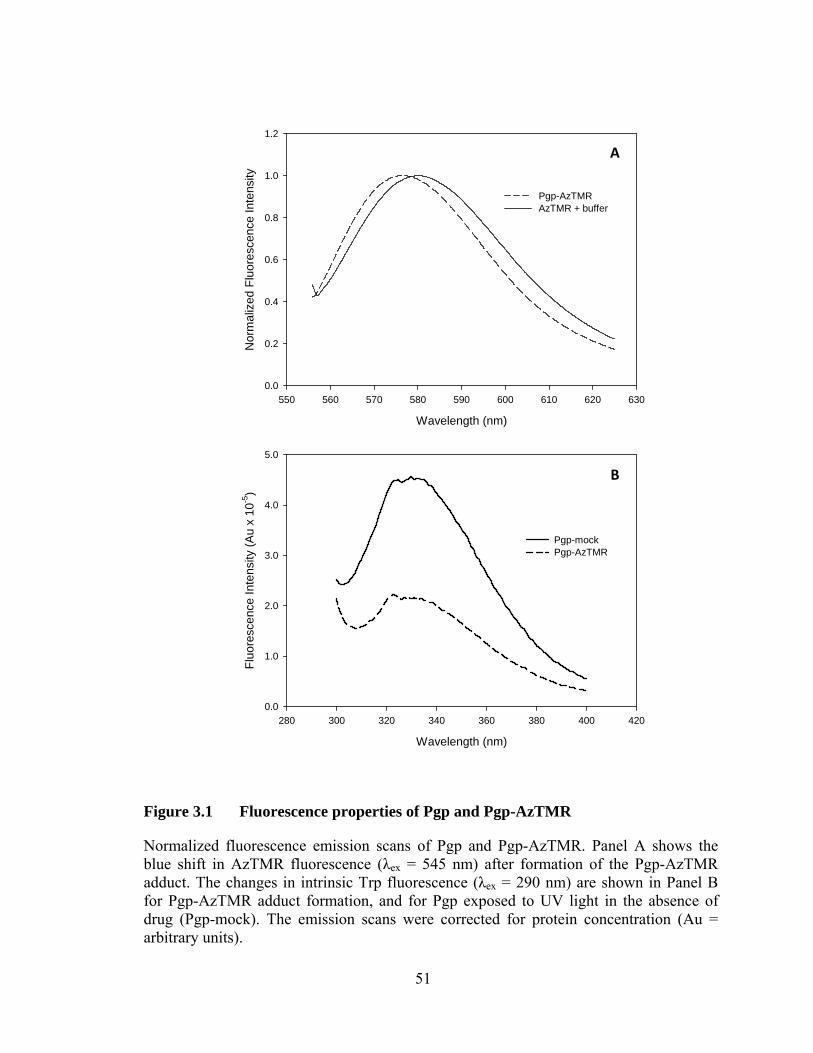
51
Wavelength (nm)
550 560 570 580 590 600 610 620 630
Nor
mal
ized
Flu
ores
cenc
e In
tens
ity
0.0
0.2
0.4
0.6
0.8
1.0
1.2
Pgp-AzTMRAzTMR + buffer
Wavelength (nm)
280 300 320 340 360 380 400 420
Fluo
resc
ence
Inte
nsity
(Au
x 10
-5)
0.0
1.0
2.0
3.0
4.0
5.0
Pgp-mockPgp-AzTMR
Figure 3.1 Fluorescence properties of Pgp and Pgp-AzTMR
Normalized fluorescence emission scans of Pgp and Pgp-AzTMR. Panel A shows the blue shift in AzTMR fluorescence (λex = 545 nm) after formation of the Pgp-AzTMR adduct. The changes in intrinsic Trp fluorescence (λex = 290 nm) are shown in Panel B for Pgp-AzTMR adduct formation, and for Pgp exposed to UV light in the absence of drug (Pgp-mock). The emission scans were corrected for protein concentration (Au = arbitrary units).
A
B
52
of AzTMR as a control for Pgp exposure to UV light. In addition, a Pgp sample was
incubated with AzTMR for 20 min in the dark (Pgp-dark) to observe the effects of no
light exposure. There was a small increase in bound AzTMR fluorescence compared to
Pgp-mock (Figure 3.2B) for the 0 min sample, along with a slight decrease in Trp
fluorescence relative to Pgp-mock (Figure 3.2A). This indicates that the exposure to room
lighting did result in a slight crosslinking of AzTMR to Pgp, and the bound AzTMR
quenched Trp fluorescence as expected. The Pgp-dark sample, however, showed no
bound AzTMR fluorescence, indicating that incubation in the absence of UV irradiation
does not result in activation and crosslinking of AzTMR to Pgp, and they can
subsequently be separated from each other. Pgp-mock retained Trp fluorescence intensity
and ATPase activity (Figure 3.2C), suggesting that 365 nm UV exposure did not damage
the protein. The ATPase activity of the 0 min sample was similar to that of Pgp-mock,
while that of Pgp-dark was slightly lower.
Over the range of the UV irradiation times used, the Trp fluorescence intensity of
Pgp did not change to a significant degree. The AzTMR fluorescence, being a measure of
labelling, increased with time up to a maximum level after 10 min of UV exposure. The
ATPase activity decreased with increasing UV irradiation time, and leveled off ~30%
lower than that of Pgp-mock. The data suggest that 10, 20, or 30 min of 365 nm UV
exposure would be sufficient for optimum labelling and ATPase activity of Pgp-AzTMR,
however, to ensure no under- or over-exposure (which can lead to photobleaching), 20
min was chosen as the optimal time for all subsequent experiments.
In order to determine the optimum initial concentration of AzTMR, the
concentration was varied from 0-300 μM and the resulting Pgp-AzTMR monitored for
53
Fluo
resc
ence
em
290
:330
(Au
x 10
-2)
0
10
20
30
40
50
Fluo
resc
ence
em
545
:579
(Au
x 10
-2)
0
10
20
30
40
50
Crosslinking time (min)
0 5 10 15 20 25 30 35
ATPa
se a
ctiv
ity (%
con
trol)
0
20
40
60
80
100
Figure 3.2 Crosslinking timecourse of AzTMR to Pgp
Intrinsic Trp fluorescence (Panel A), bound AzTMR fluorescence (Panel B), and ATPase activity (Panel C) measured at each time of UV crosslinking in the presence of 100 μM AzTMR. The 0 min sample was exposed for 20 min to room lighting. Pgp-mock (Δ) was irradiated for 20 min in the absence of AzTMR, Pgp-dark (×) was left for 20 min in the dark. All other samples were exposed to UV light in the Stratalinker (●). Fluorescence measurements were corrected for protein concentration and Pgp-mock was used as the 100% ATPase activity benchmark. All values are the average of 3 experiments ± SE.
A
B
C
Trp fluorescence
bound AzTMR fluorescence
ATPase activity
54
Trp and bound AzTMR fluorescence and ATPase activity. The 0 μM sample was
effectively equivalent to Pgp-mock and had the highest Trp fluorescence and ATPase
activity, with no bound AzTMR fluorescence. The AzTMR fluorescence intensity
increased with concentration to a maximum at 300 μM (Figure 3.3B), and the Trp
fluorescence decreased as expected, since increased AzTMR crosslinking led to more
internal Trp quenching (Figure 3.3A). The Pgp ATPase activity decreased as the AzTMR
concentration increased, and was about 40% lower at 100 μM (Figure 3.3C). To
maximize Trp emission (important for binding experiments) as well as AzTMR labelling
and ATPase activity, a concentration of 100 μM AzTMR was chosen for crosslinking in
further experiments.
DTE has been observed in our lab to protect Pgp ATPase activity, while the
presence of ATP is thought to protect Pgp function (likely by maintaining its native
conformation), therefore, the addition of both of these agents was tested for their effect
on AzTMR crosslinking. The fluorescence emission of bound AzTMR was similar for
samples containing 2 mM ATP in either the presence or absence of 5 mM DTE, and
significantly higher than those containing no ATP (Figure 3.4B). This suggests that ATP
is required for optimal crosslinking of AzTMR to Pgp, while DTE is not. The effect of
ATP and DTE on Pgp-AzTMR ATPase activity was significant (Figure 3.4C); samples
lacking both agents showed markedly decreased activity upon crosslinking. Both samples
containing DTE, with and without ATP, had the highest ATPase activity following
crosslinking. All samples displayed a ~50% reduction in Pgp Trp fluorescence following
crosslinking (Figure 3.4A). In the samples containing ATP, this decrease was likely due
to quenching of Trp fluorescence by linked AzTMR. Based on these results, it appears
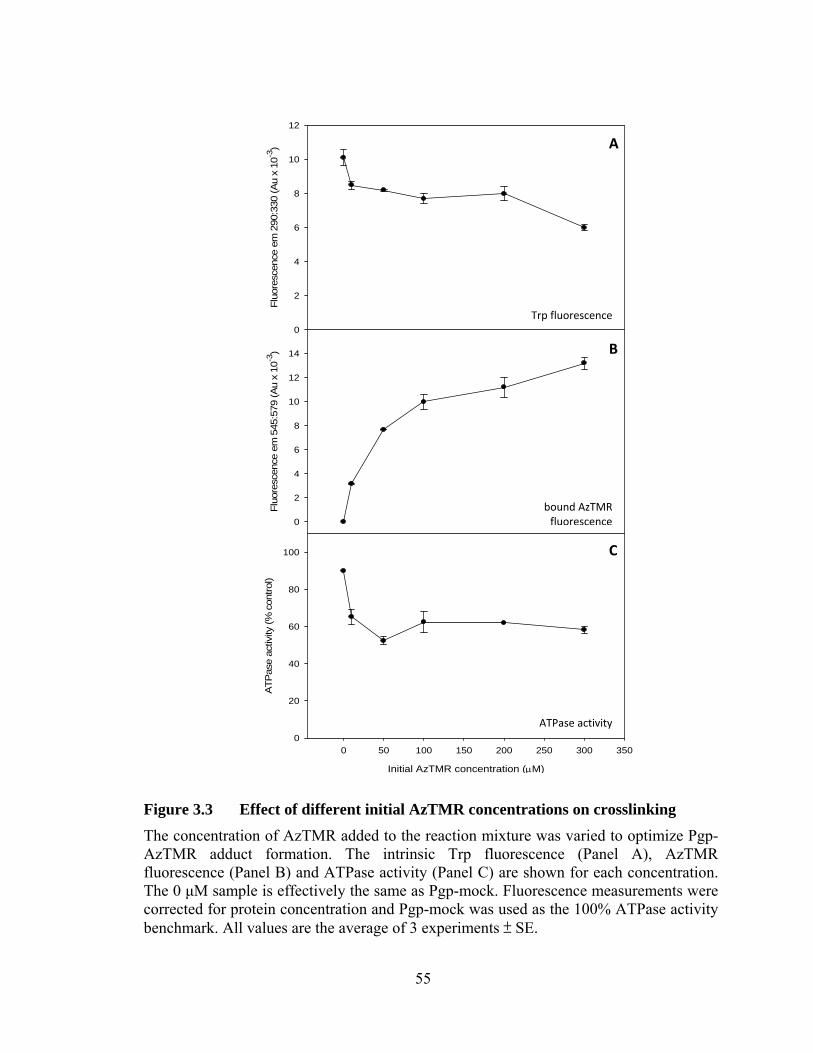
55
Fluo
resc
ence
em
290
:330
(Au
x 10
-3)
0
2
4
6
8
10
12
Fluo
resc
ence
em
545
:579
(Au
x 10
-3)
0
2
4
6
8
10
12
14
Initial AzTMR concentration (μM)
0 50 100 150 200 250 300 350
ATP
ase
activ
ity (%
con
trol)
0
20
40
60
80
100
Figure 3.3 Effect of different initial AzTMR concentrations on crosslinking The concentration of AzTMR added to the reaction mixture was varied to optimize Pgp-AzTMR adduct formation. The intrinsic Trp fluorescence (Panel A), AzTMR fluorescence (Panel B) and ATPase activity (Panel C) are shown for each concentration. The 0 μM sample is effectively the same as Pgp-mock. Fluorescence measurements were corrected for protein concentration and Pgp-mock was used as the 100% ATPase activity benchmark. All values are the average of 3 experiments ± SE.
A
B
C
Trp fluorescence
bound AzTMR fluorescence
ATPase activity
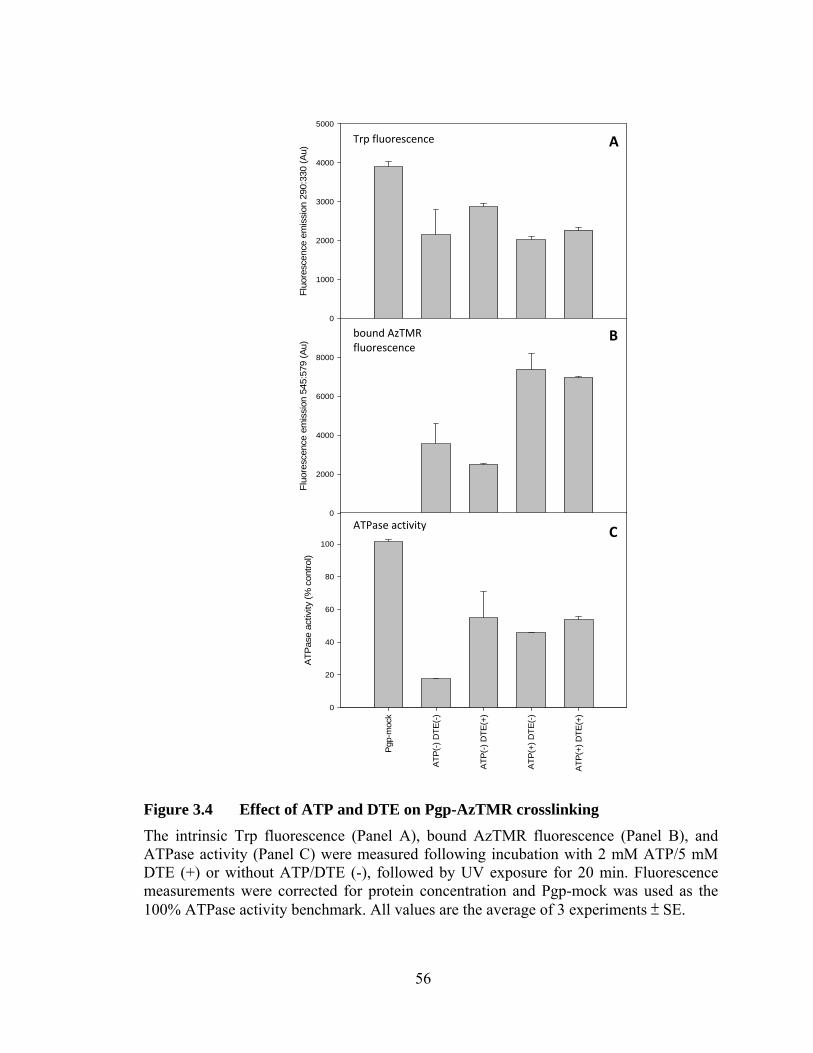
56
Fluo
resc
ence
em
issi
on 2
90:3
30 (A
u)0
1000
2000
3000
4000
5000
Fluo
resc
ence
em
issi
on 5
45:5
79 (A
u)
0
2000
4000
6000
8000
Pgp
-moc
k
ATP(
-) D
TE(-
)
ATP
(-) D
TE(+
)
ATP
(+) D
TE(-
)
ATP
(+) D
TE(+
)
ATP
ase
activ
ity (%
con
trol)
0
20
40
60
80
100
Figure 3.4 Effect of ATP and DTE on Pgp-AzTMR crosslinking The intrinsic Trp fluorescence (Panel A), bound AzTMR fluorescence (Panel B), and ATPase activity (Panel C) were measured following incubation with 2 mM ATP/5 mM DTE (+) or without ATP/DTE (-), followed by UV exposure for 20 min. Fluorescence measurements were corrected for protein concentration and Pgp-mock was used as the 100% ATPase activity benchmark. All values are the average of 3 experiments ± SE.
ATPase activity
A
B
C
Trp fluorescence
bound AzTMR fluorescence
57
that both ATP and DTE are beneficial to ensure maximum AzTMR labelling while
minimizing the negative effects of UV exposure on Pgp ATPase activity. Therefore, 2
mM ATP and 5 mM DTE were included in all subsequent crosslinking experiments.
3.4 STOICHIOMETRY OF COVALENT LINKAGE OF AZTMR TO PGP
It was necessary to determine the drug labelling stoichiometry of AzTMR to Pgp in
order to assess the outcome of various crosslinking conditions. A standard curve of
AzTMR absorbance at 545 nm was generated at concentrations from 0-25 μM. However,
when the AzTMR concentration was interpolated based on Pgp-AzTMR absorbance at
545 nm, the labelling ratio varied from 6 to 48, depending on the starting concentration of
AzTMR used. It seems likely that the absorbance standard curve was overestimating the
AzTMR concentration in the Pgp-AzTMR samples because the measured absorbance
signal was very low. As a result, a standard curve of AzTMR fluorescence emission at
579 nm (λex = 545 nm) was generated for AzTMR concentrations from 0-1 μM (Figure
3.5A). These standards were treated in the same way as Pgp-AzTMR and Pgp-mock
(including UV exposure). The AzTMR standard curve was linear (Figure 3.5A) and
allowed estimation of the AzTMR concentration of the Pgp-AzTMR solutions. The molar
stoichiometry was determined by comparison with the molar protein concentration for
each of the tested conditions of Pgp labelling. The stoichiometry increased with the time
of UV exposure up to a maximum of just over 1 at 20-30 min. The stoichiometry also
appeared to increase with AzTMR concentration, but did not appear to reach a maximum,
which is likely due to the inability of the gel filtration column to sufficiently separate
Pgp-AzTMR from unlabelled AzTMR at very high concentrations. ATP is an absolute
requirement for efficient AzTMR labelling; in its absence labelling was found to be
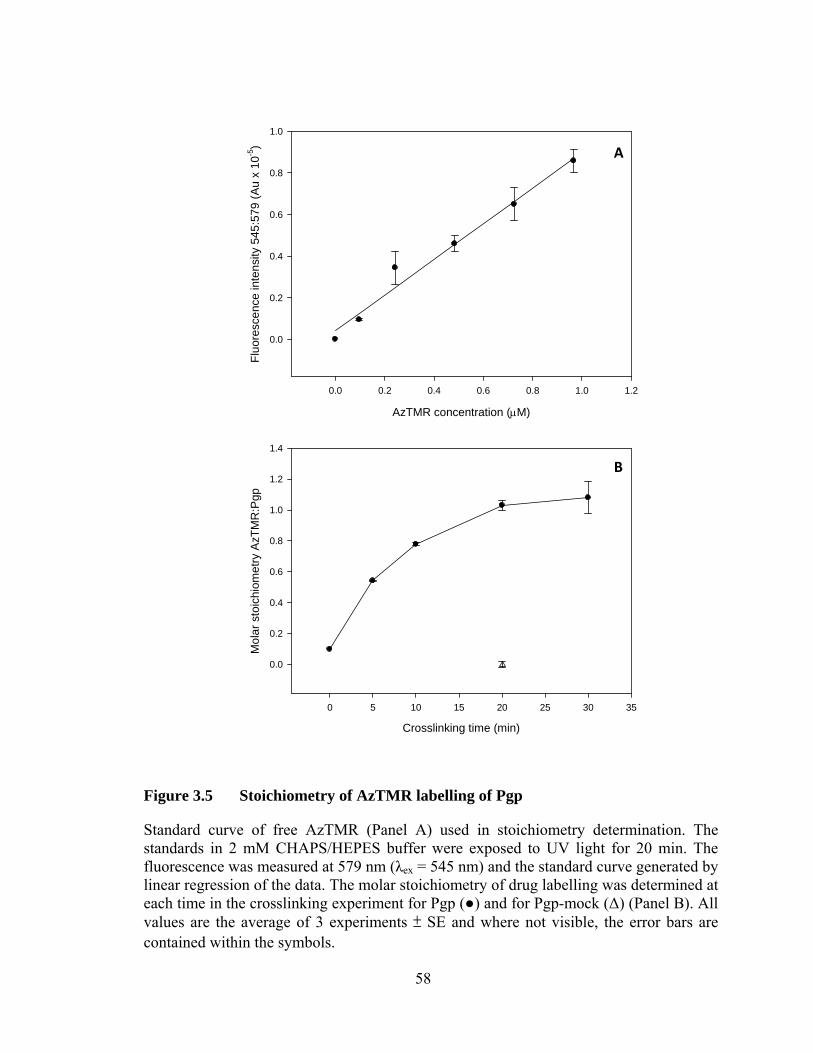
58
AzTMR concentration (μM)
0.0 0.2 0.4 0.6 0.8 1.0 1.2
Fluo
resc
ence
inte
nsity
545
:579
(Au
x 10
-5)
0.0
0.2
0.4
0.6
0.8
1.0
Crosslinking time (min)
0 5 10 15 20 25 30 35
Mol
ar s
toic
hiom
etry
AzT
MR
:Pgp
0.0
0.2
0.4
0.6
0.8
1.0
1.2
1.4
Figure 3.5 Stoichiometry of AzTMR labelling of Pgp
Standard curve of free AzTMR (Panel A) used in stoichiometry determination. The standards in 2 mM CHAPS/HEPES buffer were exposed to UV light for 20 min. The fluorescence was measured at 579 nm (λex = 545 nm) and the standard curve generated by linear regression of the data. The molar stoichiometry of drug labelling was determined at each time in the crosslinking experiment for Pgp (●) and for Pgp-mock (Δ) (Panel B). All values are the average of 3 experiments ± SE and where not visible, the error bars are contained within the symbols.
A
B
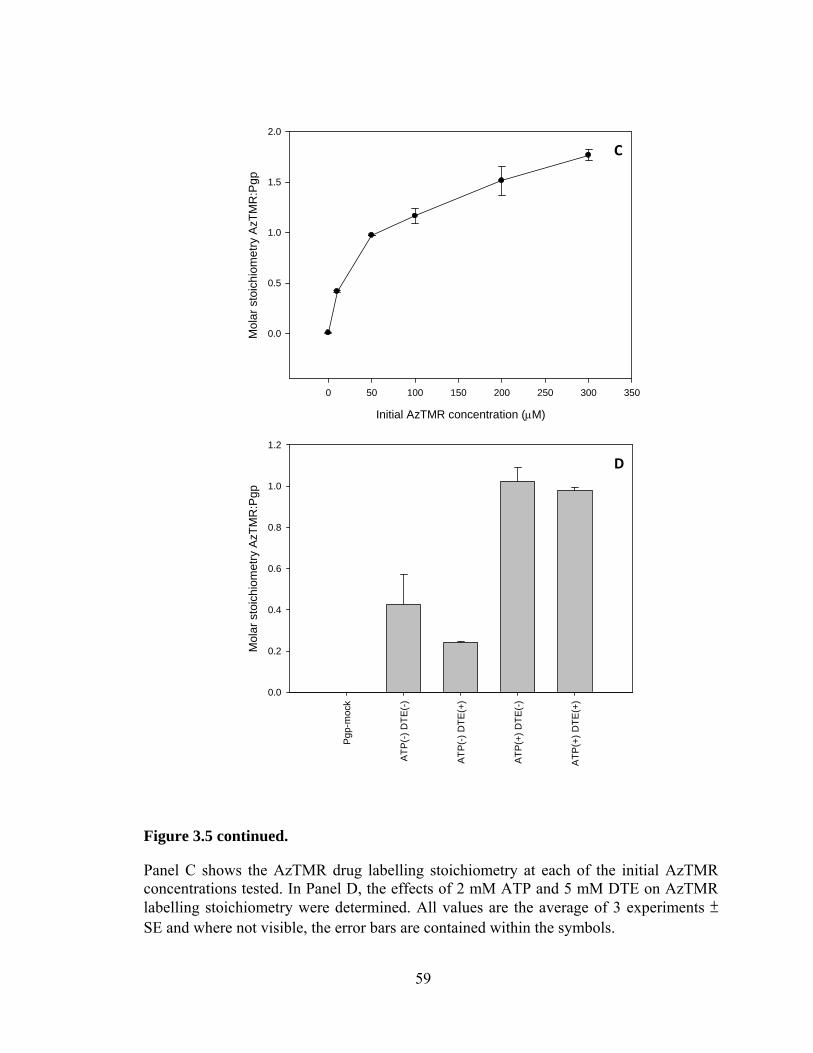
59
Pgp-
moc
k
ATP
(-) D
TE(-
)
ATP(
-) D
TE(+
)
ATP(
+) D
TE(-
)
ATP
(+) D
TE(+
)
Mol
ar s
toic
hiom
etry
AzT
MR
:Pgp
0.0
0.2
0.4
0.6
0.8
1.0
1.2
Initial AzTMR concentration (μM)
0 50 100 150 200 250 300 350
Mol
ar s
toic
hiom
etry
AzT
MR
:Pgp
0.0
0.5
1.0
1.5
2.0
Figure 3.5 continued.
Panel C shows the AzTMR drug labelling stoichiometry at each of the initial AzTMR concentrations tested. In Panel D, the effects of 2 mM ATP and 5 mM DTE on AzTMR labelling stoichiometry were determined. All values are the average of 3 experiments ± SE and where not visible, the error bars are contained within the symbols.
C
D
60
20-40% (Figure 3.5D). In contrast, DTE did not appear to be required for stoichiometric
labelling, but served an important role in maintaining ATPase activity. Under optimized
conditions for crosslinking, the molar stoichiometry of AzTMR labelling of Pgp was
repeatedly found to be ~1.
3.5 DISCUSSION
The activation of AzTMR by UV light produces a highly reactive aryl azide
intermediate which acts as a powerful nucleophile in a number of different reactions. It
can react with hydrocarbons, amines, and carbon-carbon double bonds which are present
in the amino acid side chains of proteins (145). The goal of this project was to covalently
link a fluorescent probe, AzTMR, to its physiological binding site within the Pgp binding
pocket. To ensure that this probe was not labelling Pgp in a non-specific way, the Pgp-
AzTMR drug adduct was thoroughly characterized. The ATPase activity of the Pgp-
AzTMR drug adduct decreased by 25-45% and the intrinsic Trp fluorescence by 25-50%
(Figure 3.1B), both of which were consistent with what was observed for noncovalent
binding of TMR. Furthermore, the fluorescence emission peak of AzTMR shifted to
lower wavelengths by ~3 nm. This blue shift is consistent with the TMR fluorophore
moving from an aqueous to a more non-polar environment, such as that found in the
interior of proteins. Earlier studies on the drug-binding pocket of Pgp suggested that its
environment resembles one with a polarity lower than that of chloroform (76). If the
AzTMR probe were merely crosslinking to the protein surface in a non-specific way, no
change would be expected in the emission spectrum of the fluorophore.
61
The goal of the timecourse experiment was to determine the optimum UV light
exposure for crosslinking AzTMR to Pgp to achieve a molar labelling stoichiometry close
to 1. A secondary aim was also to determine whether the changes observed in ATPase
activity, Trp fluorescence and AzTMR fluorescence were due to UV exposure or
formation of the drug adduct. For this reason, several control experiments were
conducted, including a 0 minute sample (20 min at room temperature and exposure to
room lighting), Pgp-dark (20 min in the dark) and Pgp-mock (UV-exposed sample with
no AzTMR). The results indicated that AzTMR does not crosslink significantly to Pgp in
the absence of UV irradiation (a small amount of crosslinking to Pgp occurred as a result
of exposure to room lighting).
The concentration of AzTMR in the reaction mixture was an important parameter to
optimize, as different concentrations resulted in different ATPase activity and apparent
stoichiometry of the Pgp-AzTMR adduct. The Kd for AzTMR non-covalent binding to
Pgp is 27 μM (Section 4.3.2), and the most effective concentrations in crosslinking were
higher than this. The activated azido group is very reactive and, given the large molar
excess of label, it might be surprising that only one molecule of AzTMR was found
covalently linked to Pgp. A study with the nucleotide photoaffinity labels 2-azido-ATP
and 8-azido-ATP showed that while both analogs are capable of binding to the catalytic
site of Pgp, only the latter is able to covalently react after photoactivation (146). The
authors suggested that Pgp had no suitable amino acid side chains adjacent to the
photoactivated 2-position of 2-azido-ATP. This explanation is also applicable to the
photoactivation of AzTMR; there may be limited availability of suitable reactive amino
acid side chains in the immediate vicinity of the TMR binding sites. Therefore, although
62
more than one molecule of AzTMR may bind to Pgp, it is possible that only one binding
site is labelled following photoactivation.
The role of ATP and DTE was also investigated as part of optimizing the AzTMR
labelling efficiency to Pgp. The effect of adding 2 mM ATP was significant, with
samples containing ATP showing 60-80% more AzTMR labelling than those without.
The decrease in intrinsic Trp fluorescence on AzTMR labelling can likely be attributed to
quenching by crosslinked AzTMR. The transport cycle of Pgp involves both drug and
nucleotide binding, and one study found different conformations of the TMDs in different
nucleotide-bound states of Pgp (50). It is thought that the substrate-binding site may be
more accessible to drug in the presence of nucleotide through conformational changes
transmitted from the NBDs to the TMDs. Thus ATP binding may help facilitate drug
binding to Pgp, which explains why the presence of ATP resulted in more efficient
crosslinking of AzTMR. Alternatively, ATP (as a substrate) may stabilize the native
sandwich dimer conformation of Pgp.
Crosslinking AzTMR to Pgp resulted in a 25-45% decrease in the ATPase activity.
Many substrates are found to either stimulate or inhibit ATPase activity, or both
(103;104;121). The effect of free AzTMR on Pgp ATPase activity is concentration
dependent; it was observed to slightly stimulate activity at very low concentrations and
then inhibit activity to below basal levels at higher concentrations (Section 4.3.1). At
saturating concentrations of AzTMR, Pgp ATPase activity is ~50% lower, which is
consistent with the activity of Pgp-AzTMR after crosslinking. Recent models for the
catalytic cycle of Pgp suggest that it can participate in either basal ATPase activity or
drug-coupled activity (124). In the basal cycle, ATP is turned over at a constant rate until
63
the binding of substrate shifts the protein to the drug-coupled cycle. This binding is
proposed to be dependent on the specific drug; the better it is at forming the transition
state for the drug-coupled cycle, the faster it is transported. Covalent linking of AzTMR
to Pgp would effectively move it into the drug-coupled cycle.
64
Chapter 4
BIOCHEMICAL CHARACTERIATION OF
PGP-AZTMR
65
4.1 INTRODUCTION
The drug binding nature of Pgp has been actively studied in an effort to define a
binding site (or sites) that can be targeted by inhibitors. The binding affinity of Pgp has
been measured for a wide range of substrates, and the Kd values range from the nM to
μM scales (61). The X-ray structures of Pgp in the presence of cyclic peptide inhibitors
indicate that the large binding pocket contains at least three, possibly more, distinct
binding sub-sites. Pgp cannot possibly contain a unique binding site for each of its
hundreds of substrates, however, its structures, along with those of other multidrug
binding proteins (147), reveal how they are capable of poly-specific drug binding. The
goal of this chapter was to characterize the sub-site where AzTMR is crosslinked within
the binding pocket of Pgp.
The binding sites of Pgp for H33342 and LDS-751 have been mapped to the
cytoplasmic leaflet of the membrane (76;77). The LDS-751 site has been described as
having a nonpolar, hydrophobic environment (76), however, Clarke and coworkers have
suggested that the binding pocket is accessible to water (92). The polarity of the
environment for AzTMR covalently crosslinked to Pgp may be determined by measuring
the Stokes shift of AzTMR in a variety of solvents and constructing a Lippert plot, which
relates the Stokes shift to solvent polarity.
The transport cycle of Pgp involves coupling the processes of drug binding and
translocation to the binding and hydrolysis of ATP. Drug binding to the TMDs induces
conformational changes in Pgp that initiate the transport process (123). The ability of
drugs to stimulate or inhibit Pgp ATPase activity is thus a direct consequence of drug
binding and the resulting conformational changes. Any changes in ATPase activity could
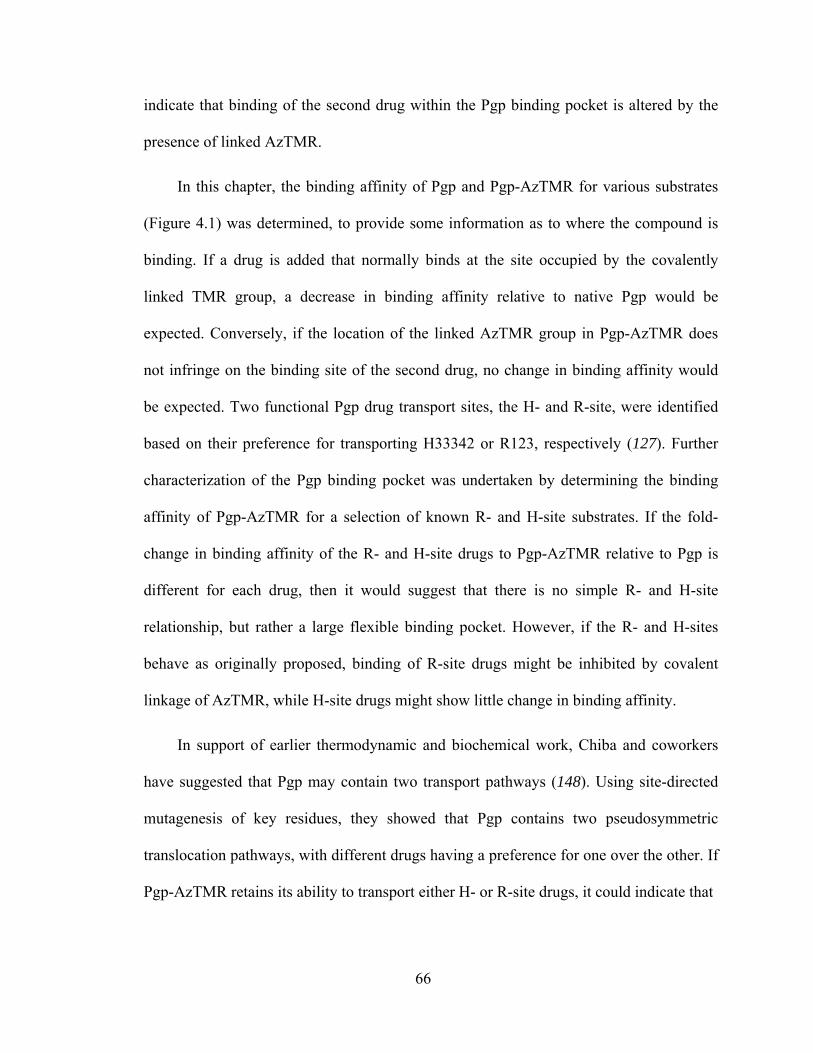
66
indicate that binding of the second drug within the Pgp binding pocket is altered by the
presence of linked AzTMR.
In this chapter, the binding affinity of Pgp and Pgp-AzTMR for various substrates
(Figure 4.1) was determined, to provide some information as to where the compound is
binding. If a drug is added that normally binds at the site occupied by the covalently
linked TMR group, a decrease in binding affinity relative to native Pgp would be
expected. Conversely, if the location of the linked AzTMR group in Pgp-AzTMR does
not infringe on the binding site of the second drug, no change in binding affinity would
be expected. Two functional Pgp drug transport sites, the H- and R-site, were identified
based on their preference for transporting H33342 or R123, respectively (127). Further
characterization of the Pgp binding pocket was undertaken by determining the binding
affinity of Pgp-AzTMR for a selection of known R- and H-site substrates. If the fold-
change in binding affinity of the R- and H-site drugs to Pgp-AzTMR relative to Pgp is
different for each drug, then it would suggest that there is no simple R- and H-site
relationship, but rather a large flexible binding pocket. However, if the R- and H-sites
behave as originally proposed, binding of R-site drugs might be inhibited by covalent
linkage of AzTMR, while H-site drugs might show little change in binding affinity.
In support of earlier thermodynamic and biochemical work, Chiba and coworkers
have suggested that Pgp may contain two transport pathways (148). Using site-directed
mutagenesis of key residues, they showed that Pgp contains two pseudosymmetric
translocation pathways, with different drugs having a preference for one over the other. If
Pgp-AzTMR retains its ability to transport either H- or R-site drugs, it could indicate that
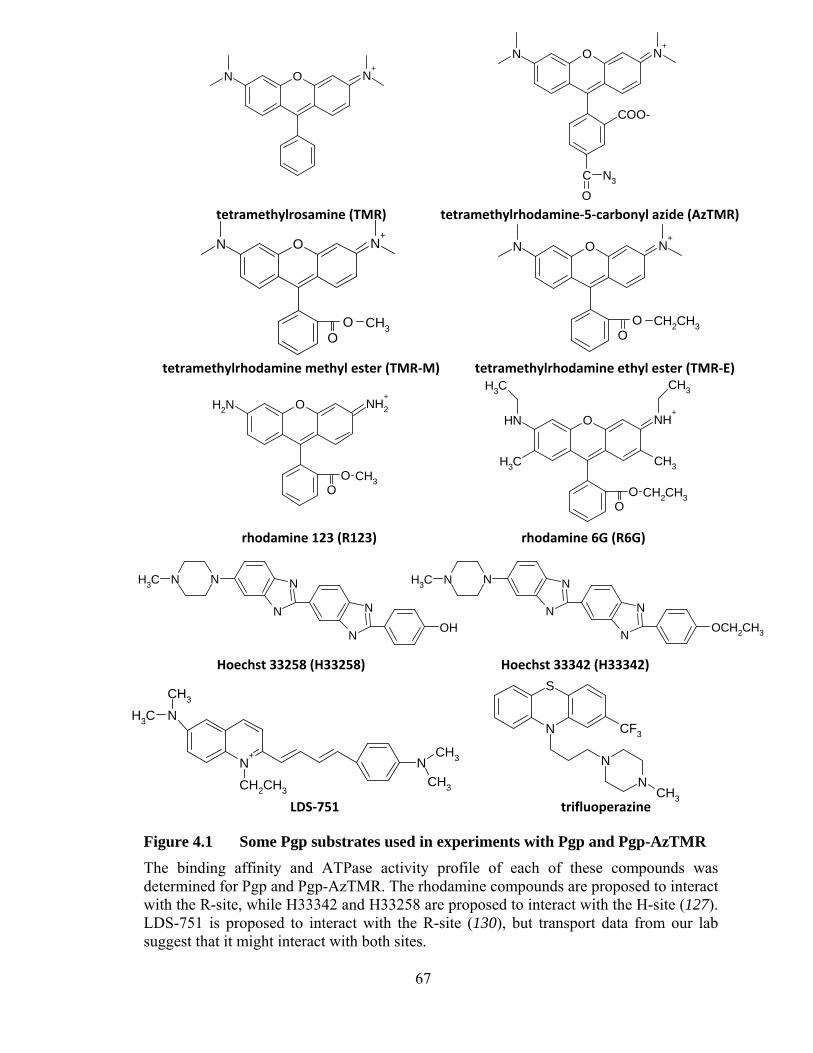
67
Figure 4.1 Some Pgp substrates used in experiments with Pgp and Pgp-AzTMR The binding affinity and ATPase activity profile of each of these compounds was determined for Pgp and Pgp-AzTMR. The rhodamine compounds are proposed to interact with the R-site, while H33342 and H33258 are proposed to interact with the H-site (127). LDS-751 is proposed to interact with the R-site (130), but transport data from our lab suggest that it might interact with both sites.
O N+
N
O N+
COO-
ON3C
N
N
NN
NNNCH3
OH N
NN
NNNCH3
OCH2CH3
N+
NCH3
CH3
CH2CH3
NCH3
CH3
NN
N
S
CF3
CH3
tetramethylrosamine (TMR) tetramethylrhodamine‐5‐carbonyl azide (AzTMR)
tetramethylrhodamine methyl ester (TMR‐M) tetramethylrhodamine ethyl ester (TMR‐E)
rhodamine 123 (R123) rhodamine 6G (R6G)
Hoechst 33258 (H33258) Hoechst 33342 (H33342)
LDS‐751 trifluoperazine
O NH2+
NH2
OO CH3
O NH+
NH
OO CH2CH3
CH3CH3
CH3 CH3
O N+
N
OO CH3
O N+
N
OO CH2CH3
68
one or both of these pathways are still able to function with AzTMR bound to the R-site
within the binding pocket.
4.2 DETERMINING THE POLARITY OF THE LOCAL ENVIRONMENT OF BOUND AZTMR IN PGP
For a number of fluorophores, their excitation and emission spectra are dependent
on the polarity of their local environment. After crosslinking of AzTMR to Pgp, a small
blue shift was seen in its emission spectrum (Figure 3.1). As a rule of a thumb,
fluorophores experience a shift in their fluorescence emission spectra towards higher
energies when moving to a more nonpolar, or hydrophobic, environment. However,
because excitation spectra can also shift to higher or lower energies in different
environments, the difference between absorption and emission maxima, or Stokes shift
(νA-νF), is a more quantitative way of analyzing that change. The Stokes shift of AzTMR
(in wavenumbers, cm-1) was measured in a number of different solvents ranging from low
to high polarity: chloroform, methylene chloride, DMF, DMSO, 2-propanol, methanol
and aqueous buffer. These solvents were chosen based on the ability of AzTMR to
dissolve in them at a concentration of 0.30 μM without any harsh conditions. The
orientation polarizability (Δf) of each solvent was determined based on its refractive
index and dielectric constant (Section 2.4.5) and used as a relative measure of that
solvent’s polar or nonpolar nature. The measured Stokes shift of AzTMR in each solvent
was plotted against solvent orientation polarizability in the Lippert plot (shown in Figure
4.2). Linear regression of the data gave the Lippert equation (m = 1444 cm-1) for AzTMR
in a variety of environments. The measured Stokes shift of AzTMR crosslinked to Pgp of
1028 cm-1 was used to interpolate a polarizability of 0.2799 from the Lippert equation.
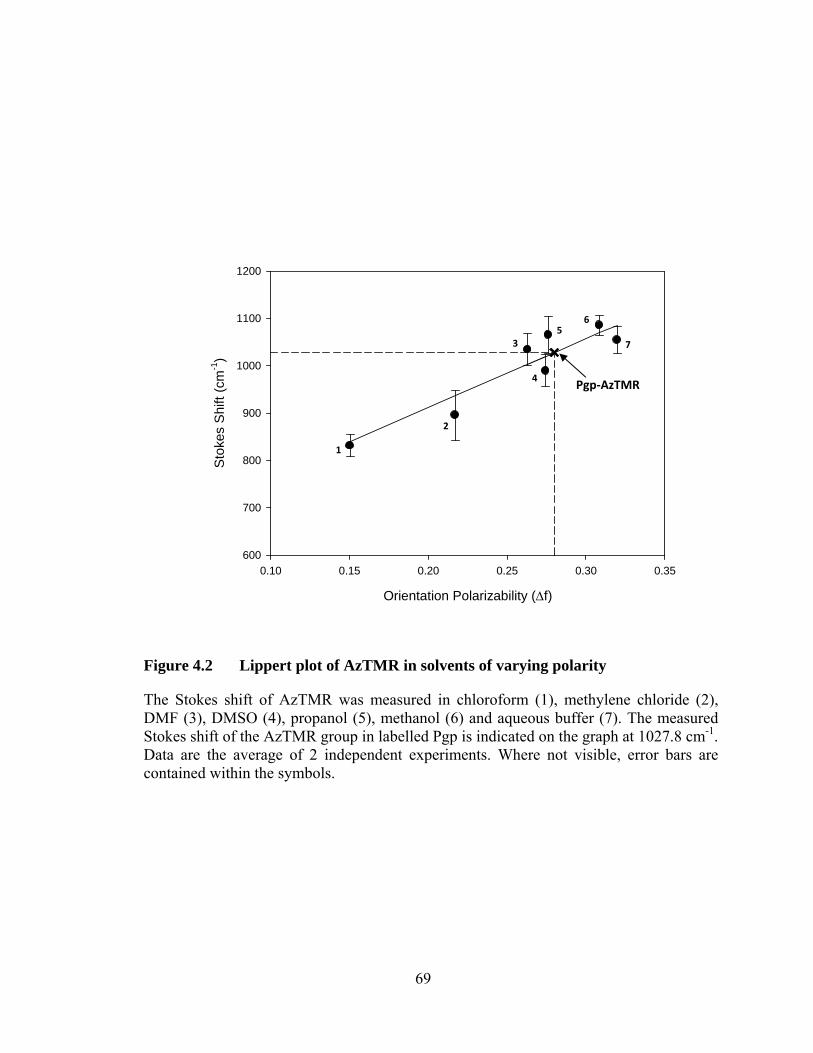
69
Orientation Polarizability (Δf)
0.10 0.15 0.20 0.25 0.30 0.35
Sto
kes
Shi
ft (c
m-1
)
600
700
800
900
1000
1100
1200
Figure 4.2 Lippert plot of AzTMR in solvents of varying polarity
The Stokes shift of AzTMR was measured in chloroform (1), methylene chloride (2), DMF (3), DMSO (4), propanol (5), methanol (6) and aqueous buffer (7). The measured Stokes shift of the AzTMR group in labelled Pgp is indicated on the graph at 1027.8 cm-1. Data are the average of 2 independent experiments. Where not visible, error bars are contained within the symbols.
Pgp‐AzTMR
1
2
3
4
56
7
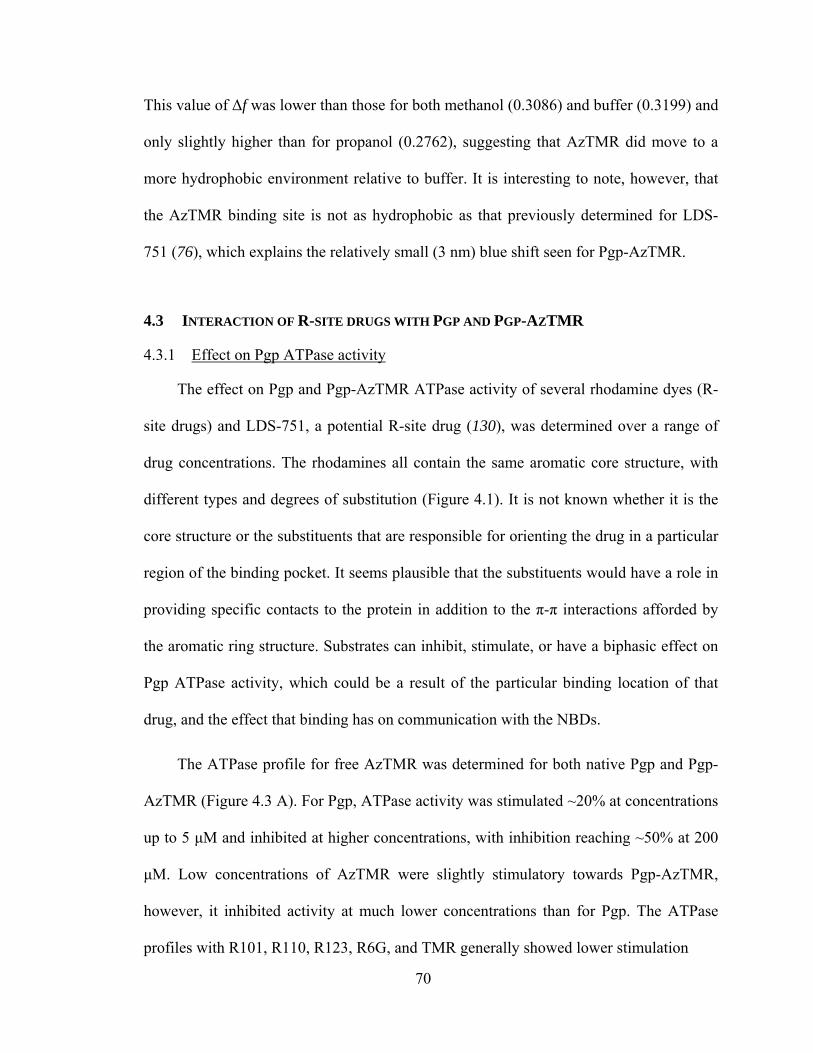
70
This value of Δf was lower than those for both methanol (0.3086) and buffer (0.3199) and
only slightly higher than for propanol (0.2762), suggesting that AzTMR did move to a
more hydrophobic environment relative to buffer. It is interesting to note, however, that
the AzTMR binding site is not as hydrophobic as that previously determined for LDS-
751 (76), which explains the relatively small (3 nm) blue shift seen for Pgp-AzTMR.
4.3 INTERACTION OF R-SITE DRUGS WITH PGP AND PGP-AZTMR
4.3.1 Effect on Pgp ATPase activity
The effect on Pgp and Pgp-AzTMR ATPase activity of several rhodamine dyes (R-
site drugs) and LDS-751, a potential R-site drug (130), was determined over a range of
drug concentrations. The rhodamines all contain the same aromatic core structure, with
different types and degrees of substitution (Figure 4.1). It is not known whether it is the
core structure or the substituents that are responsible for orienting the drug in a particular
region of the binding pocket. It seems plausible that the substituents would have a role in
providing specific contacts to the protein in addition to the π-π interactions afforded by
the aromatic ring structure. Substrates can inhibit, stimulate, or have a biphasic effect on
Pgp ATPase activity, which could be a result of the particular binding location of that
drug, and the effect that binding has on communication with the NBDs.
The ATPase profile for free AzTMR was determined for both native Pgp and Pgp-
AzTMR (Figure 4.3 A). For Pgp, ATPase activity was stimulated ~20% at concentrations
up to 5 μM and inhibited at higher concentrations, with inhibition reaching ~50% at 200
μM. Low concentrations of AzTMR were slightly stimulatory towards Pgp-AzTMR,
however, it inhibited activity at much lower concentrations than for Pgp. The ATPase
profiles with R101, R110, R123, R6G, and TMR generally showed lower stimulation
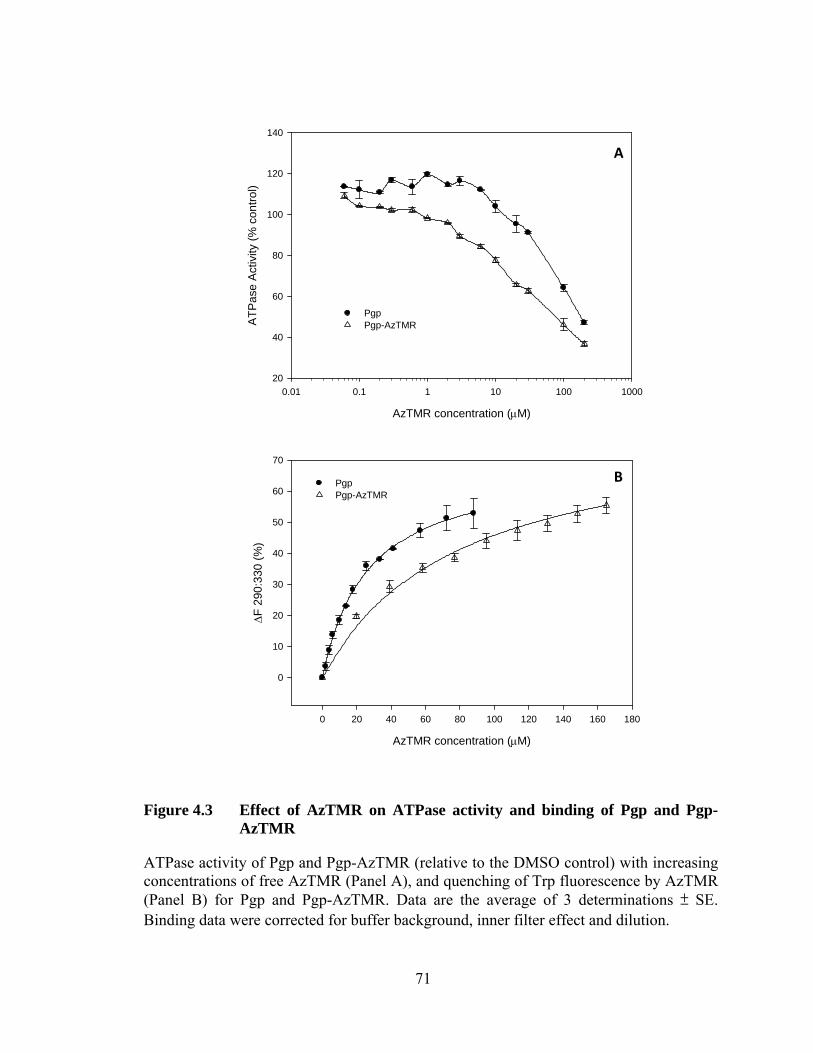
71
AzTMR concentration (μM)
0 20 40 60 80 100 120 140 160 180
ΔF 2
90:3
30 (%
)
0
10
20
30
40
50
60
70
PgpPgp-AzTMR
AzTMR concentration (μM)
0.01 0.1 1 10 100 1000
ATP
ase
Act
ivity
(% c
ontro
l)
20
40
60
80
100
120
140
PgpPgp-AzTMR
Figure 4.3 Effect of AzTMR on ATPase activity and binding of Pgp and Pgp-AzTMR
ATPase activity of Pgp and Pgp-AzTMR (relative to the DMSO control) with increasing concentrations of free AzTMR (Panel A), and quenching of Trp fluorescence by AzTMR (Panel B) for Pgp and Pgp-AzTMR. Data are the average of 3 determinations ± SE. Binding data were corrected for buffer background, inner filter effect and dilution.
A
B
72
levels at low concentrations for Pgp-AzTMR relative to Pgp, however, the overall shape
of the curve and inhibition region were relatively unchanged (see Figure 4.4A for TMR).
Suprisingly, the ATPase profiles of TMR-E and TMR-M were different from those of the
other rhodamines. At the concentrations tested, both TMR-E and TMR-M stimulated
activity, but did not show any inhibition at high concentration (see Figure 4.4B for TMR-
E). For Pgp, LDS-751 was largely stimulatory or had little effect on ATPase activity up
to 300 μM, but inhibited Pgp-AzTMR activity above 1 μM, much like free AzTMR.
4.3.2 Binding affinity of Pgp for R-site drugs
The binding affinities of Pgp and Pgp-AzTMR for the R-site drugs were determined
by measuring the concentration-dependent saturable quenching of intrinsic Trp
fluorescence (λex/λem = 290/330 nm). The rhodamines are all fluorescent, however, they
did not undergo a substantial enhancement or quenching of fluorescence upon binding to
Pgp or Pgp-AzTMR. Initially, drug titrations were completed with Pgp-mock, however,
once it became apparent that there was no significant difference in the binding affinity of
Pgp compared to Pgp-mock, Pgp was used in all subsequent experiments. This is
supported by the findings that UV exposure alone had a negligible impact on Pgp, and
that Pgp-mock exhibited no changes in ATPase activity or fluorescence when compared
to Pgp.
The binding affinities (measured as Kd) of Pgp and Pgp-AzTMR for free AzTMR
were determined to be 26.3 μM and 78.9 μM, respectively (Figure 4.3B), representing a
3-fold decrease in the affinity of Pgp-AzTMR for a second molecule of AzTMR. The
binding curve for several of the rhodamines rose faster and saturated at lower
concentrations for Pgp relative to Pgp-AzTMR; a representative drug from this group was
73
TMR-E concentration (μM)
0.01 0.1 1 10 100 1000
ATP
ase
Act
ivity
(% c
ontro
l)
110
120
130
140
150
160
170
Pgp Pgp-AzTMR
TMR concentration (μM)
0.01 0.1 1 10 100 1000
ATP
ase
Act
ivity
(% c
ontro
l)
40
60
80
100
120
140
160
PgpPgp-AzTMR
Figure 4.4 Effect of TMR and TMR-E on ATPase activity of Pgp and Pgp-AzTMR
ATPase activity of labelled and unlabelled Pgp at concentrations from 0.6 μM to 300 μM TMR (Panel A) and TMR-E (Panel B). The DMSO control was used as the 100% activity control. Data are the average of 3 determinations ± SE.
A
B
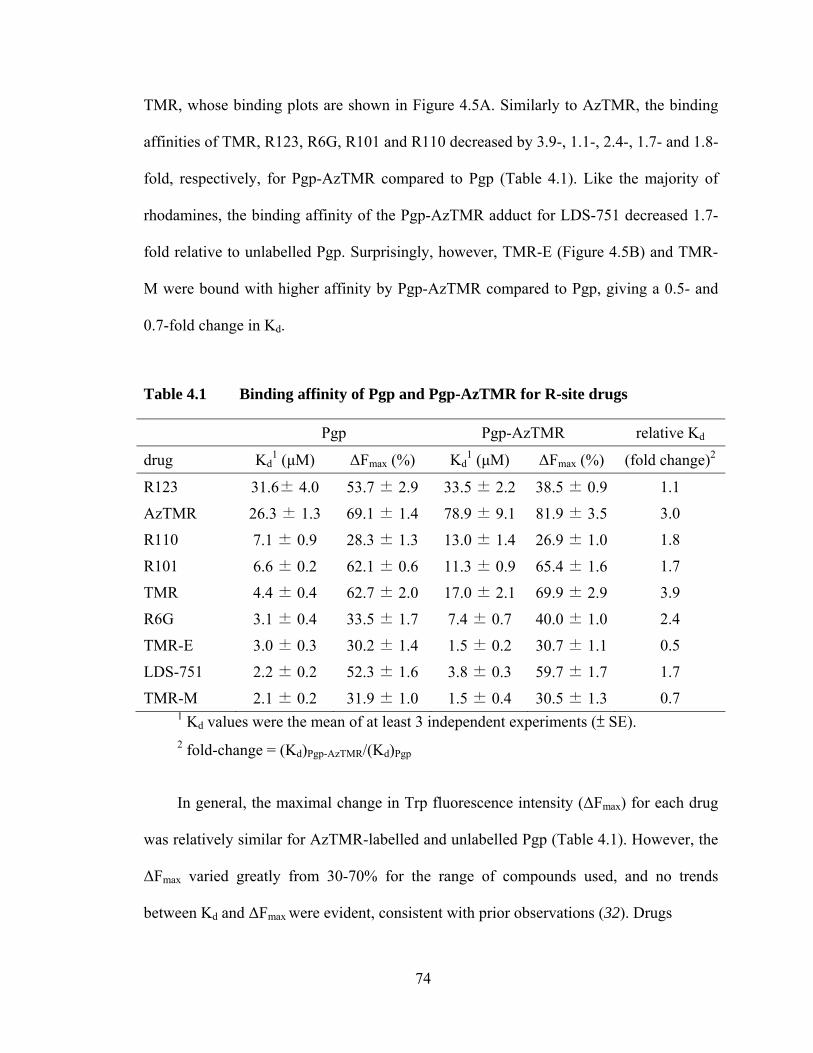
74
TMR, whose binding plots are shown in Figure 4.5A. Similarly to AzTMR, the binding
affinities of TMR, R123, R6G, R101 and R110 decreased by 3.9-, 1.1-, 2.4-, 1.7- and 1.8-
fold, respectively, for Pgp-AzTMR compared to Pgp (Table 4.1). Like the majority of
rhodamines, the binding affinity of the Pgp-AzTMR adduct for LDS-751 decreased 1.7-
fold relative to unlabelled Pgp. Surprisingly, however, TMR-E (Figure 4.5B) and TMR-
M were bound with higher affinity by Pgp-AzTMR compared to Pgp, giving a 0.5- and
0.7-fold change in Kd.
Table 4.1 Binding affinity of Pgp and Pgp-AzTMR for R-site drugs
Pgp Pgp-AzTMR relative Kd
drug Kd1 (μM) ΔFmax (%) Kd
1 (μM) ΔFmax (%) (fold change)2
R123 31.6± 4.0 53.7 ± 2.9 33.5 ± 2.2 38.5 ± 0.9 1.1
AzTMR 26.3 ± 1.3 69.1 ± 1.4 78.9 ± 9.1 81.9 ± 3.5 3.0
R110 7.1 ± 0.9 28.3 ± 1.3 13.0 ± 1.4 26.9 ± 1.0 1.8
R101 6.6 ± 0.2 62.1 ± 0.6 11.3 ± 0.9 65.4 ± 1.6 1.7
TMR 4.4 ± 0.4 62.7 ± 2.0 17.0 ± 2.1 69.9 ± 2.9 3.9
R6G 3.1 ± 0.4 33.5 ± 1.7 7.4 ± 0.7 40.0 ± 1.0 2.4
TMR-E 3.0 ± 0.3 30.2 ± 1.4 1.5 ± 0.2 30.7 ± 1.1 0.5
LDS-751 2.2 ± 0.2 52.3 ± 1.6 3.8 ± 0.3 59.7 ± 1.7 1.7
TMR-M 2.1 ± 0.2 31.9 ± 1.0 1.5 ± 0.4 30.5 ± 1.3 0.7 1 Kd values were the mean of at least 3 independent experiments (± SE). 2 fold-change = (Kd)Pgp-AzTMR/(Kd)Pgp
In general, the maximal change in Trp fluorescence intensity (ΔFmax) for each drug
was relatively similar for AzTMR-labelled and unlabelled Pgp (Table 4.1). However, the
ΔFmax varied greatly from 30-70% for the range of compounds used, and no trends
between Kd and ΔFmax were evident, consistent with prior observations (32). Drugs
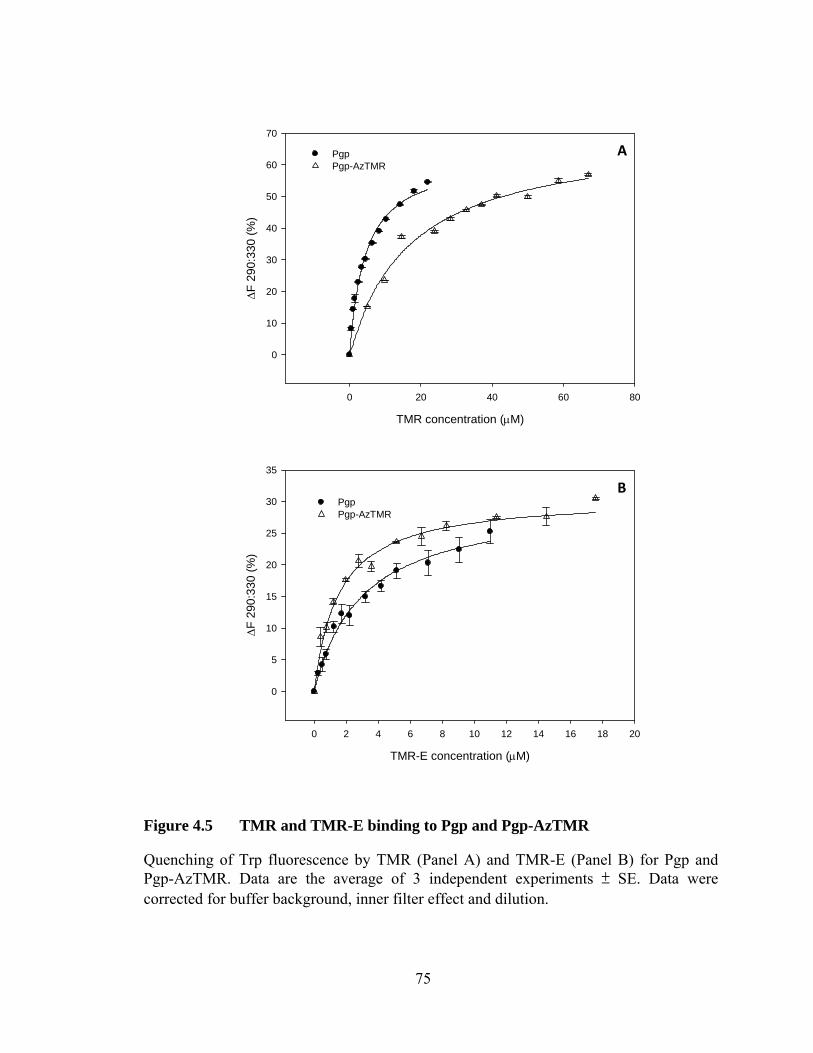
75
TMR concentration (μM)
0 20 40 60 80
Δ F 2
90:3
30 (%
)
0
10
20
30
40
50
60
70
PgpPgp-AzTMR
TMR-E concentration (μM)
0 2 4 6 8 10 12 14 16 18 20
ΔF 2
90:3
30 (%
)
0
5
10
15
20
25
30
35
PgpPgp-AzTMR
Figure 4.5 TMR and TMR-E binding to Pgp and Pgp-AzTMR
Quenching of Trp fluorescence by TMR (Panel A) and TMR-E (Panel B) for Pgp and Pgp-AzTMR. Data are the average of 3 independent experiments ± SE. Data were corrected for buffer background, inner filter effect and dilution.
A
B
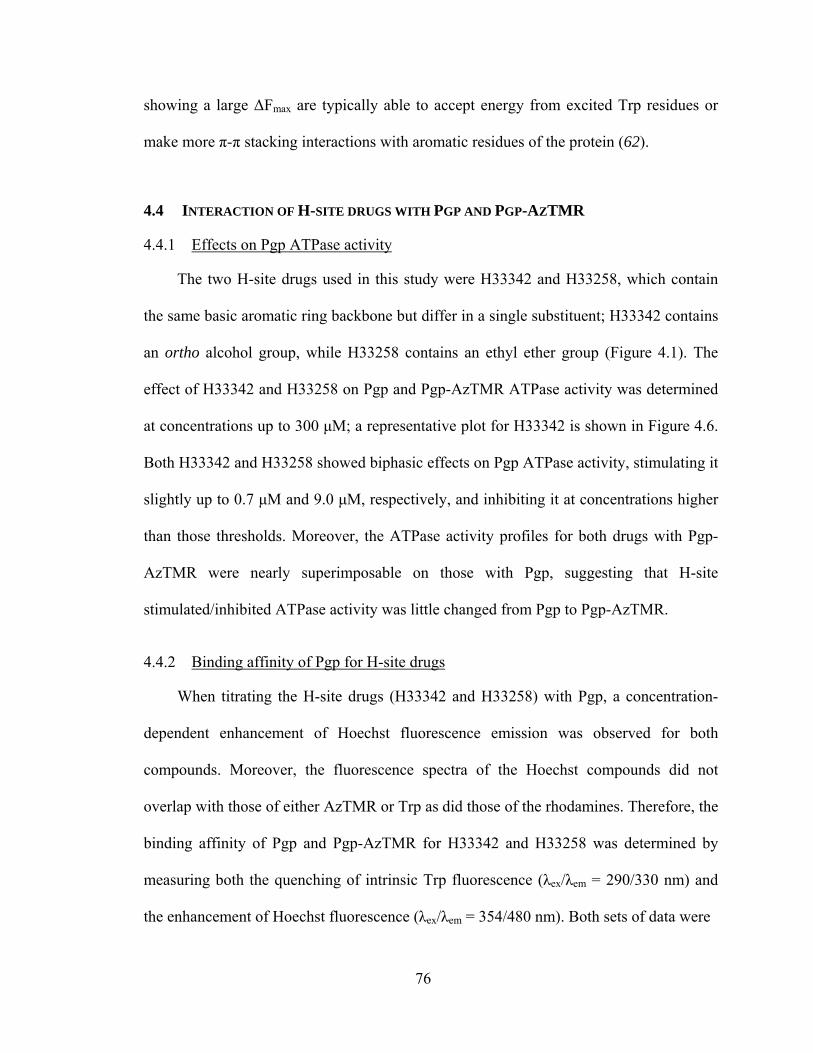
76
showing a large ΔFmax are typically able to accept energy from excited Trp residues or
make more π-π stacking interactions with aromatic residues of the protein (62).
4.4 INTERACTION OF H-SITE DRUGS WITH PGP AND PGP-AZTMR
4.4.1 Effects on Pgp ATPase activity
The two H-site drugs used in this study were H33342 and H33258, which contain
the same basic aromatic ring backbone but differ in a single substituent; H33342 contains
an ortho alcohol group, while H33258 contains an ethyl ether group (Figure 4.1). The
effect of H33342 and H33258 on Pgp and Pgp-AzTMR ATPase activity was determined
at concentrations up to 300 μM; a representative plot for H33342 is shown in Figure 4.6.
Both H33342 and H33258 showed biphasic effects on Pgp ATPase activity, stimulating it
slightly up to 0.7 μM and 9.0 μM, respectively, and inhibiting it at concentrations higher
than those thresholds. Moreover, the ATPase activity profiles for both drugs with Pgp-
AzTMR were nearly superimposable on those with Pgp, suggesting that H-site
stimulated/inhibited ATPase activity was little changed from Pgp to Pgp-AzTMR.
4.4.2 Binding affinity of Pgp for H-site drugs
When titrating the H-site drugs (H33342 and H33258) with Pgp, a concentration-
dependent enhancement of Hoechst fluorescence emission was observed for both
compounds. Moreover, the fluorescence spectra of the Hoechst compounds did not
overlap with those of either AzTMR or Trp as did those of the rhodamines. Therefore, the
binding affinity of Pgp and Pgp-AzTMR for H33342 and H33258 was determined by
measuring both the quenching of intrinsic Trp fluorescence (λex/λem = 290/330 nm) and
the enhancement of Hoechst fluorescence (λex/λem = 354/480 nm). Both sets of data were
77
H33342 concentration (μM)
0.01 0.1 1 10 100 1000
ATP
ase
Act
ivity
(% c
ontro
l)
0
20
40
60
80
100
120
140
PgpPgp-AzTMR
Figure 4.6 Effect of H33342 on ATPase activity of Pgp and Pgp-AzTMR
The ATPase activity of Pgp and Pgp-AzTMR was measured in the presence of various concentrations of H33342 ranging from 0.6 μM to 300 μM. Each data point is the average of triplicate measurements ± SE. The DMSO control was used as the 100% activity control.
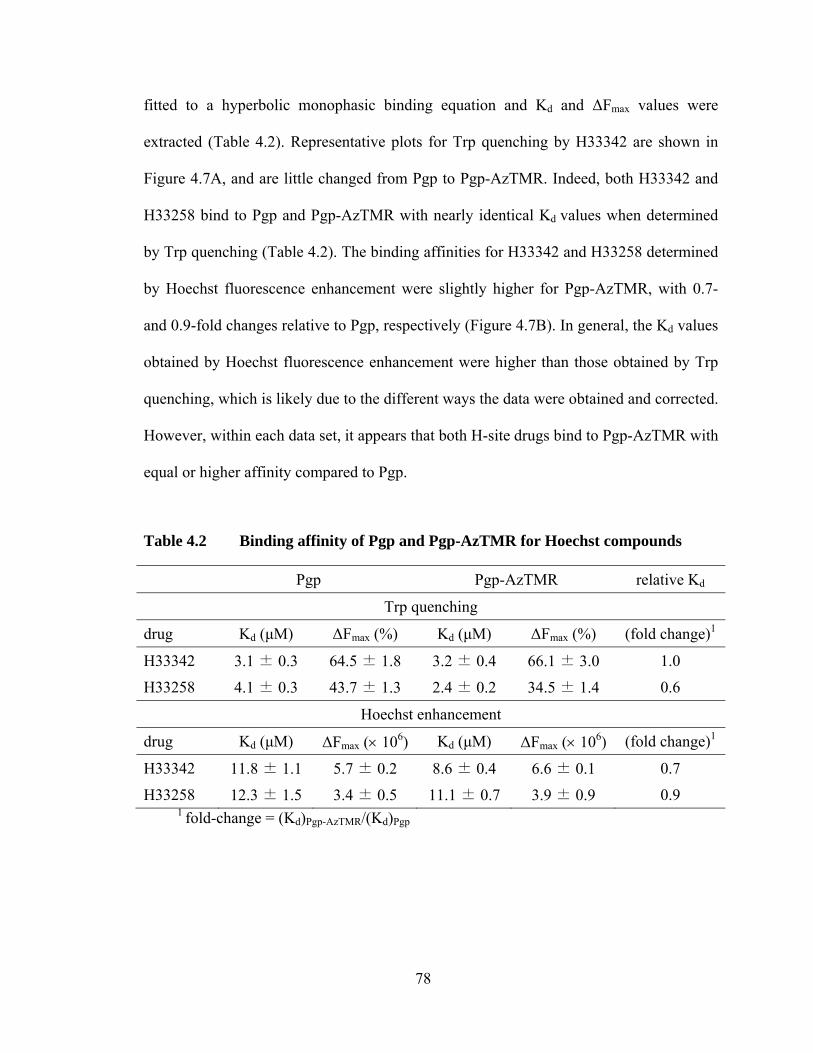
78
fitted to a hyperbolic monophasic binding equation and Kd and ΔFmax values were
extracted (Table 4.2). Representative plots for Trp quenching by H33342 are shown in
Figure 4.7A, and are little changed from Pgp to Pgp-AzTMR. Indeed, both H33342 and
H33258 bind to Pgp and Pgp-AzTMR with nearly identical Kd values when determined
by Trp quenching (Table 4.2). The binding affinities for H33342 and H33258 determined
by Hoechst fluorescence enhancement were slightly higher for Pgp-AzTMR, with 0.7-
and 0.9-fold changes relative to Pgp, respectively (Figure 4.7B). In general, the Kd values
obtained by Hoechst fluorescence enhancement were higher than those obtained by Trp
quenching, which is likely due to the different ways the data were obtained and corrected.
However, within each data set, it appears that both H-site drugs bind to Pgp-AzTMR with
equal or higher affinity compared to Pgp.
Table 4.2 Binding affinity of Pgp and Pgp-AzTMR for Hoechst compounds
Pgp Pgp-AzTMR relative Kd
Trp quenching
drug Kd (μM) ΔFmax (%) Kd (μM) ΔFmax (%) (fold change)1
H33342 3.1 ± 0.3 64.5 ± 1.8 3.2 ± 0.4 66.1 ± 3.0 1.0
H33258 4.1 ± 0.3 43.7 ± 1.3 2.4 ± 0.2 34.5 ± 1.4 0.6
Hoechst enhancement
drug Kd (μM) ΔFmax (× 106) Kd (μM) ΔFmax (× 106) (fold change)1
H33342 11.8 ± 1.1 5.7 ± 0.2 8.6 ± 0.4 6.6 ± 0.1 0.7
H33258 12.3 ± 1.5 3.4 ± 0.5 11.1 ± 0.7 3.9 ± 0.9 0.9 1 fold-change = (Kd)Pgp-AzTMR/(Kd)Pgp
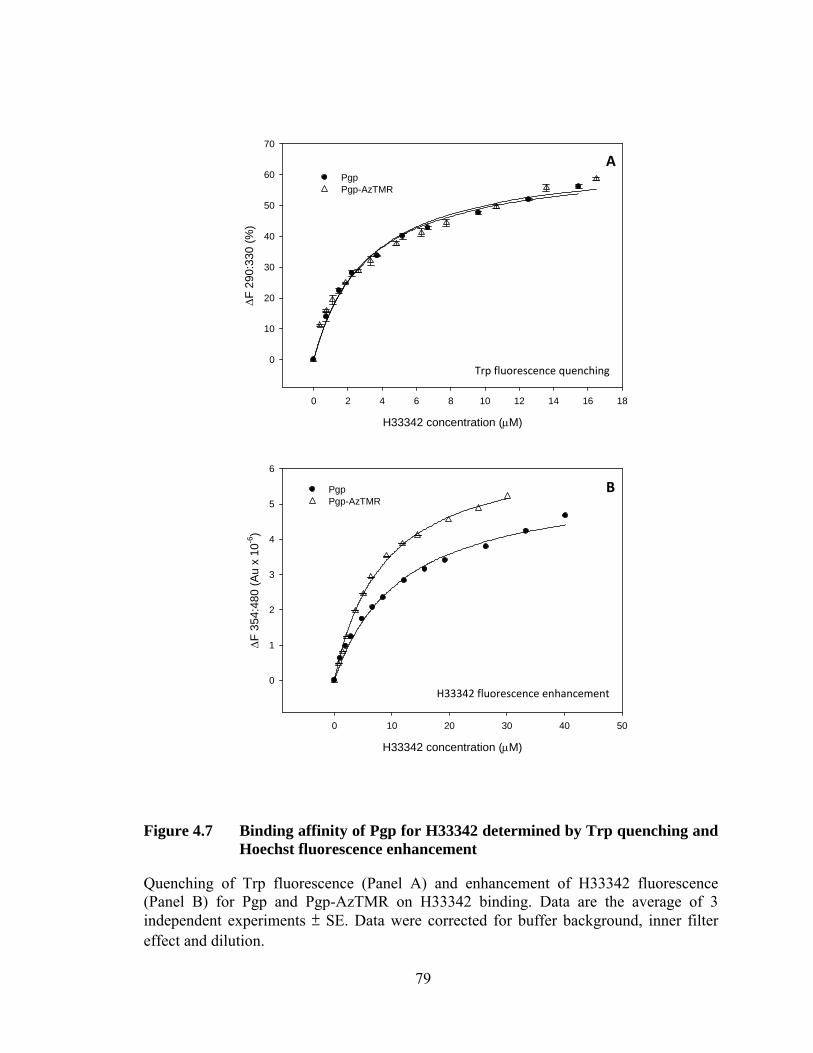
79
H33342 concentration (μM)
0 10 20 30 40 50
Δ F 3
54:4
80 (A
u x
10-6
)
0
1
2
3
4
5
6
PgpPgp-AzTMR
H33342 concentration (μM)
0 2 4 6 8 10 12 14 16 18
Δ F 2
90:3
30 (%
)
0
10
20
30
40
50
60
70
PgpPgp-AzTMR
Figure 4.7 Binding affinity of Pgp for H33342 determined by Trp quenching and Hoechst fluorescence enhancement
Quenching of Trp fluorescence (Panel A) and enhancement of H33342 fluorescence (Panel B) for Pgp and Pgp-AzTMR on H33342 binding. Data are the average of 3 independent experiments ± SE. Data were corrected for buffer background, inner filter effect and dilution.
A
B
Trp fluorescence quenching
H33342 fluorescence enhancement
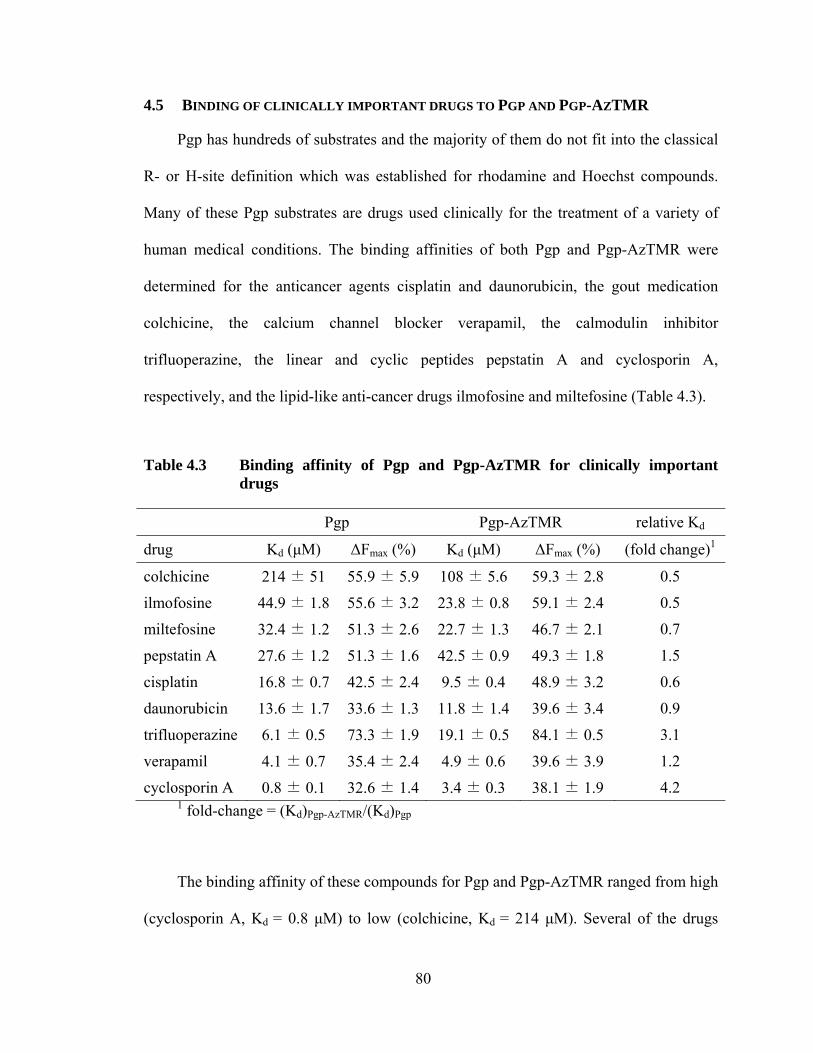
80
4.5 BINDING OF CLINICALLY IMPORTANT DRUGS TO PGP AND PGP-AZTMR
Pgp has hundreds of substrates and the majority of them do not fit into the classical
R- or H-site definition which was established for rhodamine and Hoechst compounds.
Many of these Pgp substrates are drugs used clinically for the treatment of a variety of
human medical conditions. The binding affinities of both Pgp and Pgp-AzTMR were
determined for the anticancer agents cisplatin and daunorubicin, the gout medication
colchicine, the calcium channel blocker verapamil, the calmodulin inhibitor
trifluoperazine, the linear and cyclic peptides pepstatin A and cyclosporin A,
respectively, and the lipid-like anti-cancer drugs ilmofosine and miltefosine (Table 4.3).
Table 4.3 Binding affinity of Pgp and Pgp-AzTMR for clinically important drugs
Pgp Pgp-AzTMR relative Kd
drug Kd (μM) ΔFmax (%) Kd (μM) ΔFmax (%) (fold change)1
colchicine 214 ± 51 55.9 ± 5.9 108 ± 5.6 59.3 ± 2.8 0.5
ilmofosine 44.9 ± 1.8 55.6 ± 3.2 23.8 ± 0.8 59.1 ± 2.4 0.5
miltefosine 32.4 ± 1.2 51.3 ± 2.6 22.7 ± 1.3 46.7 ± 2.1 0.7
pepstatin A 27.6 ± 1.2 51.3 ± 1.6 42.5 ± 0.9 49.3 ± 1.8 1.5
cisplatin 16.8 ± 0.7 42.5 ± 2.4 9.5 ± 0.4 48.9 ± 3.2 0.6
daunorubicin 13.6 ± 1.7 33.6 ± 1.3 11.8 ± 1.4 39.6 ± 3.4 0.9
trifluoperazine 6.1 ± 0.5 73.3 ± 1.9 19.1 ± 0.5 84.1 ± 0.5 3.1
verapamil 4.1 ± 0.7 35.4 ± 2.4 4.9 ± 0.6 39.6 ± 3.9 1.2
cyclosporin A 0.8 ± 0.1 32.6 ± 1.4 3.4 ± 0.3 38.1 ± 1.9 4.2 1 fold-change = (Kd)Pgp-AzTMR/(Kd)Pgp
The binding affinity of these compounds for Pgp and Pgp-AzTMR ranged from high
(cyclosporin A, Kd = 0.8 μM) to low (colchicine, Kd = 214 μM). Several of the drugs
81
(daunorubicin, colchicine, cisplatin, ilmofosine and miltefosine) bound to labelled Pgp
with equal or higher affinity compared to unlabelled Pgp. The others (trifluoperazine,
verapamil, pepstatin A and cyclosporin A) bound with equal or lower affinity to Pgp-
AzTMR relative to unlabelled Pgp.
4.6 PGP-AZTMR DRUG TRANSPORT
In order to determine if crosslinking AzTMR to Pgp had any effect on its ability to
transport drugs, a real-time fluorescence assay was used to measure the drug transport
function of Pgp and Pgp-AzTMR. Both labelled and unlabelled Pgp were reconstituted
into DMPC proteoliposomes at a lipid:protein ratio of approximately 18:1 (w/w). The
reconstitution procedure yielded proteoliposomes which had moderate ATPase activity.
The transport of TMR, H33342 and LDS-751 have all been measured previously using
reconstituted Pgp, however, both TMR and LDS-751 had overlapping fluorescence
properties with AzTMR, making their transport impossible to measure. A 5 μM
concentration of H33342 was used in the transport experiments, as this concentration had
previously been determined as optimal. The H33342 fluorescence (λex/λem = 354/450 nm)
in both Pgp and Pgp-AzTMR proteoliposomes decreased following the addition of ATP
and an ATP regenerating system to initiate transport (Figure 4.8A). This occurs as the
protein pumps the fluorescent drug out of the bilayer into the lumen of the liposome.
Since H33342 fluorescence is high in a membrane environment and low in aqueous
solution, this results in a decrease in fluorescence intensity. In order to show that the
observed decrease in fluorescence was not due to dynamic repartitioning of the drug, a
vanadate control was also carried out. When identical Pgp proteoliposome samples were
trapped in a non-transporting state by the addition of the inhibitor vanadate, no decrease
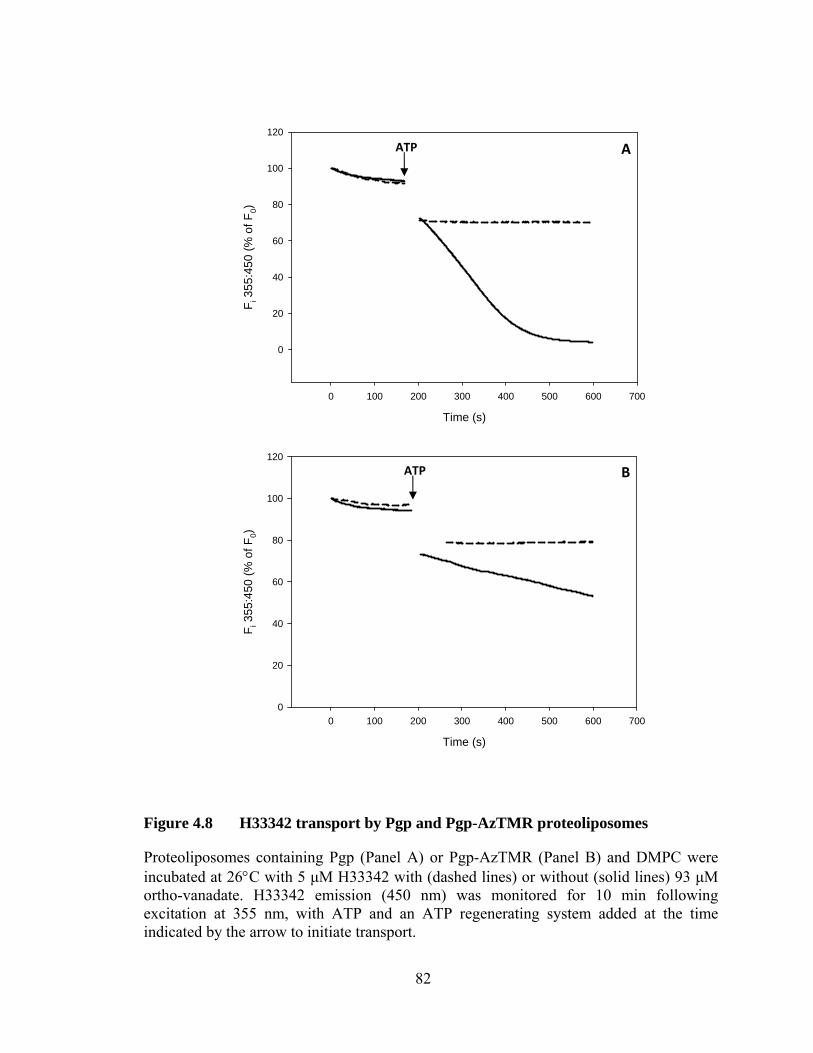
82
Time (s)
0 100 200 300 400 500 600 700
F i 355
:450
(% o
f F0)
0
20
40
60
80
100
120
Time (s)
0 100 200 300 400 500 600 700
F i 355
:450
(% o
f F0)
0
20
40
60
80
100
120
Figure 4.8 H33342 transport by Pgp and Pgp-AzTMR proteoliposomes
Proteoliposomes containing Pgp (Panel A) or Pgp-AzTMR (Panel B) and DMPC were incubated at 26°C with 5 μM H33342 with (dashed lines) or without (solid lines) 93 μM ortho-vanadate. H33342 emission (450 nm) was monitored for 10 min following excitation at 355 nm, with ATP and an ATP regenerating system added at the time indicated by the arrow to initiate transport.
A
B
ATP
ATP
83
in H33342 fluorescence was observed (Figure 4.8B). The initial rate of drug transport (%
change in fluorescence intensity/s) was measured for H33342 transport by both Pgp and
Pgp-AzTMR by taking the line slope for the first 20 s following the addition of ATP. The
data were corrected for the vanadate control and protein concentration (Section 2.6.2), as
the Pgp-containing liposomes had a slightly higher protein concentration than those of
Pgp-AzTMR. The initial transport rates for unlabelled and labelled Pgp were 5.84 × 10⁵
and 1.94 × 10⁵ Au·s-1·mg-1, respectively, representing a 3-fold faster rate of transport for
Pgp compared to Pgp-AzTMR.
4.7 DISCUSSION
Previous work on the substrate binding pocket of Pgp revealed that drugs bind to
Pgp within the cytoplasmic leaflet of the membrane. Fluorescence studies with the Pgp
substrate, LDS-751, indicated that it binds with high affinity to a site that is relatively
hydrophobic, with a polarity lower than that of chloroform (76). This is supported by the
observation that many Pgp substrates are large non-polar/amphipathic molecules which
are thought to interact with the protein via hydrophobic and van der Waals interactions.
In the present study, a polarizability value was calculated for the AzTMR binding site
from the measured Stokes shift that was similar to that of propanol. This is consistent
with the relatively small blue shift seen for AzTMR compared to the larger blue shift
observed for another Pgp substrate (76). Therefore, it appears that the binding location of
AzTMR in Pgp is less polar than water, however, it is less hydrophobic than that of other
drugs, likely reflecting the unique nature of each binding site.
84
The majority of drugs tested had a biphasic effect on Pgp ATPase activity,
stimulating it up to a certain concentration and inhibiting it at higher concentrations.
However, while TMR-E and TMR-M stimulated Pgp ATPase activity at low
concentrations like the other rhodamines, they did not show inhibition at higher
concentrations. Both AzTMR and LDS-751 were more inhibitory towards Pgp-AzTMR
at low concentrations compared to unlabelled Pgp, but for the other drugs (both R-site
and H-site) there was little change in the ATPase profiles of labelled and unlabelled Pgp.
Thus, AzTMR crosslinking to Pgp does not appear to affect the way drug-induced
conformational changes are transmitted to the NBDs.
It is generally accepted that Pgp can bind more than one substrate simultaneously. In
this chapter, the binding of a second R-site, H-site, or other drug was quantified by
estimating a Kd value for binding of each drug to Pgp-AzTMR and comparing it with
binding to unlabelled Pgp. The majority of rhodamines (TMR, AzTMR, R123, R6G,
R101, and R110) bound to Pgp-AzTMR with lower affinity than Pgp, indicating that they
likely bind close to the site where AzTMR is linked. Taken together, these data indicate
that AzTMR is very likely covalently crosslinked to the R-site of Pgp. Unexpectedly, the
structurally similar compounds, TMR-M and TMR-E, actually bound to Pgp-AzTMR
with higher affinity than Pgp, suggesting they may not bind to the same site as the other
rhodamines. The effect of these compounds on ATPase activity was also unusual, and it
is possible that the methyl- and ethyl-ester groups of these rhodamines (Figure 4.1) result
in them binding to a different sub-site. The binding to Pgp-AzTMR of LDS-751, which
was previously identified as an R-site drug (130), was consistent with the majority of
rhodamines, in that it bound with lower affinity to Pgp-AzTMR, which is in agreement
85
with earlier observations from our lab (54). However, unpublished transport data from
our lab (Balpreet Vinepal, 2008, M.Sc. thesis, University of Guelph) indicated that LDS-
751 competes for transport of both TMR and H33342, indicating that it likely binds to
both the H-site and the R-site.
While there was a 3- to 4-fold difference in the Kd values obtained through intrinsic
Trp fluorescence quenching or enhancement of bound Hoechst fluorescence, the trends
seen for binding to labelled and unlabelled Pgp were similar. For Trp quenching, H33342
and H33258 bound to Pgp-AzTMR with similar and higher affinity, respectively. When
determined by ligand fluorescence enhancement, both Hoechst drugs had a higher affinity
for Pgp-AzTMR. These findings suggest that binding of AzTMR does not affect the
binding of the Hoechst molecules, which is expected, since they likely interact with the
H-site.
The finding that a majority of R-site drugs bound to Pgp-AzTMR with lower
affinity suggests steric interference with binding. Since both H-site drugs bind with
higher affinity, covalent linkage of AzTMR to the R-site may induce slight
conformational changes in Pgp that encourage binding of these compounds. In a previous
study, R-site drugs were found to stimulate the transport of H-site drugs (and vice versa),
while two R- or H-site drug inhibited each others transport, consistent with the binding
data (127).
The binding affinities of Pgp and Pgp-AzTMR for several clinically important drugs
were determined. Some of the compounds bound to Pgp-AzTMR with higher affinity,
and some with lower affinity, indicating that the presence of crosslinked AzTMR affected
the binding of most of them. Because of the range in size and structure of the drugs
86
tested, they may bind to different sub-sites in the Pgp binding pocket. Importantly, all of
the compounds were able to bind to labelled Pgp, proving that they are capable of binding
even in the presence of linked AzTMR.
Both Pgp and Pgp-AzTMR were successfully reconstituted into DMPC
proteoliposomes which were able to transport H33342. The initial rate of transport
measured for Pgp-AzTMR was 3-fold lower than that observed for Pgp, indicating that it
clearly retains significant activity after the crosslinking process. The presence of cross-
linked TMR could lead to partial steric blocking of the transport pathway for H33342. It
is possible, but unlikely, as Pgp-AzTMR retained ATPase activity, that the decrease in
drug transport was due to irreversible damage caused by crosslinking. In addition, as
several batches of Pgp-AzTMR were combined and concentrated prior to reconstitution,
it is possible that AzTMR labelling of one or more of the batches was incomplete, so that
residual transport activity arises from unlabelled Pgp. Recently, Chiba and coworkers
identified two pseudosymmetric solute transport pathways in Pgp by site-directed
mutagenesis of residues lining the translocation pocket (148). Moreover, they showed
that Pgp substrates selectively, but not exclusively, use one of these pathways over the
other. It is possible that covalent linkage of AzTMR to Pgp blocks the R-selective
pathway but does not affect the ability of the H-selective pathway to function normally.
Perhaps the coupling of communication between the TMDs and NBDs is also altered as a
result of having a permanent occupant in the drug binding site.
87
Chapter 5
BINDING OF DRUG MONOMERS AND DIMERS TO
PGP/PGP-AZTMR AND EFFECTS ON ATPASE
ACTIVITY
88
5.1 INTRODUCTION
Pgp affects the uptake, distribution and bioavailability of clinically administered
drugs. A major contributor to MDR in human cancer, Pgp also prevents entry of
therapeutic drugs into the brain, and has become a highly sought after drug target (18;21).
Pgp reversal agents, or modulators, block Pgp-mediated function by binding to the
protein themselves, and/or overwhelming the transporter in a futile transport cycle.
However, the lack of efficacy of third generation modulators in clinical trials has cast
serious doubt on their usefulness in reversing MDR in cancer treatment (21;26;149). Pgp
modulators may still be useful in enhancing drug delivery to the brain, which is a major
problem in treating diseases such as HIV, Parkinson’s disease, and epilepsy (131).
A relatively new concept in the rational design of Pgp modulation has been the
development of bivalent Pgp inhibitors (150;151). These compounds were developed
based on existing evidence that Pgp can simultaneously bind two substrates (54;55). It
was proposed that polyvalent modulators would bind more tightly to Pgp and thus be
more effective at inhibiting its action (150). Early work with dimers of the insecticide
stipiamide provided some clues as to the size and structure of the Pgp binding pocket
(150). Dimers with different tether lengths of the antiprotozoal emetine, the antiretroviral
abacavir, the antimalarial quinine and the antipsychotic quetiapine (Figure 5.1) have all
been developed, and are in various stages of testing with Pgp (132;152). Using several
emetine dimers of different lengths, an optimum distance of 10 Å between the
monomeric halves was needed to inhibit R123 transport with an IC50 of 2.9 μM, and only
5 nM was needed to inhibit [125I]-iodoarylazidoprazosin (IAAP) labelling by 50% (152).
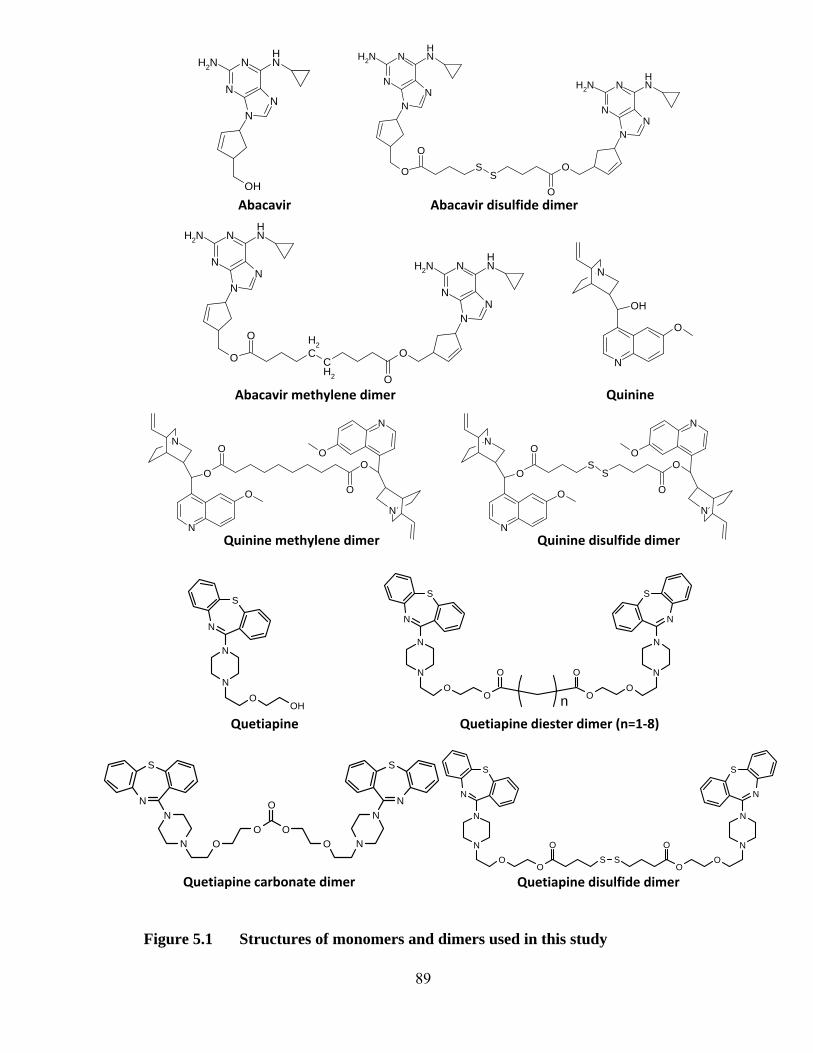
89
Figure 5.1 Structures of monomers and dimers used in this study
N
N
ON
N
O
O
OO
O
N
N
ON
N
O
OS
S
OO
O
N
N
NN
NH
NH2N
N
NN
NH
NH2
O CH2
O
CH2
O
O
N
N
O
OH
N
N
S
N
OO
O
N
N
S
N
OO
O
n
N
N
S
N
OOH
Abacavir Abacavir disulfide dimer
Abacavir methylene dimer Quinine
Quinine methylene dimer Quinine disulfide dimer
Quetiapine Quetiapine diester dimer (n=1‐8)
Quetiapine carbonate dimer Quetiapine disulfide dimer
N
N
S
N
OO
O
N
N
S
N
OO
OS S
N
N
S
N
OO
N
N
S
N
OO
O
N
N
NN
NH
NH2N
N
NN
NH
NH2
O SO
SO
O
N
N
NN
NH
NH2
OH
90
Moreover, one of he emetine dimers was found to reverse the MDR phenotype of MCF-
7/DX1 cells when co-administered with doxorubicin.
Subsequent versions of quinine and quetiapine drug dimers were specifically
designed to have a tether with a built-in clearance mechanism, and contained reversible
ester bonds or disulfide linkages that can be broken down in tissues. Quinine is a known
Pgp modulator and the quinine methylene dimer was found to be a potent inhibitor of
R123 efflux from cultured cancer cell lines, with an IC50 of 1.7 μM. Furthermore, quinine
methylene dimer inhibited the transport of several fluorescent and radiolabelled Pgp
substrates and, like the emetine dimers, prevented [125I]-IAAP labelling of Pgp (132).
Similar studies with the antipsychotic drug quetiapine and several dimers with different
tether lengths are currently under way.
A major problem in the drug treatment of medical conditions affecting the CNS is
the penetration of these agents across the BBB. The eradication of HIV reservoirs in the
brain is difficult, as many HIV protease inhibitors are Pgp substrates and are removed
before they accumulate. A recent study, using reversible prodrug dimers of the
antiretroviral agent abacavir, found that not only did these agents block their own efflux
by Pgp, they were also converted to the monomeric (and therapeutic) form upon entering
the cell (131). This strategy may be useful for other therapies which have limited CNS
penetration due to Pgp.
The majority of experiments with these drug dimers were conducted with cultured
cells, or crude membrane vesicles expressing Pgp, limiting the amount of information
that could be obtained. Therefore, the study of these dimeric compounds in simpler
systems is necessary to characterize their interactions with Pgp at the molecular level.
91
These drug dimers are useful probes to explore the size and binding capacity of the
substrate-binding pocket of Pgp, especially when combined with the Pgp-AzTMR adduct.
For example, if a large drug dimer is still able to bind to Pgp-AzTMR, this would indicate
that the substrate binding pocket is large enough to accommodate three drug moieties.
In the current study, monomers and dimers of abacavir, quinine and quetiapine
(Figure 5.1) were tested for Pgp binding and their effect on Pgp ATPase activity. The
direct measurement of the binding affinity of Pgp for these compounds is useful in
evaluating their overall performance as potential modulators, and in the design of more
effective agents. In addition, the use of these compounds combined with the Pgp-AzTMR
adduct can provide some important information on the size of the substrate-binding
pocket, and its ability to accommodate multiple drug units.
5.2 ABACAVIR MONOMER AND DIMERS
5.2.1 Binding affinity of Pgp and Pgp-AzTMR for abacavirs
The binding affinities of Pgp and Pgp-AzTMR for abacavir and two of its dimers,
abacavir disulfide dimer and abacavir methylene dimer (Figure 5.2), were determined by
measuring the intrinsic Trp quenching (λex/λem = 290/330 nm) of the two proteins. Figure
5.2A shows that both dimers quenched the intrinsic Trp fluorescence of Pgp to a similar
extent as the monomer, but at much lower concentrations. For Pgp, the estimated Kd
values for the disulfide and methylene dimers were much lower than the Kd value for the
monomer, while the maximum quenching for each (ΔFmax) was similar at ~20% (Table
5.1). Thus, abacavir disulfide and methylene dimers bind to Pgp with 6- to 8-fold higher
affinity than the abacavir monomer, likely the result of an increased number of contacts
with the protein side chains in the binding pocket, and more van der Waals interactions.
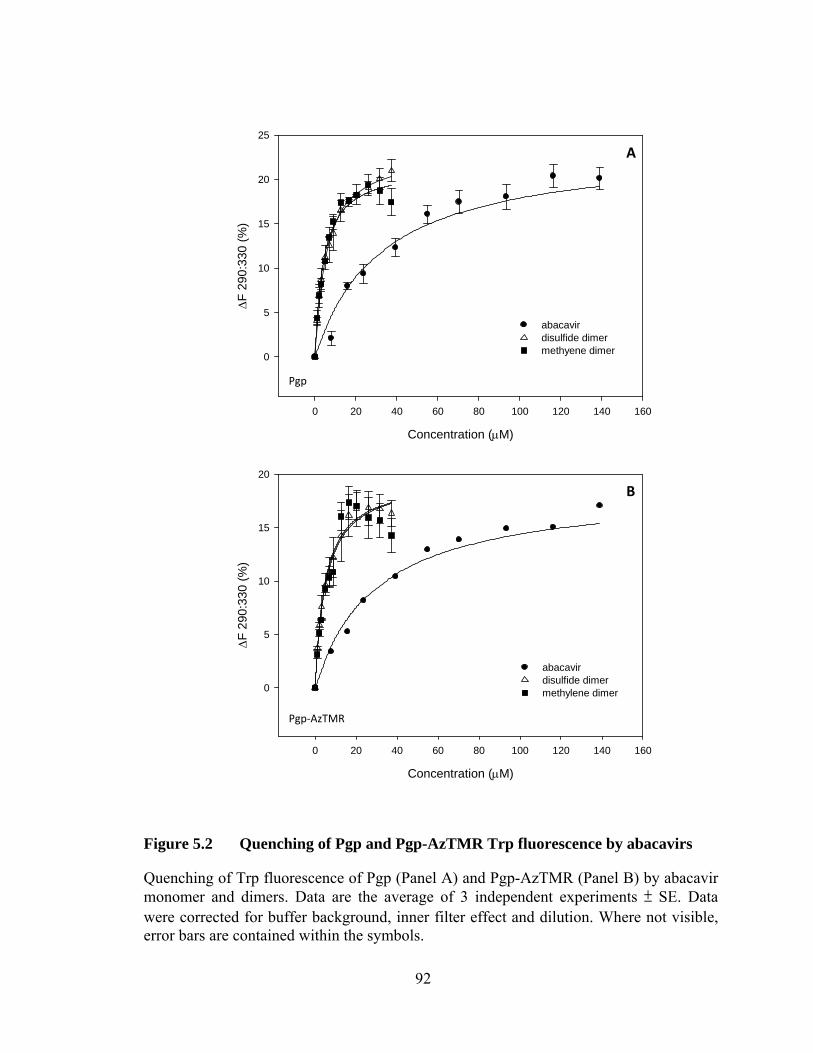
92
Concentration (μM)
0 20 40 60 80 100 120 140 160
ΔF
290:
330
(%)
0
5
10
15
20
abacavirdisulfide dimermethylene dimer
Concentration (μM)
0 20 40 60 80 100 120 140 160
ΔF
290:
330
(%)
0
5
10
15
20
25
abacavirdisulfide dimermethyene dimer
Figure 5.2 Quenching of Pgp and Pgp-AzTMR Trp fluorescence by abacavirs
Quenching of Trp fluorescence of Pgp (Panel A) and Pgp-AzTMR (Panel B) by abacavir monomer and dimers. Data are the average of 3 independent experiments ± SE. Data were corrected for buffer background, inner filter effect and dilution. Where not visible, error bars are contained within the symbols.
A
B
Pgp
Pgp‐AzTMR
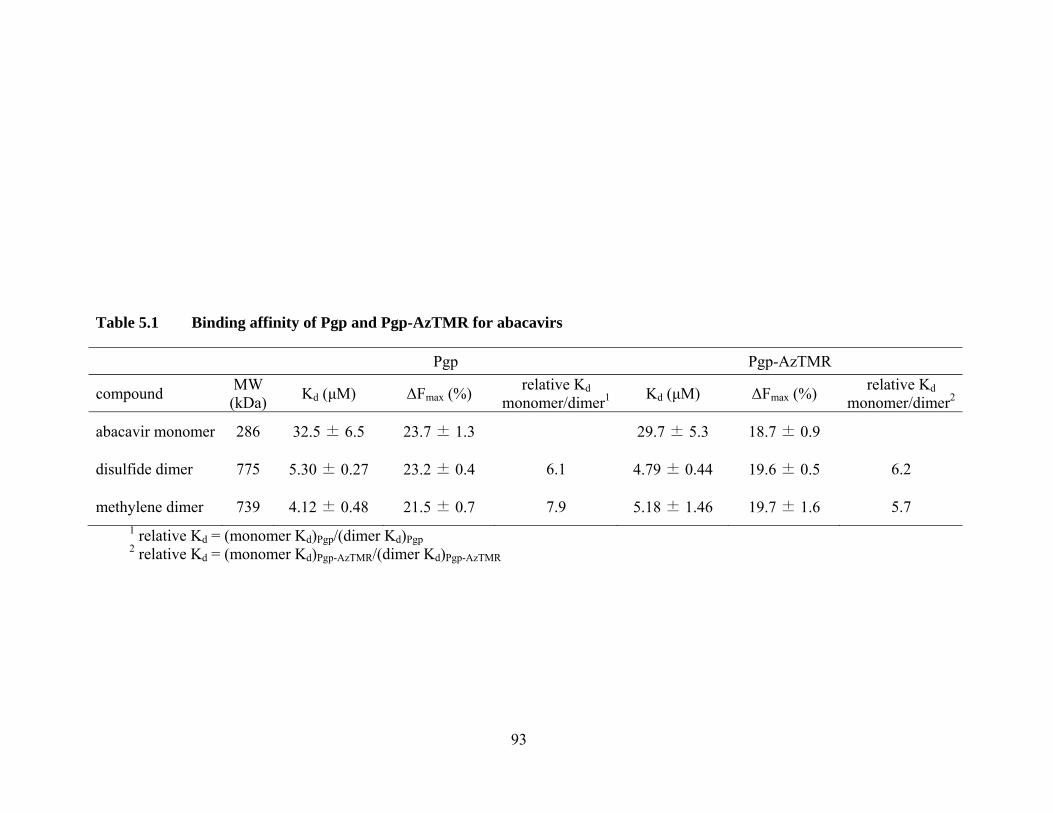
93
Table 5.1 Binding affinity of Pgp and Pgp-AzTMR for abacavirs
Pgp Pgp-AzTMR
compound MW (kDa) Kd (μM) ΔFmax (%) relative Kd
monomer/dimer1 Kd (μM) ΔFmax (%) relative Kd monomer/dimer2
abacavir monomer 286 32.5 ± 6.5 23.7 ± 1.3 29.7 ± 5.3 18.7 ± 0.9
disulfide dimer 775 5.30 ± 0.27 23.2 ± 0.4 6.1 4.79 ± 0.44 19.6 ± 0.5 6.2
methylene dimer 739 4.12 ± 0.48 21.5 ± 0.7 7.9 5.18 ± 1.46 19.7 ± 1.6 5.7 1 relative Kd = (monomer Kd)Pgp/(dimer Kd)Pgp 2 relative Kd = (monomer Kd)Pgp-AzTMR/(dimer Kd)Pgp-AzTMR
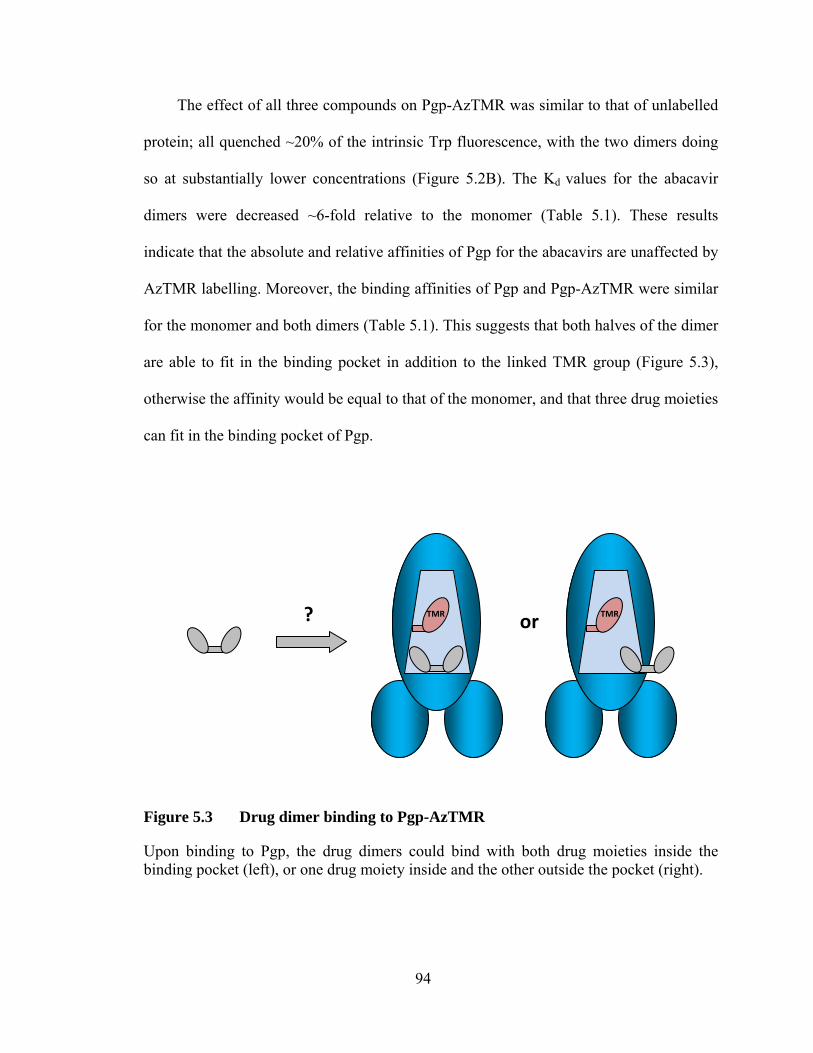
94
The effect of all three compounds on Pgp-AzTMR was similar to that of unlabelled
protein; all quenched ~20% of the intrinsic Trp fluorescence, with the two dimers doing
so at substantially lower concentrations (Figure 5.2B). The Kd values for the abacavir
dimers were decreased ~6-fold relative to the monomer (Table 5.1). These results
indicate that the absolute and relative affinities of Pgp for the abacavirs are unaffected by
AzTMR labelling. Moreover, the binding affinities of Pgp and Pgp-AzTMR were similar
for the monomer and both dimers (Table 5.1). This suggests that both halves of the dimer
are able to fit in the binding pocket in addition to the linked TMR group (Figure 5.3),
otherwise the affinity would be equal to that of the monomer, and that three drug moieties
can fit in the binding pocket of Pgp.
Figure 5.3 Drug dimer binding to Pgp-AzTMR
Upon binding to Pgp, the drug dimers could bind with both drug moieties inside the binding pocket (left), or one drug moiety inside and the other outside the pocket (right).
? TMR TMR or
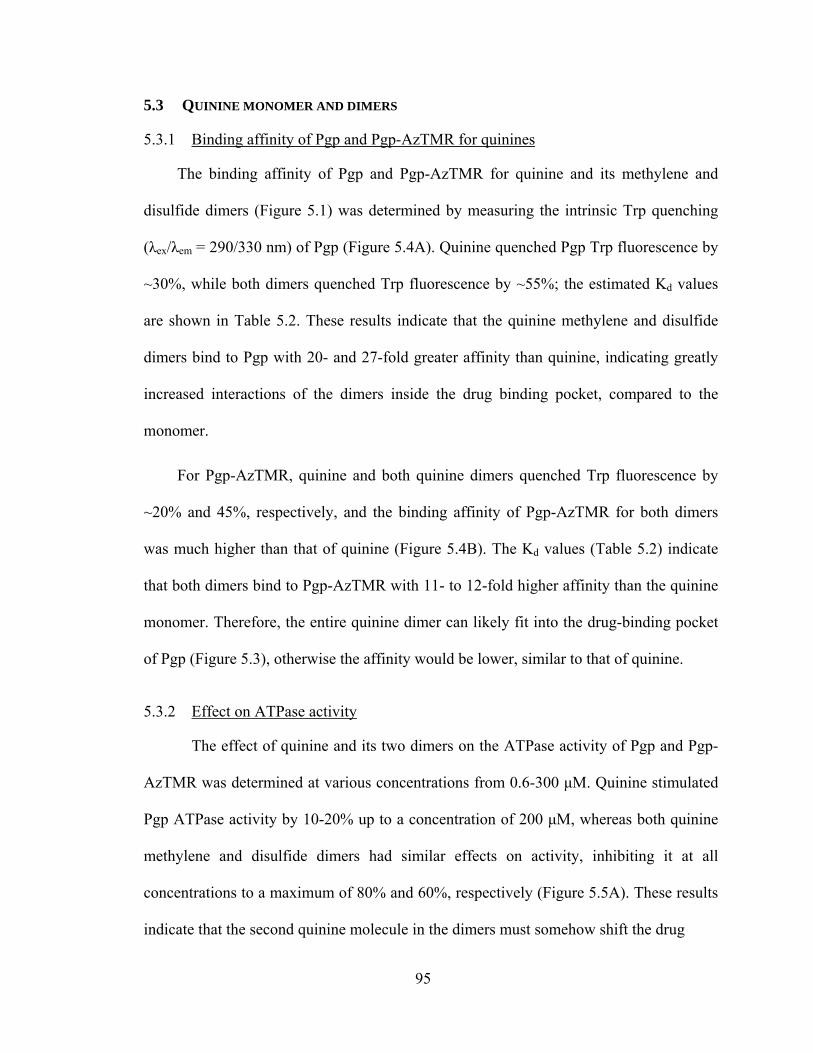
95
5.3 QUININE MONOMER AND DIMERS
5.3.1 Binding affinity of Pgp and Pgp-AzTMR for quinines
The binding affinity of Pgp and Pgp-AzTMR for quinine and its methylene and
disulfide dimers (Figure 5.1) was determined by measuring the intrinsic Trp quenching
(λex/λem = 290/330 nm) of Pgp (Figure 5.4A). Quinine quenched Pgp Trp fluorescence by
~30%, while both dimers quenched Trp fluorescence by ~55%; the estimated Kd values
are shown in Table 5.2. These results indicate that the quinine methylene and disulfide
dimers bind to Pgp with 20- and 27-fold greater affinity than quinine, indicating greatly
increased interactions of the dimers inside the drug binding pocket, compared to the
monomer.
For Pgp-AzTMR, quinine and both quinine dimers quenched Trp fluorescence by
~20% and 45%, respectively, and the binding affinity of Pgp-AzTMR for both dimers
was much higher than that of quinine (Figure 5.4B). The Kd values (Table 5.2) indicate
that both dimers bind to Pgp-AzTMR with 11- to 12-fold higher affinity than the quinine
monomer. Therefore, the entire quinine dimer can likely fit into the drug-binding pocket
of Pgp (Figure 5.3), otherwise the affinity would be lower, similar to that of quinine.
5.3.2 Effect on ATPase activity
The effect of quinine and its two dimers on the ATPase activity of Pgp and Pgp-
AzTMR was determined at various concentrations from 0.6-300 μM. Quinine stimulated
Pgp ATPase activity by 10-20% up to a concentration of 200 μM, whereas both quinine
methylene and disulfide dimers had similar effects on activity, inhibiting it at all
concentrations to a maximum of 80% and 60%, respectively (Figure 5.5A). These results
indicate that the second quinine molecule in the dimers must somehow shift the drug
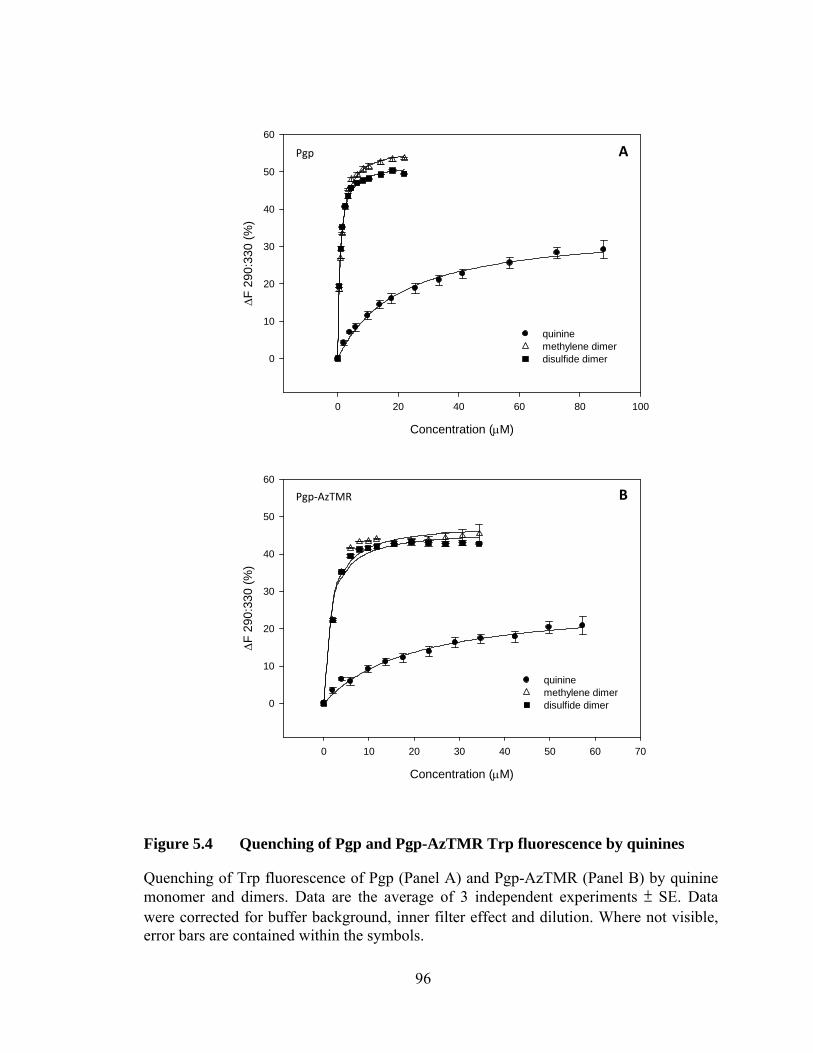
96
Concentration (μM)
0 10 20 30 40 50 60 70
ΔF 2
90:3
30 (%
)
0
10
20
30
40
50
60
quininemethylene dimerdisulfide dimer
Concentration (μM)
0 20 40 60 80 100
ΔF 2
90:3
30 (%
)
0
10
20
30
40
50
60
quininemethylene dimerdisulfide dimer
Figure 5.4 Quenching of Pgp and Pgp-AzTMR Trp fluorescence by quinines
Quenching of Trp fluorescence of Pgp (Panel A) and Pgp-AzTMR (Panel B) by quinine monomer and dimers. Data are the average of 3 independent experiments ± SE. Data were corrected for buffer background, inner filter effect and dilution. Where not visible, error bars are contained within the symbols.
B
A Pgp
Pgp‐AzTMR
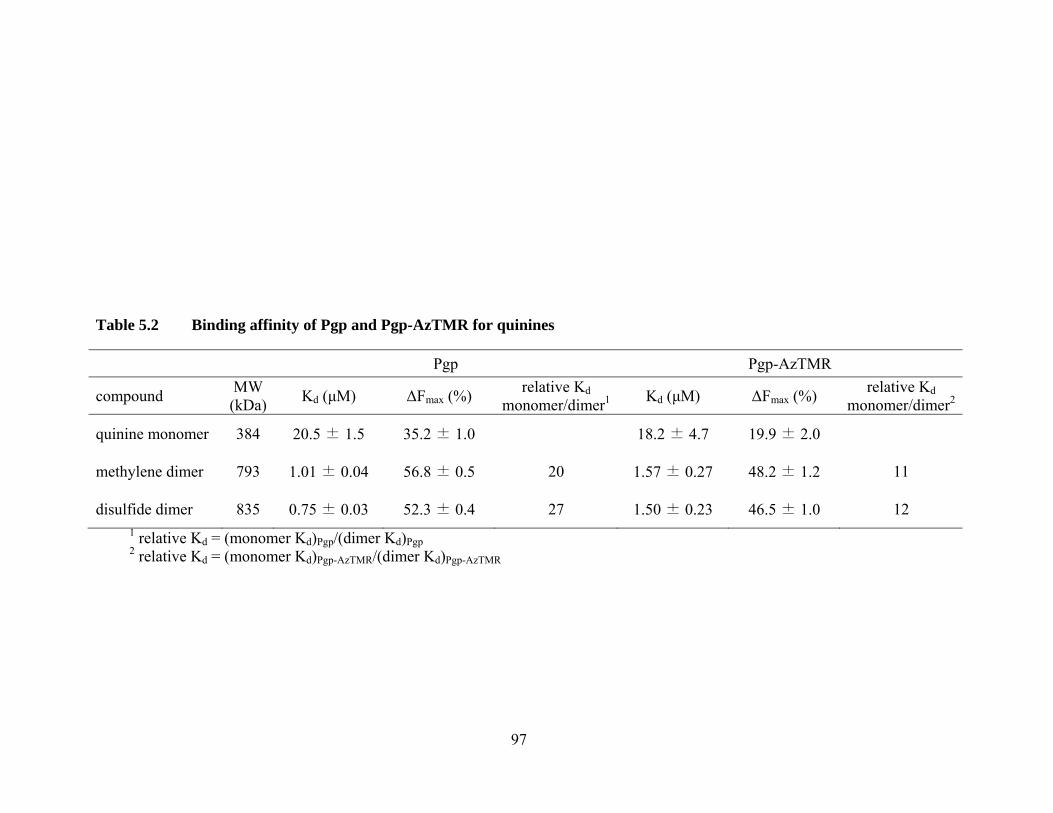
97
Table 5.2 Binding affinity of Pgp and Pgp-AzTMR for quinines
Pgp Pgp-AzTMR
compound MW (kDa) Kd (μM) ΔFmax (%) relative Kd
monomer/dimer1 Kd (μM) ΔFmax (%) relative Kd monomer/dimer2
quinine monomer 384 20.5 ± 1.5 35.2 ± 1.0 18.2 ± 4.7 19.9 ± 2.0
methylene dimer 793 1.01 ± 0.04 56.8 ± 0.5 20 1.57 ± 0.27 48.2 ± 1.2 11
disulfide dimer 835 0.75 ± 0.03 52.3 ± 0.4 27 1.50 ± 0.23 46.5 ± 1.0 12 1 relative Kd = (monomer Kd)Pgp/(dimer Kd)Pgp 2 relative Kd = (monomer Kd)Pgp-AzTMR/(dimer Kd)Pgp-AzTMR
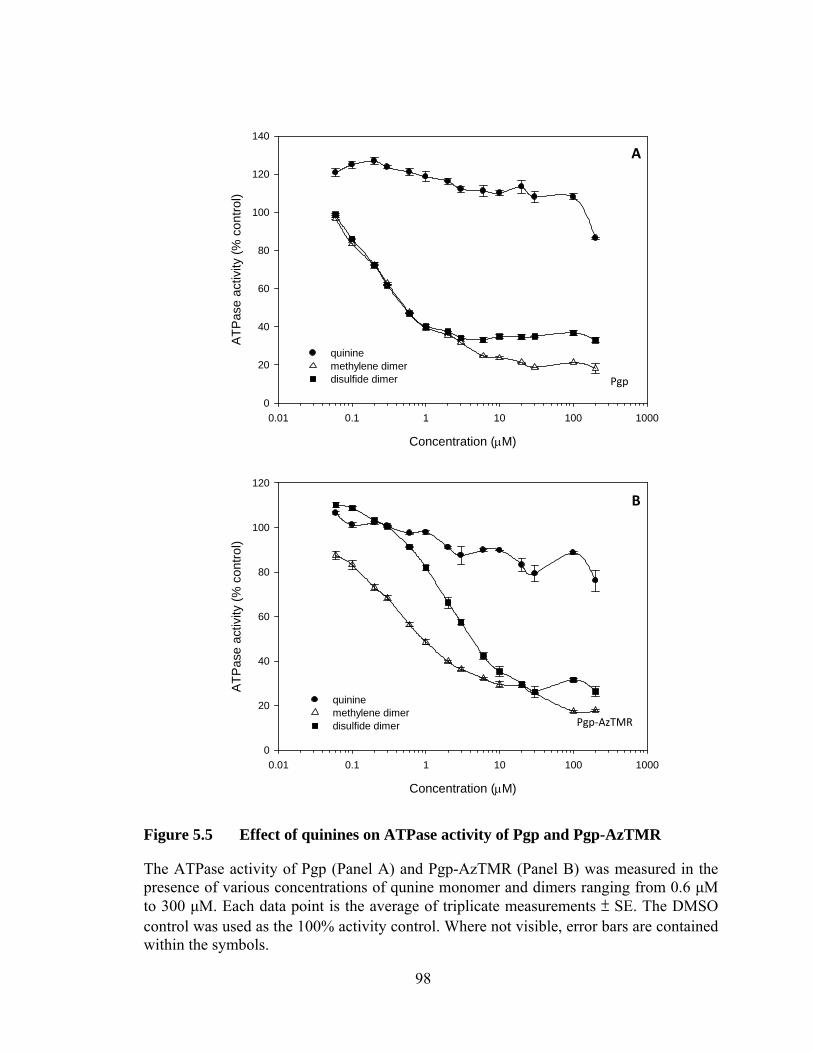
98
Concentration (μM)
0.01 0.1 1 10 100 1000
ATP
ase
activ
ity (%
con
trol)
0
20
40
60
80
100
120
140
quininemethylene dimerdisulfide dimer
Concentration (μM)
0.01 0.1 1 10 100 1000
ATP
ase
activ
ity (%
con
trol)
0
20
40
60
80
100
120
quininemethylene dimerdisulfide dimer
Figure 5.5 Effect of quinines on ATPase activity of Pgp and Pgp-AzTMR
The ATPase activity of Pgp (Panel A) and Pgp-AzTMR (Panel B) was measured in the presence of various concentrations of qunine monomer and dimers ranging from 0.6 μM to 300 μM. Each data point is the average of triplicate measurements ± SE. The DMSO control was used as the 100% activity control. Where not visible, error bars are contained within the symbols.
A
B
Pgp
Pgp‐AzTMR
99
from stimulating to inhibiting the ATPase activity of Pgp, suggesting a fundamental
difference in drug coupling between the binding pocket and NBDs for the monomer and
dimers. The effect of all three molecules on the ATPase activity of Pgp-AzTMR was
similar to that of Pgp (Figure 5.5B), suggesting that crosslinking AzTMR in the binding
pocket of Pgp does not greatly affect the coupling between the drug binding site and the
NBDs. Quinine caused little stimulation of ATPase activity for both Pgp and Pgp-
AzTMR, and inhibition levels were low (< 20%) at the highest concentration tested. Both
quinine dimers inhibited Pgp and Pgp-AzTMR activity to a much greater extent, up to
80% at high concentrations, and did not stimulate activity at low concentrations.
5.4 QUETIAPINE MONOMER AND DIMERS
5.4.1 Binding affinity of Pgp and Pgp-AzTMR for quetiapines
The binding affinities of Pgp and Pgp-AzTMR for the quetiapine monomer, its
disulfide, methylene (C2-Me2) and carbonate dimers and eight diester dimers (C1 to C8)
(Figure 5.1) were determined by measuring the quenching of intrinsic Trp fluorescence
(λex/λem = 290/330 nm). The quetiapine monomer quenched Pgp Trp fluorescence to
~60% (Figure 5.6A), whereas each of the dimers had ΔFmax values of ~38% (C2-Me2)-
49% (C1 diester). Each one of the dimers saturably quenched Trp fluorescence at much
lower concentrations than quetiapine. The Kd values ranged from a high of 2.49 μM (C8
diester) to a low of 0.96 μM (C3 diester), indicating that the dimers bind to Pgp with 12-
to 30-fold higher affinity than the quetiapine monomer (Table 5.3).
Quetiapine was found to quench the Trp fluorescence of both Pgp and Pgp-AzTMR
to a similar extent (Figure 5.7A). Interestingly, none of the dimers quenched the Trp
fluorescence of Pgp-AzTMR to the same extent as they did for Pgp, with ΔFmax ranging
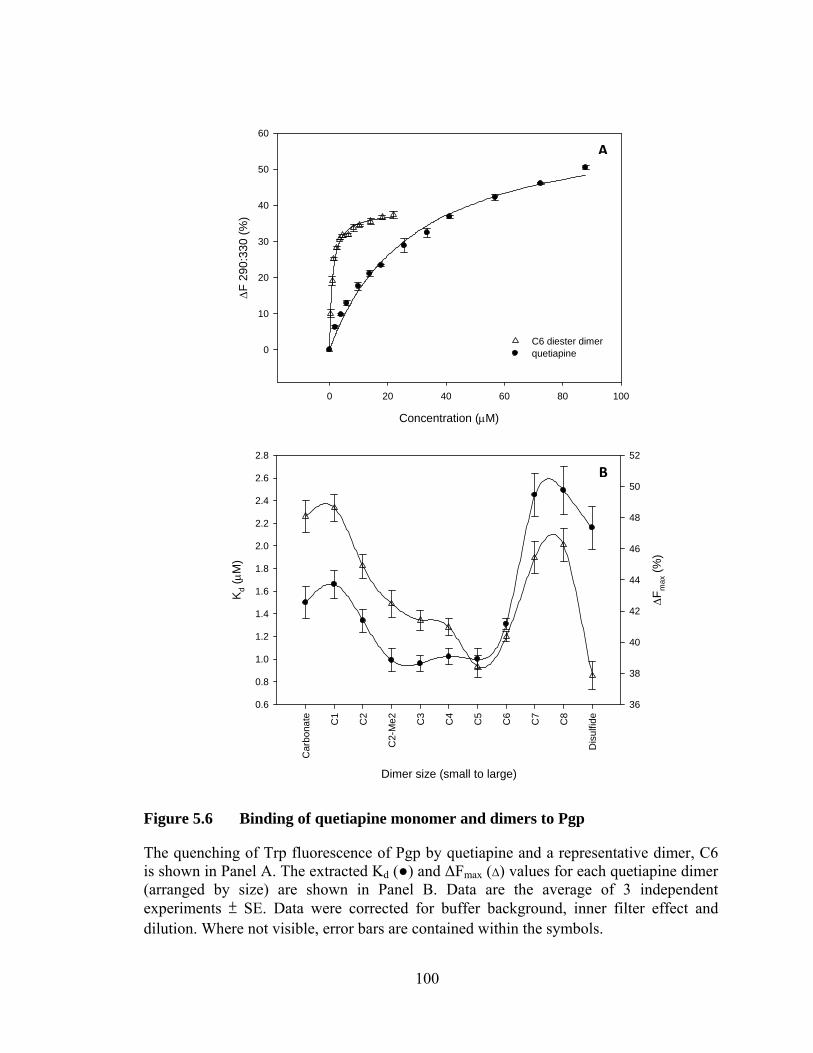
100
Concentration (μM)
0 20 40 60 80 100
ΔF 2
90:3
30 (%
)
0
10
20
30
40
50
60
C6 diester dimerquetiapine
Dimer size (small to large)
Car
bona
te C1
C2
C2-
Me2 C
3
C4
C5
C6
C7
C8
Dis
ulfid
e
Kd (
μM)
0.6
0.8
1.0
1.2
1.4
1.6
1.8
2.0
2.2
2.4
2.6
2.8
ΔFm
ax (%
)
36
38
40
42
44
46
48
50
52
Figure 5.6 Binding of quetiapine monomer and dimers to Pgp
The quenching of Trp fluorescence of Pgp by quetiapine and a representative dimer, C6 is shown in Panel A. The extracted Kd (●) and ΔFmax (Δ) values for each quetiapine dimer (arranged by size) are shown in Panel B. Data are the average of 3 independent experiments ± SE. Data were corrected for buffer background, inner filter effect and dilution. Where not visible, error bars are contained within the symbols.
A
B
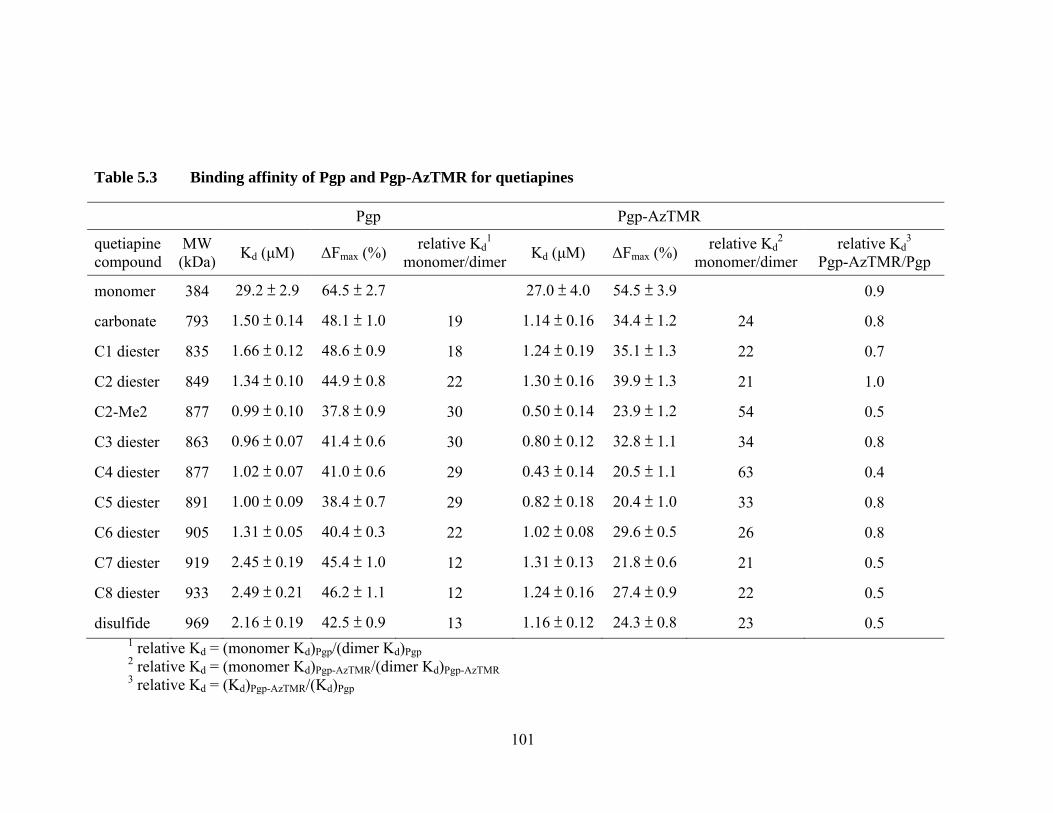
101
Table 5.3 Binding affinity of Pgp and Pgp-AzTMR for quetiapines
Pgp Pgp-AzTMR
quetiapine compound
MW (kDa) Kd (μM) ΔFmax (%) relative Kd
1 monomer/dimer Kd (μM) ΔFmax (%) relative Kd
2 monomer/dimer
relative Kd3
Pgp-AzTMR/Pgp
monomer 384 29.2 ± 2.9 64.5 ± 2.7 27.0 ± 4.0 54.5 ± 3.9 0.9
carbonate 793 1.50 ± 0.14 48.1 ± 1.0 19 1.14 ± 0.16 34.4 ± 1.2 24 0.8
C1 diester 835 1.66 ± 0.12 48.6 ± 0.9 18 1.24 ± 0.19 35.1 ± 1.3 22 0.7
C2 diester 849 1.34 ± 0.10 44.9 ± 0.8 22 1.30 ± 0.16 39.9 ± 1.3 21 1.0
C2-Me2 877 0.99 ± 0.10 37.8 ± 0.9 30 0.50 ± 0.14 23.9 ± 1.2 54 0.5
C3 diester 863 0.96 ± 0.07 41.4 ± 0.6 30 0.80 ± 0.12 32.8 ± 1.1 34 0.8
C4 diester 877 1.02 ± 0.07 41.0 ± 0.6 29 0.43 ± 0.14 20.5 ± 1.1 63 0.4
C5 diester 891 1.00 ± 0.09 38.4 ± 0.7 29 0.82 ± 0.18 20.4 ± 1.0 33 0.8
C6 diester 905 1.31 ± 0.05 40.4 ± 0.3 22 1.02 ± 0.08 29.6 ± 0.5 26 0.8
C7 diester 919 2.45 ± 0.19 45.4 ± 1.0 12 1.31 ± 0.13 21.8 ± 0.6 21 0.5
C8 diester 933 2.49 ± 0.21 46.2 ± 1.1 12 1.24 ± 0.16 27.4 ± 0.9 22 0.5
disulfide 969 2.16 ± 0.19 42.5 ± 0.9 13 1.16 ± 0.12 24.3 ± 0.8 23 0.5 1 relative Kd = (monomer Kd)Pgp/(dimer Kd)Pgp 2 relative Kd = (monomer Kd)Pgp-AzTMR/(dimer Kd)Pgp-AzTMR 3 relative Kd = (Kd)Pgp-AzTMR/(Kd)Pgp
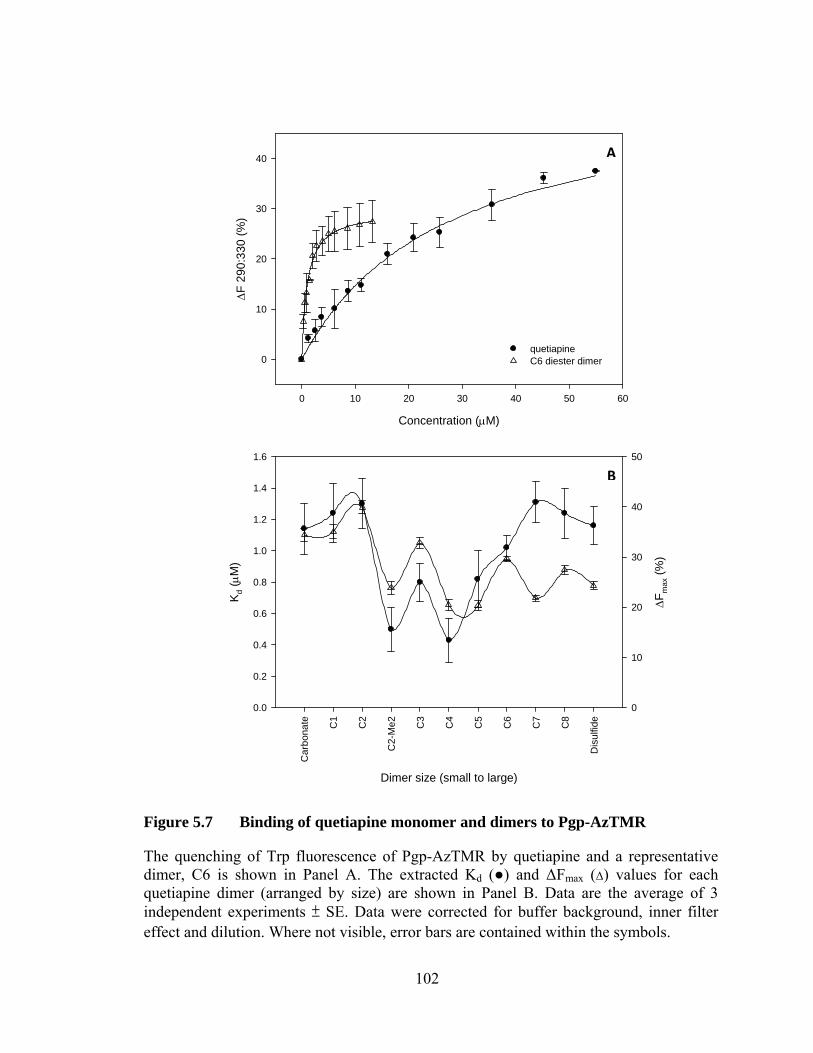
102
Concentration (μM)
0 10 20 30 40 50 60
ΔF
290:
330
(%)
0
10
20
30
40
quetiapineC6 diester dimer
Dimer size (small to large)
Car
bona
te C1
C2
C2-
Me2 C3
C4
C5
C6
C7
C8
Dis
ulfid
e
Kd (
μM)
0.0
0.2
0.4
0.6
0.8
1.0
1.2
1.4
1.6
ΔFm
ax (%
)
0
10
20
30
40
50
Figure 5.7 Binding of quetiapine monomer and dimers to Pgp-AzTMR
The quenching of Trp fluorescence of Pgp-AzTMR by quetiapine and a representative dimer, C6 is shown in Panel A. The extracted Kd (●) and ΔFmax (Δ) values for each quetiapine dimer (arranged by size) are shown in Panel B. Data are the average of 3 independent experiments ± SE. Data were corrected for buffer background, inner filter effect and dilution. Where not visible, error bars are contained within the symbols.
A
B
103
from 20-40%. Each of the dimers had much lower Kd values for binding to Pgp-AzTMR
when compared to quetiapine monomer, ranging from 1.31 μM (C7 diester) to 0.43 μM
(C4 diester), representing 21- to 63-fold higher binding affinities than the monomer.
When the binding of the monomer and dimers to labelled and unlabelled Pgp were
compared, most of the compounds had a higher affinity for Pgp-AzTMR (Table 5.3). The
fold-change in binding varied between 0.5 and 1.0, indicating that the binding of the
quetiapines to Pgp was only slightly affected by the presence of AzTMR in the binding
pocket (Table 5.3) and that three drug moieties can simultaneously fit into the binding
pocket. When Kd and ΔFmax were plotted against the size of the dimers, C2-Me2, C3, C4
and C5 were found to bind to Pgp with the highest affinity, suggesting that their tether
lengths are optimal for fitting into the native Pgp drug-binding pocket (Figure 5.6B).
5.4.2 Effect on ATPase activity
The effect of the quetiapine monomer and dimers on Pgp and Pgp-AzTMR ATPase
activity was measured over concentrations from 0.6-300 μM. From these curves, IC50
values were estimated by determining the concentration at which 50% inhibition occurred
(Table 5.4). Quetiapine showed a biphasic effect on Pgp ATPase activity, stimulating it
20-30% at concentrations up to 6 μM and inhibiting activity at higher concentrations,
with an IC50 of 15 μM. Using the calculated Kd values, the fractional or site occupancy
was calculated for each compound for the range of quetiapine concentrations used in the
ATPase assay. At 2 μM, quetiapine was found to stimulate ATPase activity by 30% with
only 6% of the drug binding sites occupied (Figure 5.9A). In general, the dimers from the
shortest tether of C1 up to C5 stimulated Pgp ATPase activity at low concentrations and
inhibited activity at concentrations above 1 μM (Figure 5.8A). The dimers with longer
104
tether lengths, C6 to C8, did not stimulate ATPase activity, but rather inhibited activity
over the entire concentration range (Figure 5.8B). Although C2-Me2 has the same tether
length as C2 and the same mass as C4, it did not show stimulation at low concentrations,
but rather inhibited ATPase activity at all concentrations in a similar pattern to the
quetiapines with longer tethers (C6 through C8). It is evident that additional methyl
substituents affect the positioning of the tether within the binding pocket and,
consequently, coupled ATPase activity. Quetiapine carbonate behaved much like the
short tether-length diesters, stimulating ~10% at lower concentrations and inhibiting
activity at higher values, whereas quetiapine disulfide behaved like the longer tethers,
showing no stimulation at low concentrations. The IC50 values of the quetiapine dimer
series decreased with increasing tether length, and increased at the longest tether C8
(Table 5.4).
The effect of quetiapine monomer and dimers on the ATPase activity of Pgp-
AzTMR was also determined. Quetiapine monomer did not stimulate the activity of
labelled Pgp at low concentrations, however, the overall shape of the ATPase profile is
quite similar, and above 10 μM, quetiapine inhibited Pgp-AzTMR activity (Figure 5.9A).
In addition, the IC50 value determined for quetiapine was much higher than those for each
of the dimers, consistent with what was seen for Pgp (Table 5.4). Dimers with short
tethers up to C3 stimulated Pgp-AzTMR ATPase activity at low concentrations and
inhibited it at high concentrations (Figure 5.8A), while C4 and larger dimers only
inhibited activity at all concentrations (Figure 5.8B). The carbonate dimer behaved like
the short tethers and the disulfide behaved like the long tethers, similar to what was
observed with Pgp. The only noticeable difference between the two data sets was that all
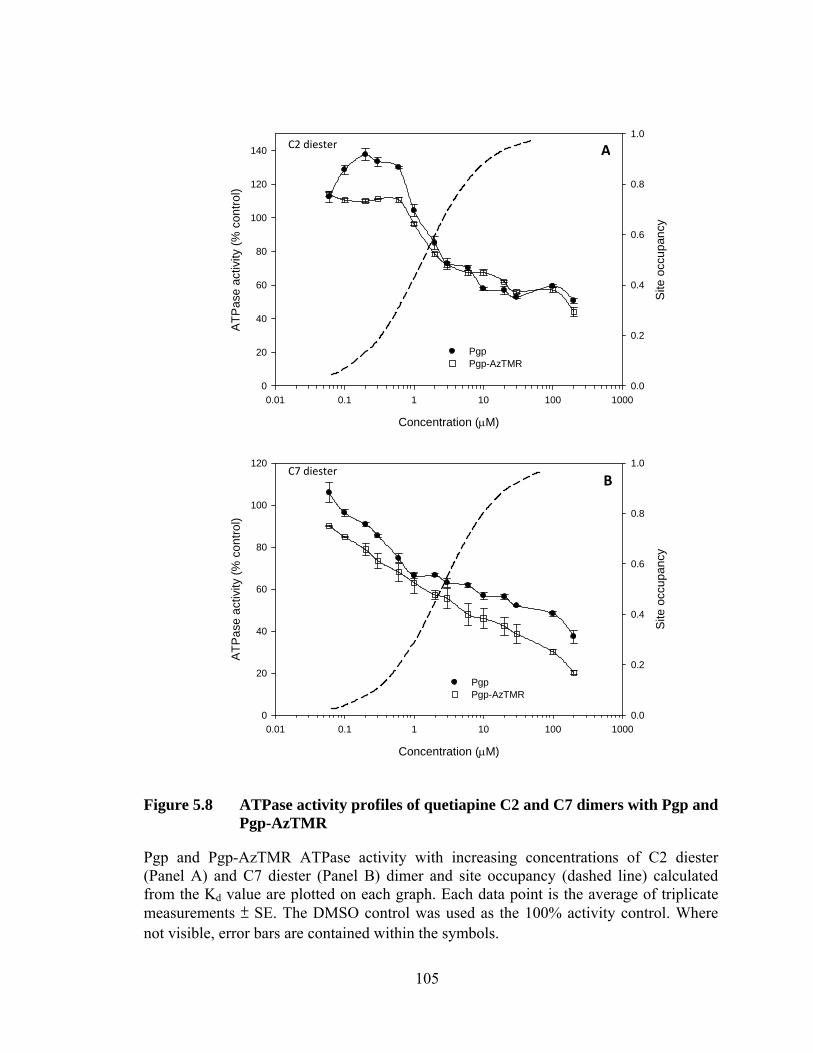
105
Concentration (μM)
0.01 0.1 1 10 100 1000
ATP
ase
activ
ity (%
con
trol)
0
20
40
60
80
100
120
140
Site
occ
upan
cy
0.0
0.2
0.4
0.6
0.8
1.0
PgpPgp-AzTMR
Concentration (μM)
0.01 0.1 1 10 100 1000
ATP
ase
activ
ity (%
con
trol)
0
20
40
60
80
100
120
Site
occ
upan
cy
0.0
0.2
0.4
0.6
0.8
1.0
PgpPgp-AzTMR
Figure 5.8 ATPase activity profiles of quetiapine C2 and C7 dimers with Pgp and Pgp-AzTMR
Pgp and Pgp-AzTMR ATPase activity with increasing concentrations of C2 diester (Panel A) and C7 diester (Panel B) dimer and site occupancy (dashed line) calculated from the Kd value are plotted on each graph. Each data point is the average of triplicate measurements ± SE. The DMSO control was used as the 100% activity control. Where not visible, error bars are contained within the symbols.
A
B
C2 diester
C7 diester
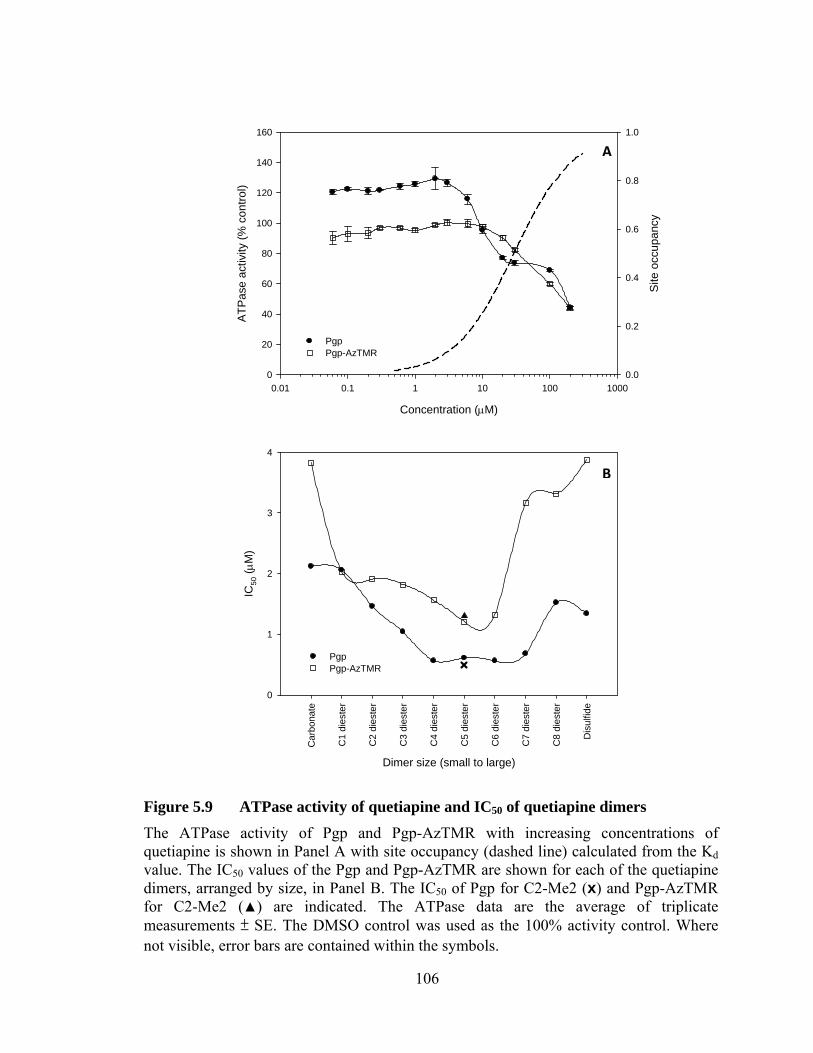
106
Dimer size (small to large)
Car
bona
te
C1
dies
ter
C2
dies
ter
C3
dies
ter
C4
dies
ter
C5
dies
ter
C6
dies
ter
C7
dies
ter
C8
dies
ter
Dis
ulfid
e
IC50
(μM
)
0
1
2
3
4
PgpPgp-AzTMR
Concentration (μM)
0.01 0.1 1 10 100 1000
ATP
ase
activ
ity (%
con
trol)
0
20
40
60
80
100
120
140
160
Site
occ
upan
cy
0.0
0.2
0.4
0.6
0.8
1.0
PgpPgp-AzTMR
Figure 5.9 ATPase activity of quetiapine and IC50 of quetiapine dimers The ATPase activity of Pgp and Pgp-AzTMR with increasing concentrations of quetiapine is shown in Panel A with site occupancy (dashed line) calculated from the Kd value. The IC50 values of the Pgp and Pgp-AzTMR are shown for each of the quetiapine dimers, arranged by size, in Panel B. The IC50 of Pgp for C2-Me2 (x) and Pgp-AzTMR for C2-Me2 (▲) are indicated. The ATPase data are the average of triplicate measurements ± SE. The DMSO control was used as the 100% activity control. Where not visible, error bars are contained within the symbols.
A
B
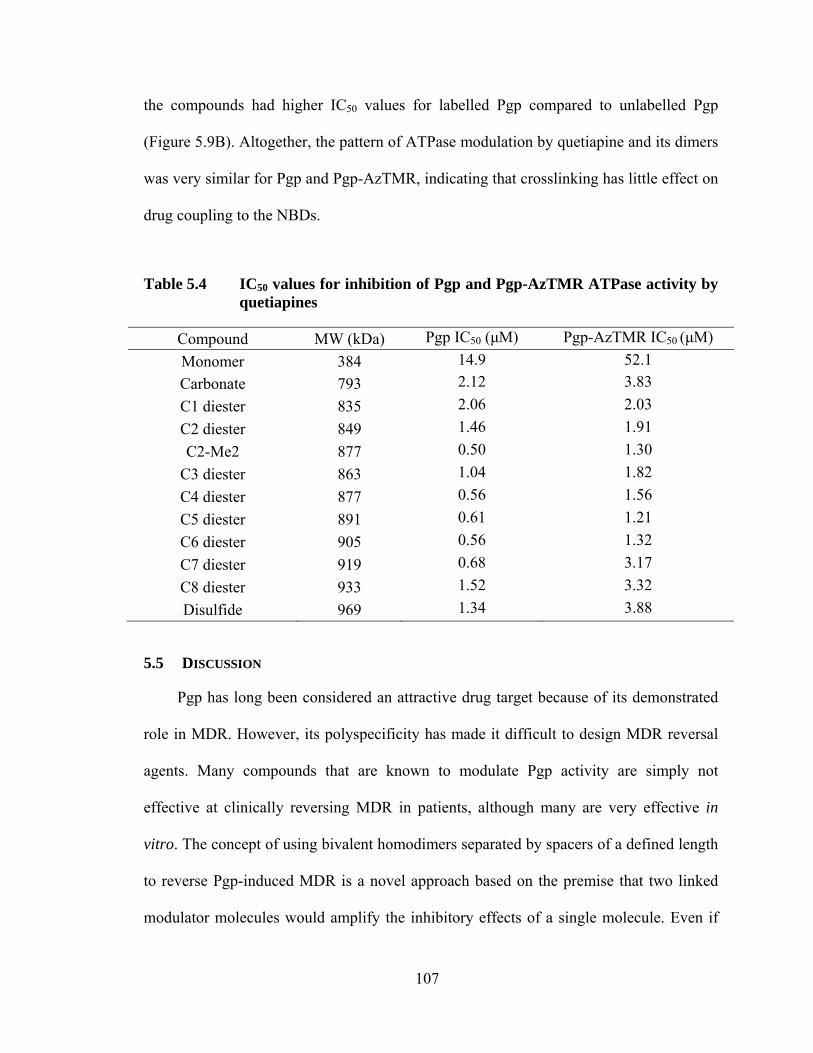
107
the compounds had higher IC50 values for labelled Pgp compared to unlabelled Pgp
(Figure 5.9B). Altogether, the pattern of ATPase modulation by quetiapine and its dimers
was very similar for Pgp and Pgp-AzTMR, indicating that crosslinking has little effect on
drug coupling to the NBDs.
Table 5.4 IC50 values for inhibition of Pgp and Pgp-AzTMR ATPase activity by quetiapines
Compound MW (kDa) Pgp IC50 (μM) Pgp-AzTMR IC50 (μM) Monomer 384 14.9 52.1 Carbonate 793 2.12 3.83 C1 diester 835 2.06 2.03 C2 diester 849 1.46 1.91 C2-Me2 877 0.50 1.30
C3 diester 863 1.04 1.82 C4 diester 877 0.56 1.56 C5 diester 891 0.61 1.21 C6 diester 905 0.56 1.32 C7 diester 919 0.68 3.17 C8 diester 933 1.52 3.32 Disulfide 969 1.34 3.88
5.5 DISCUSSION
Pgp has long been considered an attractive drug target because of its demonstrated
role in MDR. However, its polyspecificity has made it difficult to design MDR reversal
agents. Many compounds that are known to modulate Pgp activity are simply not
effective at clinically reversing MDR in patients, although many are very effective in
vitro. The concept of using bivalent homodimers separated by spacers of a defined length
to reverse Pgp-induced MDR is a novel approach based on the premise that two linked
modulator molecules would amplify the inhibitory effects of a single molecule. Even if
108
these compounds proved to be unsuitable for clinical use, they might be useful in
providing information on the size and nature of the Pgp drug-binding pocket. Several
bivalent drug dimers have shown promising results in vitro by their ability to inhibit drug
binding to Pgp and reduce Pgp-mediated drug efflux from cells (150). For example, a
bivalent emetine probe was able to reverse the MDR phenotype of cells when
administered with the cytotoxic agent daunorubicin (152). However, early versions of
polyvalent modulators were thought to be too cytotoxic because they accumulated in cells
and were not efficiently cleared. As a result, homodimers linked together with reversible
ester bonds were developed. They were more quickly hydrolyzed by cytoplasmic
esterases, while maintaining their ability to reverse MDR in vitro (132).
In the current study, the binding affinity and effects on ATPase activity of bivalent
abacavir, quinine and quetiapine homodimers were measured with unlabelled Pgp, and
Ppg labelled with the R-site drug, AzTMR. Interestingly, the abacavir, quinine, and
quetiapine dimers bound to Pgp and Pgp-AzTMR with 6- to 8-fold, 11- to 27-fold, and
12- to 63-fold higher affinity, respectively. The fact that the drug dimers bind more
tightly to Pgp than the monomer, which confirms the early hypotheses that dimers could
be more potent inhibitors of Pgp, is likely the result of increased contacts and interactions
inside the binding pocket. Furthermore, since the binding affinity of Pgp for modulator
dimers is much higher compared to monomers, this is a useful strategy to improve their
potency, as lower concentrations of modulators would be needed to reverse MDR if they
are dimerized. The results also indicate that none of the dimers are prevented from
binding to Pgp by the presence of linked AzTMR, and confirm that it may be possible for
three drugs to simultaneously bind to Pgp. Indeed, that the binding pocket of Pgp may be
109
sufficiently large to accommodate at least two molecules of substrate is suggested by the
recent X-ray crystal structure (40). The finding that the Kd of each of the drug dimers was
similar for labelled and unlabelled Pgp suggests that these compounds likely bind to a
different sub-site within the binding pocket, which does not overlap with the R-site.
The effects of the drug monomers and dimers on the ATPase activity of Pgp and
Pgp-AzTMR were complex and not easily explained. Both quinine dimers were much
more potent inhibitors of ATPase activity than the monomer. However, there remains no
satisfactory explanation for the observed ATPase profiles in the greater context of Pgp
function, and the ability to inhibit ATPase activity alone does not necessarily make a
compound a good Pgp modulator.
In the case of quetiapine, a large series of cross-linked dimers with different tether
lengths was available, and provided some interesting information on the Pgp drug
binding pocket. The extent to which the dimers quenched Pgp-AzTMR Trp fluorescence
was lower than for Pgp, indicating that they may bind to a somewhat different site in
labelled Pgp. Moreover, while quetiapine binds to labelled and unlabelled Pgp with
similar affinity, each of the dimers had a higher affinity for Pgp-AzTMR, implying that
this new site is more favourable for dimer binding. Of particular interest is the Pgp
binding affinity for dimers with different tether lengths. The affinity increased with
increasing tether length up to the C3 diester dimer and was equally strong for C3, C4, and
C5. However, for C6 diester dimer and longer, the affinity decreased, suggesting that the
optimum tether length for binding of bivalent quetiapines to Pgp is between C3 and C5.
This trend was unchanged for binding to Pgp-AzTMR, with C3 to C5 diester having the
highest binding affinities. These results are supported by earlier findings that the greatest
110
inhibition of [125I]-IAAP labelling of Pgp and R123 transport by Pgp, were achieved by
stipiamide and emetine dimers with optimal tether lengths (150;152). Interestingly, the
different chemical linkages in the carbonate, disulfide and C2-Me2 dimers were largely
irrelevant to binding, as their affinities followed the trend based on tether length.
The biphasic pattern of ATPase stimulation and inhibition observed for monomeric
quetiapine was also seen for short tether-length quetiapine dimers (up to C5), while the
dimers with longer tether lengths (C6 and above) only inhibited. Their effects on
verapamil-stimulated Pgp ATPase activity in crude membranes were comparable (C.A.
Hrycyna, unpublished work). These results are also similar to the effects of stipiamide
dimers on verapamil-induced ATPase activity, with activity stimulated by dimers with
short tethers up to a certain threshold and inhibited by longer tethers (150). The only
difference noted for Pgp-AzTMR was that the IC50 values were noticeably higher
compared to Pgp, indicating that the dimers are not as potent inhibitors of labelled Pgp
ATPase activity.
Taken together, the results of these experiments with three monomer/dimer pairs
with purified Pgp provide some useful information on the size of the Pgp binding pocket,
and the relationship between the sub-sites where they bind and the R-site where TMR is
linked.
111
Chapter 6
SUMMARY AND CONCLUSIONS
112
6.1 SUMMARY AND CONCLUSIONS
In this project, the fluorescent azido derivative of the Pgp substrate, TMR, was
covalently crosslinked to the drug binding pocket by UV activation. Although previous
studies crosslinked drugs to Pgp, they looked largely at the changes in ATPase activity
and did not measure the direct binding of drugs to the crosslinked protein (91). Moreover,
by using specific labelling at inserted Cys residues, rather than crosslinking to native
residues present in the binding pocket, the physiological relevance of the results come
into question. In this study, the small, highly reactive azido group was used for
crosslinking to both minimize chemical changes to the substrate molecule, and attempt to
link it to its natural site within the Pgp binding pocket. The ATPase activity of the Pgp-
AzTMR adduct decreased relative to Pgp, however, this decrease was similar to that
observed for Pgp with reversibly bound AzTMR, and could have resulted from a shift
from the basal to the drug-coupled ATPase cycle (124). Reaction parameters were
optimized to obtain covalently crosslinked Pgp with good functionality and a molar
labelling stoichiometry of ~1. Other than its effect on ATPase activity, crosslinking of
AzTMR to the drug binding pocket resulted in a Pgp-AzTMR adduct that displayed
similar biochemical properties to native Pgp. It also retained the ability to transport
H33342, albeit not to the same extent as native Pgp.
The crosslinking of AzTMR to Pgp resulted in a small blue shift in intrinsic Trp
fluorescence, and the local environment of the binding site was estimated to have a
polarity similar to that of propanol. Interestingly, this binding region is more polar than
that for the substrate LDS-751, which was previously found to have a polarity lower than
113
chloroform (76). These results demonstrate that in order to achieve its polyspecificity,
Pgp contains several distinct binding regions for different substrates.
Trp quenching of the Pgp-AzTMR adduct allowed the measurement of Kd for
binding of a second drug, without the complicating effects of multiple reversible drug
equilibria that were encountered in previous studies (54). The binding affinity of labelled
and unlabelled Pgp for a second substrate (rhodamine, Hoechst dye, or another clinically
used drug) was determined. The majority of rhodamines tested had a higher affinity for
Pgp than Pgp-AzTMR, suggesting that AzTMR may be linked close to their binding site,
resulting in some steric interference. The binding affinity for two Hoechst compounds,
measured by either intrinsic Trp fluorescence quenching or enhanced ligand fluorescence,
was either unchanged or higher for Pgp-AzTMR. These results indicate that binding of
H-site drugs to Pgp is not affected by a crosslinked molecule of AzTMR, and may even
be made more favourable. The ATPase profiles of labelled and unlabelled Pgp were
relatively similar for the majority of R- and H-site drugs, suggesting that crosslinking
AzTMR to the R-site did not affect communication between the drug-binding pocket and
the NBDs. The effect of AzTMR labelling on the binding affinities of several clinically
important drugs to Pgp was variable, with some drugs binding more tightly to Pgp and
others more tightly to Pgp-AzTMR. Therefore, the simple R- and H-site proposal for the
Pgp binding site is likely more complicated than previously thought, involving broader
R- and H-preferring regions which can bind a variety of molecules at overlapping sites.
All of these results do, however, provide direct confirmation of simultaneous binding of
two drug molecules to the Pgp substrate binding pocket (54;55).
114
Three sets of Pgp modulators and their potentially clinically useful dimers (quinine,
quetiapine, and abacavir series) were used with AzTMR-labelled and unlabelled Pgp to
obtain information on the size and capacity of the drug-binding pocket. In all cases, the
dimers bound to Pgp with substantially higher affinity than the monomers, with between
6- and 30-fold lower Kd values. This higher binding affinity likely results from increased
contacts and interactions between the dimers and the binding pocket. Therefore, using
drug dimers represents a useful strategy to enhance the Pgp binding affinity of these
compounds. Quinine dimers and longer tether-length quetiapine dimers inhibited Pgp
ATPase activity, unlike the monomers, which generally stimulated activity at low
concentrations and inhibited it at high concentrations, producing a biphasic profile. An
optimum tether length for quetiapine was found, between the C3 and C5 diester, for
which the Pgp binding affinity was highest, and inhibition of ATPase activity the most
potent. All of these results are consistent with earlier ATPase activity measurements
made with monomer/dimer compounds using Pgp in crude membranes (132;150;152),
and demonstrate the potential of these drugs as clinical Pgp-reversal agents.
The binding affinity of Pgp-AzTMR for the drug dimers was comparable to that
noted for unlabelled Pgp, suggesting that the entire drug dimer is able to fit into the
binding pocket together with the AzTMR group. These results suggest that AzTMR
crosslinking does not significantly impact the dimers’ ability to interact with Pgp, and in
fact, provides evidence that it is possible for three drug moieties to bind to the Pgp
binding pocket simultaneously. Chemotherapy treatment is often carried out with drug
cocktails containing several Pgp substrates. These results suggest that they would affect
each others binding and transport, although the details cannot be predicted presently.
115
6.2 SUGGESTIONS FOR FUTURE WORK
It would be extremely useful to know the physical location of the AzTMR binding
site in Pgp. To this end, mass spectrometry was employed as part of my studies to find
the labelled peptide fragment from purified Pgp-AzTMR digested with trypsin and
chymotrypsin. While ~30% sequence coverage was obtained, the fragments were largely
from the extracellular and cytoplasmic domains; the coverage from the TMDs was very
poor. Some groups have reported better sequence coverage for Pgp digested with
chymotrypsin, especially in the TMDs, but these studies were completed on Pgp
reconstituted into proteoliposomes and the details of their digestion protocol were not
published (153). Therefore, while technically difficult, it should be possible to identify
the labelling site of AzTMR in a carefully designed mass spectrometric analysis.
In this study, the binding affinities of a number of R- and H-site drugs were
determined for Pgp with and without a crosslinked AzTMR label. H33258 can bind to
Pgp-AzTMR and its fluorescence emission spectrum overlaps the excitation spectrum of
AzTMR, with a calculated Förster distance of 53 Å for the pair of fluorophores.
Therefore, FRET may occur between covalently-linked AzTMR and bound H33258, thus
allowing the estimation of the distance between the two probes (77). This information
could provide substantial insight into the relative location of the R- and H-sites within the
binding pocket of Pgp.
In future studies, it might also be possible to covalently crosslink two drug
molecules to Pgp in a sequential manner. Crosslinking of ethidium monoazide has been
carried out in our lab (Richard Mather, 2008, M.Sc. thesis, University of Guelph),
however, it is not strictly an R- or H-site drug. Therefore, it would be useful to synthesize
116
an azido derivative of either H33342 or H33258 to see if it is possible to covalently
crosslink a second drug molecule to Pgp. This could give complementary information on
the binding sub-site for H-site drugs and would also allow the evaluation of binding of a
third drug to Pgp, using similar approaches to those in this thesis.
The bivalent versions of Pgp modulators show promise in their ability to act as
MDR-reversal agents by inhibiting drug binding to Pgp at much lower concentrations
than the monomers (150). These compounds have also been shown to inhibit R123 efflux
from cells, and it should be possible to measure their effect on H33342 transport using
Pgp reconstituted into DMPC proteoliposomes. Moreover, measurement of the binding
affinity of these compounds to Pgp covalently cross-linked to both AzTMR and an H-site
drug could demonstrate whether four drugs can bind to Pgp simultaneously, and provide
additional information on the maximum size of the binding pocket.
The interaction of nucleotides with Pgp and Pgp-AzTMR could provide valuable
information on the coupling process between drug binding and ATP hydrolysis. In the
ATP-switch model (123), drug binding is proposed to induce binding of ATP, which it is
assumed cannot bind tightly in the absence of drug. However, the partition model (124),
and data from our lab (32), suggest that drugs and ATP can bind independently of each
other. By measuring Trp quenching of Pgp, the binding affinity of nucleotides (ATP and
ADP) can be determined for Pgp and Pgp-AzTMR. Whether or not there is a significant
difference in the binding affinity of nucleotide for both states of Pgp, this should provide
some idea on how the presence of drug in the binding pocket affects nucleotide binding.
117
REFERENCES
1. Juliano, R. L. and Ling, V. (1976) A surface glycoprotein modulating drug permeability in Chinese hamster ovary cell mutants, Biochim. Biophys. Acta 455, 152-162.
2. Dassa, E. and Bouige, P. (2001) The ABC of ABCs: a phylogenetic and functional classification of ABC systems in living organisms, Res. Microbiol. 152, 211-229.
3. Van Veen, H. W. and Konings, W. N. (1998) The ABC family of multidrug transporters in microorganisms, Biochim. Biophys. Acta 1365, 31-36.
4. Dean, M., Rzhetsky, A., and Allikmets, R. (2001) The human ATP-binding cassette (ABC) transporter superfamily, Genome Res. 11, 1156-1166.
5. Zolnerciks, J. K., Andress, E. J., Nicolau, M., and Linton, K. J. (2011) Structure of ABC transporters, in Essays in Biochemistry: ABC Transporters (Sharom, F. J., Ed.), vol 50, pp 43-61, Portland Press Limited, London.
6. Saurin, W., Hofnung, M., and Dassa, E. (1999) Getting in or out: Early segregation between importers and exporters in the evolution of ATP-binding cassette (ABC) transporters, J. Mol. Evol. 48, 22-41.
7. Borst, P. and Oude Elferink, R. P. (2002) Mammalian ABC transporters in health and disease, Annu. Rev. Biochem. 71, 537-592.
8. Thiebaut, F., Tsuruo, T., Hamada, H., Gottesman, M. M., Pastan, I., and Willingham, M. C. (1987) Cellular localization of the multidrug-resistance gene product P-glycoprotein in normal human tissues, Proc. Natl. Acad. Sci. U. S. A. 84, 7735-7738.
9. Croop, J. M., Raymond, M., Haber, D., Devault, A., Arceci, R. J., Gros, P., and Housman, D. E. (1989) The three mouse multidrug resistance (mdr) genes are expressed in a tissue-specific manner in normal mouse tissues, Mol. Cell. Biol. 9, 1346-1350.
10. De Boer, A. G., Van der Sandt, I. C. J., and Gaillard, P. J. (2003) The role of drug transporters at the blood-brain barrier, Annu. Rev. Pharmacol. Toxicol. 43, 629-656.
11. Eckford, P. D. and Sharom, F. J. (2009) ABC efflux pump-based resistance to chemotherapy drugs, Chem. Rev. 109, 2989-3011.
118
12. Schinkel, A. H., Smit, J. J., van Tellingen, O., Beijnen, J. H., Wagenaar, E., van Deemter, L., Mol, C. A., van der Valk, M. A., Robanus-Maandag, E. C., and te Riele, H. P. (1994) Disruption of the mouse mdr1a P-glycoprotein gene leads to a deficiency in the blood-brain barrier and to increased sensitivity to drugs, Cell 77, 491-502.
13. Roulet, A., Puel, O., Gesta, S., Lepage, J. F., Drag, M., Soll, M., Alvinerie, M., and Pineau, T. (2003) MDR1-deficient genotype in Collie dogs hypersensitive to the P-glycoprotein substrate ivermectin, Eur. J. Pharmacol. 460, 85-91.
14. Gillet, J. P., Efferth, T., and Remacle, J. (2007) Chemotherapy-induced resistance by ATP-binding cassette transporter genes, Biochim. Biophys. Acta 1775, 237-262.
15. Stavrovskaya, A. A. (2000) Cellular mechanisms of multidrug resistance of tumour cells, Biochemistry 65, 95-106.
16. Gottesman, M. M., Fojo, T., and Bates, S. E. (2002) Multidrug resistance in cancer: role of ATP-dependent transporters, Nat. Rev. Cancer 2, 48-58.
17. Alvarez, M., Paull, K., Monks, A., Hose, C., Lee, J. S., Weinstein, J., Grever, M., Bates, S., and Fojo, T. (1995) Generation of a drug resistance profile by quantitation of mdr-1/P-glycoprotein in the cell lines of the National Cancer Institute Anticancer Drug Screen, J. Clin. Invest. 95, 2205-2214.
18. Gottesman, M. M. (1993) How cancer cells evade chemotherapy: sixteenth Richard and Hinda Rosenthal Foundation Award Lecture, Cancer Res. 53, 747-754.
19. Yuen, A. R. and Sikic, B. I. (1994) Multidrug resistance in lymphomas, J. Clin. Oncol. 12, 2453-2459.
20. Sorrentino, B. P., Brandt, S. J., Bodine, D., Gottesman, M. M., Pastan, I. H., Cline, A., and Neinhuis, A. W. (1992) Selection of drug-resistant bone marrow cells in vivo after retroviral transfer of human MDR1, Science 257, 99-103.
21. Polgar, O. and Bates, S. E. (2005) ABC transporters in the balance: is there a role in multidrug resistance?, Biochem. Soc. Trans. 33, 241-245.
22. List, A. F., Kopecky, K. J., Willman, C. L., Head, D. R., Slovak, M. L., Douer, D., Dakhil, S. R., and Appelbaum, F. R. (2002) Cyclosporine inhibition of P-glycoprotein in chronic myeloid leukemia blast phase, Blood 100, 1910-1912.
23. Dantzig, A. H., Law, K. L., Cao, J., and Starling, J. J. (2001) Reversal of multidrug resistance by the P-glycoprotein modulator, LY335979, from the bench to the clinic, Curr. Med. Chem. 8, 39-50.
119
24. Bansal, T., Jaggi, M., Khar, R. K., and Talegaonkar, S. (2009) Emerging significance of flavonoids as P-glycoprotein inhibitors in cancer chemotherapy, J. Pharm. Pharmaceut. Sci. 12, 46-78.
25. Goldstein, L. J., Galski, H., Fojo, A. T., Willingham, M., Lai, S. L., Gazdar, A. F., Pirker, R., Green, A., Crist, W., Brodeur, G. M., Lieber, M., Cossman, J., Gottesman, M. M., and Pastan, I. (1989) Expression of a multidrug resistance gene in human cancers, J. Natl. Cancer Inst. 81, 116-124.
26. Tamaki, A., Ierano, C., Szakacs, G., Robey, R. W., and Bates, S. E. (2011) The controversial role of ABC transporters in clinical oncology, in Essays in Biochemistry: ABC Transporters (Sharom, F. J., Ed.), vol 50, pp 209-232, Portland Press Limited, London.
27. Kast, C., Canfield, V., Levenson, R., and Gros, P. (1996) Transmembrane organization of mouse P-glycoprotein determined by epitope insertion and immunofluorescence, J. Biol. Chem. 271, 9240-9248.
28. Loo, T. W. and Clarke, D. M. (1995) Membrane topology of a cysteine-less mutant of human P-glycoprotein, J. Biol. Chem. 270, 843-848.
29. Zhang, J. T. and Ling, V. (1991) Study of membrane orientation and glycosylated extracellular loops of mouse P-glycoprotein by in vitro translation, J. Biol. Chem. 266, 18224-18232.
30. Gribar, J. J., Ramachandra, M., Hrycyna, C. A., Dey, S., and Ambudkar, S. V. (2000) Functional characterization of glycosylation-deficient human P-glycoprotein using a vaccinia virus expression system, J. Membr. Biol. 173, 203-214.
31. Schinkel, A. H., Arceci, R. J., Smit, J. J., Wagenaar, E., Baas, F., Dolle, M., Tsuruo, T., Mechetner, E. B., Roninson, I. B., and Borst, P. (1993) Binding properties of monoclonal antibodies recognizing external epitopes of the human MDR1 P-glycoprotein, Int. J. Cancer 55, 478-484.
32. Liu, R., Siemiarczuk, A., and Sharom, F. J. (2000) Intrinsic fluorescence of the P-glycoprotein multidrug transporter: sensitivity of tryptophan residues to binding of drugs and nucleotides, Biochemistry 39, 14927-14938.
33. Liu, R. and Sharom, F. J. (1996) Site-directed fluorescence labeling of P-glycoprotein on cysteine residues in the nucleotide binding domains, Biochemistry 35, 11865-11873.
34. Holland, I. B. and Blight, M. A. (1999) ABC-ATPases, adaptable energy generators fuelling transmembrane movement of a variety of molecules in organisms from bacteria to humans, J. Mol Biol. 293, 381-399.
120
35. Dassa, E. (2011) Natural history of ABC systems: not only transporters, in Essays in Biochemistry: ABC Transporters (Sharom, F. J., Ed.), vol 50, pp 19-42, Portland Publishing Limited, London.
36. Walker, J. E., Saraste, M., Runswick, M. J., and Gay, N. J. (1982) Distantly related sequences in the α- and β-subunits of ATP synthase, myosin, kinases and other ATP-requiring enzymes and a common nucleotide binding fold, EMBO J. 1, 945-951.
37. Oswald, C., Holland, I. B., and Schmitt, L. (2006) The motor domains of ABC-transporters - What can structures tell us?, Naunyn Schmiedebergs Arch. Pharmacol. 372, 385-399.
38. Frelet, A. and Klein, M. (2006) Insight in eukaryotic ABC transporter function by mutation analysis, FEBS Lett. 580, 1064-1084.
39. Schmitt, L., Benabdelhak, H., Blight, M. A., Holland, I. B., and Stubbs, M. T. (2003) Crystal structure of the nucleotide-binding domain of the ABC-transporter haemolysin B: identification of a variable region within ABC helical domains, J. Mol Biol. 330, 333-342.
40. Aller, S. G., Yu, J., Ward, A., Weng, Y., Chittaboina, S., Zhuo, R., Harrell, P. M., Trinh, Y. T., Zhang, Q., Urbatsch, I. L., and Chang, G. (2009) Structure of P-glycoprotein reveals a molecular basis for poly-specific drug binding, Science 323, 1718-1722.
41. Ward, A., Reyes, C. L., Yu, J., Roth, C. B., and Chang, G. (2007) Flexibility in the ABC transporter MsbA: Alternating access with a twist, Proc. Natl. Acad. Sci. U. S. A. 104, 19005-19010.
42. Dawson, R. J. and Locher, K. P. (2006) Structure of a bacterial multidrug ABC transporter, Nature 443, 180-185.
43. Dawson, R. J. and Locher, K. P. (2007) Structure of the multidrug ABC transporter Sav1866 from Staphylococcus aureus in complex with AMP-PNP, FEBS Lett. 581, 935-938.
44. Davidson, A. L. and Maloney, P. C. (2007) ABC transporters: how small machines do a big job, Trends Microbiol. 15, 448-455.
45. Hollenstein, K., Dawson, R. J. P., and Locher, K. P. (2007) Structure and mechanism of ABC transporter proteins, Curr. Opin. Struct. Biol. 17, 412-418.
46. O'Mara, M. L. and Tieleman, D. P. (2007) P-glycoprotein models of the apo and ATP-bound states based on homology with Sav1866 and MalK, FEBS Lett. 581, 4217-4222.
121
47. Becker, J. P., Depret, G., Van, B. F., Tulkens, P. M., and Prevost, M. (2009) Molecular models of human P-glycoprotein in two different catalytic states, BMC Struct. Biol. 9, 3.
48. Zolnerciks, J. K., Wooding, C., and Linton, K. J. (2007) Evidence for a Sav1866-like architecture for the human multidrug transporter P-glycoprotein, FASEB J. 21, 3937-3948.
49. Rosenberg, M. F., Callaghan, R., Ford, R. C., and Higgins, C. F. (1997) Structure of the multidrug resistance P-glycoprotein to 2.5 nm resolution determined by electron microscopy and image analysis, J. Biol. Chem. 272, 10685-10694.
50. Rosenberg, M. F., Velarde, G., Ford, R. C., Martin, C., Berridge, G., Kerr, I. D., Callaghan, R., Schmidlin, A., Wooding, C., Linton, K. J., and Higgins, C. F. (2001) Repacking of the transmembrane domains of P-glycoprotein during the transport ATPase cycle, EMBO J. 20, 5615-5625.
51. Rosenberg, M. F., Callaghan, R., Modok, S., Higgins, C. F., and Ford, R. C. (2005) Three-dimensional structure of P-glycoprotein: the transmembrane regions adopt an asymmetric configuration in the nucleotide-bound state, J. Biol. Chem. 280, 2857-2862.
52. Lee, J. Y., Urbatsch, I. L., Senior, A. E., and Wilkens, S. (2002) Projection structure of P-glycoprotein by electron microscopy - Evidence for a closed conformation of the nucleotide binding domains, J. Biol. Chem. 277, 40125-40131.
53. Lee, J. Y., Urbatsch, I. L., Senior, A. E., and Wilkens, S. (2008) Nucleotide-induced structural changes in P-glycoprotein observed by electron microscopy, J. Biol. Chem. 283, 5769-5779.
54. Lugo, M. R. and Sharom, F. J. (2005) Interaction of LDS-751 and rhodamine 123 with P-glycoprotein: evidence for simultaneous binding of both drugs, Biochemistry 44, 14020-14029.
55. Loo, T. W., Bartlett, M. C., and Clarke, D. M. (2003) Simultaneous binding of two different drugs in the binding pocket of the human multidrug resistance P-glycoprotein, J. Biol. Chem. 278, 39706-39710.
56. Gottesman, M. M., Ambudkar, S. V., and Xia, D. (2009) Structure of a multidrug transporter, Nat. Biotechnol. 27, 546-547.
57. Gottesman, M. M. (2002) Mechanisms of cancer drug resistance, Annu. Rev. Med. 53, 615-627.
58. Schinkel, A. H. and Jonker, J. W. (2003) Mammalian drug efflux transporters of the ATP binding cassette (ABC) family: an overview, Adv. Drug Deliv. Rev. 55, 3-29.
122
59. Sharom, F. J. (2008) ABC multidrug transporters: structure, function and role in chemoresistance, Pharmacogenomics 9, 105-127.
60. Sharom, F. J. (2011) The P-glycoprotein multidrug transporter, in Essays in Biochemistry: ABC Transporters (Sharom, F. J., Ed.), vol 50, pp 161-178, Portland Press Limited, London.
61. Sharom, F. J., Liu, R., Qu, Q., and Romsicki, Y. (2001) Exploring the structure and function of the P-glycoprotein multidrug transporter using fluorescence spectroscopic tools, Semin. Cell Dev. Biol. 12, 257-265.
62. Pawagi, A. B., Wang, J., Silverman, M., Reithmeier, R. A., and Deber, C. M. (1994) Transmembrane aromatic amino acid distribution in P-glycoprotein. A functional role in broad substrate specificity, J. Mol. Biol. 235, 554-564.
63. Loo, T. W. and Clarke, D. M. (1994) Functional consequences of glycine mutations in the predicted cytoplasmic loops of P-glycoprotein, J. Biol. Chem. 269, 7243-7248.
64. Loo, T. W. and Clarke, D. M. (2008) Mutational analysis of ABC proteins, Arch. Biochem. Biophys. 476, 51-64.
65. Loo, T. W., Bartlett, M. C., and Clarke, D. M. (2003) Substrate-induced conformational, changes in the transmembrane segments of human P-glycoprotein - Direct evidence for the substrate-induced fit mechanism for drug binding, J. Biol. Chem. 278, 13603-13606.
66. Seelig, A. (1998) A general pattern for substrate recognition by P-glycoprotein, Eur. J. Biochem. 251, 252-261.
67. Garrigues, A., Loiseau, N., Delaforge, M., Ferté, J., Garrigos, M., André, F., and Orlowski, S. (2002) Characterization of two pharmacophores on the multidrug transporter P-glycoprotein, Mol. Pharmacol. 62, 1288-1298.
68. Sharom, F. J. (2006) Shedding light on drug transport: structure and function of the P-glycoprotein multidrug transporter (ABCB1), Biochem. Cell Biol. 84, 979-992.
69. Robert, J. and Jarry, C. (2003) Multidrug resistance reversal agents, J. Med. Chem. 46, 4805-4817.
70. Dayan, G., Jault, J. M., Baubichon-Cortay, H., Baggetto, L. G., Renoir, J. M., Baulieu, E. E., Gros, P., and Di Pietro, A. (1997) Binding of steroid modulators to recombinant cytosolic domain from mouse P-glycoprotein in close proximity to the ATP site, Biochemistry 36, 15208-15215.
123
71. Maki, N., Moitra, K., Ghosh, P., and Dey, S. (2006) Allosteric modulation bypasses the requirement for ATP hydrolysis in regenerating low affinity transition state conformation of human P-glycoprotein, J. Biol. Chem. 281, 10769-10777.
72. Eytan, G. D. (2005) Mechanism of multidrug resistance in relation to passive membrane permeation, Biomed. Pharmacother. 59, 90-97.
73. Ayesh, S., Shao, Y. M., and Stein, W. D. (1996) Co-operative, competitive and non-competitive interactions between modulators of P-glycoprotein, Biochim. Biophys. Acta 1316, 8-18.
74. Ferry, D. R., Malkhandi, P. J., Russell, M. A., and Kerr, D. J. (1995) Allosteric regulation of [3H]vinblastine binding to P-glycoprotein of MCF-7 ADR cells by dexniguldipine, Biochem. Pharmacol. 49, 1851-1861.
75. Garrigos, M., Mir, L. M., and Orlowski, S. (1997) Competitive and non-competitive inhibition of the multidrug-resistance-associated P-glycoprotein ATPase-further experimental evidence for a multisite model, Eur. J. Biochem. 244, 664-673.
76. Lugo, M. R. and Sharom, F. J. (2005) Interaction of LDS-751 with P-glycoprotein and mapping of the location of the R drug binding site, Biochemistry 44, 643-655.
77. Qu, Q. and Sharom, F. J. (2002) Proximity of bound Hoechst 33342 to the ATPase catalytic sites places the drug binding site of P-glycoprotein within the cytoplasmic membrane leaflet, Biochemistry 41, 4744-4752.
78. Loo, T. W. and Clarke, D. M. (1997) Identification of residues in the drug-binding site of human P-glycoprotein using a thiol-reactive substrate, J. Biol. Chem. 272, 31945-31948.
79. Loo, T. W. and Clarke, D. M. (1999) Identification of residues in the drug-binding domain of human P-glycoprotein - Analysis of transmembrane segment 11 by cysteine-scanning mutagenesis and inhibition by dibromobimane, J. Biol. Chem. 274, 35388-35392.
80. Loo, T. W. and Clarke, D. M. (2002) Location of the rhodamine-binding site in the human multidrug resistance P-glycoprotein, J. Biol. Chem. 277, 44332-44338.
81. Loo, T. W. and Clarke, D. M. (1999) Determining the structure and mechanism of the human multidrug resistance P-glycoprotein using cysteine-scanning mutagenesis and thiol-modification techniques, Biochim. Biophys. Acta 1461, 315-325.
82. Loo, T. W. and Clarke, D. M. (2005) Do drug substrates enter the common drug-binding pocket of P-glycoprotein through "gates"?, Biochem. Biophys. Res. Commun. 329, 419-422.
124
83. Bruggemann, E. P., Germann, U. A., Gottesman, M. M., and Pastan, I. (1989) Two different regions of P-glycoprotein are photoaffinity-labeled by azidopine, J. Biol. Chem. 264, 15483-15488.
84. Safa, A. R. (2004) Identification and characterization of the binding sites of P-glycoprotein for multidrug resistance-related drugs and modulators, Curr. Med. Chem. Anticancer Agents 4, 1-17.
85. Martin, C., Berridge, G., Higgins, C. F., Mistry, P., Charlton, P., and Callaghan, R. (2000) Communication between multiple drug binding sites on P-glycoprotein, Mol. Pharmacol. 58, 624-632.
86. Globisch, C., Pajeva, I. K., and Wiese, M. (2008) Identification of putative binding sites of P-glycoprotein based on its homology model, ChemMedChem. 3, 280-295.
87. Loo, T. W. and Clarke, D. M. (1993) Functional consequences of phenylalanine mutations in the predicted transmembrane domain of P-glycoprotein, J. Biol. Chem. 268, 19965-19972.
88. Gruol, D. J., Bernd, J., Phippard, A. E., Ojima, I., and Bernacki, R. J. (2001) The use of a novel taxane-based P-glycoprotein inhibitor to identify mutations that alter the interaction of the protein with paclitaxel, Mol. Pharmacol. 60, 104-113.
89. Gruol, D. J., King, M. N., and Kuehne, M. E. (2002) Evidence for the locations of distinct steroid and Vinca alkaloid interaction domains within the murine mdr1b P-glycoprotein, Mol. Pharmacol. 62, 1238-1248.
90. Welker, E., Szabo, K., Hollo, Z., Muller, M., Sarkadi, B., and Varadi, A. (1995) Drug-stimulated ATPase activity of a deletion mutant of the human multidrug-resistance protein (MDR1), Biochem. Biophys. Res. Commun. 216, 602-609.
91. Loo, T. W., Bartlett, M. C., and Clarke, D. M. (2003) Methanethiosulfonate derivatives of rhodamine and verapamil activate human P-glycoprotein at different sites, J. Biol. Chem. 278, 50136-50141.
92. Loo, T. W., Bartlett, M. C., and Clarke, D. M. (2004) The drug-binding pocket of the human multidrug resistance P-glycoprotein is accessible to the aqueous medium, Biochemistry 43, 12081-12089.
93. Loo, T. W. and Clarke, D. M. (2000) Identification of residues within the drug-binding domain of the human multidrug resistance P-glycoprotein by cysteine-scanning mutagenesis and reaction with dibromobimane, J. Biol. Chem. 275, 39272-39278.
94. Loo, T. W., Bartlett, M. C., and Clarke, D. M. (2002) The "LSGGQ" motif in each nucleotide-binding domain of human P-glycoprotein is adjacent to the opposing Walker A sequence, J. Biol. Chem. 277, 41303-41306.
125
95. Qu, Q. and Sharom, F. J. (2001) FRET analysis indicates that the two ATPase active sites of the P-glycoprotein multidrug transporter are closely associated, Biochemistry 40, 1413-1422.
96. Smith, P. C., Karpowich, N., Millen, L., Moody, J. E., Rosen, J., Thomas, P. J., and Hunt, J. F. (2002) ATP binding to the motor domain from an ABC transporter drives formation of a nucleotide sandwich dimer, Mol. Cell 10, 139-149.
97. Hanekop, N., Zaitseva, J., Jenewein, S., Holland, I. B., and Schmitt, L. (2006) Molecular insights into the mechanism of ATP-hydrolysis by the NBD of the ABC-transporter HlyB, FEBS Lett. 580, 1036-1041.
98. Ambudkar, S. V., Kim, I. W., Xia, D., and Sauna, Z. E. (2006) The A-loop, a novel conserved aromatic acid subdomain upstream of the Walker A motif in ABC transporters, is critical for ATP binding, FEBS Lett. 580, 1049-1055.
99. Zaitseva, J., Jenewein, S., Jumpertz, T., Holland, I. B., and Schmitt, L. (2005) H662 is the linchpin of ATP hydrolysis in the nucleotide-binding domain of the ABC transporter HlyB, EMBO J. 24, 1901-1910.
100. Tombline, G., Bartholomew, L. A., Urbatsch, I. L., and Senior, A. E. (2004) Combined mutation of catalytic glutamate residues in the two nucleotide binding domains of P-glycoprotein generates a conformation that binds ATP and ADP tightly, J. Biol. Chem. 279, 31212-31220.
101. Tombline, G., Muharemagic, A., White, L. B., and Senior, A. E. (2005) Involvement of the "occluded nucleotide conformation" of P-glycoprotein in the catalytic pathway, Biochemistry 44, 12879-12886.
102. Qu, Q., Russell, P. L., and Sharom, F. J. (2003) Stoichiometry and affinity of nucleotide binding to P-glycoprotein during the catalytic cycle, Biochemistry 42, 1170-1177.
103. Doige, C. A., Yu, X., and Sharom, F. J. (1992) ATPase activity of partially purified P-glycoprotein from multidrug-resistant Chinese hamster ovary cells, Biochim. Biophys. Acta 1109, 149-160.
104. al-Shawi, M. K. and Senior, A. E. (1993) Characterization of the adenosine triphosphatase activity of Chinese hamster P-glycoprotein, J. Biol. Chem. 268, 4197-4206.
105. Gottesman, M. M., Pastan, I., and Ambudkar, S. V. (1996) P-glycoprotein and multidrug resistance, Curr. Opin. Genet. Dev. 6, 610-617.
106. Senior, A. E., al-Shawi, M. K., and Urbatsch, I. L. (1995) The catalytic cycle of P-glycoprotein, FEBS Lett. 377, 285-289.
126
107. Urbatsch, I. L., Beaudet, L., Carrier, I., and Gros, P. (1998) Mutations in either nucleotide-binding site of P-glycoprotein (mdr3) prevent vanadate trapping of nucleotide at both sites, Biochemistry 37, 4592-4602.
108. Urbatsch, I. L., Sankaran, B., Weber, J., and Senior, A. E. (1995) P-glycoprotein is stably inhibited by vanadate-induced trapping of nucleotide at a single catalytic site, J. Biol. Chem. 270, 19383-19390.
109. Loo, T. W. and Clarke, D. M. (1995) Covalent modification of human P-glycoprotein mutants containing a single cysteine in either nucleotide-binding fold abolishes drug-stimulated ATPase activity, J. Biol. Chem. 270, 22957-22961.
110. Siarheyeva, A., Liu, R., and Sharom, F. J. (2010) Characterization of an asymmetric occluded state of P-glycoprotein with two bound nucleotides: implications for catalysis, J. Biol. Chem. 285, 7575-7586.
111. Tombline, G. and Senior, A. E. (2005) The occluded nucleotide conformation of P-glycoprotein, J. Bioenerg. Biomembr. 37, 497-500.
112. Higgins, C. F. and Gottesman, M. M. (1992) Is the multidrug transporter a flippase?, Trends Biochem. Sci. 17, 18-21.
113. Romsicki, Y. and Sharom, F. J. (1999) The membrane lipid environment modulates drug interactions with the P-glycoprotein multidrug transporter, Biochemistry 38, 6887-6896.
114. Seelig, A., Blatter, X. L., and Wohnsland, F. (2000) Substrate recognition by P-glycoprotein and the multidrug resistance-associated protein MRP1: a comparison, Int. J. Clin. Pharmacol. Ther. 38, 111-121.
115. Smith, A. J., van Helvoort, A., van Meer, G., Szabó, K., Welker, E., Szakács, G., Váradi, A., Sarkadi, B., and Borst, P. (2000) MDR3 P-glycoprotein, a phosphatidylcholine translocase, transports several cytotoxic drugs and directly interacts with drugs as judged by interference with nucleotide trapping, J. Biol. Chem. 275, 23530-23539.
116. Romsicki, Y. and Sharom, F. J. (2001) Phospholipid flippase activity of the reconstituted P-glycoprotein multidrug transporter, Biochemistry 40, 6937-6947.
117. Eckford, P. D. and Sharom, F. J. (2005) The reconstituted P-glycoprotein multidrug transporter is a flippase for glucosylceramide and other simple glycosphingolipids, Biochem. J. 389, 517-526.
118. Sharom, F. J. (2003) Probing of conformational changes, catalytic cycle and ABC transporter function, in ABC Proteins: From Bacteria to Man (Holland, I. B., Kuchler, K., Higgins, C., and Cole, S. P., Eds.), pp 107-133, Academic Press, London.
127
119. Loo, T. W. and Clarke, D. M. (2005) Recent progress in understanding the mechanism of P-glycoprotein-mediated drug efflux, J. Membr. Biol. 206, 173-185.
120. Loo, T. W. and Clarke, D. M. (1997) Drug-stimulated ATPase activity of human P-glycoprotein requires movement between transmembrane segments 6 and 12, J. Biol. Chem. 272, 20986-20989.
121. Litman, T., Zeuthen, T., Skovsgaard, T., and Stein, W. D. (1997) Structure-activity relationships of P-glycoprotein interacting drugs: kinetic characterization of their effects on ATPase activity, Biochim. Biophys. Acta 1361, 159-168.
122. Hrycyna, C. A., Airan, L. E., Germann, U. A., Ambudkar, S. V., Pastan, I., and Gottesman, M. M. (1998) Structural flexibility of the linker region of human P-glycoprotein permits ATP hydrolysis and drug transport, Biochemistry 37, 13660-13673.
123. Higgins, C. F. and Linton, K. J. (2004) The ATP switch model for ABC transporters, Nat. Struct. Mol. Biol. 11, 918-926.
124. al-Shawi, M. K., Polar, M. K., Omote, H., and Figler, R. A. (2003) Transition state analysis of the coupling of drug transport to ATP hydrolysis by P-glycoprotein, J. Biol. Chem. 278, 52629-52640.
125. Omote, H., Figler, R. A., Polar, M. K., and al-Shawi, M. K. (2004) Improved energy coupling of human P-glycoprotein by the glycine 185 to valine mutation, Biochemistry 43, 3917-3928.
126. Callaghan, R., Ford, R. C., and Kerr, I. D. (2006) The translocation mechanism of P-glycoprotein, FEBS Lett. 580, 1056-1063.
127. Shapiro, A. B. and Ling, V. (1997) Positively cooperative sites for drug transport by P-glycoprotein with distinct drug specificities, Eur. J. Biochem. 250, 130-137.
128. Shapiro, A. B., Fox, K., Lam, P., and Ling, V. (1999) Stimulation of P-glycoprotein-mediated drug transport by prazosin and progesterone. Evidence for a third drug-binding site, Eur. J. Biochem. 259, 841-850.
129. Tang, F. X., Hui, O. Y., Yang, J. Z., and Borchardt, R. T. (2004) Bidirectional transport of rhodamine 123 and Hoechst 33342, fluorescence probes of the binding sites on P-glycoprotein, across MDCK-MDR1 cell monolayers, J. Pharm. Sci. 93, 1185-1194.
130. Shapiro, A. B. and Ling, V. (1998) Transport of LDS-751 from the cytoplasmic leaflet of the plasma membrane by the rhodamine-123-selective site of P-glycoprotein, Eur. J. Biochem. 254, 181-188.
128
131. Namanja, H. A., Emmert, D., Davis, D., Campos, C., Miller, D. S., Hrycyna, C. A., and Chmielewski, J. (2011) Toward eradicating HIV reservoirs in the brain: inhibiting P-glycoprotein at the blood-brain barrier with prodrug abacavir dimers, J. Am. Chem. Soc. DOI: 10.1021/ja206867t.
132. Pires, M. M., Emmert, D., Hrycyna, C. A., and Chmielewski, J. (2009) Inhibition of P-glycoprotein-mediated paclitaxel resistance by reversibly linked quinine homodimers, Mol. Pharmacol. 75, 92-100.
133. Ling, V. and Thompson, L. H. (1974) Reduced permeability in CHO cells as a mechanism of resistance to colchicine, J. Cell Physiol. 83, 103-116.
134. Doige, C. A. and Sharom, F. J. (1991) Strategies for the purification of P-glycoprotein from multidrug-resistant Chinese hamster ovary cells, Protein Expr. Purif. 2, 256-265.
135. Sharom, F. J., Yu, X., Chu, J. W., and Doige, C. A. (1995) Characterization of the ATPase activity of P-glycoprotein from multidrug-resistant Chinese hamster ovary cells, Biochem. J. 308, 381-390.
136. Bradford, M. M. (1976) A rapid and sensitive method for the quantitation of microgram quantities of protein utilizing the principle of protein-dye binding, Anal. Biochem. 72, 248-254.
137. Peterson, G. L. (1977) A simplification of the protein assay method of Lowry et al. which is more generally applicable, Anal. Biochem. 83, 346-356.
138. Chifflet, S., Torriglia, A., Chiesa, R., and Tolosa, S. (1988) A method for the determination of inorganic phosphate in the presence of labile organic phosphate and high concentrations of protein: application to lens ATPases, Anal. Biochem. 168, 1-4.
139. Lakowicz, J. R. (2006) Principles of fluorescence spectroscopy, Springer Science+Business Media, New York.
140. Romsicki, Y. and Sharom, F. J. (1998) The ATPase and ATP-binding functions of P-glycoprotein-modulation by interaction with defined phospholipids, Eur. J. Biochem. 256, 170-178.
141. Sharom, F. J. (2011) The P-glycoprotein multidrug transporter, Essays in Biochemistry 50, 161-178.
142. Pleban, K., Kopp, S., Csaszar, E., Peer, M., Hrebicek, T., Rizzi, A., Ecker, G. F., and Chiba, P. (2005) P-glycoprotein substrate binding domains are located at the transmembrane domain/transmembrane domain interfaces: a combined photoaffinity labeling-protein homology modeling approach, Mol. Pharmacol. 67, 365-374.
129
143. Loo, T. W., Bartlett, M. C., and Clarke, D. M. (2003) Permanent activation of the human P-glycoprotein by covalent modification of a residue in the drug-binding site, J. Biol. Chem. 278, 20449-20452.
144. Schumacher, M. A., Miller, M. C., and Brennan, R. G. (2004) Structural mechanism of the simultaneous binding of two drugs to a multidrug-binding protein, EMBO J. 23, 2923-2930.
145. Pierce Applications Handbook and Catalog, (2005), Rockford, IL.
146. Sankaran, B., Bhagat, S., and Senior, A. E. (1997) Inhibition of P-glycoprotein ATPase activity by procedures involving trapping of nucleotide in catalytic sites, Arch. Biochem. Biophys. 341, 160-169.
147. Schumacher, M. A., Miller, M. C., Grkovic, S., Brown, M. H., Skurray, R. A., and Brennan, R. G. (2001) Structural mechanisms of QacR induction and multidrug recognition, Science 294, 2158-2163.
148. Parveen, Z., Stockner, T., Bentele, C., Pferschy, S., Kraupp, M., Freissmuth, M., Ecker, G., and Chiba, P. (2011) Molecular dissection of dual pseudosymmetric solute translocation pathways in human P-glycoprotein, Mol. Pharmacol. 79, 443-452.
149. Szakacs, G., Paterson, J. K., Ludwig, J. A., Booth-Genthe, C., and Gottesman, M. M. (2006) Targeting multidrug resistance in cancer, Nat. Rev. Drug Discov. 5, 219-234.
150. Sauna, Z. E., Andrus, M. B., Turner, T. M., and Ambudkar, S. V. (2004) Biochemical basis of polyvalency as a strategy for enhancing the efficacy of P-glycoprotein (ABCB1) modulators: stipiamide homodimers separated with defined-length spacers reverse drug efflux with greater efficacy, Biochemistry 43, 2262-2271.
151. Matrosovich, M. N. (1989) Towards the development of antimicrobial drugs acting by inhibition of pathogen attachment to host cells: a need for polyvalency, FEBS Lett. 252, 1-4.
152. Pires, M. M., Hrycyna, C. A., and Chmielewski, J. (2006) Bivalent probes of the human multidrug transporter P-glycoprotein, Biochemistry 45, 11695-11702.
153. Ecker, G. F., Csaszar, E., Kopp, S., Plagens, B., Holzer, W., Ernst, W., and Chiba, P. (2002) Identification of ligand-binding regions of P-glycoprotein by activated-pharmacophore photoaffinity labeling and matrix-assisted laser desorption/ionization-time-of-flight mass spectrometry, Mol. Pharmacol. 61, 637-648.