Embed Size (px)
Citation preview
12345678910111213141516171819202122232425262728293031323334353637383940414243444546474849505152535455565758
Characterizing discontinuities in naturally fractured outcropanalogues and rock core: the need to consider fracture
development over geological timeQ1
S. R. HENCHER1,2,3
1Halcrow London Ltd, Elms House, 43 Brook Green, London W6 7EF, UK2School of Earth and Environment, University of Leeds, Leeds LS2 9JT, UK3Department of Earth Sciences, Pokfulam Road, University of Hong Kong,
Hong Kong, PR China (e-mail: [email protected])
Abstract: This paper reviews aspects of the procedures for characterizing rock masses fromoutcrop mapping and core logging. It is argued that current definitions of discontinuities andjoints are too simple and too coarse to deal adequately with the range of geological features thatare found in the field and that range from open fractures through to incipient joint traces.A generic approach is proposed that differentiates between discontinuities on the basis of relativetensile strength compared to the intact parent rock. Examples are provided of how fracturefrequency and extent vary with degree of weathering and erosion, and it is suggested thatthe concept of dynamic development of geological discontinuities needs to be appreciated by geo-technical engineers and structural geologists when analysing fracture networks. This concepthas major implications for the use of rock mass classifications to zone the rock mass into engineer-ing units.
The methodology for rock mass characterization forengineering projects generally involves systematicmeasurement and description of discontinuities(mostly joints) in field exposures such as quarriesand road cuttings, in tunnels or down boreholes.Observations are often extrapolated to rock massesat some distance from the location of measurement.In the petroleum industry, exposures at the Earth’ssurface used in this way are termed ‘outcrop ana-logues’ and there is some implicit assumption thatthe fracture characteristics at the analogue locationcan be transferred to depth at least in some respects.It has long been established that such extrapola-tion can only be valid within geologically consis-tent structural domains (e.g. Piteau 1973) but thereare many other pitfalls and difficulties, some ofwhich are addressed in this paper. Most importantly,there is a need to appreciate that fracture networksdevelop with time from a series of microcracks toa full-blown system of mechanical discontinuities.Even in unconfined, uniaxial compressive strengthtests, microfractures coalesce to form fairly con-tinuous weakness planes whilst the rock still hasperhaps 35% of its ultimate strength (e.g. Eberhardtet al. 1999). It is suggested that in nature a joint candevelop from an initially incipient state to an openfracture over time as stress and other environmentalconditions change. Processes that may contribute tothe development and weakening of fractures includetectonics, unloading and weathering. Terminology
for description of joints and other discontinu-ities needs to account for their different stages indevelopment.
Definitions and guidance on measurement
Discontinuity data in rock masses are generallyanalysed according to spatial and geometrical attri-butes. Definitions of what comprises a discontinuityor joint, however, vary quite widely betweengeologists and engineers, and between differentinternational standards. Some current definitionsused in engineering are presented in Table 1.Commonly, a discontinuity is defined as a naturalphysical break in the rock mass, lacking tensilestrength, and this is the definition used for theRock Quality Designation (RQD) classification(Deere 1968; BSI 1999). The International Societyfor Rock Mechanics defines discontinuities ashaving zero or low tensile strength (ISRM 1978).This perception of rock blocks separated by extre-mely weak or open fractures is intrinsic in otherrock mass classifications that incorporate RQD asa fundamental component. These include the RockMass Rating (RMR) of Bienawski (1989) and theQ system (Barton et al. 1974). The AmericanSociety for Testing Materials’ (ASTM 2008)definition of ‘structural discontinuities’ encom-passes features with considerable greater strength,
From: Spence, G. H., Redfern, J., Aguilera, R., Bevan, T. G., Cosgrove, J. W., Couples, G. D. & Daniel, J.-M. (eds)Advances in the Study of Fractured Reservoirs. Geological Society, London, Special Publications, 374,http://dx.doi.org/10.1144/SP374.15 # The Geological Society of London 2013. Publishing disclaimer:www.geolsoc.org.uk/pub_ethics
5960616263646566676869707172737475767778798081828384858687888990919293949596979899100101102103104105106107108109110111112113114115116
Table 1. Definitions of joints and discontinuities
ISRM (1978)
JointA break of geological origin in the continuity of a body of rock along which there has been no visible displacement. Joints
can be open, filled or healed.Comments:The terms ‘open’ and ‘filled’ are clear, although many joints are only open or infilled locally but elsewhere incipient. The
meaning of infill is sometimes stretched to include zones of weathering. The term ‘healed’ implies a secondary orcontemporaneous mineralization process, as described by Ramsay & Huber (1987) and Miller et al. (1994), but is amisnomer for incipient joint planes.
DiscontinuityThe general term for any mechanical discontinuity in a rock mass having zero or low tensile strength (emphasis added). It is
the collective term for most types of joints, weak bedding planes, weak schistosity planes, weakness zones and faults.Comment:The definition does not allow for somewhat stronger visible traces of rock fabric, which may still play an important role in
engineering performance and fluid flow. It is common practice to record all visible traces of discontinuity in outcropmapping, regardless of strength, a practice that which does not tally with ISRM definitions.
BS EN ISO 14689-1:2003 Q5(European standard)
DiscontinuitySurface which breaks the rock material continuity within the rock mass and that is open or may become open under the stress
applied by the engineering work.Comment:This definition requires interpretation by the observer, and assumes an awareness of stress levels and engineering application,
which may cause difficulties for logging.
ASTM (2008)
Structural discontinuityAn interruption or abrupt change in a rock’s structural properties. Such changes might include strength, stiffness or density,
usually occurring across internal surfaces or zones, such as bedding, parting, cracks, joints, faults or cleavage.Comments:This particular ASTM (2008) addresses the use of rock mass classifications including RMR, Q and RQD. The definition of a
structural discontinuity encompasses pervasive rock fabric and incipient features that might have high tensile strength andconflicts with the ISRM definitions. Most rock mass classifications are based on the assumption that all discontinuities aremechanical fractures with zero tensile strength (as in RQD) so the ASTM definition might be regarded as inconsistent.
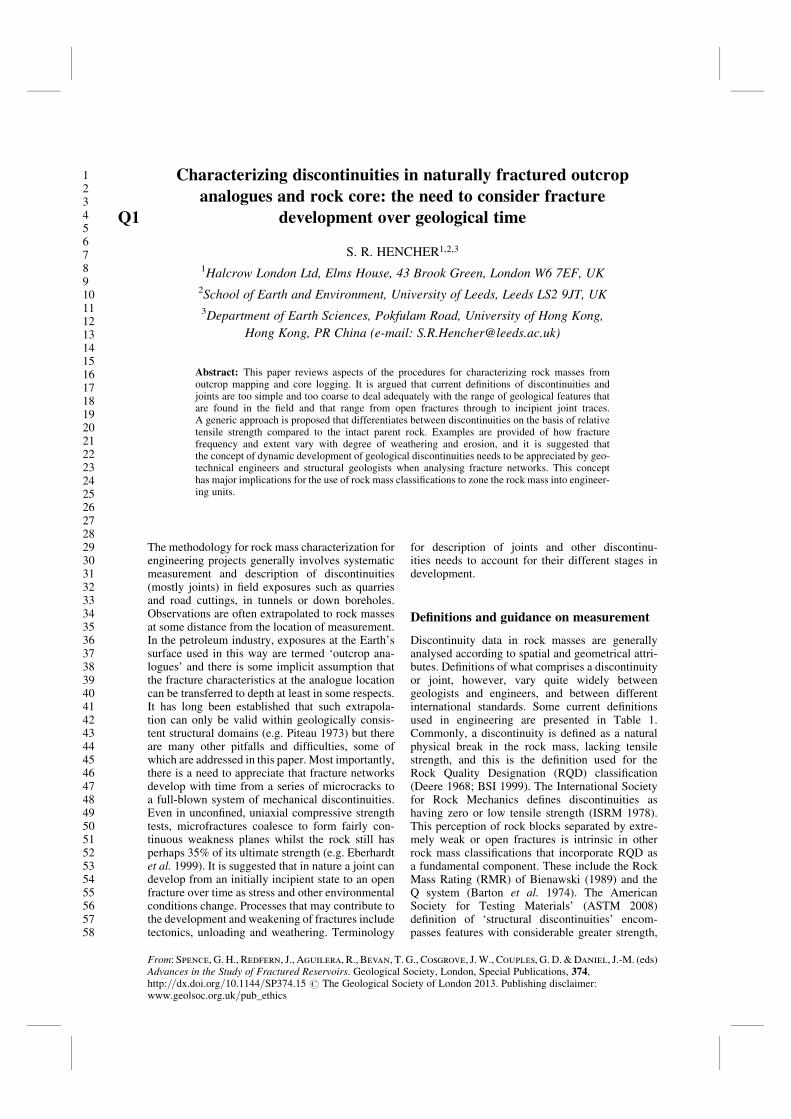
Fig. 1. Exposure
Colouronline/colour
hardcopy
in granite with exposed and incipient joints, New Territories, Hong Kong. The hammer is for scale,290 mm in length.
S. R. HENCHER
117118119120121122123124125126127128129130131132133134135136137138139140141142143144145146147148149150151152153154155156157158159160161162163164165166167168169170171172173174
including cleavage and bedding; the European stan-dard lies somewhere in-between.
Guidance for carrying out discontinuity surveysis given in several publications including ISRM(1978) and Priest (1993). An example of the com-monly adopted methodology is provided by Priest& Hudson (1981) who carried out statistical studiesof discontinuity trace length distributions alongscanlines set out on photographs of planar facesof Ordovician mudstone and Cambrian sandstone.The author defined discontinuities as mechanicalbreaks with ‘zero or relatively low tensile strength’but included any visible trace on the photographs.Clearly, strength cannot readily be judged from aphotograph, so the survey may have included incipi-ent discontinuities with strength approaching thatof the intact rock.
Whether or not all visible traces are recordedas discontinuities may have considerable conse-quences for rock mass characterization. For exam-ple, RQD calculated on the basis of visible tracesmight suggest a poor rock quality that could beexcavated easily. If, however, the visible traceson photographs or measured in a tunnel wall are ofincipient discontinuities with relatively high tensilestrength, the correct RQD as might be measuredin drillcore could be much higher and even 100%.This is becoming an ever greater issue, with thegrowing trend to use automated ground-based lasersurveys to characterize rock mass fracture networksbased solely on appearance (and reflectance) andwithout physical examination of rock exposures(Slob 2010). The implications – for example, forpredicting tunnel boring machine (TBM Q2) advance
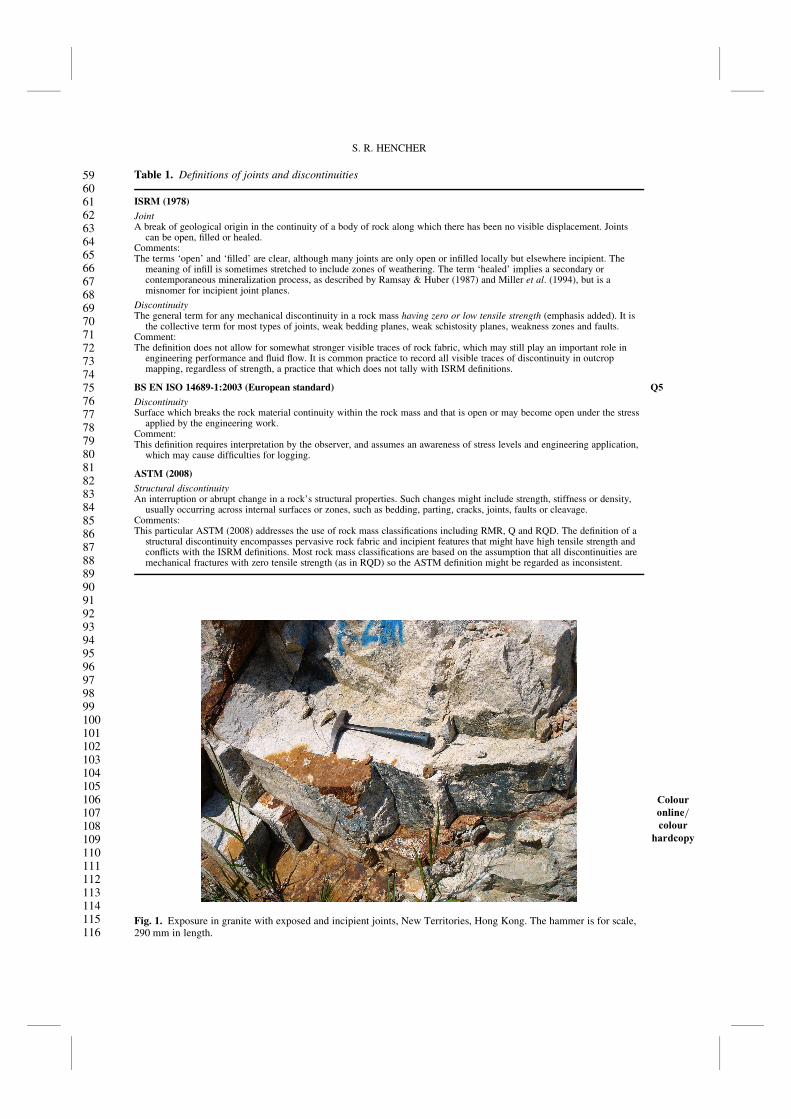
Fig. 2. Sandstone
Colouronline/colour
hardcopy
cliffs near Guoliang, China. Cliffs are more than 100 m high and contain bedding plane traces at,perhaps, 1–2 m spacing and extensive traces of vertical joints. Photograph courtesy of P. Evans.
CHARACTERIZING DISCONTINUITIES
175176177178179180181182183184185186187188189190191192193194195196197198199200201202203204205206207208209210211212213214215216217218219220221222223224225226227228229230231232
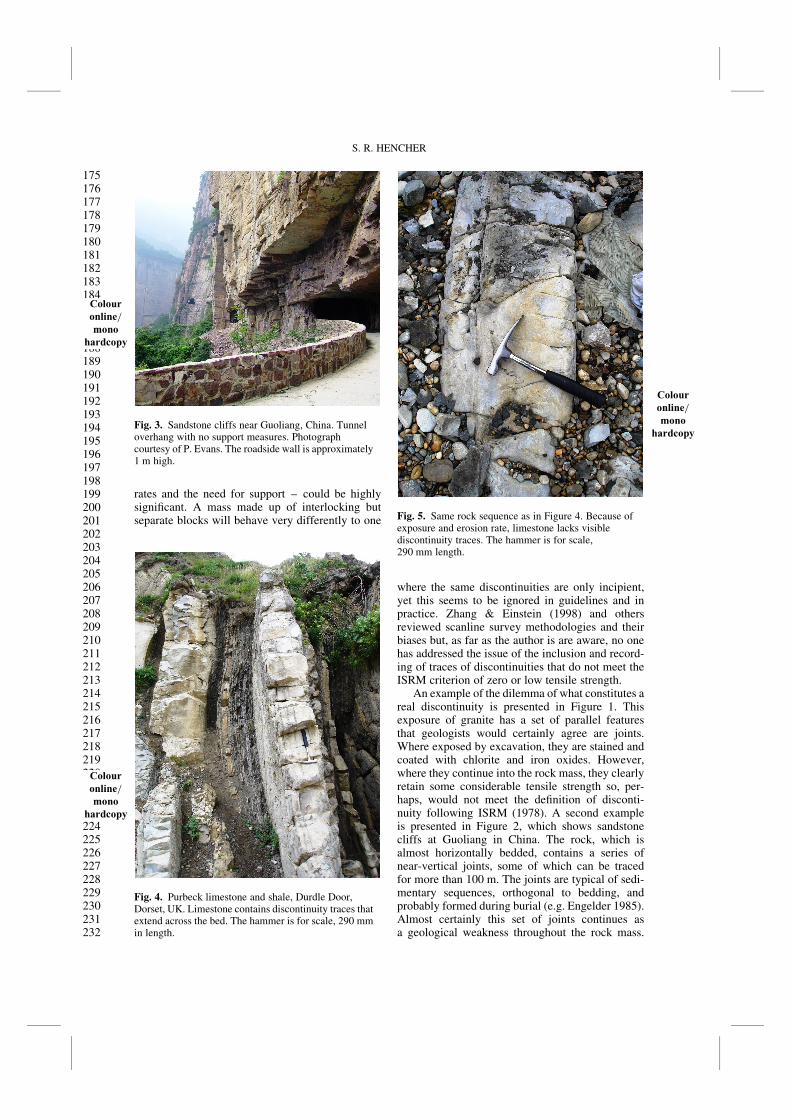
rates and the need for support – could be highlysignificant. A mass made up of interlocking butseparate blocks will behave very differently to one
where the same discontinuities are only incipient,yet this seems to be ignored in guidelines and inpractice. Zhang & Einstein (1998) and othersreviewed scanline survey methodologies and theirbiases but, as far as the author is are aware, no onehas addressed the issue of the inclusion and record-ing of traces of discontinuities that do not meet theISRM criterion of zero or low tensile strength.
An example of the dilemma of what constitutes areal discontinuity is presented in Figure 1. Thisexposure of granite has a set of parallel featuresthat geologists would certainly agree are joints.Where exposed by excavation, they are stained andcoated with chlorite and iron oxides. However,where they continue into the rock mass, they clearlyretain some considerable tensile strength so, per-haps, would not meet the definition of disconti-nuity following ISRM (1978). A second exampleis presented in Figure 2, which shows sandstonecliffs at Guoliang in China. The rock, which isalmost horizontally bedded, contains a series ofnear-vertical joints, some of which can be tracedfor more than 100 m. The joints are typical of sedi-mentary sequences, orthogonal to bedding, andprobably formed during burial (e.g. Engelder 1985).Almost certainly this set of joints continues asa geological weakness throughout the rock mass.
Fig. 3. Sandstone
Colouronline/mono
hardcopy
cliffs near Guoliang, China. Tunneloverhang with no support measures. Photographcourtesy of P. Evans. The roadside wall is approximately1 m high.
Fig. 4. Purbeck
Colouronline/mono
hardcopy
limestone and shale, Durdle Door,Dorset, UK. Limestone contains discontinuity traces thatextend across the bed. The hammer is for scale, 290 mmin length.
Fig. 5. Same
Colouronline/mono
hardcopy
rock sequence as in Figure 4. Because ofexposure and erosion rate, limestone lacks visiblediscontinuity traces. The hammer is for scale,290 mm length.
S. R. HENCHER
233234235236237238239240241242243244245246247248249250251252253254255256257258259260261262263264265266267268269270271272273274275276277278279280281282283284285286287288289290 T
able
2.A
bb
revi
atio
ns
for
def
ect
typ
esQ
6,
an
dd
escr
ipti
on
sfo
rlo
gg
ing
core
an
dex
po
sure
s(f
rom
Go
lder
Ass
oci
ates
’a
pp
roac
hfo
rco
relo
gg
ing
,a
sp
rese
nte
da
nd
dis
cuss
edin
Hen
cher
(20
12
)a
nd
mo
difi
edto
incl
ud
ere
lati
vest
ren
gth
cla
sses
)
1.
Def
ect
type
1A
.L
arger
def
ects
2.
Str
ength
rela
tive
toth
esu
rroundin
gro
ckor
soil
3.
Coat
ing
or
infi
llin
g4.
Pla
nar
ity
5.
Roughnes
s6.
Dip
7.
Aper
ture
8.
Ter
min
atio
n(v
isib
leper
sist
ence
)
Exam
ple
sfr
om
bore
hole
log
(dep
thof
feat
ure
giv
en)
B,
bed
din
g.
X,
foli
atio
n.
C,
conta
ct.
L,
clea
vag
e.J,
join
t.S
,sc
his
tosi
ty.
V,
vein
.
Note
:1.
Abov
esy
mbols
are
for
dis
cret
efe
ature
ssu
chas
bed
din
g-
par
alle
ldis
conti
nuit
ies
reco
rded
along
scan
lines
or
inbore
hole
s.W
her
efa
bri
cis
per
vas
ive
(such
assl
atey
clea
vag
e)th
ench
arac
teri
stic
sof
rock
mas
ssh
ould
be
reco
rded
inth
em
ain
body
of
des
crip
tion.
SS
/SZ
,sh
eare
dse
am/z
one
(fau
lt).
CS
/CZ
,cr
ush
edse
am/z
one
(fau
lt).
IS/I
Z,
infi
lled
seam
/zo
ne.
Note
:1.
Full
des
crip
tion
of
the
feat
ure
sw
ill
gen
eral
lybe
requir
ed.
Hi
–H
igh:
sim
ilar
topar
ent
rock
.M
o–
Moder
ate
or
inte
rmed
iate
:si
gnifi
cantl
yw
eake
rth
anpar
ent
rock
.W
e–
Wea
k:
low
stre
ngth
,m
ayopen
up
duri
ng
dri
llin
g.
Op
–open
,m
echan
ical
frac
ture
.
Note
s:1.
Only
Op
def
ects
should
be
incl
uded
for
RQ
Ddet
erm
inat
ion.
2.
Itm
aybe
dif
ficu
ltto
judge
stre
ngth
of
inci
pie
nt
feat
ure
sin
scan
line
surv
eys
and
imposs
ible
from
photo
gra
phs
or
lase
rsu
rvey
s.3.
Ifre
lati
vest
rength
cannot
be
esti
mat
ed,
do
not
gues
s.
Cn,
clea
n.
Sn,
stai
n.
Ct,
coat
ing
or
infi
ll.
Note
:1.
Min
eral
ogy
and
nat
ure
,in
cludin
gth
icknes
s,ex
tent
and
stre
ngth
of
coat
ing,
infi
llor
wea
ther
edzo
ne
should
be
reco
rded
.
Pl,
pla
nar
.U
n,
undula
ting.
St,
step
ped
.
Sl,
slic
kensi
ded
.S
m,
smooth
.R
o,
rough.
Inth
eco
re,
mea
sure
das
the
angle
rela
tive
toth
epla
ne
atri
ght
angle
toth
eco
reax
is.
Rec
ord
wher
esi
gnifi
cant
inex
posu
res
usi
ng
term
inolo
gy
such
asth
atre
com
men
ded
by
the
ISR
M.
Insc
anli
nes
or
win
dow
surv
eys,
mea
sure
or
esti
mat
eth
evis
ible
per
sist
ence
of
the
def
ect
(in
met
res)
and
the
nat
ure
of
term
inat
ions:
see
Pri
est
(1993)
for
more
det
ails
.
4.1
5m
:B
,W
e,P
l,S
l,358
Inte
rpre
tati
on:
Dis
tinct
bed
din
g-p
aral
lel
inci
pie
nt
def
ect
wit
hlo
wte
nsi
lest
rength
,pla
nar
,sl
icke
nsi
ded
and
dip
pin
gat
358
.5.1
m:
J,M
o,
Ct
FeO
,P
l,S
m,
258
Inte
rpre
tati
on:
Inci
pie
nt
join
tsi
gnifi
cantl
yw
eake
rth
anpar
ent
rock
but
stil
lre
lati
vely
stro
ng,
coat
edw
ith
iron
oxid
es,
pla
nar
and
smooth
and
dip
pin
gat
258
.
CHARACTERIZING DISCONTINUITIES
291292293294295296297298299300301302303304305306307308309310311312313314315316317318319320321322323324325326327328329330331332333334335336337338339340341342343344345346347348
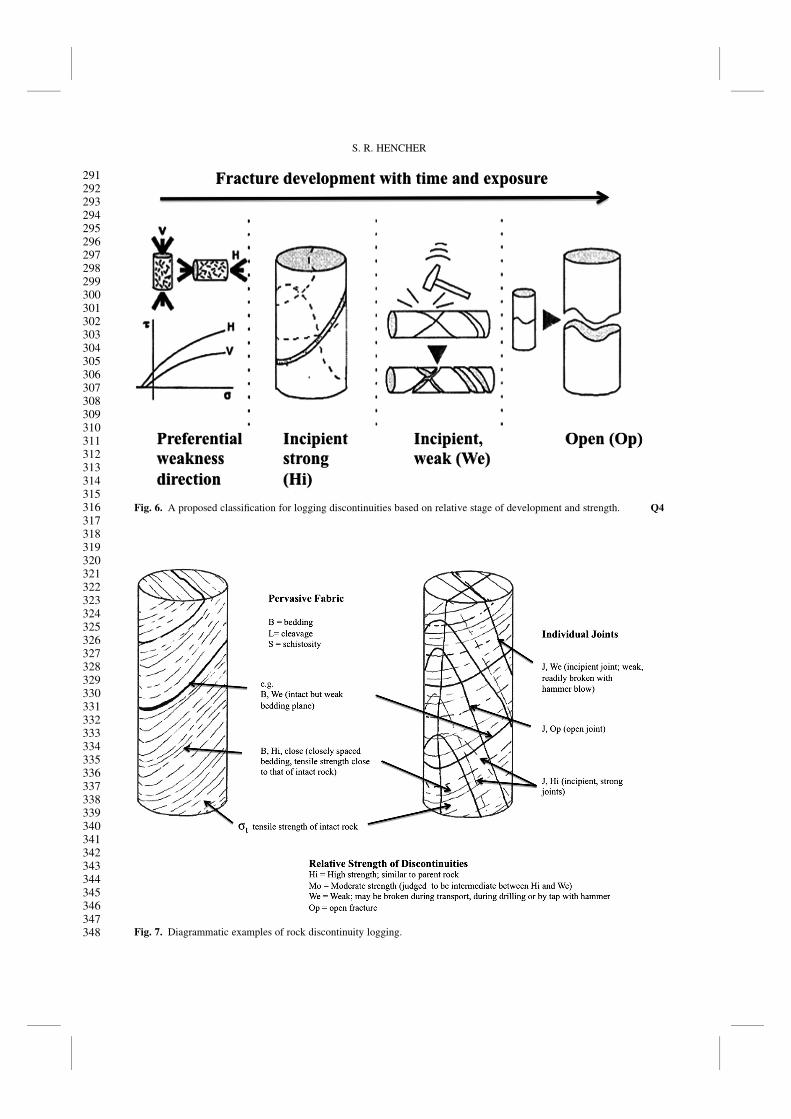
Fig. 6. A proposed classification Q4for logging discontinuities based on relative stage of development and strength.
Fig. 7. Diagrammatic examples of rock discontinuity logging.
S. R. HENCHER
349350351352353354355356357358359360361362363364365366367368369370371372373374375376377378379380381382383384385386387388389390391392393394395396397398399400401402403404405406
Fig. 8. Example
Colouronline/colour
hardcopy
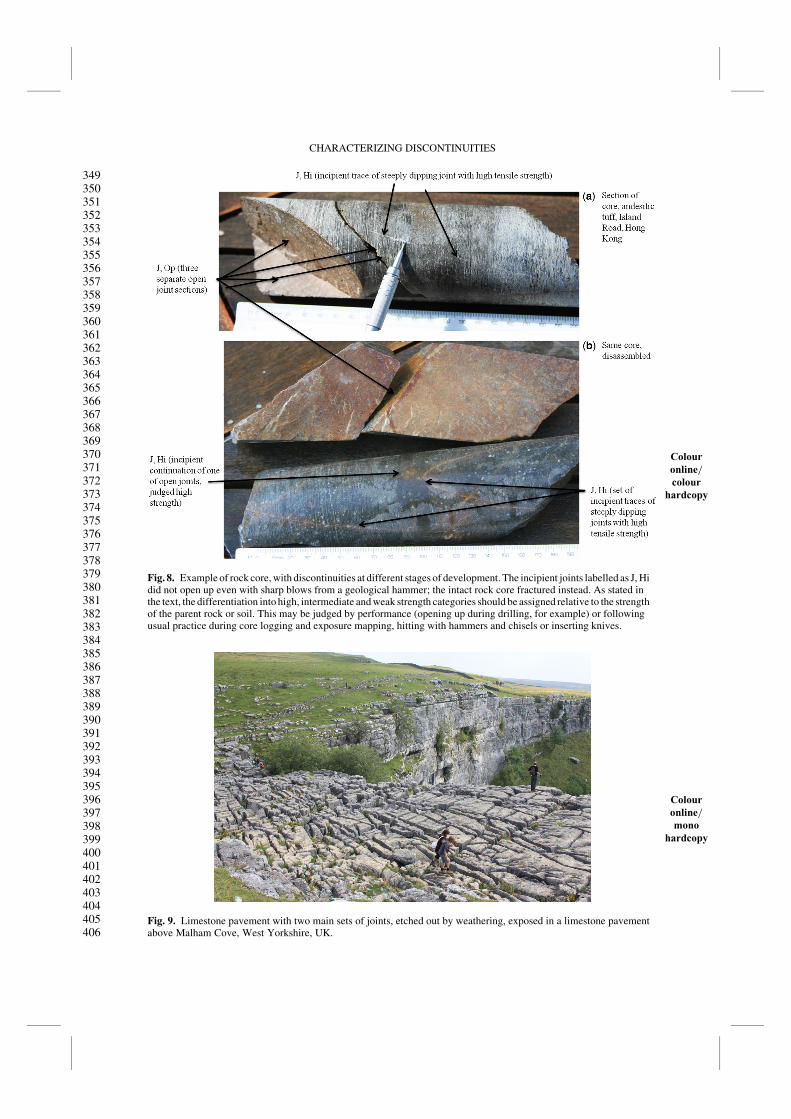
of rock core, with discontinuities at different stages of development. The incipient joints labelled as J, Hidid not open up even with sharp blows from a geological hammer; the intact rock core fractured instead. As stated inthe text, the differentiation into high, intermediate and weak strength categories should be assigned relative to the strengthof the parent rock or soil. This may be judged by performance (opening up during drilling, for example) or followingusual practice during core logging and exposure mapping, hitting with hammers and chisels or inserting knives.
Fig. 9. Limestone
Colouronline/mono
hardcopy
pavement with two main sets of joints, etched out by weathering, exposed in a limestone pavementabove Malham Cove, West Yorkshire, UK.
CHARACTERIZING DISCONTINUITIES
407408409410411412413414415416417418419420421422423424425426427428429430431432433434435436437438439440441442443444445446447448449450451452453454455456457458459460461462463464
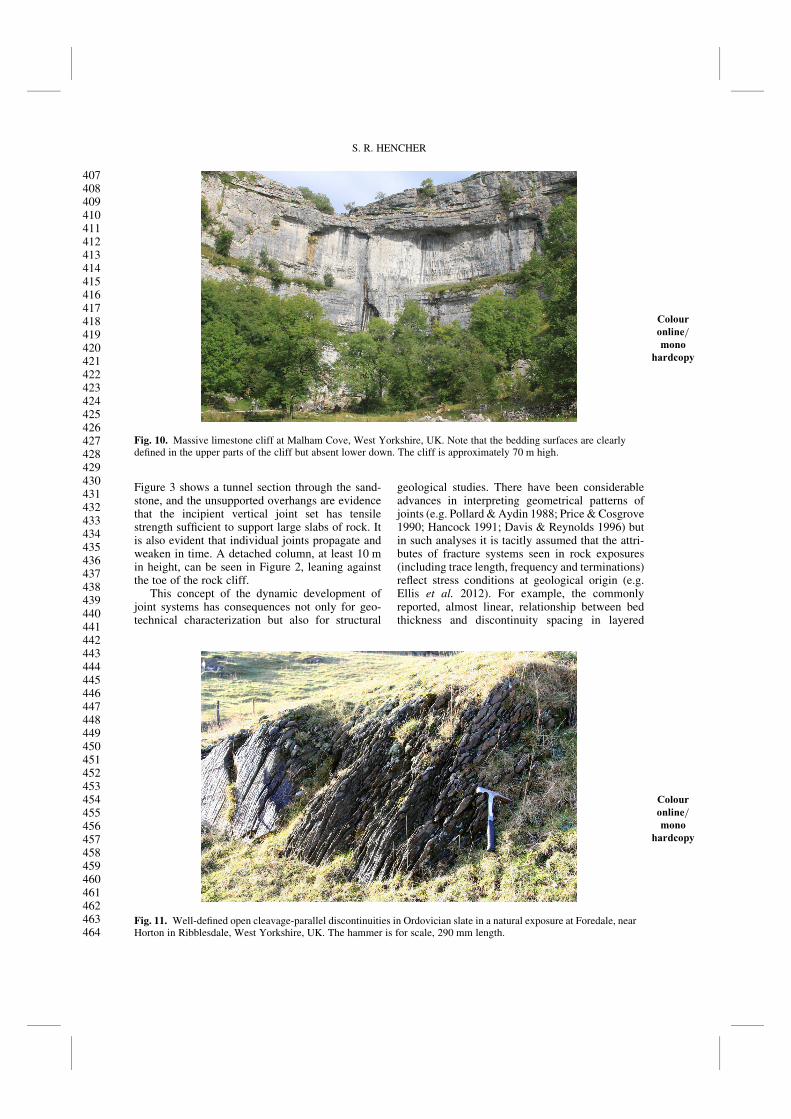
Figure 3 shows a tunnel section through the sand-stone, and the unsupported overhangs are evidencethat the incipient vertical joint set has tensilestrength sufficient to support large slabs of rock. Itis also evident that individual joints propagate andweaken in time. A detached column, at least 10 min height, can be seen in Figure 2, leaning againstthe toe of the rock cliff.
This concept of the dynamic development ofjoint systems has consequences not only for geo-technical characterization but also for structural
geological studies. There have been considerableadvances in interpreting geometrical patterns ofjoints (e.g. Pollard & Aydin 1988; Price & Cosgrove1990; Hancock 1991; Davis & Reynolds 1996) butin such analyses it is tacitly assumed that the attri-butes of fracture systems seen in rock exposures(including trace length, frequency and terminations)reflect stress conditions at geological origin (e.g.Ellis et al. 2012). For example, the commonlyreported, almost linear, relationship between bedthickness and discontinuity spacing in layered
Fig. 10. Massive
Colouronline/mono
hardcopy
limestone cliff at Malham Cove, West Yorkshire, UK. Note that the bedding surfaces are clearlydefined in the upper parts of the cliff but absent lower down. The cliff is approximately 70 m high.
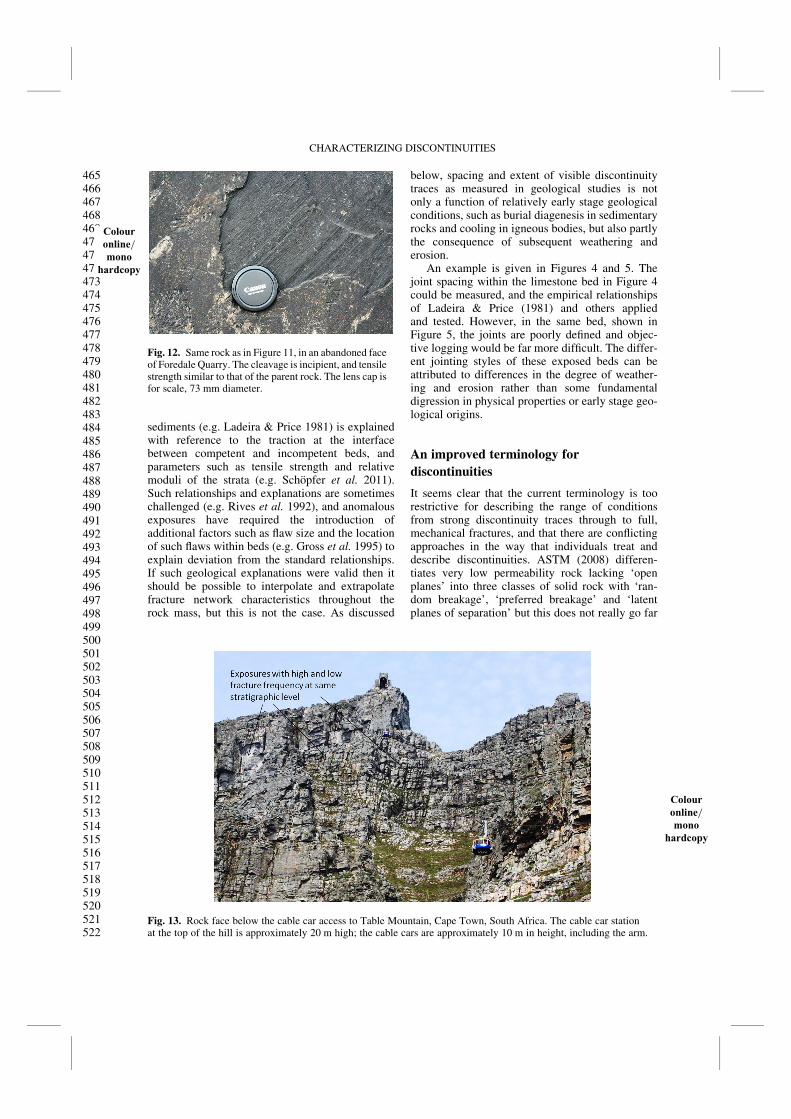
Fig. 11. Well-defined
Colouronline/mono
hardcopy
open cleavage-parallel discontinuities in Ordovician slate in a natural exposure at Foredale, nearHorton in Ribblesdale, West Yorkshire, UK. The hammer is for scale, 290 mm length.
S. R. HENCHER
465466467468469470471472473474475476477478479480481482483484485486487488489490491492493494495496497498499500501502503504505506507508509510511512513514515516517518519520521522
sediments (e.g. Ladeira & Price 1981) is explainedwith reference to the traction at the interfacebetween competent and incompetent beds, andparameters such as tensile strength and relativemoduli of the strata (e.g. Schopfer et al. 2011).Such relationships and explanations are sometimeschallenged (e.g. Rives et al. 1992), and anomalousexposures have required the introduction ofadditional factors such as flaw size and the locationof such flaws within beds (e.g. Gross et al. 1995) toexplain deviation from the standard relationships.If such geological explanations were valid then itshould be possible to interpolate and extrapolatefracture network characteristics throughout therock mass, but this is not the case. As discussed
below, spacing and extent of visible discontinuitytraces as measured in geological studies is notonly a function of relatively early stage geologicalconditions, such as burial diagenesis in sedimentaryrocks and cooling in igneous bodies, but also partlythe consequence of subsequent weathering anderosion.
An example is given in Figures 4 and 5. Thejoint spacing within the limestone bed in Figure 4could be measured, and the empirical relationshipsof Ladeira & Price (1981) and others appliedand tested. However, in the same bed, shown inFigure 5, the joints are poorly defined and objec-tive logging would be far more difficult. The differ-ent jointing styles of these exposed beds can beattributed to differences in the degree of weather-ing and erosion rather than some fundamentaldigression in physical properties or early stage geo-logical origins.
An improved terminology for
discontinuities
It seems clear that the current terminology is toorestrictive for describing the range of conditionsfrom strong discontinuity traces through to full,mechanical fractures, and that there are conflictingapproaches in the way that individuals treat anddescribe discontinuities. ASTM (2008) differen-tiates very low permeability rock lacking ‘openplanes’ into three classes of solid rock with ‘ran-dom breakage’, ‘preferred breakage’ and ‘latentplanes of separation’ but this does not really go far
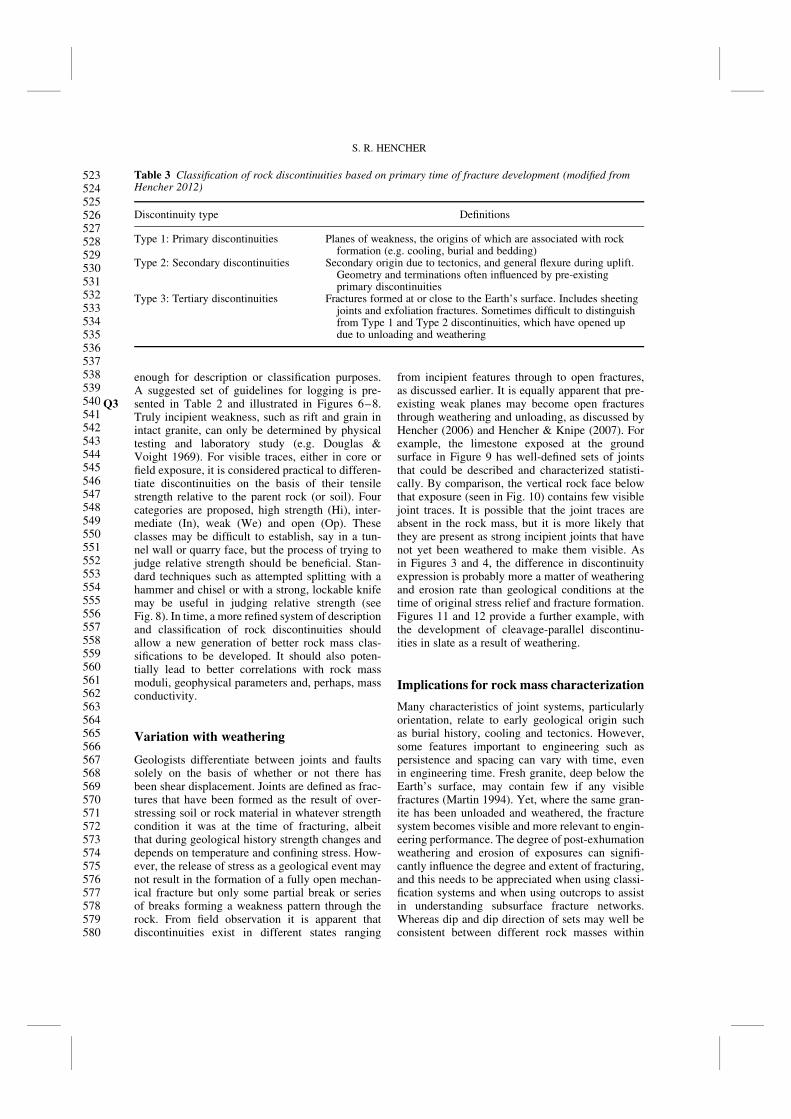
Fig. 12. Same
Colouronline/mono
hardcopy
rock as in Figure 11, in an abandoned faceof Foredale Quarry. The cleavage is incipient, and tensilestrength similar to that of the parent rock. The lens cap isfor scale, 73 mm diameter.
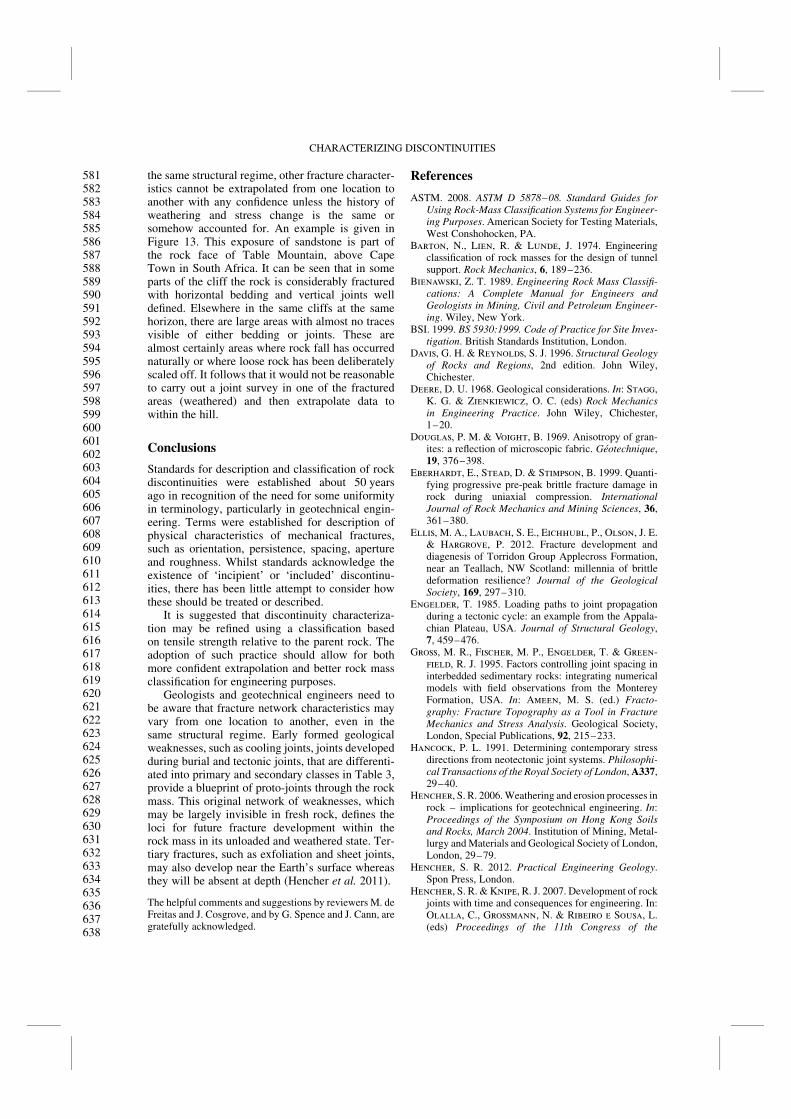
Fig. 13. Rock
Colouronline/mono
hardcopy
face below the cable car access to Table Mountain, Cape Town, South Africa. The cable car stationat the top of the hill is approximately 20 m high; the cable cars are approximately 10 m in height, including the arm.
CHARACTERIZING DISCONTINUITIES
523524525526527528529530531532533534535536537538539540541542543544545546547548549550551552553554555556557558559560561562563564565566567568569570571572573574575576577578579580
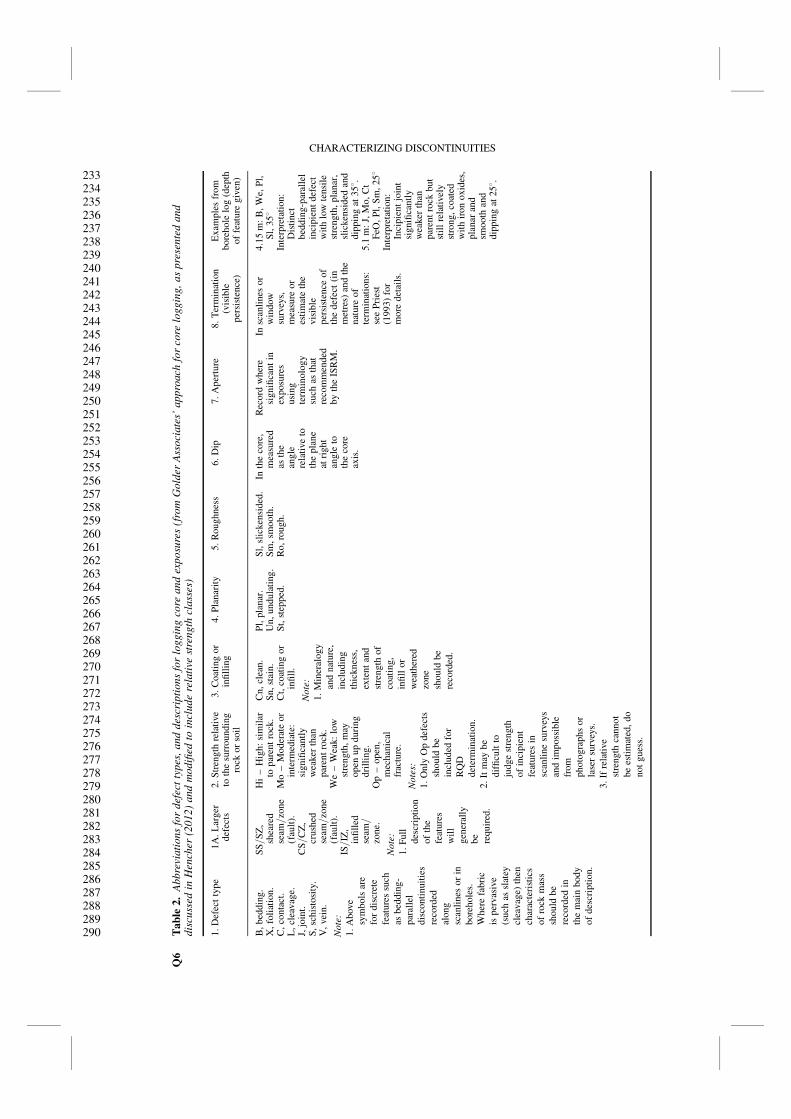
enough for description or classification purposes.A suggested set of guidelines for logging is pre-sented in Table 2 and illustrated in Figures 6–8Q3 .Truly incipient weakness, such as rift and grain inintact granite, can only be determined by physicaltesting and laboratory study (e.g. Douglas &Voight 1969). For visible traces, either in core orfield exposure, it is considered practical to differen-tiate discontinuities on the basis of their tensilestrength relative to the parent rock (or soil). Fourcategories are proposed, high strength (Hi), inter-mediate (In), weak (We) and open (Op). Theseclasses may be difficult to establish, say in a tun-nel wall or quarry face, but the process of trying tojudge relative strength should be beneficial. Stan-dard techniques such as attempted splitting with ahammer and chisel or with a strong, lockable knifemay be useful in judging relative strength (seeFig. 8). In time, a more refined system of descriptionand classification of rock discontinuities shouldallow a new generation of better rock mass clas-sifications to be developed. It should also poten-tially lead to better correlations with rock massmoduli, geophysical parameters and, perhaps, massconductivity.
Variation with weathering
Geologists differentiate between joints and faultssolely on the basis of whether or not there hasbeen shear displacement. Joints are defined as frac-tures that have been formed as the result of over-stressing soil or rock material in whatever strengthcondition it was at the time of fracturing, albeitthat during geological history strength changes anddepends on temperature and confining stress. How-ever, the release of stress as a geological event maynot result in the formation of a fully open mechan-ical fracture but only some partial break or seriesof breaks forming a weakness pattern through therock. From field observation it is apparent thatdiscontinuities exist in different states ranging
from incipient features through to open fractures,as discussed earlier. It is equally apparent that pre-existing weak planes may become open fracturesthrough weathering and unloading, as discussed byHencher (2006) and Hencher & Knipe (2007). Forexample, the limestone exposed at the groundsurface in Figure 9 has well-defined sets of jointsthat could be described and characterized statisti-cally. By comparison, the vertical rock face belowthat exposure (seen in Fig. 10) contains few visiblejoint traces. It is possible that the joint traces areabsent in the rock mass, but it is more likely thatthey are present as strong incipient joints that havenot yet been weathered to make them visible. Asin Figures 3 and 4, the difference in discontinuityexpression is probably more a matter of weatheringand erosion rate than geological conditions at thetime of original stress relief and fracture formation.Figures 11 and 12 provide a further example, withthe development of cleavage-parallel discontinu-ities in slate as a result of weathering.
Implications for rock mass characterization
Many characteristics of joint systems, particularlyorientation, relate to early geological origin suchas burial history, cooling and tectonics. However,some features important to engineering such aspersistence and spacing can vary with time, evenin engineering time. Fresh granite, deep below theEarth’s surface, may contain few if any visiblefractures (Martin 1994). Yet, where the same gran-ite has been unloaded and weathered, the fracturesystem becomes visible and more relevant to engin-eering performance. The degree of post-exhumationweathering and erosion of exposures can signifi-cantly influence the degree and extent of fracturing,and this needs to be appreciated when using classi-fication systems and when using outcrops to assistin understanding subsurface fracture networks.Whereas dip and dip direction of sets may well beconsistent between different rock masses within
Table 3 Classification of rock discontinuities based on primary time of fracture development (modified fromHencher 2012)
Discontinuity type Definitions
Type 1: Primary discontinuities Planes of weakness, the origins of which are associated with rockformation (e.g. cooling, burial and bedding)
Type 2: Secondary discontinuities Secondary origin due to tectonics, and general flexure during uplift.Geometry and terminations often influenced by pre-existingprimary discontinuities
Type 3: Tertiary discontinuities Fractures formed at or close to the Earth’s surface. Includes sheetingjoints and exfoliation fractures. Sometimes difficult to distinguishfrom Type 1 and Type 2 discontinuities, which have opened updue to unloading and weathering
S. R. HENCHER
581582583584585586587588589590591592593594595596597598599600601602603604605606607608609610611612613614615616617618619620621622623624625626627628629630631632633634635636637638
the same structural regime, other fracture character-istics cannot be extrapolated from one location toanother with any confidence unless the history ofweathering and stress change is the same orsomehow accounted for. An example is given inFigure 13. This exposure of sandstone is part ofthe rock face of Table Mountain, above CapeTown in South Africa. It can be seen that in someparts of the cliff the rock is considerably fracturedwith horizontal bedding and vertical joints welldefined. Elsewhere in the same cliffs at the samehorizon, there are large areas with almost no tracesvisible of either bedding or joints. These arealmost certainly areas where rock fall has occurrednaturally or where loose rock has been deliberatelyscaled off. It follows that it would not be reasonableto carry out a joint survey in one of the fracturedareas (weathered) and then extrapolate data towithin the hill.
Conclusions
Standards for description and classification of rockdiscontinuities were established about 50 yearsago in recognition of the need for some uniformityin terminology, particularly in geotechnical engin-eering. Terms were established for description ofphysical characteristics of mechanical fractures,such as orientation, persistence, spacing, apertureand roughness. Whilst standards acknowledge theexistence of ‘incipient’ or ‘included’ discontinu-ities, there has been little attempt to consider howthese should be treated or described.
It is suggested that discontinuity characteriza-tion may be refined using a classification basedon tensile strength relative to the parent rock. Theadoption of such practice should allow for bothmore confident extrapolation and better rock massclassification for engineering purposes.
Geologists and geotechnical engineers need tobe aware that fracture network characteristics mayvary from one location to another, even in thesame structural regime. Early formed geologicalweaknesses, such as cooling joints, joints developedduring burial and tectonic joints, that are differenti-ated into primary and secondary classes in Table 3,provide a blueprint of proto-joints through the rockmass. This original network of weaknesses, whichmay be largely invisible in fresh rock, defines theloci for future fracture development within therock mass in its unloaded and weathered state. Ter-tiary fractures, such as exfoliation and sheet joints,may also develop near the Earth’s surface whereasthey will be absent at depth (Hencher et al. 2011).
The helpful comments and suggestions by reviewers M. deFreitas and J. Cosgrove, and by G. Spence and J. Cann, aregratefully acknowledged.
References
ASTM. 2008. ASTM D 5878–08. Standard Guides forUsing Rock-Mass Classification Systems for Engineer-ing Purposes. American Society for Testing Materials,West Conshohocken, PA.
Barton, N., Lien, R. & Lunde, J. 1974. Engineeringclassification of rock masses for the design of tunnelsupport. Rock Mechanics, 6, 189–236.
Bienawski, Z. T. 1989. Engineering Rock Mass Classifi-cations: A Complete Manual for Engineers andGeologists in Mining, Civil and Petroleum Engineer-ing. Wiley, New York.
BSI. 1999. BS 5930:1999. Code of Practice for Site Inves-tigation. British Standards Institution, London.
Davis, G. H. & Reynolds, S. J. 1996. Structural Geologyof Rocks and Regions, 2nd edition. John Wiley,Chichester.
Deere, D. U. 1968. Geological considerations. In: Stagg,K. G. & Zienkiewicz, O. C. (eds) Rock Mechanicsin Engineering Practice. John Wiley, Chichester,1–20.
Douglas, P. M. & Voight, B. 1969. Anisotropy of gran-ites: a reflection of microscopic fabric. Geotechnique,19, 376–398.
Eberhardt, E., Stead, D. & Stimpson, B. 1999. Quanti-fying progressive pre-peak brittle fracture damage inrock during uniaxial compression. InternationalJournal of Rock Mechanics and Mining Sciences, 36,361–380.
Ellis, M. A., Laubach, S. E., Eichhubl, P., Olson, J. E.& Hargrove, P. 2012. Fracture development anddiagenesis of Torridon Group Applecross Formation,near an Teallach, NW Scotland: millennia of brittledeformation resilience? Journal of the GeologicalSociety, 169, 297–310.
Engelder, T. 1985. Loading paths to joint propagationduring a tectonic cycle: an example from the Appala-chian Plateau, USA. Journal of Structural Geology,7, 459–476.
Gross, M. R., Fischer, M. P., Engelder, T. & Green-field, R. J. 1995. Factors controlling joint spacing ininterbedded sedimentary rocks: integrating numericalmodels with field observations from the MontereyFormation, USA. In: Ameen, M. S. (ed.) Fracto-graphy: Fracture Topography as a Tool in FractureMechanics and Stress Analysis. Geological Society,London, Special Publications, 92, 215–233.
Hancock, P. L. 1991. Determining contemporary stressdirections from neotectonic joint systems. Philosophi-cal Transactions of the Royal Society of London, A337,29–40.
Hencher, S. R. 2006. Weathering and erosion processes inrock – implications for geotechnical engineering. In:Proceedings of the Symposium on Hong Kong Soilsand Rocks, March 2004. Institution of Mining, Metal-lurgy and Materials and Geological Society of London,London, 29–79.
Hencher, S. R. 2012. Practical Engineering Geology.Spon Press, London.
Hencher, S. R. & Knipe, R. J. 2007. Development of rockjoints with time and consequences for engineering. In:Olalla, C., Grossmann, N. & Ribeiro e Sousa, L.(eds) Proceedings of the 11th Congress of the
CHARACTERIZING DISCONTINUITIES
639640641642643644645646647648649650651652653654655656657658659660661662663664665666667668669670671672673674675676677678679680681682683684685686687688689690691692693694695696
International Society for Rock Mechanics, Volume 1.Taylor & Francis, London, 223–226.
Hencher, S. R., Lee, S. G., Carter, T. G. & Richards, L.R. 2011. Sheeting joints –Characterisation, ShearStrength and Engineering. Rock Mechanics and RockEngineering, 44, 1–22.
ISRM. 1978. Suggested methods for the quantitativedescription of discontinuities in rock masses. Inter-national Journal of Rock Mechanics and MiningSciences & Geomechanics Abstracts, 15, 319–368.
Ladeira, F. L. & Price, N. J. 1981. Relationship betweenfracture spacing and bed thickness. Journal of Struc-tural Geology, 3, 179–183.
Martin, D. C. 1994. Quantifying drilling-induced dam-age in samples of Lac du Bonnet granite. In: RockMechanics: Models and Measurements, Challengesfrom the Industry: Proceedings of the First NorthAmerican Rock Mechanics Symposium, Austin,Texas, June 1994. Ashgate Publishing, Farnham,Surrey, 419–427.
Miller, L. D., Goldfarb, R. J., Gehrais, G. E. & Snee,L. W. 1994. Genetic links among fluid cycling, veinformation, regional deformation and plutonism in theJuneau gold belt, southeastern Alaska. Geology, 22,203–206.
Piteau, D. R. 1973. Characterising and extrapolating rockjoint properties in engineering practice. Rock Mech-anics, 2 (Suppl.), 2–31.
Pollard, D. D. & Aydin, A. 1988. Progress in under-standing jointing over the past century. GeologicalSociety of America Bulletin, 100, 1181–1204.
Priest, S. D. 1993. Discontinuity Analysis for Rock Engin-eering. Chapman & Hall, London.
Priest, S. D. & Hudson, J. A. 1981. Estimation of discon-tinuity spacing and trace length using scanline surveys.International Journal for Rock Mechanics and MiningScience, 18, 183–197.
Price, N. J. & Cosgrove, J. 1990. Analysis of Geo-logical Structures. Cambridge University Press,Cambridge.
Ramsay, J. G. & Huber, M. I. 1987. The Techniques ofModern Structural Geology: Volume 2, Folds andFractures. Academic Press, London.
Rives, T., Razack, M., Petit, J.-P. & Rawnsley, K. D.1992. Joint spacing: analogue and numerical simu-lations. Journal of Structural Geology, 14, 925–937.
Schopfer, M. P. J., Arslan, A., Walsh, J. J. & Childs, C.2011. Reconciliation of contrasting theories for frac-ture spacing in layered rocks. Journal of StructuralGeology, 33, 551–56.
Slob, S. 2010. Automated rock mass characterisationusing 3-D terrestial laser scanning. Unpublisheddoctoral thesis, Technische Universiteit Delft.
Zhang, L. & Einstein, H. H. 1998. Estimating the meantrace length of rock discontinuities. Rock Mechanics &Rock Engineering, 31, 217–235.
S. R. HENCHER