Embed Size (px)
Citation preview

Characterizing a fault-zone and associated fractures using lab experiments and attribute-based seismic analysis: an example from Woodford Shale, Anadarko basin, Oklahoma Zonghu Liao*, Ze’ev Reches, and Kurt J. Marfurt, The University of Oklahoma; Nabanita Gupta, Shell Oil Company Summary Woodford Shale exhibits complex geophysical features (e.g., sub-seismic fractures) that are critical for gas exploration. Seismic attributes are effective tools in characterizing the patterns of discontinuities within shale reservoirs. In this study, we characterize a fault/fractures system within Woodford shale by integrating seismic attributes analyses and lab experiment modeling for better interpretation of this system. Introduction The Woodford Shale in middle-west of oklahoma (Fig.1a), was reported to produce dry gas, condensate, and oil within a thickness of ~200ft (Fig. 1a; Gupta, 2012). Due to multiple phases of tectonic activity, the Woodford Shale exhibits heterogeneous lithological features and complex geophysical characteristics (Arroyal, 2009). This complexity requires an integrated characterization of the faults and fractures in this unit. In this study, we characterize a faults/fractures system by application of seismic attributes (Marfurt and Rich, 2010) and clay modeling (Reches, 1988) to gain a better understanding of the relations between stratigraphy and mesostructures (Busetti, 2009). The study could: 1) illuminate faults and understand its physical mechanism within Woodford Shale, and 2) provide fracture distribution for planning of horizontal boreholes and improvement of hydro-fracturing. Study area Faults and the irregular unconformity surface (Fig. 1b) have been highlighted at the top of Woodford Shale by red lines. Our target structure is the north-south fault. Vertical slice (Fig. 2) of the 3D seismic amplitude volumes cutting through the fault AA’ shows the stratigraphic intervals. The red lines show that the fault-zone is vertical and the stratigraphic markers (e.g., pink line) show little vertical displacements; for these features, we interpret this fault as a strike-slip fault. For the analysis of this fault system, we applied clay cake experiments and 3D seismic attributes.
a)
b)
Figure 1: a) Geological map and study area (Asterisk) covers the Woodford in Anadarko basin, Oklahoma (adapted from Gupta, 2012) ; b) Horizontal slice through the 3D-seismic amplitude volume flattened at the level of interest in the Woodford Shale. The red lines represent major faults. AA’ section is presented in Fig.2
Figure 2: Vertical slice of the 3D-seismic amplitude volume with the studied fault-zone (in red lines).
DOI http://dx.doi.org/10.1190/segam2013-0656.1© 2013 SEGSEG Houston 2013 Annual Meeting Page 1416
Dow
nloa
ded
10/1
0/13
to 1
29.1
5.12
7.24
5. R
edis
trib
utio
n su
bjec
t to
SEG
lice
nse
or c
opyr
ight
; see
Ter
ms
of U
se a
t http
://lib
rary
.seg
.org
/

Woodford Shale Fault/Fracture Characterization
Fault model and clay experiments Clay-cake models have been widely used to study wrench faulting (e.g., Reches, 1988; Naylor et al., 1986; Staples et al., 2011). Naylor et al. (1986) presents the evolution of experimental wrench fault zones and recognized these distinct features (Fig. 3): 1) Synthetic Riedel shears (R) that are small strike-slip fault trending ~17ºrelative to the basement fault; 2) Short-lived splay faults near the tips of Riedel shears; 3) Antithetic Riedel shears (R’) striking at ~72º to the basement fault with an opposite sense of shear of the R shears; 4) P faults connecting the discontinuous Riedel shears.
We used a clay deformation apparatus with a horizontal table, and in our strike-slip experiment, the clay cake was placed on top of two plates that were moved laterally with respect to each other. In the experiment discussed here (Fig. 4), a clay cake (1.22 g/cm3, or 76.2 lb/ft3) of approximate dimensions of 15 cm (5.9 in) long, 15 cm (5.9 in) wide, and 5 cm (1.97 in) thick, was built above two flat wood blocks. The faults and fractures were photographed (Figs. 5, 6) every 30 seconds. The whole experiment lasted approximately 30 min. Fig. 6 indicates that our experiment generated fault pattern similar to Naylor et al. (1996). This systematically occurrence of Riedel P shears could be used as major indicators for strike-slip fault.
Figure 3: Mechanical basis for faults/fractures associated with a major strike-slip fault: a) R and R’ faults that developed as Coulomb slip planes; b) Stress on the sides of the tip of a Riedel shear, which indicate the potential faults; c) Stress between two Riedel shears generates P shear (after Naylor et al., 1996).
Figure 4: General view of the strike-slip clay experiment. Circles are marked as indicators for movements.
Figure 5: Photograph from above demonstrating fault and fractures on the top during right-lateral strike-slip.
Figure 6: Photograph from above demonstrating fault Riedels and P shears on top of the deformed clay in the end of right-lateral strike-slip with digitized image.
DOI http://dx.doi.org/10.1190/segam2013-0656.1© 2013 SEGSEG Houston 2013 Annual Meeting Page 1417
Dow
nloa
ded
10/1
0/13
to 1
29.1
5.12
7.24
5. R
edis
trib
utio
n su
bjec
t to
SEG
lice
nse
or c
opyr
ight
; see
Ter
ms
of U
se a
t http
://lib
rary
.seg
.org
/
Woodford Shale Fault/Fracture Characterization
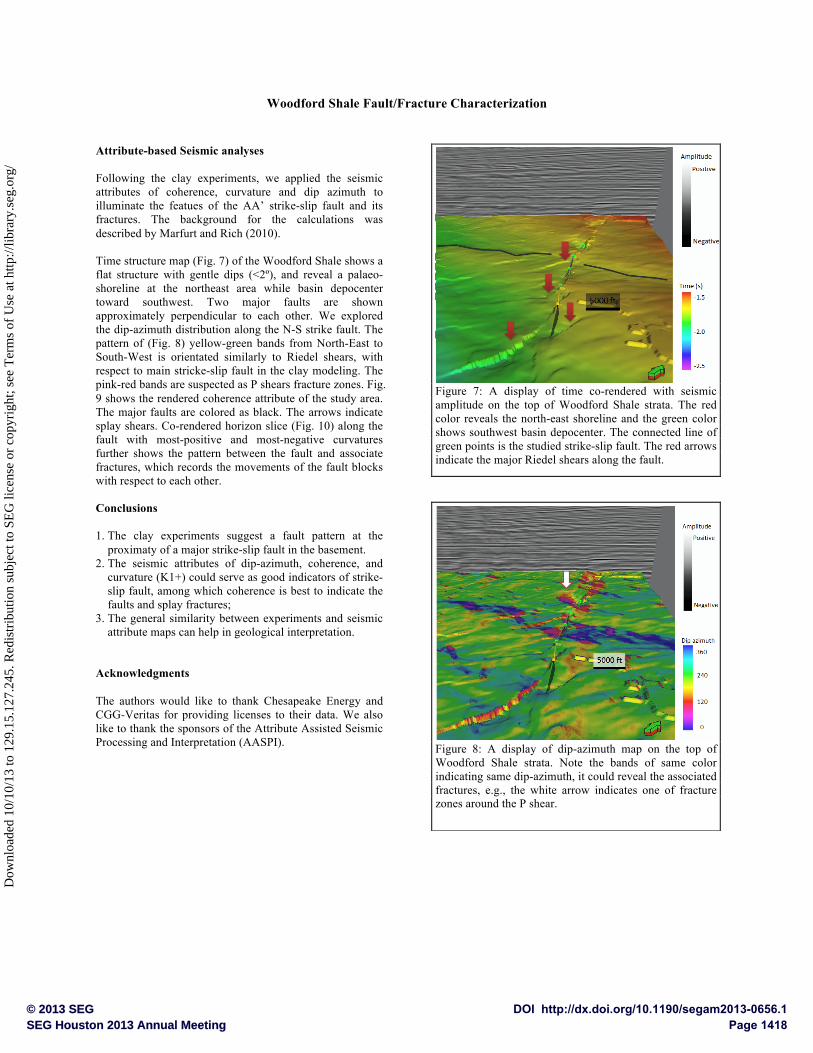
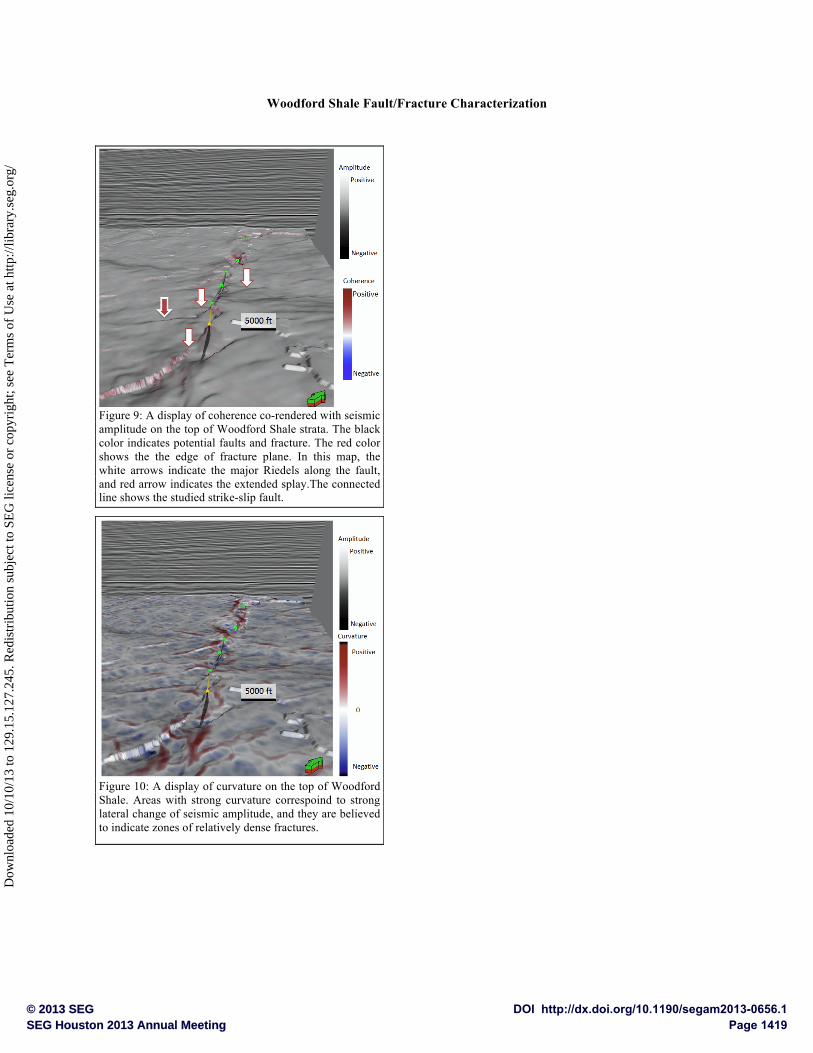
Attribute-based Seismic analyses Following the clay experiments, we applied the seismic attributes of coherence, curvature and dip azimuth to illuminate the featues of the AA’ strike-slip fault and its fractures. The background for the calculations was described by Marfurt and Rich (2010). Time structure map (Fig. 7) of the Woodford Shale shows a flat structure with gentle dips (<2º), and reveal a palaeo- shoreline at the northeast area while basin depocenter toward southwest. Two major faults are shown approximately perpendicular to each other. We explored the dip-azimuth distribution along the N-S strike fault. The pattern of (Fig. 8) yellow-green bands from North-East to South-West is orientated similarly to Riedel shears, with respect to main stricke-slip fault in the clay modeling. The pink-red bands are suspected as P shears fracture zones. Fig. 9 shows the rendered coherence attribute of the study area. The major faults are colored as black. The arrows indicate splay shears. Co-rendered horizon slice (Fig. 10) along the fault with most-positive and most-negative curvatures further shows the pattern between the fault and associate fractures, which records the movements of the fault blocks with respect to each other. Conclusions 1. The clay experiments suggest a fault pattern at the
proximaty of a major strike-slip fault in the basement. 2. The seismic attributes of dip-azimuth, coherence, and
curvature (K1+) could serve as good indicators of strike-slip fault, among which coherence is best to indicate the faults and splay fractures;
3. The general similarity between experiments and seismic attribute maps can help in geological interpretation.
Acknowledgments The authors would like to thank Chesapeake Energy and CGG-Veritas for providing licenses to their data. We also like to thank the sponsors of the Attribute Assisted Seismic Processing and Interpretation (AASPI).
Figure 7: A display of time co-rendered with seismic amplitude on the top of Woodford Shale strata. The red color reveals the north-east shoreline and the green color shows southwest basin depocenter. The connected line of green points is the studied strike-slip fault. The red arrows indicate the major Riedel shears along the fault.
Figure 8: A display of dip-azimuth map on the top of Woodford Shale strata. Note the bands of same color indicating same dip-azimuth, it could reveal the associated fractures, e.g., the white arrow indicates one of fracture zones around the P shear.
DOI http://dx.doi.org/10.1190/segam2013-0656.1© 2013 SEGSEG Houston 2013 Annual Meeting Page 1418
Dow
nloa
ded
10/1
0/13
to 1
29.1
5.12
7.24
5. R
edis
trib
utio
n su
bjec
t to
SEG
lice
nse
or c
opyr
ight
; see
Ter
ms
of U
se a
t http
://lib
rary
.seg
.org
/
Woodford Shale Fault/Fracture Characterization
Figure 9: A display of coherence co-rendered with seismic amplitude on the top of Woodford Shale strata. The black color indicates potential faults and fracture. The red color shows the the edge of fracture plane. In this map, the white arrows indicate the major Riedels along the fault, and red arrow indicates the extended splay.The connected line shows the studied strike-slip fault.
Figure 10: A display of curvature on the top of Woodford Shale. Areas with strong curvature correspoind to strong lateral change of seismic amplitude, and they are believed to indicate zones of relatively dense fractures.
DOI http://dx.doi.org/10.1190/segam2013-0656.1© 2013 SEGSEG Houston 2013 Annual Meeting Page 1419
Dow
nloa
ded
10/1
0/13
to 1
29.1
5.12
7.24
5. R
edis
trib
utio
n su
bjec
t to
SEG
lice
nse
or c
opyr
ight
; see
Ter
ms
of U
se a
t http
://lib
rary
.seg
.org
/
http://dx.doi.org/10.1190/segam2013-0656.1 EDITED REFERENCES Note: This reference list is a copy-edited version of the reference list submitted by the author. Reference lists for the 2013 SEG Technical Program Expanded Abstracts have been copy edited so that references provided with the online metadata for each paper will achieve a high degree of linking to cited sources that appear on the Web. REFERENCES
Arroyal, R. M. P., 2009, Characterization and origin of fracture patterns in the Woodford Shale in southeastern Oklahoma for application to exploration and development: M.S. thesis, University of Oklahoma.
Busetti, S., 2009, Fracturing in layered reservoir rocks: Ph.D. dissertation, University of Oklahoma.
Gupta, N., and K. J. Marfurt, 2012, Multi-scale characterization of the Woodford Shale in west-central Oklahoma: From scanning electron microscope to 3D seismic: Ph.D. dissertation, University of Oklahoma.
Gupta, N., S. Sarkar, and K. J. Marfurt, 2011, Seismic characterization of the Woodford Shale in the Anadarko basin: 81st Annual International Meeting, SEG, Expanded Abstracts, 1083–1087.
Marfurt, K. J., and J. Rich, 2010, Beyond curvature — Volumetric estimation of reflector rotation and convergence: 80th Annual International Meeting, SEG, Expanded Abstracts, 1467–1472.
Naylor, M. A., G. Mandl, and C. H. K. Supesteijn, 1986, Fault geometries in basement-induced wrench faulting under different initial stress states: Journal of Structural Geology, 8, no. 7, 737–752, http://dx.doi.org/10.1016/0191-8141(86)90022-2.
Reches, Z., 1988, Evolution of fault patterns in clay experiments: Tectonophysics, 145, no. 1-2, 141–156, http://dx.doi.org/10.1016/0040-1951(88)90322-8.
Staples, E., K. J. Marfurt, and Z. Reches, 2011, Curvature-fracture relations in clay experiments: 81st Annual International Meeting, SEG, Expanded Abstracts, 1908–1912.
DOI http://dx.doi.org/10.1190/segam2013-0656.1© 2013 SEGSEG Houston 2013 Annual Meeting Page 1420
Dow
nloa
ded
10/1
0/13
to 1
29.1
5.12
7.24
5. R
edis
trib
utio
n su
bjec
t to
SEG
lice
nse
or c
opyr
ight
; see
Ter
ms
of U
se a
t http
://lib
rary
.seg
.org
/