Embed Size (px)
Citation preview

IOSR Journal of Applied Geology and Geophysics (IOSR-JAGG)
e-ISSN: 2321–0990, p-ISSN: 2321–0982.Volume 4, Issue 2 Ver. I (Mar. - Apr. 2016), PP 47-59
www.iosrjournals.org
DOI: 10.9790/0990-0402014759 www.iosrjournals.org 47 | Page
Characterizations of the Late Cenomanian Reservoirs, El Diyur
Field, North Western Desert, Egypt
Esam A. El-Gawad1, Mohamed Fathy
1, and Mohamed M.Ali
2,
1Department of Geology, Faculty of Science, Al-Azhar University, Cairo, Egypt.
2Qarun Petroleum Company, (Apache J.V), Egypt.
Abstract: The study aimed to combine the different available data to understand the subsurface system and the
characteristic of Late Cretaceous reservoirs in El Diyur field to represent the vertical and lateral heterogeneity
at the well, multi-well, and field scale, which could be used as a tool for reservoir management. Seismic
interpretation was conducted on the seismic sections that concerned the study area to make a detailed structural
interpretation to determine the structural geometry of the Late Cretaceous horizons. Petrophysical well log
analysis of the reservoir rock of Abu Roash “G-10” and “G-20” zones have been done and mapped. The
estimated volume of Original Hydrocarbon in Place of Abu Roash “G-10” and “G-20” zones have been
calculated.
I. Introduction El Diyur field is located in the north Western Desert of Egypt, between latitudes 29° 23' N- 29° 25' N
and longitudes 29° 20' E- 29° 24' E occupying a current area of 27 square kilometers (Fig.1). El Diyur field lies
on the southern eastern margin of Abu Gharadig Basin and west of East Bahariya Concession.
II. Materials and methods Interpretation was conducted on seismic lines and (GR, Resistivity, Density and Neutron) logs of four
wells extracted from El-Diyur field (Fig.1). Integrated methods involving seismic interpretation and
petrophysical data analysis were employed to meet the objectives of this study. Interpretations of seismic
sections were done, Abu Roash “G-10” and “G-20” zones were identified and evaluated by generating various
maps such as structural, net reservoir isopach, arithmetic average water saturation and arithmetic average
effective porosity maps.
Geological Setting
Stratigraphic setting
The stratigraphic section of the North Western Desert is thick and includes most of the sedimentary
succession from recent to Pre-Cambrian basement complex [1] (Fig.2).The sedimentary sequence of the study
area based on deepest drilled well ranges in age from the Early Jurassic Ras Qattara Formation to Miocene
Moghra Formation at surface. The Cretaceous mega-sequence is divided into Lower and Upper sequences, the
LowerCretaceous includes Alam El Bueib, Alamein, Dahab and Kharita formations while the Upper Cretaceous
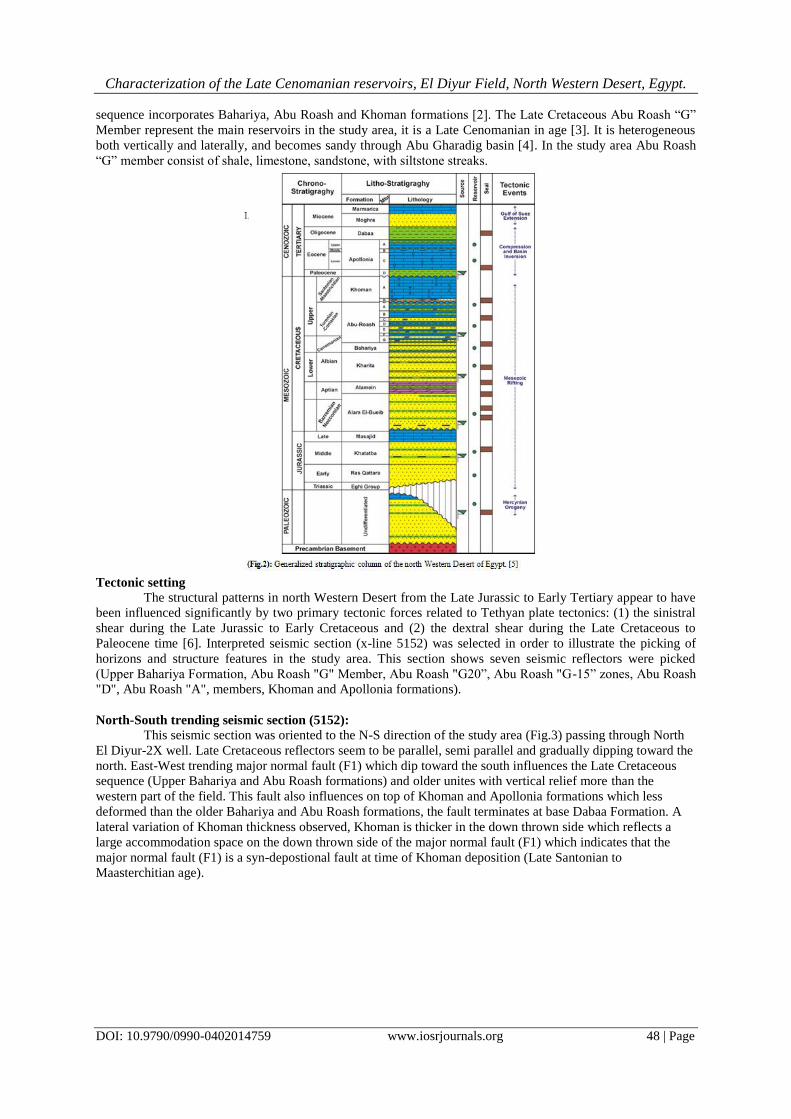
Characterization of the Late Cenomanian reservoirs, El Diyur Field, North Western Desert, Egypt.
DOI: 10.9790/0990-0402014759 www.iosrjournals.org 48 | Page
sequence incorporates Bahariya, Abu Roash and Khoman formations [2]. The Late Cretaceous Abu Roash “G”
Member represent the main reservoirs in the study area, it is a Late Cenomanian in age [3]. It is heterogeneous
both vertically and laterally, and becomes sandy through Abu Gharadig basin [4]. In the study area Abu Roash
“G” member consist of shale, limestone, sandstone, with siltstone streaks.
Tectonic setting
The structural patterns in north Western Desert from the Late Jurassic to Early Tertiary appear to have
been influenced significantly by two primary tectonic forces related to Tethyan plate tectonics: (1) the sinistral
shear during the Late Jurassic to Early Cretaceous and (2) the dextral shear during the Late Cretaceous to
Paleocene time [6]. Interpreted seismic section (x-line 5152) was selected in order to illustrate the picking of
horizons and structure features in the study area. This section shows seven seismic reflectors were picked
(Upper Bahariya Formation, Abu Roash "G" Member, Abu Roash "G20”, Abu Roash "G-15” zones, Abu Roash
"D", Abu Roash "A", members, Khoman and Apollonia formations).
North-South trending seismic section (5152):
This seismic section was oriented to the N-S direction of the study area (Fig.3) passing through North
El Diyur-2X well. Late Cretaceous reflectors seem to be parallel, semi parallel and gradually dipping toward the
north. East-West trending major normal fault (F1) which dip toward the south influences the Late Cretaceous
sequence (Upper Bahariya and Abu Roash formations) and older unites with vertical relief more than the
western part of the field. This fault also influences on top of Khoman and Apollonia formations which less
deformed than the older Bahariya and Abu Roash formations, the fault terminates at base Dabaa Formation. A
lateral variation of Khoman thickness observed, Khoman is thicker in the down thrown side which reflects a
large accommodation space on the down thrown side of the major normal fault (F1) which indicates that the
major normal fault (F1) is a syn-depostional fault at time of Khoman deposition (Late Santonian to
Maasterchitian age).

Characterization of the Late Cenomanian reservoirs, El Diyur Field, North Western Desert, Egypt.
DOI: 10.9790/0990-0402014759 www.iosrjournals.org 49 | Page
Structure contour maps
Structure contour maps constructed on top Abu Roash “G-10” and “G-20” zones, (Fig.4;5) show that
the depth value reach maximum toward the southeastern part of the study area while minimum value occurred
in the central part at the closure and all sedimentary sequence are dipping gradually to north direction. The area
influenced by one major normal fault trending E-W (F1), (The fault tends appear to swing from WNW- to ENE
but it generally East-West direction), there are five minor faults, the most important minor fault was (F2)
trending NW-SE and throws dip to SW. The major fault (F1) is a southerly dipping with a maximum vertical
relief of about ± 800-1000 feet toward the east and decreasing until reach ±350 feet to the center of the study
area. The (F1) heave almost +46 meter toward the west and central part of the study area which indicate a semi-
vertical fault on the other hand heave of the same fault tend to increase toward the east till reach +200 feet. The
NW fault (F2) is a SW dipping minor normal fault leading to form north El Diyur area structure with a vertical
relief of about ± 250 feet. These faults (F1, F2) leading to form a closures which interpreted to be a fault-
dependent three-way dip closures which formed traps for the hydrocarbons on the top of Abu Roash “G-10” and
“G-20” zones. Both faults trends related to dextral convergence between Africa and Eurasia, Africa and Eurasia
changed from sinistral divergence to dextral convergence until the Late Cretaceous ([7]; [8]).
(Fig. 1): N-S trending seismic section (5152) passing through NED-2X well.

Characterization of the Late Cenomanian reservoirs, El Diyur Field, North Western Desert, Egypt.
DOI: 10.9790/0990-0402014759 www.iosrjournals.org 50 | Page
Well Log Analysis
Neutron Density crossplot
Abu Roash “G-10” zone represent the middle clastic reservoir zone of Abu Roash “G” Member, (Fig.6)
shows the neutron density crossplots that have been applied on the Abu Roash “G-10” zone. It is observed that,
the reservoir sandstone plotted points are scattered and lay between sandstone and limestone lines with average
grain density (pma) is 2.67 gm/cc and neutron porosity ranging from 22% to 28%. The zone is mainly reservoir
sandstone with non-reservoir siltstone scattered and lay between limestone and dolomite lines. (Fig.7) shows the
neutron density crossplots that have been applied on the Abu Roash “G-20” sand-I zone. It is observed that, the
major plotted points are scattered and lay between sandstone and limestone lines with average grain density
(pma) is 2.65 gm/cc and neutron porosity ranging from 20% to 30%. The zone is mainly sandstone with non-
reservoir siltstone. While (Fig.8) shows the neutron density crossplots of Abu Roash “G-20” sand-II zone, the
plotted points are scattered and lay between sandstone and limestone lines with average grain density (pma) is
2.67 gm/cc and neutron porosity ranging from 22% to 28%. The zone is mainly calcareous sandstone with
siltstone.

Characterization of the Late Cenomanian reservoirs, El Diyur Field, North Western Desert, Egypt.
DOI: 10.9790/0990-0402014759 www.iosrjournals.org 51 | Page
4.2. Well log analysis results
(Table 1): Reservoir and pay summaries resulted from the petrophysical analysis.

Characterization of the Late Cenomanian reservoirs, El Diyur Field, North Western Desert, Egypt.
DOI: 10.9790/0990-0402014759 www.iosrjournals.org 52 | Page
4.3. Lateral variation of reservoir properties
After calculating the values of the log- parameters, the values have been averaged and mapped to
represent their general distribution.
4.3.1. Abu Roash “G-10” zone
Abu Roash G-10 sandstones were deposited in prograding deltaic distributary environment and exhibit
coarsening-upward profile with related increase in reservoir quality upwards [9]. The net reservoir sandstone
isopach map of the Abu Roash “G-10” zone (Fig.9) shows an increase towards the central and western part of
the study area with maximum value of (25 feet) and minimum value of (2 feet). Two sandstone bodies separated
by facies barrier (non-reservoir fine sandstone and siltstone) this barrier trending northwest direction. From
distribution pattern of net reservoir sandstone and the gradual upward decreasing in Gamma ray log response
reflects an increasing in depositional energy upward characterized this sandstone bodies (Fig.13) Abu Roash
“G-10” were deposited as a distributary river mouth bar facies ([10];[11]), on other hand the area of low values
of sandstone might represent interdistributary fine sandstone and siltstone. The effective porosity distribution
map of the Abu Roash “G-10” (Fig.10) shows an increase toward the central and western part of the study area
and decrease toward the interdistributary fine sandstone and siltstone to the west. It reaches the maximum value
(29%) at the mouth bar facies and the minimum (6%) toward the interdistributary fine sandstone and siltstone
facies which reflects the effect of facies distribution on the effective porosity values. Distribution of the clay
volume (Fig.11) shows an increase of clay volume toward the interdistributary fine sandstone and siltstone
which reflects that clay volume was controlled by facies distribution. The water saturation distribution map of
the Abu Roash “G-10” zone (Fig.12) shows an increasing toward the down-dip of the major noral fault (F1)
where it reaches the maximum value (100%) The water saturation decreasing toward the up-dip of the major
fault of the study area reaching the minimum value (28%).The high values of water saturation toward the up-dip
of the major fault is due to facies change from sandstone to siltstone.
Both facies and structure elements were controlled the water saturation distribution of Abu Roash “G-
10”zone.
4.3.2. Abu Roash “G-20” zone
Abu Roash “G20” was deposited entirely in shallow marine environments where the sands exhibit
strong linear trends. These sands were apparently deposited in sub-tidal bars within a marine embayment. This
interval contains no evidence of incision at the base of the sands and the best sand facies exhibit current ripple
cross bedding, presumably from tidal currents [9]. Abu Roash “G-20” represent the lower clastic reservoir zone
of Abu Roash” Member, this zone represented by reservoir sandstone and siltstone. Abu Roash “G-20”
classified into “G-20”sand-I and “G-20”sand-II zones based on the reservoir sandstone quality due to the
calcareous cement of “G-20”sand-II.

Characterization of the Late Cenomanian reservoirs, El Diyur Field, North Western Desert, Egypt.
DOI: 10.9790/0990-0402014759 www.iosrjournals.org 53 | Page
(Fig.9): Net reservoir isopach map for Abu Roash”G-10” zone.
(Fig.10): Average effective porosity map for Abu Roash”G-10” zone.

Characterization of the Late Cenomanian reservoirs, El Diyur Field, North Western Desert, Egypt.
DOI: 10.9790/0990-0402014759 www.iosrjournals.org 54 | Page
(Fig.11): Average clay volume distribution map for Abu Roash”G-10” zone.
(Fig.12): Water saturation map for Abu Roash”G-10” zone.
(Fig.13): Stratigraphic well-section flattened on top Abu Roash “G-10” shows the gradually upward decreasing
of Gamma Ray response (sandstone coarsing upward).

Characterization of the Late Cenomanian reservoirs, El Diyur Field, North Western Desert, Egypt.
DOI: 10.9790/0990-0402014759 www.iosrjournals.org 55 | Page
4.3.2.1. Abu Roash “G-20” sand-I
The net reservoir sandstone isopach map of the Abu Roash “G-20 sand-I” (Fig.14) shows an increasing
on reservoir sandstone thickness towards the central part of the study area with maximum value (32 feet) at
sandstone body trending to the northeast direction, and minimum value (3 feet) to the eastern part of the study
area. From distribution pattern of net reservoir sandstone and the gradual upward increasing in Gamma ray log
response which characterized this sandstone body (Fig.22) reflects a decreasing in depositional energy upward
which characterizes the tidal creeks [10], this tidal creek cross cut the surrounded tidal flat sediments. The
effective porosity distribution map (Fig.15) shows an increasing toward the central part of the study area
especially toward tidal creek facies, reaches the maximum value (23%) which reflects the influences of facies
distribution on effective porosity and decrease toward the east and western part it reaches the minimum value
(11 %) toward the east. The clay volume distribution map (Fig.16) shows an increasing toward the eastern
part of the study area. The water saturation distribution map (Fig.17) shows that the water saturation decreasing
toward the up-dip of the major normal fault (F1) reaching the minimum value (32%), and increasing toward the
down-dip of the major normal fault (F1) where it reaches the maximum value (100%). Water saturation
distribution was controlled by the structure elements.
4.3.2.2. Abu Roash “G20” sand-II
The net reservoir isopach map of the Abu Roash “G-20” sand-II (Fig.18) shows an increasing on
reservoir sandstone thickness towards the eastern and central part of the study area with maximum value (13
feet) and minimum value (3 feet) to the south western part of the study area. The effective porosity distribution
map (Fig.19) shows an increasing in the effective porosity toward eastern and central part of the study area,
reaches the maximum value (21%) and decrease toward the southern part, and reaches the minimum value (9
%), the distribution of effective porosity reflects that effective porosity was controlled by sandstone distribution.
The clay volume distribution map (Fig.20) shows an increasing of the clay volume values toward the
southeastern part of the study area represent the lowest values of reservoir sandstone which reflects that clay
volume controlled by facies distribution. The water saturation distribution map (Fig.21) shows that the water
saturation decreasing toward the up-dip of the major normal fault (F1) reaching the minimum value (46%), and
increasing toward the down-dip of the major normal fault (F1) where it reaches the maximum value (100%).
Water saturation distribution was controlled by the structure elements.
(Fig.14): Net reservoir isopach map for Abu Roash”G-20” Sand-I zone.

Characterization of the Late Cenomanian reservoirs, El Diyur Field, North Western Desert, Egypt.
DOI: 10.9790/0990-0402014759 www.iosrjournals.org 56 | Page
(Fig.25): Average effective porosity map for Abu Roash”G-20” sand-I zone.
(Fig.16): Average clay volume distribution map for Abu Roash”G-20” sand-I zone.
(Fig.17): Water saturation map for Abu Roash”G-20” sand-I zone.

Characterization of the Late Cenomanian reservoirs, El Diyur Field, North Western Desert, Egypt.
DOI: 10.9790/0990-0402014759 www.iosrjournals.org 57 | Page
(Fig.18): Net reservoir Isopach map for Abu Roash”G-20” sand-II zone.
(Fig.19): Average effective porosity map for Abu Roash”G-20” sand-II zone.
(Fig.20): Average clay volume distribution map for Abu Roash”G-20”sand-II zone.

Characterization of the Late Cenomanian reservoirs, El Diyur Field, North Western Desert, Egypt.
DOI: 10.9790/0990-0402014759 www.iosrjournals.org 58 | Page
(Fig.21): Water saturation distribution map for Abu Roash”G-20”sand-II zone.
(Fig.22): Stratigraphic well-section flattened on top Abu Roash “G-20” shows the fining upward of Gamma Ray
log response of ED-11 and ED-17wells “tidal creek” and normal tidal flat sandstone and siltstone of ED-25
well. Hydrocarbons Volume calculation
Preliminary hydrocarbon volumes have been estimated for “G-10” and “G-20” reservoirs zones. The
reservoir input parameters were based on the sums and averages from the first four drilled wells penetrating the
reservoir section. These estimation were calculated based upon the following formula expressed in terms of
stock tank of original oil in place (STOOIP ):STOOIP ( STB )= 7758 * A * h * Փeff * (1-Sw) * N/G * 1/Bo
Where, A= reservoir area in acre, h= netpay thickness in feet, Փeff =effective porosity in fraction, (1-Sw) =
hydrocarbon saturation in fraction, N/G = net to gross reservoir ratio, Bo = formation volume factor and 7758 is
an acre feet conversion for oil.
(Table 2): The stock tank of original oil in place STOOIP estimated for zones

Characterization of the Late Cenomanian reservoirs, El Diyur Field, North Western Desert, Egypt.
DOI: 10.9790/0990-0402014759 www.iosrjournals.org 59 | Page
III. Summary and Conclusions
The principal structure responsible for hydrocarbon entrapment in the study area was a structural high
which correspond to the three way dip closure of East-West major normal fault (F1) and the Northwest-
Southeast normal fault of North El Diyur area (F2).
Abu Roash “G-10” zone consist of sandstone were deposited as distributary river mouth bar and
interdistributary fine sandstone graded to siltstone with net reservoir thickness between (max. 25 feet - min. 2
feet),effective porosity reaches (max. 29% - min. 6%) at the mouth bar facies and the interdistributary fine
sandstone and siltstone respectively, water saturation values ranging between (max. 100% - min. 28%), water
saturation was controlled by structural and facies elements while effective porosity and clay volume were
controlled mainly by facies distribution. Abu Roash “G-20 sand-I” consist of sandstone deposited at tidal flat
environment with net reservoir thickness between (max. 33 feet - min. 3 feet), effective porosity reaches (max.
23% - min. 11%) at tidal creek sandstone facies and fine tidal flat sandstone respectively. Water saturation
values ranging between (max. 100% - min. 32%).Abu Roash “G-20 sand-II” reservoir composed of calcareous
sandstone with net reservoir thickness between (max. 13 feet - min. 3 feet), effective porosity reaches (max.
21% - min. 9%), water saturation values ranging between (max. 100% - min. 46%).Water saturation values were
controlled by structural elements while effective porosity and clay volume controlled mainly by facies
distribution at Abu Roash “G-20” Sand-I & Sand-II. The cumulative stock tank of original oil in place STOOIP
estimated for the three zones is 104.6 Million Stock Tank Barrel
Acknowledgement
A word of gratitude is extended to the Egyptian Petroleum Corporation (EGPC), Qarun Petroleum Company
(QPC). Sincere thanks to all the staff of Al-Azhar University.
References [1]. Schlumberger, Geology of Egypt Paper presented at the Well Evaluation Conference, Schlumberger, Cairo. (1995), pp. 58-66. [2]. Hantar, G, North Western Desert, In Said, R. (1990), Geology of Egypt, (A.A. Balkema, Rotterdam, Brookfiled, 1990) pp.293-320. [3]. Abdel Aal, A, Subsurface study of the Abu Gharadig basin,Western Desert, Egypt, Msc. Thesis, Ain Shams University,(1990)
[4] Fawzy, A., and Dahi, M, Regional geological evaluation of the Western Desert, Egypt: Paper presented at the Geology of the Arab
World, Cairo University, 1992, pp.111-149.
[5] Moustafa.A. R.,Mesozoic-Cenozoic Basin Evolution in the Northern Western Desert of Egypt. Geology of East Libya, vol. 3, 2008,
pp. 35-42.
[6] W. M. Meshref, Tectonic framework of Egypt. In Said, R. (Ed.), Geology of Egypt,1990, 113-156, Balkema, Rotterdam [7] Savostin, L.A., Sibuet, J.-C., Zonenshain, L.P., Le Pichon, X., and Roulet, M.-J., “Kinematic evolution of the Tethys belt from the
Atlantic Ocean to the Pamirs since the Triassic Tectonophysics", v. 123, (1986).
[8] Smith, A.G, Alpine deformation and the oceanic area of Tethys, Mediterranean and Atlantic.Bull.Geol.Soc.Am.82, 1971, 2039- 2070.
[9] Pasley, M.A., Gabe Artigas, and Nassef, Osama and Joe Comisky, Depositional Facies Control on Reservoir Characteristics in the
Middle and Lower Abu Roash “G” Sandstones, Western Desert, Egypt. Adapted from oral presentation at AAPG International Conference and Exhibition, Cape Town, South Africa, October 26-29, 2008.
[10] Cant, D.J., Subsurface facies analysis, in Walker, R,G., and James, N. P. eds., facies models:response to sea level change,
Geological association of Canada, st. Johns, new-foundland, 1992, P 27-45. [11] Coleman, J.M., & prior, D.B, Deltaic environment in sandstone depostional environments. AAPG, Mem. 31, (1982).