Embed Size (px)
Citation preview
8/12/2019 Characterization of Woodchips for Energy from Forestry and Agroforestry Production
http://slidepdf.com/reader/full/characterization-of-woodchips-for-energy-from-forestry-and-agroforestry-production 1/14
Energies 2012, 5, 3803-3816; doi:10.3390/en5103803
energiesISSN 1996-1073
www.mdpi.com/journal/energies
Article
Characterization of Woodchips for Energy from Forestry and
Agroforestry Production
Rodolfo Picchio1,
*, Raffaello Spina1, Alessandro Sirna
1, Angela Lo Monaco
1,
Vincenzo Civitarese2, Angelo Del Giudice
2, Alessandro Suardi
2 and Luigi Pari
2
1 Department of Science and Technology for Agriculture, Forest, Nature and Energy (DAFNE),
Tuscia University, Via S. Camillo De Lellis, 01100 Viterbo, Italy;
E-Mails: [email protected] (R.S.); [email protected] (A.S.); [email protected] (A.L.M.)2 Agricultural Engineering Research Unit of the Agriculture Research Council (CRA-ING), Via della
Pascolare, 16, 00016 Monterotondo, Italy; E-Mails: [email protected] (V.C.);
[email protected] (A.D.G.); [email protected] (A.S.);
[email protected] (L.P.)
* Author to whom correspondence should be addressed; E-Mail: [email protected];
Tel.: +39-0761-357400; Fax: +39-0761-357250.
Received: 21 August 2012; in revised form: 18 September 2012 / Accepted: 18 September 2012 /
Published: 27 September 2012
Abstract: We set out to determine the particle-size distribution, the fiber, the bark and the
leaves content, the heating value, the CNH and the ash content of a wide sample of wood
chips, collected from 10 forestry and 10 agroforestry production sources. This sampling
focused on two main production types: forestry (Full Tree System—FTS—and logging
residues—LR) and agroforestry (Short Rotation Coppice—SRC). For the forestry production wood chips from coniferous and broadleaf species were considered. For the
agroforestry production wood chips from poplar plantations were examined (different
clones with two different harvesting intervals). Overall, we collected 400 samples. Particle
size distribution was determined with an automatic screening device on 200 samples. The
higher heating value was determined on 200 subsamples using an adiabatic bomb
calorimeter. The CNH and the ash content was ascertained on another 200 subsamples.
FTS and SRC (with three year old sprouts) offered the best quality, with high fiber content
(71%–80%), favorable particle-size distribution and good energetic parameters. On the
contrary, both logging residues and SRC (with two year old sprouts) presented a high bark
content (18%–27%) and occasionally a mediocre particle-size distribution, being often too
rich in fines (6%–12%), but the energetic parameters are in the normal range.
OPEN ACCESS
8/12/2019 Characterization of Woodchips for Energy from Forestry and Agroforestry Production
http://slidepdf.com/reader/full/characterization-of-woodchips-for-energy-from-forestry-and-agroforestry-production 2/14
Energies 2012, 5 3804
Keywords: woody biomass; high heating value; ash content; fiber; bark
1. Introduction
A recent study on timber trade in the World, based on FAO statistics [1], revealed a rising trend in
the use of the wood for various markets, especially in response to energy demand [2]. Because of
increasing crude oil prices, the limited availability of fossil fuels and the deterioration of
environmental quality due to greenhouse gases, mainly CO2, various biomass solid materials have
recently been proposed for use as fuels [3].
According to the analysis carried out by the European Renewable Energy Council, the EU aims for
a 100% renewable energy future by 2050, where biomass will potentially supply about 36% of the total
European primary energy consumption, while the potential for many developing countries is highersince their resources in such areas are larger [4,5].
The versatile nature of wood biomass fuels is both a main asset and a significant obstacle at the
same time. On one hand, wood biomass is available in many forms and in all parts of the World,
allowing the deployment of bioenergy almost everywhere, once the useful sources have been identified
and assessed [6]. On the other hand, this same diversity makes biomass a complex and difficult fuel.
Wood is still the dominant source of fuel in many developing countries. Until now, about 15% of
world energy requirements are provided by biomass. About 13% of wood fuels is used in developing
countries, while 2% is used in developed countries [7]. Among the many methods of potentially
sustainable energy generation in the latter countries, biomass has been receiving increasing attention.
Among the biomass sources that may be used for energy production, wood shows the greatest potential
from both the productive and environmental point of view [7].
The quality of the wood fuel varies according to site characteristics, harvesting season and
silvicultural treatment. Moreover, because of high moisture content, irregular shape and size, and low
bulk density, woody biomass is very difficult to handle, transport, store, and utilize in its original form.
These are the main reasons of interest in determining the relationship between the origin of the wood
fuel and such main quality characteristics as: particle-size distribution, bark content and calorific value.
Particle-size distribution is crucial to fuel handling efficiency, to its drying and reaction rate, to the
energy required for conversion into ethanol, and to the yield of bio-oil obtained from pyrolysis. Bark
has a high ash and alkali metal content, which causes corrosion and sintering of the boilers, although
the ash content in tree bark is 4–5 times lower than in than seen in straw and other herbaceous
crops [6]. A high bark to fiber ratio has a crucial and negative effect on pulping, as well as on heating
value the latter related to the higher moisture content of bark compared to fiber. A high bark content
also has a significant impact on pelletizing potential and pellet durability. Calorific value is an
essential quality for any fuels, and is relatively constant for wood fuels in their dry status [6].
Transformation of woody biomass materials into pellets, briquettes, or chips reduces costs and
problems with handling, transportation, storage, and utilization of low bulk density biomass materials.
Among the various transformation methods tried one in particular—chipping—seems to have achieved
a good compromise. Comminution (or chipping) is an essential element of all modern energy wood
8/12/2019 Characterization of Woodchips for Energy from Forestry and Agroforestry Production
http://slidepdf.com/reader/full/characterization-of-woodchips-for-energy-from-forestry-and-agroforestry-production 3/14
8/12/2019 Characterization of Woodchips for Energy from Forestry and Agroforestry Production
http://slidepdf.com/reader/full/characterization-of-woodchips-for-energy-from-forestry-and-agroforestry-production 4/14
Energies 2012, 5 3806
leaves, “LR” contains no leaves, because it consists of coppice branches harvested in winter, when no
leaves are present, whereas “FTS” contains significant amounts of leaf material because it consists of
conifer trees. The third difference concerns the bark content, “LR” consists of small tree parts
(branches), whereas “FTS” includes the entire tree, with an obvious effect on the bark to fiber ratio.
Table 1. The experimental matrix of 10 different forestry yards.
Types Main trees Code Samples Average DBH cm ± SD
FTS Picea abies L. a 20 15.6 ± 1.1
FTS Picea abies L. b 20 16.5 ± 1.9
FTS Pinus nigra Arn. c 20 22.1 ± 1.5
FTS Pinus pinaster Ait. d 20 23.3 ± 2.1
FTS Pinus halepensis Mill. e 20 16.6 ± 0.9
Types Main trees Code SamplesAverage topping diameter
cm ± SDLR Quercus cerris L. a 20 8.2 ± 1.3
LR Quercus pubescens Willd. b 20 8.1 ± 1.0
LR Quercus cerris L. c 20 9.6 ± 1.6
LR Fagus sylvatica L. d 20 8.2 ± 1.1
LR Fagus sylvatica L. e 20 7.6 ± 0.8
Table 2. The experimental matrix of 10 different agroforestry yards in SRC plantation.
Harvesting interval Poplar clones Code Samples
2 years AF2 a 20
3 years AF2 a 20
2 years AF6 b 20
3 years AF6 b 20
2 years Monviso c 20
3 years Monviso c 20
2 years Monviso d 20
3 years Monviso d 20
2 years Muur e 20
3 years Muur e 20
For the agroforestry production there were wood chips from poplar plantations (different clones
with two different harvesting intervals). For each site 20 chip samples were randomly collected and
each sample consisted of approximately 1 kg of chips, which were put in individual bags, and duly
tagged in order to identify the type and provenance. Sampling aimed at providing a representative
cross-section of current operations and did not follow in detail any specific design to balance
treatments for comparative purposes. For the forestry yards, the FTS sample types were obtained from
first thinning of coniferous woods (range of age 27–35 years), while the LR sample types were
obtained from broadleaved logging residues of final coppice cuts (range of age 19–30 years). Logging
residues consisted of tops and branches, left after the harvesting of adult trees from final cuts. For the10 agroforestry yards for the four clones, two harvesting intervals were selected, the 2 years interval
and the 3 years one. In all the yards the samples had been processed with the same chipper, an
8/12/2019 Characterization of Woodchips for Energy from Forestry and Agroforestry Production
http://slidepdf.com/reader/full/characterization-of-woodchips-for-energy-from-forestry-and-agroforestry-production 5/14
Energies 2012, 5 3807
industrial chipper assembled on a truck with a drum unit. This machine was equipped with an
independent engine (power 100 kW) and hydraulic crane. This was important because chipper
characteristics have been shown to significantly affect particle-size distribution and chips quality [14].
The samples were analyzed for: (1) component breakdown, (2) particle-size distribution and
(3) higher heating value (HHV), (4) content of Carbon (C), Nitrogen (N) and Hydrogen (H) and (5) ash
content. Each of the 400 samples was divided into five sub-samples with different masses. For the
analysis (1) each sub-sample was 0.2 kg, while for the analysis (2) each sub-sample was 0.5 kg and for
the analyses (3–5) each sub-sample was 0.1 kg. The sub-samples were randomly extracted from the
larger pool of original samples.
Component breakdown was determined on 200 g sub-samples, by manually separating their content
into the following main components: fiber, bark, twigs, leaves, dust and other [14]. Each component
was weighed with an Orma (model BC16D) precision scale. Particle-size distribution was determined
on 500 g subsamples, according to CEN/TS 15149-1:2011 “Solid biofuels—Determination of particlesize distribution—Part 1: Oscillating screen method using sieve apertures of 1 mm and above”, using a
certified model FTL0200 automatic screening device. Five sieves were used in order to separate the six
following chip length classes: >100 mm, 100–63 mm, 63–45 mm, 45–16 mm, 16–3.15 mm, <3.15 mm.
Each fraction was then weighed with the Orma (model BC16D) precision scale.
According to the European Standard UNI EN 14918:2010 “Solid biofuels—Method for the
determination of calorific value”, for the measurement of the higher heating value a sub-sample of
100 g was ground with an Ika Werke MF10B rotating-blade mill equipped with a 0.7 mm sieve, then
1 g of wood dust was selected and compressed into pellets with a Parr manual press. The pellet was
burned in a Parr 6200 adiabatic bomb calorimeter.According to the European Standard UNI EN 15104:2011 “Solid biofuels—Determination of total
content of carbon, hydrogen and nitrogen—Instrumental methods”, the content of C, H, and N was
determined in a sub-sample of 100 g. Biomass content of C, H and N was analyzed in a Leco CHN
1000 elemental analyzer by the LECO-1 method using a combustion analyzer.
Standard ash was prepared according to UNI EN 14775:2010 “Solid biofuels—Determination of
ash content”. The fuel sub-sample of 100 g was ground with an Ika Werke MF10B rotating-blade mill
equipped with a 1 mm sieve. Then, only 50 g was placed in a laboratory furnace in such a way that the
sample loading did not exceed 1.0 kg/m2. The furnace was heated to 250 °C at a rate of 0.083 °C/s.
The sample was left at this temperature for 1 h to allow devolatilization before ignition. Afterwards,
the furnace was heated at 0.083 °C/s to 550 °C. The sample was maintained at this temperature for 2 h,
removed from the furnace, cooled in ambient air for approximately 5 min, then transferred to a
dessicator and after cooling to ambient temperature, weighed.
Data were analyzed with the Statistica 2010 advanced statistics software, in order to check the
statistical significance of the eventual differences between treatments with ANOVA and MANOVA
techniques. Post-hoc tests were conducted with Tukey HSD test method.
8/12/2019 Characterization of Woodchips for Energy from Forestry and Agroforestry Production
http://slidepdf.com/reader/full/characterization-of-woodchips-for-energy-from-forestry-and-agroforestry-production 6/14
Energies 2012, 5 3808
3. Results
3.1. Component Breakdown
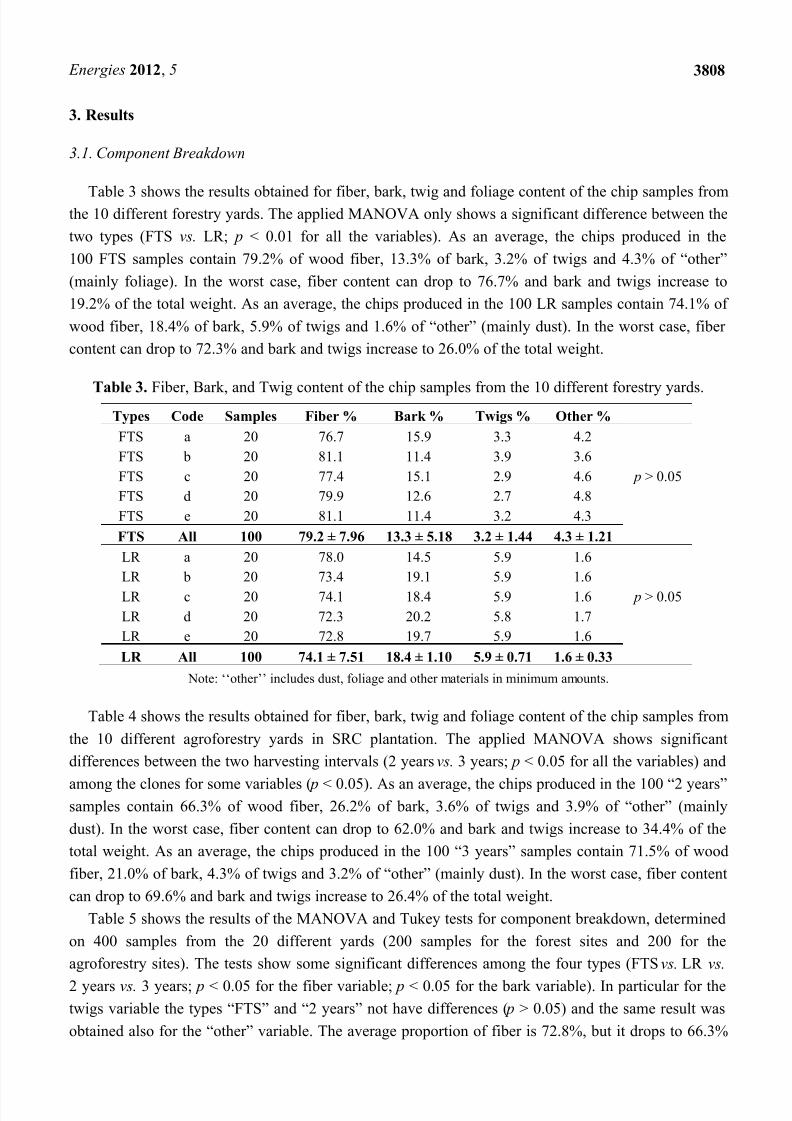
Table 3 shows the results obtained for fiber, bark, twig and foliage content of the chip samples fromthe 10 different forestry yards. The applied MANOVA only shows a significant difference between the
two types (FTS vs. LR; p < 0.01 for all the variables). As an average, the chips produced in the
100 FTS samples contain 79.2% of wood fiber, 13.3% of bark, 3.2% of twigs and 4.3% of “other”
(mainly foliage). In the worst case, fiber content can drop to 76.7% and bark and twigs increase to
19.2% of the total weight. As an average, the chips produced in the 100 LR samples contain 74.1% of
wood fiber, 18.4% of bark, 5.9% of twigs and 1.6% of “other” (mainly dust). In the worst case, fiber
content can drop to 72.3% and bark and twigs increase to 26.0% of the total weight.
Table 3. Fiber, Bark, and Twig content of the chip samples from the 10 different forestry yards.Types Code Samples Fiber % Bark % Twigs % Other %
FTS a 20 76.7 15.9 3.3 4.2
p > 0.05
FTS b 20 81.1 11.4 3.9 3.6
FTS c 20 77.4 15.1 2.9 4.6
FTS d 20 79.9 12.6 2.7 4.8
FTS e 20 81.1 11.4 3.2 4.3
FTS All 100 79.2 ± 7.96 13.3 ± 5.18 3.2 ± 1.44 4.3 ± 1.21
LR a 20 78.0 14.5 5.9 1.6
p > 0.05
LR b 20 73.4 19.1 5.9 1.6
LR c 20 74.1 18.4 5.9 1.6
LR d 20 72.3 20.2 5.8 1.7
LR e 20 72.8 19.7 5.9 1.6
LR All 100 74.1 ± 7.51 18.4 ± 1.10 5.9 ± 0.71 1.6 ± 0.33
Note: ‘‘other’’ includes dust, foliage and other materials in minimum amounts.
Table 4 shows the results obtained for fiber, bark, twig and foliage content of the chip samples from
the 10 different agroforestry yards in SRC plantation. The applied MANOVA shows significant
differences between the two harvesting intervals (2 years vs. 3 years; p < 0.05 for all the variables) and
among the clones for some variables ( p < 0.05). As an average, the chips produced in the 100 “2 years”samples contain 66.3% of wood fiber, 26.2% of bark, 3.6% of twigs and 3.9% of “other” (mainly
dust). In the worst case, fiber content can drop to 62.0% and bark and twigs increase to 34.4% of the
total weight. As an average, the chips produced in the 100 “3 years” samples contain 71.5% of wood
fiber, 21.0% of bark, 4.3% of twigs and 3.2% of “other” (mainly dust). In the worst case, fiber content
can drop to 69.6% and bark and twigs increase to 26.4% of the total weight.
Table 5 shows the results of the MANOVA and Tukey tests for component breakdown, determined
on 400 samples from the 20 different yards (200 samples for the forest sites and 200 for the
agroforestry sites). The tests show some significant differences among the four types (FTS vs. LR vs.
2 years vs. 3 years; p < 0.05 for the fiber variable; p < 0.05 for the bark variable). In particular for the
twigs variable the types “FTS” and “2 years” not have differences ( p > 0.05) and the same result was
obtained also for the “other” variable. The average proportion of fiber is 72.8%, but it drops to 66.3%
8/12/2019 Characterization of Woodchips for Energy from Forestry and Agroforestry Production
http://slidepdf.com/reader/full/characterization-of-woodchips-for-energy-from-forestry-and-agroforestry-production 7/14
8/12/2019 Characterization of Woodchips for Energy from Forestry and Agroforestry Production
http://slidepdf.com/reader/full/characterization-of-woodchips-for-energy-from-forestry-and-agroforestry-production 8/14
Energies 2012, 5 3810
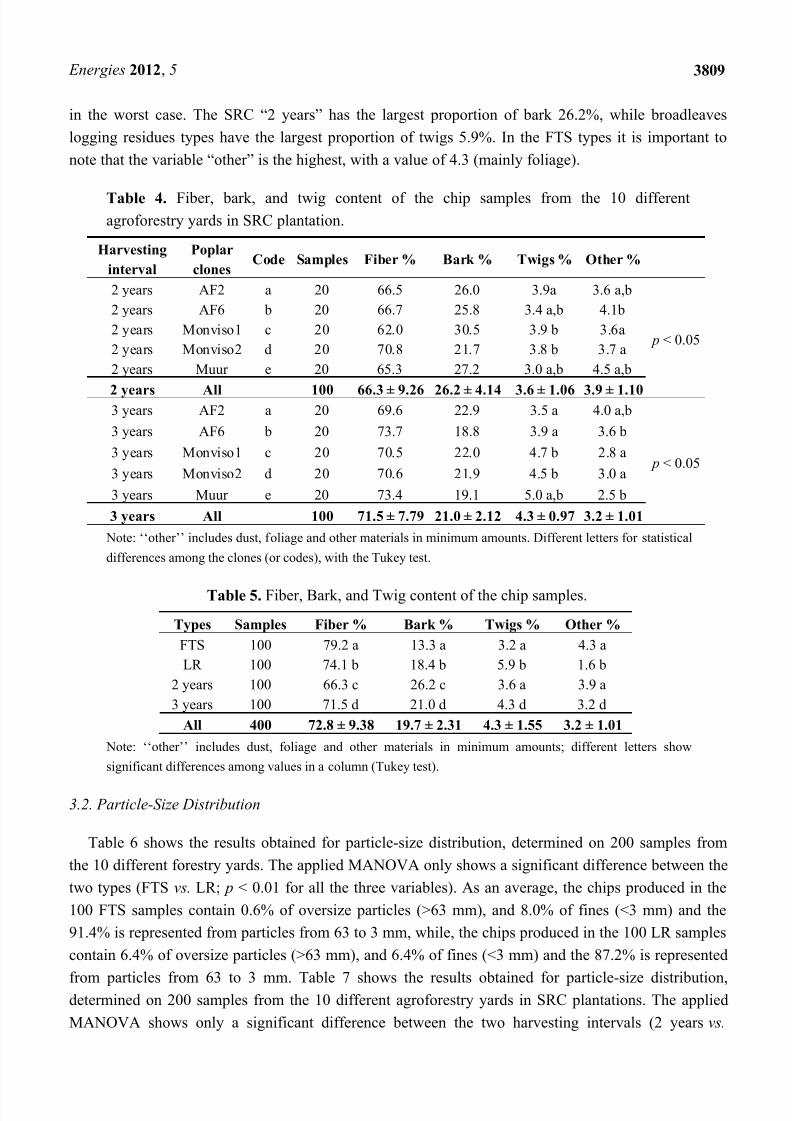
3 years; p < 0.05 for all the three variables). On average, the chips produced in the 100 “2 years”
samples contain 1.0% of oversize particles (>63 mm), and 11.8% of fines (<3 mm) and the 87.3% is
represented from particles from 63 to 3 mm, while, the chips produced in the 100
“3 years” samples contain 2.3% of oversize particles (>63 mm), and 8.0% of fines (<3 mm) and the
89.7% is represented from particles from 63 to 3 mm.
Table 6. Particle size distribution of the chip samples from the 10 different forestry yards.
Types Code Samples Oversize % Acceptable % Fines %
FTS a 20 0.6 91.5 7.8
p > 0.05
FTS b 20 0.5 91.3 8.2
FTS c 20 0.5 91.7 7.8
FTS d 20 0.6 91.5 7.9
FTS e 20 0.6 91.2 8.2
FTS All 100 0.6 ± 0.14 91.4 ± 1.18 8.0 ± 1.16LR a 20 6.8 85.0 8.1
p > 0.05
LR b 20 6.6 87.6 5.9
LR c 20 6.1 88.0 5.8
LR d 20 6.1 87.0 6.9
LR e 20 6.5 88.4 5.1
LR All 100 6.4 ± 0.98 87.2 ± 2.10 6.4 ± 1.73
Note: Oversize = particles > 63 mm; Acceptable = particles from 63 to 3 mm; Fines = particles < 3 mm;
eventual values in bold represent a difference between the code.
Table 7. Particle size distribution of the chip samples from the 10 different agroforestry
yards in SRC plantation.
Harvesting
interval
Poplar
clonesCode Samples Oversize % Acceptable % Fines %
2 years AF2 a 20 0.9 86.8 12.3
p > 0.05
2 years AF6 b 20 0.9 90.4 8.7
2 years Monviso1 c 20 1.0 88.9 10.1
2 years Monviso2 d 20 1.0 87.2 11.9
2 years Muur e 20 1.0 83.2 15.9
2 years All 100 1.0 ± 0.31 87.3 ± 4.65 11.8 ± 4.663 years AF2 a 20 2.4 85.9 11.8
p > 0.05
3 years AF6 b 20 2.4 91.4 6.1
3 years Monviso1 c 20 2.2 90.7 7.1
3 years Monviso2 d 20 2.3 89.5 8.2
3 years Muur e 20 2.0 91.1 6.9
3 years All 100 2.3 ± 0.45 89.7 ± 3.03 8.0 ± 2.93
Note: Oversize = particles > 63 mm; Acceptable = particles from 63 to 3 mm; Fines = particles < 3 mm;
eventual values in bold represent a difference between the code.
8/12/2019 Characterization of Woodchips for Energy from Forestry and Agroforestry Production
http://slidepdf.com/reader/full/characterization-of-woodchips-for-energy-from-forestry-and-agroforestry-production 9/14
Energies 2012, 5 3811
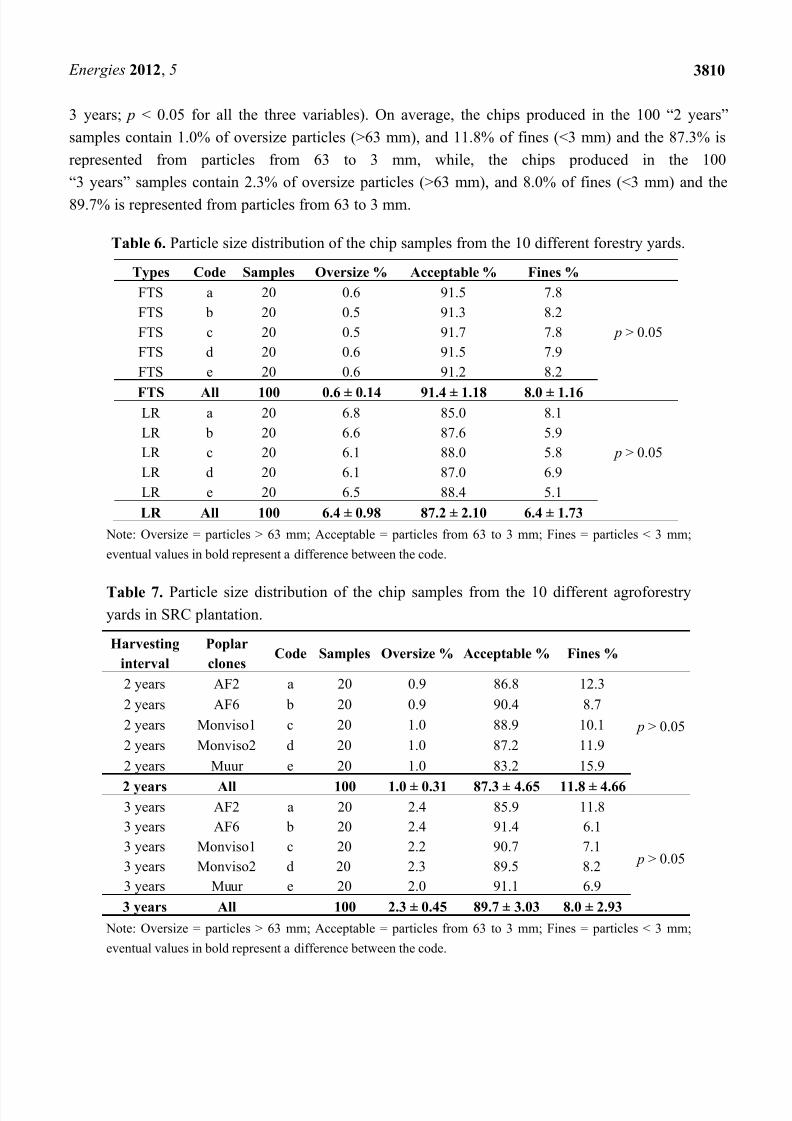
Table 8 shows the MANOVA results obtained for particle-size distribution, determined on
400 samples from the 20 different yards. The test shows some significant differences between the four
types (FTS vs. LR vs. 2 years vs. 3 years; p < 0.01 for the oversize variable; p < 0.05 for the acceptable
variable; p < 0.05 for the fines variable). In particular for the acceptable variable the types “LR” and
“2 years” have no differences, while for the fines variable the types “FTS” and “3 years” have
no differences.
The average proportion of the acceptable fraction (63 to 3 mm) is 88.9%, but it drops to 73.1% in
the worst case. Broadleaved logging residues have the largest proportion of oversize particles 6.4%,
while SRC “2years” types has the largest proportion of fines particles 11.8%.
Table 8. Particle size distribution of the chip samples.
Types Samples Oversize % Acceptable % Fines %
FTS 100 0.6 a 91.4 a 8.0 a
LR 100 6.4 b 87.2 b 6.4 b
2 years 100 1.0 c 87.3 b 11.8 c
3 years 100 2.3 d 89.7 c 8.0 a
All 400 2.56 ± 2.38 88.91 ± 3.50 8.54 ± 3.54
Note: Oversize = particles > 63 mm; Acceptable = particles from 63 to 3 mm; Fines = particles < 3 mm;
different letters show significant differences among values in a column (Tukey test).
3.3. Energetic Characterization
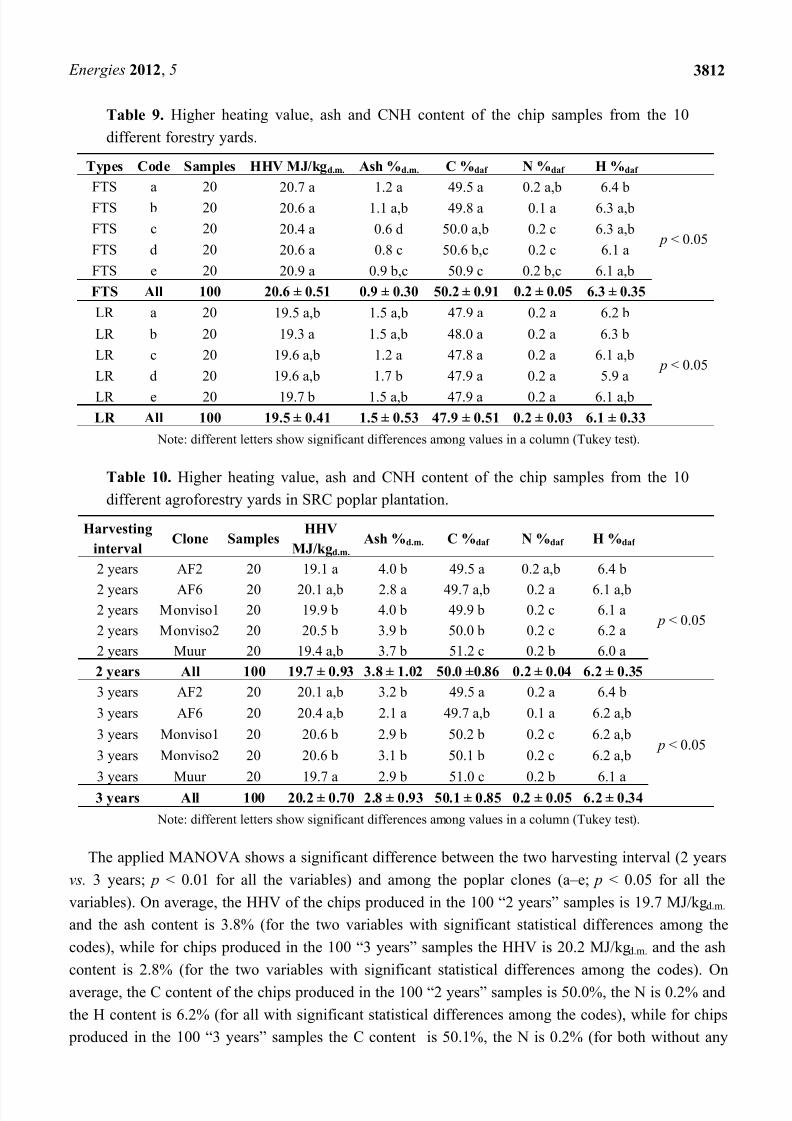
Table 9 shows the results obtained for energetic parameters, determined on 200 samples from the
10 different forestry yards. The applied MANOVA shows a significant difference between the two
types (FTS vs. LR; p < 0.01 for all the variables) and among the five “codes” (a–e; p < 0.05 for some
variables). As an average, the HHV of the chips produced in the 100 FTS samples is 20.6 MJ/kg d.m.
and the ash content is 0.9% (but with significant statistical differences among the codes), while for
chips produced in the 100 LR samples the HHV is 19.5 MJ/kgd.m. and the ash content is 1.5% (but for
the two variables with significant statistical differences among the code). As an average, the C content
of the chips produced in the 100 FTS samples is 50.2%, the N is 0.2% (for both with significant
statistical differences among the codes) and the H content is 6.3% (but with low statistical differences
among the codes), while for chips produced in the 100 LR samples the C content is 47.9%, the N is0.2% (for both without any differences among the codes) and the H content is 6.1% (but with low
statistical differences among the codes).
Table 10 shows the results obtained for energetic parameters, determined on 200 samples from the
10 different agroforestry yards in the SRC plantations.
8/12/2019 Characterization of Woodchips for Energy from Forestry and Agroforestry Production
http://slidepdf.com/reader/full/characterization-of-woodchips-for-energy-from-forestry-and-agroforestry-production 10/14
Energies 2012, 5 3812
Table 9. Higher heating value, ash and CNH content of the chip samples from the 10
different forestry yards.
Types Code Samples HHV MJ/kgd.m. Ash %d.m. C %daf N %daf H %daf
FTS a 20 20.7 a 1.2 a 49.5 a 0.2 a,b 6.4 b
p < 0.05
FTS b 20 20.6 a 1.1 a,b 49.8 a 0.1 a 6.3 a,b
FTS c 20 20.4 a 0.6 d 50.0 a,b 0.2 c 6.3 a,b
FTS d 20 20.6 a 0.8 c 50.6 b,c 0.2 c 6.1 a
FTS e 20 20.9 a 0.9 b,c 50.9 c 0.2 b,c 6.1 a,b
FTS All 100 20.6 ± 0.51 0.9 ± 0.30 50.2 ± 0.91 0.2 ± 0.05 6.3 ± 0.35
LR a 20 19.5 a,b 1.5 a,b 47.9 a 0.2 a 6.2 b
p < 0.05
LR b 20 19.3 a 1.5 a,b 48.0 a 0.2 a 6.3 b
LR c 20 19.6 a,b 1.2 a 47.8 a 0.2 a 6.1 a,b
LR d 20 19.6 a,b 1.7 b 47.9 a 0.2 a 5.9 a
LR e 20 19.7 b 1.5 a,b 47.9 a 0.2 a 6.1 a,b
LR All 100 19.5 ± 0.41 1.5 ± 0.53 47.9 ± 0.51 0.2 ± 0.03 6.1 ± 0.33
Note: different letters show significant differences among values in a column (Tukey test).
Table 10. Higher heating value, ash and CNH content of the chip samples from the 10
different agroforestry yards in SRC poplar plantation.
Harvesting
intervalClone Samples
HHV
MJ/kgd.m. Ash %d.m. C %daf N %daf H %daf
2 years AF2 20 19.1 a 4.0 b 49.5 a 0.2 a,b 6.4 b
p < 0.05
2 years AF6 20 20.1 a,b 2.8 a 49.7 a,b 0.2 a 6.1 a,b2 years Monviso1 20 19.9 b 4.0 b 49.9 b 0.2 c 6.1 a
2 years Monviso2 20 20.5 b 3.9 b 50.0 b 0.2 c 6.2 a
2 years Muur 20 19.4 a,b 3.7 b 51.2 c 0.2 b 6.0 a
2 years All 100 19.7 ± 0.93 3.8 ± 1.02 50.0 ±0.86 0.2 ± 0.04 6.2 ± 0.35
3 years AF2 20 20.1 a,b 3.2 b 49.5 a 0.2 a 6.4 b
p < 0.05
3 years AF6 20 20.4 a,b 2.1 a 49.7 a,b 0.1 a 6.2 a,b
3 years Monviso1 20 20.6 b 2.9 b 50.2 b 0.2 c 6.2 a,b
3 years Monviso2 20 20.6 b 3.1 b 50.1 b 0.2 c 6.2 a,b
3 years Muur 20 19.7 a 2.9 b 51.0 c 0.2 b 6.1 a
3 years All 100 20.2 ± 0.70 2.8 ± 0.93 50.1 ± 0.85 0.2 ± 0.05 6.2 ± 0.34
Note: different letters show significant differences among values in a column (Tukey test).
The applied MANOVA shows a significant difference between the two harvesting interval (2 years
vs. 3 years; p < 0.01 for all the variables) and among the poplar clones (a–e; p < 0.05 for all the
variables). On average, the HHV of the chips produced in the 100 “2 years” samples is 19.7 MJ/kg d.m.
and the ash content is 3.8% (for the two variables with significant statistical differences among the
codes), while for chips produced in the 100 “3 years” samples the HHV is 20.2 MJ/kgd.m. and the ash
content is 2.8% (for the two variables with significant statistical differences among the codes). On
average, the C content of the chips produced in the 100 “2 years” samples is 50.0%, the N is 0.2% and
the H content is 6.2% (for all with significant statistical differences among the codes), while for chips
produced in the 100 “3 years” samples the C content is 50.1%, the N is 0.2% (for both without any
8/12/2019 Characterization of Woodchips for Energy from Forestry and Agroforestry Production
http://slidepdf.com/reader/full/characterization-of-woodchips-for-energy-from-forestry-and-agroforestry-production 11/14
8/12/2019 Characterization of Woodchips for Energy from Forestry and Agroforestry Production
http://slidepdf.com/reader/full/characterization-of-woodchips-for-energy-from-forestry-and-agroforestry-production 12/14
8/12/2019 Characterization of Woodchips for Energy from Forestry and Agroforestry Production
http://slidepdf.com/reader/full/characterization-of-woodchips-for-energy-from-forestry-and-agroforestry-production 13/14
Energies 2012, 5 3815
4. Zervos, A.; Lins, C.; Muth, J.; Smith, E. Re-Thinking 2050: A 100% Renewable Energy Vision for
the European Union; European Renewable Energy Council (EREC): Brussels, Belgium, 2010.
5. Houshfar, E.; Løvås, T.; Skreiberg, Ø. Experimental investigation on NOx reduction by primary
measures in biomass combustion: Straw, peat, sewage sludge, forest residues and wood pellets.
Energies 2012, 5, 270–290.
6. Spinelli, R.; Nati, C.; Sozzi, L.; Magagnotti, N.; Picchi, G. Physical characterization of
commercial woodchips on the Italian energy market. Fuel 2011, 90, 2198–2202.
7. Picchio, R.; Maesano, M.; Savelli, S.; Marchi, E. Productivity and energy balance in conversion
of a Quercus cerris L. coppice stand into high forest in Central Italy. Croatian J. For. Eng. 2009,
30, 15–26.
8. Spinelli, R.; Magagnotti, N.; Paletto, G.; Preti, C. Determining the impact of some wood
characteristics on the performance of a mobile chipper. Silva Fenn. 2011, 45, 85–95.
9. Saarinen, V.M. The effects of slash and stump removal on productivity and quality of forestregeneration operations—Preliminary results. Biomass Bioenergy 2006, 30, 349–356.
10. Picchio, R.; Verani, S.; Sperandio, G.; Spina, R.; Marchi, E. Stump grinding on a poplar
plantation: Working time, productivity, and economic and energetic inputs. Ecol. Eng. 2012, 40,
117–120.
11. Verwijst, T.; Telenius, B. Biomass estimation procedures in short rotation forestry. For. Ecol.
Manag. 1999, 121, 137–146.
12. Vega-Nieva, D.; Dopazo, R.; Ortiz, L. Reviewing the Potential of Forest Bioenergy Plantations:
Woody Energy Crop Plantations Management and Breeding for Increasing Biomass Productivity.
In Proceedings of the World Bioenergy 2008 Conference, Jönköping, Sweden, 27–29 May 2008; pp. 27–29.
13. Picchio, R.; Sirna, A.; Sperandio, G.; Spina, R.; Verani, S. Mechanized harvesting of Eucalypt
coppice for biomass production using high mechanization level. Croatian J. For. Eng. 2012, 33,
15–24.
14. Spinelli, R.; Hartsough, B.; Magagnotti, N. Testing mobile chippers for chip size distribution.
Int. J. For. Eng. 2005, 16 , 29–35.
15. Nati, C.; Spinelli, R.; Fabbri, P. Wood chips size distribution in relation to blade wear and screen
use. Biomass Bioenergy 2010, 34, 583–587.
16. Naik, S.; Goud, V.V.; Rout, P.K.; Jacobson, K.; Dalai, A.K. Characterization of Canadian
biomass for alternative renewable biofuel. Renew. Energy 2010, 35, 1624–1631.
17. Erol, M.; Haykiri-Acma, H.; Küçükbayrak, S. Calorific value estimation of biomass from their
proximate analyses data. Renew. Energy 2010, 35, 170–173.
18. Kataki, R.; Konwer, D. Fuelwood characteristics of indigenous tree species of north-east India.
Biomass Bioenergy 2002, 22, 433–437.
19. Todaro, L.; Scopa, A.; De Franchi, A.S. Caratterizzazione energetica di biomasse agro-forestali
presenti in aree collinari e montane della Basilicata. Forest@ 2007, 4, 42–50.
20. Obernberger, I.; Brunner, T.; Bärnthaler, G. Chemical properties of solid biofuels-significance
and impact. Biomass Bioenergy 2006, 30, 973–982.

8/12/2019 Characterization of Woodchips for Energy from Forestry and Agroforestry Production
http://slidepdf.com/reader/full/characterization-of-woodchips-for-energy-from-forestry-and-agroforestry-production 14/14