Embed Size (px)
Citation preview
This article was downloaded by: [University of Arizona]On: 29 August 2013, At: 01:23Publisher: Taylor & FrancisInforma Ltd Registered in England and Wales Registered Number: 1072954Registered office: Mortimer House, 37-41 Mortimer Street, London W1T 3JH,UK
Polymer-Plastics Technologyand EngineeringPublication details, including instructions forauthors and subscription information:http://www.tandfonline.com/loi/lpte20
Characterization of Wood andWood-Plastic CompositeMubarak A. Khan a , K. M. Idriss Ali a & M. S. Jahan ba Radiation and Polymer Chemistry LaboratoryInstitute of Nuclear Science arid TechnologyBangladesh Atomic Energy Commission, P.O. Box3787, Dhaka, Bangladeshb Department of Physics, The University of Memphis,Memphis, Tennessee, 38152Published online: 23 Apr 2008.
To cite this article: Mubarak A. Khan , K. M. Idriss Ali & M. S. Jahan (1999)Characterization of Wood and Wood-Plastic Composite, Polymer-Plastics Technologyand Engineering, 38:4, 753-765, DOI: 10.1080/03602559909351611
To link to this article: http://dx.doi.org/10.1080/03602559909351611
PLEASE SCROLL DOWN FOR ARTICLE
Taylor & Francis makes every effort to ensure the accuracy of all theinformation (the “Content”) contained in the publications on our platform.However, Taylor & Francis, our agents, and our licensors make norepresentations or warranties whatsoever as to the accuracy, completeness,or suitability for any purpose of the Content. Any opinions and viewsexpressed in this publication are the opinions and views of the authors, andare not the views of or endorsed by Taylor & Francis. The accuracy of theContent should not be relied upon and should be independently verified withprimary sources of information. Taylor and Francis shall not be liable for anylosses, actions, claims, proceedings, demands, costs, expenses, damages,and other liabilities whatsoever or howsoever caused arising directly or

indirectly in connection with, in relation to or arising out of the use of theContent.
This article may be used for research, teaching, and private study purposes.Any substantial or systematic reproduction, redistribution, reselling, loan,sub-licensing, systematic supply, or distribution in any form to anyone isexpressly forbidden. Terms & Conditions of access and use can be found athttp://www.tandfonline.com/page/terms-and-conditions
Dow
nloa
ded
by [
Uni
vers
ity o
f A
rizo
na]
at 0
1:23
29
Aug
ust 2
013
P0LYM.-PLAST. TECHNOL. ENG., 38(4), 753-765 (1999)
CHARACTERIZATION OF WOOD AND WOOD-PLASTIC COMPOSITE
MUBARAK A. KHAN and K. M. IDRISS ALI
Radiation and Polymer CheFnislq I-uboratory Institute of Nuclear Science arid Technology Bangladesh Atomic Energy Commission P.O. Box 3787 Dhaka, Bangladesh
M. S. JAHAN
Department of Physics The University of Memphis Memphis, Tennessee 38152
Abstract
Wood-plastic composites ( W E ) were prepared with low-grade wood (kadom, simul, and mango) of Bangladesh and MMA (methyl methacry- late) under CO-60 gamma irradiation with a 3-Mrad dose (800 kradh). Polymer loading and tensile properties of the composites were deter- mined and the effect of urea and N-vinyl pyrrolidone (NVP) on these properties was studied. The polymer loading (PL) increases slightly (2-3%) with the addition of urea to the MMA + MeOH solution: how- ever, this increment is 6 1 6 % with NVP addition and l2-54% with urea + NVP, depending on the type of wood. Similarly, the tensile strength (TS) increased by 11-25%, the bending strength (BS) by 31-48%, and
*To whom correspondence should be sent at: Nuclear and Radiation Chemistiy Division. LNST, AERE, P.O. Box 3787, Dhaka-1000, Bangladesh.
Copyright 0 1999 by Marcel Dekker. Inc.
753
www.dekker.com
Dow
nloa
ded
by [
Uni
vers
ity o
f A
rizo
na]
at 0
1:23
29
Aug
ust 2
013
754 KHAN, IDRISS ALI, AND JAHAN
the compressed strength (CS) by 40-67%. To further characterize the composite, the samples were investigated with infrared (IR), electron- spin resonance (ESR), and thermally simulated luminescence (TSL) techniques. IR studies reveal that M M A was grafted with the wood sub- strate; ESR and TSL investigations detected the residual free radicals (not the primary free radicals) in the composites.
Key Words: ESR; TSL; Composites; Infrared; Characterization of com- posites; Spectral analysis: Wood composites.
INTRODUCTION
Wood is a very important construction and engineering material. It has been in use worldwide since ancient times. Its uses for different purposes are in- creasing day by day to meet the demand created by the growth of world pop- ulation and modem technologies. Thus, world forest reserve is depleting very fast. Sometimes, it is really very difficult to get good quality wood in many countries. As a result, people are tempted and forced to use low-grade wood in the absence of high-quality wood. On the other hand, low-grade wood can- not produce high-quality materials. The question of improving low-grade wood to the level of high-grade wood arises so that the paucity created by the absence of high-quality wood can be minimized. Various chemical and ge- netic treatments have been attempted to overcome these problems. As a result. different varieties of trees have been produced in the world over the last few decades and various wood products like wood-plastic composites, laminated wood, thermoplastics, and so forth have been made available in the market. A number of wood-plastic composites with low-quality wood using a single monomer, mixed monomers, and formulated solutions have been produced re- cently (1-5). The quality of the composites made with the formulated solu- tions was significantly high; mechanical, bending, and compressed strengths of the composite were substantially enhanced and it was also found irrelevant whether the impregnation of the solutions into the wood matrix was made un- der vacuum or normal pressure.
The main objective of this research project is to improve the quality of low-grade wood (soft wood) to the level of high-grade wood so that the improved wood substrate can be used as a substitute for the high-quality timber (wood) in making quality furniture. indoor panels, decorative articles, and the like. This would resist attack by insects, microbes, fungus, water absorption, and dimensional instability. With this objective in mind, three types of soft wood (kadom, d = 0.36 g/cm3; simul, d = 0.4 g/cm'; mango, d = 0.51 g/cm') were used to prepare wood-plastic composite (WPC) with methyl
Dow
nloa
ded
by [
Uni
vers
ity o
f A
rizo
na]
at 0
1:23
29
Aug
ust 2
013
CHARACTERIZATION OF WOOD COMPOSITES 755
methacrylate (MMA): MeOH = 90: 10 (v/v) under Co-60 gamma radiation. Methanol was used to swell the substrate cellulose to facilitate MMA impregnation into the wood matrix and to easily diffuse the free radicals of MMA and additives into the cellulose backbone chain during the polymerization process under radiation (6). Composites of a different nature are required for diverse applications. Some applications demand higher bending strength, whereas others require good compressed strength. To facilitate these applications, various additives and coadditives were incorpo- rated into the bulk impregnating monomer solution. In this case, urea and N- vinyl pyrrolidone (NVP), both containing the carboamide group, have been used to enhance various tensile properties. The present study deals with the charac- terization of the wood composites by infrared (IR), electron-spin resonance (ESR), and thermally simulated luminescence (TSL) techniques: the composites were prepared with MMA in the presence of carboamide materials (additives).
EXPERIMENTAL
Materials
Kadom (Anthrocephnlus cadanibo, d = 0.36 g/cm3), simul (Sulmalia mam- aburica, d = 0.40 g/cm3), and mango (Mungiferu indicn. d = 0.51 g/cm3) were the substrates collected from the local market in Bangladesh. Methyl methacrylate (MMA) procured from Aldrich Chemical Co. was used as the bulk monomer to which methanol (Merck) was added as the swelling solvent. N-vinyl pyrrolidone (NVP) and urea, procured from Aldrich Chemical Co., were used as additives to enhance the tensile properties of the composite.
Methods
Wood samples (10 X 3 X 0.5 cm) were taken from long-grain plank, polished thoroughly with suitable sandpapers, and then immersed for 20 h at normal pressure and temperature (25°C) into the bulk monomer solution that contains methanol by 10% v/v with MMA. The additive was incorporated into the bulk monomer solution by 1% w/w in order to study the effect of the additives in the composite. The impregnated substrates were wiped out with tissue paper to remove unnecessary adherent and then packed in polyethylene bags and ti- nally irradiated by Co-60 gamma rays with a 3-Mrad dose (800 kradh). The irradiated samples were heated at 105°C until the unreacted monomer was completely removed (ascertained by the constant weight obtained). The poly- mer loading was determined by the weight gain after the irradiation of the im- pregnated samples, followed by removal of the unreacted monomer.
Dow
nloa
ded
by [
Uni
vers
ity o
f A
rizo
na]
at 0
1:23
29
Aug
ust 2
013
756 KHAN, IDRISS ALI, AND JAHAN
The irradiated samples were used to measure tensile properties such as ten- sile strength (TS), bending strength (BS), and compressed strength (CS). These were determined directly from Instron (model 101 1 UK), a machine for the measurement of tensile properties at a crosshead speed of 3 cdmin . These samples were also used to characterize other properties through IR, ESR, and TSL studies. The ESR and TSL measurement were taken at the Department of Physics in the University of Memphis (Tennessee, USA).
Infrared Studies
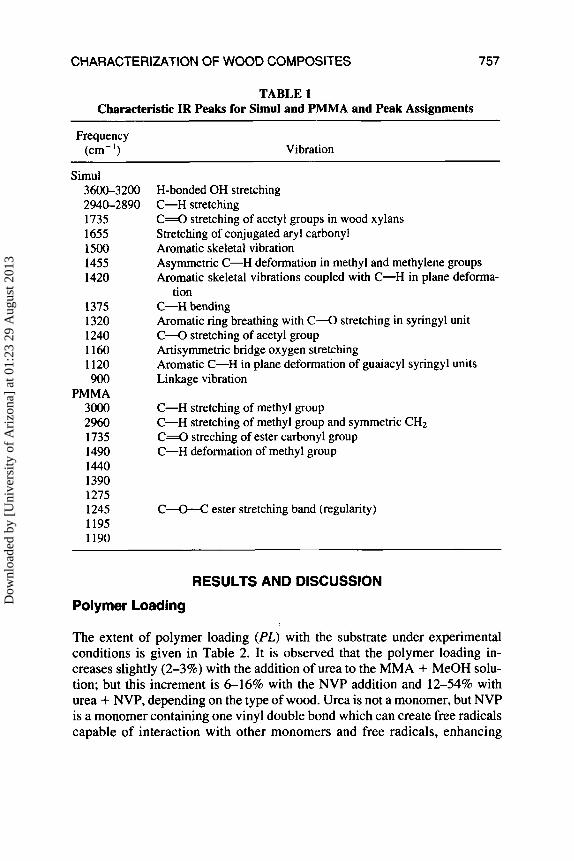
Wood substrates and their composites were powdered like sawdust (60 mesh), were extracted with hot benzene for 72 h, dried at 105°C for 24 h, dispersed in dry KBr (wood dust : KBr = 100 : 300, w/w), and then ground to fine par- ticles in a mortar. The KBr pellets, formed under the press technique, was used for IR spectra using IR 470 (Shimadzu Co.). The IR spectra of PMMA [poly(methyl methacry late)] and untreated wood substrates were also taken for the sake of comparison. The IR peaks for simul. mango, and kadam are very similar. The IR peaks of pure simul and PMMA are shown in Table 1.
Electron-Spin Resonance Studies
The ESR spectra of the wood and its composites were taken at the Department of Physics in the University of Memphis with a Varian E4 spectrometer oper- ating at 9.5 GHz. The modulation frequency was maintained at 100 kHz and the amplitude was less than 2 G peak to peak. In order to avoid saturation of the signal, very low microwave power was used. The relative frequency con- centration (per unit mass) was determined by double integrating the first- derivative ESR signal.
Thermally Simulated Luminescence Studies
The wood samples were heated in a commercial TSL apparatus (Harshaw-Fil- troll 2000N2000B) up to 400°C at a constant heating rate of 2"C/s. The Sam- ple chamber was continuously purged with N2 gas. The heated samples emit- ted light as a glow, and the total light output produced as a function of temperature yields a glow curve. The area under the TSI, glow curve was mea- sured by integrating the curve between the set temperatures. This was subse- quently background corrected and normalized per unit mass of the sample to obtain the TSL intensity (1) (in nC/g). The TSL measurement was also carried out at the University of Memphis.
Dow
nloa
ded
by [
Uni
vers
ity o
f A
rizo
na]
at 0
1:23
29
Aug
ust 2
013
CHARACTERIZATION OF WOOD COMPOSITES 757
TABLE I Characteristic IR Peaks for Simul and PMMA and Peak Assignments
Frequency (cm-'1 Vibration
Simul 3600-3200 2940-2890 1735 1655 1500 1455 1420
1375 1320 1240 1160 1120 900
PMMA 3000 2960 1735 1490 1440 1390 1275 1245 1195 1190
H-bonded OH stretching C-H stretching C = O stretching of acetyl groups in wood xylans Stretching of conjugated aryl carbonyl Aromatic skeletal vibration Asymmetric C-H deformation in methyl and rnethylene groups Aromatic skeletal vibrations coupled with C-H in plane deforma-
C-H bending Aromatic ring breathing with C - 0 stretching in syringyl unit C - 0 stretching of acetyl group Artisymmetric bridge oxygen stretching Aromatic C-H in plane deformation of guaiacyl syringyl units Linkage vibration
tion
C-H stretching of methyl group C-H stretching of methyl group and symmetric CH;? C = O streching of ester carbonyl group C-H deformation of methyl group
C - 0 - C ester stretching band (regularity)
RESULTS AND DISCUSSION
Polymer Loading
The extent of polymer loading (PL) with the substrate under experimental conditions is given in Table 2. It is observed that the polymer loading in- creases slightly (2-3%) with the addition of urea to the MMA + MeOH solu- tion; but this increment is 6 1 6 % with the NVP addition and 12-54% with urea + NVP, depending on the type of wood. Urea is not a monomer, but NVP is a monomer containing one vinyl double bond which can create free radicals capable of interaction with other monomers and free radicals, enhancing
Dow
nloa
ded
by [
Uni
vers
ity o
f A
rizo
na]
at 0
1:23
29
Aug
ust 2
013
758 KHAN, IDRISS ALI, AND JAHAN
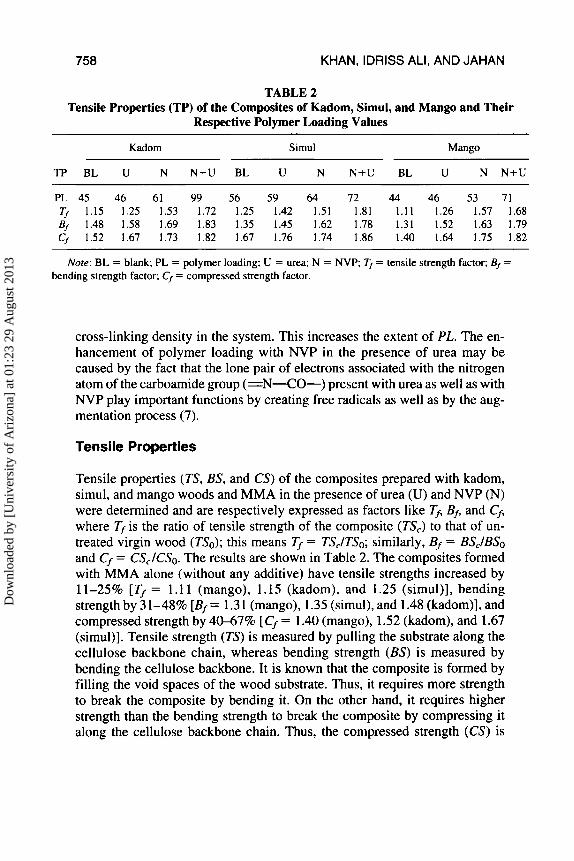
TABLE 2 Tensile Properties (TP) of the Composites of Kadom, Simul, and Mango and Their
Respective Polymer Loading Values
Kadom Simul Mango
TP BL U N N + U BL U N N+U BL U N N + U
PI. 45 46 61 99 56 59 64 72 44 46 53 71 TJ 1.15 1.25 1.53 1.72 1.25 1.42 1.51 1.81 1.1 1 1.26 1.57 1.68 EJ 1.48 1.58 1.69 1.83 1.35 1.45 1.62 1.78 1.31 1.52 1.63 1.79 CJ 1.52 1.67 1.73 1.82 1.67 1.76 1.74 1.86 1.40 1.64 1.75 1.82
Note: B L = blank; PL = polymer loading: U = urea; N = NVP; T, = tensile strength factor; E J - - bending strength factor; C, = compressed strength factor.
cross-linking density in the system. This increases the extent of PL. The en- hancement of polymer loading with NVP in the presence of urea may be caused by the fact that the lone pair of electrons associated with the nitrogen atom of the carboamide group (=N-CO-) present with urea as well as with NVP play important functions by creating free radicals as well as by the aug- mentation process (7).
Tensile Properties
Tensile properties (TS, BS, and CS) of the composites prepared with kadom, simul, and mango woods and MMA in the presence of urea (U) and NVP (N) were determined and are respectively expressed as factors like Tf, Bf, and Cf, where Tf is the ratio of tensile strength of the composite (73,) to that of un- treated virgin wood (730); this means T, = TSJTS,; similarly, Bf = BSJBSO and Cf = CS,/CSo. The results are shown in Table 2. The composites formed with MMA alone (without any additive) have tensile strengths increased by 11-25% [Tf = 1.11 (mango), 1.15 (kadom), and 1.25 (simul)], bending strength by 3 1-48% [Bf = 1.3 1 (mango), 1.35 (simul), and 1.48 (kadom)], and compressed strength by 4047% [C’= I .40 (mango), 1.52 (kadom), and 1.67 (simul)]. Tensile strength (TS) is measured by pulling the substrate along the cellulose backbone chain, whereas bending strength (BS) is measured by bending the cellulose backbone. It is known that the composite is formed by filling the void spaces of the wood substrate. Thus, it requires more strength to break the composite by bending it. On the other hand, it requires higher strength than the bending strength to break the composite by compressing it along the cellulose backbone chain. Thus, the compressed strength (CS) is
Dow
nloa
ded
by [
Uni
vers
ity o
f A
rizo
na]
at 0
1:23
29
Aug
ust 2
013
CHARACTERIZATION OF WOOD COMPOSITES 759
higher than the bending strength (BS). Thus, the CS values are expected to be enhanced: that is, in fact, observed in Table 2.
Effect of Urea and NVP
Urea incorporated into the bulk monomer solution (MMA : MeOH) has en- hanced the tensile strengths by 25-42%, although the polymer loading (PL) was increased by 1-3% only (see Table 2). The enhanced TS values are about 10-17% [Tf = I .25-1.15 (kadom) and 1.42-1.25 (simul)] higher than the TS values obtained with MMA alone. Similarly, bending strengths and compressed strengths of the composite have been increased by 45-58% and 67-76%, re- spectively, with increments of 10-21% with BS and 10-14% with CS. Because urea is not a monomer, it does not add onto the monomerkellulose during poly- merization, but it does help mechanistically to cross-link or bind the monomer radicals with the cellulose backbone chain through the interaction of lone pairs of electrons present with the N atom of urea. On the other hand, NVP, being a monomer, interacts with MMA physically as well as through lone pairs of elec- trons of the N atom present in NVP. Thus, the presence of NVP with the MMA + MeOH solution enhances both PL and tensile properties (TS, BS, and CS); TS increases by 51-57%, BS by 62-83%, and CS by 73-75% in the presence of NVP with MMA + MeOH, depending on the nature of wood used. The combi- nation of urea and NVP together with MMA + MeOH solutions enhances the tensile properties further: TS (68-81%), BS (78-83%), and CS (82-86%). It is observed that the differences among the values of TS, BS, and CS of the com- posites prepared with MMA + MeOH + urea + NVP are far less than those o b tained with MMA + MeOH + NVP (TS, 51-57%; BS, 62-69%; CS, 73-75%), or M M A + MeOH + urea (TS, 25-42%; BS, 45-58%; CS, 67-76%), or MMA + MeOH (TS, 11-25%; BS, 3 1-48%; CS, 52-67%); see Table 2.
Infrared Spectra
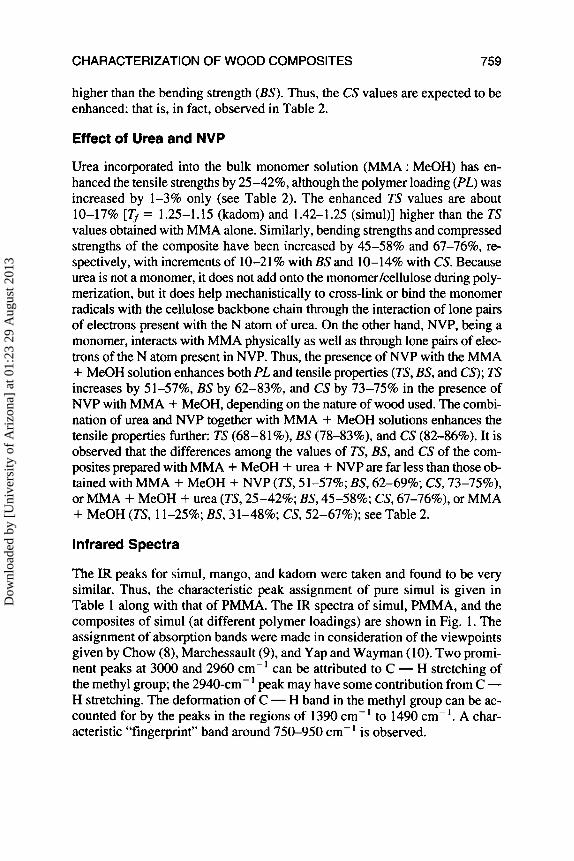
The IR peaks for simul, mango, and kadom were taken and found to be very similar. Thus, the characteristic peak assignment of pure simul is given in Table 1 along with that of PMMA. The IR spectra of simul, PMMA, and the composites of simul (at different polymer loadings) are shown in Fig. 1. The assignment of absorption bands were made in consideration of the viewpoints given by Chow (8), Marchessault (9), and Yap and Wayman (10). Two promi- nent peaks at 3000 and 2960 cm-’ can be attributed to C - H stretching of the methyl group; the 2940-cm- ' peak may have some contribution from C - H stretching. The deformation of C - H band in the methyl group can be ac- counted for by the peaks in the regions of 1390 cm-‘ to 1490 cm-’. A char- acteristic “fingerprint” band around 750-950 cm- ’ is observed.
Dow
nloa
ded
by [
Uni
vers
ity o
f A
rizo
na]
at 0
1:23
29
Aug
ust 2
013
760 KHAN, IDRISS ALI, AND JAHAN
FIG. 1. IR spectra of PMMA, simul, and simul composites at different polymer loading.
Dow
nloa
ded
by [
Uni
vers
ity o
f A
rizo
na]
at 0
1:23
29
Aug
ust 2
013
CHARACTERIZATION OF WOOD COMPOSITES 761
WPC ESR Signals
5 j ; r- I
- Blank I
- Blank i’
I
3380 3430 3480 3530 3580 MAGNETIC FIELD (GAUSS)
I i -
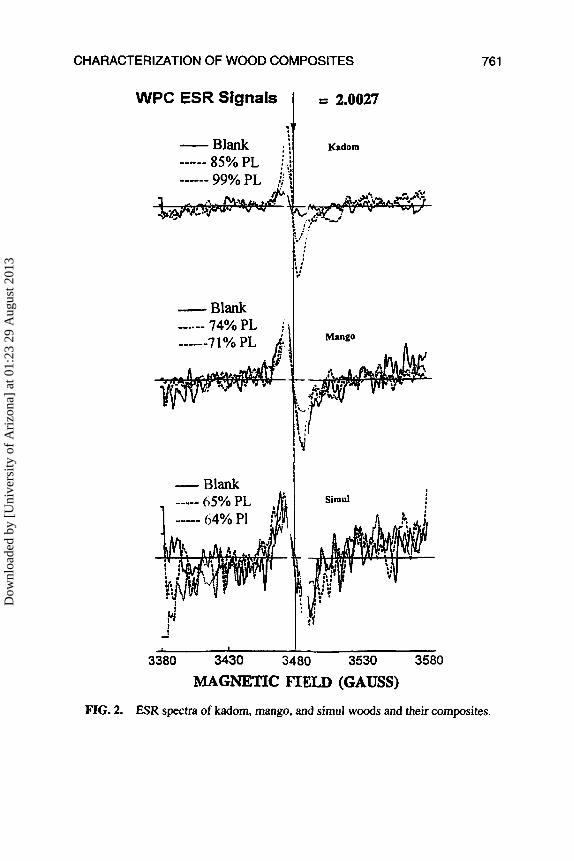
FIG. 2. ESR spectra of kadom, mango. and simul woods and their composites.
Dow
nloa
ded
by [
Uni
vers
ity o
f A
rizo
na]
at 0
1:23
29
Aug
ust 2
013
762 KHAN, IDRISS ALI, AND JAHAN
As the polymer loading increases, the characteristic peaks of the polymer become prominent. The C=O vibration at 1735 cm-' increases with an in- crease of polymer loading. The peaks at 2940 and 3000 cm-' for C - H stretching are the result of to methyl groups. Peaks at 1655 cm-' (conjugated aryl carbonyl) and 1500 cm-' (aromatic skeleton) decrease as the polymer loading increases, indicating a prohibition on the vibration of the conjugated aryl ring and the aromatic ring. The increase of peak intensity at 1735 cm-' for C = 0 vibration and decrease at 1655 cm-' with increased polymer loading is an indication for grafting M M A with the substrate cellulose. Similarly, the de- crease of the ratio of peak intensities at 3450 cm-' for the hydrogen-bonded OH group and 2940 cm- ' for the methyl group with increased polymer load- ing is also an indication in favor of MMA grafting with the cellulose; similar findings were also observed earlier (1 1) that MMA is grafted with the wood.
Electron-Spin Resonance Studies
The ESR spectra were taken for the composites of the three substrates (kadom, simul, and mango) along with the untreated samples. Each sample shows a
0.25
- c I .- : 0.2
% - Z
$ 0.15 l-
w 0 Z
P
a
8 0.1 a 0 a w 0.05
0 U
w L
C
K = Kadom K-1 = 85% PL K-2 = 99% PL K-B = Blank
M = Mango M-1 = 74% PL M-2 = 71% PL M-B = Blank
1 -B = Blank
S = Simul S-1 = 65% PL S-2 = 64% PL
K-6 K-1 K-2 M-8 M-1 M-2 S-B S-1 S-2
SAMPLES
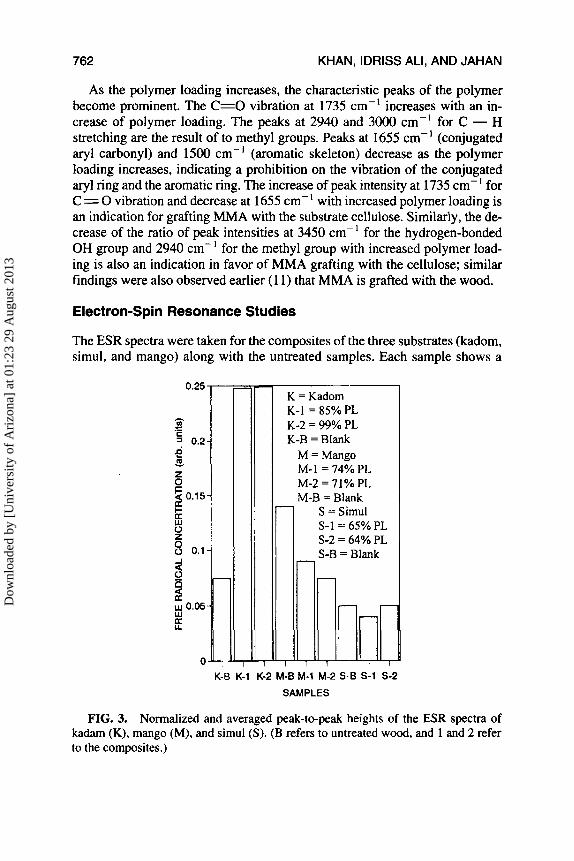
FIG. 3. Normalized and averaged peak-to-peak heights of the ESR spectra of kadm (K), mango (M), and simul (S). (B refers to untreated wood. and 1 and 2 refer to the composites.)
Dow
nloa
ded
by [
Uni
vers
ity o
f A
rizo
na]
at 0
1:23
29
Aug
ust 2
013
CHARACTERIZATION OF WOOD COMPOSITES 763
K-Samples 30
K- 1 Is: i
K=Kadom
I-
0
M-Samples
SSamples
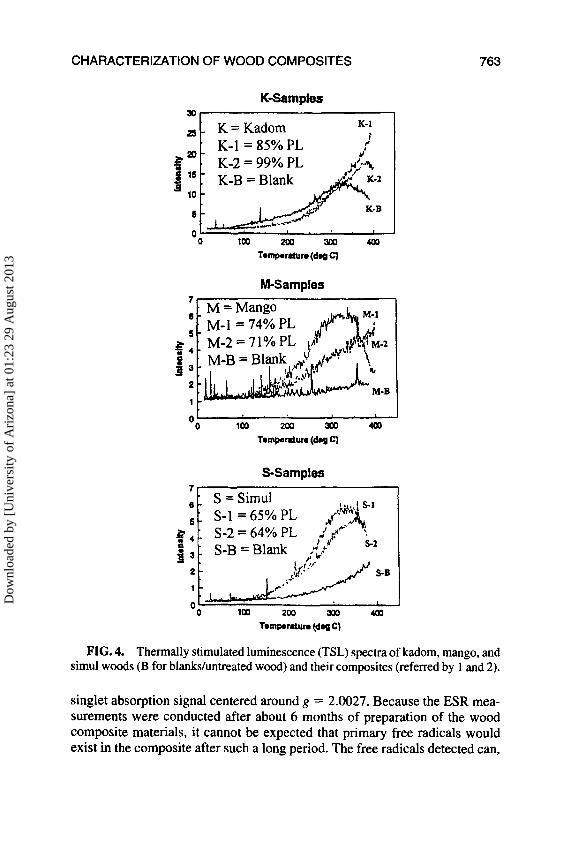
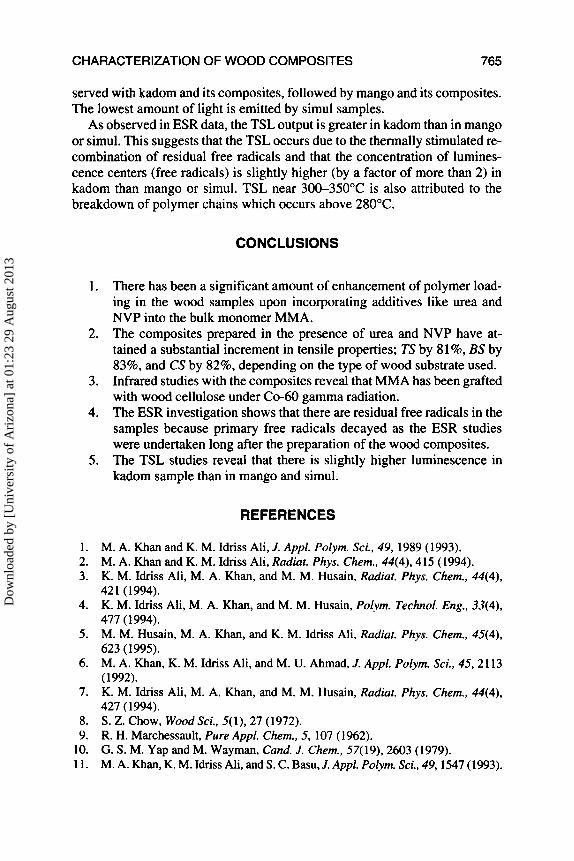
FIG. 4. Thermally stimulated luminescence (TSL) spectra of kadom, mango, and simul woods (B for blanks/untreated wood) and their composites (referred by 1 and 2).
singlet absorption signal centered around g = 2.0027. Because the ESR mea- surements were conducted after about 6 months of preparation of the wood composite materials, it cannot be expected that primary free radicals would exist in the composite after such a long period. The free radicals detected can,
Dow
nloa
ded
by [
Uni
vers
ity o
f A
rizo
na]
at 0
1:23
29
Aug
ust 2
013
764 KHAN, IDRISS ALI, AND JAHAN
80
60
c v
z 0" Z 8 40 v) W
3 20
0
K = Kadom K-1 = 85% PL n K-2=99%PL
K-B K-l K-2 M-B M-1 M-2 S-B S-1 S-2
SAMPLES
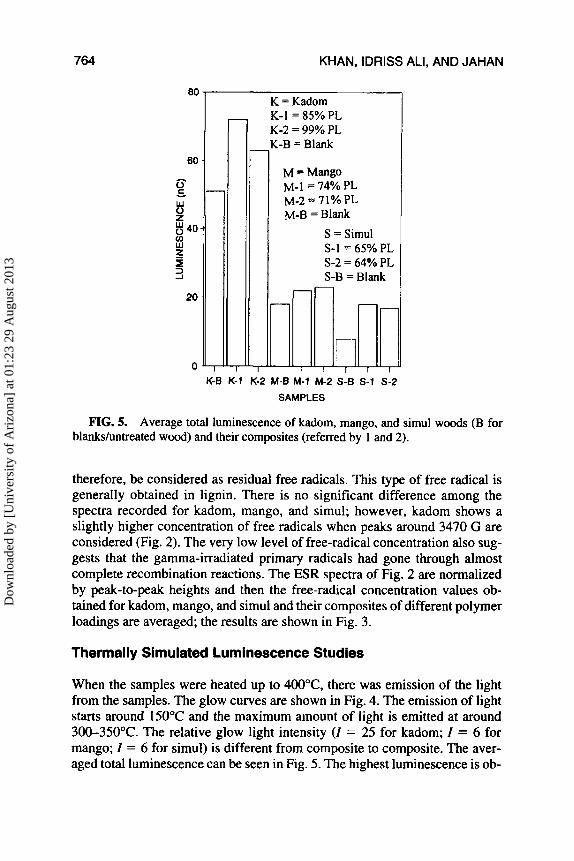
FIG. 5. Average total luminescence of kadom, mango, and simul woods (B for blankduntreated wood) and their composites (referred by 1 and 2).
therefore, be considered as residual free radicals. This type of free radical is generally obtained in lignin. There is no significant difference among the spectra recorded for kadom, mango, and simul; however, kadom shows a slightly higher concentration of free radicals when peaks around 3470 G are considered (Fig. 2). The very low level of free-radical concentration also sug- gests that the gamma-irradiated primary radicals had gone through almost complete recombination reactions. The ESR spectra of Fig. 2 are normalized by peak-to-peak heights and then the free-radical concentration values ob- tained for kadom, mango, and simul and their composites of different polymer loadings are averaged; the results are shown in Fig. 3.
Thermally Simulated Luminescence Studies
When the samples were heated up to 400°C, there was emission of the light from the samples. The glow curves are shown in Fig. 4. The emission of light starts around 150°C and the maximum amount of light is emitted at around 30-350"C. The relative glow light intensity (I = 25 for kadom; I = 6 for mango; I = 6 for simul) is different from composite to composite. The aver- aged total luminescence can be seen in Fig. 5. The highest luminescence is ob-
Dow
nloa
ded
by [
Uni
vers
ity o
f A
rizo
na]
at 0
1:23
29
Aug
ust 2
013
CHARACTERIZATION OF WOOD COMPOSITES 765
served with kadom and its composites, followed by mango and its composites. The lowest amount of light is emitted by simul samples.
As observed in ESR data, the TSL output is greater in kadom than in mango or simul. This suggests that the TSL occurs due to the thermally stimulated re- combination of residual free radicals and that the concentration of lumines- cence centers (free radicals) is slightly higher (by a factor of more than 2) in kadom than mango or simul. TSL near 3W35O"C is also attributed to the breakdown of polymer chains which occurs above 280°C.
CONCLUSIONS
1 .
2.
3.
4.
5.
1. 2. 3.
4.
5.
6.
7.
8. 9.
10. 11.
There has been a significant amount of enhancement of polymer load- ing in the wood samples upon incorporating additives like urea and NVP into the bulk monomer MMA. The composites prepared in the presence of urea and NVP have at- tained a substantial increment in tensile properties; TS by 81%, BS by 83%, and CS by 82%, depending on the type of wood substrate used. Infrared studies with the composites reveal that MMA has been grafted with wood cellulose under Co-60 gamma radiation. The ESR investigation shows that there are residual free radicals in the samples because primary free radicals decayed as the ESR studies were undertaken long after the preparation of the wood composites. The TSL studies reveal that there is slightly higher luminescence in kadom sample than in mango and simul.
REFERENCES
M. A. Khan and K. M. Idriss Ali, J. Appl. Polym. Sci., 49, 1989 (1993). M. A. Khan and K. M. Idriss Ali, Radiat. Phys. Chem., 44(4), 415 (1994). K. M. Idriss Ali, M. A. Khan, and M. M. Husain, Radiat. Phys. Chem., 44(4), 421 (1994). K. M. Idriss Ali, M. A. Khan, and M. M. Husain, Pol.vin. Techno/. Eng., 33(4), 477 (1994). M. M. Husain, M. A. Khan, and K. M. ldriss Ali, Rudiar. Phys. Chem., 45(4), 623 (1995). M. A. Khan, K. M. Idriss Ah, and M. U. Ahmad, J. Appl. Polym. Sci., 45.21 13 (1992). K. M. Idriss Ali, M. A. Khan, and M. M. Husain, Radiat. Phys. Chem., 44(4), 427 (1994). S. Z. Chow, Wood Sci., 5(1), 27 (1972). R. H. Marchessault, Pure Appl. Chein., 5, 107 (1962). G. S. M. Yap and M. Wayman, Cand. J. Chem., 57( 19). 2603 (1979). M. A. Khan, K. M. Idriss Ah, and S. C. Basu, J. Appl. Pol-ym. Sci., 49,1547 (1993).
Dow
nloa
ded
by [
Uni
vers
ity o
f A
rizo
na]
at 0
1:23
29
Aug
ust 2
013