Embed Size (px)
Citation preview
Characterization of the Twitter @replies Network:Are User Ties Social or Topical?
Daniel SousaDEI-FEUP, University of Porto
Rua Dr. Roberto Frias, s/n4200-465 Porto, [email protected]
Luís SarmentoLabs SAPO and LIACC/FEUP
Rua Dr. Roberto Frias, s/n4200-465 Porto, Portugal
Eduarda Mendes RodriguesDEI-FEUP, University of Porto
Rua Dr. Roberto Frias, s/n4200-465 Porto, [email protected]
ABSTRACTIn recent years, social media services have become a globalphenomenon on the Internet. The popularity of these ser-vices provides an opportunity to study the characteristicsof online social networks and the communities that emergein them. This paper presents an analysis of the users’ in-teractions in the implicit network derived from tweet repliesof a specific dataset obtained from a popular microbloggingservice, Twitter1. We analyze the influence of the topicsof the tweet messages on the interaction among users, todetermine if the social aspect prevails over the topic in themoment of interaction. Thus, the main goal of this paperis to investigate if people selectively choose whom to replyto based on the topic or, otherwise, if they reply to any-one about anything. We found that the social aspect pre-dominantly conditions users’ interactions. For users withlarger and denser ego-centric networks, we observed a slighttendency for separating their connections depending on thetopics discussed.
Categories and Subject DescriptorsH.3.5 [Information Storage and Retrieval]: Online In-formation Systems—Web-based services; J.4 [Computer Ap-plications]: Social and Behavioral Sciences—Sociology
General TermsExperimentation, Human Factors, Measurement
KeywordsTwitter, microblogging, social network, topic analysis
1. INTRODUCTIONThe many social media services that have emerged over
the past few years allow people to create virtual communi-ties and to interact with each other online. The dynamics
1http://www.twitter.com
Permission to make digital or hard copies of all or part of this work forpersonal or classroom use is granted without fee provided that copies arenot made or distributed for profit or commercial advantage and that copiesbear this notice and the full citation on the first page. To copy otherwise, torepublish, to post on servers or to redistribute to lists, requires prior specificpermission and/or a fee.SMUC’10, October 30, 2010, Toronto, Ontario, Canada.Copyright 2010 ACM 978-1-4503-0386-6/10/10 ...$10.00.
of social networks and the characterization of social ties is atopic of great interest in the data mining research commu-nity. Understanding social networks and user interactionsis important to improve current systems and to design newapplications, including personalized recommender systems(e.g., recommendation of news [12] or “friends”). Most so-cial networks require users to make explicit social connec-tions by accepting a “connection request”. However, we canalso consider implicit connections derived from users’ activ-ities in the social network, such as tagging another user’sphoto, sending a message, or posting a comment on otheruser’s page. In some ways implicit networks can be betterindicators of the actual social ties between users. Accord-ing to a study of Facebook [5], we know that people onlycommunicate with a few of their declared friends. Thus,one way of quantifying how strong a social tie is, is mea-suring the frequency of interaction between the two peopleinvolved [4].
In this paper, we focus on studying one type of implicitnetworks that can be found in Twitter, a popular microblog-ging service that emerged in 2006 [6]. The informal andspontaneous nature of this social media service encouragesusers to interact frequently with potentially large communi-ties. Users may choose to follow other users, which enablesthem to receive all the tweets from the followed users. Unlikethe messages posted to topic-specific mailing lists, the tweetsmay cover a very wide range of topics. Users may reply toany specific tweet, thus engaging in a kind of conversation.We aim to analyze the influence of the topic in users’ deci-sion to reply to tweet messages. More specifically, we aimto investigate if users are motivated to reply based on so-cial ties, thus communicating with their “friends” about anytopic or if, on the other hand, they discriminate who theyreply to based on the topic of the original message.
The answer to this question is particularly important fordesigning systems that recommend new social connections(i.e., new “friends”). If users do actually distinguish theirconnections based on the topics, then a content-based re-commender system might be useful for suggesting interest-ing connections. Otherwise, friend recommendations shouldbe essentially based on the social network structure, such asthe People You May Know (PYMK) system used in MyS-pace [11], rather than on the content of the messages ex-changed.
This paper is organized as follows. First, we review re-lated work and then we explain the adopted methodologythat allows us to investigate if users distinguish their con-nections according to the topics discussed. Next, we present
a brief description of the dataset of Twitter messages andassociated replies, which we used for deriving an implicit so-cial network. Then, we describe our experiments and presentour results. Finally, we discuss our findings regarding the in-fluence of the topic on users’ interactions, and we concludeby outlining areas for future work.
2. RELATED WORKIn recent years, several studies have been conducted on
social networks. Many of them have discussed extensivelytopological and structural issues of the networks, includingtheir size, density, degree distributions, geodesic paths, con-nected components, community structure, among others [8,9, 10, 13, 15]. However, an important aspect of social mediaservices relates to the activity networks, which are networksthat can be derived from the actual interactions betweenusers, rather than from the mere declared friendship con-nections [4]. Viswanath et al. [14] built an implicit networkbased on Facebook wall posts, in order to study the evolu-tion of activity among users. They found that the links inthe activity network tend to come and go quickly, suggest-ing that the activity network is rapidly changing over time.Despite this high churn in users’ interactions over time, theyfound that many of the global structural properties remainconstant.Early studies on Twitter include a systematic description
of the main characteristics of microblogging and the impacton informal communication at work provided by this kind ofservices [17] and also try to understand how and why peopleuse Twitter [6, 17]. Such studies reported a variety of socialpurposes and motivations to use Twitter, including to keepin touch with friends, to raise visibility of interesting things,to gather useful information according user’s personal inter-ests, or to get help and opinions on a specific matter.A large-scale study of the conversational characteristics
of Twitter and its power as a new medium of informationsharing [9], reveals that any retweeted tweet is to reach anaverage of 1000 users regardless of the number of follow-ers the original tweet has, showing the power of this serviceas a source of information dissemination. Boyd et al. [2]analyzed the conversational aspects of the retweets. Theretweet mechanism empowers users to spread informationof their choice beyond the reach of the original tweet’s fol-lowers. Using a series of case studies and empirical data,Boyd et al. describe and map out the various conventions ofretweeting, and examine retweeting practices. For example,they found that over 9% of all retweets include a reference tothe retweeter’s handle. In other words, A retweets B whenB’s message refers to A. They call these “ego retweets”.Java et al. [6] present an analysis of Twitter’s growth rate,
both in users and user posts, and provide insights into theuser activity and geographical distribution. In general, theyfound that the reciprocity and clustering coefficient valuesfor users in Europe and Asia are higher than the valuesobtained for users in North America.Weng et al. [16] carried out an important study focused on
the problem of identifying influential users on Twitter, andpropose a measure that goes beyond the mere number of fol-lowers a user has. The measure is an extension of PageRankthat measures the users’ influence taking into account boththe topical similarity between users and their network links’structure. Moreover, they also reveal that the presence ofreciprocity in the explicitly following/follower network can
be explained by the phenomenon of homophily. In otherwords, a user follows a friend because they have similar topicinterests.
Summarizing, there are several research studies on Twit-ter and, to the best of our knowledge, none of them lookedat characterizing topics’ influence in the social network ac-tivity. In this paper we analyze the users’ motivations forreplying to other Twitter users trying to understand if userssegment their links according to the topics discussed. Thisis important both to improve current systems and to designnew applications (e.g., recommender systems).
3. PROBLEM SETTING
3.1 Twitter @replies NetworkTwitter is a social networking and microblogging service
that allows users to answer the question: “What are youdoing now?”. Twitter is also a social messaging servicewhere users interact by sending short text messages witha maximum of 140 characters in length, called “tweets”.Users can also follow other people and have friends, or “fol-lowers”. Unlike many social media services, such as Face-book2 or MySpace3, the relationship of following and beingfollowed requires no reciprocation. A user can follow anyother user, and the user being followed needs not to followback. Furthermore the practice of responding to a tweet hasevolved into a well-defined markup vocabulary: RT standsfor retweet, a ‘#’ followed by a word represents an hashtag,and a ‘@’ followed by a username directly addresses the mes-sage to that user, while keeping the message public for otherusers to read. This type of messages are often referred to as@replies. Therefore, users can be connected in an implicitor explicit manner as, for example, via retweets, #hashtags,@replies or through friends and followers relationships.
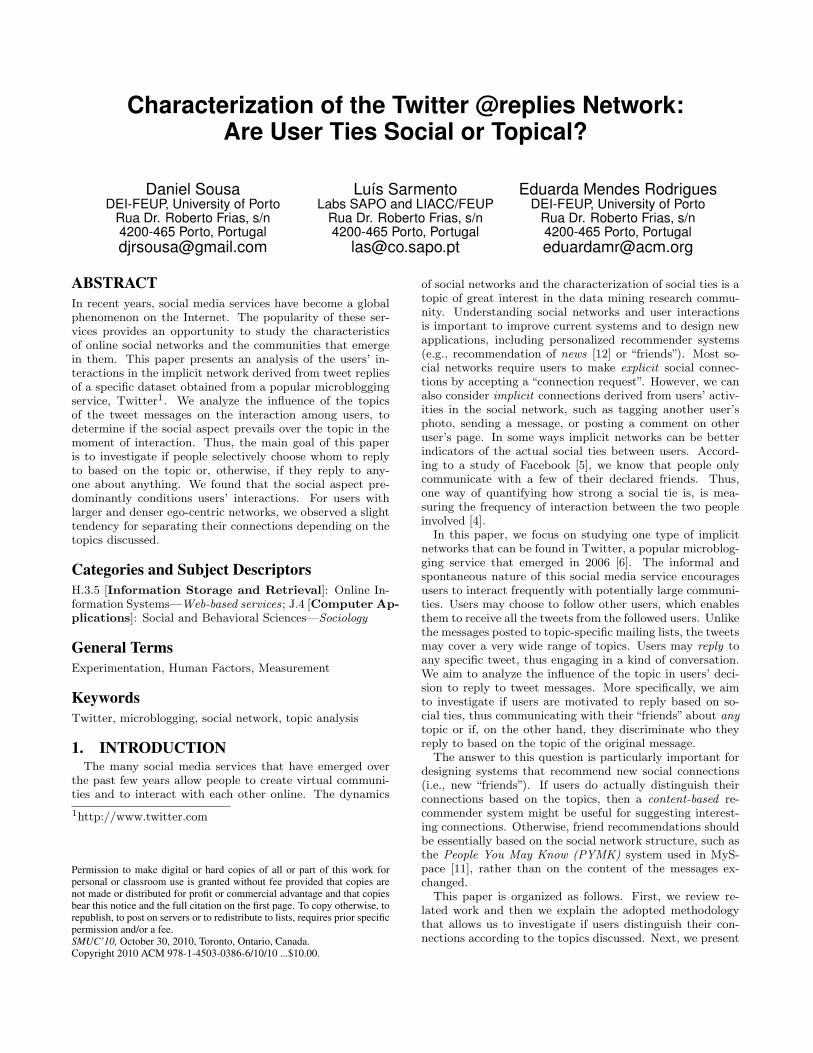
Considering the @replies messages, we can build an activ-ity network representing the flow of interaction among Twit-ter users. Such implicit network derived from tweet repliescan be represented as a directed graph G = (V,E) where eachnode u ∈ V represents a user and each edge (ui,u j) ∈ E rep-resents an @reply message sent from user ui to the user u j.
Figure 1: Ego-centric network of user ui, represent-ing @replies interactions with people who tweet ontopic TX (set of users UX), topic TY (set of users UY ),and other topics.
2http://www.facebook.com/3http://www.myspace.com/
Every edge in the graph G also has an associated weightwi j which corresponds to the number of replies sent fromuser ui to user u j, as depicted in Figure 1. This networkcan be analyzed from the perspective of each user ui, byconsidering the individual’s personal network or ego-centricnetwork G′(ui), which comprises all the people to whom uisends at least one @reply message.
3.2 Topic vs. Social MotivationsThis paper aims to understand what motivates a user to
reply to other users tweets. More precisely, we seek to an-swer the following research question: “Are people interac-tions motivated by the topic or does the social aspect takeprecedence over the topic, when replying to tweets?”. Toanswer this question we start by considering the ego-centricnetwork of each user ui, G′(ui). Given two topics, TX and TY ,we can extract from G′(ui) two, possibly overlapping sub-graphs, G′
TX(ui) and G′
TY(ui), which represent user ui’s replies
to messages from other individuals on those two topics, re-spectively. Let UX be the set of users to whom ui is connectedin G′
TX(ui) and UY the set of users to whom ui is connected in
G′TY(ui). There are two possible scenarios for these two sets
of users:
1. There is no overlap between UX and UY (i.e., UX ∩ UY= /0);
2. There is a certain overlap between UX and UY (i.e., UX∩ UY = /0). In some cases, the two sets can overlapcompletely. More precisely, one set of users can be asubset of the other, or the two sets can be exactly thesame (i.e., UX ⊆ UY ∨ UX ⊇ UY ).
If user ui’s interactions are neither socially nor topicallymotivated, then ui will not discriminate who he replies tobased on any (of these) criteria. This is equivalent to sayingthat user ui chooses whether to reply or not as if he wasfollowing a random process. Thus, let p(UX ) and p(UY ) bethe marginal probabilities of a user ui interacting with otherusers on topics TX and TY , respectively. Assuming no otherselection criteria is being followed by user ui, the probabilityof replying to a user in UX , p(UX ), should be independentof the probability of replying to a user in UY , p(UY ). There-fore, the probability of interacting with the same subset ofpeople on both topics, which is equivalent to the probabil-ity of overlap between users in UX and UY , will be given byp(UX ,UY ) = p(UX ) · p(UY ).However, we know that users do not choose who they reply
to randomly. So, we can measure how much p(UX ,UY ) differsfrom its expected value under the independence assumptionand, thus, test whether user replies are motivated by thetopic or by the social aspect. There are two possible cases:
1. If the user’s interactions are topically motivated, thenthe actual observed probability of overlap will be infe-rior to the expected overlap. In such case, p(UX ,UY )<p(UX )·(UY );
2. If, on the other hand, there is a social motivation forselecting who to reply to, the observed probability ofoverlap will be higher than expected under the inde-pendence assumption. Thus, p(UX ,UY )> p(UX )·(UY ).
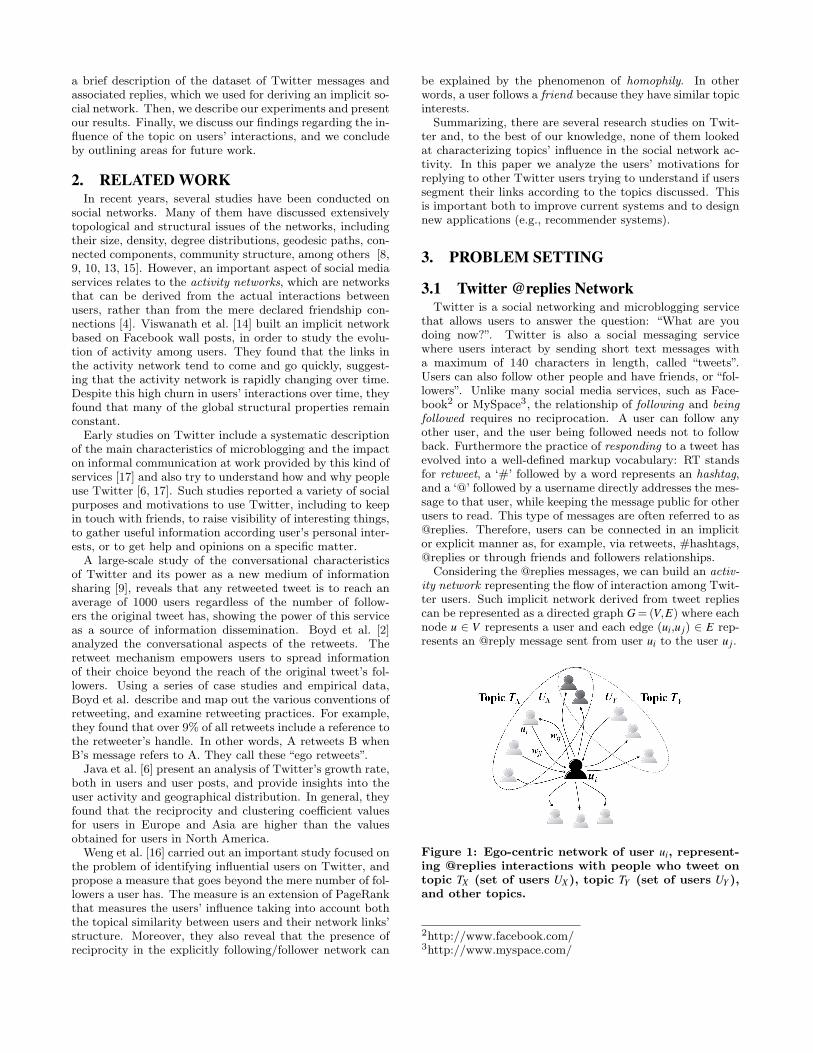
Figure 2: Interpretation of the NPMI values, consid-ering the overlap between the sets of users UX andUY .
3.3 Measuring User MotivationTo quantify the extent of the overlap and a user’s motiva-
tion to reply to other users’ tweets, we use the NormalizedPointwise Mutual Information (NPMI) [3], a bi-directionalassociation measure used in information theory and statis-tics. This measure relates the probability of co-occurrenceof two events with the probabilities of occurrence of eachof them individually. In our problem setting, such eventsconsist of user ui’s interactions with other users on topicsTX and TY , respectively. Thus, for a given pair of topics TXand TY and associated sets of users UX and UY , the NPMImeasure is defined as:
NPMI(UX ,UY ) =ln( p(UX ,UY )
p(UX )p(UY ))
−ln(p(UX ,UY )).
If the independence assumption holds, p(UX ,UY ) =p(UX )·(UY )⇒ NPMI = 0. In other cases, the NPMI associa-tion measure quantifies if the overlap between the two sets ofusers is higher than expected, i.e., 0 < NPMI ≤ 1, or, on theother hand, if it is lower than expected, i.e., −1 ≤ NPMI < 0(see Figure 2).
If UX and UY are mutually exclusive, this implies that userui completely separates people in his ego-centric networkaccording to the topics discussed. Thus, p(UX ,UY ) = 0 ⇒NPMI =−1. On the other hand, if UX and UY consist of thesame set of people, then p(UX ,UY ) = 1 ⇒ NPMI = 1.
All the probability distributions at stake can be estimatedusing directly observable quantities (see Figure 3). In fact,the NPMI measure can be expressed based on such quanti-ties. Let us define:
• N = |G′(ui)|-1, as the size of ui’s ego-centric network,excluding ui, i.e., the total number of users to whomui replied (in any topic);
• a =|UX∩UY |
N , as the fraction of users from G′(ui) towhom user ui replied on both topics TX and TY ;
• b =|UX−UY |
N , as the fraction of users from G′(ui) towhom user ui replied only on topic TX ;
• c =|UY−UX |
N , as the fraction of users from G′(ui) towhom user ui replied only on topic TY .
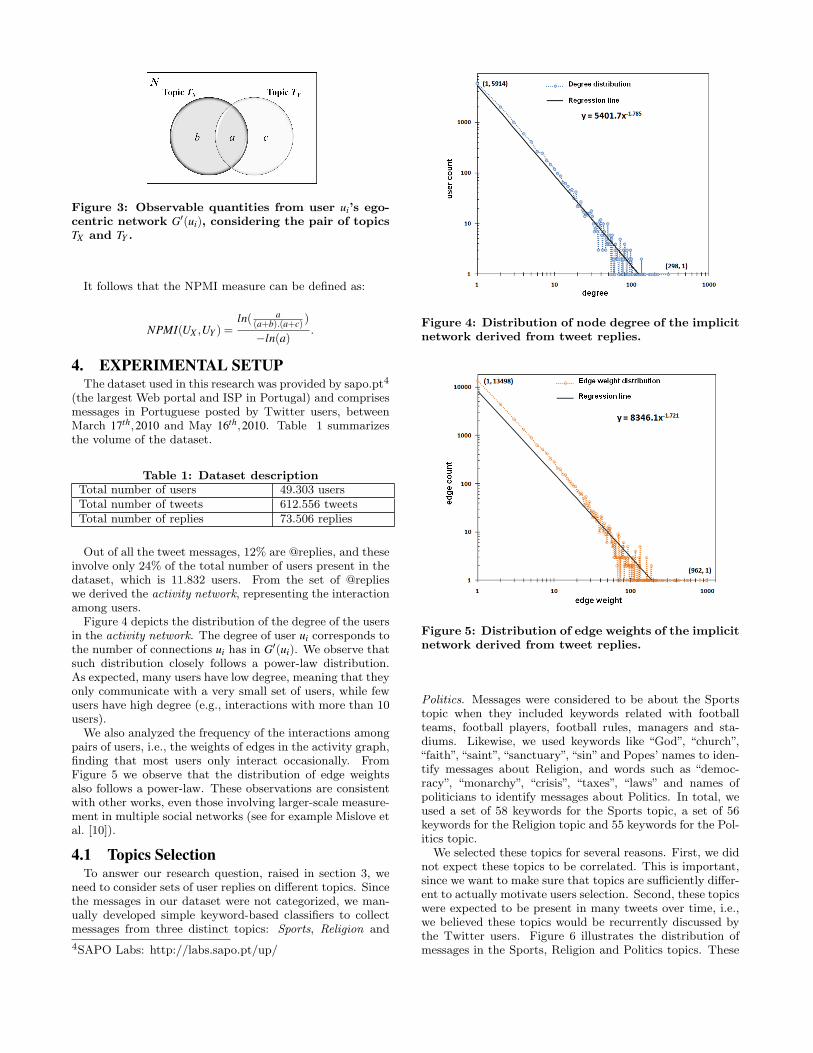
Figure 3: Observable quantities from user ui’s ego-centric network G′(ui), considering the pair of topicsTX and TY .
It follows that the NPMI measure can be defined as:
NPMI(UX ,UY ) =ln( a
(a+b).(a+c) )
−ln(a).
4. EXPERIMENTAL SETUPThe dataset used in this research was provided by sapo.pt4
(the largest Web portal and ISP in Portugal) and comprisesmessages in Portuguese posted by Twitter users, betweenMarch 17th,2010 and May 16th,2010. Table 1 summarizesthe volume of the dataset.
Table 1: Dataset descriptionTotal number of users 49.303 usersTotal number of tweets 612.556 tweetsTotal number of replies 73.506 replies
Out of all the tweet messages, 12% are @replies, and theseinvolve only 24% of the total number of users present in thedataset, which is 11.832 users. From the set of @replieswe derived the activity network, representing the interactionamong users.Figure 4 depicts the distribution of the degree of the users
in the activity network. The degree of user ui corresponds tothe number of connections ui has in G′(ui). We observe thatsuch distribution closely follows a power-law distribution.As expected, many users have low degree, meaning that theyonly communicate with a very small set of users, while fewusers have high degree (e.g., interactions with more than 10users).We also analyzed the frequency of the interactions among
pairs of users, i.e., the weights of edges in the activity graph,finding that most users only interact occasionally. FromFigure 5 we observe that the distribution of edge weightsalso follows a power-law. These observations are consistentwith other works, even those involving larger-scale measure-ment in multiple social networks (see for example Mislove etal. [10]).
4.1 Topics SelectionTo answer our research question, raised in section 3, we
need to consider sets of user replies on different topics. Sincethe messages in our dataset were not categorized, we man-ually developed simple keyword-based classifiers to collectmessages from three distinct topics: Sports, Religion and
4SAPO Labs: http://labs.sapo.pt/up/
Figure 4: Distribution of node degree of the implicitnetwork derived from tweet replies.
Figure 5: Distribution of edge weights of the implicitnetwork derived from tweet replies.
Politics. Messages were considered to be about the Sportstopic when they included keywords related with footballteams, football players, football rules, managers and sta-diums. Likewise, we used keywords like “God”, “church”,“faith”, “saint”, “sanctuary”, “sin” and Popes’ names to iden-tify messages about Religion, and words such as “democ-racy”, “monarchy”, “crisis”, “taxes”, “laws” and names ofpoliticians to identify messages about Politics. In total, weused a set of 58 keywords for the Sports topic, a set of 56keywords for the Religion topic and 55 keywords for the Pol-itics topic.
We selected these topics for several reasons. First, we didnot expect these topics to be correlated. This is important,since we want to make sure that topics are sufficiently differ-ent to actually motivate users selection. Second, these topicswere expected to be present in many tweets over time, i.e.,we believed these topics would be recurrently discussed bythe Twitter users. Figure 6 illustrates the distribution ofmessages in the Sports, Religion and Politics topics. These
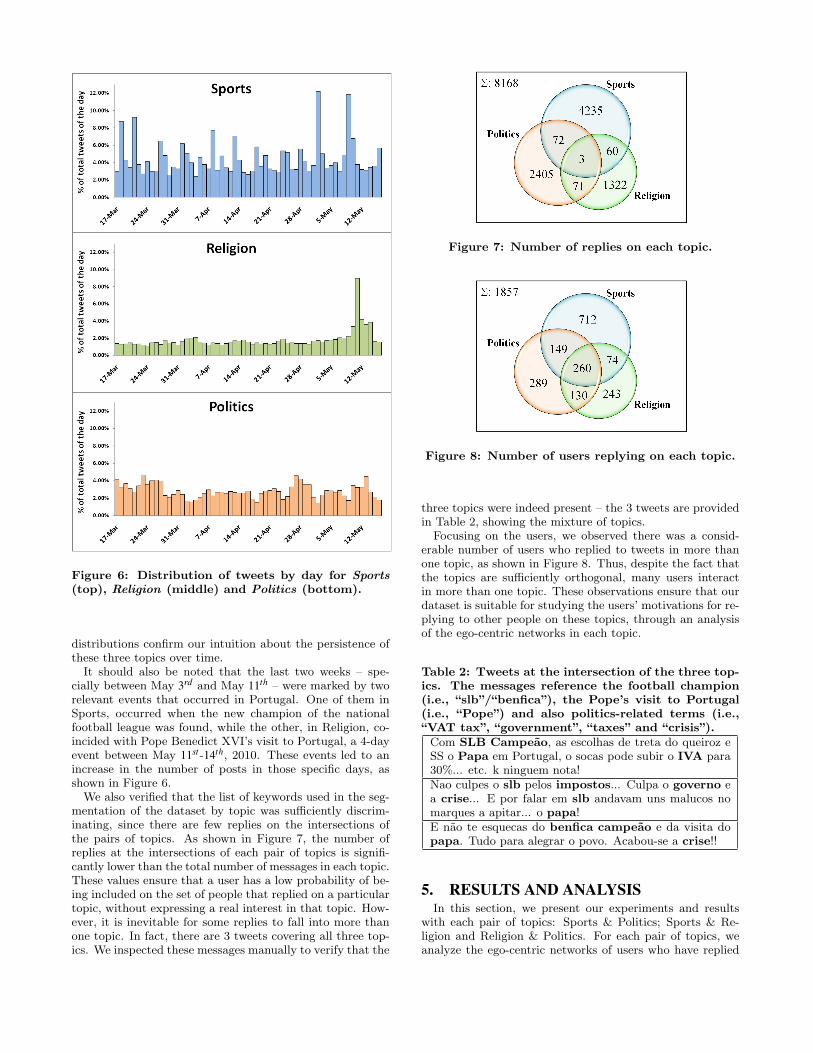
Figure 6: Distribution of tweets by day for Sports(top), Religion (middle) and Politics (bottom).
distributions confirm our intuition about the persistence ofthese three topics over time.It should also be noted that the last two weeks – spe-
cially between May 3rd and May 11th – were marked by tworelevant events that occurred in Portugal. One of them inSports, occurred when the new champion of the nationalfootball league was found, while the other, in Religion, co-incided with Pope Benedict XVI’s visit to Portugal, a 4-dayevent between May 11st -14th, 2010. These events led to anincrease in the number of posts in those specific days, asshown in Figure 6.We also verified that the list of keywords used in the seg-
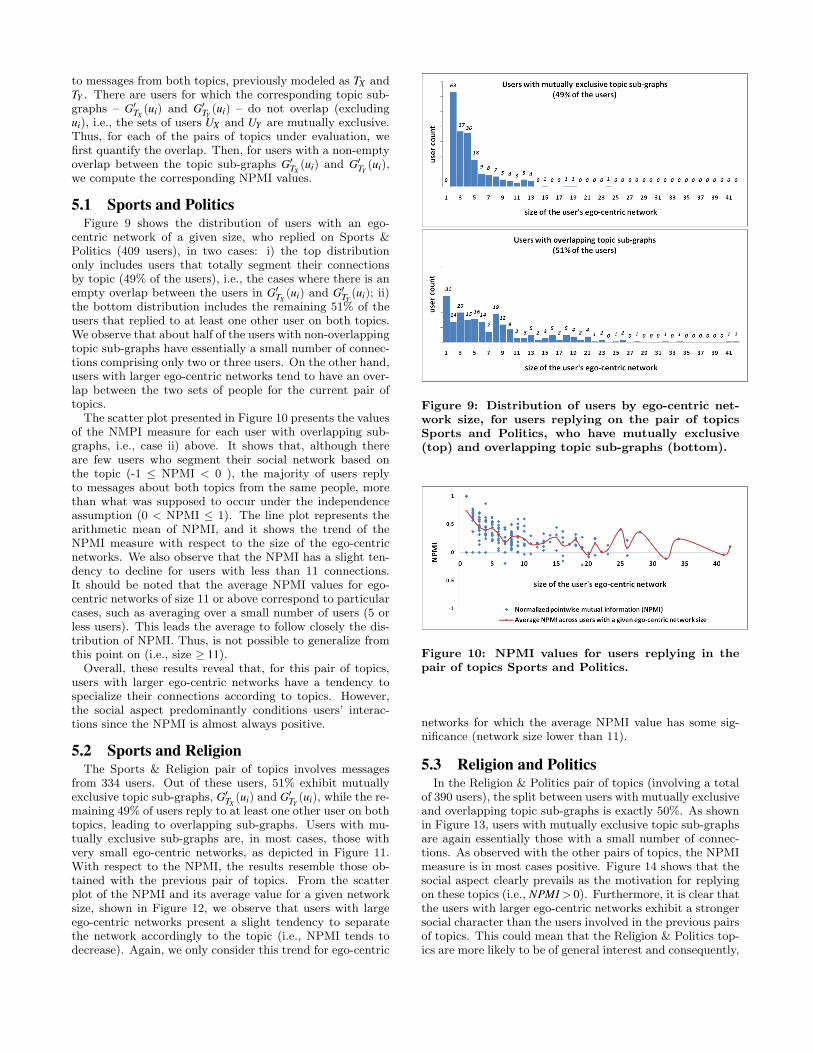
mentation of the dataset by topic was sufficiently discrim-inating, since there are few replies on the intersections ofthe pairs of topics. As shown in Figure 7, the number ofreplies at the intersections of each pair of topics is signifi-cantly lower than the total number of messages in each topic.These values ensure that a user has a low probability of be-ing included on the set of people that replied on a particulartopic, without expressing a real interest in that topic. How-ever, it is inevitable for some replies to fall into more thanone topic. In fact, there are 3 tweets covering all three top-ics. We inspected these messages manually to verify that the
Figure 7: Number of replies on each topic.
Figure 8: Number of users replying on each topic.
three topics were indeed present – the 3 tweets are providedin Table 2, showing the mixture of topics.
Focusing on the users, we observed there was a consid-erable number of users who replied to tweets in more thanone topic, as shown in Figure 8. Thus, despite the fact thatthe topics are sufficiently orthogonal, many users interactin more than one topic. These observations ensure that ourdataset is suitable for studying the users’ motivations for re-plying to other people on these topics, through an analysisof the ego-centric networks in each topic.
Table 2: Tweets at the intersection of the three top-ics. The messages reference the football champion(i.e., “slb”/“benfica”), the Pope’s visit to Portugal(i.e., “Pope”) and also politics-related terms (i.e.,“VAT tax”, “government”, “taxes” and “crisis”).Com SLB Campeao, as escolhas de treta do queiroz eSS o Papa em Portugal, o socas pode subir o IVA para30%... etc. k ninguem nota!Nao culpes o slb pelos impostos... Culpa o governo ea crise... E por falar em slb andavam uns malucos nomarques a apitar... o papa!E nao te esquecas do benfica campeao e da visita dopapa. Tudo para alegrar o povo. Acabou-se a crise!!
5. RESULTS AND ANALYSISIn this section, we present our experiments and results
with each pair of topics: Sports & Politics; Sports & Re-ligion and Religion & Politics. For each pair of topics, weanalyze the ego-centric networks of users who have replied
to messages from both topics, previously modeled as TX andTY . There are users for which the corresponding topic sub-graphs – G′
TX(ui) and G′
TY(ui) – do not overlap (excluding
ui), i.e., the sets of users UX and UY are mutually exclusive.Thus, for each of the pairs of topics under evaluation, wefirst quantify the overlap. Then, for users with a non-emptyoverlap between the topic sub-graphs G′
TX(ui) and G′
TY(ui),
we compute the corresponding NPMI values.
5.1 Sports and PoliticsFigure 9 shows the distribution of users with an ego-
centric network of a given size, who replied on Sports &Politics (409 users), in two cases: i) the top distributiononly includes users that totally segment their connectionsby topic (49% of the users), i.e., the cases where there is anempty overlap between the users in G′
TX(ui) and G′
TY(ui); ii)
the bottom distribution includes the remaining 51% of theusers that replied to at least one other user on both topics.We observe that about half of the users with non-overlappingtopic sub-graphs have essentially a small number of connec-tions comprising only two or three users. On the other hand,users with larger ego-centric networks tend to have an over-lap between the two sets of people for the current pair oftopics.The scatter plot presented in Figure 10 presents the values
of the NMPI measure for each user with overlapping sub-graphs, i.e., case ii) above. It shows that, although thereare few users who segment their social network based onthe topic (-1 ≤ NPMI < 0 ), the majority of users replyto messages about both topics from the same people, morethan what was supposed to occur under the independenceassumption (0 < NPMI ≤ 1). The line plot represents thearithmetic mean of NPMI, and it shows the trend of theNPMI measure with respect to the size of the ego-centricnetworks. We also observe that the NPMI has a slight ten-dency to decline for users with less than 11 connections.It should be noted that the average NPMI values for ego-centric networks of size 11 or above correspond to particularcases, such as averaging over a small number of users (5 orless users). This leads the average to follow closely the dis-tribution of NPMI. Thus, is not possible to generalize fromthis point on (i.e., size ≥ 11).Overall, these results reveal that, for this pair of topics,
users with larger ego-centric networks have a tendency tospecialize their connections according to topics. However,the social aspect predominantly conditions users’ interac-tions since the NPMI is almost always positive.
5.2 Sports and ReligionThe Sports & Religion pair of topics involves messages
from 334 users. Out of these users, 51% exhibit mutuallyexclusive topic sub-graphs, G′
TX(ui) and G′
TY(ui), while the re-
maining 49% of users reply to at least one other user on bothtopics, leading to overlapping sub-graphs. Users with mu-tually exclusive sub-graphs are, in most cases, those withvery small ego-centric networks, as depicted in Figure 11.With respect to the NPMI, the results resemble those ob-tained with the previous pair of topics. From the scatterplot of the NPMI and its average value for a given networksize, shown in Figure 12, we observe that users with largeego-centric networks present a slight tendency to separatethe network accordingly to the topic (i.e., NPMI tends todecrease). Again, we only consider this trend for ego-centric
Figure 9: Distribution of users by ego-centric net-work size, for users replying on the pair of topicsSports and Politics, who have mutually exclusive(top) and overlapping topic sub-graphs (bottom).
Figure 10: NPMI values for users replying in thepair of topics Sports and Politics.
networks for which the average NPMI value has some sig-nificance (network size lower than 11).
5.3 Religion and PoliticsIn the Religion & Politics pair of topics (involving a total
of 390 users), the split between users with mutually exclusiveand overlapping topic sub-graphs is exactly 50%. As shownin Figure 13, users with mutually exclusive topic sub-graphsare again essentially those with a small number of connec-tions. As observed with the other pairs of topics, the NPMImeasure is in most cases positive. Figure 14 shows that thesocial aspect clearly prevails as the motivation for replyingon these topics (i.e., NPMI > 0). Furthermore, it is clear thatthe users with larger ego-centric networks exhibit a strongersocial character than the users involved in the previous pairsof topics. This could mean that the Religion & Politics top-ics are more likely to be of general interest and consequently,
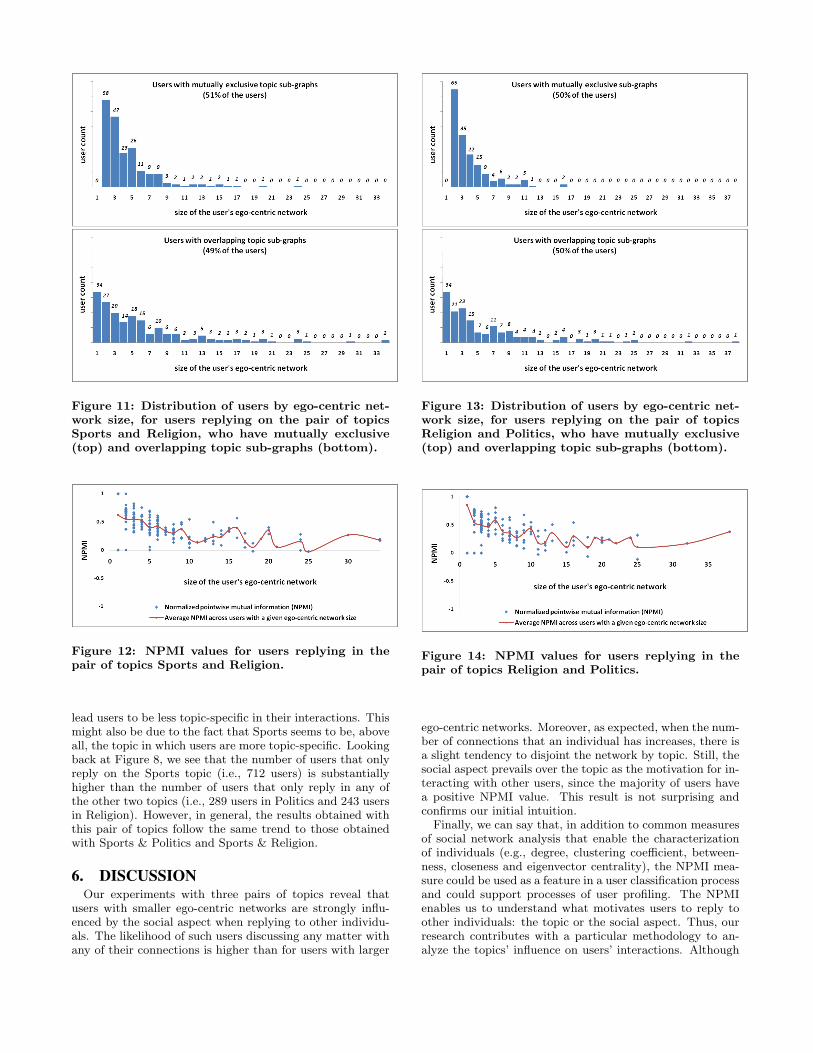
Figure 11: Distribution of users by ego-centric net-work size, for users replying on the pair of topicsSports and Religion, who have mutually exclusive(top) and overlapping topic sub-graphs (bottom).
Figure 12: NPMI values for users replying in thepair of topics Sports and Religion.
lead users to be less topic-specific in their interactions. Thismight also be due to the fact that Sports seems to be, aboveall, the topic in which users are more topic-specific. Lookingback at Figure 8, we see that the number of users that onlyreply on the Sports topic (i.e., 712 users) is substantiallyhigher than the number of users that only reply in any ofthe other two topics (i.e., 289 users in Politics and 243 usersin Religion). However, in general, the results obtained withthis pair of topics follow the same trend to those obtainedwith Sports & Politics and Sports & Religion.
6. DISCUSSIONOur experiments with three pairs of topics reveal that
users with smaller ego-centric networks are strongly influ-enced by the social aspect when replying to other individu-als. The likelihood of such users discussing any matter withany of their connections is higher than for users with larger
Figure 13: Distribution of users by ego-centric net-work size, for users replying on the pair of topicsReligion and Politics, who have mutually exclusive(top) and overlapping topic sub-graphs (bottom).
Figure 14: NPMI values for users replying in thepair of topics Religion and Politics.
ego-centric networks. Moreover, as expected, when the num-ber of connections that an individual has increases, there isa slight tendency to disjoint the network by topic. Still, thesocial aspect prevails over the topic as the motivation for in-teracting with other users, since the majority of users havea positive NPMI value. This result is not surprising andconfirms our initial intuition.
Finally, we can say that, in addition to common measuresof social network analysis that enable the characterizationof individuals (e.g., degree, clustering coefficient, between-ness, closeness and eigenvector centrality), the NPMI mea-sure could be used as a feature in a user classification processand could support processes of user profiling. The NPMIenables us to understand what motivates users to reply toother individuals: the topic or the social aspect. Thus, ourresearch contributes with a particular methodology to an-alyze the topics’ influence on users’ interactions. Although
our results reveal that users with more connections havea tendency to separate the network by topic, we do not at-tempt to generalize these findings due to scale of our datasetand also to the “manual” process used for topics’ selection.
7. CONCLUSIONS AND FUTURE WORKIn this paper we have presented a study of users’ interac-
tions through an analysis of the Twitter @replies network,using a dataset consisting of Twitter messages from Portu-gal. We focused exclusively on the activity network, i.e., theimplicit social network derived from tweet replies, to inves-tigate what motivates users to reply to other individuals.We showed that this implicit network presents some prop-erties shared by many social networks. More importantly,we found that the social aspect appears to be predominantin motivating users’ interactions. However, for users withlarger ego-centric networks we observed a slight tendency forusers to separate their connections depending on the topicsdiscussed. Understanding the dynamics of networks and an-alyzing the topics’ influence on user interactions are impor-tant to improve recommender systems, as we can customizethe recommendations according to the user’s profile.As future work, we will be studying a larger set of topics
and also comparing seasonal topics with permanent ones.Moreover, we will explore some popular techniques such asSupport Vector Machines (SVM) [7] classifiers aiming to pro-duce a classified collection, which will automate the processof network segmentation. Furthermore, instead of a manualtopic selection, we will explore topic modeling techniques,such as Latent Dirichlet Allocation (LDA) [1] to discoverthe latent topics present in the dataset. This will allow usto replicate this study at a much larger scale.
8. ACKNOWLEDGMENTSWe would like to thank SAPO Labs (http://labs.sapo.pt)
for providing access to the Twitter data crawl, and to Gus-tavo Laboreiro for the help in the preparation of the datasetused in the experiments. We would also like to thank theuseful comments made by the anonymous reviewers.
9. REFERENCES[1] D. M. Blei, A. Y. Ng, and M. I. Jordan. Latent
dirichlet allocation. Journal of Machine LearningResearch, 3:993–1022, 2003.
[2] D. Boyd, S. Golder, and G. Lotan. Tweet, tweet,retweet: Conversational aspects of retweeting ontwitter. In HICSS-43, 2010.
[3] B. Gerlof. Normalized (pointwise) mutual informationin collocation extraction. In Chiarcos Eckart deCastilho & Stede, From Form to Meaning: ProcessingTexts Automatically, page 3140. Proc. of the BiennialGSCL Conference, 2009.
[4] E. Gilbert and K. Karahalios. Predicting tie strengthwith social media. In Proc. of the 27th InternationalConference on Human Factors in Computing Systems,pages 211–220, Boston, MA, USA, 2009.
[5] S. A. Golder, D. M. Wilkinson, and B. A. Huberman.Rhythms of social interaction: Messaging within amassive online network. Proc. 3rd Intl. Conf. onCommunities and Technologies, 2007.
[6] A. Java, X. Song, T. Finin, and B. Tseng. Why wetwitter: understanding microblogging usage and
communities. In Proc. of the 9th WebKDD and 1stSNA-KDD 2007 Workshop on Web Mining and SocialNetwork Analysis, pages 56–65, San Jose, CA, 2007.
[7] T. Joachims. Text categorization with support vectormachines: learning with many relevant features. InProceedings of ECML-98, 10th European Conferenceon Machine Learning, pages 137–142, Chemnitz, DE,1998. Springer Verlag, Heidelberg, DE.
[8] R. Kumar, J. Novak, and A. Tomkins. Structure andevolution of online social networks. In Proc. of the12th ACM SIGKDD International Conference onKnowledge Discovery and Data Mining, pages611–617, Philadelphia, PA, USA, 2006.
[9] H. Kwak, C. Lee, H. Park, and S. Moon. What isTwitter, a social network or a news media? In WWW’10: Proc. of the 19th International Conference onWorld Wide Web, pages 591–600, New York, NY,USA, 2010.
[10] A. Mislove, M. Marcon, K. Gummadi, P. Druschel,and B. Bhattacharjee. Measurement and analysis ofonline social networks. In IMC ’07: Proceedings of the7th ACM SIGCOMM Conference on InternetMeasurement, pages 29–42, San Diego, CA, USA,2007.
[11] M. Moricz, Y. Dosbayev, and M. Berlyant. PYMK:friend recommendation at myspace. In Proc. of the2010 International Conference on Management ofData, pages 999–1002, Indianapolis, Indiana, USA,2010.
[12] O. Phelan, K. McCarthy, and B. Smyth. Using twitterto recommend real-time topical news. In Proc. of the3rd ACM Conference on Recommender Systems, pages385–388, New York, NY, USA, 2009.
[13] J. Scott. Social Networks Analysis: a handbook. SAGEPublications Ltd, 2nd edition, 2000.
[14] B. Viswanath, A. Mislove, M. Cha, and K. P.Gummadi. On the evolution of user interaction infacebook. In Proc. of the 2nd ACM Workshop onOnline Social Networks, pages 37–42, Barcelona,Spain, 2009.
[15] S. Wasserman and K. Faust. Social Network Analysis:Methods and Applications. Cambridge UniversityPress, 1st edition, Nov. 1994.
[16] J. Weng, E. Lim, J. Jiang, and Q. He. TwitterRank:finding topic-sensitive influential twitterers. In Proc.of the 3rd ACM International Conference on WebSearch and Data Mining, pages 261–270, New York,NY, USA, 2010.
[17] D. Zhao and M. B. Rosson. How and why peopletwitter: the role that micro-blogging plays in informalcommunication at work. In Proc. of the ACM 2009International Conference on Supporting Group Work,pages 243–252, Sanibel Island, FL, USA, 2009.