Embed Size (px)
Citation preview
SUPPORTING MATERIAL
Characterization of the Solution Structure of Human Serum Albumin Loaded with a Metal Porphyrin and Fatty Acids
Matthias J. N. Junk, Hans W. Spiess, and Dariush Hinderberger*
Max Planck Institute for Polymer Research, Ackermannweg 10, 55128 Mainz, Germany
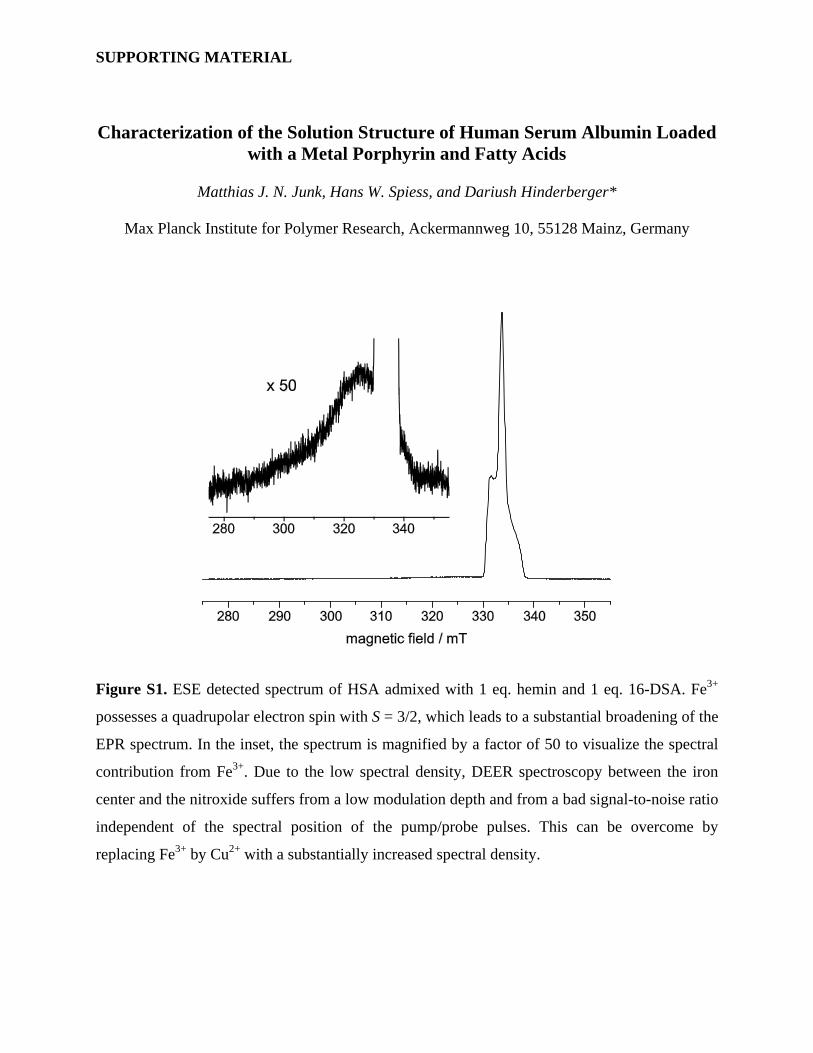
Figure S1. ESE detected spectrum of HSA admixed with 1 eq. hemin and 1 eq. 16-DSA. Fe3+
possesses a quadrupolar electron spin with S = 3/2, which leads to a substantial broadening of the
EPR spectrum. In the inset, the spectrum is magnified by a factor of 50 to visualize the spectral
contribution from Fe3+. Due to the low spectral density, DEER spectroscopy between the iron
center and the nitroxide suffers from a low modulation depth and from a bad signal-to-noise ratio
independent of the spectral position of the pump/probe pulses. This can be overcome by
replacing Fe3+ by Cu2+ with a substantially increased spectral density.

Figure S2. CW EPR spectra of human serum albumin loaded with one eq. Cu(II) protoporphyrin
IX and various amounts of 16-rDSA and 16-DSA. The spectra were recorded at 298 K. The
characteristic signatures of DSA bound to HSA are marked by solid lines, the signature of free
fatty acids in solution is marked by dashed lines. Spectral features stemming from Cu(II)
protoporphyrin IX are marked by asterisks. Virtually all DSA molecules are complexed by the
protein, when it is loaded with one hemin-analog molecule and one fatty acid on average (bottom
spectra). An increased amount of fatty acids per HSA molecule leads to increasing signatures
due to free, uncomplexed fatty acids. Yet, even at a HSA–fatty acid ratio of 1:5 (top spectra),
more than 99 % of all fatty acids are complexed by the protein as deduced from the relative
spectral intensities of both species. At this HSA–fatty acid ratio, five fatty acids are bound in six
available binding sites per protein molecule (one of a total of seven fatty acid binding sites is
occupied by Cu(II) protoporphyrin IX). A similarly high fraction of bound DSA molecules was
observed in CW EPR spectra of HSA complexed with (six) fatty acids only (Junk et al. Angew.
Chem. Int. Ed. 2010, 49, 8755). Hence, the affinities of the residual binding sites of the protein
for fatty acids are hardly affected by a simultaneous binding of a porphyrinoid molecule. In the
spectra on the left, an increase of the fatty acid loading is achieved by increasing the amount of
diamagnetic rDSA while keeping the HSA–DSA ratio constant. This procedure was chosen to
limit the amount of EPR-active species per protein molecule to two and hence to avoid multispin
artifacts in the DEER experiments. In the spectra on the right, the increase of the fatty acid
loading is achieved by varying the amount of the EPR-active DSA molecules themselves. Both
series of spectra exhibit similar relative amounts of free spin probes at the same rate of loading.
(Note that a slight dipolar broadening of the spectral features of the bound species causes the
signatures from the free species to appear slightly more pronounced in the non-spindiluted
spectra shown on the right). This indicates that HSA exhibits similar binding affinities to rDSA
and DSA and that spin dilution does not lead to a preferential occupation of one specific binding
site by the EPR-active DSA molecule.

Figure S3. Background-corrected DEER time-domain data and dipolar spectra of HSA
complexed with 1 eq. of Cu(II) protoporphyrin IX and varying amounts of 16-DSA. The
observer pulse was applied at field positions exciting Cu(II) orientations predominantly in the
-plane of the porphyrin ring (A, position xy) and outerdiagonal elements towards the
molecular -axis (B, position z1; and C, position z2). Higher fractions of spin-labeled fatty acids
lead to increased modulation depths indicating a higher number of paramagnetic centers in the
protein cluster. The pronounced decrease of the dominant frequency at ~1 MHz and the
concomitant increase of large dipolar couplings at a high loading of the protein with
paramagnetic molecules are due to multispin contributions to the DEER signal (cf. Ref. 24).
These contributions cause large dipolar couplings to be overestimated and small dipolar
couplings to be suppressed (cf. Junk et al. J. Magn. Reson. 2011, doi:
10.1016/j.jmr.2011.03.003).

Figure S4. Representation of Figure 5 (main text) in the time domain. The intramolecular parts
of the recorded DEER time-domain data of HSA complexed with 1 eq. Cu(II) protoporphyrin IX,
4 eq. 16-rDSA, and 1 eq. 16-DSA are shown by solid, black lines for observer pulse positions xy
and z1. The corresponding calculated time-domain data assuming full occupation of all fatty acid
binding sites (2–7) are depicted by dashed, gray lines. The modulation depth of the calculated
time-domain data was adjusted to fit the modulation depth of the measured DEER data.

Figure S5. Representation of Figure 6A (main text) in the time domain. Background-corrected
DEER time-domain data of HSA complexed with 1 eq. of Cu(II) protoporphyrin IX and 1 eq. of
16-DSA for observer pulse positions xy and z1 are shown by solid, black lines. Best fits based on
a single dipolar coupling are depicted by dashed, gray lines. These fits are obtained if the
coupled electron spin is assumed to be placed in the extended xy-plane of the porphyrin ring ( =
90°) with a distance of r = 3.85 nm to Cu(II). The modulation depth of the calculated time-
domain data was adjusted to fit the modulation depth of the measured DEER data.

Figure S6. Evaluation of the orientation of the dominant dipolar contribution. The Figure
depicts calculated DEER time-domain data (left) and Pake patterns (right) stemming from a
single dipolar contribution between a Cu(II) and a nitroxide electron spin with a fixed distance of
r = 3.85 nm and varying angles between the Cu(II)–nitroxide connecting vector r and the -
axis of the molecular Cu(II) frame for observer pulse positions xy (top) and z1 (bottom). As the
angle is varied from 0° (nitroxide oriented along the z-axis of the Cu(II) frame) to 90°
(nitroxide spin in the xy-plane of the porphyrin ring), the spectral contribution II ( = 0°) at ~2
MHz becomes ever more prominent for observer pulse position xy while its relative intensity
decreases for observer pulse position z1. The calculated data for = 80° and 90° closely match
the experimentally observed DEER data. For = 80°, a small shoulder at II = ±2 MHz is
observed at observer pulse position z1, which is still consistent with the experimentally obtained
DEER data (Figure 6). However, this spectral shoulder becomes too prominent for angles 70°,
leading to the conclusion that the nitroxide spin of the dominant dipolar contribution has to be
placed within an angular deviation of ±10° from the porphyrin plane.
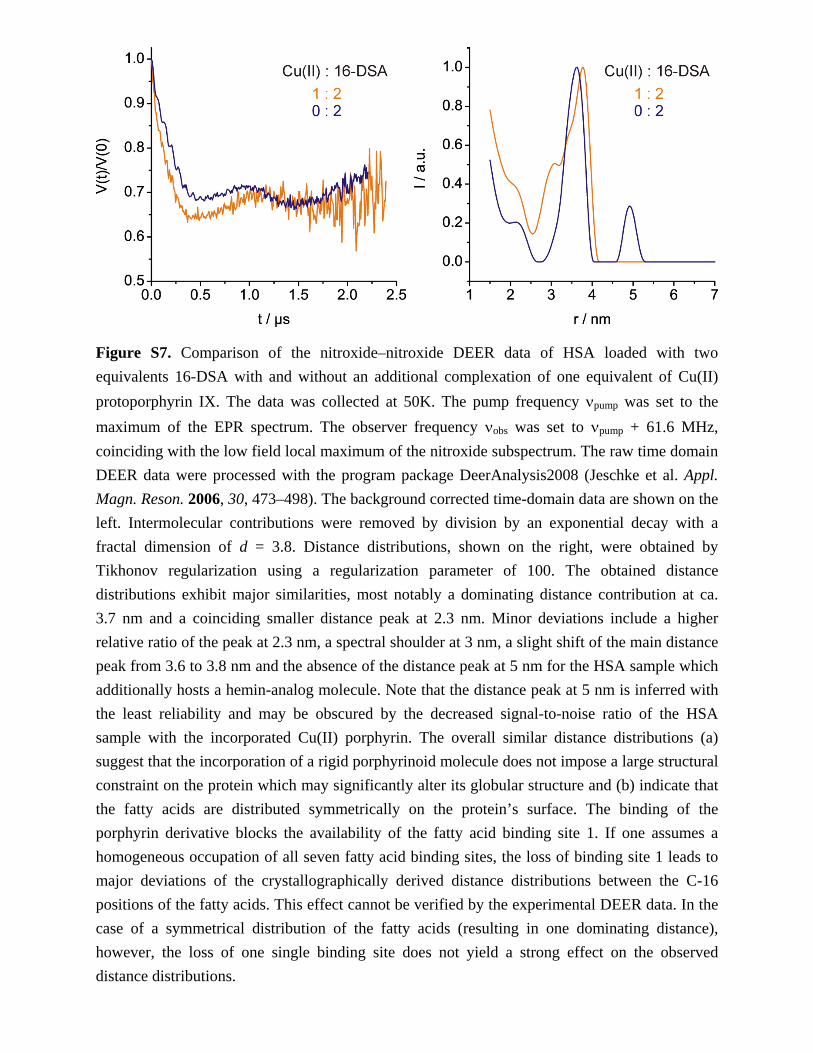
Figure S7. Comparison of the nitroxide–nitroxide DEER data of HSA loaded with two
equivalents 16-DSA with and without an additional complexation of one equivalent of Cu(II)
protoporphyrin IX. The data was collected at 50K. The pump frequency pump was set to the
maximum of the EPR spectrum. The observer frequency obs was set to pump + 61.6 MHz,
coinciding with the low field local maximum of the nitroxide subspectrum. The raw time domain
DEER data were processed with the program package DeerAnalysis2008 (Jeschke et al. Appl.
Magn. Reson. 2006, 30, 473–498). The background corrected time-domain data are shown on the
left. Intermolecular contributions were removed by division by an exponential decay with a
fractal dimension of d = 3.8. Distance distributions, shown on the right, were obtained by
Tikhonov regularization using a regularization parameter of 100. The obtained distance
distributions exhibit major similarities, most notably a dominating distance contribution at ca.
3.7 nm and a coinciding smaller distance peak at 2.3 nm. Minor deviations include a higher
relative ratio of the peak at 2.3 nm, a spectral shoulder at 3 nm, a slight shift of the main distance
peak from 3.6 to 3.8 nm and the absence of the distance peak at 5 nm for the HSA sample which
additionally hosts a hemin-analog molecule. Note that the distance peak at 5 nm is inferred with
the least reliability and may be obscured by the decreased signal-to-noise ratio of the HSA
sample with the incorporated Cu(II) porphyrin. The overall similar distance distributions (a)
suggest that the incorporation of a rigid porphyrinoid molecule does not impose a large structural
constraint on the protein which may significantly alter its globular structure and (b) indicate that
the fatty acids are distributed symmetrically on the protein’s surface. The binding of the
porphyrin derivative blocks the availability of the fatty acid binding site 1. If one assumes a
homogeneous occupation of all seven fatty acid binding sites, the loss of binding site 1 leads to
major deviations of the crystallographically derived distance distributions between the C-16
positions of the fatty acids. This effect cannot be verified by the experimental DEER data. In the
case of a symmetrical distribution of the fatty acids (resulting in one dominating distance),
however, the loss of one single binding site does not yield a strong effect on the observed
distance distributions.