Embed Size (px)
Citation preview
buildings
Article
Characterization of the Mechanical Performance inCompression Perpendicular to the Grain ofInsect-Deteriorated Timber
Maxime Verbist 1,* , Jorge M. Branco 1 and Lina Nunes 2,3
1 Institute for Sustainability and Innovation in Structural Engineering, Civil Engineering Department,University of Minho, Campus de Azurém, 4800-058 Guimarães, Portugal; [email protected]
2 Structures Department, National Laboratory for Civil Engineering, 1700-066 Lisboa, Portugal;[email protected]
3 Centre for Ecology, Evolution and Environmental Changes, Azorean Biodiversity Group and University ofthe Azores, 9700-042 Angra do Heroísmo, Portugal
* Correspondence: [email protected]
Received: 19 December 2019; Accepted: 14 January 2020; Published: 19 January 2020�����������������
Abstract: Among biological agents, insect attacks may cause severe degradation of timber structuresin the service life of buildings which leads to lower mechanical performance and, thus, maintenanceproblems over time. Additionally, compression perpendicular to the grain always features a weak spotwith respect to the long-term mechanical performance of timber members and joints. In the presentwork, the respective strength and elastic modulus were thus investigated for insect deterioratedwood. Following a standardized geometry, small samples degraded by anobiids were extractedfrom beams made of sweet chestnut wood (Castanea sativa Mill.) that were removed from service.Visual assessment of the external wood surfaces was then performed to identify areas infested byinsects. Afterwards, destructive monotonic compression tests were carried out perpendicularly tothe grain on the damaged area to determine the loss of compressive strength and elastic modulus.The experimental results showed that the loss of compressive strength and elastic modulus mightbe linearly correlated to the wood density loss for small samples infested by insects. Nonetheless,future work should focus on determining accurately the density loss in the insect-deteriorated partthrough non- or semi-destructive tests, in order to establish stronger relationships with the mechanicalproperties loss investigated.
Keywords: timber; insect wood deterioration; compression; destructive tests
1. Introduction
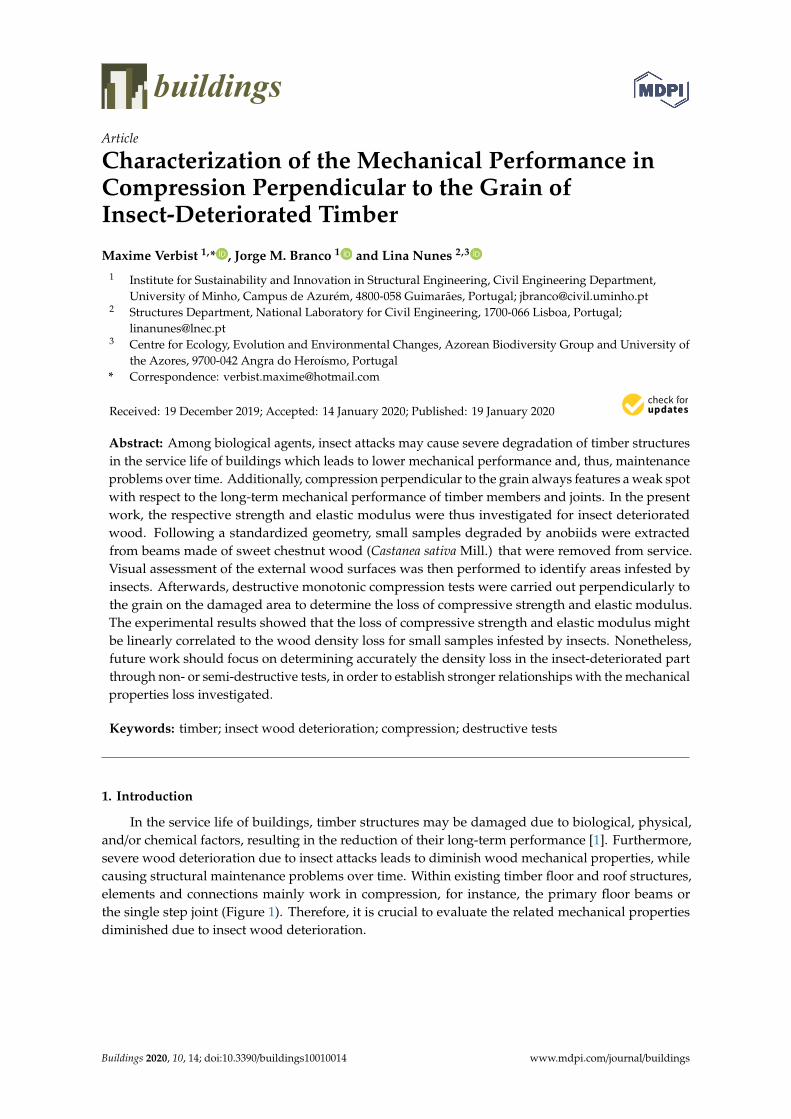
In the service life of buildings, timber structures may be damaged due to biological, physical,and/or chemical factors, resulting in the reduction of their long-term performance [1]. Furthermore,severe wood deterioration due to insect attacks leads to diminish wood mechanical properties, whilecausing structural maintenance problems over time. Within existing timber floor and roof structures,elements and connections mainly work in compression, for instance, the primary floor beams orthe single step joint (Figure 1). Therefore, it is crucial to evaluate the related mechanical propertiesdiminished due to insect wood deterioration.
Buildings 2020, 10, 14; doi:10.3390/buildings10010014 www.mdpi.com/journal/buildings

Buildings 2020, 10, 14 2 of 14
Buildings 2020, 10, x FOR PEER REVIEW 2 of 13
they are commonly higher for hardwood than softwood, and with increasing wood density. As a first approach to the mechanical characterization, strength and elastic moduli could be obtained from standards [3,4] or wood handbooks [5]. Nonetheless, transversal compression appears as a weak spot with respect to the long-term mechanical performance of structural members and joints working in compression (Figure 1). Reflecting lower strength and higher deformation, the residual mechanical behavior of degraded wood in compression perpendicular to the grain should thus be investigated.
When assessing the mechanical performance of timber connections and members [6–10], mechanical characterization in compression perpendicular to the grain was beforehand investigated for several wood species (i.e., Abies alba Mill., Castanea sativa Mill., Picea abies L., Pinus pinaster Ait., Pinus sylvestris L.). As a result, force-displacement responses were obtained through carrying out monotonic compression tests perpendicular to the grain on small timber samples, in accordance with standards (e.g., American Standard Test Methods ASTM D143-94 [11], European Standard EN 408 [12]). Concomitantly, the respective compressive strengths and elastic moduli were determined through using analytical models detailed in the literature [9,13,14].
As regards insect wood deterioration, mechanical characterization in bending and compression [15] was executed on small samples extracted from pine that had been attacked by wood-boring beetles, most likely Anobium punctatum De Geer. This research concluded that no clear correlation was successfully established between the effective cross-section of samples, taking into account the area of visible insect emergency holes, and the loss of mechanical properties studied. So far, the latter seems governed by the wood density loss only. Other experimental attempts [16–18] were achieved on the efficiency of semi- and non-destructives techniques, such as “screw pull-out” technique and “micro-computed tomography” methodology, in assessing the residual wood density, in order to correlate it with the residual compressive and shear strength parallel to the grain of maritime pine infested by anobiids.
In this research context, the present work aims at characterizing the residual mechanical behavior in compression perpendicular to the grain in the radial direction from 12 small samples made of sweet chestnut (Castanea sativa Mill.) degraded by anobiids. In other words, their respective compressive strength and elastic modulus have to be assessed and correlated to residual wood density. To this end, the experimental program was established into two steps: (1) Visual assessment of wood deterioration and wood density evaluation, (2) monotonic compression tests perpendicular to the grain. Based on a larger experimental dataset, predictive models should be determined in the future to estimate the mechanical performance of insect-deteriorated wood with respect to the residual wood density.
(a) (b)
Figure 1. Insect-deteriorated timber members withstanding compressive loads (𝐹 ), implying their vertical (𝐹 ) and horizontal (𝐹 ) components in connections: Main floor beam in contact with masonry support (a), single step joint within roof trusses (b). Black dots represent exit holes on the external surfaces of wood infested by insects.
Figure 1. Insect-deteriorated timber members withstanding compressive loads (Fc), implying theirvertical (FV) and horizontal (FH) components in connections: Main floor beam in contact with masonrysupport (a), single step joint within roof trusses (b). Black dots represent exit holes on the externalsurfaces of wood infested by insects.
Wood features an orthotropic constitution conditioning the mechanical performance of structuralmembers and connections. Compressive, shear, and tensile strength are higher in the fiber direction,while compressive and shear strength are lower and the tensile strength quasi-negligible in thetransversal directions [2]. Besides, those mechanical properties vary between wood species; they arecommonly higher for hardwood than softwood, and with increasing wood density. As a first approachto the mechanical characterization, strength and elastic moduli could be obtained from standards [3,4]or wood handbooks [5]. Nonetheless, transversal compression appears as a weak spot with respectto the long-term mechanical performance of structural members and joints working in compression(Figure 1). Reflecting lower strength and higher deformation, the residual mechanical behavior ofdegraded wood in compression perpendicular to the grain should thus be investigated.
When assessing the mechanical performance of timber connections and members [6–10],mechanical characterization in compression perpendicular to the grain was beforehand investigatedfor several wood species (i.e., Abies alba Mill., Castanea sativa Mill., Picea abies L., Pinus pinaster Ait.,Pinus sylvestris L.). As a result, force-displacement responses were obtained through carrying outmonotonic compression tests perpendicular to the grain on small timber samples, in accordance withstandards (e.g., American Standard Test Methods ASTM D143-94 [11], European Standard EN 408 [12]).Concomitantly, the respective compressive strengths and elastic moduli were determined throughusing analytical models detailed in the literature [9,13,14].
As regards insect wood deterioration, mechanical characterization in bending and compression [15]was executed on small samples extracted from pine that had been attacked by wood-boring beetles, mostlikely Anobium punctatum De Geer. This research concluded that no clear correlation was successfullyestablished between the effective cross-section of samples, taking into account the area of visible insectemergency holes, and the loss of mechanical properties studied. So far, the latter seems governedby the wood density loss only. Other experimental attempts [16–18] were achieved on the efficiencyof semi- and non-destructives techniques, such as “screw pull-out” technique and “micro-computedtomography” methodology, in assessing the residual wood density, in order to correlate it with theresidual compressive and shear strength parallel to the grain of maritime pine infested by anobiids.
In this research context, the present work aims at characterizing the residual mechanical behaviorin compression perpendicular to the grain in the radial direction from 12 small samples made of sweetchestnut (Castanea sativa Mill.) degraded by anobiids. In other words, their respective compressivestrength and elastic modulus have to be assessed and correlated to residual wood density. To this end,the experimental program was established into two steps: (1) Visual assessment of wood deterioration

Buildings 2020, 10, 14 3 of 14
and wood density evaluation, (2) monotonic compression tests perpendicular to the grain. Based ona larger experimental dataset, predictive models should be determined in the future to estimate themechanical performance of insect-deteriorated wood with respect to the residual wood density.
2. Materials and Methods
The present experimental method aims to establish any relevant correlation between the lossof mechanical properties in compression perpendicular to the grain and the residual wood density.In the following section, 12 insect-degraded and 4 sound specimens are described, while tackling theirvisual assessment and the evaluation of their respective wood density. As with previous studies on thewood mechanical characterization [8,10], monotonic compression tests perpendicular to the grain inthe radial direction were implemented to determine the force-displacement response for small timbersamples, conforming to standards (ASTM D143-94 [11], EN 408 [12]). Lastly, several standardized andanalytical models [9,13,14] were detailed to calculate the compressive strength and elastic modulus.
2.1. Specimens
Several small samples were extracted from existing timber beams of chestnut wood (C. sativa),so that the upper face (Figure 2) was cut from the layer that visually appeared to present the higherlevel of deterioration. Regarding the mechanical characterization detailed further, the monotoniccompression load was assumed on the upper face. The degradation found was restricted to sapwood andmainly due to insects identified as anobiids (Coleoptera Anobiidae). Due to the limited availability ofinfested timber beams, only 12 degraded samples were gathered for the present experimental campaign.
Buildings 2020, 10, x FOR PEER REVIEW 3 of 13
2. Materials and Methods
The present experimental method aims to establish any relevant correlation between the loss of mechanical properties in compression perpendicular to the grain and the residual wood density. In the following section, 12 insect-degraded and 4 sound specimens are described, while tackling their visual assessment and the evaluation of their respective wood density. As with previous studies on the wood mechanical characterization [8,10], monotonic compression tests perpendicular to the grain in the radial direction were implemented to determine the force-displacement response for small timber samples, conforming to standards (ASTM D143-94 [11], EN 408 [12]). Lastly, several standardized and analytical models [9,13,14] were detailed to calculate the compressive strength and elastic modulus.
2.1. Specimens
Several small samples were extracted from existing timber beams of chestnut wood (C. sativa), so that the upper face (Figure 2) was cut from the layer that visually appeared to present the higher level of deterioration. Regarding the mechanical characterization detailed further, the monotonic compression load was assumed on the upper face. The degradation found was restricted to sapwood and mainly due to insects identified as anobiids (Coleoptera Anobiidae). Due to the limited availability of infested timber beams, only 12 degraded samples were gathered for the present experimental campaign.
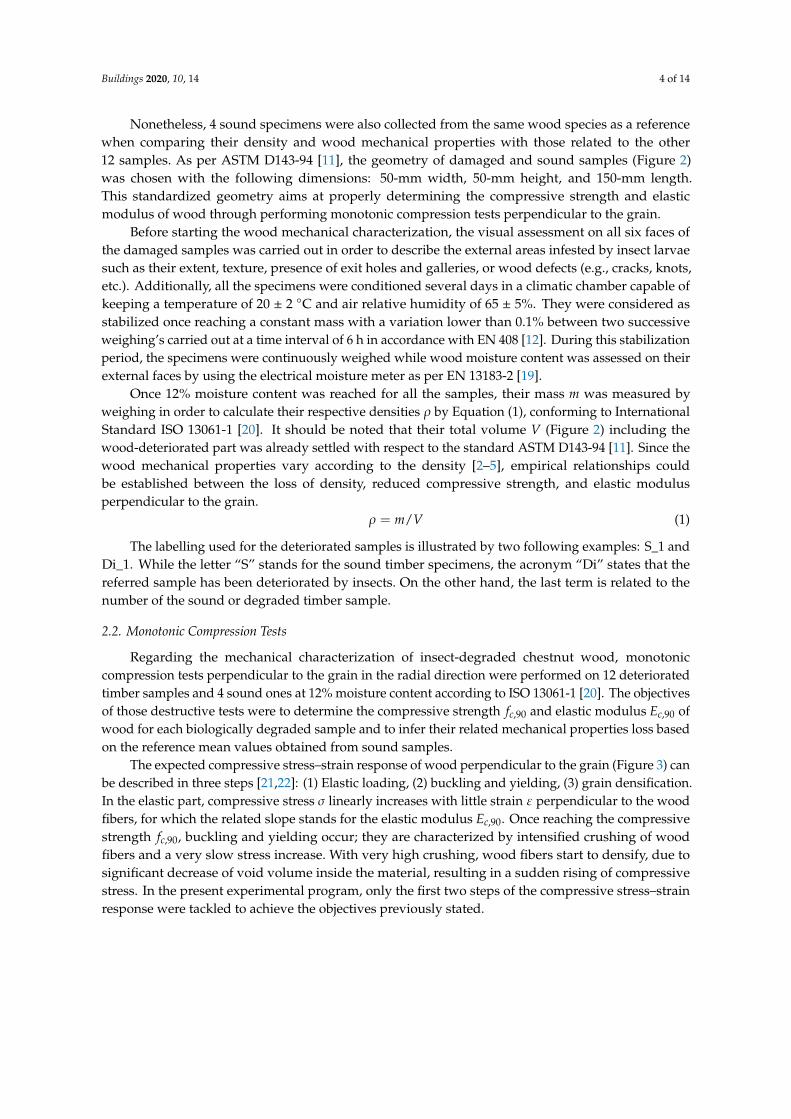
Nonetheless, 4 sound specimens were also collected from the same wood species as a reference when comparing their density and wood mechanical properties with those related to the other 12 samples. As per ASTM D143-94 [11], the geometry of damaged and sound samples (Figure 2) was chosen with the following dimensions: 50-mm width, 50-mm height, and 150-mm length. This standardized geometry aims at properly determining the compressive strength and elastic modulus of wood through performing monotonic compression tests perpendicular to the grain.
Figure 2. Geometry of the small timber samples extracted from existing beams infested by anobiids.
Deteriorated upper face
Figure 2. Geometry of the small timber samples extracted from existing beams infested by anobiids.
Buildings 2020, 10, 14 4 of 14
Nonetheless, 4 sound specimens were also collected from the same wood species as a referencewhen comparing their density and wood mechanical properties with those related to the other12 samples. As per ASTM D143-94 [11], the geometry of damaged and sound samples (Figure 2)was chosen with the following dimensions: 50-mm width, 50-mm height, and 150-mm length.This standardized geometry aims at properly determining the compressive strength and elasticmodulus of wood through performing monotonic compression tests perpendicular to the grain.
Before starting the wood mechanical characterization, the visual assessment on all six faces ofthe damaged samples was carried out in order to describe the external areas infested by insect larvaesuch as their extent, texture, presence of exit holes and galleries, or wood defects (e.g., cracks, knots,etc.). Additionally, all the specimens were conditioned several days in a climatic chamber capable ofkeeping a temperature of 20 ± 2 ◦C and air relative humidity of 65 ± 5%. They were considered asstabilized once reaching a constant mass with a variation lower than 0.1% between two successiveweighing’s carried out at a time interval of 6 h in accordance with EN 408 [12]. During this stabilizationperiod, the specimens were continuously weighed while wood moisture content was assessed on theirexternal faces by using the electrical moisture meter as per EN 13183-2 [19].
Once 12% moisture content was reached for all the samples, their mass m was measured byweighing in order to calculate their respective densities ρ by Equation (1), conforming to InternationalStandard ISO 13061-1 [20]. It should be noted that their total volume V (Figure 2) including thewood-deteriorated part was already settled with respect to the standard ASTM D143-94 [11]. Since thewood mechanical properties vary according to the density [2–5], empirical relationships couldbe established between the loss of density, reduced compressive strength, and elastic modulusperpendicular to the grain.
ρ = m/V (1)
The labelling used for the deteriorated samples is illustrated by two following examples: S_1 andDi_1. While the letter “S” stands for the sound timber specimens, the acronym “Di” states that thereferred sample has been deteriorated by insects. On the other hand, the last term is related to thenumber of the sound or degraded timber sample.
2.2. Monotonic Compression Tests
Regarding the mechanical characterization of insect-degraded chestnut wood, monotoniccompression tests perpendicular to the grain in the radial direction were performed on 12 deterioratedtimber samples and 4 sound ones at 12% moisture content according to ISO 13061-1 [20]. The objectivesof those destructive tests were to determine the compressive strength fc,90 and elastic modulus Ec,90 ofwood for each biologically degraded sample and to infer their related mechanical properties loss basedon the reference mean values obtained from sound samples.
The expected compressive stress–strain response of wood perpendicular to the grain (Figure 3) canbe described in three steps [21,22]: (1) Elastic loading, (2) buckling and yielding, (3) grain densification.In the elastic part, compressive stress σ linearly increases with little strain ε perpendicular to the woodfibers, for which the related slope stands for the elastic modulus Ec,90. Once reaching the compressivestrength fc,90, buckling and yielding occur; they are characterized by intensified crushing of woodfibers and a very slow stress increase. With very high crushing, wood fibers start to densify, due tosignificant decrease of void volume inside the material, resulting in a sudden rising of compressivestress. In the present experimental program, only the first two steps of the compressive stress–strainresponse were tackled to achieve the objectives previously stated.

Buildings 2020, 10, 14 5 of 14Buildings 2020, 10, x FOR PEER REVIEW 5 of 13
Figure 3. Compressive stress–strain curve perpendicular to the grain of wood, including the respective strength 𝑓 , and elastic modulus 𝐸 , . Scheme inspired from [21,22].
(a) (b)
Figure 4. Setup required to apply the monotonic compression load 𝐹 perpendicular to the grain (a). Compressive stress distribution 𝜎 and vertical crushing 𝑤 assumed under the loaded area (b).
2.3. Calculation of the Compressive Strength and Elastic Modulus
From the monotonic compression tests, compressive force-displacement responses were obtained for small timber samples. In accordance with the literature review [9,13], the compressive strength 𝑓 , and elastic modulus 𝐸 , of wood perpendicular to the grain can be determined in the radial direction, through the definition of the maximal compressive force 𝐹 , (Figure 5a) with respect to different national standards (i.e., ASTM D143-94 [11], EN 408 [12], ISO 13910 [23], Standards Australia/New Zealand AS/NZS 3603 [24] and AS/NZS 4063 [25]). Broadly speaking, the maximal compressive force 𝐹 , can be defined based on specific strain values perpendicular to the grain, and in some cases, on the slope of the force-displacement response standing for the elastic modulus 𝐸 , . Nonetheless, the compressive strength values 𝑓 , obtained from those standards can be very different and incompatible. For illustration purposes, 2.5 times higher strength values [6] were obtained for ASTM D143-94 [11] specimens, when comparing with the EN 408 [12] testing
Figure 3. Compressive stress–strain curve perpendicular to the grain of wood, including the respectivestrength fc,90 and elastic modulus Ec,90. Scheme inspired from [21,22].
Conforming with ASTM D143-94 [11], the monotonic compression test consists of applyinga vertical force Fc perpendicular to the grain in the radial direction, transferred from the actuator to thesteel plate, in the middle of the insect-degraded upper face for small timber samples (Figure 4a). In thisregard, the standardized loading velocity 0.01 mm/s was chosen. In order to minimize the distortioneffects and out-of-plane displacements during the tests, a hinge support was settled beforehandbetween the actuator and the loading steel plate. Also, two Linear Variable Differential Transformers(LVDTs) aided by a sketched grid from either lateral faces of the sample were used to measure thevertical crushing w of the loaded area. The latter was delimited by the basis dimensions of the steelplate 50 × 50 mm2 in order to ensure a standardized compressive stress distribution (Figure 4b) underan inclination angle of 45◦ (1:1). Small timber samples tested were simply supported from the bottomside to simulate the reaction of compressive stresses σc over the effective length of 150 mm, which isdetailed further in the next section.
Buildings 2020, 10, x FOR PEER REVIEW 5 of 13
Figure 3. Compressive stress–strain curve perpendicular to the grain of wood, including the respective strength 𝑓 , and elastic modulus 𝐸 , . Scheme inspired from [21,22].
(a) (b)
Figure 4. Setup required to apply the monotonic compression load 𝐹 perpendicular to the grain (a). Compressive stress distribution 𝜎 and vertical crushing 𝑤 assumed under the loaded area (b).
2.3. Calculation of the Compressive Strength and Elastic Modulus
From the monotonic compression tests, compressive force-displacement responses were obtained for small timber samples. In accordance with the literature review [9,13], the compressive strength 𝑓 , and elastic modulus 𝐸 , of wood perpendicular to the grain can be determined in the radial direction, through the definition of the maximal compressive force 𝐹 , (Figure 5a) with respect to different national standards (i.e., ASTM D143-94 [11], EN 408 [12], ISO 13910 [23], Standards Australia/New Zealand AS/NZS 3603 [24] and AS/NZS 4063 [25]). Broadly speaking, the maximal compressive force 𝐹 , can be defined based on specific strain values perpendicular to the grain, and in some cases, on the slope of the force-displacement response standing for the elastic modulus 𝐸 , . Nonetheless, the compressive strength values 𝑓 , obtained from those standards can be very different and incompatible. For illustration purposes, 2.5 times higher strength values [6] were obtained for ASTM D143-94 [11] specimens, when comparing with the EN 408 [12] testing
Figure 4. Setup required to apply the monotonic compression load Fc perpendicular to the grain (a).Compressive stress distribution σc and vertical crushing w assumed under the loaded area (b).
Buildings 2020, 10, 14 6 of 14
2.3. Calculation of the Compressive Strength and Elastic Modulus
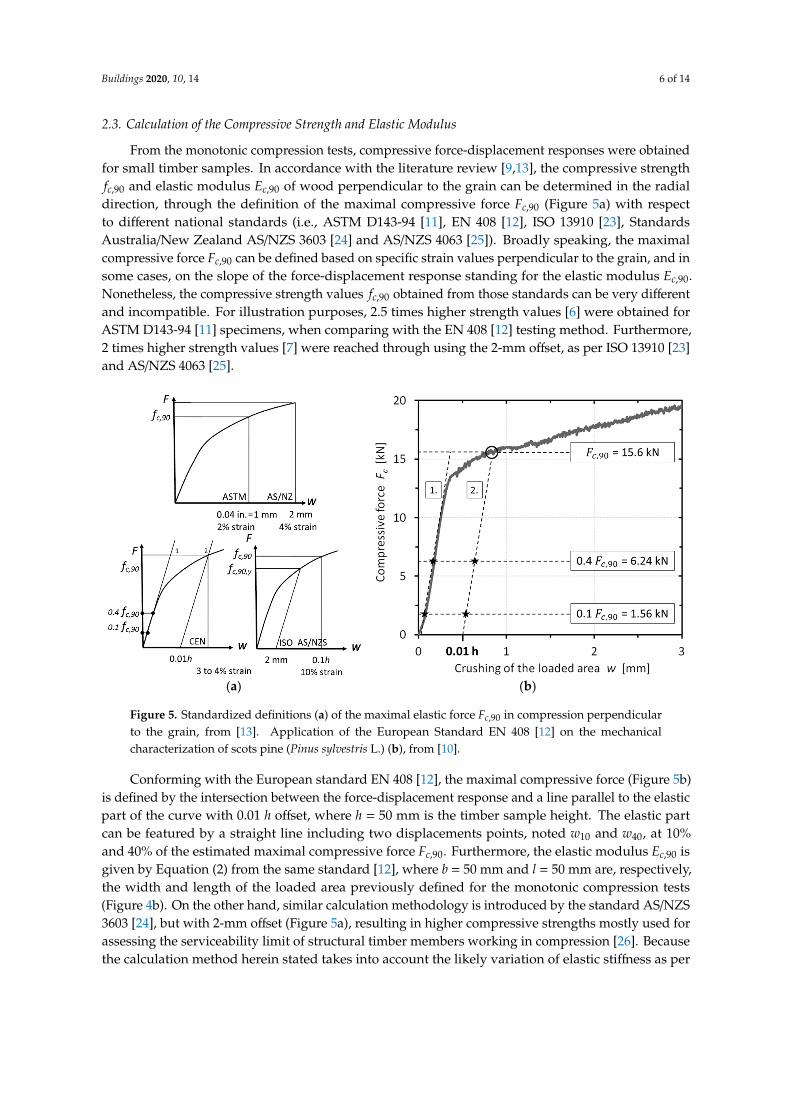
From the monotonic compression tests, compressive force-displacement responses were obtainedfor small timber samples. In accordance with the literature review [9,13], the compressive strengthfc,90 and elastic modulus Ec,90 of wood perpendicular to the grain can be determined in the radialdirection, through the definition of the maximal compressive force Fc,90 (Figure 5a) with respectto different national standards (i.e., ASTM D143-94 [11], EN 408 [12], ISO 13910 [23], StandardsAustralia/New Zealand AS/NZS 3603 [24] and AS/NZS 4063 [25]). Broadly speaking, the maximalcompressive force Fc,90 can be defined based on specific strain values perpendicular to the grain, and insome cases, on the slope of the force-displacement response standing for the elastic modulus Ec,90.Nonetheless, the compressive strength values fc,90 obtained from those standards can be very differentand incompatible. For illustration purposes, 2.5 times higher strength values [6] were obtained forASTM D143-94 [11] specimens, when comparing with the EN 408 [12] testing method. Furthermore,2 times higher strength values [7] were reached through using the 2-mm offset, as per ISO 13910 [23]and AS/NZS 4063 [25].
Buildings 2020, 10, x FOR PEER REVIEW 6 of 13
method. Furthermore, 2 times higher strength values [7] were reached through using the 2-mm offset, as per ISO 13910 [23] and AS/NZS 4063 [25].
Conforming with the European standard EN 408 [12], the maximal compressive force (Figure 5b) is defined by the intersection between the force-displacement response and a line parallel to the elastic part of the curve with 0.01 ℎ offset, where ℎ = 50 mm is the timber sample height. The elastic part can be featured by a straight line including two displacements points, noted 𝑤 and 𝑤 , at 10% and 40% of the estimated maximal compressive force 𝐹 , . Furthermore, the elastic modulus 𝐸 , is given by Equation (2) from the same standard [12], where 𝑏 = 50 mm and 𝑙 = 50 mm are, respectively, the width and length of the loaded area previously defined for the monotonic compression tests (Figure 4b). On the other hand, similar calculation methodology is introduced by the standard AS/NZS 3603 [24], but with 2-mm offset (Figure 5a), resulting in higher compressive strengths mostly used for assessing the serviceability limit of structural timber members working in compression [26]. Because the calculation method herein stated takes into account the likely variation of elastic stiffness as per wood species, the European standard EN 408 [12] was chosen for the mechanical characterization of chestnut wood in the present experimental campaign. 𝐸 , , . . (2) 𝑓 , , , (3)
𝑘 , 𝑘 (4)
(a) (b)
Figure 5. Standardized definitions (a) of the maximal elastic force 𝐹 , in compression perpendicular to the grain, from [13]. Application of the European Standard EN 408 [12] on the mechanical characterization of scots pine (Pinus sylvestris L.) (b), from [10].
In accordance with Eurocode 5 (EN 1995-1-1 [27]), the compressive strength 𝑓 , is calculated by Equation (3), where 𝑘 , is the factor of the compressive stress spreading perpendicular to the grain inside timber. Although 𝑘 , varies according to the load cases and support configurations within the structural member, the minimal and maximal values imposed by the Amendment 1 of Eurocode 5 (EN 1995-1-1/A1 [28]) are 1 and 1.75, respectively. From reliable analytical models on the compressive stress spreading perpendicular to the grain [14], this factor can be estimated by Equation (4), where 𝑘 = 1.1 is an experimental calibration factor and 𝑙 is the effective length of compressive stress spreading inside timber (Figure 6). The onset of wood fibers crushing was assumed in the present work for small deformations of 3–5%, leading to compressive stress dispersion at an
Figure 5. Standardized definitions (a) of the maximal elastic force Fc,90 in compression perpendicularto the grain, from [13]. Application of the European Standard EN 408 [12] on the mechanicalcharacterization of scots pine (Pinus sylvestris L.) (b), from [10].
Conforming with the European standard EN 408 [12], the maximal compressive force (Figure 5b)is defined by the intersection between the force-displacement response and a line parallel to the elasticpart of the curve with 0.01 h offset, where h = 50 mm is the timber sample height. The elastic partcan be featured by a straight line including two displacements points, noted w10 and w40, at 10%and 40% of the estimated maximal compressive force Fc,90. Furthermore, the elastic modulus Ec,90 isgiven by Equation (2) from the same standard [12], where b = 50 mm and l = 50 mm are, respectively,the width and length of the loaded area previously defined for the monotonic compression tests(Figure 4b). On the other hand, similar calculation methodology is introduced by the standard AS/NZS3603 [24], but with 2-mm offset (Figure 5a), resulting in higher compressive strengths mostly used forassessing the serviceability limit of structural timber members working in compression [26]. Becausethe calculation method herein stated takes into account the likely variation of elastic stiffness as per

Buildings 2020, 10, 14 7 of 14
wood species, the European standard EN 408 [12] was chosen for the mechanical characterization ofchestnut wood in the present experimental campaign.
Ec,90 =h× Fc,90 × (0.4− 0.1)
b× l× (w40 −w10)(2)
fc,90 =Fc,90
b× l× kc,90(3)
kc,90 = k×
√le f f
l(4)
In accordance with Eurocode 5 (EN 1995-1-1 [27]), the compressive strength fc,90 is calculated byEquation (3), where kc,90 is the factor of the compressive stress spreading perpendicular to the graininside timber. Although kc,90 varies according to the load cases and support configurations within thestructural member, the minimal and maximal values imposed by the Amendment 1 of Eurocode 5(EN 1995-1-1/A1 [28]) are 1 and 1.75, respectively. From reliable analytical models on the compressivestress spreading perpendicular to the grain [14], this factor can be estimated by Equation (4), wherek = 1.1 is an experimental calibration factor and le f f is the effective length of compressive stressspreading inside timber (Figure 6). The onset of wood fibers crushing was assumed in the presentwork for small deformations of 3–5%, leading to compressive stress dispersion at an inclination angleof 45◦ (1:1) under the loaded area. Nonetheless, high deformations of 10% should be considered whenassessing the serviceability limit, with a slope of 34◦ (1.5:1) for the compressive stress spreading [13,14].
Buildings 2020, 10, x FOR PEER REVIEW 7 of 13
inclination angle of 45° (1:1) under the loaded area. Nonetheless, high deformations of 10% should be considered when assessing the serviceability limit, with a slope of 34° (1.5:1) for the compressive stress spreading [13,14].
(a) (b)
Figure 6. Theoretical compressive stress 𝜎 perpendicular to the grain in the radial direction spreading over the effective length 𝑙 on the lateral face (a), and over the width 𝑏 on the transversal face (b), for a determined height ℎ of the timber sample. Schemes inspired from [9].
3. Results
From the experimental methodology previously described, the mechanical characterization of wood chestnut deteriorated by anobiids in compression perpendicular to the grain was assessed. The experimental outcomes were obtained in three key points: (1) Wood density and visual assessment, (2) compressive force-displacement response, (3) compressive strength and elastic modulus. Lastly, correlations were established and then discussed between the loss of mechanical properties investigated and the wood density loss for the tested samples.
3.1. Wood Density and Visual Assessment
Table 1 gives the values of the wood density 𝜌 and the related property loss 𝜌 for all damaged samples investigated in the first step of the experimental program, namely the wood density and visual assessment. The density loss 𝜌 (%) was calculated by the Equation (5), with the mean value of wood density 𝜌 , = 650 kg/m3 from the four sound samples. The latter property met the range of mean values between 540 and 650 kg/m3, provided by the European standards (EN 1912 [3], EN 338 [4], and EN 350 [29]). Low values of density loss were recorded between 2.44% and 14.69%. 𝜌 = 100 1 𝜌 𝜌 ,⁄ (5)
As a first characterization approach, a visual assessment was made on the upper face (E) and the cross-sections (C–D) for 12 biologically degraded timber samples (Figure 7a,b), in order to complete the experimental outcomes obtained from monotonic compression tests. To this end, two physical aspects of deteriorated wood were tackled: (1) Touch surface and (2) texture. In Table 1, some relationships might be established between the density loss 𝜌 and the qualitative parameters previously stated. For instance, hard surface (HS) in respect with the upper face (E) could be related to timber samples with 𝜌 8.76%, whereas soft surface (SS) and friable texture (FT) were mostly observed for the other ones.
In addition to physical aspects, two categories of damage features were defined for the visual assessment: (1) Wood defects (e.g., knots, grain deflection, drying cracks, etc.) and (2) insect wood deterioration. Regarding the first category of damage features, only the sample Di_12 (Table 1) presented significant wood defect, namely a drying crack spreading over the whole length perpendicular to the tangential direction. For all the biologically degraded samples, galleries and emergency holes bored by anobiids with 1–2 mm diameter (Figure 7a,b) were reported on the upper
𝜎 𝜎
Figure 6. Theoretical compressive stress σc perpendicular to the grain in the radial direction spreadingover the effective length le f f on the lateral face (a), and over the width b on the transversal face (b),for a determined height h of the timber sample. Schemes inspired from [9].
3. Results
From the experimental methodology previously described, the mechanical characterization ofwood chestnut deteriorated by anobiids in compression perpendicular to the grain was assessed.The experimental outcomes were obtained in three key points: (1) Wood density and visual assessment,(2) compressive force-displacement response, (3) compressive strength and elastic modulus. Lastly,correlations were established and then discussed between the loss of mechanical properties investigatedand the wood density loss for the tested samples.
3.1. Wood Density and Visual Assessment
Table 1 gives the values of the wood density ρ and the related property loss ρL for all damagedsamples investigated in the first step of the experimental program, namely the wood density and
Buildings 2020, 10, 14 8 of 14
visual assessment. The density loss ρL (%) was calculated by the Equation (5), with the mean value ofwood density ρs,m = 650 kg/m3 from the four sound samples. The latter property met the range ofmean values between 540 and 650 kg/m3, provided by the European standards (EN 1912 [3], EN 338 [4],and EN 350 [29]). Low values of density loss were recorded between 2.44% and 14.69%.
ρL = 100× (1− ρ/ρs,m) (5)
Table 1. Density loss as per physical aspects and damage features of anobiid-deteriorated wood.
Specimen Labelling ρ 1 (kg/m3) ρL1 (%) dDi
1 (mm)Visual Observations on the
Upper Face and Cross-Section 1
Di_1 610.40 6.09 10.00 HSDi_2 624.72 3.89 10.00 HSDi_3 601.41 7.48 6.50 HSDi_4 593.04 8.76 10.00 HSDi_5 600.83 7.56 9.50 HSDi_6 562.99 13.39 9.50 SS; FTDi_7 570.83 12.18 11.50 SS; FTDi_8 626.93 3.55 2.50 HSDi_9 582.96 10.31 6.00 SS; FTDi_10 631.87 2.79 8.50 SS; FTDi_11 634.11 2.44 11.00 HSDi_12 554.51 14.69 11.50 SS; FT; DC
1 Legend: ρ, wood density; ρL, wood density loss; dDi, depth of insect wood deterioration; HS, hard surface;SS, soft surface; FT, friable texture; DC, drying crack.
As a first characterization approach, a visual assessment was made on the upper face (E) and thecross-sections (C–D) for 12 biologically degraded timber samples (Figure 7a,b), in order to complete theexperimental outcomes obtained from monotonic compression tests. To this end, two physical aspectsof deteriorated wood were tackled: (1) Touch surface and (2) texture. In Table 1, some relationshipsmight be established between the density loss ρL and the qualitative parameters previously stated.For instance, hard surface (HS) in respect with the upper face (E) could be related to timber sampleswith ρL ≤ 8.76%, whereas soft surface (SS) and friable texture (FT) were mostly observed for theother ones.
Buildings 2020, 10, x FOR PEER REVIEW 8 of 13
face (E) and cross-sections (C–D). Concomitantly, the depth of insect wood deterioration 𝑑 in the cross-section (Figure 7b) was defined for the second category of damage features.
Since anobiid larvae mostly infest the sapwood, the quantitative parameter 𝑑 can be considered as the sapwood depth within the cross-section of timber samples studied. Low values between 2.5 and 11.5 mm were thus recorded for the depth of insect wood deterioration 𝑑 . It should be kept in mind that this parameter and the sapwood amount may significantly vary as per the targeted area within the cross-section of tree logs when cutting beams and then extracting small samples required for the wood mechanical characterization.
Due to the almost random diffusion of anobiid deterioration along the grain in the sapwood, strong correlations are still very challenging to establish between the qualitative parameters from the visual assessment, the depth of insect wood deterioration 𝑑 , the density loss 𝜌 , and, thus, the wood mechanical properties in compression perpendicular to the grain.
(a) (b)
Figure 7. Upper face (a) and cross-section (b) of the insect deteriorated sample Di_1.
Table 1. Density loss as per physical aspects and damage features of anobiid-deteriorated wood.
Specimen Labelling 𝝆 1 (kg/m3) 𝝆𝑳 1 (%) 𝒅𝑫𝒊 1 (mm) Visual Observations on the Upper Face and
Cross-Section 1 Di_1 610.40 6.09 10.00 HS Di_2 624.72 3.89 10.00 HS Di_3 601.41 7.48 6.50 HS Di_4 593.04 8.76 10.00 HS Di_5 600.83 7.56 9.50 HS Di_6 562.99 13.39 9.50 SS; FT Di_7 570.83 12.18 11.50 SS; FT Di_8 626.93 3.55 2.50 HS Di_9 582.96 10.31 6.00 SS; FT
Di_10 631.87 2.79 8.50 SS; FT Di_11 634.11 2.44 11.00 HS Di_12 554.51 14.69 11.50 SS; FT; DC
1 Legend: 𝜌, wood density; 𝜌 , wood density loss; 𝑑 , depth of insect wood deterioration; HS, hard surface; SS, soft surface; FT, friable texture; DC, drying crack.
3.2. Compressive Force-Displacement Response
In the second step of the present experimental program, monotonic compression tests were performed on small timber samples perpendicular to the grain. As a result, several force-displacement responses were pulled out by focusing more on the “elastic loading” part and the early stage of the “buckling and yielding” process (Figure 3). The experimental outcomes obtained from 4 sound (S) and 12 deteriorated (Di) timber specimens were plotted on a same graph (Figure 8) through
Bored galleries (1-2 mm diameter)
Exit holes (1–2 mm diameter) 𝒅𝑫𝒊
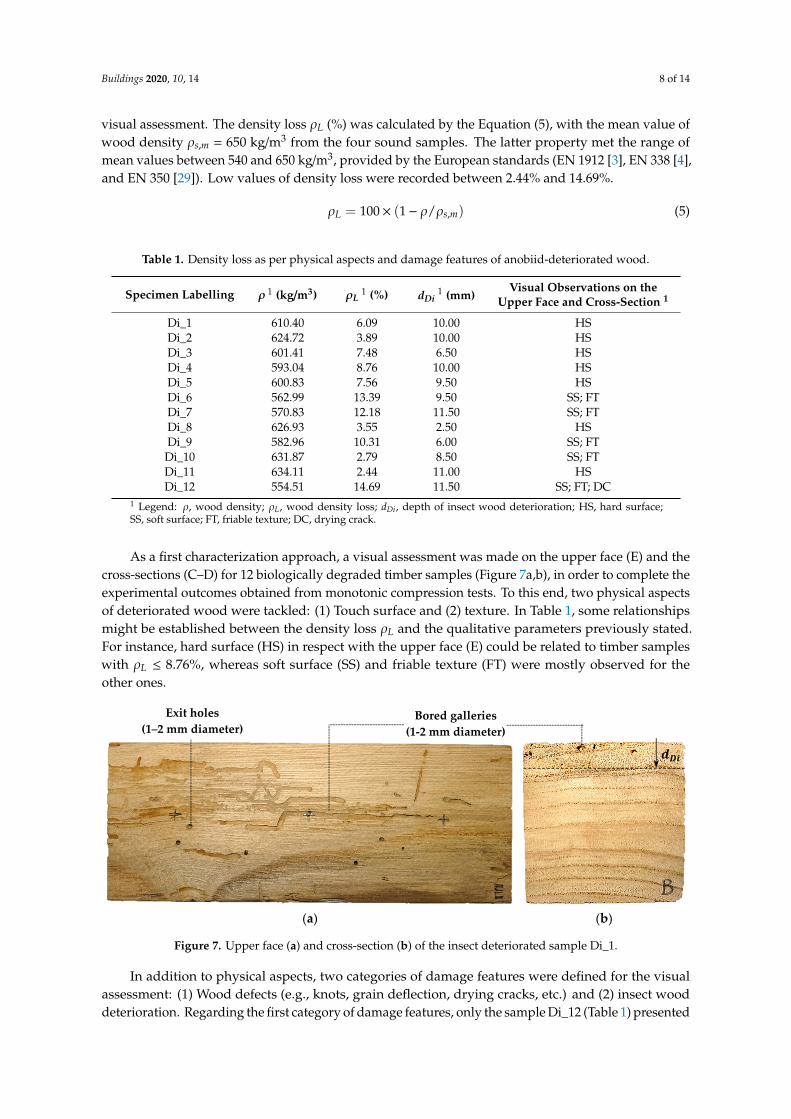
Figure 7. Upper face (a) and cross-section (b) of the insect deteriorated sample Di_1.
In addition to physical aspects, two categories of damage features were defined for the visualassessment: (1) Wood defects (e.g., knots, grain deflection, drying cracks, etc.) and (2) insect wooddeterioration. Regarding the first category of damage features, only the sample Di_12 (Table 1) presented
Buildings 2020, 10, 14 9 of 14
significant wood defect, namely a drying crack spreading over the whole length perpendicular to thetangential direction. For all the biologically degraded samples, galleries and emergency holes bored byanobiids with 1–2 mm diameter (Figure 7a,b) were reported on the upper face (E) and cross-sections(C–D). Concomitantly, the depth of insect wood deterioration dDi in the cross-section (Figure 7b) wasdefined for the second category of damage features.
Since anobiid larvae mostly infest the sapwood, the quantitative parameter dDi can be consideredas the sapwood depth within the cross-section of timber samples studied. Low values between 2.5 and11.5 mm were thus recorded for the depth of insect wood deterioration dDi. It should be kept in mindthat this parameter and the sapwood amount may significantly vary as per the targeted area within thecross-section of tree logs when cutting beams and then extracting small samples required for the woodmechanical characterization.
Due to the almost random diffusion of anobiid deterioration along the grain in the sapwood,strong correlations are still very challenging to establish between the qualitative parameters from thevisual assessment, the depth of insect wood deterioration dDi, the density loss ρL, and, thus, the woodmechanical properties in compression perpendicular to the grain.
3.2. Compressive Force-Displacement Response
In the second step of the present experimental program, monotonic compression tests wereperformed on small timber samples perpendicular to the grain. As a result, several force-displacementresponses were pulled out by focusing more on the “elastic loading” part and the early stage of the“buckling and yielding” process (Figure 3). The experimental outcomes obtained from 4 sound (S)and 12 deteriorated (Di) timber specimens were plotted on a same graph (Figure 8) through couplingthe compressive force Fc perpendicular to the grain with the crushing of the loaded area w in theradial direction.
Buildings 2020, 10, x FOR PEER REVIEW 9 of 13
coupling the compressive force 𝐹 perpendicular to the grain with the crushing of the loaded area 𝑤 in the radial direction.
Regarding the 4 sound samples, the pattern of the compressive force-displacement responses (Figure 8) matches very well with the theoretical one (Figure 3), and with the experimental one (Figure 5b) obtained from sound samples made of P. sylvestris [10]. Indeed, the respective patterns related to both elastic and yielding steps can easily be simplified by drawing up two straight lines whose slopes represent the wood stiffness. It should be noted that the stiffness related to the fiber yielding is much lower than the elastic one, resulting in significant crushing perpendicular to the grain, while the compressive forces keep rising. The vertical crushing 𝑤 was mainly concentrated under the loaded area over 10-mm depth on average (Figure 9a), although it might still spread with lower deformation up to 30-mm depth due to the significant stiffness of sound timber samples. After ending the tests, 1–2-mm depth of timber embedment was observed on the upper face of the specimens at the former location of the loading steel plates.
For the 12 deteriorated samples, the compressive force-displacement responses perpendicular to the grain (Figure 8) increasingly fell down as the degradation level went up. As a matter of fact, both maximal elastic force and stiffness, which constitute the “elastic loading” part, were progressively reduced when the wood density loss was constantly rising. Thereby, an insect wood deterioration classification could be established in the future by correlating the loss of both maximal elastic force and stiffness with the density loss, based on a larger amount of anobiid-infested timber samples to test. On the other hand, the stiffness related to the “buckling and yielding” part slightly increased in comparison with those from sound samples. This phenomenon was due to the early grain densification inside the wood deteriorated layer under the compressive loading area [21,22]. Standing out among the others, the tested samples Di_6 and Di_12 presented flattened compressive force-displacement curves with maximal elastic force and stiffness both insignificant. This was a sign of high deterioration level. The whole vertical crushing 𝑤 was concentrated under the loaded area over 10–15-mm depth on average (Figure 9b), due to the reduced stiffness of degraded timber samples. After ending the tests, 3–4-mm depth of timber embedment was observed on the upper face of the specimens at the former location of the loading steel plates.
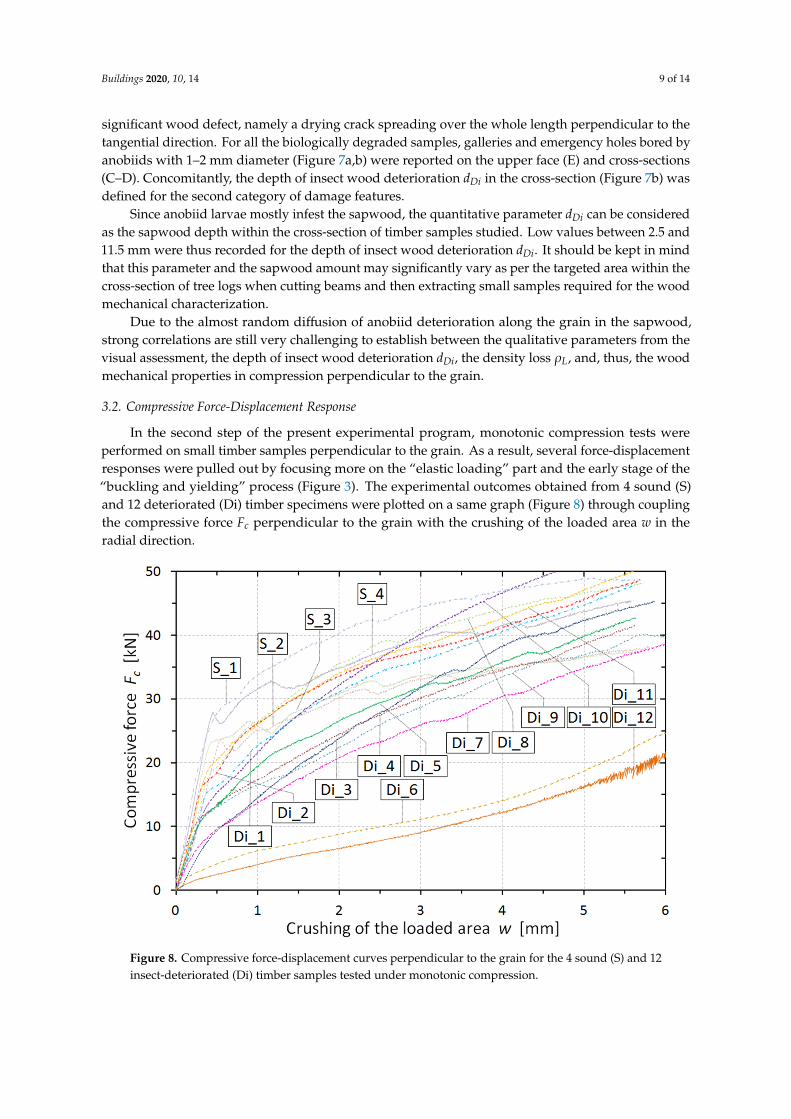
Figure 8. Compressive force-displacement curves perpendicular to the grain for the 4 sound (S) and 12 insect-deteriorated (Di) timber samples tested under monotonic compression. Figure 8. Compressive force-displacement curves perpendicular to the grain for the 4 sound (S) and 12insect-deteriorated (Di) timber samples tested under monotonic compression.

Buildings 2020, 10, 14 10 of 14
Regarding the 4 sound samples, the pattern of the compressive force-displacement responses(Figure 8) matches very well with the theoretical one (Figure 3), and with the experimental one(Figure 5b) obtained from sound samples made of P. sylvestris [10]. Indeed, the respective patternsrelated to both elastic and yielding steps can easily be simplified by drawing up two straight lineswhose slopes represent the wood stiffness. It should be noted that the stiffness related to the fiberyielding is much lower than the elastic one, resulting in significant crushing perpendicular to the grain,while the compressive forces keep rising. The vertical crushing w was mainly concentrated underthe loaded area over 10-mm depth on average (Figure 9a), although it might still spread with lowerdeformation up to 30-mm depth due to the significant stiffness of sound timber samples. After endingthe tests, 1–2-mm depth of timber embedment was observed on the upper face of the specimens at theformer location of the loading steel plates.Buildings 2020, 10, x FOR PEER REVIEW 10 of 13
(a) (b)
Figure 9. Crushing 𝑤 perpendicular to the grain under the loaded area obtained after the tests for the sound (a) and insect-deteriorated (b) timber samples. Meshing dimensions of 5 × 5 mm.
3.3. Compressive Strength and Elastic Modulus
Based on the force-displacement responses (Figure 8) and their maximal elastic force 𝐹 , in compression inferred in accordance with EN 408 [12], the compressive strength 𝑓 , and elastic modulus 𝐸 , perpendicular to the grain in the radial direction were determined by Equations (2)–(4) for all anobiid-infested timber samples tested. Additionally, loss of compressive strength and elastic modulus, noted 𝑓 , , and 𝐸 , , (%), were calculated by both Equations (6) and (7), respectively, with the mean values of compressive strength 𝑓 , , , = 6.11 MPa and elastic modulus 𝐸 , , , = 1132.85 MPa from the 4 sound specimens tested. The values of all the parameters stated above are given in Table 2. The mechanical properties in compression perpendicular to the grain for sound sweet chestnut wood could be associated to the strength class D30 as per standards [3,4]. 𝑓 , , = 100 1 𝑓 , 𝑓 , , ,⁄ (6) 𝐸 , , = 100 1 𝐸 , 𝐸 , , ,⁄ (7)
Table 2. Compressive strengths, elastic modulus, and properties loss for deteriorated timber samples.
Specimen Labelling
𝑭𝒄,𝟗𝟎 2
(kN) 𝒇𝒄,𝟗𝟎 2
(MPa) 𝒇𝒄,𝟗𝟎,𝑳 2
(%) 𝑬𝒄,𝟗𝟎 2
(MPa) 𝑬𝒄,𝟗𝟎,𝑳 2
(%) Di_1 22.79 4.78 21.80 822.25 27.42 Di_2 25.60 5.37 12.15 1123.63 0.81 Di_3 15.53 3.26 46.67 517.95 54.28 Di_4 16.33 3.43 43.89 854.97 24.53 Di_5 19.40 4.07 33.42 746.15 34.14 Di_6 6.19 1.38 77.42 198.29 82.50 Di_7 14.21 2.98 51.25 502.42 55.65 Di_8 27.11 5.69 6.91 896.2 20.89 Di_9 16.57 3.48 43.07 758.35 33.06
Di_10 22.59 4.74 22.45 800.59 29.33 Di_11 26.02 5.46 10.67 925.95 18.26 Di_12 5.07 1.06 82.66 150.22 86.74
2 Legend: 𝐹 , , maximal elastic compressive force; 𝑓 , , compressive strength; 𝑓 , , , compressive strength loss; 𝐸 , , compressive elastic modulus; 𝐸 , , , compressive elastic modulus loss.
The respective values given in Tables 1 and 2 show that the loss of compressive strength 𝑓 , , and elastic modulus 𝐸 , , perpendicular to the grain tended to linearly increase with the wood density loss 𝜌 as per different damage levels. For density loss varying from 2.44% to 14.69%, ranges of values were recorded as 6.91–82.66% for the loss of compressive strength, and 0.81–86.74% for the loss of elastic modulus. On average, over 12 degraded timber samples tested, 𝑓 , , = 37.70% and 𝐸 , , = 38.97% were obtained for mean density loss of 𝜌 = 7.76%.
Figure 9. Crushing w perpendicular to the grain under the loaded area obtained after the tests for thesound (a) and insect-deteriorated (b) timber samples. Meshing dimensions of 5 × 5 mm.
For the 12 deteriorated samples, the compressive force-displacement responses perpendicularto the grain (Figure 8) increasingly fell down as the degradation level went up. As a matter of fact,both maximal elastic force and stiffness, which constitute the “elastic loading” part, were progressivelyreduced when the wood density loss was constantly rising. Thereby, an insect wood deteriorationclassification could be established in the future by correlating the loss of both maximal elastic forceand stiffness with the density loss, based on a larger amount of anobiid-infested timber samples totest. On the other hand, the stiffness related to the “buckling and yielding” part slightly increased incomparison with those from sound samples. This phenomenon was due to the early grain densificationinside the wood deteriorated layer under the compressive loading area [21,22]. Standing out amongthe others, the tested samples Di_6 and Di_12 presented flattened compressive force-displacementcurves with maximal elastic force and stiffness both insignificant. This was a sign of high deteriorationlevel. The whole vertical crushing w was concentrated under the loaded area over 10–15-mm depth onaverage (Figure 9b), due to the reduced stiffness of degraded timber samples. After ending the tests,3–4-mm depth of timber embedment was observed on the upper face of the specimens at the formerlocation of the loading steel plates.
3.3. Compressive Strength and Elastic Modulus
Based on the force-displacement responses (Figure 8) and their maximal elastic force Fc,90 incompression inferred in accordance with EN 408 [12], the compressive strength fc,90 and elastic modulusEc,90 perpendicular to the grain in the radial direction were determined by Equations (2)–(4) for allanobiid-infested timber samples tested. Additionally, loss of compressive strength and elastic modulus,noted fc,90,L and Ec,90,L (%), were calculated by both Equations (6) and (7), respectively, with the meanvalues of compressive strength fc,90,s,m = 6.11 MPa and elastic modulus Ec,90,s,m = 1132.85 MPa fromthe 4 sound specimens tested. The values of all the parameters stated above are given in Table 2.

Buildings 2020, 10, 14 11 of 14
The mechanical properties in compression perpendicular to the grain for sound sweet chestnut woodcould be associated to the strength class D30 as per standards [3,4].
fc,90,L = 100× (1− fc,90/ fc,90,s,m) (6)
Ec,90,L = 100× (1− Ec,90/Ec,90,s,m) (7)
Table 2. Compressive strengths, elastic modulus, and properties loss for deteriorated timber samples.
Specimen Labelling Fc,902 (kN) fc,90
2 (MPa) fc,90,L2 (%) Ec,90
2 (MPa) Ec,90,L2 (%)
Di_1 22.79 4.78 21.80 822.25 27.42Di_2 25.60 5.37 12.15 1123.63 0.81Di_3 15.53 3.26 46.67 517.95 54.28Di_4 16.33 3.43 43.89 854.97 24.53Di_5 19.40 4.07 33.42 746.15 34.14Di_6 6.19 1.38 77.42 198.29 82.50Di_7 14.21 2.98 51.25 502.42 55.65Di_8 27.11 5.69 6.91 896.2 20.89Di_9 16.57 3.48 43.07 758.35 33.06
Di_10 22.59 4.74 22.45 800.59 29.33Di_11 26.02 5.46 10.67 925.95 18.26Di_12 5.07 1.06 82.66 150.22 86.74
2 Legend: Fc,90, maximal elastic compressive force; fc,90, compressive strength; fc,90,L, compressive strength loss;Ec,90, compressive elastic modulus; Ec,90,L, compressive elastic modulus loss.
The respective values given in Tables 1 and 2 show that the loss of compressive strength fc,90,L andelastic modulus Ec,90,L perpendicular to the grain tended to linearly increase with the wood density lossρL as per different damage levels. For density loss varying from 2.44% to 14.69%, ranges of values wererecorded as 6.91–82.66% for the loss of compressive strength, and 0.81–86.74% for the loss of elasticmodulus. On average, over 12 degraded timber samples tested, fc,90,L = 37.70% and Ec,90,L = 38.97%were obtained for mean density loss of ρL = 7.76%.
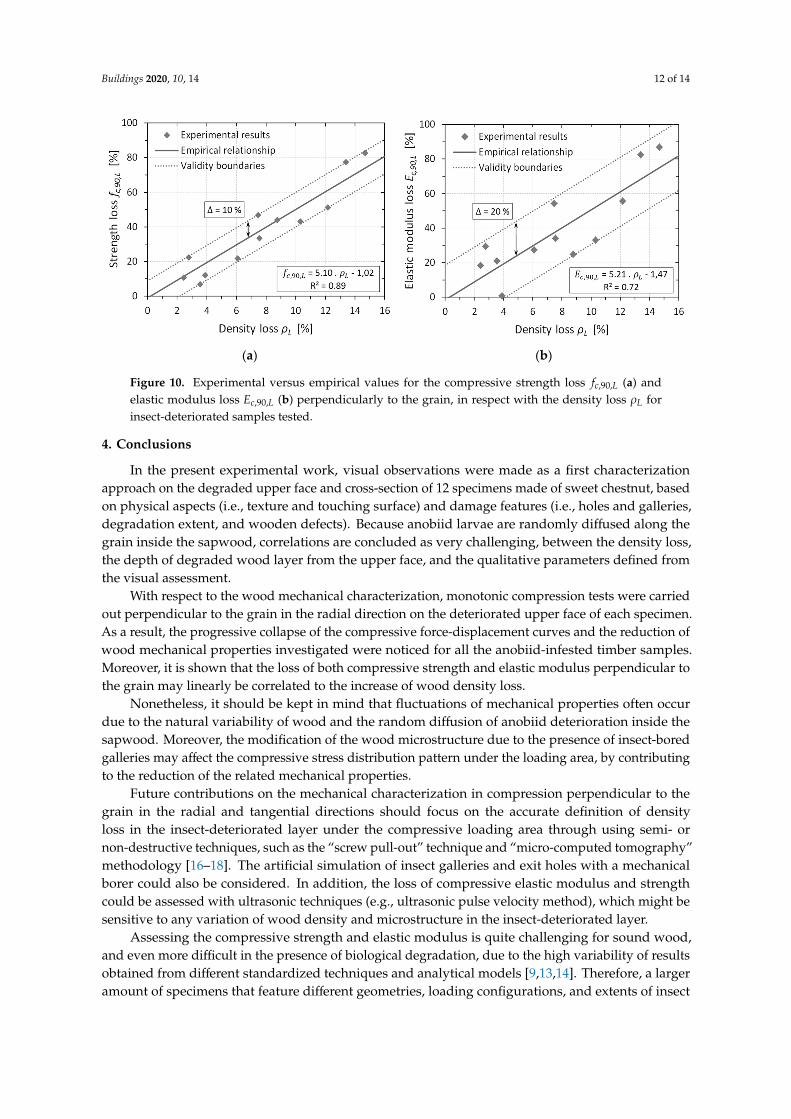
The loss of compressive strength fc,90,L and elastic modulus Ec,90,L assessed from 12 deterioratedtimber samples were plotted on two graphs in respect with the density loss ρL (Figure 10). The linearregression method was used to establish strong empirical correlations between those stated parameters.Regarding the compressive strength loss, the experimental dots detailed on the first graph (Figure 10a)are quite condensed around the linear regression (R2 = 0.89, ∆ = ±10%) expressed in Equation (8),whereas those plotted on the second graph (Figure 10b) are more diffused (R2 = 0.72, ∆ = ±20%)in comparison with the related empirical Equation (9) for the elastic modulus loss. Such differentfluctuations might come from the natural variability of wood mechanical properties, the short numberof specimens tested, and the random diffusion of anobiid deterioration under the compressiveloading area.
fc,90,L = 5.10× ρL − 1.02 (±10%) (8)
Ec,90,L = 5.21× ρL − 1.47 (±20%) (9)
Buildings 2020, 10, 14 12 of 14
Buildings 2020, 10, x FOR PEER REVIEW 11 of 13
The loss of compressive strength 𝑓 , , and elastic modulus 𝐸 , , assessed from 12 deteriorated timber samples were plotted on two graphs in respect with the density loss 𝜌 (Figure 10). The linear regression method was used to establish strong empirical correlations between those stated parameters. Regarding the compressive strength loss, the experimental dots detailed on the first graph (Figure 10a) are quite condensed around the linear regression (R2 = 0.89, ∆ = ±10%) expressed in Equation (8), whereas those plotted on the second graph (Figure 10b) are more diffused (R2 = 0.72, ∆ = ±20%) in comparison with the related empirical Equation (9) for the elastic modulus loss. Such different fluctuations might come from the natural variability of wood mechanical properties, the short number of specimens tested, and the random diffusion of anobiid deterioration under the compressive loading area. 𝑓 , , = 5.10 𝜌 1.02 ±10% (8) 𝐸 , , = 5.21 𝜌 1.47 ±20% (9)
(a) (b)
Figure 10. Experimental versus empirical values for the compressive strength loss 𝑓 , , (a) and elastic modulus loss 𝐸 , , (b) perpendicularly to the grain, in respect with the density loss 𝜌 for insect-deteriorated samples tested.
4. Conclusions
In the present experimental work, visual observations were made as a first characterization approach on the degraded upper face and cross-section of 12 specimens made of sweet chestnut, based on physical aspects (i.e., texture and touching surface) and damage features (i.e., holes and galleries, degradation extent, and wooden defects). Because anobiid larvae are randomly diffused along the grain inside the sapwood, correlations are concluded as very challenging, between the density loss, the depth of degraded wood layer from the upper face, and the qualitative parameters defined from the visual assessment.
With respect to the wood mechanical characterization, monotonic compression tests were carried out perpendicular to the grain in the radial direction on the deteriorated upper face of each specimen. As a result, the progressive collapse of the compressive force-displacement curves and the reduction of wood mechanical properties investigated were noticed for all the anobiid-infested timber samples. Moreover, it is shown that the loss of both compressive strength and elastic modulus perpendicular to the grain may linearly be correlated to the increase of wood density loss.
Nonetheless, it should be kept in mind that fluctuations of mechanical properties often occur due to the natural variability of wood and the random diffusion of anobiid deterioration inside the sapwood. Moreover, the modification of the wood microstructure due to the presence of insect-bored galleries may affect the compressive stress distribution pattern under the loading area, by contributing to the reduction of the related mechanical properties.
Figure 10. Experimental versus empirical values for the compressive strength loss fc,90,L (a) andelastic modulus loss Ec,90,L (b) perpendicularly to the grain, in respect with the density loss ρL forinsect-deteriorated samples tested.
4. Conclusions
In the present experimental work, visual observations were made as a first characterizationapproach on the degraded upper face and cross-section of 12 specimens made of sweet chestnut, basedon physical aspects (i.e., texture and touching surface) and damage features (i.e., holes and galleries,degradation extent, and wooden defects). Because anobiid larvae are randomly diffused along thegrain inside the sapwood, correlations are concluded as very challenging, between the density loss,the depth of degraded wood layer from the upper face, and the qualitative parameters defined fromthe visual assessment.
With respect to the wood mechanical characterization, monotonic compression tests were carriedout perpendicular to the grain in the radial direction on the deteriorated upper face of each specimen.As a result, the progressive collapse of the compressive force-displacement curves and the reduction ofwood mechanical properties investigated were noticed for all the anobiid-infested timber samples.Moreover, it is shown that the loss of both compressive strength and elastic modulus perpendicular tothe grain may linearly be correlated to the increase of wood density loss.
Nonetheless, it should be kept in mind that fluctuations of mechanical properties often occurdue to the natural variability of wood and the random diffusion of anobiid deterioration inside thesapwood. Moreover, the modification of the wood microstructure due to the presence of insect-boredgalleries may affect the compressive stress distribution pattern under the loading area, by contributingto the reduction of the related mechanical properties.
Future contributions on the mechanical characterization in compression perpendicular to thegrain in the radial and tangential directions should focus on the accurate definition of densityloss in the insect-deteriorated layer under the compressive loading area through using semi- ornon-destructive techniques, such as the “screw pull-out” technique and “micro-computed tomography”methodology [16–18]. The artificial simulation of insect galleries and exit holes with a mechanicalborer could also be considered. In addition, the loss of compressive elastic modulus and strengthcould be assessed with ultrasonic techniques (e.g., ultrasonic pulse velocity method), which might besensitive to any variation of wood density and microstructure in the insect-deteriorated layer.
Assessing the compressive strength and elastic modulus is quite challenging for sound wood,and even more difficult in the presence of biological degradation, due to the high variability of resultsobtained from different standardized techniques and analytical models [9,13,14]. Therefore, a largeramount of specimens that feature different geometries, loading configurations, and extents of insect

Buildings 2020, 10, 14 13 of 14
wood deterioration, should be provided in the future for the monotonic compression tests in the radialand tangential directions.
Only thereafter should strong experimental and empirical models be established to predict thereduction of both mechanical properties investigated in the present study, with respect to the residualwood density. Lastly, it could be interesting to carry out similar research on different wood speciesand wood-destroying insect species in order to have at disposal a larger dataset when checking thereliability of those models.
Author Contributions: Conceptualization, M.V., J.M.B., and L.N.; methodology, M.V., J.M.B., and L.N.; software,not applicable; validation, M.V., J.M.B., and L.N.; formal analysis, M.V.; investigation, M.V.; resources, J.M.B.;data curation, M.V.; writing, original draft preparation, M.V.; writing, review and editing, M.V., J.M.B., and L.N.;visualization, M.V.; supervision, J.M.B. and L.N.; project administration, J.M.B. and L.N.; funding acquisition,J.M.B. and L.N. All authors have read and agreed to the published version of the manuscript.
Funding: This work was financed by the European Regional Development Fund (FEDER) through theCompetitively Factors Operational Programme (COMPETE) and by national funds through the Foundation forScience and Technology (FCT) within the scope of research projects INVISIBLE WOODS PTDC/EPH-PAT/2401/2014and PROTIMBER PTDC/ECM-EST/1072/2014, respectively, and the PhD Scholarships SFRH/BD/128580/2017.
Conflicts of Interest: The authors declare no conflict of interest.
References
1. Verbist, M.; Nunes, L.; Jones, D.; Branco, J.M. Chapter 11: Service life design of timber structures. In Long-TermPerformance and Durability of Masonry Structures—Degradation Mechanisms, Health Monitoring and ServiceLife Design—Part III: Long-Term Performance and Service Life Design, 1st ed.; Ghiassi, B., Lourenço, P.B., Eds.;Woodhead Publishing: Sawston/Cambridge, UK, 2018; pp. 311–336. [CrossRef]
2. Dinwoodie, J.M. Wood—Nature’s cellular, polymeric fibre-composite. In The Institute of Metals; Book 420;Maney Pub: Leeds, UK, 1989; p. 138. ISBN 0-901462-35-7.
3. EN 1912. Structural Timber—Strength Classes—Assignment of Visual Grades and Species; CEN, EuropeanStandardisation Institute: Brussels, Belgium, 2012.
4. EN 338. Structural Timber—Strength Classes; CEN, European Standardisation Institute: Brussels, Belgium,2016.
5. Kretschmann, D.E. Chapter 5—Mechanical properties of wood. In Wood Handbook—Wood as an EngineeringMaterial; Robert, J.R., Ed.; USDA Forest Service, Forest Products Laboratory: Madison, WI, USA, 2010.
6. Poussa, M.; Tukiainen, P.; Ranta-Manus, A. Experimental study of compression and shear strength ofspruce timber. In Proceedings of the Internationnal Council for Research and Innovation in Building andConstruction Working Comission W18 Timber Structures Meeting Fourty, Bled, Slovenia, 28–31 August 2007.
7. Franke, S.; Quenneville, P. Compression strength perpendicular to the grain of New Zealand Radiata pinelumber. Aust. J. Struct. Eng. 2011, 12, 23–34. [CrossRef]
8. Šobra, K.; Branco, J.M. Experimental evaluation of dovetail joints. In STSM COST Action FP1101—Assessment,Reinforcement and Monitoring of Timber Structures; University of Minho: Guimarães, Portugal, 2014.
9. Leijten, A.J.M. The bearing strength capacity perpendicular to grain of Norway spruce—Evaluation of threestructural timber design models. Constr. Build. Mater. 2016, 105, 528–535. [CrossRef]
10. Verbist, M.; Branco, J.M.; Poletti, E.; Descamps, T.; Lourenço, P.B. Single Step Joint: Overview of Europeanstandardized approaches and experimentations. Mater. Struct. 2017, 50, 161. [CrossRef]
11. American Society for Testing and Materials. Standard Methods of Testing Small Clear Specimens of Timber;ASTM D143-94; ASTM: West Conshohocken, PA, USA, 2000.
12. EN 408. Structural Timber and Glued Laminated Timber—Determination of Some Physical and Mechanical Properties;CEN, European Standardisation Institute: Brussels, Belgium, 2003.
13. Leijten, A.J.M.; Franke, S.; Quenneville, P.; Gupta, R. Bearing strength capacity of continuous supportedtimber beams: Unified approach for test methods and structural design codes. J. Struct. Eng. 2012, 138,266–272. [CrossRef]
14. Van Der Put, T.A.C.M. Derivation of the bearing strength perpendicular to the grain of locally loaded timberblocks. Holz Roh Werkst. 2008, 66, 409–417. [CrossRef]

Buildings 2020, 10, 14 14 of 14
15. Cruz, H.; Machado, J.S. Effects of beetle attack on the bending and compression strength properties of pinewood. Adv. Mater. Res. 2013, 778, 145–151. [CrossRef]
16. Gilfillan, J.R.; Gilbert, S.G. Development of a technique to measure the residual strength of woodworminfested timber. Constr. Build. Mater. 2001, 15, 381–388. [CrossRef]
17. Nunes, L.; Parracha, J.L.; Faria, P.; Palma, P.; Maurício, A.; Pereira, M.F.C. Towards an assessment tool ofanobiid damage of pine timber structures. In Proceedings of the IABSE Symposium 2019 Guimarães: Towardsa Resilient Built Environment—Risk and Asset Management, Guimarães, Portugal, 27–29 March 2019;pp. 1734–1741.
18. Parracha, J.L.; Pereira, M.F.C.; Maurício, A.; Machado, J.S.; Faria, P.; Nunes, L. A semi-destructive assessmentmethod to estimate the residual strength of maritime pine structural elements degraded by anobiids.Mater. Struct. 2019, 52, 54. [CrossRef]
19. EN 13183-2. Moisture Content of a Piece of Sawn Timber. Part 2—Estimation by Electrical Resistance Method;CEN, European Standardisation Institute: Brussels, Belgium, 2002.
20. International Organization for Standardization. Physical and Mechanical Properties of Wood—Test Methodsfor Small Clear Wood Specimens—Part 1: Determination of Moisture Content for Physical and Mechanical Tests;ISO 13061-1:2014; International Organization for Standardization: Geneva, Switzerland, 2014.
21. Tabarsa, T.; Chui, Y.H. Stress-strain response of wood under radial compression. Part I. Test method andinfluences of cellular properties. Wood Fiber Sci. 2000, 32, 144–152.
22. Tabarsa, T.; Chui, Y.H. Characterizing microscopic behaviour of wood under transverse compression. Part II.Effect of species and loading direction. Wood Fiber Sci. 2001, 33, 223–232.
23. International Organization for Standardization. Timber Structures—Strength Graded Timber—Test Methods forStructural Properties; ISO 13910; International Standard Organization: Geneva, Switzerland, 2014.
24. AS/NZS 3603. Timber Structures Standard; Standards New Zealand: Wellington, New Zealand, 1992.25. AS/NZS 4063. Timber-Stress Graded—In Grade Strength and Stiffness Evaluation; Standards Australia: Sydney,
Australia, 1992.26. Leicester, R.H.; Fordham, H.; Breitinger, H. Bearing strength of timber beams. In CIB-W18-Timber Structures:
Paper 31-6-5; University of Karlsruhe: Karlsruhe, Germany, 1998.27. EN 1995-1-1. Eurocode 5—Design of Timber Structures—Part 1.1: General—Common Rules and Rules for Buildings;
CEN, European Standardisation Institute: Brussels, Belgium, 2004.28. EN 1995-1-1/A1. Eurocode 5—Amendment 1—Design of Timber Structures—Part 1.1: General—Common Rules
and Rules for Buildings; CEN, European Standardisation Institute: Brussels, Belgium, 2008.29. EN 350. Durability of Wood and Wood-Based Products. Testing and Classification of the Durability to Biological
Agents of Wood and Wood-Based Materials; CEN, European Standardisation Institute: Brussels, Belgium, 2016.
© 2020 by the authors. Licensee MDPI, Basel, Switzerland. This article is an open accessarticle distributed under the terms and conditions of the Creative Commons Attribution(CC BY) license (http://creativecommons.org/licenses/by/4.0/).