Embed Size (px)
Citation preview

CHARACTERIZATION OF THE INTERACTOME OF
THE HIPPO TUMOUR SUPPRESSOR PATHWAY
USING MASS SPECTROMETRY
By
Fang Yuan, B.Sc. (Hons.)
A Thesis Submitted to the School of Graduate Studies in Partial Fulfillment of the
Requirements for the Degree Master of Science
University of Toronto
©Copyright 2013 by Fang Yuan

M. Sc. Thesis – Fang Yuan University of Toronto, Molecular Genetics
ii
MASTER OF SCIENCE
Department Molecular Genetics, University of Toronto
Convocation Date: November 2013
Title: Characterization of the Hippo tumour suppressor pathway using mass spectrometry
Author: Fang Yuan
Supervisor: Dr. Jeffrey Wrana
ABSTRACT
The Hippo signaling pathway offers an intrinsic mechanism to control organ sizes,
and dysfunction of this pathway can often lead to cancer. Great advancement has been
made in recent years into understanding this pathway. Despite all this invaluable
knowledge, much remains to be explored. Mass spectrometry offers an unbiased
approach to characterize the interactome of any protein of interest and is particularly
powerful for identifying potential novel regulators of signalling pathways. I therefore set
out to characterize the interactome of all the Hippo pathway main components using
mass spectrometry, with the goal of uncovering novel regulatory mechanism(s) of the
Hippo pathway. In the end, I was able to identify over 250 novel interactors of the Hippo
pathway in total. This study demonstrates the utility of mass spectrometry to identify
novel regulators of the Hippo pathway and characterization of one such interactor.

M. Sc. Thesis – Fang Yuan University of Toronto, Molecular Genetics
iii
ACKNOWLEDGEMENT
I owe a great debt of gratitude to those individuals whose contributions have made this
work possible. First, I would like to thank my supervisor, Dr. Jeffrey Wrana, whose constant
guidance, and wealth of experience and knowledge have helped shape me as a scientist. I
would also like to thank the members of my supervisory committee, Dr. David Kaplan and
Dr. Helen Mcneill for their invaluable advice and insights into my research.
Acknowledgement is also due to all the members of the Wrana lab who have contributed
directly or indirectly to this work and their willingness to partake in stimulating scientific
discussion and for their commitment to the research goals of our laboratory.
Finally, I would like to thank my family for supporting me in my decision to pursue a
career in research.

M. Sc. Thesis – Fang Yuan University of Toronto, Molecular Genetics
iv
TABLE OF CONTENTS
1. INTRODUCTION…………………………………………………………….……………1
1.1 The evolutionarily conserved tumor-suppressor Hippo pathway……………...…………..1
1.2 Cross-talk with other signaling pathways…………………………………….…………...5
1.3 Regulation of the Hippo pathway………………………………………………………7
1.4 Using mass spectrometry to identify novel regulators of the Hippo pathway in
mammals……………………………………………………………………………….10
2. MATERIALS AND METHODS…...……………………………………..………………13
2.1 Cell culture………………………………………………………………………………13
2.2 Generation of T-Rex FLP cell lines……………………………………………………...14
2.3 Affinity purification and tandem mass spectrometry……………………………………14
2.4 Bioinformatic analysis…………………………………………………………………...16
2.5 Plasmid and siRNA transfection, TEAD reporter assay………………………………...16
2.6 Immunofluorescence…………………………………………………………………….17
2.7 Primary cortical neuron culture………………………………………………………….17
3. RESULTS……………………………...……………………….………………..…….….18
3.1 Mass spectrometry………………………………………………………………………18
3.2 Protein-centric and function-centric clustering of the interactors……………………….20
3.3 Position of the tag, kinase activity and cell density do not seem to affect interactome of at
least certin proteins….......…………………………………………………………………...21
3.4 Identification and characterization of DOCK7 and its role in Hippo signaling………....22
3.5 Characterization of the role of DOCK7 in neuronal development………………………25
4.DISCUSSION…………………………………………………………………………….28
M. Sc. Thesis – Fang Yuan University of Toronto, Molecular Genetics
v
4.1 Mass spectrometry……………………………………………………………………….28
4.2 DOCK7 failed to change Hippo signaling……………………………………………….29
4.3 Hippo signaling failed to change DOCK7 activity………………………………………31
5. CONCLUSION…………………………...………………………………………………31
6. REFERENCES…………………...………………………….……………………………34
7. FIGURES……………………………………..…………………………..………………43
8. TABLES……………………………….………………………………………….………52

M. Sc. Thesis – Fang Yuan University of Toronto, Molecular Genetics
vii
LIST OF FIGURES
Figure 1. The core Hippo pathway signaling cascade.
Figure 2. Characterization of HEK293 T-Rex FLP lines.
Figure 3 Summary of the mass spectrometry study.
Figure 4. The role of DOCK7 in regulating the Hippo pathway remains unclear.
Figure 5. The role of DOCK7 in regulating the Hippo pathway in Eph4 cells remains
inconclusive.
Figure 6. The role of MOB1 in regulating axon development in embryonic neurons remains
inconclusive.
Figure 7. The domain structure of LRCH proteins.

M. Sc. Thesis – Fang Yuan University of Toronto, Molecular Genetics
viii
LIST OF TABLES
Table 1. Summary of all the high-confidence interactors of the Hippo pathway main
components.
Table 2. Comparison of the intearctome between wild-type and kinase-dead variant of
MST1/2 and LATS1/2
Table 3. Comparison of the intearctome between N-term tagged and C-term tagged variant
of LATS1/2.
Table 4. Comparison of the intearctome between low and high cell density of core Hippo
pathway components
Table 5. Interactome of DOCK7

M. Sc. Thesis – Fang Yuan University of Toronto, Molecular Genetics
ix
LIST OF ABBREVIATIONS
ECM – Extracellular Matrix
GEF – Guanine Exchange Factors
MS – Mass Spectrometry
PPI – Protein-Protein Interaction
TBS – TEAD-binding-sequence
YAP/TAZ – YAP and TAZ

M. Sc. Thesis – Fang Yuan University of Toronto, Molecular Genetics
1
1. INTRODUCTION
1.1 The evolutionarily conserved Hippo tumor-suppressor pathway
Organ size is controlled by both extrinsic and intrinsic mechanisms. Extrinsic growth
factors, such as insulin-like growth factors, stimulate organ size, whereas lack of nutrients
significantly reduces organ size (Stanger, 2008). Intrinsic regulation has also been proposed
based on results from several limb transplant experiments in salamander, where the
transplanted limbs grow to the original size of the donor but not that of the recipient
(Stanger, 2008). The molecular mechanism of the intrinsic regulation of organ size had
remained largely unknown until the discovery of the Hippo tumor-suppressor pathway.
Early studies have shown that mutations in several evolutionarily-conserved genes can
cause overgrowth in a set of specific organs in both Drosophila and mouse without altering
cell fate or cell polarity. For example, the Hpo mutant in Drosophila causes enlargement of
imaginal discs epithelial tissues (Wu et al., 2003), and mutation in Mst1 or Mst2
(homologues of Hpo in mammal) results in liver enlargement and tumour development in
mouse (Dong et al., 2007). Other genes that cause similar phenotypes include the kinases
LATS1/2 (Tao et al., 1999), the adaptor proteins SAV1 (Callus et al., 2006) and MOB1A/B
(Praskova et al., 2008). Later work further revealed that LATS1/2 phosphorylates and
inhibits the function of the transcription co-activators YAP and TAZ (YAP/TAZ) (Zhao et al.,
2010b). Finally, overexpression of YAP/TAZ phenocopies mutations in the core Hippo
pathway components (Huang et al., 2005), thus revealing the last component of the Hippo
signaling pathway.
M. Sc. Thesis – Fang Yuan University of Toronto, Molecular Genetics
2
The core Hippo signal cassette transduces signals in a fairly linear manner (Fig. 1)
(Zhao et al., 2010a). Upon activation, MST1/2 phosphorylate and activate LATS1/2 with the
aid of the adaptor proteins SAV1 (Chan et al., 2005). SAV1 interacts with MST1/2 through
the SARAH domains present in both SAV1 and MST1/2 (Callus et al., 2006). Activated
MST1/2 also phosphorylates MOB1A/B, resulting in an enhanced LATS1/2–Mob1
interaction which leads to a further increase in LATS1/2 activity (Bao et al., 2009). Activated
LATS1/2 in turn phosphorylates YAP/TAZ (Huang et al., 2005). Phosphorylation of
YAP/TAZ is inhibitory to their transcriptional functions because such phosphorylation
promotes 14-3-3 binding and subsequent cytoplasmic sequestration. Phosphorylation of
YAP/TAZ on the same sites can also induce their degradation by the E3 ubiquitin ligase
SCFβ–TRCP (Zhao et al., 2010b). When the Hippo pathway is inactive, YAP/TAZ are
dephosphorylated, dissociates from 14-3-3 and become more stable with subsequent
accumulation in the nucleus where they perform their functions as transcriptional co-
activators.
While in the nucleus, YAP/TAZ can bind to a variety of transcription factors under
different biological contexts, including RUNX2 (Cui et al., 2003), PAX8 (Di Palma et al.,
2009), TBX5 (Murakami et al., 2005), TTF-1 (Park et al., 2004), MyoD (Jeong et al., 2010),
PPARγ (Hong et al., 2005), P73 (Tomlinson et al., 2010), and TEADS (Mahoney et al.,
2005). RUNX2 was the first identified transcription factor that binds to YAP/TAZ using a
yeast two-hybrid system (Cui et al., 2003). RUNX2 promotes osteoblastic differentiation of
mesenchymal stem cell (MSC), which is enhanced by binding to YAP/TAZ. Later work
revealed that YAP/TAZ can also bind to the transcription factor PPARγ which promotes

M. Sc. Thesis – Fang Yuan University of Toronto, Molecular Genetics
3
adipocytic differentiation of MSC (Hong et al., 2005). Interestingly, such binding suppresses
the activity of PPARγ. Therefore, YAP/TAZ, PPARγ and RUNX2 together form a delicate
system in MSC where nuclear YAP/TAZ (inactive Hippo pathway) promotes osteoblastic
differentiation and cytoplasmic YAP/TAZ (active Hippo pathway) promotes adipocytic
differentiation. YAP/TAZ has also been shown to bind to and promote the activity of TBX5,
an essential transcription factor in cardiac and limb development (Murakami et al., 2005).
Importantly, patients with Holt-Oram syndrome harbour various mutations in TBX5 which
result in impaired binding to YAP/TAZ, thus linking YAP/TAZ directly to human disease
progression. However, perhaps the most-studied binding partner of YAP/TAZ is the TEAD
family members (Mahoney et al., 2005). In fact, TEAD seems to be the primary mediator of
Hippo pathway in Drosophila (Zhao et al., 2008). Disrupting the interaction between
YAP/TAZ and TEAD, as well as TEAD knockdown, directly affects the YAP/TAZ-mediated
effects on cell proliferation, cell migration, and organ size control. Some transcriptional
targets of this complex have also been identified, including CTGF (Zhao et al., 2008), Cyr61
(Lai et al., 2011), ZEB1 (Liu et al., 2010b) and AREG (Zhang et al., 2009), all of which are
crucial in YAP/TAZ-induced cell proliferation and survival under different biological
contexts.
By inhibiting the functions of YAP/TAZ, the Hippo pathway has several important
biological functions. First and foremost, the Hippo pathway is a tumor suppressor pathway.
By sequestering YAP/TAZ in the cytoplasm, the Hippo pathway effectively inhibits the
transcription co-activator activity of YAP/TAZ and retards YAP/TAZ-mediated cell
proliferation, cell survival and cell migration. In both Drosophila and mouse models,

M. Sc. Thesis – Fang Yuan University of Toronto, Molecular Genetics
4
mutations in different Hippo pathway components often result in tumor development (Dong
et al., 2007). Importantly, tumor sample analysis have revealed amplification of YAP in
breast cancer patients (Zender et al., 2006), mutation in NF2 (a Hippo pathway regulator) in
meningiomas patients (Striedinger et al., 2008), and epigenetic silencing of LATS1/2 in
breast cancer patients (Jiang et al., 2006), all pointing to a role of the Hippo pathway in
cancer progression. Related to this, nuclear YAP/TAZ has been shown to help cells maintain
a stem cell phenotype and confer cancer cells a more basal stem-cell-like property
(Cordenonsi et al., 2011). Activation, or re-activation in some cases, of the Hippo pathway,
limit the expansion or even promote the differentiation of the stem cell population. Lastly,
the Hippo pathway is a critical regulator of early mammalian development. During the early
stage of blastocyst formation, the zygote forms a fluid-filled epithelial vesicle that encloses a
compact group of cells (Stephenson et al., 2012). The outer cell layer is called trophectoderm
(TE) and the inner cell layer is called inner cell mass (ICM). The fate of the cells between
TE and ICM is dictated by expression of specific transcription factors. Specifically, OCT4 is
only expressed in ICM and CDX2 is only expressed in TE. Recently it’s been found that the
expression of CDX2 is absolutely dependent on the transcriptional activity of TEAD4
(Nishioka et al., 2009). Although TEAD4 is expressed in both TE and ICM, YAP/TAZ
remains in the nucleus and promotes the activity of TEAD4 only in TE, whereas YAP/TAZ
is sequestered in the cytoplasm in ICM. Not-surprisingly, the different localization of
YAP/TAZ between TE and ICM is largely dependent on its phosphorylation status by
LATS1/2. Overexpression of LATS in embryo led to cytoplasmic sequestration of
YAP/TAZ and significant reduction in CDX2 expression without affecting cell number. On
the other hand, LATS1/2 double-knockout mouse showed nuclear YAP and strong induction

M. Sc. Thesis – Fang Yuan University of Toronto, Molecular Genetics
5
of CDX2 even in inner cells. These data all point to a crucial role of the Hippo pathway in
early development.
1.2 Cross-talk with other signaling pathways
The Hippo pathway has been shown to regulate other signaling pathways. A prime
example is the TGFβ pathway and the similar BMP pathway. In both pathways, the TGFβ
superfamily ligands bind to the corresponding receptors, which then phosphorylates the
receptor-regulated SMAD (R-SMAD). Phosphorylated R-SMAD binds to SMAD4 and the
R-SMAD/SMAD4 complex accumulates in the nucleus where they co-modulate
transcription in co-operation with DNA-binding transcription factors to regulate target gene
expression. Our lab has shown that YAP/TAZ can bind to SMAD2/3, which is the R-
SMADS of the TGFβ branch, and dominantly controls the nucleo-cytoplasmic shuttling of
the SMAD2/3-SMAD4 complex (Varelas et al., 2008). In the absence of YAP/TAZ, or in
cells where YAP/TAZ is predominantly cytoplasmic (i.e. when the Hippo pathway is
activated), efficient accumulation of the SMAD complex in the nucleus is inhibited, which
leads to inhibition of the TGFβ-SMAD2/3 signaling pathway. Importantly, because the
TGFβ-SMAD2/3 signaling pathway plays an important role in cell migration and
particularly the epithelial-to-mesenchymal transition (EMT) process, the activity of the
Hippo pathway thus provides another guard against cell migration by sequestering
SMAD2/3 in the cytoplasm (Varelas et al., 2010b).
A somewhat similar mechanism also operates in the BMP signaling pathway. In this
pathway, activated BMP receptor phosphorylates SMAD1/5, which then binds to SMAD4
and translocates into the nucleus. YAP/TAZ has also been shown to bind phosphorylated

M. Sc. Thesis – Fang Yuan University of Toronto, Molecular Genetics
6
SMAD1 (Alarcon et al., 2009). However, this binding does not seem to control the
subcellular localization of the SMAD1/5-SMAD4 complex. Rather, YAP/TAZ translocates
with the SMAD1/5-SMAD4 complex into the nucleus and enhances their transcriptional
activity. Although the link between the BMP pathway and the Hippo pathway has not been
completely characterized, at least in Drosophila, inactivation of upstream Hippo pathway
components resulted in elevated Dpp (the Drosophila homologue of BMP) target gene
expression, presumably due to increased interaction between YAP/TAZ and SMAD1/5 in the
nucleus.
Furthermore, YAP/TAZ also serves as the cross-talk node between the Hippo pathway
and the WNT pathway. In the WNT pathway, the WNT proteins bind to the Frizzled receptor,
causing the receptors to activate CK1δ/ε which then phosphorylates the Dishevelled (DVL)
family proteins. Phosphorylation of DVL promotes the stabilization and the nuclear
translocation of the WNT pathway transducer β-catenin by blocking GSK-3-mediated
phosphorylation. Our lab has shown that TAZ can regulate WNT signaling via direct
interaction with the cytoplasmic protein DVL(Varelas et al., 2010a). TAZ, when
phosphorylated by the Hippo pathway and sequestered in the cytoplasm, competes with
CK1δ/ε kinases for binding to cytoplasmic DVL, resulting in decreased levels of
phosphorylated DVL and reduced WNT signaling. In addition, inactivation of Hippo
pathway components in Drosophila, which drives TAZ into the nucleus, led to reduced
interaction between DVL and TAZ and increased stability of Arm (Drosophila homologue of
β-catenin) and increased expression of WNT target genes. The Hippo pathway can thus
participate in the regulation of the WNT pathway through TAZ phosphorylation and
M. Sc. Thesis – Fang Yuan University of Toronto, Molecular Genetics
7
subsequent inhibition of DVL phosphorylation.
1.3 Regulation of the Hippo pathway
Given the importance of the Hippo pathway, extensive research has been carried out to
understand how this pathway is regulated. Most of the early studies used Drosophila to
identify regulators of the Hippo pathway due to the ease of conducting genetic screening and
the prominent phenotype when the Hippo pathway is disrupted in this model organism.
These studies revealed that many polarity or cell-junction related proteins regulate the Hippo
pathway activity. For example, the atypical cadherin Fat (Ft) and Dachsous (Ds) have been
shown to control growth upstream of the Hippo pathway (Willecke et al., 2008).
Interestingly, it appears that the relative levels of Ft and Ds between neighbour cells control
the activity of the Hippo pathway. Thus Ft and Ds might provide a mechanism of non-cell-
autonomous regulation of the Hippo pathway. This discovery is particularly intriguing given
the fact that Ft and Ds are both major regulators of planar cell polarity (PCP), suggesting a
role for PCR in Hippo regulation. Another important complex is the Kibra-Merlin-Expanded
complex which is located at the sub-apical region of the cells (Hamaratoglu et al., 2006).
Disruption of this complex also leads to inactivation of the Hippo pathway. Importantly,
components of this complex physically interact with the core Hippo components. For
example, Expanded interacts with Yki (Drosophila homologue of YAP/TAZ) and Hpo
(Drosophila homologue of MST1/2), Kibra binds Wts (Drosophila homologue of LATS1/2),
and Merlin binds Sav. Therefore, it has been postulated that this complex might directly
regulate Hippo pathway depending on different polarity cues. Finally, protein complexes
controlling apical-basal polarity have also been shown to regulate the Hippo pathway

M. Sc. Thesis – Fang Yuan University of Toronto, Molecular Genetics
8
activity. These complexes include the apical aPkc-Bazooka-Par6 complex and the basal Lgl-
Scrib-Dlg complex (Grzeschik et al., 2010). Specifically, the two complexes work
antagonistically with each other where Lgl appears to activate the Hippo pathway and aPkc
seems to inhibit the Hippo pathway. Current studies are focusing on characterizing the
molecular link between these polarity proteins and the core Hippo pathway components.
Most of these polarity proteins have been shown to be functionally conserved in
mammals in terms of regulating the Hippo pathway. To identify novel regulators of the
Hippo pathway in mammals, our lab has shown using mass spectrometry that YAP/TAZ
interact physically with components of the Crumbs polarity complex (Varelas et al., 2010c).
Disruption of the Crumbs complex at high cell density leads to reduced phosphorylation of
YAP/TAZ and more nuclear accumulation of YAP/TAZ, suggesting that the physical
interaction between YAP/TAZ and the Crumbs complex is functionally linked to the
phosphorylation and cytoplasmic sequestration of YAP/TAZ. We believe that the Crumbs
complex serves as a cell-density-sensing platform that promotes the phosphorylation of
YAP/TAZ in mature epithelium. Using the same approach, other groups have reported that
YAP/TAZ also interacts with other polarity proteins such as AMOT (Zhao et al., 2011) and
α-catenin (Silvis et al., 2011), and showed that their interaction with YAP/TAZ are all
required for YAP/TAZ phosphorylation under different contexts. α-catenin, for example, is
particularly important in controlling epidermal proliferation.
Two other regulatory mechanisms on Hippo pathway have recently been identified,
the first one being the mechanotranduction pathway. The mechanotransduction pathway
describes how the cell responds to the mechanical changes in its surrounding environment,

M. Sc. Thesis – Fang Yuan University of Toronto, Molecular Genetics
9
for example the rigidity of the extracellular matrix (ECM). A recent study showed that the
mechanotransduction pathway re-organizes the cytoskeleton network to control the
localization of YAP/TAZ, which then controls specific biological outcome (Dupont et al.,
2011). By plating cells on ECM with different degrees of rigidity, the study showed that
YAP/TAZ localize in the nucleus on stiff ECM, whereas they localize in the cytoplasm on
soft ECM. Furthermore, by altering the cell shape, therefore altering the cytoskeleton
network, the study showed that YAP/TAZ localize in the nucleus when cells are spreading
whereas they localize in the cytoplasm when cells are confined into small regions.
Importantly, the study showed that manipulation of the localization of YAP/TAZ in
mesenchymal stem cells could alter their differentiation program, similar to how they
respond to ECM with different degrees of rigidity.
The most recent regulatory mechanism was characterized when specific extracellular
growth factors promote the nuclear accumulation of YAP/TAZ. These growth factors all
bind to specific transmembrane receptors which then lead to activation of specific signaling
pathways. For example, stimulation of various G-protein-coupled-receptors (GPCR) can lead
to either activation or inhibition of the Hippo pathway, which seems to depend on the
downstream signaling cascade of the particular GPCR (Yu et al., 2012). Specifically, upon
stimulation by glucagon and epinephrine, the Gs-coupled GPCR can lead to cAMP-
dependent activation of Hippo pathway. In contrast, upon stimulation by lysophosphatidic
acid and sphingosine 1-phosphate, the G12/13-coupled receptors can lead to inactivation of
the Hippo pathway through the small GTPase RHO. Other receptor-mediated Hippo pathway
regulation include the epidermal growth factor (EGF) which binds to the epidermal growth

M. Sc. Thesis – Fang Yuan University of Toronto, Molecular Genetics
10
factor receptor and subsequently inactivates the Hippo pathway via the PI3K signaling
pathway (Fan et al., 2013). Although the exact biochemical mechanisms of how the
activation of these signaling pathway leads to inactivation of the Hippo pathway is not
completely understood, these findings suggest that YAP/TAZ serves as one of the many
downstream effectors of these signaling pathways to promote cell proliferation.
1.4 Using mass spectrometry to identify novel regulator of the Hippo pathway in mammals
While many of the Hippo regulators were identified using genetic screens in
Drosophila, such method is less applicable in mammalian systems. Even when regulators
were identified, further work are needed to elucidate the precise molecular mechanism. Mass
spectrometry (MS) offers an unbiased approach to identify direct interactors and potential
regulators of the protein of interest(Liu et al., 2010a). The rationale here is that many
proteins do not function as independent units, but rather are part of large macromolecular
complexes of interacting proteins. Extensive protein-protein interaction (PPI) usually exists
in such complexes, and since most regulators require direct PPI, characterizing the entire
interactome surrounding a protein of interest can provide invaluable information regarding
how the protein is regulated. Furthermore, downstream biochemical characterization
becomes relatively easier compared to genetic screening since PPIs are already known from
the MS results. Even when compared to high-throughput PPI screening such as yeast-two
hybrid (Fromont-Racine et al., 1997) or the LUMIER technology (Barrios-Rodiles et al.,
2005), MS still offers two advantages. First, high-throughput PPI screening is often limited
by the size of the cDNA library whereas MS is capable of identifying proteome-wide
interactors. Second, traditional high-throughput PPI screening often involves over-

M. Sc. Thesis – Fang Yuan University of Toronto, Molecular Genetics
11
expressing both the target and the bait proteins. The over-abundance of the expressed
proteins may help catch transient interactions, but it may also lead to artificial interaction.
Most MS studies, on the other hand, were done in a semi-endogenous (i.e. generation of
stable cell lines expressing the bait protein) or endogenous manner (i.e. immunoprecipitating
endogenous protein using antibodies), which ensures that the interactors and/or the bait
proteins are in their fully processed and endogenous form, that the interactions are in the
native environment of the protein, and that multi-component complexes can be isolated in a
single step.
Of course, MS is not without shortcomings. Compared to binary interaction studies,
the interactors obtained from MS studies are ranked based solely on abundance. Thus it is
often hard to differentiate between non-specific interactors and true biological interactors
with low abundance. Taken into account that most MS studies are conducted without any
external stimulation in order to achieve an unbiased coverage of the interactome, it is very
likely that the characterized interactome will miss out on interactors that only bind
transiently with the protein of the interest under specific biological signals. Therefore, it is
often recommended to compare interactome of the same protein under different types of
external stimulation or different growth conditions in order to catch these transient
interactors. The problem is that we often don’t know beforehand what stimulus is
appropriate for the protein of interest in a particular biological system.
A general strategy to conduct MS studies is described as follows. Once the stable cell
line which expresses the protein of interest (usually with a tag) is generated, the surrounding
complex is purified by lysing the cells and immunoprecipitating the tag. Appropriate

M. Sc. Thesis – Fang Yuan University of Toronto, Molecular Genetics
12
negative controls can be conducted in parallel using cell lines expressing only the tag.
Purified protein complex may then be separated either before or after the trypsinization step
to achieve better resolution. The goal of trypsinization is to cleave individual proteins into
peptide fragments. Each protein generates unique pattern of fragments upon trypsinization.
The identity of the protein can thus be determined based on the masses of these fragments
using MS.
Several technical advancements have been made to improve MS data quality. First,
traditional stable cell lines usually have multiple random genomic integrations of the
expression vector, which may result not only in the disruption of endogenous gene
expression, but more importantly different genomic composition among lines expressing the
same protein. Furthermore, traditional cell lines constitutively express high levels of the
protein of interest, which may lead to artificial interaction. The T-Rex Flp-In cell line
provides solutions to these problems(Ward et al., 2011). It has a built-in TET-ON system that
allows expression of the protein only in the presence of tetracyclin or doxcyclin, thus
providing temporal control of the gene expression. In addition, the T-Rex line contains a
single stably integrated FRT site at a transcriptionally active genomic locus. In the presence
of the FLP flippase, the transfected expression vector is integrated only into the FRT site,
thus ensuring homogeneous levels of gene expression.
The second critical step in any MS study is the separation step. Even the most
sophisticated algorithm and the most powerful computer cannot identify every individual
protein in an immunoprecipitates when all peptide fragments are mixed together. Therefore,
pre-fractionation is required. A widely-used separation method is the reversed-phase

M. Sc. Thesis – Fang Yuan University of Toronto, Molecular Genetics
13
capillary liquid chromatography (RPLC)(Fekete et al., 2012), which can be applied after the
trypsinization step. The column itself is packed with hydrophobic carbon-silicon conjugates,
which binds preferably to hydrophobic peptides. When subjected to increasing amount of
polar solvents, the more hydrophilic peptides will move into the solvent phase earlier than
the more hydrophobic ones, thus creating separation.
The actual MS starts when the separated peptide is eluted from the tip of the RPLC
column. In a process referred to as electrospray ionization, a high electrical potential is
applied on the eluted peptide and takes only one electron away from the peptide thus making
the total charge on every single peptide equal to 1+. The fragments are then subjected to an
electric field in which all peptide fragments travel over a certain distance. The time-of-flight
depends solely on the mass of the peptide because the charge on the fragment is always 1+.
By recording the time-of-flight for each peptide, the mass of the peptide can be calculated
and the identity of the proteins can be determined by comparing the acquired MS spectrum
to appropriate databases such as MASCOT(van Gool and Hendrickson, 2012).
2. MATERIAL AND METHODS
2.1 Cell culture
HEK293T and Eph4 cells were grown at 37°C in Dulbecco's modified Eagle's medium
containing 10% fetal bovine serum under 5% CO2 in a humidified atmosphere and
maintained using standard procedures. Flp-InTM T-RExTM HEK293 cells were obtained from
Invitrogen. The cells were cultured in media containing 1μg/ml blasticidin and 250μg/ml

M. Sc. Thesis – Fang Yuan University of Toronto, Molecular Genetics
14
zeocin. Stable cell lines were maintained in presence of 1μg/ml blasticidin and 250μg/ml
hygromycin. Exogenous protein expression was induced by 16hrs of treatment with 1μg/ml
doxycyclin.
2.2 Generation of T-Rex FLP cell lines
All of the inducible expression cell lines were generated using the Flp-In T-REx system.
Constructs containing LATS1/2, MST1/2, MOB1A/B, SAV1, and RASSF5/6 were generated
by polymerase chain reaction and subsequently cloned into the pcDNA5-FRT-TO-FLAG
vector from Invitrogen. Cells were co-transfected with these constructs and the pOG44
vector (expressing FLP recombinase) into the HEK293 Flp-In T-REx host cell lines. Cells
that had integrated the expression plasmid were selected with 800μg/ml hygromycin B until
enough colonies were observed by naked eyes, and the colonies were pooled and maintained
as described above.
2.3 Affinity purification and tandem mass spectrometry
Inducible FLAG-tagged HEK293 cell lines expressing Hippo pathway components were
generated using the Flp-In T-REx system and used for FLAG affinity purification. Cells were
grown to confluency and subsequently lysed in TNTE buffer (50mM Tris pH 7.4, 150mM
NaCl, 1mM EDTA, and 0.5% Triton X-100). Immunoprecipitation was carried out using
anti-Flag M2 beads (Sigma; A2220) for 1.5 hours, followed by 2 washes in lysis buffer and 3
washes in wash buffer (0.1% Triton X-100). Subsequently the beads were washed two times
with 20mM Tris buffer (pH 8.0). The bound proteins were then digested on beads at 37°C
overnight with trypsin. The trypsin was evaporated using SpeedVac and the digested proteins

M. Sc. Thesis – Fang Yuan University of Toronto, Molecular Genetics
15
were resuspended in 20μl of 2.5% Formic Acid (pH<3.0) then loaded into a 10cm of Zorbax
C18-packed column. A 100 min gradient of 0.1% formic acid to 0.1% formic
acid/acetonitrile was delivered in a split-flow manner by an Agilent 1100 Capillary HPLC. A
gradient of0-35% ACN was used over a 65 min peak collection window. Data were acquired
on a ThermoFisher LTQ linear ion trap, using a data-dependent method consisting of 1 MS
scan followed by 4 MS/MS scans. Acquired RAW files were converted to mgf format, which
were searched with the Mascot search engine (Matrix Sciences, London, UK) against the
NCBI data base, limited to human taxonomy with a precursor ion mass tolerance of 3.0 and a
fragmentation mass tolerance of 0.6. Methionine oxidation was allowed as a variable
modification, and trypsin specificity (with one missed cleavages allowed) was selected. The
results from the search were compared using an in-house program (Prohits) and proteins
unique to the bait samples (not present in control immunoprecipitation) with protein mascot
score >50, and >2 unique peptides were considered as confident hits.
2.4 Bioinformatics analysis
Protein-centric analysis was carried out using the CytoscapeTM software. Briefly, the names
of the bait and the prey proteins were listed side-by-side on Excel worksheets. The
worksheets were then imported into CytoscapeTM which visualizes the protein-protein
network by 1). seeking the common interactors among the bait proteins 2). connecting bait

M. Sc. Thesis – Fang Yuan University of Toronto, Molecular Genetics
16
proteins with their unique prey proteins 3). Connecting bait proteins with their shared prey
proteins.
Function-centric analysis was also carried out using the CytoscapeTM software using the
BiNGO plugin. Briefly, after importing the names of the bait and the prey proteins into
CytoscapeTM, BiNGO automatically searches the GO term for each protein according to the
Gene Ontology project. The complete protein list along with their GO terms was exported
back into Excel and the proteins were further categorized manually based on their GO terms.
The final function-centric cluster were generated using Excel.
2.5 Plasmid and siRNA transfection, TEAD reporter assay
Confluent cultures of Eph4 cells were trypsinized, resuspended in culture media, and then
counted. For low- and high-density cultures, 25,000 cells or 250,000 cells were plated in 24-
well dishes respectively and reverse-transfected using RNAiMAX (Invitrogen). For
transfection of HEK293T, calcium phosphate was used. For reporter assays, HEK293T cells
were seeded in 24-well dishes and transfected with cDNAs, pCMV-YFP, and 5xTBS-lux
reporters. Forty-eight hours after transfection, the cells were lysed. Luciferase activity in cell
lysates was determined and normalized to YFP activity.
2.6 Immunofluorescence

M. Sc. Thesis – Fang Yuan University of Toronto, Molecular Genetics
17
For immunofluorescence analysis of cell cultures, the samples were fixed with 4%
paraformaldehyde for 10min. Samples were permeabilized with 0.2% Triton X-100 in PBS
for 10min and blocked with 2% BSA-PBS for two hours prior to addition of primary
antibodies at 4°C overnight. The samples were then washed with 0.1% Tween-PBS,
incubated with secondary antibodies at room temperature for 1hr, washed again with 0.1%
Tween- PBS, and finally mounted. Quantification of fluorescence intensity was performed
on deconvolved, maximum projected Z-stacks acquired under non-saturating conditions.
Identical exposure times were used between different samples to ensure the linearity of the
fluorescence measurements using the VOLOCITY software.
2.7 Primary cortical neuron culture
Dissociated mouse cortical neurons from embryonic mouse brain tissue were first trypsinzed
at 37°C for 15min. 100,000 cells were then resuspended in Dulbecco's modified Eagle's
medium containing 10% fetal bovine serum and plated into a polylysine-coated glass
coverslips sitting in a 24-well plate. The next day, the media was changed to Neurobasal
media supplemented with 5% fetal bovine serum, B27 and GlutMAX. The cells were ready
for analysis 72 hours after plating.
3 RESULTS AND DISCUSSION
Despite the recent advancement in understanding the Hippo pathway, several questions

M. Sc. Thesis – Fang Yuan University of Toronto, Molecular Genetics
18
still remain. First, much less is known about how MST1/2 and LATS1/2 are regulated
compared to TAZ/YAP. It would be helpful to expand the studies to these important Hippo
pathway components as well. Second, are there any other cross-talk nodes within the Hippo
pathway in addition to TAZ/YAP? Third, most studies on the Hippo pathway focused on its
roles in cell proliferation and stem cell renewal in epithelial cells. Since the Hippo pathway
components are expressed in a large number of cell types, it’s likely that the Hippo pathway
has functions other than promoting cell proliferation in non-epithelial cell types. To answer
these questions, I decided to use mass spectrometry (MS) to conduct a systematic study on
the protein-protein interaction (PPI) network of the Hippo pathway components.
3.1 Mass spectrometry
I decided to generate stable cell lines that express the Hippo pathway main components
instead of immunoprecipitating endogenous proteins due to lack of good antibodies against
most of these proteins. The T-Rex HEK293 FLP cell line was chosen for the following
reasons. First, HEK293 cells shows density-dependent Hippo pathway activation (i.e.
nuclear YAP/TAZ at low density and cytoplasmic YAP/TAZ at high density) (Fig. 2a).
Second, HEK293 cells are among the easiest cells to obtain T-Rex FLP clones due to its high
transfection efficiency.
Using the T-Rex FLP system, I generated cell lines expressing all main Hippo pathway
components including MST1/2, LATS1/2, SAV, and MOB1A/B (Fig. 1). I also generated
lines expressing RASSF5, RASSF6 since they are known regulators of MST1/2 (Allen et al.,
2007; Hwang et al., 2007). For all the kinases included, I also generated lines expressing
their dominant-negative versions. The reason is that the dominant-negative kinase sometimes

M. Sc. Thesis – Fang Yuan University of Toronto, Molecular Genetics
19
can lock the substrate in a more stable fashion compared to their wild-type counterpart, thus
increasing the probability of catching substrates during the immunoprecipitation step. All of
these proteins were tagged with triple-FLAG tag at the N-terminal position. My negative
control was a cell line that expressed only the triple-Flag tag. I then confirmed that all cell
lines express the proteins in a doxcyclin-inducible manner (Fig. 2b). Figure 3a summarizes
my MS work-flow. Briefly, cells were allowed to grow to full confluency to maximize the
activation of the Hippo pathway. Next, the cells were treated with 1uM of doxycycline for 16
hours to induce gene expression. Cells were lysed at this point and were processed for MS.
A high-confidence list of interactors from any MS studies must include true biological
interactors of the bait protein and exclude non-specific binders which may result from non-
specific binding to the beads, non-specific binding to the tag, and/or artificial binding to the
bait protein during the lysis step with no biological function. To reduce the amount of these
“sticky proteins”, I first excluded highly abundant proteins such as heat shock proteins,
keratin, nucleoproteins, and ribosomal proteins, all of which have been shown to bind empty
beads in other MS studies (Liu et al., 2010a). To exclude proteins that bind to the FLAG tag,
I removed all interactors found in the control cell line which expresses only the triple-FLAG
tag. To further control the high confidence of the interactors, I kept the minimum number of
unique peptides above 2 and the minimum Mascot score above 50, adopted from other
similar MS studies. Unique peptide number tells the amount of protein in the
immunoprecipitated complex, and the Mascot score tells the confidence of the results
generated by the algorithm based on the MS spectra. The final list included interactors
detected in at least two of three biological repeats for each bait (Table 1) with the bold font

M. Sc. Thesis – Fang Yuan University of Toronto, Molecular Genetics
20
highlighting the bait proteins, and the blue shade highlighting the known interactors. Overall
the baits and their known interactors were highly enriched among the interactors, thus
indicating that my MS experiments are robust enough to identify the expected interactors.
3.2 Protein-centric and function-centric clustering of the interactors
The MS study on all Hippo pathway components yielded more than 250 high-
confident hits (Table 1). To gain more insight into the global interactome of the Hippo
pathway, I sought commonalities among the hits in both a protein-centric and function-
centric fashion. Protein-centric clustering was carried out with the aid of CytoscapeTM
software (Fig. 3b). The goal of this analysis is to generate PPI networks using the bait
proteins as nodes which allows for the identification of common interactors among different
Hippo pathway components that might reflect potential common regulatory complexes based
on the assumption that proteins are more likely to have common interactor(s) if they operate
in the same pathway. As a proof of principle, the STRIPAK phosphatase complex is
represented as a shared complex between MST1/2 and SAV1 (Fig. 3b, highlighted in pink)
(Ribeiro et al., 2010).
As a complementary approach, I also carried out a literature search to uncover
common cell biological relationships among these hits as well as functional clustering based
on GO terms using CytoscapeTM software. This exercise identified a number of molecular
targets, cellular processes, and signaling pathways that likely play important roles in Hippo
pathway regulation (Fig. 3c; Table 1). Several of these proteins have been previously
implicated in Hippo pathway regulation, for example the RASSF family members that
attenuate MST1/2 activity. In addition, this approach implicated a number of molecular

M. Sc. Thesis – Fang Yuan University of Toronto, Molecular Genetics
21
targets whose roles in the Hippo pathway regulation have not been established. For example,
the Scribble polarity complex component DLG5 was found to interact with MST1/2. The
Scribble polarity complex has been shown to regulate the Hippo pathway but the precise
molecular mechanism has not been demonstrated (Cordenonsi et al., 2011; Grzeschik et al.,
2010). Furthermore, previous work have focused more on how the Scribble complex acts on
YAP/TAZ and less on MST1/2. In fact, little is known about how MST1/2 are regulated
compared to the other Hippo pathway components. Thus, the DLG5-MST1/2 interaction
might reveal a novel regulatory mechanism of how the Scribble polarity complex regulates
MST1/2 in mammals. Another example is the guanine-exchange factor DOCK7 that interacts
with MOB1, whose characterization is described in the rest of this study.
3.3 Position of the tag, kinase activity and cell density do not seem to affect interactome of at
least certain proteins
In the course of my MS studies I also assessed the kinase-dead variants of MST1/2 and
LATS1/2. As mentioned before, kinase-dead variants of certain enzymes sometimes can
“lock” the substrates in the binding pocket thus increasing the abundance of the substrate
peptides in the immunoprecipitates. Disappointingly, none of the dominant-negative kinases
co-immunoprecipitated more interactors compared to their wild-type counterpart (Table 2).
In some cases, the position of the tag might affect the interactome of the protein of
interest depending on how the protein folds. Therefore, I also tested the effects of having the
tag at either the N-terminal or the C-terminal for LATS1/2, both of which did not pull down
many polarity-related or signaling-related proteins. Unfortunately, I did not observe any
significant changes when comparing the MS results either (Table 3).

M. Sc. Thesis – Fang Yuan University of Toronto, Molecular Genetics
22
Lastly, I reasoned that the interactome of the Hippo pathway components might change
at different cell densities. It is possible that the core components are bound by inhibitors at
low cell density, or are bound by activators at high cell density. Thus I repeated MS studies
on MST1/2, LATS1/2, SAV and MOB1/2 at low cell density. However, no significant
changes were observed when comparing the MS results obtained from high cell density and
low cell density (Table 4). It might suggest that changing cell density may directly work on
YAP/TAZ instead of regulating the core Hippo pathway components.
3.4 Identification and characterization of DOCK7 and its role in Hippo signaling
As seen from Table 1 and 2, although many novel interactors were discovered from the
MS study, only a few are involved in signaling pathways and polarity regulation which are of
more interest to me. Dedicator of Cytokinesis 7 (DOCK7), along with its close homologue
DOCK6, is a novel interactor of MOB1. It is a member of the DOCK-C subfamily of the
DOCK family of guanine nucleotide exchange factors (GEFs) which function as activators
of small G proteins RAC1 and CDC42(Watabe-Uchida et al., 2006). DOCK7 possesses a
DHR2 domain which mediates G protein activation by stabilizing it in its nucleotide free
state. It also contains a DHR1 regulatory domain (Fig. 4a). The biological role of DOCK7
has been mainly demonstrated in the neuronal systems via regulating RAC1 and/or CDC42
activity. In one study, DOCK7 was shown to be required for axon formation in murine
embryonic hippocampal neurons (Watabe-Uchida et al., 2006). In another study, DOCK7
was shown to negatively regulate Schwann cell differentiation and myelination (Yamauchi et
al., 2011). Interestingly, the DOCK7 knockout mouse exhibits normal neuronal development
but with lighter skin pigmentation (Blasius et al., 2009), suggesting that loss of DOCK7

M. Sc. Thesis – Fang Yuan University of Toronto, Molecular Genetics
23
might be compensated by its close homologues DOCK6 and DOCK8.
Before beginning any further investigation on the DOCK7-MOB1 interaction, I first
confirmed this interaction manually. I overexpressed MOB1B and DOCK7 in HEK293T
cells, then immunopreciptated DOCK7, and immunoblotted for MOB1. This showed that
MOB1 interacted with DOCK7 (Fig. 4b). I then hypothesized that the interaction between
MOB1 and DOCK7 might be controlled to regulate DOCK7 activity. As mentioned in the
introduction, the interaction between LATS1/2 and MOB1 requires phosphorylation of two
evolutionarily-conserved threonine sites on MOB1 (T12 and T35 on MOB1B) by MST1/2
(Bao et al., 2009). I reasoned that these two sites might also be important for MOB1 to exert
its effects on DOCK7. To address these questions, I first confirmed that overexpressing
MST1 increased MOB1B T12 phosphorylation by blotting the lysates using an antibody
specific against the phosphorylated threonine sites (Fig. 4b). To examine whether
phosphorylation on these two threonine sites are required for the interaction between MOB1
and DOCK7, I co-expressed DOCK7 with either wild-type MOB1B or MOB1B(T12/35A)
mutant in HEK293T cells, then immunoprecipitated DOCK7, and found that
MOB1B(T12/35A) did not co-precipitate with DOCK7, suggesting that interaction of MOB1
with DOCK7 is phosphorylation dependent by MST1/2 (Fig. 4c). The data thus provided
evidences for a MST1/2-MOB1-DOCK7 signaling axis where activated MST1/2 regulates
DOCK7 activity via phosphorylating MOB1.
The next question I addressed was to characterize the functional role of this
interaction. Initially, I hypothesized that DOCK7 might regulate the Hippo signaling via
interacting with MOB1. I reasoned that MOB1 might serve as an adaptor protein for DOCK7

M. Sc. Thesis – Fang Yuan University of Toronto, Molecular Genetics
24
and DOCK7 might control a small GTPase to regulate Hippo signaling. To address this
possibility, I first tested the effects of DOCK7 on Hippo signaling in a simple but widely-
used reporter assay. In this assay, DOCK7 is co-transfected with a luciferase reporter driven
by TEAD-binding-sequence (TBS). HEK293T cells were used because of their high
transfection efficiency which maximizes luciferase signal production. As mentioned in the
introduction, YAP/TAZ binds strongly to TEAD and any change in YAP/TAZ localization
should affect the expression of the luciferase reporter. YFP driven by normal PCMV6
promoter was co-transfected to normalize transfection efficiency. Disappointingly,
expression of full-length DOCK7 (DOCK7-FL), DOCK7 that lacks the DHR2 catalytic
domain (DOCK7-Δ-DHR2, catalytic-dead), or the DHR2 domain of DOCK7 (DOCK7-
DHR2, lack regulatory domain) did not significantly alter the luciferase expression (Fig. 4d).
Transfection of wild-type or the T12/35A mutant form of MOB1 didn’t alter the luciferase
expression either (Fig. 4d). As a positive control, YAP/TAZ were strongly phosphorylated as
assessed by immunoblotting when LATS was overexpressed, indicating functional Hippo
signaling in HEK293T cells (Fig. 4e).
A more robust system is the well-polarized Eph4 murine mammary epithelial cell line
which exhibits density-dependent and polarity-controlled Hippo signaling (Varelas et al.,
2010b). To avoid the problems associated with the reporter assay, I first chose to examine the
localization of endogenous YAP/TAZ after changing the level of DOCK7 in Eph4 cells. I
first reduced DOCK7 expression by treating the cells with si-DOCK7 at either high or low
density, and then examined YAP localization using immunofluorescence. Si-Crumbs was
used as a positive control. Si-Dock7 did not significantly change YAP localization either at
M. Sc. Thesis – Fang Yuan University of Toronto, Molecular Genetics
25
high or low cell density (Fig. 5a), even though the knock-down efficiency is greater than
80% as measured by qPCR (Fig. 5b). I was not able to examine the protein level of DOCK7
using western blot after knockdown due to lack of good antibodies against DOCK7. Next, I
transiently transfected GFP-DOCK7 into Eph4 cells at either high or low density. Again,
DOCK7 expression did not significantly change YAP localization at either cell density level
(Fig. 5c).
3.5 Characterization of the role of DOCK7 in neuronal development
Because it was difficult to draw any definitive conclusions on the role of DOCK7 in
regulating the Hippo pathway, I decided to examine the DOCK7-MOB1 interaction from
another angle, that is, whether MOB1 regulates the function of DOCK7 in Hippo-
independent signalling pathway. There are at least two mechanisms for MOB1 to regulate
DOCK7. MOB1 can either regulate the localization of DOCK7, or it can regulate the GEF
activity of DOCK7. To examine the former possibility, one really needs to examine whether
double knockdown of MOB1A/B would affect the localization of endogenous DOCK7 using
immunofluorescence. However, due to lack of good antibody against DOCK7, it is difficult
to carry out such experiment at present (the localization of over-expressed GFP-DOCK7 do
not conform to that of the endogenous DOCK7) (Watabe-Uchida et al., 2006). To examine
whether MOB1 influences the GEF activity of DOCK7, I performed “PBD pull-down assay”
which assesses the level of endogenous RAC1-GTP (active RAC1). The premise of this
assay is that the p21 RAC1/CDC42 binding domain (PBD) of PAK binds specifically to the
active GTP-bound form of RAC1. HEK293T cells were transfected with various constructs
of DOCK7 and MOB1, and endogenous RAC1-GTP was precipitated from cell lysates using

M. Sc. Thesis – Fang Yuan University of Toronto, Molecular Genetics
26
the PAK-PBD protein beads. However, I was not able to obtain consistent results and most
experiments showed no significant change in endogenous RAC1-GTP level upon expressing
either DOCK7 or MOB1 or both (Fig. 6a and 6b).
Aside from the biochemical role of MOB1 in regulating DOCK7, it is more
important to examine whether the MOB1-DOCK7 interaction has any functional relevance
in any biological settings. As mentioned before, it has been reported that DOCK7 is required
for axon formation in developing neurons (Watabe-Uchida et al., 2006). Our lab has
developed a system to culture mouse embryonic cortical neurons in vitro from E14 mouse
embryos. Thus I decided to utilize this system to examine the biological role of the MOB1-
DOCK7 interaction. The system is described briefly below. Shortly after trypsinization,
50000 embryonic cortical neurons were electroporated with either plasmids or siRNA and
immediately plated. Shortly after plating, a neuron forms lamellipodia (stage 1), from which
several minor neurites sprout (stage 2). After 24hr, only one of these neurites elongates to
form the axon (stage 3), whereas several days later the remaining neurites form dendrites
(stage 4). Axons can then be immunostained using axon-specific markers. Embryonic
cortical neurons thus serve as an ideal system to study axon formation. The ideal experiment
is to treat the neurons with either si-DOCK7 or si-MOB1 and examine the effects on axon
formation using immunofluorescence. Again, due to lack of good antibodies against either
DOCK7 or MOB1, and due to the low transfection efficiency of siRNA in neurons, I was not
able to carry out this experiment. Therefore, I decided to investigate whether overexpressing
DOCK7 or MOB1 promotes axon formation. I thus generated GFP-tagged DOCK7 and
MOB1B constructs and attempted to express them in embryonic cortical neurons.

M. Sc. Thesis – Fang Yuan University of Toronto, Molecular Genetics
27
Unfortunately, no GFP expression was observed after several attempts. Upon trouble-
shooting, I suspected that the PCMV promoter of my vector is not strong enough to drive
high expression in primary neurons. Thus I re-cloned my GFP-tagged DOCK7 and MOB1B
constructs into a pCAG-promoter driven vector which is a stronger promoter than pCMV in
many primary cells. Significant GFP expression was observed three days after transfection
(Fig. 6c). I then quantified the axon number per neuron by staining them with Tau-1 (axon
specific antibody) and MAP2 (general neurite marker). Neither DOCK7 nor MOB1
expression produced any significant effects on axon number in cortical neurons (Fig. 6d).
One possibility of producing no observable phenotypes in neurons is that MOB1
controls DOCK7 activity outside of the context of axon formation, or that MOB1 controls
DOCK7 via RAC1-independent avenues. Because the function of DOCK7 is not extensively
studied, I decided to perform mass spectrometry on DOCK7 in order to identify novel
interactors and potential regulators. Flag-tagged DOCK7 was expressed in HEK293T cells
and mass spectrometry was performed on the anti-Flag precipitate. Proteins from the LRCH
family were enriched in the precipitates (Table 3). Very little is known about this family of
proteins. The Drosophila Lrch protein contains a repetition of protein-interaction LRR domain
at the N-term and a single actin-binding CH domain at the C-term (Foussard et al., 2010) (Fig.
7). Depletion of Lrch in Drosophila leads to defects in mitosis. Furthermore, genetic variation
of one of the human homologues, LRCH1, is associated with osteoarthritis (Spector et al.,
2006). Thus, it is possible that MOB1B controls cytoskeleton via regulating the interaction
between DOCK7 and the LRCH family proteins, and they may play a role in the development
of osteoarthritis.

M. Sc. Thesis – Fang Yuan University of Toronto, Molecular Genetics
28
4 DISCUSSION
4.1 Mass spectrometry
I picked nine proteins from the Hippo signaling pathway as the basis of my mass
spectrometry study. Out of all the hits identified, one might notice that only a few are
involved in polarity complexes which have been traditionally shown to regulate Hippo
signaling. One explanation is that the regulatory mechanism of the Hippo pathway in
HEK293 cells is not well understood. Seeing that the HEK293 cells are not a typical
columnar epithelial cell line, it is likely that the Hippo pathway in HEK293 cells is not
mainly regulated by the polarity complexes. Thus, HEK293 cells might not be the ideal
system to uncover novel polarity-related regulators of the Hippo pathway. In fact, to address
the aforementioned problem of poorly-assembled polarity complexes in HEK293 cells, I
explored the possibility of implementing the T-Rex FLP system in other more-epithelial-like
cell lines, for example the Eph4 murine mammary epithelial cells, but failed to obtain any
surviving clones upon selection, most likely due to poor transfection efficiency in Eph4
cells.
4.2 DOCK7 failed to change Hippo signaling
In this study, I decided to pursue the novel hit DOCK7 to study its role in Hippo
pathway signaling. I first confirmed that DOCK7 interacts with MOB1A/B. Furthermore, I
showed that the interaction depends on two evolutionarily-conserved residues that are
phosphorylated by MST1/2. This interesting data suggests that in additional to the canonical
Hippo signaling branch where MST1/2 stimulates the activity of LATS1/2, there might be
another non-canonical signaling branch where MST1/2 stimulates the activity of DOCK7.

M. Sc. Thesis – Fang Yuan University of Toronto, Molecular Genetics
29
Disappointingly, most other data was negative, especially ones concerning the
functions of DOCK7 and its relationship with the Hippo pathway. I first hypothesized that
DOCK7 regulates the Hippo signaling. The first such experiment was the TEAD-reporter
assay in which over-expression of neither DOCK7 nor MOB1 resulted any change in
luciferase expression (Fig. 4d). In this case, the limitations of this assay system must be
taken into account before making any conclusions from these negative data. First, as
mentioned before, the regulation of Hippo pathway in HEK293T cells differs from that in
epithelial cell lines due to poorly assembled polarity complexes. One can imagine that if
DOCK7 operates only within the context of the polarity arm of Hippo regulation, then any
effects it might have on the Hippo pathway will be diminished in HEK293T cells. Second,
the artificial reporter system used in this assay contains five concatamerized TEAD binding
sites, which may render the system too sensitive to detect any change in YAP/TAZ level even
when Hippo signaling is altered (i.e. signal saturation). Indeed, expressing LATS1 in this
system reduced the reporter signals by a mere ~40% (Fig. 4d). Therefore, if DOCK7
activates the Hippo pathway (thus reducing the nuclear YAP/TAZ level), such effects might
not be detected by this system.
I then switched to the more robust Eph4 cells and examined the endogenous
localization of YAP/TAZ when changing the level of DOCK7. Again, the results were
negative (Fig. 5). However, it is still difficult to draw a definitive conclusion on whether
DOCK7 truly regulates the Hippo pathway given the negative data. First, as mentioned
before, despite great knockdown at the RNA level, how much the protein level was reduced
remains unknown due to lack of good antibodies. Especially at high cell density where cell

M. Sc. Thesis – Fang Yuan University of Toronto, Molecular Genetics
30
division rate is low and the protein turnover rate is reduced, the levels of some junctional
protein remain comparatively high despite greatly reduced RNA level. Seeing that DOCK7
has been shown to localize at junctions, it is possible that the reduction at the protein level of
DOCK7 is too insignificant to produce a phenotype even after greater than 80% RNA
knockdown. Second, close homologues of DOCK7, for example DOCK6 and DOCK8,
might compensate the loss of DOCK7 even assuming the protein level of DOCK7 was
reduced significantly. Both proteins are GEF proteins and DOCK8 have also been shown to
bind MOB1(Mou et al., 2012). Therefore, double or even triple knockdown against DOCK7
and its two homologues in Eph4 cells need to be carried out in order to definitively conclude
whether DOCK7 truly has any effects on Hippo signaling. Lastly, it is possible that
endogenous DOCK7 in Eph4 cells is already working at full capacity. If so, any additional
DOCK7 transfected into the system will not produce any significant effects because the
system is already saturated.
4.3 Hippo signaling failed to change DOCK7 activity
Since no definitive conclusions can be drawn on whether DOCK7 regulates the
Hippo signaling, I asked whether the Hippo signaling regulates the activity of DOCK7.
Again, few positive data was generated. First, I wasn’t able to show that DOCK7 acts as a
GEF protein in a biochemical assay as reported in other literature (Fig. 6a). One possibility
of seeing no phenotype is that this particular experiment examines the total endogenous level
of RAC1-GTP from all cells, but only a fraction of cells are transfected with the DOCK7 or
MOB1 vectors. One can imagine that even if the RAC1-GTP level did increase in these
M. Sc. Thesis – Fang Yuan University of Toronto, Molecular Genetics
31
transfected cells, it might not be strong enough to influence the total level of RAC1-GTP.
Therefore, it might be better in this case to co-transfect with exogenous RAC1 and examine
the exogenous level of RAC1-GTP.
Neither DOCK7 nor MOB1 produced any significant changes in the axon assay
either (Fig. 6). One possible reason could be that in the original paper, overexpressed
DOCK7 was shown to promote axon formation in embryonic hippocampal neurons (Watabe-
Uchida et al., 2006), whereas I used the embryonic cortical neurons. The subtle differences
between these two biological systems might result in different biological roles of DOCK7.
5 CONCLUSION
Through my MS studies, I identified more than 250 interactors for the main Hippo
pathway components. Protein-centric and function-centric analyses of these interactors
allowed me to infer proteins and processes that likely are important for the regulation of the
Hippo pathway, including several proteins which have not previously been shown to play roles
in Hippo regulation. For example, the Scribble complex DLG5 was identified as a novel
interactor of MST1/2. It may therefore be interesting to learn whether the Scribble complex
plays a role in regulating the Hippo pathway in mammals.
Among the novel interactors identified, I decided to pursue DOCK7 which interacts with
MOB1A/B. DOCK7 is a GEF protein for small G protein RAC1 and CDC42. After manually
confirming the DOCK7-MOB1 interaction using western blot, I further showed that this
interaction is regulated by a MST1/2-dependent phosphorylation event on two threonine
residues on MOB1. I was not able to conclude whether MOB1 regulates the GEF activity of

M. Sc. Thesis – Fang Yuan University of Toronto, Molecular Genetics
32
DOCK7, most likely due to the limitation of the PBD pull-down assay.
I initially hypothesized that DOCK7 might be a novel regulator of the Hippo pathway.
Disappointingly, neither using a reporter assay system in HEK293T cells nor examining
endogenous YAP/TAZ localization in the more epithelial-like Eph4 cells did I observe any
change in Hippo signaling upon changing the level of DOCK7. Possible explanations include
insufficient knockdown at protein level, or compensation from close homologues DOCK6 and
DOCK8.
I next hypothesized that MOB1 might regulate DOCK7 in Hippo-independent functions.
DOCK7 has been shown to promote axon formation. Utilizing an in vitro embryonic cortical
neuron system, I was not able to show that expressing either DOCK7 or MOB1 has any effects
on axon growth. It is possible that hippocampal neurons were used instead of cortical neurons
in the original study where they showed the axon-promoting effects of DOCK7. The subtle
differences between cortical neurons and hippocampal neurons may be why I did not see any
phenotype.
Another possibility of producing no observable phenotypes in neurons is that MOB1B
controls other DOCK7 activity. MS performed on DOCK7 revealed that DOCK7 interacts
with proteins from the LRCH family. These proteins are involved in cytoskeleton
reorganization. Thus, it is possible that MOB1B controls cytoskeleton via regulating the
interaction between DOCK7 and the LRCH family proteins independent of RAC1.
I would also like to use this opportunity to comment on some improvements and future
experiments that could be carried out. As mentioned in the Discussion section, a huge
weakness in my study is the lack of a good DOCK7 antibody. Without it, no solid conclusions
can be drawn from any experiments involving knocking down endogenous DOCK7, which is

M. Sc. Thesis – Fang Yuan University of Toronto, Molecular Genetics
33
one of the most important experiments to demonstrate any biological functions of DOCK7. In
addition to definitively show that the knockdown worked at the protein level, a good DOCK7
antibody will also allow us to visualize the change in endogenous localization of DOCK7 in
cells where transfection efficiency is low and western blot might not be representative of the
transfected cells (i.e. primary neurons). Therefore, a good DOCK7 antibody must be acquired
before performing any future experiments.
Furthermore, choosing to work on the primary neurons right from the start might not be
the wisest choice in retrospect. Working on these primary neurons are expensive, time
consuming, and requires more than a fair amount of experience. As suggested by my
committee member Dr. Kaplan, there are many neuronal cell lines available that mimic the
axonal growth in primary neurons. If I could’ve restarted over on this project, I would’ve
definitely tested the effect of DOCK7 on these cell lines first before moving on to the primary
neurons.
Lastly, I want to emphasize that DOCK7 is not the only novel hit identified from the
mass spectrometry study. DLG5, for example, is another interesting novel interactor of
MST1/2. In fact, DLG5 is a polarity-related protein, and polarity complexes have always been
implicated in Hippo pathway regulation. One can imagine that DLG5 is a novel regulator of
MST1/2. Similar experiments could be applied to study how DLG5 regulates the Hippo
signaling, using assays such as the TEAD reporter assay, or examining the endogenous
YAP/TAZ localization upon DLG5 knocking down in Eph4 cells.
5. REFERENCES
Alarcon, C., Zaromytidou, A.I., Xi, Q., Gao, S., Yu, J., Fujisawa, S., Barlas, A., Miller, A.N.,

M. Sc. Thesis – Fang Yuan University of Toronto, Molecular Genetics
34
Manova-Todorova, K., Macias, M.J., et al. (2009). Nuclear CDKs drive Smad transcriptional
activation and turnover in BMP and TGF-beta pathways. Cell 139, 757-769.
Allen, N.P., Donninger, H., Vos, M.D., Eckfeld, K., Hesson, L., Gordon, L., Birrer, M.J.,
Latif, F., and Clark, G.J. (2007). RASSF6 is a novel member of the RASSF family of tumor
suppressors. Oncogene 26, 6203-6211.
Bao, Y., Sumita, K., Kudo, T., Withanage, K., Nakagawa, K., Ikeda, M., Ohno, K., Wang, Y.,
and Hata, Y. (2009). Roles of mammalian sterile 20-like kinase 2-dependent
phosphorylations of Mps one binder 1B in the activation of nuclear Dbf2-related kinases.
Genes Cells 14, 1369-1381.
Barrios-Rodiles, M., Brown, K.R., Ozdamar, B., Bose, R., Liu, Z., Donovan, R.S., Shinjo, F.,
Liu, Y., Dembowy, J., Taylor, I.W., et al. (2005). High-throughput mapping of a dynamic
signaling network in mammalian cells. Science 307, 1621-1625.
Blasius, A.L., Brandl, K., Crozat, K., Xia, Y., Khovananth, K., Krebs, P., Smart, N.G.,
Zampolli, A., Ruggeri, Z.M., and Beutler, B.A. (2009). Mice with mutations of Dock7 have
generalized hypopigmentation and white-spotting but show normal neurological function.
Proceedings of the National Academy of Sciences of the United States of America 106,
2706-2711.
Callus, B.A., Verhagen, A.M., and Vaux, D.L. (2006). Association of mammalian sterile
twenty kinases, Mst1 and Mst2, with hSalvador via C-terminal coiled-coil domains, leads to
its stabilization and phosphorylation. Febs J 273, 4264-4276.
Chan, E.H., Nousiainen, M., Chalamalasetty, R.B., Schafer, A., Nigg, E.A., and Sillje, H.H.
(2005). The Ste20-like kinase Mst2 activates the human large tumor suppressor kinase Lats1.
Oncogene 24, 2076-2086.

M. Sc. Thesis – Fang Yuan University of Toronto, Molecular Genetics
35
Cordenonsi, M., Zanconato, F., Azzolin, L., Forcato, M., Rosato, A., Frasson, C., Inui, M.,
Montagner, M., Parenti, A.R., Poletti, A., et al. (2011). The Hippo transducer TAZ confers
cancer stem cell-related traits on breast cancer cells. Cell 147, 759-772.
Cui, C.B., Cooper, L.F., Yang, X., Karsenty, G., and Aukhil, I. (2003). Transcriptional
coactivation of bone-specific transcription factor Cbfa1 by TAZ. Mol Cell Biol 23, 1004-
1013.
Di Palma, T., D'Andrea, B., Liguori, G.L., Liguoro, A., de Cristofaro, T., Del Prete, D.,
Pappalardo, A., Mascia, A., and Zannini, M. (2009). TAZ is a coactivator for Pax8 and TTF-
1, two transcription factors involved in thyroid differentiation. Experimental cell research
315, 162-175.
Dong, J., Feldmann, G., Huang, J., Wu, S., Zhang, N., Comerford, S.A., Gayyed, M.F.,
Anders, R.A., Maitra, A., and Pan, D. (2007). Elucidation of a universal size-control
mechanism in Drosophila and mammals. Cell 130, 1120-1133.
Dupont, S., Morsut, L., Aragona, M., Enzo, E., Giulitti, S., Cordenonsi, M., Zanconato, F.,
Le Digabel, J., Forcato, M., Bicciato, S., et al. (2011). Role of YAP/TAZ in
mechanotransduction. Nature 474, 179-183.
Fan, R., Kim, N.G., and Gumbiner, B.M. (2013). Regulation of Hippo pathway by mitogenic
growth factors via phosphoinositide 3-kinase and phosphoinositide-dependent kinase-1.
Proceedings of the National Academy of Sciences of the United States of America 110,
2569-2574.
Review: Fekete, S., Veuthey, J.L., and Guillarme, D. (2012). New trends in reversed-phase
liquid chromatographic separations of therapeutic peptides and proteins: theory and
applications. J Pharm Biomed Anal 69, 9-27.

M. Sc. Thesis – Fang Yuan University of Toronto, Molecular Genetics
36
Review: Foussard, H., Ferrer, P., Valenti, P., Polesello, C., Carreno, S., and Payre, F. (2010).
LRCH proteins: a novel family of cytoskeletal regulators. PLoS One 5, e12257.
Review: Fromont-Racine, M., Rain, J.C., and Legrain, P. (1997). Toward a functional
analysis of the yeast genome through exhaustive two-hybrid screens. Nature genetics 16,
277-282.
Grzeschik, N.A., Parsons, L.M., Allott, M.L., Harvey, K.F., and Richardson, H.E. (2010).
Lgl, aPKC, and Crumbs regulate the Salvador/Warts/Hippo pathway through two distinct
mechanisms. Current biology : CB 20, 573-581.
Hamaratoglu, F., Willecke, M., Kango-Singh, M., Nolo, R., Hyun, E., Tao, C., Jafar-Nejad,
H., and Halder, G. (2006). The tumour-suppressor genes NF2/Merlin and Expanded act
through Hippo signalling to regulate cell proliferation and apoptosis. Nature cell biology 8,
27-36.
Hong, J.H., Hwang, E.S., McManus, M.T., Amsterdam, A., Tian, Y., Kalmukova, R.,
Mueller, E., Benjamin, T., Spiegelman, B.M., Sharp, P.A., et al. (2005). TAZ, a
transcriptional modulator of mesenchymal stem cell differentiation. Science 309, 1074-1078.
Huang, J., Wu, S., Barrera, J., Matthews, K., and Pan, D. (2005). The Hippo signaling
pathway coordinately regulates cell proliferation and apoptosis by inactivating Yorkie, the
Drosophila Homolog of YAP. Cell 122, 421-434.
Hwang, E., Ryu, K.S., Paakkonen, K., Guntert, P., Cheong, H.K., Lim, D.S., Lee, J.O., Jeon,
Y.H., and Cheong, C. (2007). Structural insight into dimeric interaction of the SARAH
domains from Mst1 and RASSF family proteins in the apoptosis pathway. Proceedings of the
National Academy of Sciences of the United States of America 104, 9236-9241.
Jeong, H., Bae, S., An, S.Y., Byun, M.R., Hwang, J.H., Yaffe, M.B., Hong, J.H., and Hwang,

M. Sc. Thesis – Fang Yuan University of Toronto, Molecular Genetics
37
E.S. (2010). TAZ as a novel enhancer of MyoD-mediated myogenic differentiation. FASEB
journal : official publication of the Federation of American Societies for Experimental
Biology 24, 3310-3320.
Jiang, Z., Li, X., Hu, J., Zhou, W., Jiang, Y., Li, G., and Lu, D. (2006). Promoter
hypermethylation-mediated down-regulation of LATS1 and LATS2 in human astrocytoma.
Neurosci Res 56, 450-458.
Lai, D., Ho, K.C., Hao, Y., and Yang, X. (2011). Taxol resistance in breast cancer cells is
mediated by the hippo pathway component TAZ and its downstream transcriptional targets
Cyr61 and CTGF. Cancer research 71, 2728-2738.
Liu, G., Zhang, J., Larsen, B., Stark, C., Breitkreutz, A., Lin, Z.Y., Breitkreutz, B.J., Ding,
Y., Colwill, K., Pasculescu, A., et al. (2010a). ProHits: integrated software for mass
spectrometry-based interaction proteomics. Nat Biotechnol 28, 1015-1017.
Liu, Y., Xin, Y., Ye, F., Wang, W., Lu, Q., Kaplan, H.J., and Dean, D.C. (2010b). Taz-tead1
links cell-cell contact to zeb1 expression, proliferation, and dedifferentiation in retinal
pigment epithelial cells. Invest Ophthalmol Vis Sci 51, 3372-3378.
Mahoney, W.M., Jr., Hong, J.H., Yaffe, M.B., and Farrance, I.K. (2005). The transcriptional
co-activator TAZ interacts differentially with transcriptional enhancer factor-1 (TEF-1)
family members. The Biochemical journal 388, 217-225.
Mou, F., Praskova, M., Xia, F., Van Buren, D., Hock, H., Avruch, J., and Zhou, D. (2012).
The Mst1 and Mst2 kinases control activation of rho family GTPases and thymic egress of
mature thymocytes. J Exp Med.
Murakami, M., Nakagawa, M., Olson, E.N., and Nakagawa, O. (2005). A WW domain
protein TAZ is a critical coactivator for TBX5, a transcription factor implicated in Holt-

M. Sc. Thesis – Fang Yuan University of Toronto, Molecular Genetics
38
Oram syndrome. Proceedings of the National Academy of Sciences of the United States of
America 102, 18034-18039.
Nishioka, N., Inoue, K., Adachi, K., Kiyonari, H., Ota, M., Ralston, A., Yabuta, N., Hirahara,
S., Stephenson, R.O., Ogonuki, N., et al. (2009). The Hippo signaling pathway components
Lats and Yap pattern Tead4 activity to distinguish mouse trophectoderm from inner cell
mass. Developmental cell 16, 398-410.
Park, K.S., Whitsett, J.A., Di Palma, T., Hong, J.H., Yaffe, M.B., and Zannini, M. (2004).
TAZ interacts with TTF-1 and regulates expression of surfactant protein-C. The Journal of
biological chemistry 279, 17384-17390.
Praskova, M., Xia, F., and Avruch, J. (2008). MOBKL1A/MOBKL1B phosphorylation by
MST1 and MST2 inhibits cell proliferation. Current biology : CB 18, 311-321.
Ribeiro, P.S., Josue, F., Wepf, A., Wehr, M.C., Rinner, O., Kelly, G., Tapon, N., and Gstaiger,
M. (2010). Combined functional genomic and proteomic approaches identify a PP2A
complex as a negative regulator of Hippo signaling. Molecular cell 39, 521-534.
Silvis, M.R., Kreger, B.T., Lien, W.H., Klezovitch, O., Rudakova, G.M., Camargo, F.D.,
Lantz, D.M., Seykora, J.T., and Vasioukhin, V. (2011). alpha-catenin is a tumor suppressor
that controls cell accumulation by regulating the localization and activity of the
transcriptional coactivator Yap1. Sci Signal 4, ra33.
Spector, T.D., Reneland, R.H., Mah, S., Valdes, A.M., Hart, D.J., Kammerer, S., Langdown,
M., Hoyal, C.R., Atienza, J., Doherty, M., et al. (2006). Association between a variation in
LRCH1 and knee osteoarthritis: a genome-wide single-nucleotide polymorphism association
study using DNA pooling. Arthritis Rheum 54, 524-532.
Review: Stanger, B.Z. (2008). Organ size determination and the limits of regulation. Cell

M. Sc. Thesis – Fang Yuan University of Toronto, Molecular Genetics
39
Cycle 7, 318-324.
Review: Stephenson, R.O., Rossant, J., and Tam, P.P. (2012). Intercellular interactions,
position, and polarity in establishing blastocyst cell lineages and embryonic axes. Cold
Spring Harb Perspect Biol 4.
Striedinger, K., VandenBerg, S.R., Baia, G.S., McDermott, M.W., Gutmann, D.H., and Lal,
A. (2008). The neurofibromatosis 2 tumor suppressor gene product, merlin, regulates human
meningioma cell growth by signaling through YAP. Neoplasia 10, 1204-1212.
Tao, W., Zhang, S., Turenchalk, G.S., Stewart, R.A., St John, M.A., Chen, W., and Xu, T.
(1999). Human homologue of the Drosophila melanogaster lats tumour suppressor
modulates CDC2 activity. Nature genetics 21, 177-181.
Tomlinson, V., Gudmundsdottir, K., Luong, P., Leung, K.Y., Knebel, A., and Basu, S. (2010).
JNK phosphorylates Yes-associated protein (YAP) to regulate apoptosis. Cell Death Dis 1,
e29.
Review: van Gool, A.J., and Hendrickson, R.C. (2012). The proteomic toolbox for studying
cerebrospinal fluid. Expert Rev Proteomics 9, 165-179.
Varelas, X., Miller, B.W., Sopko, R., Song, S., Gregorieff, A., Fellouse, F.A., Sakuma, R.,
Pawson, T., Hunziker, W., McNeill, H., et al. (2010a). The Hippo pathway regulates
Wnt/beta-catenin signaling. Dev Cell 18, 579-591.
Varelas, X., Sakuma, R., Samavarchi-Tehrani, P., Peerani, R., Rao, B.M., Dembowy, J.,
Yaffe, M.B., Zandstra, P.W., and Wrana, J.L. (2008). TAZ controls Smad nucleocytoplasmic
shuttling and regulates human embryonic stem-cell self-renewal. Nature cell biology 10,
837-848.
Varelas, X., Samavarchi-Tehrani, P., Narimatsu, M., Weiss, A., Cockburn, K., Larsen, B.G.,

M. Sc. Thesis – Fang Yuan University of Toronto, Molecular Genetics
40
Rossant, J., and Wrana, J.L. (2010b). The Crumbs complex couples cell density sensing to
Hippo-dependent control of the TGF-beta-SMAD pathway. Developmental cell 19, 831-844.
Varelas, X., Samavarchi-Tehrani, P., Narimatsu, M., Weiss, A., Cockburn, K., Larsen, B.G.,
Rossant, J., and Wrana, J.L. (2010c). The Crumbs complex couples cell density sensing to
Hippo-dependent control of the TGF-beta-SMAD pathway. Dev Cell 19, 831-844.
Ward, R.J., Alvarez-Curto, E., and Milligan, G. (2011). Using the Flp-In T-Rex system to
regulate GPCR expression. Methods Mol Biol 746, 21-37.
Watabe-Uchida, M., John, K.A., Janas, J.A., Newey, S.E., and Van Aelst, L. (2006). The Rac
activator DOCK7 regulates neuronal polarity through local phosphorylation of
stathmin/Op18. Neuron 51, 727-739.
Willecke, M., Hamaratoglu, F., Sansores-Garcia, L., Tao, C., and Halder, G. (2008).
Boundaries of Dachsous Cadherin activity modulate the Hippo signaling pathway to induce
cell proliferation. Proceedings of the National Academy of Sciences of the United States of
America 105, 14897-14902.
Wu, S., Huang, J., Dong, J., and Pan, D. (2003). hippo encodes a Ste-20 family protein
kinase that restricts cell proliferation and promotes apoptosis in conjunction with salvador
and warts. Cell 114, 445-456.
Yamauchi, J., Miyamoto, Y., Hamasaki, H., Sanbe, A., Kusakawa, S., Nakamura, A.,
Tsumura, H., Maeda, M., Nemoto, N., Kawahara, K., et al. (2011). The atypical Guanine-
nucleotide exchange factor, dock7, negatively regulates schwann cell differentiation and
myelination. The Journal of neuroscience : the official journal of the Society for
Neuroscience 31, 12579-12592.
Yu, F.X., Zhao, B., Panupinthu, N., Jewell, J.L., Lian, I., Wang, L.H., Zhao, J., Yuan, H.,
M. Sc. Thesis – Fang Yuan University of Toronto, Molecular Genetics
41
Tumaneng, K., Li, H., et al. (2012). Regulation of the Hippo-YAP pathway by G-protein-
coupled receptor signaling. Cell 150, 780-791.
Zender, L., Spector, M.S., Xue, W., Flemming, P., Cordon-Cardo, C., Silke, J., Fan, S.T.,
Luk, J.M., Wigler, M., Hannon, G.J., et al. (2006). Identification and validation of oncogenes
in liver cancer using an integrative oncogenomic approach. Cell 125, 1253-1267.
Zhang, J., Ji, J.Y., Yu, M., Overholtzer, M., Smolen, G.A., Wang, R., Brugge, J.S., Dyson,
N.J., and Haber, D.A. (2009). YAP-dependent induction of amphiregulin identifies a non-
cell-autonomous component of the Hippo pathway. Nature cell biology 11, 1444-1450.
Review: Zhao, B., Li, L., Lei, Q., and Guan, K.L. (2010a). The Hippo-YAP pathway in
organ size control and tumorigenesis: an updated version. Genes Dev 24, 862-874.
Zhao, B., Li, L., Lu, Q., Wang, L.H., Liu, C.Y., Lei, Q., and Guan, K.L. (2011). Angiomotin
is a novel Hippo pathway component that inhibits YAP oncoprotein. Genes & development
25, 51-63.
Zhao, B., Li, L., Tumaneng, K., Wang, C.Y., and Guan, K.L. (2010b). A coordinated
phosphorylation by Lats and CK1 regulates YAP stability through SCF(beta-TRCP). Genes
& development 24, 72-85.
Zhao, B., Ye, X., Yu, J., Li, L., Li, W., Li, S., Lin, J.D., Wang, C.Y., Chinnaiyan, A.M., Lai,
Z.C., et al. (2008). TEAD mediates YAP-dependent gene induction and growth control.
Genes & development 22, 1962-1971.

M. Sc. Thesis – Fang Yuan University of Toronto, Molecular Genetics
42
6. FIGURES
Figure 1. The core Hippo pathway signaling cascade. Upon activation, MST1/2 phosphorylate
and activate LATS1/2 with the aid of the adaptor proteins SAV1. Activated MST1/2 also
phosphorylate MOB1A/B, resulting in an enhanced LATS1/2–Mob1 interaction which leads
to an enhanced LATS1/2 activity. Activated LATS1/2 in turn phosphorylate YAP/TAZ.
Phosphorylation of YAP/TAZ is inhibitory to their transcriptional functions because such
phosphorylation promotes 14-3-3 binding and subsequent cytoplasmic sequestration.
Phosphorylation of YAP/TAZ on the same sites can also induce their degradation by the E3
ubiquitin ligase SCFβ–TRCP. When the Hippo pathway is inactive, YAP/TAZ become more
stable and translocate into the nucleus to perform their functions as transcriptional co-
activators. YAP/TAZ are known to bind a variety of transcriptional factors including TEAD,
Smad2/3, p73, and β-catenin, most of which have been implicated in promoting tumor
development, thus making the Hippo pathway a tumor suppressor pathway. (Zhao, 2010)
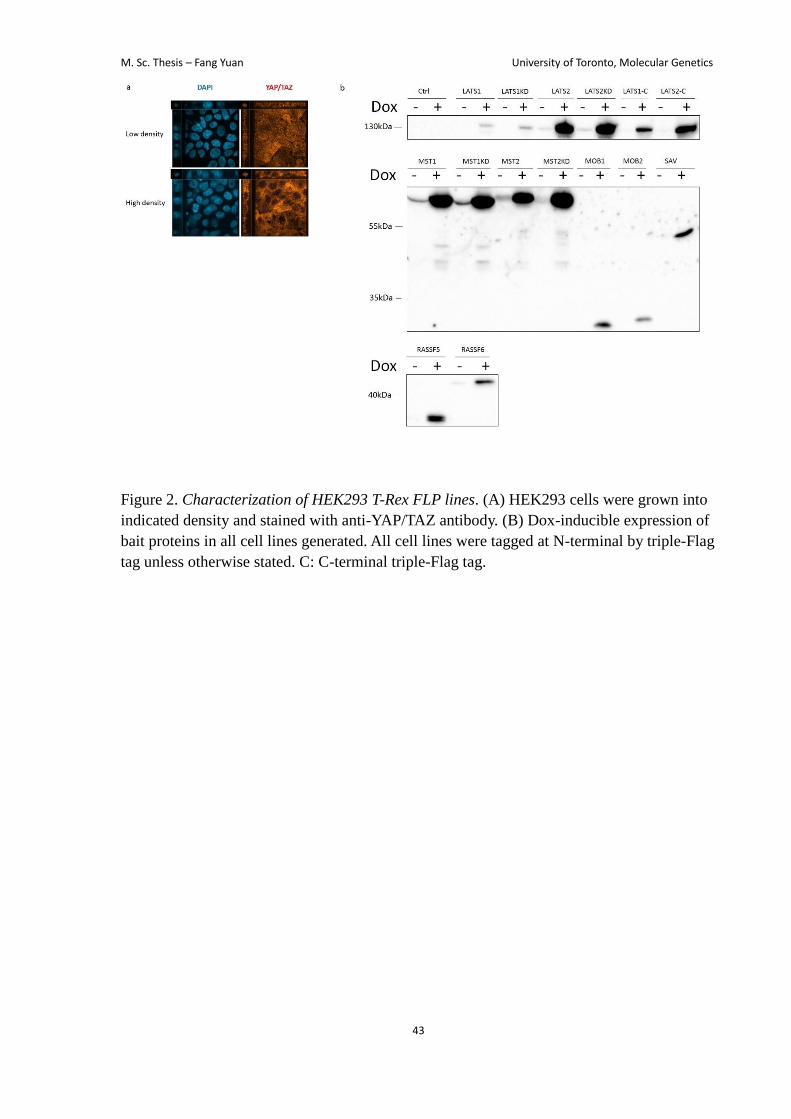
M. Sc. Thesis – Fang Yuan University of Toronto, Molecular Genetics
43
Figure 2. Characterization of HEK293 T-Rex FLP lines. (A) HEK293 cells were grown into
indicated density and stained with anti-YAP/TAZ antibody. (B) Dox-inducible expression of
bait proteins in all cell lines generated. All cell lines were tagged at N-terminal by triple-Flag
tag unless otherwise stated. C: C-terminal triple-Flag tag.

M. Sc. Thesis – Fang Yuan University of Toronto, Molecular Genetics
44
Figure 3. Summary of the mass spectrometry study. (A) HEK293 cell lines expressing triple-
Flag tagged Hippo components were generated. Cells were lysed after 16 hours incubation of
1uM doxycycline. Anti-Flag affinity purification was performed on three independent
biological samples. Proteins were identified using mass spectrometry and the list was filtered
using the parameters described in the text. (C) Protein-protein interaction map generated for
all bait proteins using Cytoscape. Circles represent proteins and lines represent interactions.
Blue circles represent bait proteins and green circles represent interactors. Red lines
represent known interactions and blue lines represent novel interactions. The STRIPAK
complex is highlighted in pink. (D) Functional clustering pie-chart of all interactors. All
interactors were annotated using the GO terms and the pie chart was generated based on the
percentage of proteins in each category. Representative proteins in each category were listed.

M. Sc. Thesis – Fang Yuan University of Toronto, Molecular Genetics
45
Figure 4. The role of DOCK7 in regulating the Hippo pathway remains unclear. (A)
Schematics of different DOCK7 constructs. (B) MST1 stimulates MOB1 phosphorylation.
HEK293T cells were transfected with the indicated plasmids. After 48 hours, the cells were
lysed and endogenous p-MOB1T12 was probed using the antibody described. The ratio of p-
MOB1T12 in the pull-down fraction relative to the MOB1 in the total lysate of the control
cells was set to one; other ratios were normalized to this value. (C) DOCK7 binds
specifically to phospho-Mob1. HEK293T cells were co-transfected with HA-MOB1B WT or
HA-MOB1B[Thr12Ala/Thr35Ala], and Flag-DOCK7. After 48 hours, the cells were lysed
and subjected to anti-Flag immunoprecipitation, and the presence of MOB1B was assessed
by anti-HA immunoblotting. (D) DOCK7 did not change luciferase level in the TEAD
reporter assay. HEK293T cells were co-transfected with PCMV-YFP, 5xTBS-lux, and the
indicated vectors. After 48 hours, the cells were lysed and the luciferase level were measured
and normalized to the YFP level. (E) LATS2, but not LATS2KD increases phosphorylation
of TAZ. HEK293T cells were co-transfected with indicated plasmids and blotted using
indicated antibodies.

M. Sc. Thesis – Fang Yuan University of Toronto, Molecular Genetics
46

M. Sc. Thesis – Fang Yuan University of Toronto, Molecular Genetics
47
Figure 5. The role of DOCK7 in regulating the Hippo pathway in Eph4 cells remains
inconclusive. (A) Eph4 cells were treated with indicated siRNA in either low or high density
and were stained with anti-YAP antibody. The knockdown efficiency is shown in (B). (C)
Eph4 cells were transfected with indicated plasmids in either low or high density and were
stained with anti-YAP antibody.

M. Sc. Thesis – Fang Yuan University of Toronto, Molecular Genetics
48

M. Sc. Thesis – Fang Yuan University of Toronto, Molecular Genetics
49
Figure 6. The role of MOB1 in regulating axon development in embryonic neurons remains
inconclusive. (A) The PBD-pull down assay was not able to conclude the effects of MOB1B
on DOCK7 GEF activity. HEK293T cells were transfected with the indicated plasmids. After
48 hours, the cells were lysed and endogenous RAC1-GTP was pulled down using the PAK-
PBD beads. Immunoblots from one such experiment is shown. Relative level of active
RAC1 was measured from three independent experiments and is shown in (B). (C)
Embryonic cortical neurons transfected with the indicated plasmid were stained 72hrs later
with anti-Tau1 and anti-MAP2 antibodies. (D) Percentage of polarized neurons, identified as
ones containing only one tau-1-positive extension, is shown for different plasmids.

M. Sc. Thesis – Fang Yuan University of Toronto, Molecular Genetics
50
Figure 7. The domain structure of LRCH proteins. All LRCH proteins contain repetition of
LRR domains and one or more CH domains.

M. Sc. Thesis – Fang Yuan University of Toronto, Molecular Genetics
51
7. TABLES
Table 1. Summary of all the high-confidence interactor of the Hippo pathway main components.
Bait=hLATS1 Total Peptide Number Annotation
Gene R1 R2 R3
LATS1 114 105 73 Bait
MOB1B 6 3 Known interactor
FBXO3 5 5 2 Transcription factor
STAU1 2 2 RNA binding
TET2 2 4 2 DNA methylase
Bait=hLATS2 Total Peptide Number
Gene R1 R2 R3
LATS2 390 409 398 Bait
CAD 50 54 27 Metabolism
PDP1 22 4 Metabolism
MOB1B 12 3 5 Known interactor
USP9X 7 8 4 ubiquitin
PRKDC 6 1 8 DNA damage
CPVL 6 3 2 Metabolism
UTRN 5 4 5 Cytoskeleton
STXBP4 5 7 3 Transport
YWHAE 4 3 3 14-3-3
ANAPC1 3 2 2 Cell cycle
YWHAZ 2 3 14-3-3
BAG4 2 2 Chaperone
Bait=hMOB1a Total Peptide Number
MOB1A 30 78 54 Known interactor
LATS1 21 47 47 Known interactor
LATS2 4 12 8 Known interactor
STAU1 3 2 2 RNA binding
PRKDC 2 6 4 DNA damage
DOCK7 2 17 27 Polarity
STK3 8 5 Known interactor
CAD 3 5 Metabolism
TET2 2 2 DNA methylase
TMOD2 2 2 Cytoskeleton
Bait=hMOB1b Total Peptide Number
Gene R1 R2 R3
MOB1b 55 65 42 Bait
LATS1 66 49 45 Known interactor
LATS2 10 16 27 Known interactor
STK3 4 12 Known interactor
STAU1 3 3 RNA binding

M. Sc. Thesis – Fang Yuan University of Toronto, Molecular Genetics
52
PRKDC 3 12 9 DNA damage
YWHAE 3 4 14-3-3
Bait=hRASSF5 Total Peptide Number
Gene R1 R2 R3
RASSF5 131 120 184 Bait
STK3 82 85 126 Known interactor
STK4 78 97 133 Known interactor
MAP1S 45 31 48 Cytoskeleton
PRKDC 11 7 7 DNA damage
KCTD12 5 2 6 Apoptosis
FBXW11 3 3 3 Transcription factor
PDCD6 2 5 6 Apoptosis
PHGDH 2 2 Metabolism
SUGT1 5 9 Metabolism
Bait=mRassf6 Total Peptide Number
Gene R1 R2 R3
STK4 169 142 150 Known interactor
STK3 114 53 53 Known interactor
RASSF6 9 9 8 Bait
CAD 8 8 6 Metabolism
AIFM1 5 4 9 Apoptosis
PSMD1 5 5 Protease
PSMD12 4 4 4 Protease
PRKDC 3 10 6 DNA damage
PSMC4 3 5 5 Protease
CCT2 3 3 2 Metabolism
PSMC5 3 4 Protease
PSMC1 2 2 2 Protease
PSMC2 2 2 2 Protease
PSMC3 3 9 Protease
Bait=hSAV Total Peptide Number
Gene R1 R2 R3
PRKDC 63 44 15 DNA damage
SAV1 57 83 99 Bait
STK3 52 145 57 Known interactor
STK4 44 136 103 Known interactor
CAD 30 58 33 Metabolism
ATAD3A 20 7 Transcription
IRS4 13 10 5 Signaling
SEC16A 7 9 7 Transcription
PHGDH 7 5 Metabolism
AKAP8L 6 15 11
UBR5 6 3 Ubiquitin
SON 5 4 13 Metabolism

M. Sc. Thesis – Fang Yuan University of Toronto, Molecular Genetics
53
RANBP9 5 3 3 Cytoskeleton
PSMD3 4 2 Protease
PCBP2 3 4 3 DNA binding
FANCI 3 4 DNA binding
NUP93 3 3 Transport
EMD 3 3 Metabolism
SSR4 3 2 Transprot
C20orf11 2 8 6
FAM83H 2 3 3 Metabolism
PPP1CA 2 3 Phosphatase
DSP 2 2 3 Polarity
CCT2 6 2 Chaperone
YWHAE 5 5 14-3-3
CCT3 4 3 Chaperone
IQGAP3 4 2 Cytoskeleton
ZNF281 2 6 DNA binding
TCP1 2 6 Metabolism
ASPM 2 4 Cell cycle
YWHAZ 2 3 14-3-3
MOV10 2 3 Metabolism
ATP2A2 2 3 cytoskeleton
YWHAG 2 2 14-3-3
SLC25A3 2 2 Transport
PSMC4 2 2 Proteasome
MATR3 2 2 Cytoskeleton
LARP4B 2 2 Transcription
CCT7 2 2 Metabolism
Bait=hSTK3 Total Peptide Number
Gene R1 R2 R3
STK3 404 472 252
STK4 283 300 148 Known interactor
RASSF2 24 24 39 Known interactor
DLG5 22 9 Polarity
RASSF1 9 36 9 Known interactor
LTK 8 3 Receptor
SAV1 8 12 8 Known interactor
PRKRIR 4 7 Kinase inhibitor
MAP1S 3 10 4 Cytoskeleton
RASSF3 3 4 3 Known interactor
RASSF4 2 5 12 Known interactor
SLMAP 9 13 Known interactor
STRN3 7 8 Known interactor
STRN 7 10 Known interactor
PPP2R1A 4 4 Known interactor

M. Sc. Thesis – Fang Yuan University of Toronto, Molecular Genetics
54
MOB4 3 4 Known interactor
FGFR1OP2 2 4 Known interactor
SCIN 2 3 Lipoprotein
TET2 2 3 DNA methylase
STRN4 2 4 Known interactor
PPP2CA 2 3 Known interactor
Bait=hSTK4 Total Peptide Number
Gene R1 R2 R3
STK4 524 407 397 Bait
STK3 188 171 92 Known interactor
RASSF2 51 40 46 Known interactor
RASSF4 12 6 26 Known interactor
RASSF1 10 10 3 Known interactor
SAV1 10 8 4 Known interactor
RASSF5 5 4 3 Known interactor
STRN 7 11 Known interactor
STRN3 5 3 Known interactor

M. Sc. Thesis – Fang Yuan University of Toronto, Molecular Genetics
55
Table 2. Comparison of the intearctome between wild-type and kinase-dead variant of
MST1/2 and LATS1/2.
Bait=hLATS1 Total Peptide Number (WT) Total Peptide Number (KD)
Gene R1 R2 R3 R1 R2 R3
LATS1 114 105 73 100 88 150
MOB1B 6 3 4 4 2
FBXO3 5 5 2 5 3
STAU1 2 2 1 2 2
TET2 2 4 2 3
Bait=hLATS2 Total Peptide Number (WT) Total Peptide Number (KD)
Gene R1 R2 R3 R1 R2 R3
LATS2 390 409 398 250 400 401
CAD 50 54 27 48 34 36
PDP1 22 4
MOB1B 12 3 5 8 15 12
USP9X 7 8 4
PRKDC 6 1 8 4
CPVL 6 3 2 1 3 3
UTRN 5 4 5 7 2 2
STXBP4 5 7 3
YWHAE 4 3 3 5 1
ANAPC1 3 2 2 2 2 2
YWHAZ 2 3 2 1 1
BAG4 2 2
Bait=hSTK3 Total Peptide Number (WT) Total Peptide Number (KD)
Gene R1 R2 R3 R1 R2 R3
STK3 404 472 252 288 387 347
STK4 283 300 148 300 305 199
RASSF2 24 24 39 30 33 40
DLG5 22 9 11 19 15
RASSF1 9 36 9 19 18
LTK 8 3
SAV1 8 12 8 5 11 11
PRKRIR 4 7 3 7 3
MAP1S 3 10 4 4 15 1
RASSF3 3 4 3 1 1 2
RASSF4 2 5 12 3 7
SLMAP 9 13 8 8 11
STRN3 7 8 1 4 9
STRN 7 10 3 1 10
PPP2R1A 4 4 5 6
MOB4 3 4 2 5 4
FGFR1OP2 2 4 2

M. Sc. Thesis – Fang Yuan University of Toronto, Molecular Genetics
56
SCIN 2 3 4 5 3
TET2 2 3 5 4
STRN4 2 4 1 5 3
PPP2CA 2 3 2 1 3
Bait=hSTK4 Total Peptide Number (WT) Total Peptide Number (KD)
Gene R1 R2 R3 R1 R2 R3
STK4 524 407 397 499 600 577
STK3 188 171 92 158 151 192
RASSF2 51 40 46 41 48 37
RASSF4 12 6 26 14 16
RASSF1 10 10 3
SAV1 10 8 4 11 4 4
RASSF5 5 4 3 15 4
STRN 7 11 1 3 9
STRN3 5 3 1 5 4

M. Sc. Thesis – Fang Yuan University of Toronto, Molecular Genetics
57
Table 3. Comparison of the intearctome between N-term tagged and C-term tagged variant
of LATS1/2.
Bait=hLATS1 Total Peptide Number (N-Term) Total Peptide Number (C-Term)
Gene R1 R2 R3 R1 R2 R3
LATS1 114 105 73 99 153 88
MOB1B 6 3 3
FBXO3 5 5 2 6 1 2
STAU1 2 2 3 3 1
TET2 2 4 2 2 1
Bait=hLATS2 Total Peptide Number (N-Term) Total Peptide Number (C-Term)
Gene R1 R2 R3 R1 R2 R3
LATS2 390 409 398 299 444 345
CAD 50 54 27 20 27
PDP1 22 4 21 19 19
MOB1B 12 3 5 11 13 8
USP9X 7 8 4 9 5
PRKDC 6 1 8 1 1
CPVL 6 3 2 3 2 2
UTRN 5 4 5 4 1
STXBP4 5 7 3 1 1 1
YWHAE 4 3 3 5 5 6
ANAPC1 3 2 2 2 3 5
YWHAZ 2 3
BAG4 2 2 1 1 3
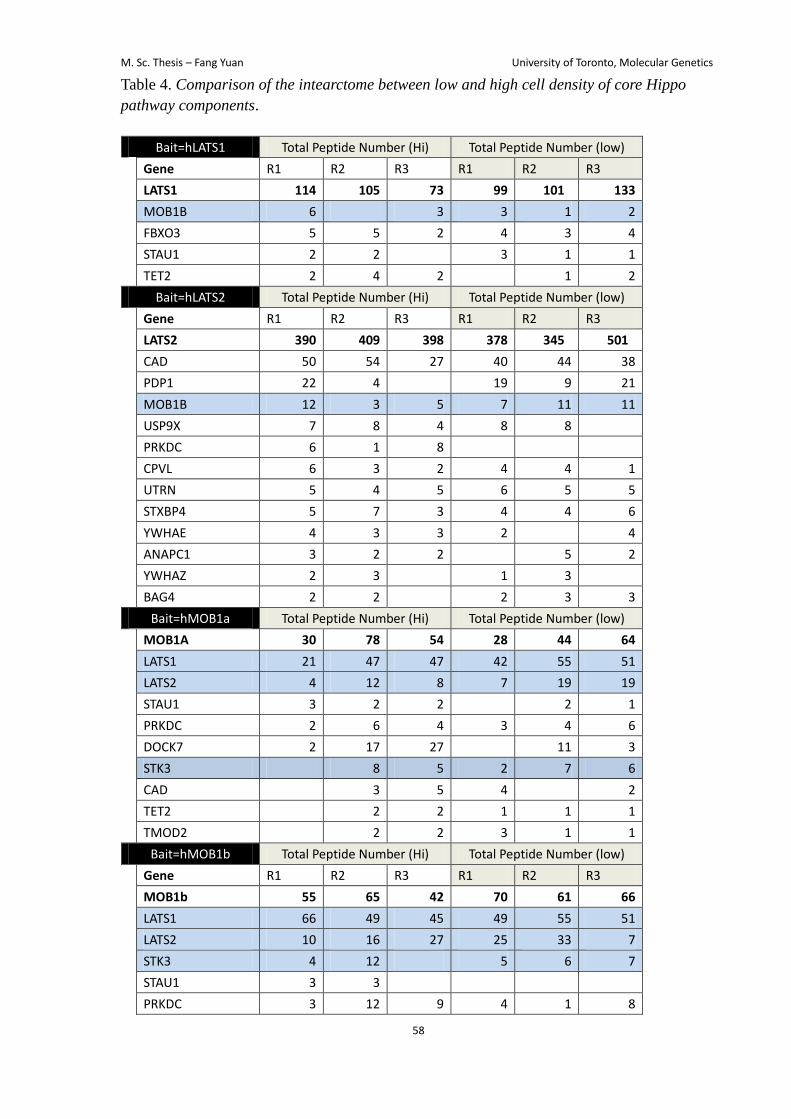
M. Sc. Thesis – Fang Yuan University of Toronto, Molecular Genetics
58
Table 4. Comparison of the intearctome between low and high cell density of core Hippo
pathway components.
Bait=hLATS1 Total Peptide Number (Hi) Total Peptide Number (low)
Gene R1 R2 R3 R1 R2 R3
LATS1 114 105 73 99 101 133
MOB1B 6 3 3 1 2
FBXO3 5 5 2 4 3 4
STAU1 2 2 3 1 1
TET2 2 4 2 1 2
Bait=hLATS2 Total Peptide Number (Hi) Total Peptide Number (low)
Gene R1 R2 R3 R1 R2 R3
LATS2 390 409 398 378 345 501
CAD 50 54 27 40 44 38
PDP1 22 4 19 9 21
MOB1B 12 3 5 7 11 11
USP9X 7 8 4 8 8
PRKDC 6 1 8
CPVL 6 3 2 4 4 1
UTRN 5 4 5 6 5 5
STXBP4 5 7 3 4 4 6
YWHAE 4 3 3 2 4
ANAPC1 3 2 2 5 2
YWHAZ 2 3 1 3
BAG4 2 2 2 3 3
Bait=hMOB1a Total Peptide Number (Hi) Total Peptide Number (low)
MOB1A 30 78 54 28 44 64
LATS1 21 47 47 42 55 51
LATS2 4 12 8 7 19 19
STAU1 3 2 2 2 1
PRKDC 2 6 4 3 4 6
DOCK7 2 17 27 11 3
STK3 8 5 2 7 6
CAD 3 5 4 2
TET2 2 2 1 1 1
TMOD2 2 2 3 1 1
Bait=hMOB1b Total Peptide Number (Hi) Total Peptide Number (low)
Gene R1 R2 R3 R1 R2 R3
MOB1b 55 65 42 70 61 66
LATS1 66 49 45 49 55 51
LATS2 10 16 27 25 33 7
STK3 4 12 5 6 7
STAU1 3 3
PRKDC 3 12 9 4 1 8
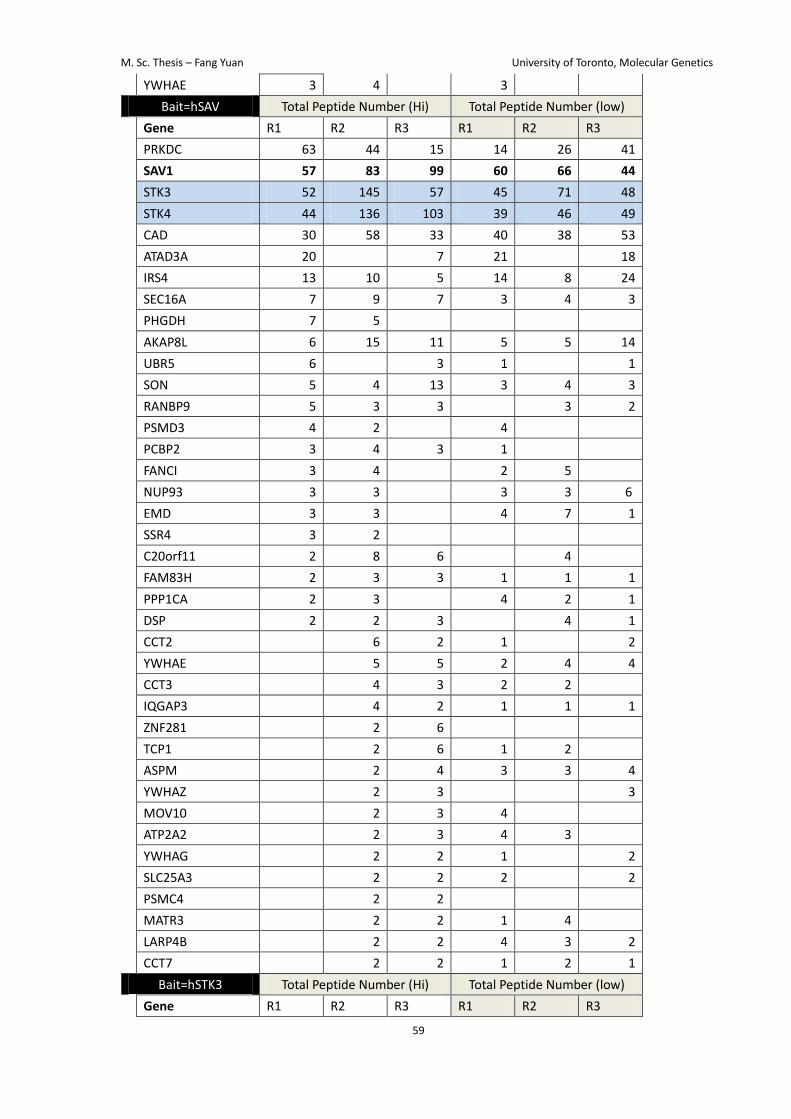
M. Sc. Thesis – Fang Yuan University of Toronto, Molecular Genetics
59
YWHAE 3 4 3
Bait=hSAV Total Peptide Number (Hi) Total Peptide Number (low)
Gene R1 R2 R3 R1 R2 R3
PRKDC 63 44 15 14 26 41
SAV1 57 83 99 60 66 44
STK3 52 145 57 45 71 48
STK4 44 136 103 39 46 49
CAD 30 58 33 40 38 53
ATAD3A 20 7 21 18
IRS4 13 10 5 14 8 24
SEC16A 7 9 7 3 4 3
PHGDH 7 5
AKAP8L 6 15 11 5 5 14
UBR5 6 3 1 1
SON 5 4 13 3 4 3
RANBP9 5 3 3 3 2
PSMD3 4 2 4
PCBP2 3 4 3 1
FANCI 3 4 2 5
NUP93 3 3 3 3 6
EMD 3 3 4 7 1
SSR4 3 2
C20orf11 2 8 6 4
FAM83H 2 3 3 1 1 1
PPP1CA 2 3 4 2 1
DSP 2 2 3 4 1
CCT2 6 2 1 2
YWHAE 5 5 2 4 4
CCT3 4 3 2 2
IQGAP3 4 2 1 1 1
ZNF281 2 6
TCP1 2 6 1 2
ASPM 2 4 3 3 4
YWHAZ 2 3 3
MOV10 2 3 4
ATP2A2 2 3 4 3
YWHAG 2 2 1 2
SLC25A3 2 2 2 2
PSMC4 2 2
MATR3 2 2 1 4
LARP4B 2 2 4 3 2
CCT7 2 2 1 2 1
Bait=hSTK3 Total Peptide Number (Hi) Total Peptide Number (low)
Gene R1 R2 R3 R1 R2 R3

M. Sc. Thesis – Fang Yuan University of Toronto, Molecular Genetics
60
STK3 404 472 252 514 300 445
STK4 283 300 148 199 244 287
RASSF2 24 24 39 40 31 35
DLG5 22 9 19 26 18
RASSF1 9 36 9 3
LTK 8 3 2 4 6
SAV1 8 12 8 7 9 9
PRKRIR 4 7 4 4 4
MAP1S 3 10 4
RASSF3 3 4 3 2 3 1
RASSF4 2 5 12 1 1 1
SLMAP 9 13 7 9 10
STRN3 7 8 2 5
STRN 7 10 2 3
PPP2R1A 4 4
MOB4 3 4 1 4
FGFR1OP2 2 4 5 2 2
SCIN 2 3 2
TET2 2 3 1
STRN4 2 4 4 1
PPP2CA 2 3 2
Bait=hSTK4 Total Peptide Number (Hi) Total Peptide Number (low)
Gene R1 R2 R3 R1 R2 R3
STK4 524 407 397 444 500 517
STK3 188 171 92 190 148 200
RASSF2 51 40 46 70 80 64
RASSF4 12 6 26 20 16 22
RASSF1 10 10 3 14 18 13
SAV1 10 8 4 14 8
RASSF5 5 4 3
STRN 7 11 1 2
STRN3 5 3 4 3 3

M. Sc. Thesis – Fang Yuan University of Toronto, Molecular Genetics
61
Table 5. Interactome of DOCK7
Bait=hDOCK7 Total Peptide Number Annotation
Gene R1 R2 R3
DOCK7 1202 999 1178 Bait
LRCH3 8 8 9 Cytoskeleton
LRCH2 6 7 Cytoskeleton
LRCH4 6 6 5 Cytoskeleton
LRCH1 5 5 Cytoskeleton
AMOT 3 2 Polarity
TET2 3 2 2 Transcription
CDK12 2 2 1 Cell cycle
BAG5 2 2 Chaperone
YWHAZ 2 2 14-3-3
PRKDC 2 2 DNA damage