Embed Size (px)
Citation preview
Characterization of the farming and livestock production systems using the feed assessment tool (FEAST) in selected local government areas of Osun
state, Nigeria
Olaniyi J. Babayemi1, Anandan Samireddypalle2, Adedayo O. Sosina1, Augustine A. Ayantunde2, Iheanacho Okike2, and Alan J. Duncan2
1University of Ibadan 2 International Livestock Research Institute
December 2014
© 2014
This publication is licensed for use under the Creative Commons Attribution-Noncommercial-Share Alike 3.0 Unported Licence. To view this licence, visit http://creativecommons.org/licenses/by-nc-sa/3.0/. Unless otherwise noted, you
are free to copy, duplicate, or reproduce and distribute, display, or transmit any part of this publication or portions thereof without permission, and to make translations, adaptations, or other derivative works under the following conditions:
ATTRIBUTION. The work must be attributed, but not in any way that suggests endorsement by the publisher or the author(s).
NON-COMMERCIAL. This work may not be used for commercial purposes.
SHARE ALIKE. If this work is altered, transformed, or built upon, the resulting work must be distributed only under the same or similar license to this one.
Contents
Introduction ............................................................................................................................................ 1
Methodology ....................................................................................................................................... 2
Respondent selection and data analysis ............................................................................................. 2
Results ..................................................................................................................................................... 3
Land holdings ...................................................................................................................................... 3
Crop production .................................................................................................................................. 4
Livestock production ........................................................................................................................... 7
Feed resources .................................................................................................................................... 8
Purchased feeds ................................................................................................................................ 10
Contribution of major classes of feeds ............................................................................................. 12
Seasonality of feed availability ......................................................................................................... 14
Problems and opportunities in livestock production........................................................................ 16
Summary ............................................................................................................................................... 18
References ............................................................................................................................................ 18
1
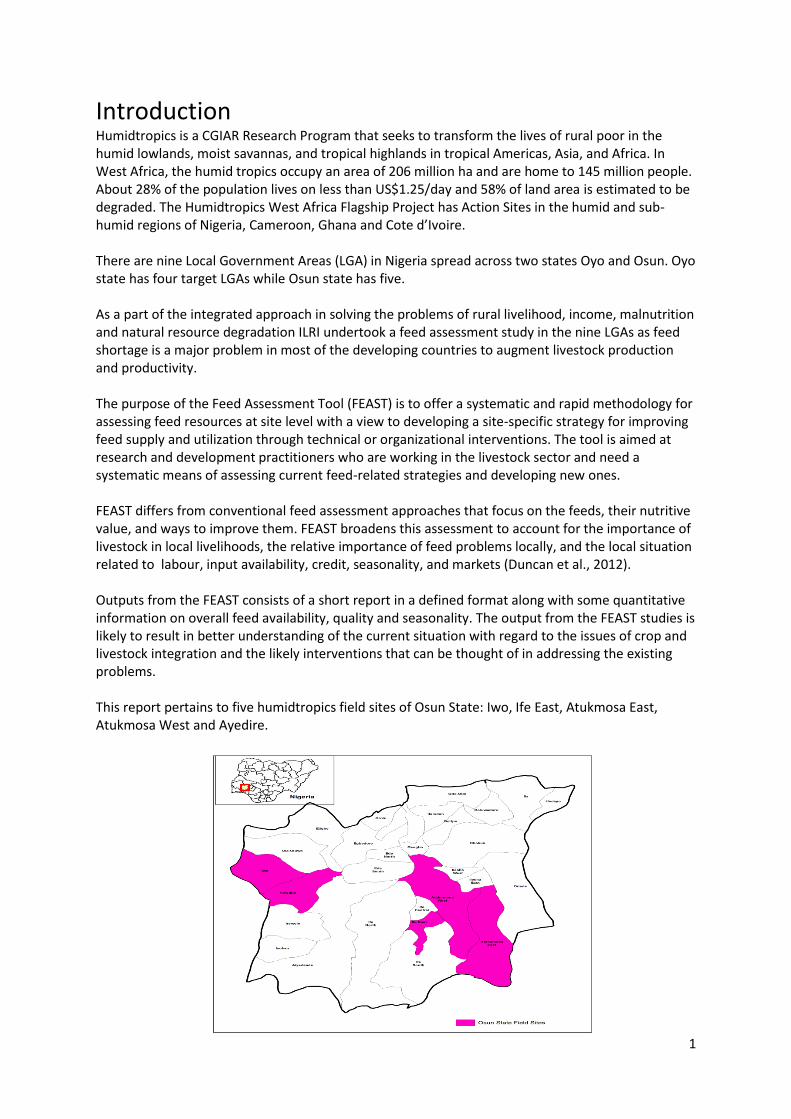
Introduction Humidtropics is a CGIAR Research Program that seeks to transform the lives of rural poor in the humid lowlands, moist savannas, and tropical highlands in tropical Americas, Asia, and Africa. In West Africa, the humid tropics occupy an area of 206 million ha and are home to 145 million people. About 28% of the population lives on less than US$1.25/day and 58% of land area is estimated to be degraded. The Humidtropics West Africa Flagship Project has Action Sites in the humid and sub-humid regions of Nigeria, Cameroon, Ghana and Cote d’Ivoire. There are nine Local Government Areas (LGA) in Nigeria spread across two states Oyo and Osun. Oyo state has four target LGAs while Osun state has five. As a part of the integrated approach in solving the problems of rural livelihood, income, malnutrition and natural resource degradation ILRI undertook a feed assessment study in the nine LGAs as feed shortage is a major problem in most of the developing countries to augment livestock production and productivity. The purpose of the Feed Assessment Tool (FEAST) is to offer a systematic and rapid methodology for assessing feed resources at site level with a view to developing a site-specific strategy for improving feed supply and utilization through technical or organizational interventions. The tool is aimed at research and development practitioners who are working in the livestock sector and need a systematic means of assessing current feed-related strategies and developing new ones. FEAST differs from conventional feed assessment approaches that focus on the feeds, their nutritive value, and ways to improve them. FEAST broadens this assessment to account for the importance of livestock in local livelihoods, the relative importance of feed problems locally, and the local situation related to labour, input availability, credit, seasonality, and markets (Duncan et al., 2012). Outputs from the FEAST consists of a short report in a defined format along with some quantitative information on overall feed availability, quality and seasonality. The output from the FEAST studies is likely to result in better understanding of the current situation with regard to the issues of crop and livestock integration and the likely interventions that can be thought of in addressing the existing problems. This report pertains to five humidtropics field sites of Osun State: Iwo, Ife East, Atukmosa East, Atukmosa West and Ayedire.
2
Methodology The State of Osun is located in the south-Western part of Nigeria. It covers an area of approximately 14,875 square kilometers. It is bounded by Ogun, Kwara, Oyo, Ondo, and Ekiti States in the south, North, West and East respectively. The state lies within the tropical rain forest. FEAST study was carried out at five Local Government Areas (LGA) in Osun state. Of these five, Iwo and Ayedire LGA are located in the North Western part of the state and the remaining three sites – Atukomoso East, Atukomoso West and Ife east are located on the Eastern part of the Osun state.
Respondent selection and data analysis Farmers from each LGA representing different wealth groups based on the land holdings were selected with the help of the state extension agents and local informants. The representative farmers were subjected to participatory rural appraisal (PRA) followed by individual interviews and the data was collected as per the FEAST format. General information on the farming and livestock production systems and feed resource availability and utilization was obtained through PRA while the quantitative information on the on overall feed availability, quality and seasonality was obtained through individual interview. Data collected through individual interview was analysed as FEAST excel template (www.ilri.org/feast). FEAST tool has been developed to help to design site specific strategies for feed supply and utilization.
3
Results The information gathered during the PRA and the result outputs from the FEAST template on various aspects is presented and discussed below.
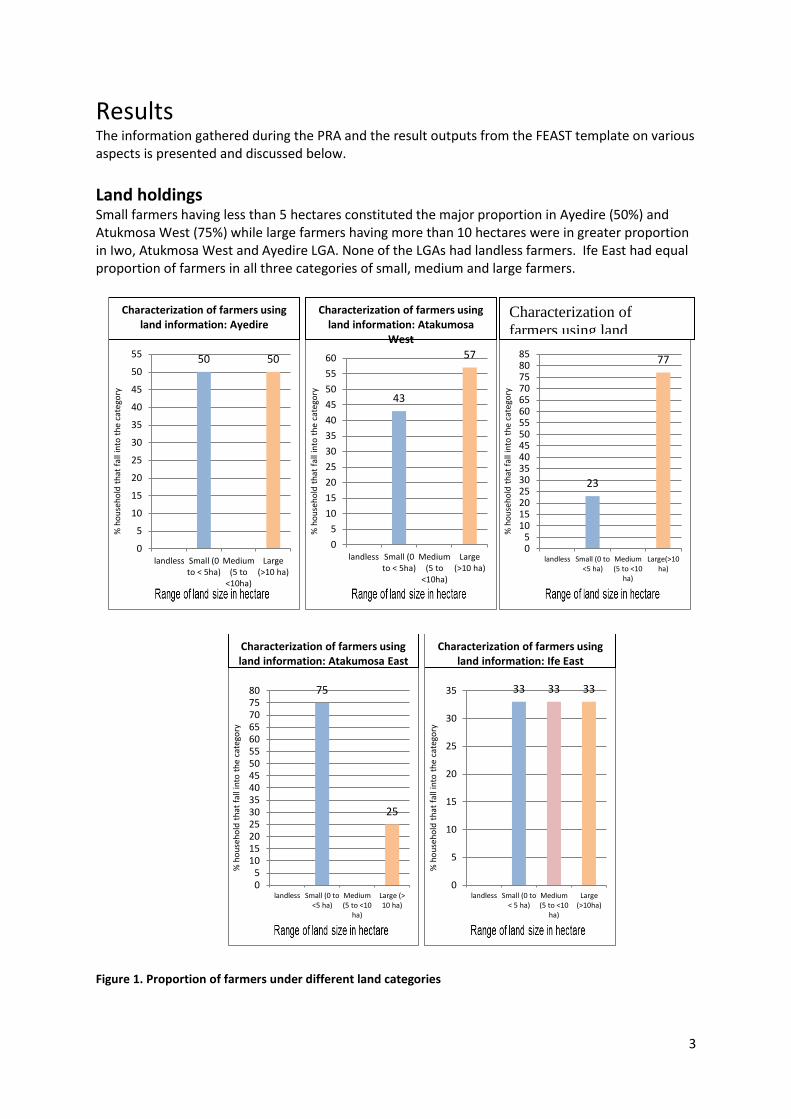
Land holdings Small farmers having less than 5 hectares constituted the major proportion in Ayedire (50%) and Atukmosa West (75%) while large farmers having more than 10 hectares were in greater proportion in Iwo, Atukmosa West and Ayedire LGA. None of the LGAs had landless farmers. Ife East had equal proportion of farmers in all three categories of small, medium and large farmers.
Figure 1. Proportion of farmers under different land categories
50 50
0
5
10
15
20
25
30
35
40
45
50
55
landless Small (0to < 5ha)
Medium(5 to
<10ha)
Large(>10 ha)
% h
ou
seh
old
th
at f
all i
nto
th
e ca
tego
ry
Characterization of farmers using land information: Ayedire
43
57
0
5
10
15
20
25
30
35
40
45
50
55
60
landless Small (0to < 5ha)
Medium(5 to
<10ha)
Large(>10 ha)
% h
ou
seh
old
th
at f
all i
nto
th
e ca
tego
ry
Characterization of farmers using land information: Atakumosa
West
23
77
05
10152025303540455055606570758085
landless Small (0 to<5 ha)
Medium(5 to <10
ha)
Large(>10ha)
% h
ou
seh
old
th
at f
all i
nto
th
e ca
tego
ry
75
25
05
101520253035404550556065707580
landless Small (0 to<5 ha)
Medium(5 to <10
ha)
Large (>10 ha)
% h
ou
seh
old
th
at f
all i
nto
th
e ca
tego
ry
Characterization of farmers using land information: Atakumosa East
33 33 33
0
5
10
15
20
25
30
35
landless Small (0 to< 5 ha)
Medium(5 to <10
ha)
Large(>10ha)
% h
ou
seh
old
th
at f
all i
nto
th
e ca
tego
ry
Characterization of farmers using land information: Ife East
Characterization of
farmers using land
information: Iwo

4
Crop production A wide range of crops mostly food (cassava, maize, yam and commercial crops (cocoa, coffee, fruits) were cultivated in the surveyed areas. Oilseeds and legumes which are important crops for livestock feeds were absent in all the surveyed LGAs.
Figure 2. Dominant crops cultivated under the surveyed local government areas of Osun state
Cas
sava
(M
anih
ot
escu
len
ta)
Co
coa
(Th
eob
rom
a ca
cao
)
Mai
ze (
Zea
may
s)
Ric
e (O
ryza
sat
iva)
Ban
ana
(Mu
sa a
cum
inat
a)
0.00
0.50
1.00
1.50
2.00
2.50
3.00
3.50
4.00
4.50
5.00
Ave
rage
are
a p
er
ho
use
ho
ld (
he
ctar
es
Average area (ha) per hh of dominant arable crops:
Iwo
Co
coa
(Th
eob
rom
a ca
cao
)
Cas
hew
Mai
ze (
Zea
may
s)
Gre
en P
epp
ers
(Cap
sicu
m a
nn
uu
m)
Tom
ato
(Ly
cop
ersi
con
esc
ule
ntu
m)
0.00
0.20
0.40
0.60
0.80
1.00
1.20
Ave
rage
are
a p
er
ho
use
ho
ld (
he
ctar
es
Average area (ha) per hh of dominant arable crops:
Atukmosa East
Co
coa
(Th
eob
rom
a ca
cao
)
Cas
sava
(M
anih
ot
escu
len
ta)
Ban
ana
(Mu
sa a
cum
inat
a)
Swee
t O
ran
ge (
Cit
rus
sin
ensi
s)
Mai
ze (
Zea
may
s)
0.00
0.50
1.00
1.50
2.00
2.50
3.00
3.50
4.00
Ave
rage
are
a p
er
ho
use
ho
ld (
he
ctar
es
Average area (ha) per hh of dominant arable crops-
Atukmosa West Ya
m (
Dis
core
a sp
p)
Man
go (
Man
gife
ra in
dic
a)
Mai
ze (
Zea
may
s)
Cas
sava
(M
anih
ot
escu
len
ta)
Pin
eap
ple
(A
nan
as c
om
osu
s)
0.00
20.00
40.00
60.00
80.00
100.00
120.00
140.00
160.00
Ave
rage
are
a p
er
ho
use
ho
ld (
he
ctar
es
Average area (ha) per hh of dominant arable crops: Ife
East
Co
coa
(Th
eob
rom
a ca
cao
)
Cas
sava
(M
anih
ot
escu
len
ta)
Yam
(D
isco
rea
spp
)
Mai
ze (
Zea
may
s)
Ban
ana
(Mu
sa a
cum
inat
a)
0.00
0.50
1.00
1.50
2.00
2.50
3.00
Ave
rage
are
a p
er
ho
use
ho
ld (
he
ctar
es
Average area (ha) per hh of dominant arable crops:
Ayedire

5
The commercial crop – cocoa was the major crop in Atakumosa East, Atakumosa West and Ayedire while food crops -cassava and yam were the major crops in Iwo and Ife East LGA respectively. Apart from the two food crops maize was the only other food crop that was being cultivated in all LGAs. The rest of the crops cultivated were mainly cash crops and consisted of fruits, vegetables and cashew. The average land size per household was least in Atakumosa East (3.16 ha) followed by Ayedire (7.3 ha), Atakumosa West (8.9 ha), Iwo (11.7 ha) and Ife east (14.3 ha). Land tenure system is widely prevalent in these areas. The household size (numbers/family) in the areas were observed to be medium to high - Ido (8.3), Ayedire (6.2), Atakumosa East(6.5), Atakumosa West(4.8) and Ife East (5.8) and contributed to the family labour for harvesting and processing of farm produce while the hired labours were always engaged in tedious work like clearing, making of heaps, ridges, planting and weeding. The rainy season sets in all the five LGA by April and lasts till October with peak rains in June- August. The period from November to March is generally dry although few of the areas may receive small rains and this period is critical when there is shortage of feeds. In the rainforest zones such as Ife East and Atakumosa (East and West), there was hardly a month that rain would not fall, thus the vegetation remains ever green. Irrigation was not practiced in the surveyed areas. However, where swampy or water logged lands exist, people utilize it for dry season vegetable and this system of cultivation using irrigation is commonly called as Fadama. Labour is available all the year round. The cost of labour sometimes depends on negotiation, the nature of the work and the duration of work. Wages ranged from 130000 to 150000 Naira /annum (1USD = 166 Naira). The rural/urban migration was common especially in areas that are far away from the major cities. Activities at the farm are generally dependent on the rains and crops grown. Month wise activities at the five LGA are summarized in tables below.
Table 1. Farming activities in Iwo local government area
Jan Mulching of yam, land clearing and harvesting of late maize
Feb Mulching of yam, land clearing
Mar Planting of maize, cassava, vegetable and melon
Apr Planting of maize, cassava, vegetable and melon
May Harvesting of maize, okra,, planting of oil palm transplanting of cocoa,
Jun Planting of tree crops, cocoa,
Jul Harvesting of yam, selling ram
Aug Harvesting of cocoa, planting of maize, cassava and okra, selling goats and ram
Sep Harvesting of cocoa, selling of goats and ram
Oct Nursery planting of cocoa and yam planting, cocoa harvesting, selling of goats and ram
Nov Planting of yam, cocoa harvesting, selling of goats
Dec Harvesting of last batch of yam and dry season maize, selling of goats and chicken
Table 2. Farming activities in Ayedire local government area
Jan Mulching of yam, land clearing and weeding of cocoa plots, harvesting of cocoa
Feb Land clearing, maize planting, weeding of cocoa and harvesting
Mar Land clearing, maize planting, weeding of cocoa, planting of tomato nursery
Apr Ridge making, ploughing, tomato nursery
May Planting of maize, cassava, water yam
Jun Planting of cocoa, oil palm, banana, cocoa, orange and weeding
Jul Weeding, harvesting of green maize, cassava, fresh yam
Aug Harvesting of yam, planting of maize, okra, beans, melon, water melon, cucumber
Sep Planting of cocoa and yam
6
Oct Harvesting of cocoa
Nov Harvesting of cocoa, selling of goats
Dec Harvesting of cocoa, selling of goats
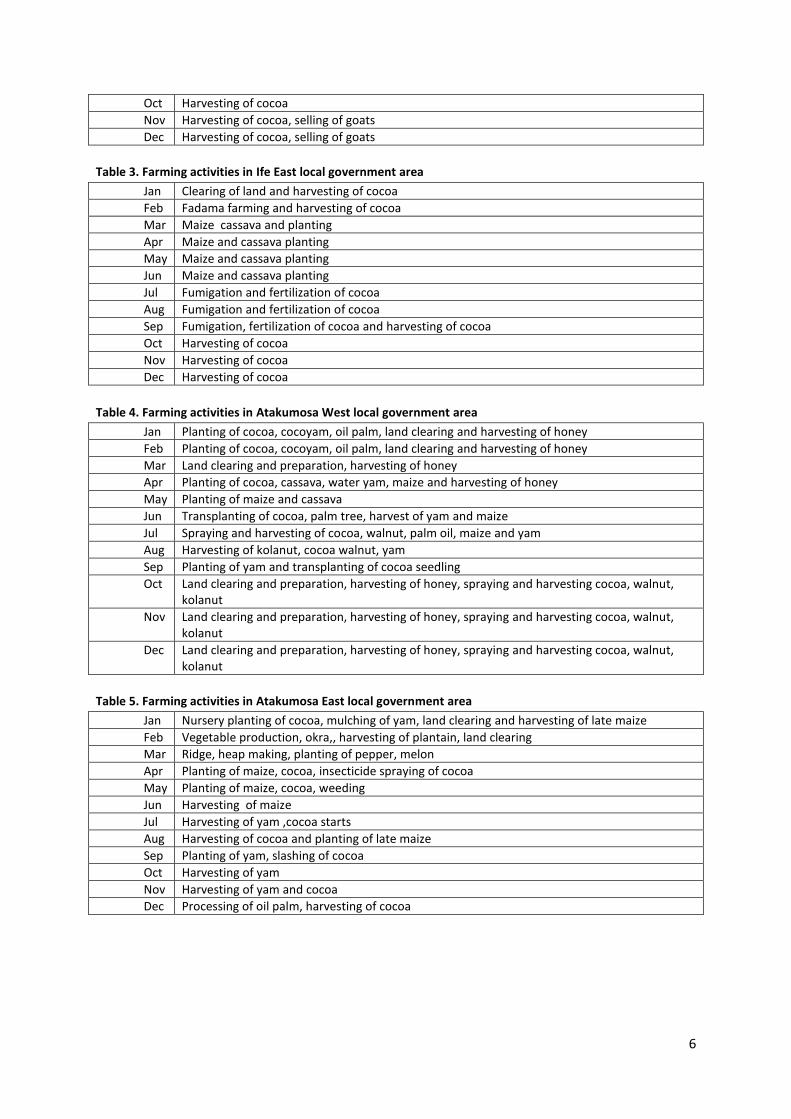
Table 3. Farming activities in Ife East local government area
Jan Clearing of land and harvesting of cocoa
Feb Fadama farming and harvesting of cocoa
Mar Maize cassava and planting
Apr Maize and cassava planting
May Maize and cassava planting
Jun Maize and cassava planting
Jul Fumigation and fertilization of cocoa
Aug Fumigation and fertilization of cocoa
Sep Fumigation, fertilization of cocoa and harvesting of cocoa
Oct Harvesting of cocoa
Nov Harvesting of cocoa
Dec Harvesting of cocoa
Table 4. Farming activities in Atakumosa West local government area
Jan Planting of cocoa, cocoyam, oil palm, land clearing and harvesting of honey
Feb Planting of cocoa, cocoyam, oil palm, land clearing and harvesting of honey
Mar Land clearing and preparation, harvesting of honey
Apr Planting of cocoa, cassava, water yam, maize and harvesting of honey
May Planting of maize and cassava
Jun Transplanting of cocoa, palm tree, harvest of yam and maize
Jul Spraying and harvesting of cocoa, walnut, palm oil, maize and yam
Aug Harvesting of kolanut, cocoa walnut, yam
Sep Planting of yam and transplanting of cocoa seedling
Oct Land clearing and preparation, harvesting of honey, spraying and harvesting cocoa, walnut, kolanut
Nov Land clearing and preparation, harvesting of honey, spraying and harvesting cocoa, walnut, kolanut
Dec Land clearing and preparation, harvesting of honey, spraying and harvesting cocoa, walnut, kolanut
Table 5. Farming activities in Atakumosa East local government area
Jan Nursery planting of cocoa, mulching of yam, land clearing and harvesting of late maize
Feb Vegetable production, okra,, harvesting of plantain, land clearing
Mar Ridge, heap making, planting of pepper, melon
Apr Planting of maize, cocoa, insecticide spraying of cocoa
May Planting of maize, cocoa, weeding
Jun Harvesting of maize
Jul Harvesting of yam ,cocoa starts
Aug Harvesting of cocoa and planting of late maize
Sep Planting of yam, slashing of cocoa
Oct Harvesting of yam
Nov Harvesting of yam and cocoa
Dec Processing of oil palm, harvesting of cocoa
7
Livestock production Livestock is an integral part of the agriculture and almost all households have one or more species of livestock- sheep, goats, pigs, chicken and cattle. The predominant animals in the areas are pigs, goats, sheep and local chicken. Cattle rearing are limited to the Fulani, who rarely practice crop farming. Although there are pockets of intensive systems of management, especially for commercial poultry and pig, the majority of livestock owners operate extensive methods of rearing where animals fend for themselves for feed depending on the common property resources. Housing is never provided; animals sleep in the corridor while birds rest on trees where they are exposed to inclement weather. Veterinarians or their assistants provide the health services for the animals. Farmers purposely provide supplementary feed in order to keep the animals around the home. The feed supply includes peels of cassava, yam and plantain, corn gluten (waste from sieve of fermented corn), wheat offal, brewer’s dried grain, palm kernel cake, orange pulp, cashew pulp, mango fruit wastes, cowpea husk, groundnut haulm, corn offal and sorghum chaff. Browse plants and shrubs are also obtained around homestead and farm area. Farmers in the area hardly declare the number of animals they have per household. They rear animals for immediate income, for festival, ceremony, gift and consumption. The farmers were aware of credit facilities. They did not have reason to take borrowed money for the operation of livestock production. Expansion of livestock production was essentially through the process of animal donations. Among the farmers or relatives and friends to the farmer, animal are given to ‘care takers’ and the profits are shared on agreement. Personal and hired lands are abundant for cultivation of crops and rearing of animals but land was never established for the purpose of rearing livestock. Livestock production was secondary and was not given its due weightage or importance. None of the farmers in the area have heard about artificial insemination.
8
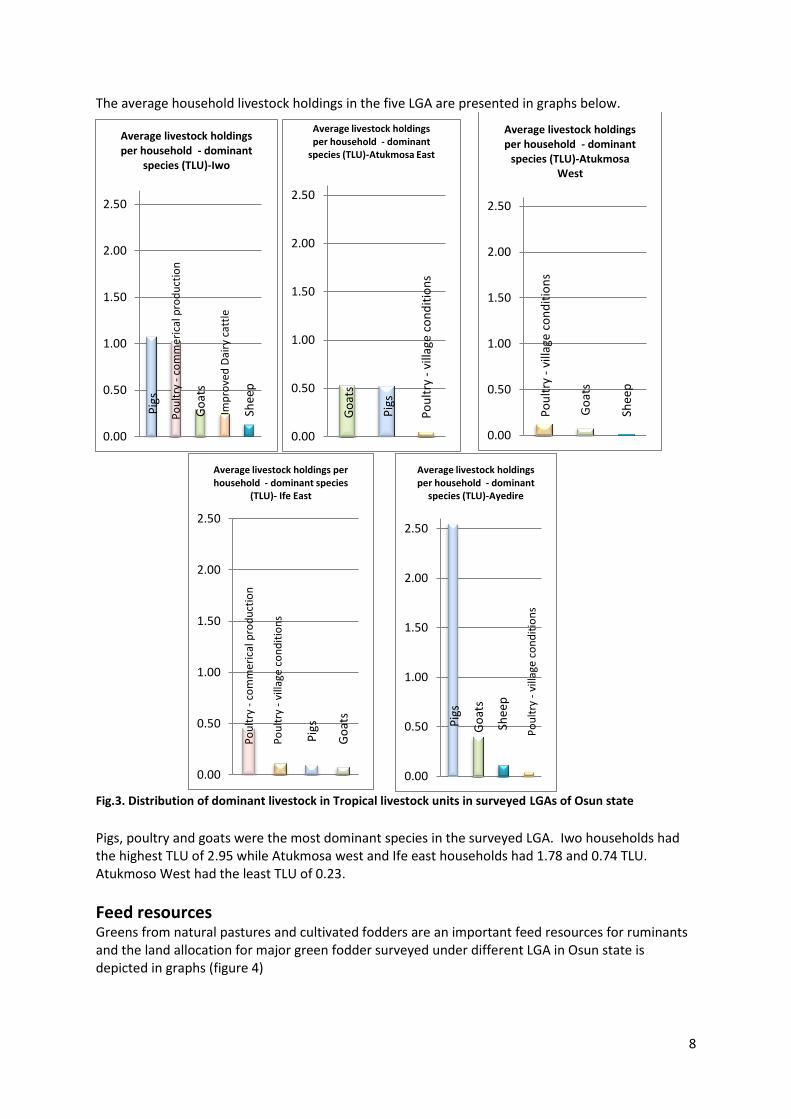
The average household livestock holdings in the five LGA are presented in graphs below.
Fig.3. Distribution of dominant livestock in Tropical livestock units in surveyed LGAs of Osun state
Pigs, poultry and goats were the most dominant species in the surveyed LGA. Iwo households had the highest TLU of 2.95 while Atukmosa west and Ife east households had 1.78 and 0.74 TLU. Atukmoso West had the least TLU of 0.23.
Feed resources Greens from natural pastures and cultivated fodders are an important feed resources for ruminants and the land allocation for major green fodder surveyed under different LGA in Osun state is depicted in graphs (figure 4)
Pig
s
Po
ult
ry -
co
mm
eric
al p
rod
uct
ion
Go
ats
Imp
rove
d D
airy
cat
tle
Shee
p
0.00
0.50
1.00
1.50
2.00
2.50
Average livestock holdings per household - dominant
species (TLU)-Iwo
Go
ats
Pig
s
Po
ult
ry -
vill
age
con
dit
ion
s 0.00
0.50
1.00
1.50
2.00
2.50
Average livestock holdings per household - dominant
species (TLU)-Atukmosa East
Po
ult
ry -
vill
age
con
dit
ion
s
Go
ats
Shee
p
0.00
0.50
1.00
1.50
2.00
2.50
Average livestock holdings per household - dominant
species (TLU)-Atukmosa West
Po
ult
ry -
co
mm
eric
al p
rod
uct
ion
Po
ult
ry -
vill
age
con
dit
ion
s
Pig
s
Go
ats
0.00
0.50
1.00
1.50
2.00
2.50
Average livestock holdings per household - dominant species
(TLU)- Ife East
Pig
s
Go
ats
Shee
p
Po
ult
ry -
vill
age
con
dit
ion
s
0.00
0.50
1.00
1.50
2.00
2.50
Average livestock holdings per household - dominant
species (TLU)-Ayedire

9
Figure 4. Major fodder crops in the surveyed LGA of Osun state
Leucenea Green fodder tree was the major green fodder source in Atukmosa east while green fodder from natural pastures was the major source in Iwo and Atukmosa West LGA. Maize was being cultivated as a major source of green fodder on a reasonably large area of land in Ife East as the dairy animals is one of the major activities. This is further confirmed by largest average land allocation 0.96 ha from cultivated and natural pastures observed in Ife East. The next large allocation was observed in Atukmosa east at 0.40 ha followed by Iwo 0.25 ha and Atukmosa West 0.23 ha.
Mai
ze (
Zea
may
s)
Nap
ier
gras
s (P
enn
iset
um
p
urp
ure
um
)
0
0.1
0.2
0.3
0.4
0.5
0.6
0.7
0.8
0.9
Ave
rage
are
a o
f cr
op
gro
wn
pe
r h
ou
seh
old
(h
ect
are
s)
Dominant fodder crops grown in Ife East
Leu
caen
a (L
euca
ena
leu
coce
ph
ala)
Styl
o (
Styl
osa
nth
es
guia
nen
sis)
Nat
ura
lly o
ccu
rin
g p
astu
re -
tr
op
ical
Sorg
hu
m (
Sorg
hu
m b
ico
lor)
Nap
ier
gras
s (P
enn
iset
um
p
urp
ure
um
)
0
0.1
0.2
0.3
0.4
0.5
0.6
0.7
0.8
Ave
rage
are
a o
f cr
op
gro
wn
pe
r h
ou
seh
old
(h
ect
are
s)
Dominant fodder crops grown in Atukmosa East
Nat
ura
lly o
ccu
rin
g p
astu
re -
tr
op
ical
0
0.1
0.2
0.3
0.4
0.5
0.6
0.7
0.8
Ave
rage
are
a o
f cr
op
gro
wn
pe
r h
ou
seh
old
(h
ect
are
s)
Dominant fodder crops grown in Atukmosa West
Nat
ura
lly o
ccu
rin
g p
astu
re -
tro
pic
al
Nap
ier
gras
s (P
enn
iset
um
pu
rpu
reu
m)
Styl
o (
Styl
osa
nth
es g
uia
nen
sis)
0
0.1
0.2
0.3
0.4
0.5
0.6
0.7
0.8A
vera
ge a
rea
of
cro
p g
row
n p
er
ho
use
ho
ld
(he
ctar
es)
Dominant fodder crops grown in Iwo
10
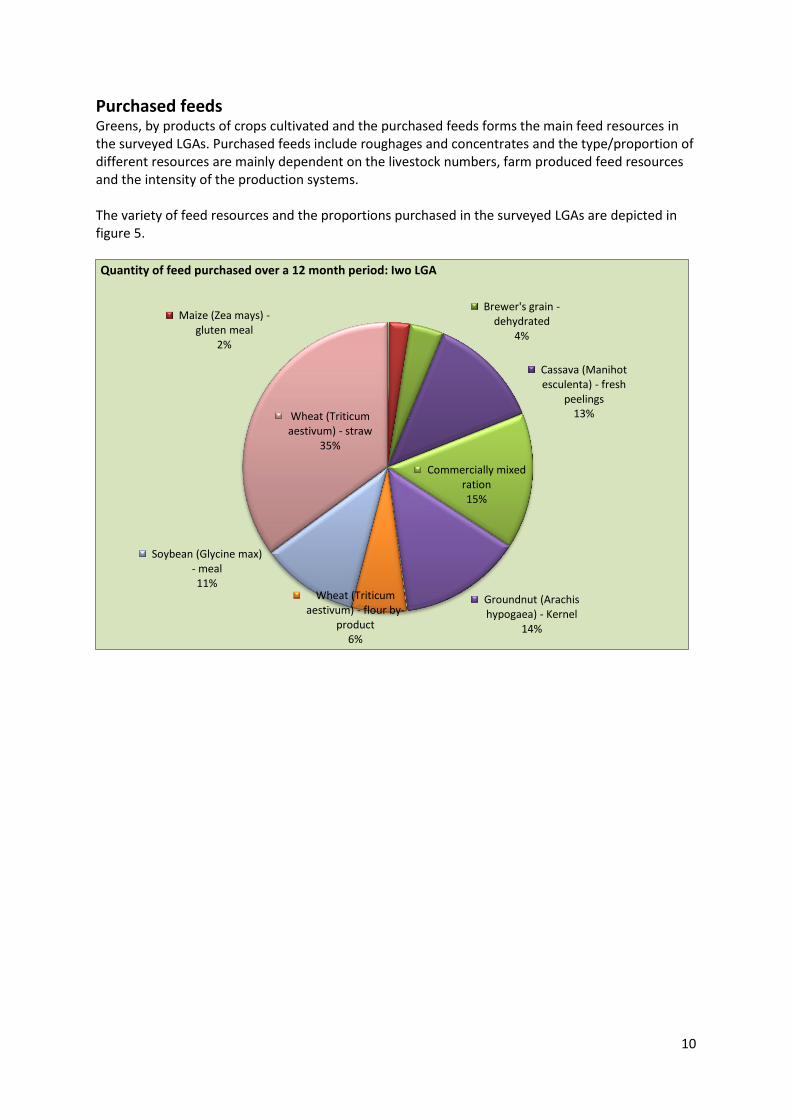
Purchased feeds Greens, by products of crops cultivated and the purchased feeds forms the main feed resources in the surveyed LGAs. Purchased feeds include roughages and concentrates and the type/proportion of different resources are mainly dependent on the livestock numbers, farm produced feed resources and the intensity of the production systems. The variety of feed resources and the proportions purchased in the surveyed LGAs are depicted in figure 5.
Maize (Zea mays) - gluten meal
2%
Brewer's grain -dehydrated
4%
Cassava (Manihot esculenta) - fresh
peelings 13%
Commercially mixed ration 15%
Groundnut (Arachis hypogaea) - Kernel
14%
Wheat (Triticum aestivum) - flour by-
product 6%
Soybean (Glycine max) - meal 11%
Wheat (Triticum aestivum) - straw
35%
Quantity of feed purchased over a 12 month period: Iwo LGA
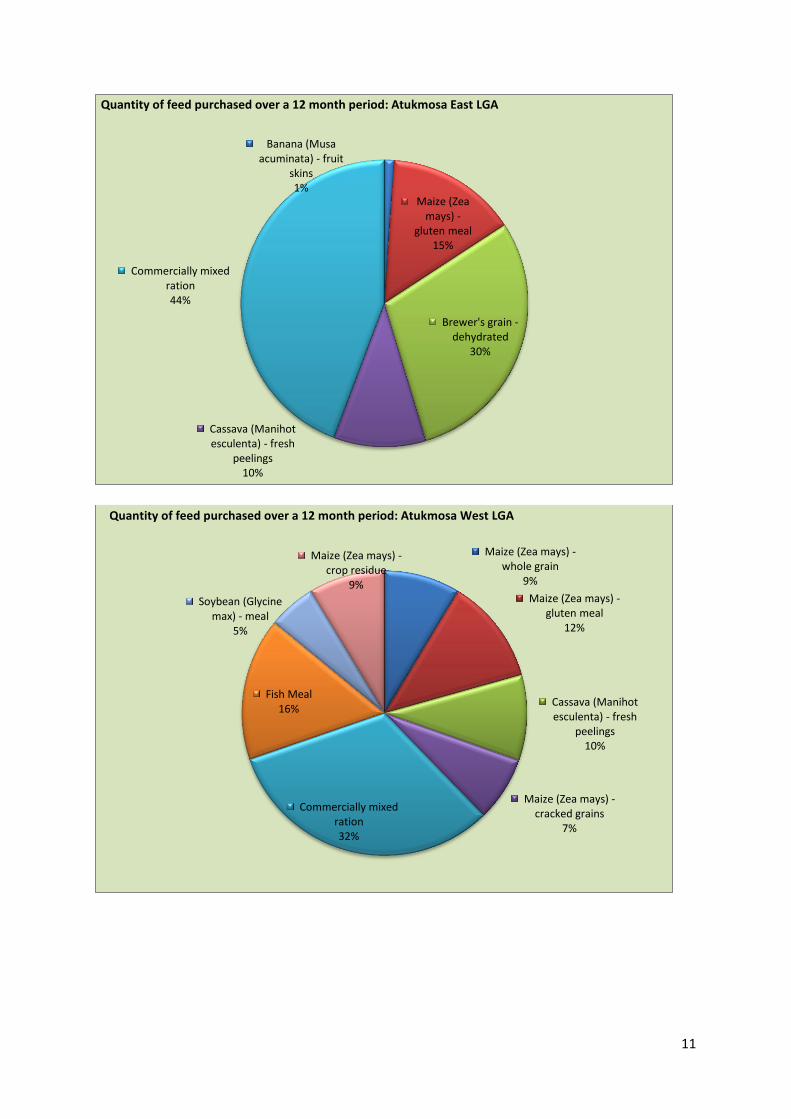
11
Banana (Musa acuminata) - fruit
skins 1%
Maize (Zea mays) -
gluten meal 15%
Brewer's grain -dehydrated
30%
Cassava (Manihot esculenta) - fresh
peelings 10%
Commercially mixed ration 44%
Quantity of feed purchased over a 12 month period: Atukmosa East LGA
Maize (Zea mays) - whole grain
9%
Maize (Zea mays) - gluten meal
12%
Cassava (Manihot esculenta) - fresh
peelings 10%
Maize (Zea mays) - cracked grains
7%
Commercially mixed ration 32%
Fish Meal 16%
Soybean (Glycine max) - meal
5%
Maize (Zea mays) - crop residue
9%
Quantity of feed purchased over a 12 month period: Atukmosa West LGA
12
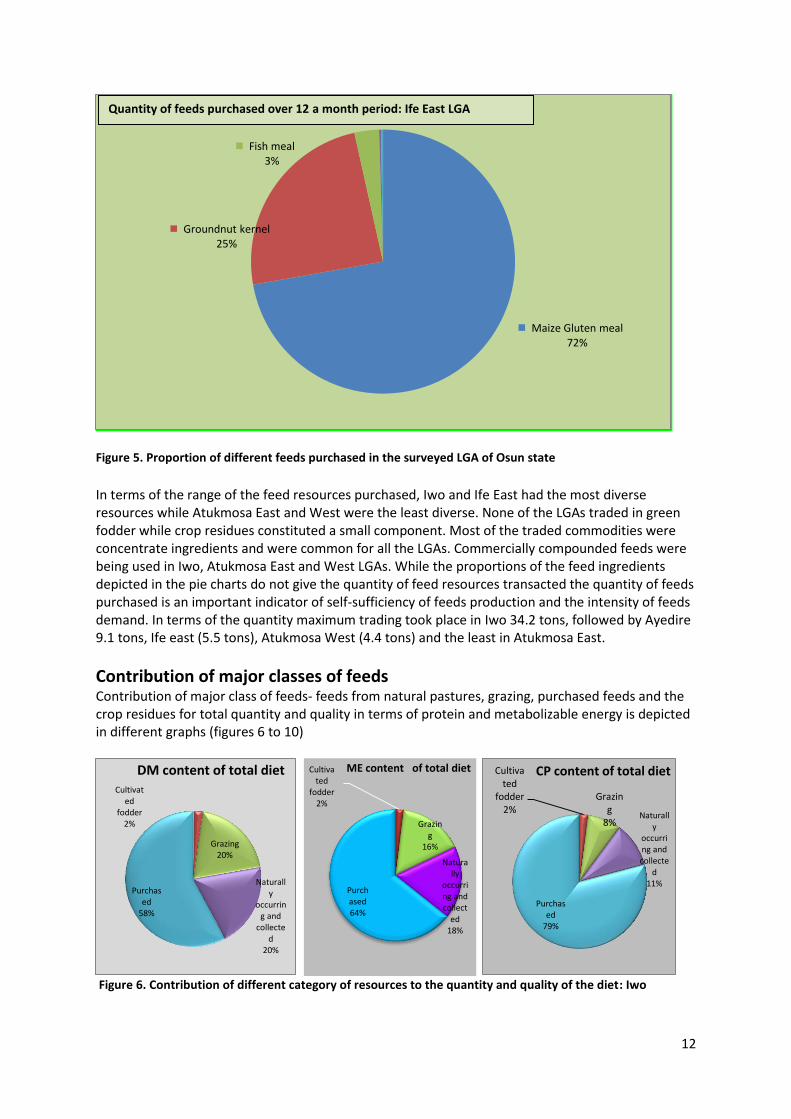
Figure 5. Proportion of different feeds purchased in the surveyed LGA of Osun state
In terms of the range of the feed resources purchased, Iwo and Ife East had the most diverse resources while Atukmosa East and West were the least diverse. None of the LGAs traded in green fodder while crop residues constituted a small component. Most of the traded commodities were concentrate ingredients and were common for all the LGAs. Commercially compounded feeds were being used in Iwo, Atukmosa East and West LGAs. While the proportions of the feed ingredients depicted in the pie charts do not give the quantity of feed resources transacted the quantity of feeds purchased is an important indicator of self-sufficiency of feeds production and the intensity of feeds demand. In terms of the quantity maximum trading took place in Iwo 34.2 tons, followed by Ayedire 9.1 tons, Ife east (5.5 tons), Atukmosa West (4.4 tons) and the least in Atukmosa East.
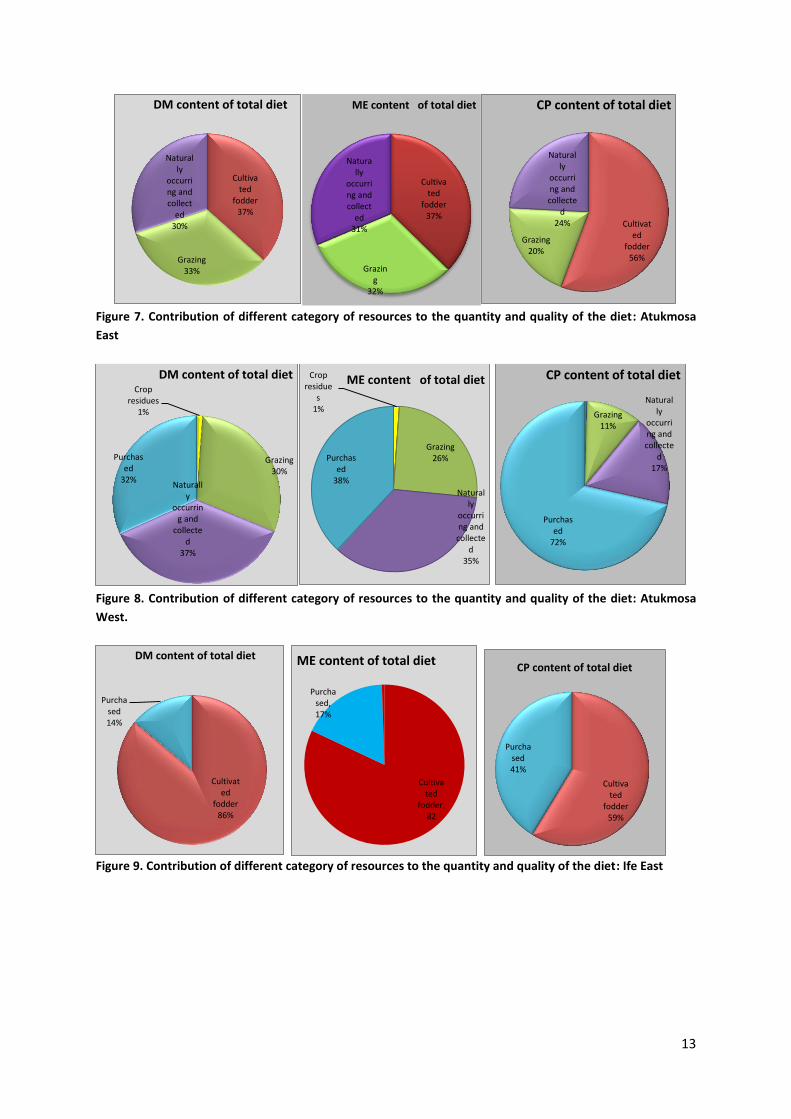
Contribution of major classes of feeds Contribution of major class of feeds- feeds from natural pastures, grazing, purchased feeds and the crop residues for total quantity and quality in terms of protein and metabolizable energy is depicted in different graphs (figures 6 to 10)
Figure 6. Contribution of different category of resources to the quantity and quality of the diet: Iwo
Maize Gluten meal 72%
Groundnut kernel 25%
Fish meal 3%
Cultivated
fodder 2%
Grazing 20%
Naturally
occurring and
collected
20%
Purchased
58%
DM content of total diet Cultivated
fodder 2%
Grazing
16%
Naturally
occurring and collect
ed 18%
Purchased 64%
ME content of total diet Cultivated
fodder 2%
Grazing
8% Naturall
y occurring and collecte
d 11%
Purchased
79%
CP content of total diet
Quantity of feeds purchased over 12 a month period: Ife East LGA
13
Figure 7. Contribution of different category of resources to the quantity and quality of the diet: Atukmosa
East
Figure 8. Contribution of different category of resources to the quantity and quality of the diet: Atukmosa
West.
Figure 9. Contribution of different category of resources to the quantity and quality of the diet: Ife East
Cultivated
fodder 37%
Grazing 33%
Naturally
occurring and collect
ed 30%
DM content of total diet
Cultivated
fodder 37%
Grazing
32%
Naturally
occurring and collect
ed 31%
ME content of total diet
Cultivated
fodder 56%
Grazing 20%
Naturally
occurring and collecte
d 24%
CP content of total diet
Crop residues
1%
Grazing 30%
Naturally
occurring and
collected
37%
Purchased
32%
DM content of total diet Crop residue
s 1%
Grazing 26%
Naturally
occurring and collecte
d 35%
Purchased
38%
ME content of total diet
Grazing 11%
Naturally
occurring and collecte
d 17%
Purchased
72%
CP content of total diet
Cultivated
fodder 86%
Purchased 14%
DM content of total diet
Cultivated
fodder, 82
Purchased, 17%
ME content of total diet
Cultivated
fodder 59%
Purchased 41%
CP content of total diet
14
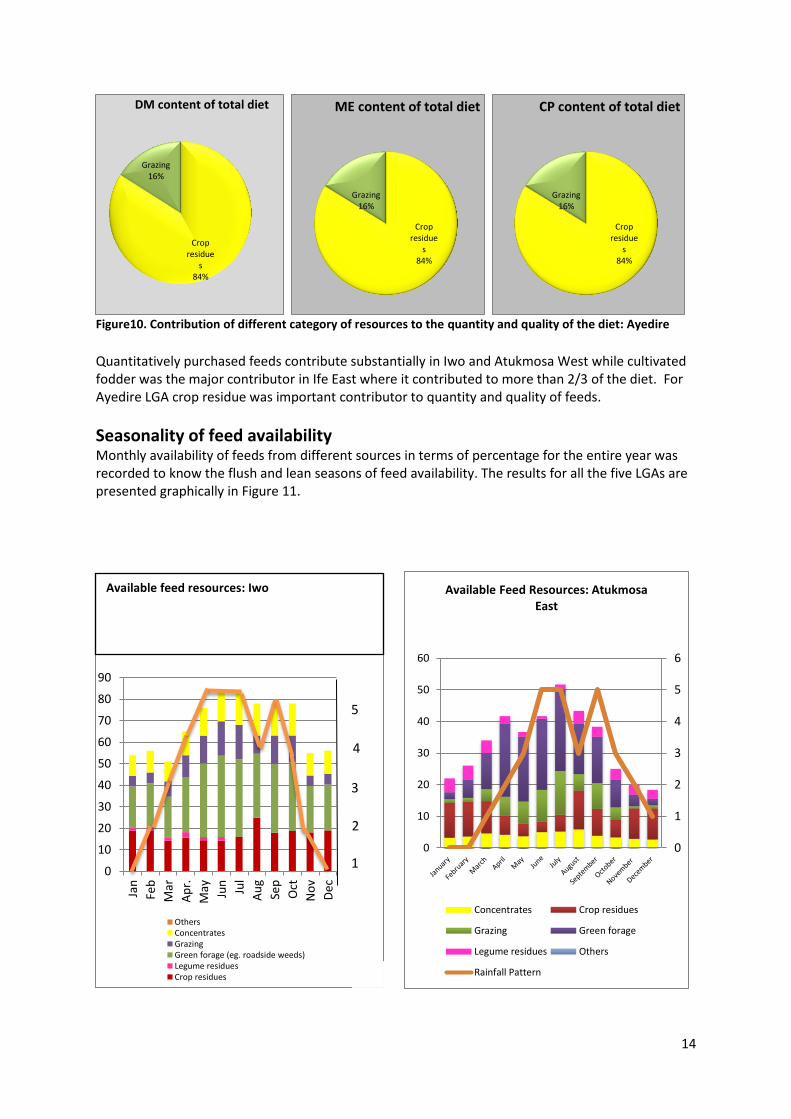
Figure10. Contribution of different category of resources to the quantity and quality of the diet: Ayedire
Quantitatively purchased feeds contribute substantially in Iwo and Atukmosa West while cultivated fodder was the major contributor in Ife East where it contributed to more than 2/3 of the diet. For Ayedire LGA crop residue was important contributor to quantity and quality of feeds.
Seasonality of feed availability Monthly availability of feeds from different sources in terms of percentage for the entire year was recorded to know the flush and lean seasons of feed availability. The results for all the five LGAs are presented graphically in Figure 11.
Crop residue
s 84%
Grazing 16%
DM content of total diet
Crop residue
s 84%
Grazing 16%
ME content of total diet
Crop residue
s 84%
Grazing 16%
CP content of total diet
0
10
20
30
40
50
60
70
80
90
Jan
Feb
Mar
Ap
r.
May Jun
Jul
Au
g
Sep
Oct
No
v
De
c
OthersConcentratesGrazingGreen forage (eg. roadside weeds)Legume residuesCrop residues
4
3
2
1
5
0
1
2
3
4
5
6
0
10
20
30
40
50
60
Available Feed Resources: Atukmosa East
Concentrates Crop residues
Grazing Green forage
Legume residues Others
Rainfall Pattern
Available feed resources: Iwo
15
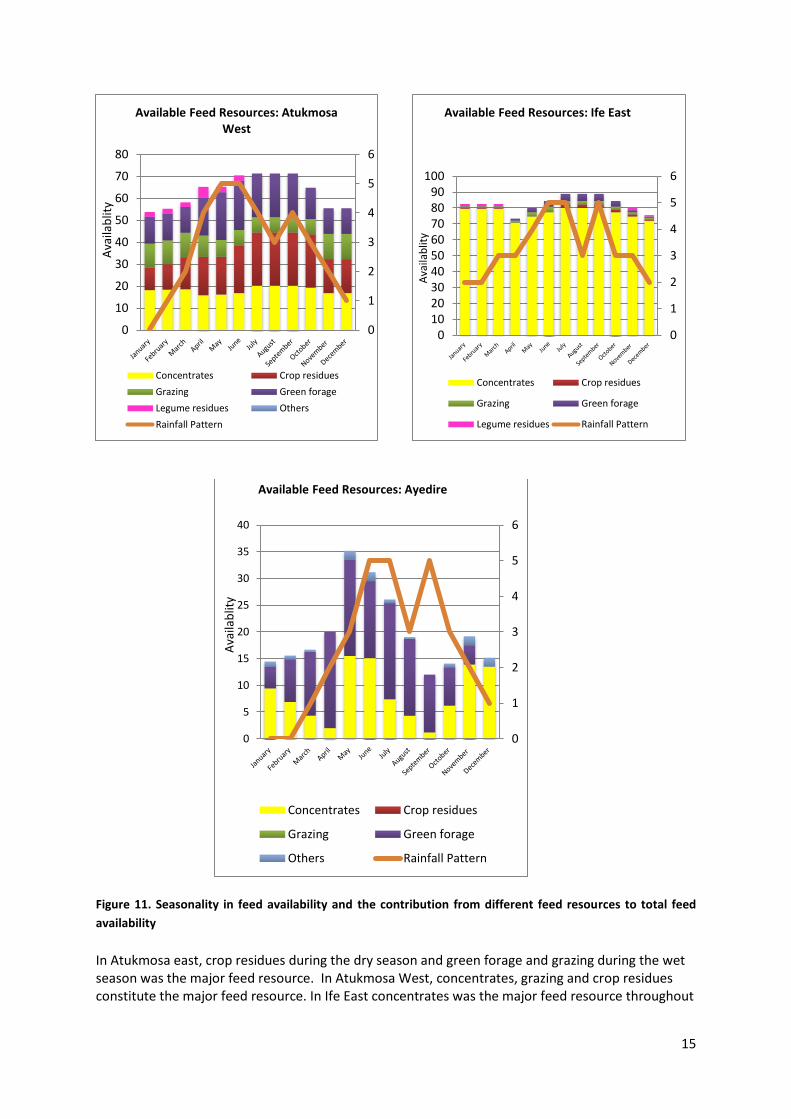
Figure 11. Seasonality in feed availability and the contribution from different feed resources to total feed
availability
In Atukmosa east, crop residues during the dry season and green forage and grazing during the wet season was the major feed resource. In Atukmosa West, concentrates, grazing and crop residues constitute the major feed resource. In Ife East concentrates was the major feed resource throughout
0
1
2
3
4
5
6
0
10
20
30
40
50
60
70
80
Ava
ilab
lity
Available Feed Resources: Atukmosa West
Concentrates Crop residues
Grazing Green forage
Legume residues Others
Rainfall Pattern
0
1
2
3
4
5
6
0102030405060708090
100
Ava
ilab
lity
Available Feed Resources: Ife East
Concentrates Crop residues
Grazing Green forage
Legume residues Rainfall Pattern
0
1
2
3
4
5
6
0
5
10
15
20
25
30
35
40
Ava
ilab
lity
Available Feed Resources: Ayedire
Concentrates Crop residues
Grazing Green forage
Others Rainfall Pattern
16
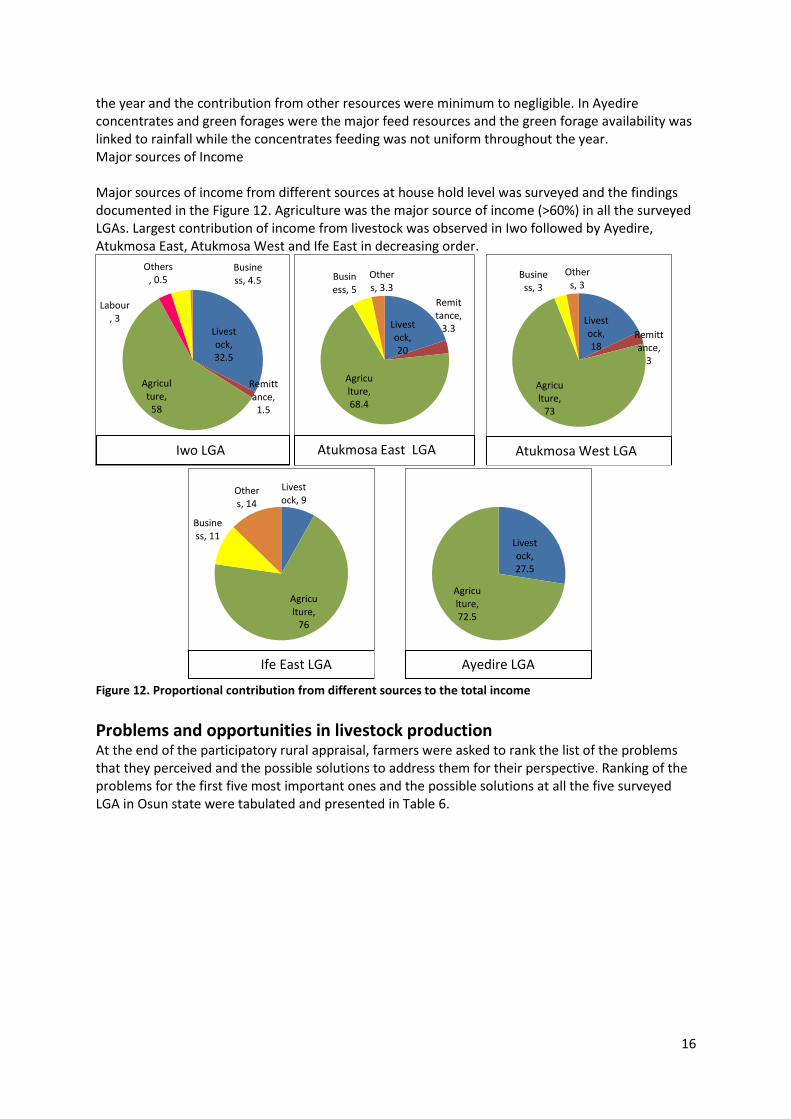
the year and the contribution from other resources were minimum to negligible. In Ayedire concentrates and green forages were the major feed resources and the green forage availability was linked to rainfall while the concentrates feeding was not uniform throughout the year. Major sources of Income Major sources of income from different sources at house hold level was surveyed and the findings documented in the Figure 12. Agriculture was the major source of income (>60%) in all the surveyed LGAs. Largest contribution of income from livestock was observed in Iwo followed by Ayedire, Atukmosa East, Atukmosa West and Ife East in decreasing order.
Figure 12. Proportional contribution from different sources to the total income
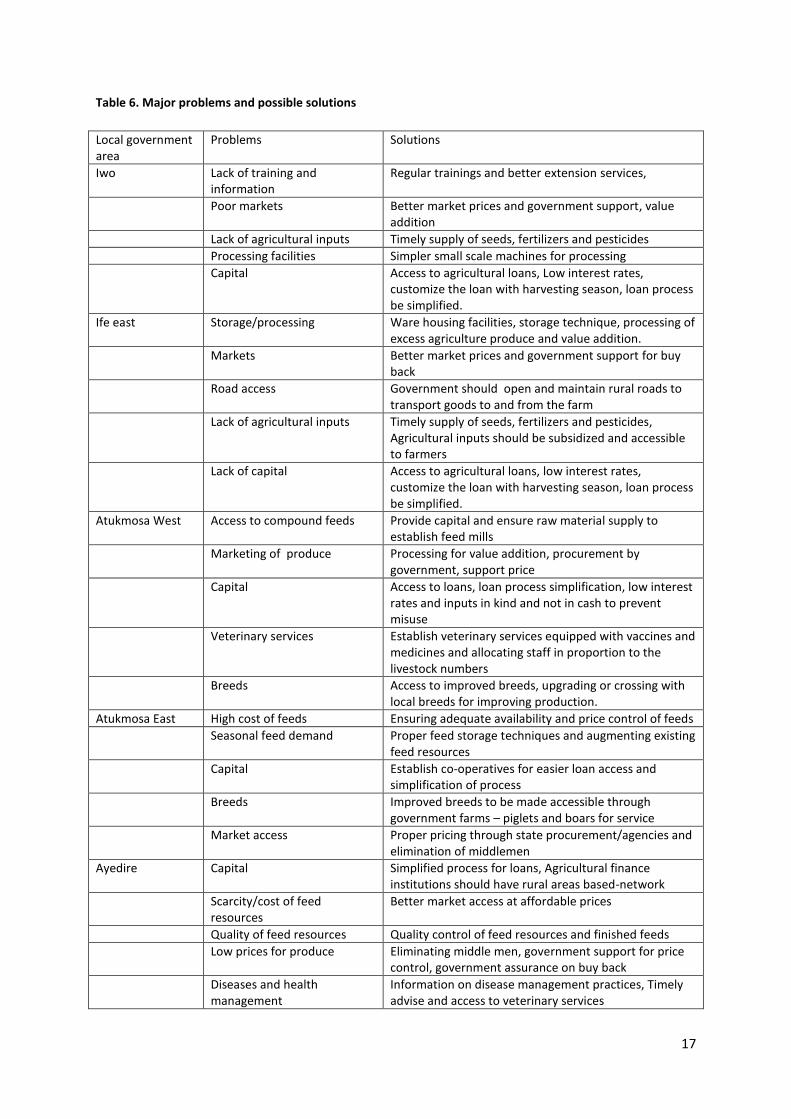
Problems and opportunities in livestock production At the end of the participatory rural appraisal, farmers were asked to rank the list of the problems that they perceived and the possible solutions to address them for their perspective. Ranking of the problems for the first five most important ones and the possible solutions at all the five surveyed LGA in Osun state were tabulated and presented in Table 6.
Livestock, 32.5
Remittance, 1.5
Agriculture,
58
Labour, 3
Business, 4.5
Others, 0.5
Livestock, 20
Remittance,
3.3
Agriculture, 68.4
Business, 5
Others, 3.3
Atukmosa East LGA
Livestock, 18
Remittance,
3
Agriculture,
73
Business, 3
Others, 3
Atukmosa West LGA
Livestock, 9
Agriculture,
76
Business, 11
Others, 14
Ife East LGA
Livestock, 27.5
Agriculture, 72.5
Ayedire LGA
Iwo LGA
17
Table 6. Major problems and possible solutions
Local government area
Problems Solutions
Iwo Lack of training and information
Regular trainings and better extension services,
Poor markets Better market prices and government support, value addition
Lack of agricultural inputs Timely supply of seeds, fertilizers and pesticides
Processing facilities Simpler small scale machines for processing
Capital Access to agricultural loans, Low interest rates, customize the loan with harvesting season, loan process be simplified.
Ife east Storage/processing Ware housing facilities, storage technique, processing of excess agriculture produce and value addition.
Markets Better market prices and government support for buy back
Road access Government should open and maintain rural roads to transport goods to and from the farm
Lack of agricultural inputs Timely supply of seeds, fertilizers and pesticides, Agricultural inputs should be subsidized and accessible to farmers
Lack of capital Access to agricultural loans, low interest rates, customize the loan with harvesting season, loan process be simplified.
Atukmosa West Access to compound feeds Provide capital and ensure raw material supply to establish feed mills
Marketing of produce Processing for value addition, procurement by government, support price
Capital Access to loans, loan process simplification, low interest rates and inputs in kind and not in cash to prevent misuse
Veterinary services Establish veterinary services equipped with vaccines and medicines and allocating staff in proportion to the livestock numbers
Breeds Access to improved breeds, upgrading or crossing with local breeds for improving production.
Atukmosa East High cost of feeds Ensuring adequate availability and price control of feeds
Seasonal feed demand Proper feed storage techniques and augmenting existing feed resources
Capital Establish co-operatives for easier loan access and simplification of process
Breeds Improved breeds to be made accessible through government farms – piglets and boars for service
Market access Proper pricing through state procurement/agencies and elimination of middlemen
Ayedire Capital Simplified process for loans, Agricultural finance institutions should have rural areas based-network
Scarcity/cost of feed resources
Better market access at affordable prices
Quality of feed resources Quality control of feed resources and finished feeds
Low prices for produce Eliminating middle men, government support for price control, government assurance on buy back
Diseases and health management
Information on disease management practices, Timely advise and access to veterinary services
18
Summary All the five surveyed LGAs in the Oyo state revealed that farmers were cultivating multiple crops and livestock was an integral part of the agriculture contributing to the income. Agriculture was the major source of income in all the surveyed LGAs and livestock was also contributing to the total income apart from providing employment and quality animal protein. Main crops included cocoa, cassava, yam, maize and fruit crops like – banana, mango, orange, pineapple etc. Of all the crops cultivated only few of crops like cassava, maize and yam were contributing to livestock feeds and legumes or oilseed crops that contribute significantly to the quality of feed resources were missing. Pigs, poultry and goats were the most dominant species followed by sheep while cattle were observed only in Iwo. Pigs and commercial poultry were being reared on commercial scale using concentrates while for other species like small ruminants and indigenous birds- extensive system of production was being followed. Purchased feeds was the major source of feeds in Iwo and Atukmosa west while cultivated fodder and crop residues was the major feed resources contributing to the total feed in Ife East and Ayedire respectively. Cassava peels, maize gluten and commercial concentrate mixtures were the major purchased feed resources. Dairy livestock except in Ife east that had local cattle was virtually non-existent and intensification of small ruminants through better feeding for fattening was not common although there were few festive occasions with huge demand for small ruminants. Agricultural input such as inorganic fertilizer is scarce, expensive and not available year round and the scope of utilizing the animal waste as valuable manure can be exploited through better crop livestock integration. Since land is sufficiently available pasture can be established for livestock production through effective use of house hold labour bringing in additional source of income. A holistic approach in livestock management through use of animals with better genetic potential, feeding, disease control, market link ups and proper integration within the existing crops using household workforce can substantially improve the contribution of the livestock to incomes, livelihood and nutrition besides complementing the agriculture and add to overall system productivity.
References Duncan, A., York, L., Lukuyu, B., Samaddar, A. and Stür, W. 2012. Feed Assessment Tool (FEAST): A systematic method for assessing local feed resource availability and use with a view to designing intervention strategies aimed at optimizing feed utilization. Questionnaire for Facilitators (Version 5.3); updated: 15 June, 2012. ILRI, Addis Ababa, Ethiopia. Available from: http://www.ilri.org/feast.