Embed Size (px)
Citation preview
ARTICLE IN PRESS
Nuclear Instruments and Methods in Physics Research A 520 (2004) 368–371
*Corresp
Center, Gr
fax: +1-30
E-mail a
(J. Cottam)
0168-9002/$
doi:10.1016
Characterization of the Astro-E2 X-ray spectrometer
J. Cottama,*, K.R. Boycea, G.V. Browna,b, E. Figueroa-Felicianoa, R.L. Kelleya,V. Poncea, F.S. Portera, C.K. Stahlea, W.A. Tillotsona,b
aNASA Goddard Space Flight Center, Greenbelt, MD 20771, USAbUniversity of Maryland, College Park, MD 20742, USA
Abstract
We present the results of extensive characterization tests of the X-ray Spectrometer (XRS), which will be launched in
2005 as part of the Astro-E2 mission. The XRS will utilize a newly developed 2-D microcalorimeter array of 32 pixels
that will provide a resolution of B6 eV over the energy range 0.3–10 keV. The detector is characterized by the energy
scale and energy resolution, both of which vary with design and operating parameters. We have calibrated the gain scale
and energy resolution over a range of operating parameters including bias voltage, temperature, and incident photon
flux. We will present the response of the cumulative detector array as well as a measure of the uniformity of the
individual pixels. One pixel is physically offset from the array and will be continuously illuminated by a radioactive
source in-flight. We will show the accuracy with which this pixel can be used to monitor variations in the focal plane
array. Finally, we have illuminated the array with a high-energy continuum source and measured the Hg absorption
edges in order to characterize the absorption efficiency of the pixels.
r 2003 Elsevier B.V. All rights reserved.
PACS: 95.55.Ka; 07.85.Nc; 07.20.Fw
Keywords: X-ray detectors; X-ray spectrometers; Microcalorimeters
1. Introduction
The X-ray Spectrometer (XRS) will be launchedin 2005 as part of the Astro-E2 mission. It consistsof a microcalorimeter array of 32 pixels that areilluminated by one of five mirror modules onboardthe spacecraft. The XRS has a nearly constantenergy resolution of DEB6 eV across the operat-
onding author. NASA Goddard Space Flight
eenbelt, MD, 20771, USA. Tel.: +1-301-286-1586;
1-286-1684.
ddress: [email protected]
.
- see front matter r 2003 Elsevier B.V. All rights reserve
/j.nima.2003.11.269
ing band of roughly 0.3–10.0 keV with a quantumefficiency of more than 95% at 6.0 keV [1]. TheXRS will therefore provide unprecedented high-resolution, high-throughput spectra, particularlyin the high-energy X-ray band [2].
The XRS array is characterized by the energyscale, the energy resolution, and the quantumefficiency. The fully integrated XRS instrumentcalibration will take place during a formalcalibration campaign in the fall of 2003. Extensivepreliminary characterization of the micro-calorimeter array took place in the winter of2003. In the sections below, we will describe theseresults.
d.
ARTICLE IN PRESS
J. Cottam et al. / Nuclear Instruments and Methods in Physics Research A 520 (2004) 368–371 369
2. Energy scale
The energy scale of the detector maps theelectronic pulses recorded from an event to theenergy of the incident photon. This is a compli-cated, non-analytic function that varies with thepower and noise on the detector. A physical modelis currently being developed to describe the pulseshapes [3]. The baseline calibration of the energy
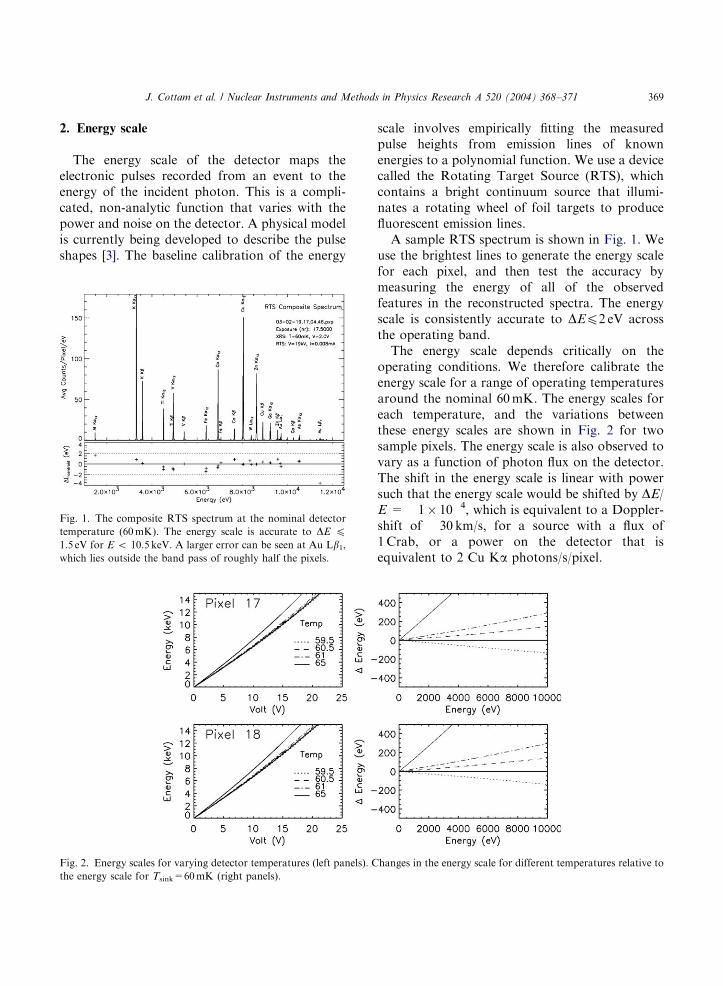
Fig. 2. Energy scales for varying detector temperatures (left panels). C
the energy scale for Tsink=60mK (right panels).
Fig. 1. The composite RTS spectrum at the nominal detector
temperature (60mK). The energy scale is accurate to DE p1.5 eV for E o 10.5 keV. A larger error can be seen at Au Lb1,which lies outside the band pass of roughly half the pixels.
scale involves empirically fitting the measuredpulse heights from emission lines of knownenergies to a polynomial function. We use a devicecalled the Rotating Target Source (RTS), whichcontains a bright continuum source that illumi-nates a rotating wheel of foil targets to producefluorescent emission lines.
A sample RTS spectrum is shown in Fig. 1. Weuse the brightest lines to generate the energy scalefor each pixel, and then test the accuracy bymeasuring the energy of all of the observedfeatures in the reconstructed spectra. The energyscale is consistently accurate to DEp2 eV acrossthe operating band.
The energy scale depends critically on theoperating conditions. We therefore calibrate theenergy scale for a range of operating temperaturesaround the nominal 60mK. The energy scales foreach temperature, and the variations betweenthese energy scales are shown in Fig. 2 for twosample pixels. The energy scale is also observed tovary as a function of photon flux on the detector.The shift in the energy scale is linear with powersuch that the energy scale would be shifted by DE/E = �1� 10�4, which is equivalent to a Doppler-shift of �30 km/s, for a source with a flux of1Crab, or a power on the detector that isequivalent to 2 Cu Ka photons/s/pixel.
hanges in the energy scale for different temperatures relative to
ARTICLE IN PRESS
J. Cottam et al. / Nuclear Instruments and Methods in Physics Research A 520 (2004) 368–371370
To monitor drifts in the gain in flight we will usea dedicated, offset pixel that is illuminated by a41Ca source. To test this, the temperature of thedetector was varied by 70.5mK with a period of4 h, which is expected to be much faster thanvariations experienced in flight. The drift in theoffset pixel was used to reconstruct drifts in theenergy scale for all the other pixels. The recon-structed energy scale was accurate to better thanDEo2 eV.
3. Energy resolution
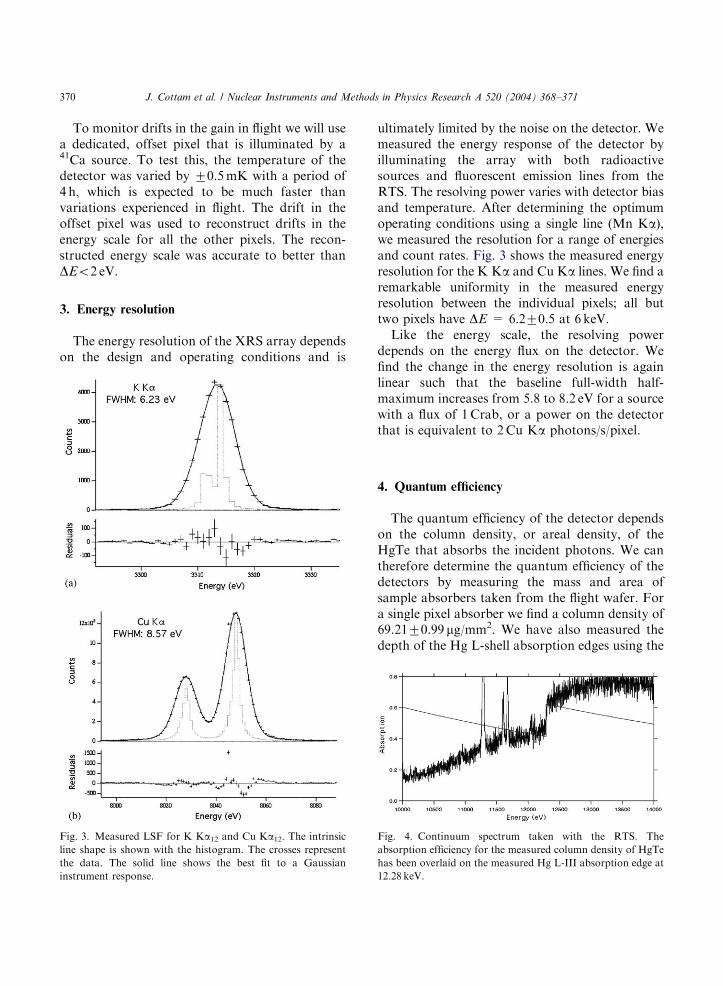
The energy resolution of the XRS array dependson the design and operating conditions and is
Fig. 3. Measured LSF for K Ka12 and Cu Ka12. The intrinsic
line shape is shown with the histogram. The crosses represent
the data. The solid line shows the best fit to a Gaussian
instrument response.
ultimately limited by the noise on the detector. Wemeasured the energy response of the detector byilluminating the array with both radioactivesources and fluorescent emission lines from theRTS. The resolving power varies with detector biasand temperature. After determining the optimumoperating conditions using a single line (Mn Ka),we measured the resolution for a range of energiesand count rates. Fig. 3 shows the measured energyresolution for the K Ka and Cu Ka lines. We find aremarkable uniformity in the measured energyresolution between the individual pixels; all buttwo pixels have DE = 6.270.5 at 6 keV.
Like the energy scale, the resolving powerdepends on the energy flux on the detector. Wefind the change in the energy resolution is againlinear such that the baseline full-width half-maximum increases from 5.8 to 8.2 eV for a sourcewith a flux of 1Crab, or a power on the detectorthat is equivalent to 2Cu Ka photons/s/pixel.
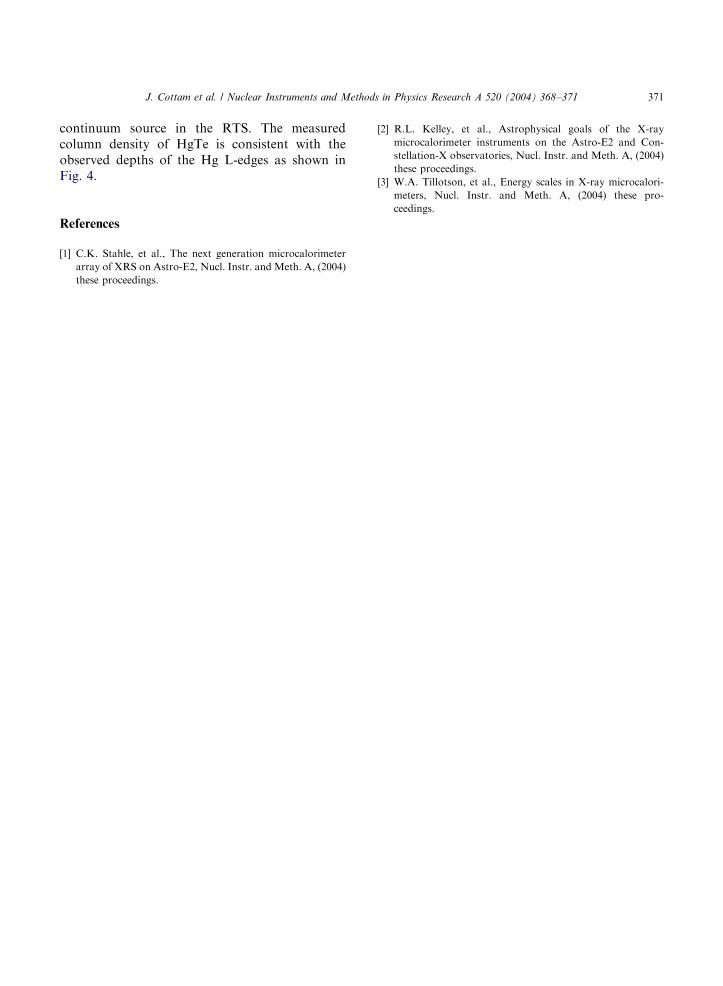
4. Quantum efficiency
The quantum efficiency of the detector dependson the column density, or areal density, of theHgTe that absorbs the incident photons. We cantherefore determine the quantum efficiency of thedetectors by measuring the mass and area ofsample absorbers taken from the flight wafer. Fora single pixel absorber we find a column density of69.2170.99 mg/mm2. We have also measured thedepth of the Hg L-shell absorption edges using the
Fig. 4. Continuum spectrum taken with the RTS. The
absorption efficiency for the measured column density of HgTe
has been overlaid on the measured Hg L-III absorption edge at
12.28 keV.
ARTICLE IN PRESS
J. Cottam et al. / Nuclear Instruments and Methods in Physics Research A 520 (2004) 368–371 371
continuum source in the RTS. The measuredcolumn density of HgTe is consistent with theobserved depths of the Hg L-edges as shown inFig. 4.
References
[1] C.K. Stahle, et al., The next generation microcalorimeter
array of XRS on Astro-E2, Nucl. Instr. and Meth. A, (2004)
these proceedings.
[2] R.L. Kelley, et al., Astrophysical goals of the X-ray
microcalorimeter instruments on the Astro-E2 and Con-
stellation-X observatories, Nucl. Instr. and Meth. A, (2004)
these proceedings.
[3] W.A. Tillotson, et al., Energy scales in X-ray microcalori-
meters, Nucl. Instr. and Meth. A, (2004) these pro-
ceedings.