Embed Size (px)
Citation preview
I
UNIVERSIDADE DE LISBOA
FACULDADE DE CIÊNCIAS
DEPARTAMENTO DE BIOLOGIA VEGETAL
Characterization of strain A19 belonging to
the species Bacillus thuringiensis var.
israelensis (Bti) isolated from soil of a
protected wetland reserve in Switzerland
Inês Amendoeira Cabral
MESTRADO EM MICROBIOLOGIA APLICADA
2012
UNIVERSIDADE DE LISBOA
FACULDADE DE CIÊNCIAS
DEPARTAMENTO DE BIOLOGIA VEGETAL
Characterization of strain A19 belonging to
the species Bacillus thuringiensis var.
israelensis (Bti) isolated from soil of a
protected wetland reserve in Switzerland
Dissertation oriented by PD Dr. Mauro Tonolla (UNIGE)
and Dr. Maria Manuela Carolino (FCUL)
Inês Amendoeira Cabral
MESTRADO EM MICROBIOLOGIA APLICADA
2012
Characterization of strain A19 belonging to
the species Bacillus thuringiensis var.
israelensis (Bti) isolated from soil of a
protected wetland reserve in Switzerland
Inês Amendoeira Cabral
MASTER THESIS
2012
This thesis was fully performed at the Cantonal Institute of Microbiology, Bellinzona
(Switzerland), in the Microbial Ecology Group of the Microbiology Unit, Plant Biology
Dept. University of Geneva, under the direct supervision of PD Dr. Mauro Tonolla.
Prof. Dr. Manuela Carolino was the internal designated supervisor in the scope of the
Master in Applied Microbiology of the Faculty of Sciences of the University of Lisbon.

II
ACKNOWLEDGMENTS
My special thank to my supervisor, PD Dr. Mauro Tonolla, for integrating me into his team
and orientating my project; to Valeria Guidi (PhD student), for her availability, support
through the thesis process and sharing her experience with Bti, and to PD Dr. Orlando
Petrini, ICM (Istituto Cantonale di Microbiologia of Bellinzona) director.
I would like to thank Nicola Storelli (PhD student), for his support in the laboratory and
sharing his experience on SDS-PAGE and 2-D PAGE techniques. I would like to thank to Dr.
Cinzia Benagli, Dr. Sophie de Respinis, Dr. Damiana Ravasi, the PhD student Regalin Rout
and the laboratory technicians Nadia Ruggeri-Bernardi, Fabio Lucchini, Daniele Carugati and
Annapaola Caminada, for their availability and support in the laboratory.
I would like to thank Dr. Peter Lüthy from Institute of Microbiology, ETH Zürich,
Switzerland, for sharing his experience with Bti; and Dr. Pie Müller, from Vector Control
Centre, Swiss Tropical and Public Health Institute, Basel, Switzeland, for the opportunity to
work in his laboratory and for providing the mosquito larvae for the bioassay.
I would like to thank Prof. Dr. Maria Manuela Carolino for her support and availability and
to Prof. Dr. Rogério Tenreiro for the availability and help with the officialisms during my stay
in Switzerland.
I would like to thank the following institutions: the Faculdade de Ciências da Universidade
de Lisboa and the University of Geneva to give me the chance to develop the master thesis
in Switzerland; the Istituto Cantonale di Microbiologia of Bellinzona, for receiving me and for
the financial support; and the Swiss Tropical and Public Health Institute of Basel, for the
laboratory availability.

III
ABSTRACT
Bolle di Magadino is a natural wetland reserve, located in Southern Switzerland, with
international importance due to its particular fauna and flora. Here the floodwater mosquitoes
are problematic, mainly for tourism; therefore, since 1988 have been carried out treatments
with the biopesticide VectoBac-G®, whose active components are endotoxins and viable
spores of Bacillus thuringiensis var. israelensis (Bti), strain AM 65-52 (referred as Vec8
throughout this thesis). During a previous project, a new strain of Bti, named A19, was
isolated from Bolle di Magadino natural reserve. This thesis aimed to characterize this strain
through physiological, toxicological and molecular approaches; and assess the possibility to
apply A19 strain as autochthonous control agent against mosquitoes. The A19 strain growth
profile was obtained through a growth curve, showing to be similar to the Vec8 Bti reference
strain. The A19 strain biochemical profile was obtained by using the API galleries, Vitek ID-
GP cards and serotyping. Concerning the serotyping, A19 strain was classified as “un-
testable”. The morphology was characterized at macro and microscopic levels, and some
unique features on A19 strain were detected relatively to the Bti reference strains (Vec8,
Bioflash, Bti4 e IP4444), as bigger colonies and absence of flagella. During the toxicological
test its toxicity against mosquito larvae was confirmed and registered as equivalent to the Bti
reference strains, through a bioassay. Furthermore, A19 strain showed to produce a bigger
amount of toxin per spore than the Bti reference strains, which, for a biopesticide, can be an
advantage at economic and environmental levels. The spore-phase total proteins’ profile of
A19 strain obtained through a SDS-PAGE, was similar to the profiles obtained for Bti
reference strains. Three missing proteins were detected on the A19 strain’s 2-D PAGE
vegetative cell total proteins’ profile, when compared with the Bti reference strains. From a
dendrogram, based on the vegetative cell total proteins’ profile, obtained by the MALDI-ToF
MS technique, Vec8 strain showed to be the Bti reference strain more similar to A19 strain.
However, there are morphological and molecular evidences that support the autochthonous
condition of A19 strain. The A19 strain cry and cyt genes were detected, as well as the 16S
ribosomal subunit encoding region, through a PCR followed by an electrophoresis run in
agarose gel. A19 strain showed to have potential to be used as biopesticide, and to have
advantages at economical and environmental level, comparatively to the Bti reference
strains.
Key words: Bacillus thuringiensis var. israelensis, spore-forming bacteria, endotoxins,
biopesticide
IV
SUMÁRIO
Bolle di Magadino é uma reserva natural de zonas húmidas, localizada no sul da Suíça,
com importância a nível internacional devido à sua fauna e flora únicas. Aqui, os mosquitos
representam um problema, principalmente para o turismo; por isso, desde 1988 têm sido
realizados tratamentos com o biopesticida VectoBac-G®, cujos componentes ativos são
endotoxinas e esporos viáveis de Bacillus thuringiensis var. israelensis (Bti), estirpe AM 65-
52 (referida como Vec8 ao longo desta tese). Durante um projeto anterior uma nova estirpe
de Bti, nomeada A19, foi isolada na reserva natural Bolle di Magadino. O objetivo deste
trabalho é caraterizar esta estirpe através de abordagens fisiológicas, toxicológicas e
moleculares, e avaliar a possibilidade de aplicar a estirpe A19 como agente autóctone para
controlo da população de mosquitos. O perfil de crescimento da estirpe A19, conseguido
através da construção de uma curva de crescimento, apresentou-se semelhante ao perfil
obtido para a estirpe de referência Vec8. O perfil bioquímico da estirpe A19 foi obtido
através de galerias API, do cartão Vitek ID-GP e serotipagem. Considerando a serotipagem,
a estirpe A19 foi classificada como “un-testable”. A caracterização morfológica foi
conseguida a nível macro e microscópico, e foram detectadas características únicas da
estirpe A19 relativamente às estirpes de Bti de referência (Vec8, Bioflash, Bti4 e IP4444),
como colónias maiores e ausência de flagelos. Durante o teste toxicológico, a sua toxicidade
contra larvas de mosquito foi confirmada, e registada como equivalente às estirpes de Bti de
referência. Para além disso, a estirpe A19 mostrou produzir uma maior quantidade de toxina
por esporo, relativamente às estirpes de Bti de referência, o que pode ser vantajoso a nível
económico e ambiental, como biopesticida. O perfil de proteínas da fase esporulativa obtido
através de SDS-PAGE foi semelhante aos perfis obtidos para as estirpes de Bti de
referência. Foi detetada a ausência de 3 proteínas no perfil 2-D PAGE de proteínas totais da
fase celular vegetativa, comparativamente com as estirpes de Bti de referência. A partir de
um dendrograma baseado em perfis de proteínas totais da fase celular vegetativa obtidos
pela técnica MALDI-ToF MS, a estirpe de referência Vec8 foi a mais próxima da estirpe A19.
No entanto existem evidências a nível morfológico e molecular que suportam a condição
autóctone da estirpe A19. Os genes cry e cyt, assim como a região codificante da
subunidade ribossomal 16S, foram amplificados através de PCR, e detetados através de
uma eletroforese em gel de agarose. A estirpe A19 mostrou ter potencial para ser utilizada
como biopesticide, e apresentou vantagens a nível económico e ambiental.
Palavras-chave: Bacillus thuringiensis var. israelensis, bateria formadora de esporos,
endotoxinas, biopesticida
V
RESUMO
Os mosquitos representam uma ameaça para a saúde humana, pois são vetores de
transmissão de várias doenças tropicais, e podem também representar um grande incómodo
para o Homem. A utilização de Bacillus thuringiensis var. israelensis (Bti) como biopesticida
comporta diversas vantagens relativamente a inseticidas sintéticos, uma vez que este
microrganismo produz uma toxina biodegradável, com elevada especificidade para o
organismo alvo.
Bolle di Magadino é uma reserva natural de zonas húmidas localizada no sul da Suíça,
cantão Ticino, com importância a nível nacional e internacional devido a sua fauna e flora
únicas. As enchentes periódicas do plano de Bolle di Magadino, devido a chuvas intensas
durante a Primavera e Verão, tornam as condições favoráveis para a reprodução de
mosquitos, principalmente das espécies Aedes vexans e Ochlerotatus sticticus. A grande
densidade de mosquitos nesta área representa um grande problema, especialmente para a
economia turística, e para combate-lo têm sido realizados tratamentos regulares com o
biopesticida VectoBac-G® (Valent BioSciences, liberty ville, IL, USA), desde 1988. Os
componentes ativos deste produto são endotoxinas e esporos viáveis de Bacillus
thuringiensis var. israelensis (Bti), estirpe AM 65-52 (referenciada ao longo deste trabalho
como Vec8). Durante um projeto anterior realizado por Chappuis (2002), cujo objetivo era a
monitorização do destino dos esporos de Bti provenientes do tratamento com VectoBac-G®
no solo da reserva de Bolle di Magadino, foi isolada uma nova estirpe de Bacillus
thuringiensis var. israelensis, nomeada A19. Admitindo a possibilidade de ser uma estirpe
autóctone da reserva natura Bolle di Magadino, é importante um melhor conhecimento das
suas características assim como possíveis vantagens relativamente a outras estirpes de Bti,
nomeadamente a estirpe Vec8. Dependendo das características da estirpe A19, a sua
produção a nível comercial como biopesticida, e a substituição do produto VectoBac-G® para
controlo da população de mosquitos na reserva natural Bolle di Magadino, são
possibilidades a considerar.
Este trabalho tem como objetivo aprofundar o conhecimento sobre a estirpe A19 através
da sua caraterização morfológica, bioquímica, proteómica, genómica e toxicológica, em
paralelo com estirpes Bti de referência (referenciadas ao longo deste trabalho como Vec8,
Bioflash, Bti4 e IP4444), para avaliar a possibilidade de utilizar A19 como agente autóctone
de controlo da população de mosquitos da reserva natural Bolle di Magadino.
O perfil de crescimento da estirpe A19 foi analisado através de uma curva de
crescimento. O tempo de duplicação (Td) da estirpe A19 (33.16 ± 0.76 min) determinado
através da construção de uma curva de crescimento, utilizando como meio de cultura o meio
VI
líquido TSB, não apresentou diferenças significativas (t-teste, p = 0.07) quando comparado
com a estirpe Vec8 (31.07 ± 1.02 min).
O perfil bioquímico de A19 foi determinado através das galerias API 20E, API 50CHB e
complementado com o cartão Vitek de identificação de batérias Gram-positivas, e
serotipagem. Os testes de fermentação de D-mannose, arbutina e D-cellobiose, de deteção
da enzima phosphatidylinositol phospholipase C e a capacidade de crescer em 6.5% NaCl
foram considerados discriminantes. As 5 estirpes de Bti testadas apresentaram 100% de
resistência a Polimixina B, Bacitracina, O/129 e Optoquina, sendo o teste à Novomicina o
único no qual nenhuma das estirpes apresentou 100% resistência. O serotipo foi testado
com anticorpos anti-H-14, com a estirpe A19, estirpes de Bti de referência e uma estirpe de
Bacillus thuringiensis var. kurstaki (Btk). Apesar de os resultados de serotipagem obtidos
não serem evidentes, a reação de aglutinação foi considerada negativa para a estirpe A19.
A mobilidade, “swimming”, das estirpes de Bti foi testada e confrontada com um controlo
negativo em meio MIO semi-sólido. Contrariamente às estirpes de Bti de referência, a
estirpe A19 apresentou resultado negativo para a mobilidade.
A caracterização morfológica da estirpe A19 foi obtida respeitando a terminologia
utilizada no “Bergey’s manual of systematic bacteriology – The Firmicutes” (Vos et al., 2009).
A nível macroscópico, foi feita a caracterização das colónias. Em meio de sangue agarizado
as colónias da estirpe A19 e das estirpes de Bti de referência apresentaram uma forma
circular, com a margem ligeiramente ondulada, a superfície plana e sem brilho, consistência
butirosa, de cor cinza e opaca. A área média das colónias da estirpe A19 (49.08 ± 5.80 mm2)
foi significativamente maior (Tukey’s HSD, p < 0.05) que as restantes estirpes. Foi também
feita uma análise microscópica, considerando a morfologia da célula vegetativa, a área
seccional longitudinal dos esporos, a área seccional do cristal parasporal, e deteção da
presença de flagelos nas 5 estirpes através do método de coloração “flagelar Leifson”. As
células da estirpe A19 na fase vegetativa apresentam forma de bastonete, caraterística das
batérias do género Bacillus. Assim como nas estirpes de Bti de referência, durante a fase
esporulativa da estirpe A19 foi detetada a produção de corpos cristalinos com forma
predominantemente globular tipicamente verificada em estirpes de Bacillus thuringiensis var.
israelensis. A área seccional média dos esporos da estirpe A19 (1 ± 0.16 μm2) foi
significativamente mais pequena (Tukey’s HSD, p < 0.05) que a área obtida para as estirpes
Vec8 e Bioflash. A estirpe A19 distinguiu-se das estirpes de Bti de referência a nível
morfológico, principalmente pela grande dimensão das suas colónias e a ausência de
flagelos nas células em fase vegetativa. A não-mobilidade da estirpe A19, assim como a
ausência de flagelos suportam o resultado negativo obtido na serotipagem, e levaram à
classificação da estirpe A19 como “un-testable” relativamente à serotipagem, de acordo com
Lee et al. (2003).
VII
Relativamente à análise toxicológica, foi feita a quantificação da toxina por esporo para
estirpe A19 e estipes de Bti de referência; e foi realizado um bioteste. A quantificação de
esporos e de proteína total de uma suspensão de esporos-toxina da estirpe A19 e das
estirpes de Bti utilizadas como referência permitiu calcular e comparar a quantidade média
de toxina produzida por esporo, por cada estirpe. A estirpe A19 demonstrou produzir uma
maior quantidade de toxina por esporo (1.64x10⁻⁴ ± 5.84x10⁻⁶ ng de toxina por esporo) do
que as 4 estirpes de referência (Tukey’s HSD, p < 0.05). O bioteste com larvas Aedes
aegypti, estirpe Rockefeller, permitiu confirmar a atividade tóxica da estirpe A19 contra
larvas de mosquito, determinar e comparar o valor de CL50 da estirpe A19 e das outras
estirpes de Bti através de uma análise probit. Os valores de CL50 das estirpes A19 (1.05 ng
mL-1), Vec8 (1.23 ng mL-1), Bioflash (0.97 ng mL-1), Bti4 (1.14 ng mL-1), e IP4444 (1.43 ng
mL-1) não apresentaram diferenças significativas (ANOVA, p = 0.16). Uma vez que a
atividade tóxica apresentada é influenciada pelas proporções de δ-endotoxinas constituintes
do cristal parasporal, este resultado pode significar que a constituição dos cristais
produzidos pela estirpe A19 é semelhante à composição dos cristais produzidos pelas
estirpes de referência.
A análise proteómica da estirpe A19 envolveu a obtenção do perfil de proteínas totais da
fase esporulativa, com recurso à técnica de SDS-PAGE (12%), e comparação do perfil com
as estirpes de Bti de referência, uma estirpe de Bacillus sphaericus e uma estirpe de
Bacillus thuringiensis var. Kurstaki (Btk). A coloração dos géis de proteínas foi feita com
solução de nitrato de prata ou solução de Coomassie blue. O perfil proteico da fase
esporulativa da estirpe A19 apresentou-se semelhante ao perfil das estirpes de Bti testadas,
afastando-se muito dos perfis correspondentes à fase de esporulação da estirpe de B.
sphaericus e de Btk, o que suporta a presença de todo o plasmídeo pBtoxis na estirpe A19.
Nos perfis obtidos para as estirpes de Bti foi possível identificar as bandas correspondentes
às toxinas Cry e Cyt constituintes do cristal parasporal. O facto de a banda correspondente
às proteínas Cry4 se apresentar muito fina, pode dever-se a uma migração imperfeita das
proteínas ou degradação rápida das mesmas. A difícil separação entre as bandas
correspondentes a Cry10Aa e Cry11Aa, e Cyt1Aa e Cyt2Ba deve-se à proximidade dos seus
pesos moleculares e à elevada concentração de proteína.
Os perfis de proteínas totais da fase celular vegetativa das 5 estirpes de Bti foram obtidos
através de 2-D PAGE e MALDI-ToF MS. No perfil de proteínas totais obtido através de 2-D
PAGE da estirpe A19, verificou-se a ausência de 3 bandas relativamente às outras estirpes.
Considerando a ausência de flagelos na estirpe A19, estas bandas podem corresponder a
proteínas flagelares, como FlhF (pI = 5.55 e Pm = 49.85; SwissProt), e proteína flagelar 2
associada ao gancho (pI = 5.67 e Pm = 49.90; SwissProt). A terceira proteína parece
corresponder à banda marcada como B6 por Hirose e colaboradores (2000), não
VIII
identificada. A ausência de flagelos pode significar a diminuição da libertação de fatores de
virulência, o que representaria uma vantagem desta estirpe como biopesticida, por isso será
importante identificar as proteínas ausentes no perfil proteico da estirpe A19.
Os perfis de proteínas obtidos através da técnica espectrometria de massa MALDI-ToF
possibilitaram a construção de um dendrograma, e assim o agrupamento de diferentes
estirpes de Bacillus, realçando a semelhança da estirpe A19 com as estirpes Bti de
referência (Vec8, Bioflash, Bti4 e IP4444), nomeadamente com a estirpe Vec8. Apesar das
semelhanças, evidências a nível morfológico e molecular suportam a condição autóctone da
estirpe A19.v
A abordagem genómica incluiu a amplificação da região codificante da subunidade
ribossomal 16S e amplificação das regiões codificantes das proteínas Cry e Cyt, através de
PCR e posterior deteção em gel de agarose; e tentativa de obtenção da “impressão digital”
da estirpe A19 através da aplicação da técnica de RAPD-PCR. Foi feita uma extração de
DNA total, à estirpe A19 e estirpes de referência. A qualidade do DNA extraído foi
confirmada através da amplificação da região de DNA codificante correspondente à
subunidade ribossomal 16S, apresentando nas 5 estirpes cerca de 1500 pb. Foram
detetados os genes codificantes das endotoxinas Cry4Aa, Cry4Ba, Cry10Aa, Cry11Aa,
Cyt1Aa e Cyt2Ba, através da realização de um PCR e eletroforese em gel de agarose. A
sua deteção apoia a hipótese da presença de todo o plasmídio pBtoxis na estirpe A19,
assim como nas estirpes de referência. A obtenção de “impressões digitais” de DNA através
do método de RAPD-PCR não foi bem-sucedido.
Em conclusão, este estudo suporta a classificação da estirpe A19 como Bacillus
thuringiensis var. israelensis, e permitiu aprofundar o conhecimento sobre esta estirpe. A
condição da estirpe A19 como “microrganismo autóctone” foi apoiada a nível morfológico e
molecular. A estirpe A19 mostrou ter potencial como biopesticida e ainda vantagens a nível
ambiental e económico.

IX
INDEX
ACKNOWLEDGMENTS.............................................................................................. II
ABSTRACT ................................................................................................................ III
SUMÁRIO .................................................................................................................. IV
RESUMO .................................................................................................................... V
INDEX ....................................................................................................................... IX
LIST OF FIGURES .................................................................................................... XI
LIST OF TABLES .................................................................................................... XII
ABBREVIATIONS ................................................................................................... XIII
1. INTRODUCTION ..................................................................................................... 1
1.1. Bacillus thuringiensis var. israelensis (Bti) ................................................................1 1.1.1. History ............................................................................................................................................... 1 1.1.2. Characteristics .................................................................................................................................. 1 1.1.3. Classification .................................................................................................................................... 2 1.1.4. Parasporal Crystal ........................................................................................................................... 3
1.1.4.1. Cry proteins .............................................................................................................................. 3 1.1.4.2. Cyt proteins ............................................................................................................................... 4 1.1.4.3. Mode of action .......................................................................................................................... 4 1.1.4.4. Synergism ................................................................................................................................. 5
1.1.5. Effects on Humans .......................................................................................................................... 5
1.2. The natural reserve Bolle di Magadino........................................................................5 1.2.1. Importance and generalities ........................................................................................................... 5 1.2.2. Problematic ....................................................................................................................................... 6
1.3. Aim of the Project ..........................................................................................................7
2. MATERIALS AND METHODS ................................................................................ 7
2.1. Bacterial strains .............................................................................................................7
2.2 Growth conditions ..........................................................................................................9
2.3. Growth curve ................................................................................................................ 10
2.4. Biochemical tests ......................................................................................................... 11 2.4.1. API galleries.................................................................................................................................... 11
2.4.1.1. API 20E ................................................................................................................................... 11 2.4.1.2. API 50CHB ............................................................................................................................. 11
2.4.2. Vitek identification (ID) Gram-positive (GP) cards .................................................................... 11 2.4.3. Voges-Proskauer (VP) tube test .................................................................................................. 12 2.4.4. Oxidase test .................................................................................................................................... 12 2.4.5. Serotyping ....................................................................................................................................... 12
2.5. Motility test ................................................................................................................... 13 2.5.1. MIO semi-solid medium motility test ........................................................................................... 13
2.6. Morphological tests ..................................................................................................... 13 2.6.1. Colonies description and measurements ................................................................................... 13 2.6.2. Vegetative cells description .......................................................................................................... 14 2.6.3. Spores and parasporal crystals description and measurments .............................................. 14 2.6.5. Leifson flagellar staining ............................................................................................................... 14
2.7. Toxicological test ......................................................................................................... 15
X
2.7.1. Spores quantification ..................................................................................................................... 15 2.7.2. Toxin quantification ........................................................................................................................ 16 2.7.3. Amount of toxin per spore ............................................................................................................ 17 2.7.4. Silver nitrate staining ..................................................................................................................... 18 2.7.5. Rearing of mosquito larvae .......................................................................................................... 18 2.7.6. Bioassay .......................................................................................................................................... 19
2.8. Proteomics .................................................................................................................... 20 2.8.1. Spore-phase protein’s profile ....................................................................................................... 20
2.8.1.1. Sodium dodecyl sulfate polyacrylamyde gel electrophoresis (SDS-PAGE) ................. 20 2.8.1.2 Coomassie blue staining ........................................................................................................ 20
2.8.2. Vegetative cell total protein’s profile ........................................................................................... 20 2.8.2.1. Protein Extraction .................................................................................................................. 20 2.8.2.2. Two-dimensional polyacrylamide gel electrophoresis (2-D PAGE) ............................... 21 2.8.2.4. Matrix-assisted laser desorption/ionization time-of-flight mass spectrometry (MALDI-
ToF MS) ................................................................................................................................................. 22
2.9. Genomics ...................................................................................................................... 23 2.9.1. DNA extraction ............................................................................................................................... 23 2.9.2. 16S ribosomal coding region........................................................................................................ 23 2.9.3. cry and cyt genes’ detection ......................................................................................................... 24 2.9.4. Random amplified polymorphic DNA polymerase chain reaction (RAPD-PCR) .................. 25
3. RESULTS .............................................................................................................. 26
3.1. Growth curve ................................................................................................................ 26
3.2. Biochemical Characterization .................................................................................... 26 3.2.1. API 20E and API 50CHB .............................................................................................................. 26 3.2.2. Vitek ID-GP card ............................................................................................................................ 28 3.2.3. Oxidase tests .................................................................................................................................. 30 3.2.4. Serotyping ....................................................................................................................................... 30
3.3. Motility ........................................................................................................................... 31
3.4. Morphological Characterization ................................................................................. 31 3.4.1. Macroscopic .................................................................................................................................... 31 3.4.2. Microscopic ..................................................................................................................................... 31
3.4. Toxicological test ......................................................................................................... 34 3.4.1. Amount of toxin per spore ............................................................................................................ 34 3.4.2. Bioassay .......................................................................................................................................... 35
3.5. Proteomics .................................................................................................................... 36 3.5.1. Total Bti spore-phase protein profile (SDS-PAGE) ................................................................... 36 3.5.2. Total Bti vegetative cell protein profile (2-D PAGE) .................................................................. 37 3.5.3. Total Bti vegetative cell protein profile (MALDI–ToF MS) ........................................................ 39
3.6. Genomic analysis ......................................................................................................... 39 3.6.1. 16S ribosomal coding region........................................................................................................ 39 3.6.2. cry and cyt genes detection ......................................................................................................... 40 3.6.3. Total Bti vegetative cell DNA profile (RAPD-PCR) ................................................................... 40
4. DISCUSSION ........................................................................................................ 40
5. CONCLUSION ...................................................................................................... 45
6. REFERENCES ...................................................................................................... 47
XI
LIST OF FIGURES
Fig. 1 Bolle di Magadino, Verzasca Valley point of view. Page 6
Fig. 2 Growth curves of A19 and Vec8 Bti strains. Page 26
Fig. 3 SEM images of Bti and Bc strains spore-phase. Page 32
Fig. 4 Highlighted flagella by the Leifson flagellar staining. Page 33/34
Fig. 5 Graphical representation of the amounts of toxin per spore of
Bti strains tested.
Page 34
Fig. 6 Amount of protein for 3.5x10⁶ spores: (a) SDS-PAGE (12%)
with total proteins of Bti spore-phase. (b) Graphical
representation of SDS-PAGE band intensity.
Page 35
Fig. 7 Mortality curves of L3-early instars larvae of the biological
model Ae. aegypti Rockefeller exposed to different Bti strains.
Page 36
Fig. 8 SDS-PAGE (12%) of total proteins from the Bti spore-phase. Page 37
Fig. 9 2-D PAGE (12%) of total protein profile from the vegetative
cell-phase.
Page 38
Fig. 10 Phyloproteomics relationship between A19 and other Bacillus
strains, based on profiles of total proteins from vegetative cells,
obtained by MALDI-ToF MS.
Page 39
Fig. 11 16S ribosomal subunit encoding region detection. Page 39
Fig. 12 A19 strain’s cry and cyt genes detection. Page 40
XII
LIST OF TABLES
Table 1. Bacterial strains. Page 8/9
Table 2. Bradford microassay dilutions for standard curve. Page 17
Table 3. Primers (Microsynth AG, Balgach, Switzerland) for cry and cyt
genes detection PCR.
Page 24/25
Table 4. API 50CHB and API 20E biochemical tests. Page 27/28
Table 5. Vitek biochemical test. Page 28/29
Table 6. Vitek resistance test. Page 30
Table 7. Serotyping reactions. Page 30
Table 8. Morphological measurements. Page 33
XIII
ABBREVIATIONS
% (v/v) Percentage (mL/mL)
% (w/v) Percentage (g/mL)
x g Relative centrifugal force
2-D Two-dimensional
π Pi = 3.14159265...
APS Ammonium persulfate
ATCC American type culture collection
ATP Adenosine-5'-triphosphate
ATPase Adenisine triphosphatase
Ba Bacillus anthracis
Bc Bacillus cereus
bp Base pairs
BSA Bovine serum albumine
Bt Bacillus thuringiensis
Bti Bacillus thuringiensis var. israelensis
Btk Bacillus thuringiensis var. kurstaki
CHAPS 3 - [(3 - cholamidopropyl) dimethylammonio] propanesulfonic acid
CHCA α-cyano-4-hydroxycinnamic acid
CI 95% 95% confidence interval
CL50 Concentração letal de 50% da população
DAPI 4',6-diamidino-2-phenylindole
DNA Deoxyribonucleic acid
dNTPs deoxyribonucleotide
DSM Deutsche Sammlung von Mikroorganismen
DTT 1,4–dithio–D–threitol
EDTA Ethylenediaminetetraacetic acid
EtOH Ethanol
Fig. Figure
GYS Glucose-yeast-salts
hrs Hours
ICP Insecticidal crystal protein
IEF Isoelectric focusing
IntDen Intensity/Density
IP Institut Pasteur
IPG Immobiline™ DryStrip gel

XIV
pI Isoelectric point
k Specific growth rate
LB Lysogeny broth
LC50 Lethal concentration of 50% of the population
LPS Lipopolysaccharide
MALDI Matrix-assisted laser desorption/ionization
min Minutes
MIO Motility indole ornithine
MS Mass spectrometry
MS/MS Tandem mass spectrometry
Mw Molecular weight
n Number of replicates
ND Not determined
NL Non linear
OD Optical density
o/n Overnight
PAGE Polyacrylamide gel electrophoresis
PBS Phosphate buffered saline
PCR Polymerase chain reaction
PFT Pore forming toxins
Pm Peso molecular
PMF Peptide mass fingerprinting
r Radius
RAPD Random amplified polymorphic DNA
RNA Ribonucleic acid
rpm Rotations per minute
RT Room temperature
SD Standard deviation
SDS Sodium dodecyl sulphate
sec Seconds
SEM Scanning electron microscopy
sol. Solution
TBE Tris - borate - EDTA
Td Doubling time
TEMED Tetramethylethylenediamine
TFA Trifluoroacetic acid

XV
ToF Time-of-flight
TSB Tryptone soy broth
UV Ultra violet
VP Voges-Proskauer
1
1. INTRODUCTION
1.1. Bacillus thuringiensis var. israelensis (Bti)
1.1.1. History
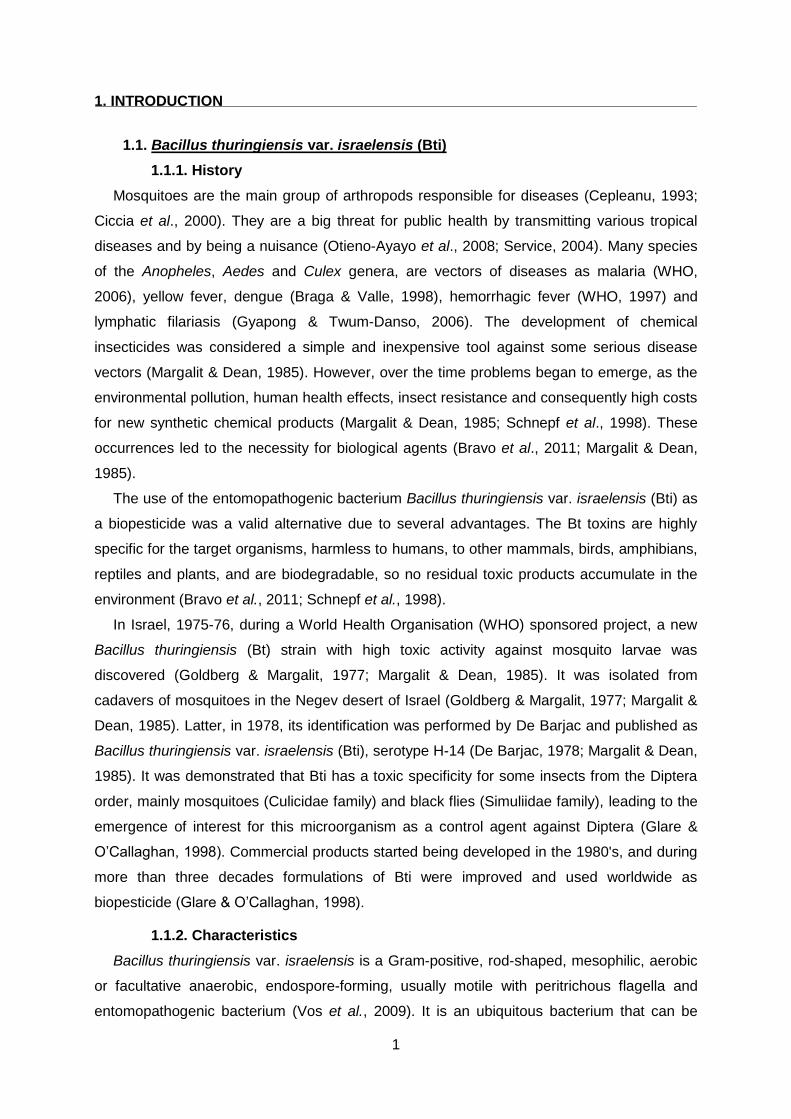
Mosquitoes are the main group of arthropods responsible for diseases (Cepleanu, 1993;
Ciccia et al., 2000). They are a big threat for public health by transmitting various tropical
diseases and by being a nuisance (Otieno-Ayayo et al., 2008; Service, 2004). Many species
of the Anopheles, Aedes and Culex genera, are vectors of diseases as malaria (WHO,
2006), yellow fever, dengue (Braga & Valle, 1998), hemorrhagic fever (WHO, 1997) and
lymphatic filariasis (Gyapong & Twum-Danso, 2006). The development of chemical
insecticides was considered a simple and inexpensive tool against some serious disease
vectors (Margalit & Dean, 1985). However, over the time problems began to emerge, as the
environmental pollution, human health effects, insect resistance and consequently high costs
for new synthetic chemical products (Margalit & Dean, 1985; Schnepf et al., 1998). These
occurrences led to the necessity for biological agents (Bravo et al., 2011; Margalit & Dean,
1985).
The use of the entomopathogenic bacterium Bacillus thuringiensis var. israelensis (Bti) as
a biopesticide was a valid alternative due to several advantages. The Bt toxins are highly
specific for the target organisms, harmless to humans, to other mammals, birds, amphibians,
reptiles and plants, and are biodegradable, so no residual toxic products accumulate in the
environment (Bravo et al., 2011; Schnepf et al., 1998).
In Israel, 1975-76, during a World Health Organisation (WHO) sponsored project, a new
Bacillus thuringiensis (Bt) strain with high toxic activity against mosquito larvae was
discovered (Goldberg & Margalit, 1977; Margalit & Dean, 1985). It was isolated from
cadavers of mosquitoes in the Negev desert of Israel (Goldberg & Margalit, 1977; Margalit &
Dean, 1985). Latter, in 1978, its identification was performed by De Barjac and published as
Bacillus thuringiensis var. israelensis (Bti), serotype H-14 (De Barjac, 1978; Margalit & Dean,
1985). It was demonstrated that Bti has a toxic specificity for some insects from the Diptera
order, mainly mosquitoes (Culicidae family) and black flies (Simuliidae family), leading to the
emergence of interest for this microorganism as a control agent against Diptera (Glare &
O’Callaghan, 1998). Commercial products started being developed in the 1980's, and during
more than three decades formulations of Bti were improved and used worldwide as
biopesticide (Glare & O’Callaghan, 1998).
1.1.2. Characteristics
Bacillus thuringiensis var. israelensis is a Gram-positive, rod-shaped, mesophilic, aerobic
or facultative anaerobic, endospore-forming, usually motile with peritrichous flagella and
entomopathogenic bacterium (Vos et al., 2009). It is an ubiquitous bacterium that can be

2
isolated from different habitats, as soil and insects cadavers (Schnepf et al., 1998). During
sporulation, Bti produces one or more globular shaped proteinaceous crystals per spore, with
toxic activity typically against members from Diptera order (Tyrell et al., 1981), which are
codified by genes located on the pBtoxis megaplasmid (127.92 kb) (Berry et al., 2002).
1.1.3. Classification
The term "Bacillus cereus group", usually used to refer a group of Gram-positive, rod-
shaped and endospore-forming bacteria whose taxonomy is still not very clear, has no
taxonomic value (Bavykin et al., 2004; Drobniewski, 1993; Vilas-Bôas et al., 2007). Bacillus
thuringiensis (Bt) is included in the Bacillus cereus group, together with four other species, B.
cereus (Bc) (stricto sensu), B. anthracis (Ba), B. mycoides, B. pseudomycoides and B.
weihenstephanensis (Vilas-Bôas et al., 2007). Bt, Bc (stricto sensu) and Ba are genetically
very close, which complicates their classification (Vilas-Bôas et al., 2007). Initially, these
organisms were classified as different species due to the big importance of some
phenotypical differences (Bavykin et al., 2004; Vilas-Bôas et al., 2007). Ba can produce a
capsule and a toxin responsible for a human-affecting disease, the anthrax; Bc (stricto
sensu) can cause food poisoning; and Bt produces the parasporal crystal with toxic activity
against insects from diverse orders (Vilas-Bôas et al., 2007). Afterward, the comparison of
their 16S rRNA sequences supported a single-specie hypothesis, since these organisms
showed more than 99% of sequence similarity, and as conservative criterion is
recommended at least 3% of divergence to delimit species (Bavykin et al., 2004). The single-
specie hypothesis is supported by other molecular methods, such as chromosomal DNA
hybridization (Seki et al., 1978), amplified fragment length polymorphism (AFLP) analysis
and cellular fatty acid patterns (Hill et al., 2004).
The classical biochemical tests, that can be very variable, and morphological methods
used for bacteria classification, do not allow the distinction between Bc and Bt (Schnepf et
al., 1998). However, they complement the information about the organism and help when
other techniques are unclear. The production of a parasporal body and the presence of its
coding-plasmid in Bt, allow its distinction from the other members of the Bacillus cereus (lato
sensu) group (Vilas-Bôas et al., 2007).
Bt strains have been classified into different types, based on their flagellar antigens. The
H-serotyping method, based on an immunological reaction between the H-specific anti-sera
and the flagellar H-antigens, has been an useful test for Bt strains classification for many
years, due to its easiness and specificity (De Barjac & Frachon, 1990). Despite its utility, this
methodology presents some limitations, such as the possibility of a spontaneous
autoagglutination in NaCl (0.85%) in the absence of a specific antiserum, observed in some
strains; and the inability to serotype Bt strains without flagella (Lecadet et al., 1999; Chaves

3
et al., 2008). Isolates without a parasporal inclusion reacting with the Bt specific anti-sera can
also be found (Lecadet et al., 1999). These isolates can represent Bt strains that have lost
the crystal proteins codifying plasmid, or Bc with antigens in common with Bt (Lecadet et al.,
1999).
Molecular methods such as sodium dodecyl sulphate polyacrylamide gel electrophoresis
(SDS-PAGE) of total cell proteins (Berber, 2004), random amplified polymorphic DNA
Polymerase chain reaction (RAPD-PCR) (Chaves et al., 2010; Kumar et al., 2009), and
extended multiplex PCR (Ben-dov et al., 1997), can be very informative for the identification
of those strains that cannot be serotyped through the flagellar antigen technique. The use of
the SDS-PAGE technique of total cell proteins to compare the different profiles obtained
between strains can be useful to group bacteria, since the most similar profiles correspond to
closer strains (Berber, 2004; Black, 2004). RAPD-PCR is considered a very useful technique
for the discrimination of related organisms and molecular characterization based on their
DNA fingerprints (Chaves et al., 2010; Kumar et al., 2009). The extended multiplex PCR
screening is considered a rapid method to detect and differentiate the different Bt strains,
and predict their insecticidal activities, based on the PCR product profile (Ben-dov et al.,
1997).
1.1.4. Parasporal Crystal
The Bti crystalline inclusions are globular-shaped, with a diameter average of 1 µm
(Boisvert, 2005). They are produced adjacent to the endospore during the stationary growth
phase of the bacterium (Schnepf et al., 1998). These parasporal inclusions are produced as
one or more units per spore, and are mainly composed by one or more insecticidal proteins
(δ-endotoxins; ICPs; Cry and Cyt proteins) (Hofte & Whiteley, 1989; Tyrell et al., 1981; WHO,
1999). The δ-endotoxins are classified in two multigenic families, Cry and Cyt, based on the
tridimensional structure and mode of action of the proteins (Chaves et al., 2008). Bti
produces four known Cry proteins (Cry4Aa, Cry4Ba, Cry10Aa and Cry11Aa) and two Cyt
proteins (Cyt1Aa and Cyt2Ba), synthesized as protoxins, i.e. proteins that need to be
modified to be toxic (Angsuthanasombat et al., 2004; Berry et al., 2002). The proteolytic
activation of the protoxins occurs by the cleavage of fragments from both N- and C-terminals
(Bravo, 1997). Cry and Cyt proteins, can act synergistically (Schnepf et al., 1998).
1.1.4.1. Cry proteins
The proteins from the Cry multigenic family are all structurally similar: globular molecules
composed of three domains (Bravo et al., 2008; Schnepf et al., 1998). The domain I, in the
N-terminal region of the polypeptide, is composed by a seven helix bundle, a hydrophobic
helix surrounded by six anphipathic helices, responsible for the membrane insertion of the
toxin and pore formation. The domain II is composed by three anti-parallels β-sheets

4
rounding a hydrophobic nucleus, and forming a prism-like structure; its loop regions are
implicated in toxin-receptor interaction and specificity. The domain III is in the C-terminal
region, and is composed by two anti-parallels β-sheets (Angsuthanasombat et al., 2004;
Bravo et al., 2008). Its exposed regions, as for domain II, are involved in the receptors
connection (Bravo et al., 2008). The domain III shares some structural similarity with
carbohydrate-binding proteins, what suggests that the carbohydrate presence can influence
the mode of action of the three Cry toxins domains (Bravo et al., 2008). The Cry proteins
have a range of molecular masses from 50 kDa to 140 kDa (Bravo, 1997). During the
activation, Cry4Aa and Cry4Ba protoxins (130 kDa) are processed in 47 - 48 kDa and 16 - 18
kDa polypeptides (Angsuthanasombat et al., 1993), which have an intermediate form of
approximately 60 kDa (Yamagiwa et al., 2004). The Cry11 protoxin (70 kDa) became active
after being processed in a 34 kDa and a 32 kDa associated fragments (Bravo et al., 2008;
Yamagiwa et al., 2004).
1.1.4.2. Cyt proteins
The Cyt proteins include two very related gene families (cyt1 and cyt2) (Bravo et al.,
2008). Cyt proteins belong to a class of bacterial toxins known as pore-forming toxins (PFT);
they are secreted as water-soluble proteins that undergo conformational changes in order to
be insert into the membrane (Bravo et al., 2008; Bravo et al., 2011). They have a single α-β
domain, where the two outer layers of the α-helix hairpins are wrapped around the β-sheet
(Bravo et al., 2008). Cyt proteins, also known as hemolytic factors, have an hemolytic
(cytolytic) activity in vitro (Butko, 2003; Thomas & Ellar, 1983). These proteins are mainly
associated to Bt strains that are active against some insects from the Diptera order, but are
not exclusive of strains with this pathotype (Bravo et al., 2008; Guerchicoff et al., 2001).
Similar to the Cry proteins, the Cyt proteins are synthesized as protoxins and became active
after the cleavage of small portions in the N- and C-terminal ends (Bravo et al., 2008; Cahan
et al., 2008). The Cyt1Aa and Cyt2Bb protoxins have a molecular weight of 27 - 28 kDa, and
after their activation their molecular weights are approximately 23 - 24 kDa (Cahan et al.,
2008; Guerchicoff et al., 1997).
1.1.4.3. Mode of action
After the ingestion by the susceptible insect larvae, the Bt crystals are dissolved in the
alkaline midgut pH and the protoxins are activated by proteases in the larval gut
(Angsuthanasombat et al., 1993, 2004; Yamagiwa et al., 1999). The activated toxic peptides
are relatively more resistant to the continuous action of proteases (Angsuthanasombat et al.,
2004). Cry active toxins bind to diverse and specific receptors in the midgut epithelial cells of
the microvilli apical membrane, which leads to toxin oligomerization and membrane insertion,
creating a permeable pore (Gómez et al., 2007). These pores cause the swelling and
5
osmotic lyses of the target cells, resulting in serious damages of the larval midgut, with the
consequent death of the larva (Angsuthanasombat et al., 2004). Contrary to the Cry toxins,
Cyt toxins interact directly with the unsaturated membrane phospholipids, due to their highly
hydrophobic nature (Cahan et al., 2008; Thomas & Ellar, 1983). After this interaction, the
toxins insert into the membrane and form pores in the cell membrane, or destroy it by a
detergent-like interaction, what will damage the larvae midgut cells, and lead to their death
(Butko, 2003; Gómez et al., 2007).
1.1.4.4. Synergism
Up to now, no resistance to Bti toxins has been observed in the field by the mosquito
species controlled with Bti-based products (Ibarra et al., 2003; Pérez et al., 2005). The
apparent lack of resistance to the Bti biopesticide products may be due to the presence of
the Cyt1Aa protein in the crystal (Bravo et al., 2008). With its presence, resistance to Cry
proteins cannot be selected (Bravo et al., 2008; Gómez et al., 2007). It was established that
Cyt1Aa and Cry11Aa toxins have a synergetic effect. In fact, the Bti crystals activity, that
usually involves more than one protein, is much higher compared to the toxic activity of
single proteins (Bravo et al., 2008). Cyt1Aa seems to act as a receptor molecule, i.e. Cyt1Aa
inserts into the membrane and exposes specific regions, promoting the biding of Cry11Aa
and its insertion into the cell membrane, leading to an increased toxic effect (Gómez et al.,
2007; Pérez et al., 2005).
1.1.5. Effects on Humans
The δ-endotoxins produced by Bt present high specificity to the target organism and
showed to be safe to non-target mammals (Gómez et al., 2007; Margalit & Dean, 1985;
Thomas & Ellar, 1983b).
In order to be accepted as the main component of a biopesticide, a Bti strain has to fulfil
some stringent biosafety criteria (Boisvert, 2005). Only if it is safe for humans and
vertebrates and for the environment, it can be commercialized (Boisvert, 2005). Despite the
tests performed to ensure the safety of a strain, it was demonstrated that, as for B. cereus
(stricto sensu), also Bti strains could produce virulence factors during the vegetative growth,
including some of the strains already commercialized (Ghelardi et al., 2002; Yuan et al.,
2002).
1.2. The natural reserve Bolle di Magadino
1.2.1. Importance and generalities
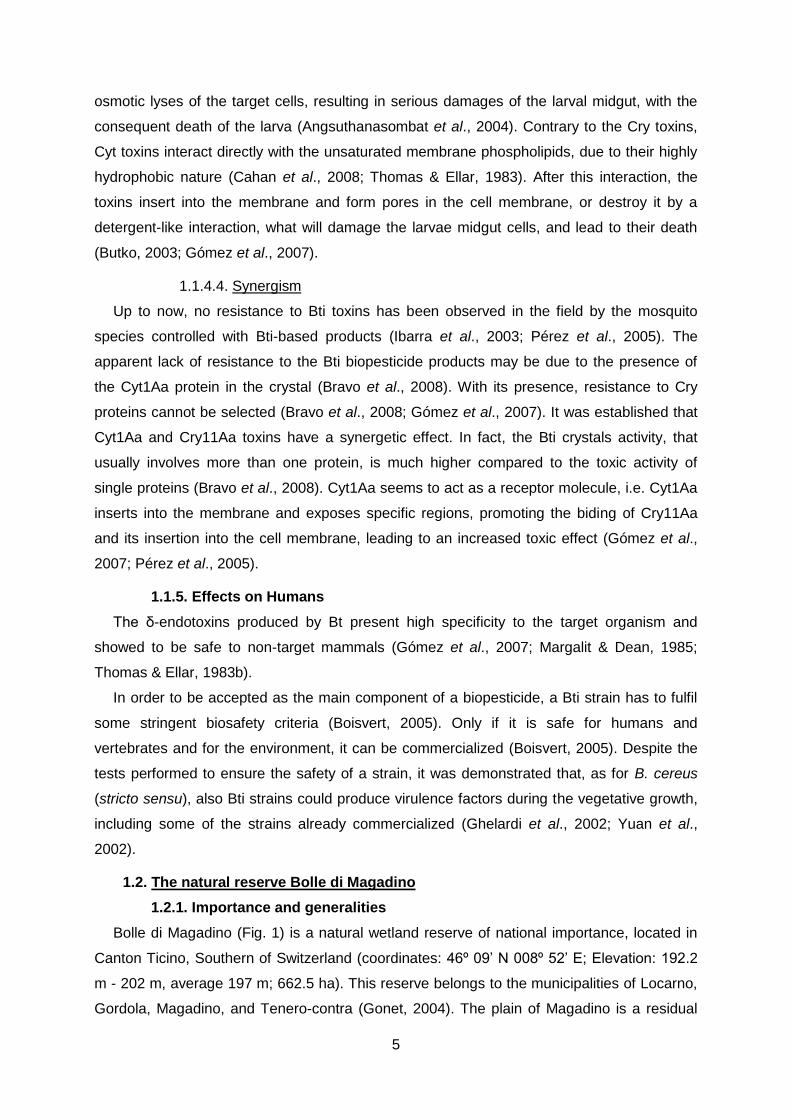
Bolle di Magadino (Fig. 1) is a natural wetland reserve of national importance, located in
Canton Ticino, Southern of Switzerland (coordinates: 46º 09’ N 008º 52’ E; Elevation: 192.2
m - 202 m, average 197 m; 662.5 ha). This reserve belongs to the municipalities of Locarno,
Gordola, Magadino, and Tenero-contra (Gonet, 2004). The plain of Magadino is a residual
6
part of a swamp, that includes a delta created by the outlet of Ticino and Verzasca rivers on
the Lake Maggiore, with a width extension of 3’400 m (Gonet, 2004). The climate is
temperate (annual average temperature: 10.8 °C) due to the thermoregulatory influence of
the lake and to the presence of the Alpine chain, that protects the area from the northern
winds (Gonet, 2004). The precipitations are abundant (annual average precipitations: 1904
mm), mainly during the spring and autumn seasons (Gonet, 2004).
Fig. 1. Bolle di Magadino, Verzasca Valley point of view. (Picture: I. Cabral).
Bolle di Magadino is a remarkable area for its biodiversity (fauna and flora), and its
importance as a breeding and migratory site for many species of birds (Gonet, 2004;
Lucchini et al., 1990). It is also important for its social and cultural value (forestry production,
fishing, agriculture, leisure activities, education and industry), and even for its landscapes
(Gonet, 2004). Its characteristics made Bolle di Magadino a protected area for the Canton
Ticino since 1979 (Gonet, 2004), and led to its inclusion on the list of wetlands of
international importance of the Ramsar Convention, in 1982 (Ramsar, Iran, 1971).
1.2.2. Problematic
The periodic floods of the Bolle di Magadino plain during the spring and summer months
due to heavy precipitation and rising level of the Lake Maggiore, made this area a major
breeding site for the floodwater mosquitoes, mainly Aedes vexans and Ochlerotatus sticticus
species (Eilenberg & Hokkanen, 2006). The high density of mosquitoes developing in this
area represents a big problem, especially given the impact on tourism economy. Since 1998,
a research group for monitoring Bti in the ecosystem, deals with the control of mosquitoes
populations using a Bti-based product (Gonet, 2004). Regular treatments with VectoBac-G®
(Valent BioSciences, Libertyville, IL, USA) have been carried out since 1988 in Bolle di
7
Magadino (Guidi et al., 2010). Aerial applications by helicopter have proved to be the only
method to reach efficiently the larval breeding sites (Eilenberg & Hokkanen, 2006).
VectoBac-G® is a biopesticide composed by a natural and innocuous corn cop granules
supporting the active component, the parasporal crystals and viable spores of Bti (strain AM
65-52) (Eilenberg & Hokkanen, 2006).
During a previous project aiming to monitor the fate of Bti spores in the soil of the Bolle di
Magadino reserve, a new strain of Bacillus thuringiensis var. israelensis, named A19, was
isolated in 2002 by Chappuis (Chappuis, 2002). Since this new strain is probably an
autochthonous organism showing toxic activity against mosquito larvae, a better knowledge
of its characteristics is important. Depending on its characteristics, the replacement of the
VectoBac-G® formulation and the commercial production of A19 strain, are possibilities that
can be considered in the future.
1.3. Aim of the Project
This thesis aimed to deepen the knowledge about A19 Bti strain, through physiological,
toxicological and molecular approaches and the application of the MALDI-ToF MS technique
as a complementary analysis, in order to access the possibility to apply A19 strain as an
autochthonous control agent against mosquito larvae at the natural reserve Bolle di
Magadino.
In order to achieve the scope, morphological characterizations, at macro and microscopic
level, were performed. Moreover the A19 strain was tested for motility, and its biochemical
profile, by using API galleries, Vitek identification (ID) Gram-positive (GP) cards and
serotyping, were determined. The proteomic analysis of A19 strain was carried out by spore-
phase total proteins’ profile by SDS-PAGE, and vegetative cell-phase total proteins’ profile
obtained by 2-D PAGE, and MALDI-ToF MS techniques. The genomic analysis, by
amplification and detection of 16S ribosomal encoding region and detection of toxin coding
genes, was performed. The toxicity of A19 strain through a bioassay, using Aedes aegypti,
Rockefeller strain mosquito larvae, was also evaluated. All techniques used were applied in
parallel to AM 65-52 Bti strain (referred throughout the study as Vec8), the active component
of the VectoBac-G® commercial product currently applied in Bolle di Magadino reserve, and
three other Bti reference strains (referred throughout the study as Bioflash, Bti4 and IP4444).
2. MATERIALS AND METHODS
2.1. Bacterial strains
Five different strains of Bacillus thuringiensis var. israelensis were included in this study,
as well as six non-Bti strains from ICM collection used as control strains (Table 1). All the
8
bacterial strains used were initially stocked in skim milk solution (10% (w/v) skim milk, 10%
(v/v) bovine serum, 20% (v/v) glycerol) at -80 °C.
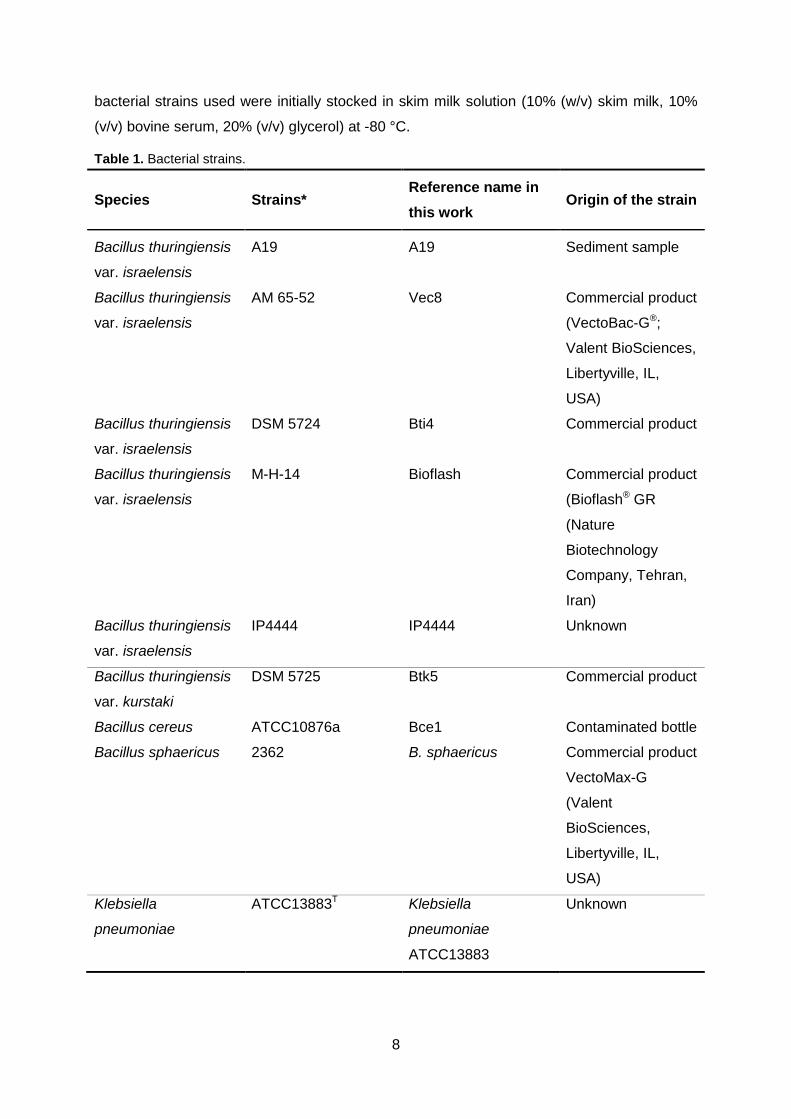
Table 1. Bacterial strains.
Species Strains* Reference name in
this work Origin of the strain
Bacillus thuringiensis
var. israelensis
A19 A19 Sediment sample
Bacillus thuringiensis
var. israelensis
AM 65-52 Vec8 Commercial product
(VectoBac-G®;
Valent BioSciences,
Libertyville, IL,
USA)
Bacillus thuringiensis
var. israelensis
DSM 5724 Bti4 Commercial product
Bacillus thuringiensis
var. israelensis
M-H-14 Bioflash Commercial product
(Bioflash® GR
(Nature
Biotechnology
Company, Tehran,
Iran)
Bacillus thuringiensis
var. israelensis
IP4444 IP4444 Unknown
Bacillus thuringiensis
var. kurstaki
DSM 5725 Btk5 Commercial product
Bacillus cereus ATCC10876a Bce1 Contaminated bottle
Bacillus sphaericus 2362 B. sphaericus Commercial product
VectoMax-G
(Valent
BioSciences,
Libertyville, IL,
USA)
Klebsiella
pneumoniae
ATCC13883T Klebsiella
pneumoniae
ATCC13883
Unknown
9
Table 1. (Continued).
Species Strains* Reference name in
this work Origin of the strain
Pseudomonas
aeruginosa
ATCC27853 Pseudomonas
aeruginosa
ATCC27853
Blood culture
Escherichia coli K12 (GM48
genotype) ATCC
39099
E. coli K12 large intestine,
colon
* ATCC: American Type Culture Collection; DSM: Deutsche Sammlung von Mikroorganismen,
Braunschweig, Germany; IP: Institut Pasteur, Paris, France T Type strain
2.2 Growth conditions
Before each test, bacteria were grown overnight (o/n) on blood agar solid medium
(Nutrient Columbia Agar Base supplemented with 5% of sheep erythrocytes; Becton
Dickinson AG, Basel, Switzerland) to obtain the fresh cultures.
For the bacterial growth curve, bacteria were grown in TSB medium (3% (w/v) tryptone
soy broth (TSB-broth; Oxoid, Switzerland), distilled water) with agitation (approximately 150
rpm) (Unimax 1010 shaker, Heidolph, Germany).
To obtain the spores-toxins suspensions for bioassays, Bti strains (A19, Vec8, Bioflash,
Bti4 and IP4444) from blood agar cultures were inoculated in sporulation solid GYS medium
(0.1% (w/v) glucose, 0.2% (w/v) yeast extract, 0.2% (w/v) (NH4)2SO4, 0.05% (w/v) K2HPO4,
0.02% (w/v) MgSO4.7H2O, 0.005% (w/v) MnSO4.H2O, 0.008% (w/v) CaCl2.H2O and 2% (w/v)
of agar) (Rogoff & Yousten, 1969) and incubated at 30°C during 3 - 4 days, until sporulation
was completed. Each culture was then washed two times in 1 mL of sterile water by
centrifugation (13’100 x g, 5 min, at 4 °C). The spores-toxins suspension was obtained by re-
suspension of the remaining pellet (spores and toxins) in 1 mL of sterile water. The absence
of vegetative cells was confirmed by microscopic observation (AxioLab Microscope; Carl
Zeiss AG, Feldbach, Switzerland) of the spores-toxins suspensions stained with Coomassie
blue staining solution (0.13% (w/v) Coomassie blue in 50% (v/v) acetic acid) (Rampersad et
al., 2002).
Bti spores-crystals suspension, used for morphological characterization and proteomic
analysis (SDS-PAGE), was obtained in liquid sporulation GYS medium (0.1% (w/v) glucose,
0.2% (w/v) yeast extract, 0.2% (w/v) (NH4)2SO4, 0.05% (w/v) K2HPO4, 0.02% (w/v)
MgSO4.7H2O, 0.005% (w/v) MnSO4.H2O, 0.008% (w/v) CaCl2.H2O) (Rogoff & Yousten,
1969). Cultures were grown in 50 mL of liquid GYS medium at 30 °C, with agitation (150
rpm) until sporulation was complete (48 h). The spores and crystals were harvested by
10
centrifugation (10’620 x g, 10 min, at 4 °C). The supernatant was discarded; the pellet was
washed two times with sterile distilled water and the Bti spores-crystals suspensions were
stored at -20 °C.
The MIO semi-solid medium (BD BBL™ Motility Indole Ornithine; Becton Dickinson AG)
was used to test the motility of the strains (Ederer & Clark, 1970).
The NaCl (0.45%) solution was used as medium for the Vitek biochemical analysis.
The incubation temperature of the bacterial cultures was always 30 °C, except for Vitek
biochemical tests, for which was 37 °C.
2.3. Growth curve
The growth curves for A19 and Vec8 strains were performed. For both strains, a pre-
culture was prepared in 20 mL of TSB medium and incubated o/n at 30 °C with agitation (150
rpm) (Unimax 1010 shaker, Heidolph). The OD (optical density) of each suspension was
measured with a wavelength of 600 nm, using a spectrophotometer (UV/VIS Spectrometer
Lambda 2S, Perkin Elmer, Schwerzenbach, Switzerland). The volumes of the inocula were
adjusted to have an initial culture OD of 0.024. Fifty mL of cultures were incubated at 30 °C
with agitation (150 rpm). Two replicates were performed at different times for both strains.
The OD measurements were performed at time intervals of 29.02 to 55.80 min for the first
replicate and 27 to 67.2 min for the second replicate, until the stationary phase was reached.
The OD was registered in triplicate at every measurement time, 0.93, 1.58, 2.07, 2.63, 3.17,
3.72, 4.28, 5.03, 5.67, 6.28 and 6.88 hours for the first replicate; and at 0.75, 1.47, 2.07,
2.62, 3.37, 3.87, 4.42, 5.03, 5.63, 6.20, 6.78, 7.28, 8.40 and 8.85 hours for the second one.
The doubling time (Td) (min) and the specific growth rate (k) (OD min-1) were determined for
both replicates, considering the OD’s average obtained in the exponential phase of the
curves, instead the number of cells, with the following formula:
N = N0 2 n
log N = log N0 + n log 2
n = (log N - log N0) / log 2
Td (min) = (t - t0) / n
Td (min) = ((t - t0) / (log N - log N0)) / log 2
k (OD min-1) = log 2 n / (t - t0)
k (OD min-1) = (log 2 x (3.3 (log N - log N0))) / (t - t0)
In this case, N is the OD corresponding to the absorbance value measured at time t, N0 is the
OD corresponding to the absorbance value measured at time t0, n is the number of
generations occurred during the time interval of exponential growth, k is the specific growth
rate, (t - t0) is the time interval between t0 and t times, corresponding to the exponential
phase of the growth curve (Madigan & Martinko, 2006). For the first replicate, t0 = 124.02 min

11
and t = 302.04 min, and for the second replicate, t0 = 124.00 min and t = 370.02 min, in both
A19 and Vec8 strains.
The k and Td ± SD were determined using the Excel software (Microsoft® Excel®, version
12.0, 2008 for mac). An unpaired t-test (t-test, α set to 0.05) was performed to check if there
were significant differences between the doubling time of A19 and Vec8 Bti strains, using the
GraphPad Prism software (version 5 for windows, GraphPad software, San Diego California
USA, www.graphpad.com).
2.4. Biochemical tests
2.4.1. API galleries
The biochemical characterization was performed with the micromethods API20E and
API50CHB standard tests according to the manufacturer’s instructions (API®, bioMérieux,
Geneva, Switzerland). The tests included in the API galleries are specified in the results.
2.4.1.1. API 20E
For every Bti strain, a cell suspension was prepared in an ampoule of NaCl 0.85%
medium (5 mL) to reach a cell density of 2 McFarland. The tubes of the API gallery were
filled with the cell suspension by using a Pasteur pipette. For the CIT, VP and GEL tests, the
tubes and the cupules were completely filled. An anoxic environment was created for the
tests ADH, LDC, ODC, H2S and URE, by adding a mineral oil drop above the cell suspension
on the cupules of the gallery. The galleries already inoculated with the Bti strains were
incubated at 30 °C. After 24 hrs of incubation, the first registration of the results was done,
except for the TDA, IND and VP tests. After 48 hrs of incubation, a drop of TDA reagent was
added to the TDA test, a drop of JAMES reagent was added to IND test, and a drop of each
VP1 and VP2 reagents was added to VP test, and the results of all reactions were recorded.
All the reactions were evaluated by direct observation, according to the manufacturer’s
instructions.
2.4.1.2. API 50CHB
The initial cell suspension was prepared in an ampoule of API 50CHB medium (5 mL) to
obtain a cell density of 2 McFarland. The tubes of the API galleries were filled with the
suspension and incubated at 30 °C, during 48 h. Results were recorded after 24 hrs and 48
hrs of incubation, according to the manufacturer’s instructions.
2.4.2. Vitek identification (ID) Gram-positive (GP) cards
A bacterial suspension with an optical density of 0.5 - 0.6 McFarland was prepared in
0.45% NaCl solution using a Densicheck (bioMérieux). The Vitek ID-GP card (ID-GP card,
bioMérieux) was used for biochemical analysis. This card includes tests for: reactions
catalyzed by 18 enzymes (phosphatidylinositol phospholipase C, arginine dihydrolase (two
12
tests), β-galactosidase, α-galactosidase, alanine-phenylalanine-proline arylamidase, L-
aspartic acid arylamidase, β-galactosidase, α-mannosidase, alkaline phosphatise, L-leucine
arylamidase, proline arylamidase, β-glucuronidase (two tests), α-galactosidase, L-
pyroglutamic acid arylamidase, alanine arylamidase, tyrosine arylamidase and urease), for
the catabolism of 18 different substrates (amygdalin, xylose, α-cyclodextrin, sorbitol,
galactose, ribose, lactate, lactose, N-acetyl-glucosamine, maltose, mannitol, mannose, β-
methyl-D-glucopyranoside, pullulan, raffinose, salicin, sucrose, and trehalose) and for 5
different types of resistance (polymyxin B, bacitracin, novobiocin, O129, and optochin). The
cell suspension was automatically inoculated in the wells of the ID-GP card, and incubated in
the VITEK® 2 equipment (bioMérieux), at 37 °C. The biochemical profile was automatically
read after some hours of incubation. Three replicates were made for Vec8, Bioflash, Bti4 and
IP4444 Bti strains, and 4 replicates were made for A19 Bti strain.
2.4.3. Voges-Proskauer (VP) tube test
The VP test, to detect the production of acetoin (acetyl methyl carbinol: C4H8O2), was
carried out according to the classical method (Barritt, 1936). A loop of bacteria from the blood
agar Bti culture was re-suspended in 1 mL of sterile distilled water supplemented by 5 mg
mL-1 peptone (Oxoid, Pratteln, Switzerland) and 2.5 mg mL-1 glucose (Merck, Dietikon,
Switzerland). After 48 hrs of incubation at 30 °C, 240 µL of Barritt reagent A (3.75% of α-
naphtol in absolute EtOH) and 80 µL of Barritt reagent B (10% of potassium hydroxide (KOH)
in sterile distilled water) were added to the culture. After 1 min of incubation at RT the results
were recorded. A red colour shift of the suspension means that a positive reaction occurred.
2.4.4. Oxidase test
The oxidase test was performed according Kovacs (1956). It allows the detection of the
enzyme cytochrome oxidase in a bacterial strain. A small loop of N,N-dimethyl-p-phenyl-
enediamine hemioxalate salt powder (Sigma Aldrich, Buchs, Switzerland) was diluted in 10
mL of sterile distilled water. A piece of filter paper was moistened with the solution, and a
loop of Bti culture was smeared above. A shift of the colour to pink and successively to
brown meant a positive result, and a colourless result meant a negative reaction. The result
of the reaction for each strain was immediately recorded. A strain of Pseudomonas
aeruginosa (ATCC27853) was used as positive control.
2.4.5. Serotyping
For the serotyping classification of the Bti strains, a serotyping micromethod, using a 96-
U-shaped wells microplate was performed (Laurent et al., 1996).
Three mL of TSB medium were inoculated with the Bti strains, directly from the stocks
preserved in skim milk (-80 °C). After 5 hrs of incubation at 30 °C, the cell suspensions were
used to inoculate plates of 10 mL semi-solid GARD medium (0.4% (w/v) agar (Oxoid, L11),
13
3% (w/v) thyoglicollat (Oxoid, 415), distilled water). After o/n growth at 30 °C, bacteria were
transferred to new GARD medium plates, and incubated again in the same conditions. A new
culture was grown in 3 mL of TSB medium with 3 - 6 hrs of incubation, at 30 °C, followed by
the fixation of bacteria in 15 μL of 37% formaldehyde (Fluka, Buchs, Switzerland). Ten µL of
NaCl 0.15 M were added to all the wells of a 96-U-shaped wells microplate (Nunc MicroWell
96 well polystyrene plates, round bottom, Sigma, Buchs, Switzerland). The stock anti-
flagellum serum (anti-H-14) was diluted ten times in NaCl 0.15 M. On the first wells’ column,
10 μL of the already diluted anti-flagellum serum were added. Dilutions were made by
transferring 10 μL of the solution from the first wells’ column into the second wells’ column,
and were repeated until four different dilutions (1:200; 1:400; 1:800; 1:1600) were obtained.
Ninety μL of the fixed cells’ suspensions were added to each well, one row of the plate for
each strain. As negative control organism, was used a Bacillus thuringiensis var. kurstaki
strain (not serotyped as H-14). Moreover, negative control tests without microorganisms and
a test with the fixed cells’ suspension in water with no NaCl were performed. To check the
auto-agglutination reaction, a test with the fixed cells’ suspension in NaCl (0.85%) and
without the anti-flagellum serum, was also carried out. The serotyping was performed two
times, and the result observed with a magnifying glass for 96-wells microplates (Sigma) and
recorded through photography (Lumix DMC-TZ7, Panasonic).
2.5. Motility test
2.5.1. MIO semi-solid medium motility test
The motility test was performed using the MIO semi-solid medium method (Ederer &
Clark, 1970). A volume of 300 μL of a NaCl solution (0.85%) was inoculated with Bti
vegetative cells grown on blood agar plates. With a small syringe (1 mL) the cell suspension
was transferred to the MIO semi-solid medium (BD BBL™ Motility Indole Ornithine; Becton
Dickinson AG). The culture was incubated o/n at 30 °C. A Klebsiella pneumoniae
(ATCC13883) was used as negative control (Cowan et al., 1960). The motility, indicated by a
generalized turbidity, was checked by direct observation of the tube culture. This test was
performed two times for the five Bti strains.
2.6. Morphological tests
The morphologic characterization was based on the terminology according to the
“Bergey’s manual of systematic bacteriology - The Firmicutes” (Vos et al., 2009).
2.6.1. Colonies description and measurements
Three dilutions (1:100; 1:1000; 1:10000) were made from the initial spores-crystals
suspension. Fifty μL of each dilution were used to inoculate blood agar Petri dishes. After 24
hrs of incubation at 30 °C, the colonies were characterized, considering their shape, colour,
opacity and β-hemolysis. The diameters of 43 colonies were measured with a calibre. This
14
procedure was carried out three different times for each Bti strain. The average area and
standard deviation (average ± SD) of the colonies were calculated with the Excel software.
One-way analysis of variance (one-way ANOVA, α set to 0.05) was performed to check for
significant differences between the average colonies’ sizes of Bti strains. The Tukey's
multiple comparison test (Tukey’s HSD, α set to 0.05) was further performed to determine
which groups presented a significant difference (SPSS statistics for Windows, ver. 17.0).
2.6.2. Vegetative cells description
A smear of Bti vegetative cells, previously grown on blood agar plates, was made on a
microscope slide. After air-drying and fixing with the flame, the smear was stained with a
drop of Coomassie blue solution (Rampersad et al., 2002), for 5 min. After the staining the
slide was washed with distilled water and air-dried. The Bti vegetative cells were observed by
optical microscopy (100-fold oil immersion objective) (Carl Zeiss AG) and described.
2.6.3. Spores and parasporal crystals description and measurments
A drop of the spores-crystals suspension was added to a microscope slide. After air-
drying, it was fixed with a flame and stained with Coomassie blue solution, as described
above (see section 2.6.2). Spores and parasporal crystals were observed by optical
microscopy using a 100-fold magnification objective (Carl Zeiss AG). To compare the
dimension of spores from the different Bti strains, were performed measurements of lengths
and correspondent widths of 60 Bti spores, for each strain. The area of a longitudinal section
(rectangle-shaped) was calculated (length x width) for each spore measured. The diameter
of the parasporal crystals was also measured and the average of maximum sectional areas
was calculated for a total of 20 crystals for each strain.
The areas of the maximum longitudinal section of spores and crystals were measured
using the AxioVision Image software, ver. 4.6 (Carl Zeiss AG). The average areas and
standard deviations of spores and crystals were determined for each strain using the Excel
software. One-way analysis of variance (one-way ANOVA, α set to 0.05) and the Tukey's
multiple comparison test (Tukey’s HSD, α set to 0.05) were performed to check for significant
differences between the average of spore’s longitudinal section areas of the different Bti
strains, as well as differences between the crystal’s sectional area of the strains.
Scanning electron microscope (SEM) images of Bti and Bc strains spore-phase were
kindly provided by Dr. F. Barja (University of Geneva, Switzerland).
2.6.5. Leifson flagellar staining
The Leifson flagellar staining was carried out according to Clark (1976). The microscope
slides were placed in glass racks inside staining jars and submerged in a cleaning solution
(3% HCl, in 95% ethanol). After four days, the slides were washed 10 times with tap water
and 2 times with distilled water. After air-drying, the slides were handled with forceps.
15
The stain was made by preparing 3 separate solutions: (a) 1.5% NaCl in distilled water;
(b) 3% tannic acid in distilled water; (c) 69.2% of para-rosaniline acetate and 23.1% of para-
rosalinine hydrochloride, in 7.7% of ethyl alcohol (95%). The alcoholic dye solution, (c), was
left o/n at RT to ensure complete solution. Equal volumes of the 3 solutions were well mixed
and left 2 hrs at RT, without disturbing, to have a clear supernatant stain solution.
The cell cultures were initially grown o/n on GARD semi-solid medium at 30 °C. A loop of
cells from the periphery of the colonies was transferred to 4 mL of TSB medium, and
incubated o/n at 30 °C with agitation (150 rpm). After the growth of the cultures, were added
0.25 mL of 37% (v/v) formaldehyde solution (Fluka) to 5 mL of cell suspension, to fix the
cells. After 15 min, the cells were centrifuged (4’100 x g, 10 min, RT), washed with sterile
distilled water, centrifuged again (4’100 x g, 10 min, RT) and the pellet was gently re-
suspended in sterile distilled water, until the suspension was barely turbid. A loop (10 µL) of
bacterial suspension was placed on a tilt washed microscope slide, to let the liquid flow
lengthwise, and it was left to air-dry. One mL of the clear supernatant stain solution (at RT)
was applied above the smear on the slide. After the formation of a precipitate (5 - 15 min),
the slide was carefully washed with tap water and air-dried. The stained flagella were
observed with an optical microscope (Carl Zeiss AG) using the 100-fold magnification
objective.
2.7. Toxicological test
2.7.1. Spores quantification
The mechanism of a weakly staining of the dormant spores using 4’,6’-diamino-2-
phenylindole (DAPI) staining, a primarily nucleic acid-specific, is not well known, but it must
occur at the cortex level (Magge et al., 2009). Based on this information spores quantification
was carried out by fluorescence microscopy, using the DAPI dye. The filtration manifold
equipment (Millipore AG, Volketswil, Switzerland) was first cleaned. A 3.0 μm white subfilter
(type SSWP, mixed cellulose esters, diameter 13 mm; Millipore AG, Volketswil, Switzerland)
was added on the filtration manifold and humidified with sterile distilled water. Above the 3.0
μm subfilter a 0.22 μm brown polycarbonate filter (type GTBP, diameter 13 mm; Millipore
AG) was added. Two mL of sterile water, 10 μL of spores-crystals suspension, and 30 μL of
concentrated DAPI stain were introduced on the filtration manifold, in contact with the brown
filter. The sample was well mixed and incubated during 10 min at room temperature,
protected from the light. After the incubation, the vacuum pump was turned on and the
spores were filtered, remaining on the brown filter surface. In order to wash all the spores
remaining on the borders of the filtration manifold’s cylinder, 2 mL of sterile distilled water
were added and filtered. The brown filter was removed and placed on a microscope slide,
with a Citifluor AF1 (glycerol/PBS; Citifluor Ltd., London, UK) drop. Above the filter, was

16
placed a lamella with a Citifluor AF1 drop on the under surface. The observation of spores
was made by epifluorescence microscopy using the UV filter (AxioLab Microscope; Carl
Zeiss AG, Feldbach, Switzerland). Spores' counting was carried out using a 100-fold
magnification objective and an eyepiece with a 5 x 5 square grid. For each filter, bacterial
cells present in 20 fields (10 on the vertical direction of the filter and 10 on the horizontal
direction), covering an area of 0.01 mm2 each, were counted. Three filters were prepared for
each spores-crystals suspension. The number of spores per mL of suspension was
calculated with the Excel software.
2.7.2. Toxin quantification
The toxin quantification was performed following the Bradford Microassay protocol (Bio-
Rad Laboratoires AG, Reinach, Switzerland), after the parasporal crystals solubilisation.
Triplicates of spores-crystals suspensions (8x10⁷ cfu mL-1) were mixed (50% (v/v)) with an
alkaline solubilisation buffer 1 (0.01 M Na2HPO4, pH 11 (NaOH)) (Robinson & Stokes, 1968)
and incubated o/n at 37 °C, with agitation (300 rpm). For bioassay experiment, 500 μL of
each sample were mixed with 500 μL of Bradford Reagent dye (Quick Start Bradford 1x Dye
Reagent, Bio-Rad) in a spectrophotometer cuvette, and incubated during 5 min at room
temperature. To subtract the spores influence on the toxin quantification, was used a strain
of Bacillus cereus spores suspension, since it doesn't produce the toxin. Samples with 250
μL of B. cereus spore suspension, 250 μL of buffer and 500 μL of Bradford reagent were
used as blank. For protein quantification in 2-D PAGE, the samples were centrifuged (10’620
x g, 10 min, at 4°C), after the o/n toxin solubilisation; 500 μL of their supernatant were used
for the toxin quantification. In this case, was used water as blank, instead the B. cereus
spores’ suspension. Measurements were made with a wavelength of 595 nm, in a
spectrophotometer (UV/VIS Spectrometer Lambda 2S; Perkin Elmer). Quantifications of the
toxin were carried out using a standard curve.
The standard curve for toxin quantification was created using BSA (BSA standard, 2 mg
mL-1, Bio-Rad), following the Bradford microassay protocol (Bio-Rad Laboratoires AG). The
volumes were calculated for a 1 mL cuvette volume (Table 2). The alkaline solubilisation
buffer 1 was used as blank.

17
Table 2. Bradford microassay dilutions for standard curve
Tube # BSA Standard
(µL)
Source of
Standard
Diluent* Volume
(µL)
Final Protein
Concentration
(µg/mL)
1 20 BSA Stock (2
mg/mL)
1580 25
2 32.5 BSA Stock (2
mg/mL)
3217.5 20
3 15 BSA Stock (2
mg/mL)
1985 15
4 1625 tube 2 1625 10
5 1625 tube 4 1625 5
6 1625 tube 5 1625 2.5
7 1500 tube 6 1500 1.25
8 (Blank) - - 1600 0
*The alkaline solubilisation buffer 1 used to solubilise the Bti toxin was used as diluent. # = number.
2.7.3. Amount of toxin per spore
The quantity of toxin per spore produced by each strain was calculated. The spores-
crystals suspension was produced in solid GYS medium. For each Bti strain, the number of
spores in the spores-crystals suspension was counted using the DAPI staining technique by
epifluorescence microscopy (see section 2.7.1.). The correspondent amount of toxin was
quantified following the Bradford microassay method (see section 2.7.2.).
The amount of toxin (ng) per spore (average ± SD) was calculated using the Excel
software. One-way analysis of variance (one-way ANOVA, α set to 0.05) and a Tukey’s HSD
post-hoc test (Tukey’s HSD, α set to 0.05) were performed to check if there were significant
differences among the amounts of toxin per spore produced by the different Bti strains
(SPSS statistics for Windows, ver. 17.0).
To confirm the relative amounts of toxin per spore between the Bti strains, new spores-
crystals’ suspensions were prepared in liquid GYS medium. The spores of each suspension
were counted (see section 2.7.1.) and the toxins quantified (see section 2.7.2.).
A 12% SDS-PAGE, with a stacker of 5% polyacrylamide, was also performed. For each
sample, a spores-toxins suspension volume corresponding to 3.5x10⁶ spores was dried on
the Speed Vac (Savant SpeedVac® concentrator; Thermo Scientific, USA). After dried, the
pellet was re-suspended in 10 µL of sterile distilled water. Was added an equal volume of
alkaline solubilisation buffer 2 (0.05 M sodium carbonated, 0.01 M DTT, pH 10) (Attathom et
al., 1995) to the suspension and incubated o/n at 37 °C, with agitation (250 rpm). After o/n
18
incubation, the samples were centrifuged (10’620 x g, 10 min, at 4 °C) and the supernatants
containing the solubilised toxins suspension, correspondent to 3.5x10⁶ spores, were kept.
The samples for the gel were then prepared to have a final volume of 25 µL, correspondent
to 80% of the toxin suspension and 20% of loading buffer (0.5 M Tris-HCl pH 6.8, 10% SDS,
4% β-mercaptoethanol, 8% glycerol, 0.1% bromophenol blue (1% Bromophenol blue, 0.05 M
Tris, distilled water)) (Chaves et al., 2008). The marker sample consisted on 8% of molecular
weight marker (SDS-PAGE Molecular Weight Standards, Broad Range, Bio-Rad) and 92% of
loading buffer. A sample of 2% BSA standard (Bio-Rad), in 78% of lysis buffer (0.03 M Tris-
HCl pH 8.5, 7 M urea; 2 M thiourea, 4% (w/v) 3-(3-cholamidopropyl-dimethyl-ammonio)-1-
propanesulfonate (CHAPS), 1% (w/v) bromophenol blue) and 20% of loading buffer, was
also included to avoid doubts concerning the bands’ weight. All the samples were warmed at
95 °C during 5 - 10 min, and loaded directly in the wells of the 12% polyacrylamide gel (16
cm). Samples were let migrate for 30 min at 100 V, followed by 6 hrs of migration at 120 -
200 V. After the migration, the gel was washed with distilled water and kept o/n at RT
submerged in a fixing solution (50% (v/v) methanol, 12% (v/v) acetic acid, distilled water) at
150 rpm (Heidolph). Protein profiles were stained with the silver nitrate staining.
2.7.4. Silver nitrate staining
This procedure was performed always with gloves to avoid proteins contamination. The
gels were washed with distilled water and incubated three times in the washing solution (50%
(v/v) EtOH, distilled water) for 10 min. Then, the gels were rehydrated in distilled water during
15 min and incubated in thiosulfate solution (0.02% (w/v) Na2S2O3, distilled water) for 1 min.
Gels were washed again three times with distilled water for 20 sec, and incubated in silver
nitrate solution (0.2% (w/v) AgNO3, 0.075% (v/v) formaldehyde, distilled water) for 20 min.
After being washed three consecutive times with distilled water, gels were incubated in the
development solution (6% (w/v) Na2CO3, 0.05% (v/v) formaldehyde, distilled water) until the
bands appeared. The development solution was eliminated and the reaction was stopped
with fixing solution for 2 h, under agitation (Heidolph) (150 rpm, at RT).
The picture of the gel was taken using a printer (RICOH Aficio MP C2800 PCL 5c). The
gel analysis was performed with the ImageJ software (version 1.44o for mac, ImageJ
software, National Institutes of Health, USA, http://imagej.nih.gov.ij), by measuring the
intensity (IntDen) of the bands corresponding to the amount of toxin in the gel for each
strain’s profile. The graphic representation was created with the Excel software.
2.7.5. Rearing of mosquito larvae
The rearing of the larvae was carried out in a temperature-controlled environment (27 °C),
with 12 hrs photoperiod (WHO, 2005). A piece of paper disc covered by mosquito eggs was
submerged in a small recipient with tap water to induce the hatching of larvae. The tap water
19
used for the rearing of larvae and for further bioassays was treated with AquaSafe® (Tetra
GmbH, Melle, Germany), to remove chlorine and neutralize heavy metals. After the hatching,
(day 0), approximately 300 larvae were transferred to a tray containing about 600 mL of
water (about 3 cm of height), and fed with 0.2 g of milled fish food (TetraMin®; Tetra GmbH).
The amount of fish food necessary to feed larvae, increased with their growth; L1-instars was
achieved on day 1 (0.4 g of fish food), L2-instars was achieved on day 2 (1.2 g of food), and
during the day 3 larvae reached the early L3-instars (2.0 g of food).
2.7.6. Bioassay
The Bioassay was carried out to test the toxic effect of A19 strain, comparing with Vec8,
Bioflash, Bti4 and IP4444 Bti strains, against L3-early instar’s larvae of the biological model
Aedes aegypti Rockefeller. For that, volumes of the spores-toxins suspensions were
adjusted to have stock solutions with identical starting concentrations of Bti toxins. This
bioassay was based on the “Guidelines for laboratory and field testing of mosquito larvicides”
(WHO, 2005), with some modifications.
The Bioassay was performed at Swiss Tropical and Public Health Institute (Swiss TPH,
Basel, Switzerland).
Larvae were exposed to different concentrations of Bti crystal toxins. A set of Bti toxins
dilutions were prepared starting from the stock solutions. Every bioassay series involved ten
0.6-fold serial dilutions of Bti toxin, from 10 to 0.1 ng mL-1 (0.10; 0.17; 0.28; 0.46; 0.77; 1.29;
2.15; 3.59; 5.99; 10 ng mL-1). Twenty-five L3-instar’s larvae were tested with each
concentration in plastic cups, with a final volume of 100 mL (WHO, 2005). Each
concentration was tested in duplicate, and every series of bioassay was repeated three times
at different days. Larvae added to tap water, treated with AquaSafe®, were used as negative
control. After 24 hrs of exposure to the Bti toxin (27 °C), the living mosquito larvae were
counted to access to the mortality of the larvae.
The percentages of mortalities were calculated and plotted against the corresponding log
transformed toxin concentration, using the Excel software. The LC50 (lethal concentration for
50% of the treated larvae) value of each Bti strain was extrapolated from the middle region of
the exponential phase of their mortality curves, where the most reproducible response occurs
(Yu, 2008). It was determined through a probit analysis (LC50, 95% CI), using the BioStat
software (AnalystSoft Inc., BioStat v2009 - statistical analysis program;
www.analystsoft.com). The LC50 value for each replicate was calculated and averaged. One-
way ANOVA was performed to check significant differences between the five strains LC50
(GraphPad Prism software). The mortality curve of A19 strain was compared with the curves
of the other reference Bti strains.
20
2.8. Proteomics
2.8.1. Spore-phase protein’s profile
2.8.1.1. Sodium dodecyl sulfate polyacrylamyde gel electrophoresis (SDS-
PAGE)
The spore-phase total protein profiles of Bti were obtained in a SDS-PAGE 12%
polyacrylamide gel (Sterile distilled water, 12% acrylamide bis (29:1), 0.375 M Tris-HCl pH
8.8, 10% (v/v) SDS, 10% (v/v) ammonium persulphate (APS), 0.05% (v/v)
tetramethylethylenediamine (TEMED)) with a stacker of 5% polyacrylamide (Sterile distilled
water, 5% acrylamide bis (29:1), 0.125 M Tris-HCl pH 6 - 8, 10% SDS, 10% APS, 0.1%
TEMED) (Chaves et al., 2008; Laemmli, 1970).
The bacterial cultures were grown in liquid GYS medium at 30 °C with agitation (150 rpm)
until the spore-phase was achieved (48 h). The spores-crystals suspensions were
centrifuged (10’620 x g, 20 min, 4 °C) and re-suspended in 1 mL of sterile distilled water. For
each strain, was prepared a sample with a final volume of 25 µL, consisting in 25% loading
buffer and 75% of concentrated Bti spores-crystals suspension. The marker sample
consisted in 8% of stock molecular weight marker (SDS-PAGE Molecular Weight Standards,
Broad Range, Bio-Rad) and 92% of loading buffer. The samples were boiled (100 °C) during
10 min and loaded directly in the wells of the gel. A sample of 2 µg of BSA (BSA standard, 2
mg mL-1, Bio-Rad), a sample of Bacillus sphaericus, and a sample of a Bacillus thuringiensis
var. kurstaki, were used as controls. The samples were let to migrate for about 15 min at 100
V and 6 hrs at 120 - 200 V. After this period gels were washed with distilled water and kept
o/n at RT, submerged in fixing solution (50% (v/v) methanol, 12% (v/v) acetic acid, distilled
water) at 150 rpm (Heidolph). The protein profiles were stained with Coomassie Brilliant Blue
G-250 stain.
2.8.1.2 Coomassie blue staining
After the incubation in the fixing solution, the gels were rehydrated during 15 min in
distilled water and incubated in a freshly prepared Coomassie blue solution for gel staining
(Stock dye solution: 2% (v/v) phosphoric acid, 10% (w/v) ammonium sulphate, 5% (w/v)
Coomassie brilliant blue G-250; Final dye: 80% of stock dye solution, 20% methanol), during
16 h. The gels were then washed with distilled water, and scanned with a printer (RICOH
Aficio MP C2800 PCL 5c).
2.8.2. Vegetative cell total protein’s profile
2.8.2.1. Protein Extraction
Vegetative cultures were grown o/n in 20 mL of TSB medium at 30 °C, with agitation (150
rpm). Suspensions were centrifuged (2’250 x g, 15 min, 4 °C) and the pellets re-suspended
in 2 mL of PBS 1x buffer (pH 7.2). Three washings with 1 mL of PBS 1x buffer, and two
21
washings with 0.5 M Tris-HCl, pH 6.8 (centrifugation speed 6’800 x g, for 30 sec, at 4 °C)
were performed. The supernatant was discarded and another centrifugation (speed 6’800 x
g, for 1 min, at 4 °C) was performed to remove completely the remaining liquid. The pellets
were re-suspended in 1 mL of lysis buffer and stored o/n in the freezer at -20 °C. The cells
were then lysed by 5 sonication cycles (SONOPLUS HD 2070, Bandelin electronics, Berlin,
Germany) of 15 sec each at about 20% of the maximum power. Between every sonication
cycles, samples were placed on ice for 2 - 3 min. After cell lysis, the samples were
centrifuged (13’100 x g, 15 min, 4 °C). The protein concentration in the supernatant was
measured using the Bradford methodology (Bradford, 1976), according to the manufacturer’s
instructions (Bio-Rad). To check the presence and the quality of proteins in each sample, 4
μg of total protein extract were resolved on a 12% polyacrylamyde SDS-PAGE.
2.8.2.2. Two-dimensional polyacrylamide gel electrophoresis (2-D PAGE)
The first dimensional separation according to the proteins isoelectric point (pI), was
conducted using the precast strips Immobiline™ DryStrip gel (IPG) (7 cm long, pH 3 - 10 NL
(Non-Linear); GE Healthcare, Glattbrugg, Switzerland). The IPG were rehydrated in a
specific support (GE Healthcare) containing 150 µL of a rehydratation buffer. The
rehydratation buffer was composed by 3 µg of Bti total protein sample, lysis buffer and 1%
IPG buffer (pH 3 to 10 NL) (GE Healthcare). The IPG were covered with 3 mL of IPG cover
fluid oil (GE Healthcare) to prevent the evaporation and incubated o/n at RT. After
rehydrated, the IPG were moved to the assembled Multiphor II (GE Healthcare) with the gel
face up, and aligned. Two pieces of paper strips (IEF electrode strip, PKG/100; GE
Healthcare) (11 cm long) were humidified and placed in contact with the gel ends of the IPG.
The IPG were then covered with 20 - 25 mL of IPG cover fluid oil (GE Healthcare) and the
Multiphor II equipment closed. The temperature was set to 18 °C. The isoelectric focusing
(IEF) was performed in 4 steps: 200 V for 0.01 h; 300 V for 2 h; 3’500 V for 2 h; and 3’500 V
for 1 h.
The 2nd dimension of the proteins’ separation was performed according to their molecular
weight. Previously, was prepared the A solution (6 M urea, 0.5 M Tris-HCl pH 6.8, 30% (v/v)
glycerol, 2% (w/v) SDS, 1% (w/v) bromophenol blue). The IPGs were incubated for 12 min
with agitation (Heidolph) in contact with the A1 solution (2 mL sol. A, 2% (w/v) dithiothreitol
(DTT)) (165 rpm, RT), followed by a second incubation, for 5 min in contact with A2 solution
(2 mL sol. A, 2.5% (w/v) iodoacetamide) (165 rpm, RT). The equilibrated IPGs were then
placed on top of the SDS-PAGE 12% polyacrylamide gels and covered with 0.5% (w/v) hot
agarose solution (0.5% (w/v) agarose, 0.025 M Tris, 0.19 M glycine, 0.1% (w/v) SDS, 1%
bromophenol blue). A well was created near the ‘+’ side of the IPG for the molecular weight
marker (SDS-PAGE Molecular Weight Standards, Broad Range, Bio-Rad) sample. After the

22
solidification of the 0.5% agarose, the gels were placed into the migration equipment (Bio
Rad MINI PROTEAN™, Bio-Rad) and covered with the running buffer (0.026 M Tris-HCl pH
7, 0.193 M glycine, 0.0035 M SDS). Twenty µL of the molecular marker diluted in the loading
buffer (1:100) were added to the first well of the gel. The proteins’ migration was carried out
at 80 V for 15 min, followed by 2 hrs at 120 V. After the migration, the gels were washed with
distilled water, and incubated o/n at RT in fixing solution (50% (v/v) methanol, 12% (v/v)
acetic acid, distilled water), with agitation (150 rpm) (Heidolph). The proteins were stained
with silver nitrate staining solution (see section 2.7.4.).
To take the picture, the gels were rehydrated in distilled water for 30 min and scanned
with a printer (RICOH Aficio MP C2800 PCL 5c).
2.8.2.4. Matrix-assisted laser desorption/ionization time-of-flight mass
spectrometry (MALDI-ToF MS)
To analyse the protein profiles from vegetative cell-phase of the different Bti, Btk and Bc
strains, a protein mass fingerprint was performed for each strain using MALDI-ToF MS
technique. A small amount of a bacteria, grown o/n in blood agar medium, was transferred to
a target spot of a FlexiMass™ MALDI target plate (Schimatzu - Biotech Corp., Kyoto, Japan),
using a disposable loop. Four wells were prepared for each strain. One µL of the α-cyano-4-
hydroxyeinnamic acid (CHCA) matrix (2.94% (w/v) of 97% CHCA, 32.35% (v/v) acetonitrile,
32.35% (v/v) of 100% EtOH, sterile distilled water, 2.94% (v/v) concentrated trifluoroacetic
acid (TFA)) was added on each sample and air-dehydrated within 1 - 2 min at RT. The
protein mass profiles of Bti strains were obtained using a MALDI-ToF MS Axima™
Confidence machine (Shimadzu - Biotech Corp.), with detection in the linear positive mode,
at a laser frequency of 50 Hz and within a mass range of 2’000 - 20’000 Da. The acceleration
voltage was 20 kV and the extraction delay 200 ns. Were used 20 laser shots per sample to
generate each spectrum. For each bacterial sample, a total of 50 protein mass fingerprints
were averaged and processed, using the LaunchpadTM v. 2.8 software (Shimadzu-Biotech
Corp.). This software automatically performed smoothing, normalization, baseline
subtraction, and peak calling. For each sample was generated a list of the significant
spectrum peaks, that included the mass-to-charge (m/z) values for each peak, and signal
intensity. Calibration was conducted for each target plate using spectra of the reference
strain E. coli K12 (GM48 genotype), grown o/n on LB medium (LB broth, Miller (Luria-
Bertani), Difco BD Switzerland) at 30 °C. Generated protein mass fingerprints were analyzed
with SARAMIS™ (Spectral ARchive and Microbial Identification System, AnagnosTec
GmbH) software (AnagnosTec, Potsdam, Germany) with default settings. For each strain,
identification was also performed by comparing the generated peak lists against the current
reference library in SARAMIS™. The resulting peak lists of individual samples were
23
processed using the SARAMIS™ software package (AnagnosTec) and submitted to cluster
analysis (single-linkage clustering using the Dice coefficient) to produce a taxonomic tree
(0.08% error, range from m/z 2’000 to 20’000).
2.9. Genomics
2.9.1. DNA extraction
Total DNA from Bti vegetative cells was extracted using the QIAamp DNA Mini Kit
(QIAGEN, Basel, Switzerland) according to the manufacturer’s instructions. For each Bti
strain, a loop of bacteria was taken from the Bti culture after o/n growth on blood agar plate,
and re-suspended in 1 mL of nanopure distilled water. The suspension was centrifuged
(5’000 x g, 5 min) and the supernatant discarded. To the remaining pellet, 20 μL of
proteinase K and 200 μL of AL lysis buffer were added and mixed by vortexing (15 sec). After
briefly centrifuged, the suspension was firstly incubated for 10 min at 56 °C, then during 10
min at 95 °C. Two-hundred μL of ethanol 96 - 100% were added and mixed by vortexing (15
sec). After briefly centrifuged, the whole suspension was transferred to a Quiagen spin
column, and centrifuged (4’300 x g, 1 min). For the first washing, the column was transferred
to a new collecting tube and 500 μL of AW1 wash buffer were added. Tube was centrifuged
for 1 min at 4’300 x g. The second washing was made using 500 μL of AW2 and centrifuged
for 3 min at 13’100 x g. The collection tube with the filtrate was discarded and the column
was placed in a new tube and subjected to a second centrifugation (13’100 x g, 1 min).
Finally the column was placed in a 1.5 mL eppendorf tube, and 80 μL of AE elution buffer
were added to the column. After 5 min incubation at RT, the tube was centrifuged (4’300 x g,
1 min). The DNA extracted was kept at 4 °C.
2.9.2. 16S ribosomal coding region
To test the quality of the DNA extracted with the Qiagen DNA extraction kit, the 16S
ribosomal subunit coding region was amplified by PCR, with the universal primers UniL
(forward primer 5’ - AGAGTTTGATCATGGCTCA - 3’, amplified region 8 - 26 E. coli) and
UniR (reverse primer 5’ - GTGTGACGGGCGGTGTGTA - 3’, amplified region 1411 - 1391 E.
coli) (Microsynth, Balgach, Switzerland) (Demarta et al., 1999). Each PCR reaction consisted
of 25 μL of a solution containing 71.5% of sterile distilled water, 10% of 10x PCR Buffer
(QIAGEN PCR buffer), 6% of 25 mM MgCl2, 2% of dNTPs mix (QIAGEN), 2% of both
primers, 0.005% HotStarTaq DNA Polymerase (250U, QIAGEN) and 6% of genomic DNA.
DNA amplifications were performed in a Veriti® 96-well Thermal Cycler (Applied Biosystems,
Rotkreuz, Switzerland). The thermal cycling conditions included an initial HotStarTaq DNA
Polymerase activation at 95 °C (15 min), 35 cycles of 30 sec at 94 °C (denaturation), 1 min at
52 °C (primers annealing) and 1.5 min at 72 °C (extension); and after the 35 cycles, 7 min at
72 °C. The amplified DNA was checked in a 1.5% (w/v) agarose gel electrophoresis
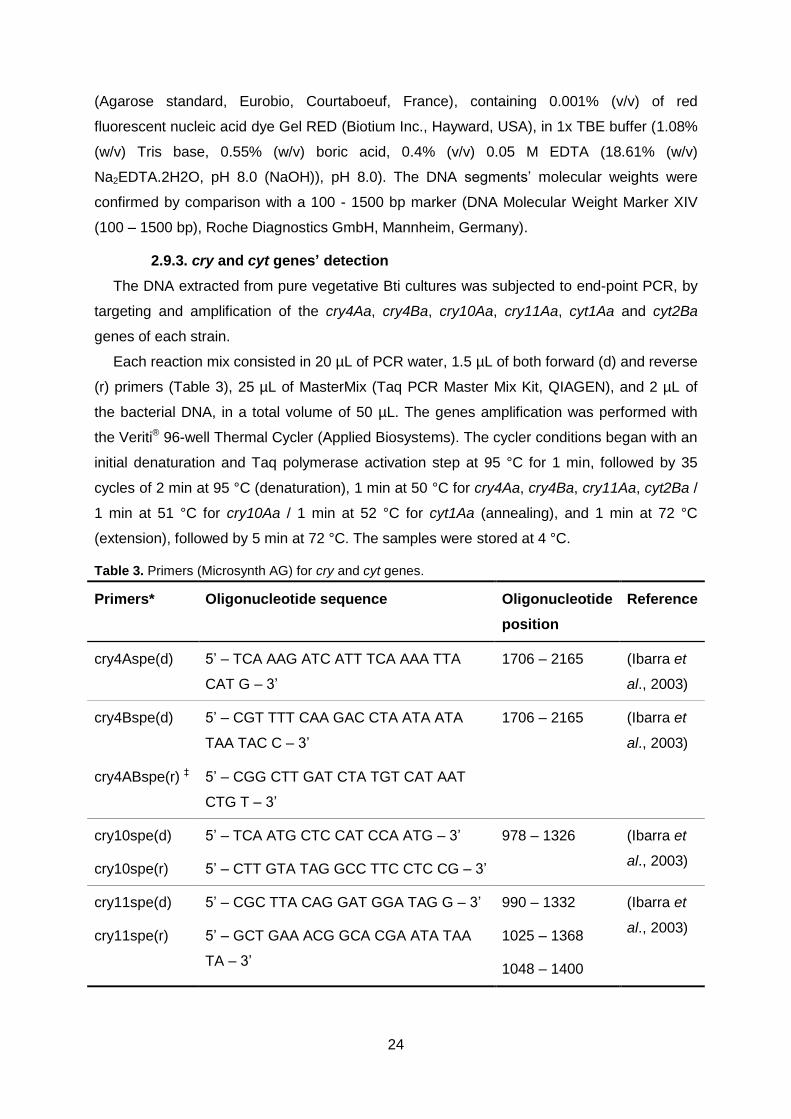
24
(Agarose standard, Eurobio, Courtaboeuf, France), containing 0.001% (v/v) of red
fluorescent nucleic acid dye Gel RED (Biotium Inc., Hayward, USA), in 1x TBE buffer (1.08%
(w/v) Tris base, 0.55% (w/v) boric acid, 0.4% (v/v) 0.05 M EDTA (18.61% (w/v)
Na2EDTA.2H2O, pH 8.0 (NaOH)), pH 8.0). The DNA segments’ molecular weights were
confirmed by comparison with a 100 - 1500 bp marker (DNA Molecular Weight Marker XIV
(100 – 1500 bp), Roche Diagnostics GmbH, Mannheim, Germany).
2.9.3. cry and cyt genes’ detection
The DNA extracted from pure vegetative Bti cultures was subjected to end-point PCR, by
targeting and amplification of the cry4Aa, cry4Ba, cry10Aa, cry11Aa, cyt1Aa and cyt2Ba
genes of each strain.
Each reaction mix consisted in 20 µL of PCR water, 1.5 µL of both forward (d) and reverse
(r) primers (Table 3), 25 µL of MasterMix (Taq PCR Master Mix Kit, QIAGEN), and 2 µL of
the bacterial DNA, in a total volume of 50 µL. The genes amplification was performed with
the Veriti® 96-well Thermal Cycler (Applied Biosystems). The cycler conditions began with an
initial denaturation and Taq polymerase activation step at 95 °C for 1 min, followed by 35
cycles of 2 min at 95 °C (denaturation), 1 min at 50 °C for cry4Aa, cry4Ba, cry11Aa, cyt2Ba /
1 min at 51 °C for cry10Aa / 1 min at 52 °C for cyt1Aa (annealing), and 1 min at 72 °C
(extension), followed by 5 min at 72 °C. The samples were stored at 4 °C.
Table 3. Primers (Microsynth AG) for cry and cyt genes.
Primers* Oligonucleotide sequence Oligonucleotide
position
Reference
cry4Aspe(d) 5’ – TCA AAG ATC ATT TCA AAA TTA
CAT G – 3’
1706 – 2165 (Ibarra et
al., 2003)
cry4Bspe(d) 5’ – CGT TTT CAA GAC CTA ATA ATA
TAA TAC C – 3’
1706 – 2165 (Ibarra et
al., 2003)
cry4ABspe(r) ‡ 5’ – CGG CTT GAT CTA TGT CAT AAT
CTG T – 3’
cry10spe(d) 5’ – TCA ATG CTC CAT CCA ATG – 3’ 978 – 1326 (Ibarra et
al., 2003) cry10spe(r) 5’ – CTT GTA TAG GCC TTC CTC CG – 3’
cry11spe(d) 5’ – CGC TTA CAG GAT GGA TAG G – 3’ 990 – 1332
1025 – 1368
1048 – 1400
(Ibarra et
al., 2003) cry11spe(r) 5’ – GCT GAA ACG GCA CGA ATA TAA
TA – 3’
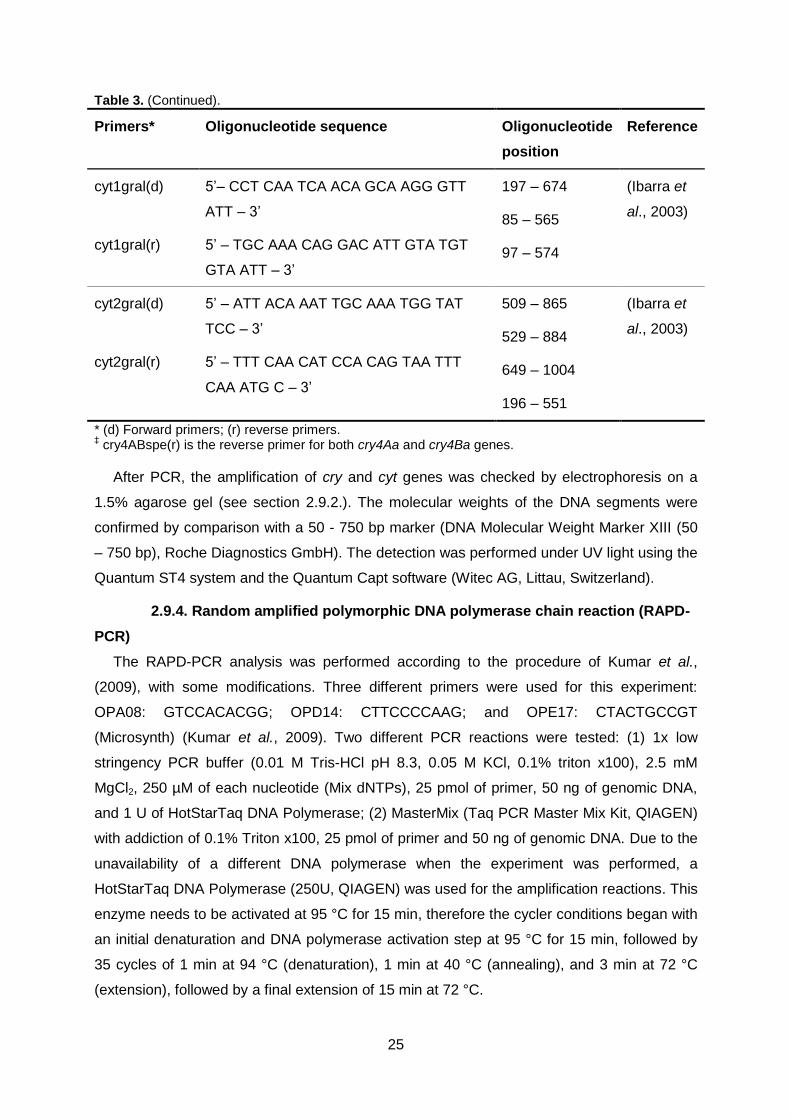
25
Table 3. (Continued).
Primers* Oligonucleotide sequence Oligonucleotide
position
Reference
cyt1gral(d) 5’– CCT CAA TCA ACA GCA AGG GTT
ATT – 3’
197 – 674
85 – 565
97 – 574
(Ibarra et
al., 2003)
cyt1gral(r) 5’ – TGC AAA CAG GAC ATT GTA TGT
GTA ATT – 3’
cyt2gral(d) 5’ – ATT ACA AAT TGC AAA TGG TAT
TCC – 3’
509 – 865
529 – 884
649 – 1004
196 – 551
(Ibarra et
al., 2003)
cyt2gral(r) 5’ – TTT CAA CAT CCA CAG TAA TTT
CAA ATG C – 3’
* (d) Forward primers; (r) reverse primers. ‡ cry4ABspe(r) is the reverse primer for both cry4Aa and cry4Ba genes.
After PCR, the amplification of cry and cyt genes was checked by electrophoresis on a
1.5% agarose gel (see section 2.9.2.). The molecular weights of the DNA segments were
confirmed by comparison with a 50 - 750 bp marker (DNA Molecular Weight Marker XIII (50
– 750 bp), Roche Diagnostics GmbH). The detection was performed under UV light using the
Quantum ST4 system and the Quantum Capt software (Witec AG, Littau, Switzerland).
2.9.4. Random amplified polymorphic DNA polymerase chain reaction (RAPD-
PCR)
The RAPD-PCR analysis was performed according to the procedure of Kumar et al.,
(2009), with some modifications. Three different primers were used for this experiment:
OPA08: GTCCACACGG; OPD14: CTTCCCCAAG; and OPE17: CTACTGCCGT
(Microsynth) (Kumar et al., 2009). Two different PCR reactions were tested: (1) 1x low
stringency PCR buffer (0.01 M Tris-HCl pH 8.3, 0.05 M KCl, 0.1% triton x100), 2.5 mM
MgCl2, 250 µM of each nucleotide (Mix dNTPs), 25 pmol of primer, 50 ng of genomic DNA,
and 1 U of HotStarTaq DNA Polymerase; (2) MasterMix (Taq PCR Master Mix Kit, QIAGEN)
with addiction of 0.1% Triton x100, 25 pmol of primer and 50 ng of genomic DNA. Due to the
unavailability of a different DNA polymerase when the experiment was performed, a
HotStarTaq DNA Polymerase (250U, QIAGEN) was used for the amplification reactions. This
enzyme needs to be activated at 95 °C for 15 min, therefore the cycler conditions began with
an initial denaturation and DNA polymerase activation step at 95 °C for 15 min, followed by
35 cycles of 1 min at 94 °C (denaturation), 1 min at 40 °C (annealing), and 3 min at 72 °C
(extension), followed by a final extension of 15 min at 72 °C.
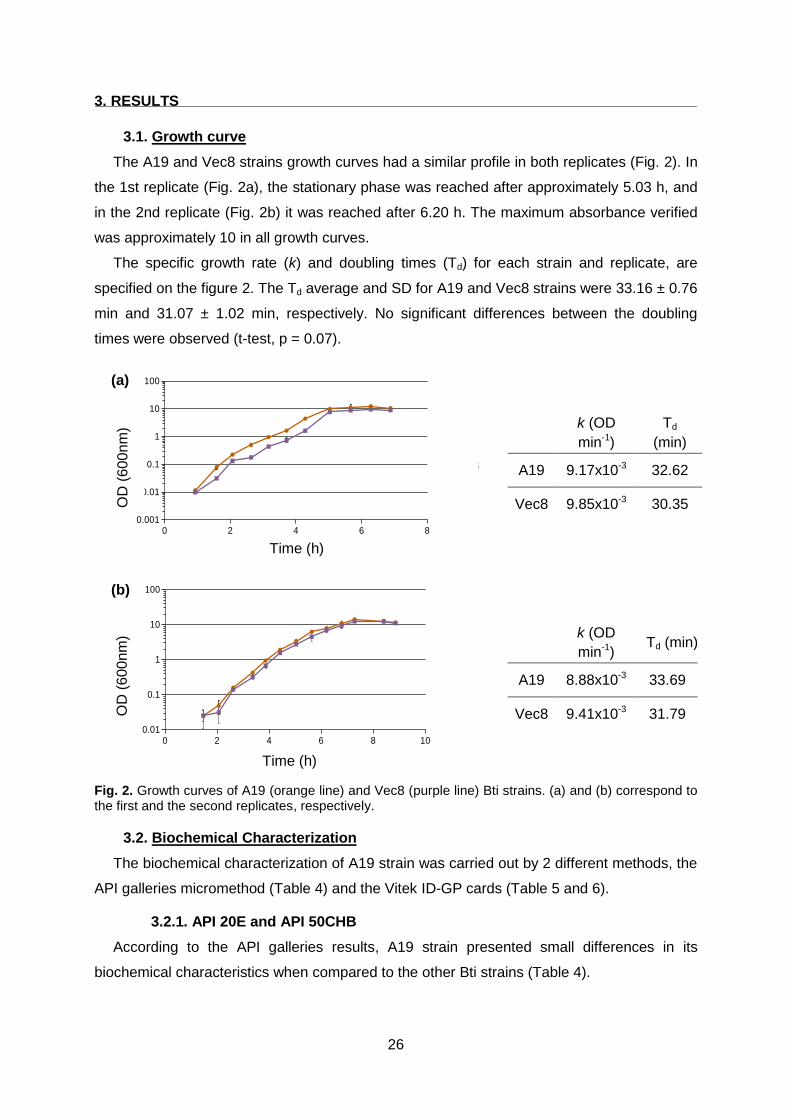
26
3. RESULTS
3.1. Growth curve
The A19 and Vec8 strains growth curves had a similar profile in both replicates (Fig. 2). In
the 1st replicate (Fig. 2a), the stationary phase was reached after approximately 5.03 h, and
in the 2nd replicate (Fig. 2b) it was reached after 6.20 h. The maximum absorbance verified
was approximately 10 in all growth curves.
The specific growth rate (k) and doubling times (Td) for each strain and replicate, are
specified on the figure 2. The Td average and SD for A19 and Vec8 strains were 33.16 ± 0.76
min and 31.07 ± 1.02 min, respectively. No significant differences between the doubling
times were observed (t-test, p = 0.07).
0 2 4 6 80.001
0.01
0.1
1
10
100
A19
Vec8
Time (h)
O.D
. (6
00nm
)
k (OD
min-1)
Td
(min)
A19 9.17x10⁻³ 32.62
Vec8 9.85x10⁻³ 30.35
0 2 4 6 8 100.01
0.1
1
10
100
A19
Vec8
time (h)
OD
(6
00
nm
)
k (OD
min-1) Td (min)
A19 8.88x10⁻³ 33.69
Vec8 9.41x10⁻³ 31.79
Fig. 2. Growth curves of A19 (orange line) and Vec8 (purple line) Bti strains. (a) and (b) correspond to the first and the second replicates, respectively.
3.2. Biochemical Characterization
The biochemical characterization of A19 strain was carried out by 2 different methods, the
API galleries micromethod (Table 4) and the Vitek ID-GP cards (Table 5 and 6).
3.2.1. API 20E and API 50CHB
According to the API galleries results, A19 strain presented small differences in its
biochemical characteristics when compared to the other Bti strains (Table 4).
(a)
(b)
Time (h)
Time (h)
OD
(6
00
nm
) O
D (
600
nm
)
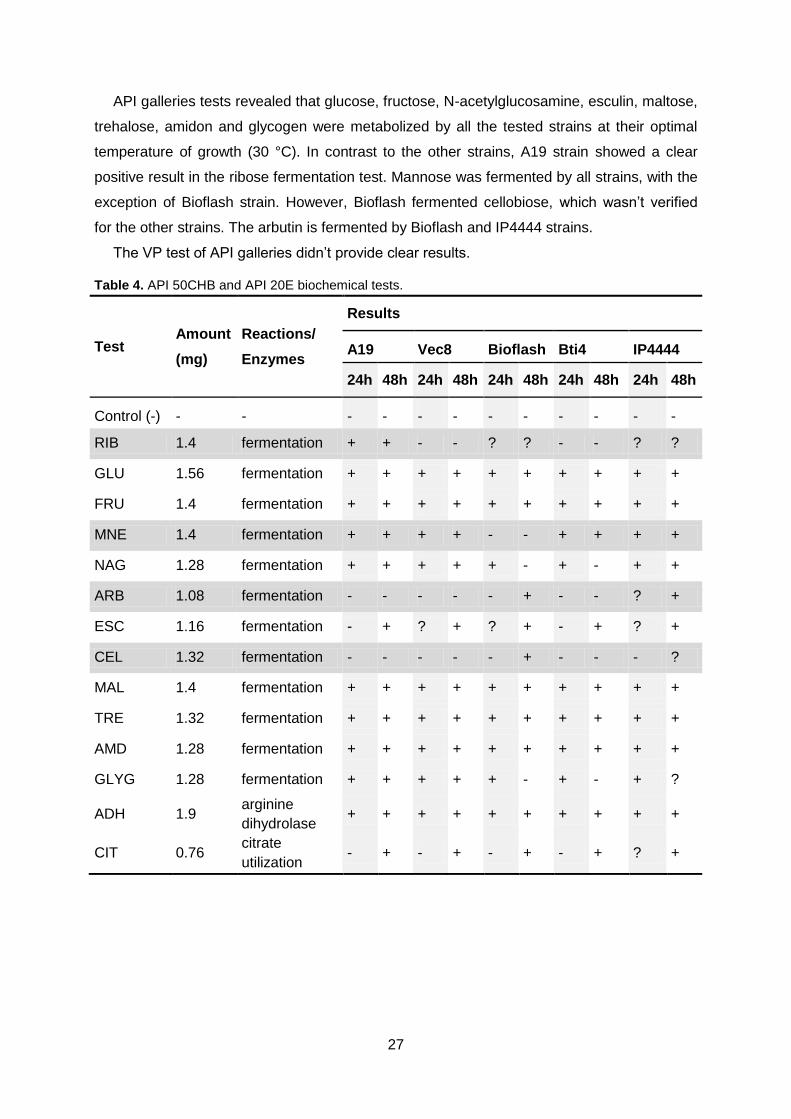
27
API galleries tests revealed that glucose, fructose, N-acetylglucosamine, esculin, maltose,
trehalose, amidon and glycogen were metabolized by all the tested strains at their optimal
temperature of growth (30 °C). In contrast to the other strains, A19 strain showed a clear
positive result in the ribose fermentation test. Mannose was fermented by all strains, with the
exception of Bioflash strain. However, Bioflash fermented cellobiose, which wasn’t verified
for the other strains. The arbutin is fermented by Bioflash and IP4444 strains.
The VP test of API galleries didn’t provide clear results.
Table 4. API 50CHB and API 20E biochemical tests.
Test Amount
(mg)
Reactions/
Enzymes
Results
A19 Vec8 Bioflash Bti4 IP4444
24h 48h 24h 48h 24h 48h 24h 48h 24h 48h
Control (-) - - - - - - - - - - - -
RIB 1.4 fermentation + + - - ? ? - - ? ?
GLU 1.56 fermentation + + + + + + + + + +
FRU 1.4 fermentation + + + + + + + + + +
MNE 1.4 fermentation + + + + - - + + + +
NAG 1.28 fermentation + + + + + - + - + +
ARB 1.08 fermentation - - - - - + - - ? +
ESC 1.16 fermentation - + ? + ? + - + ? +
CEL 1.32 fermentation - - - - - + - - - ?
MAL 1.4 fermentation + + + + + + + + + +
TRE 1.32 fermentation + + + + + + + + + +
AMD 1.28 fermentation + + + + + + + + + +
GLYG 1.28 fermentation + + + + + - + - + ?
ADH 1.9 arginine
dihydrolase + + + + + + + + + +
CIT 0.76 citrate
utilization - + - + - + - + ? +
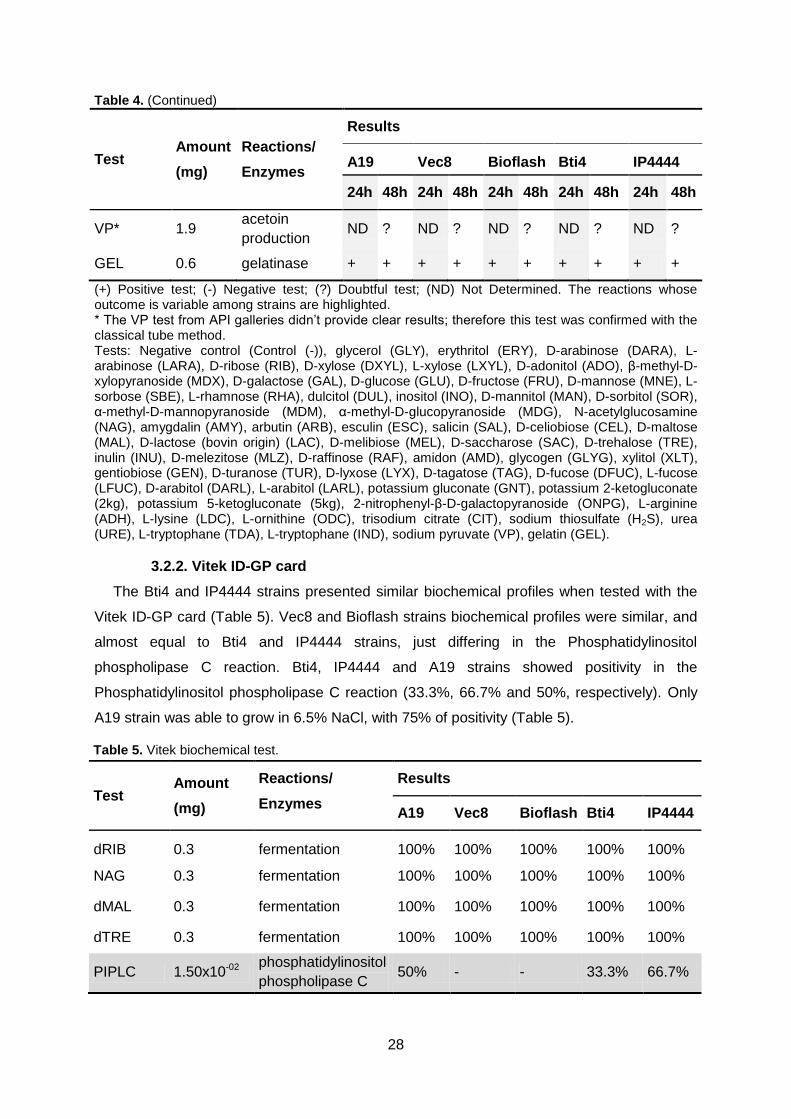
28
Table 4. (Continued)
Test Amount
(mg)
Reactions/
Enzymes
Results
A19 Vec8 Bioflash Bti4 IP4444
24h 48h 24h 48h 24h 48h 24h 48h 24h 48h
VP* 1.9 acetoin
production ND ? ND ? ND ? ND ? ND ?
GEL 0.6 gelatinase + + + + + + + + + +
(+) Positive test; (-) Negative test; (?) Doubtful test; (ND) Not Determined. The reactions whose outcome is variable among strains are highlighted. * The VP test from API galleries didn’t provide clear results; therefore this test was confirmed with the classical tube method. Tests: Negative control (Control (-)), glycerol (GLY), erythritol (ERY), D-arabinose (DARA), L-arabinose (LARA), D-ribose (RIB), D-xylose (DXYL), L-xylose (LXYL), D-adonitol (ADO), β-methyl-D-xylopyranoside (MDX), D-galactose (GAL), D-glucose (GLU), D-fructose (FRU), D-mannose (MNE), L-sorbose (SBE), L-rhamnose (RHA), dulcitol (DUL), inositol (INO), D-mannitol (MAN), D-sorbitol (SOR), α-methyl-D-mannopyranoside (MDM), α-methyl-D-glucopyranoside (MDG), N-acetylglucosamine (NAG), amygdalin (AMY), arbutin (ARB), esculin (ESC), salicin (SAL), D-celiobiose (CEL), D-maltose (MAL), D-lactose (bovin origin) (LAC), D-melibiose (MEL), D-saccharose (SAC), D-trehalose (TRE), inulin (INU), D-melezitose (MLZ), D-raffinose (RAF), amidon (AMD), glycogen (GLYG), xylitol (XLT), gentiobiose (GEN), D-turanose (TUR), D-lyxose (LYX), D-tagatose (TAG), D-fucose (DFUC), L-fucose (LFUC), D-arabitol (DARL), L-arabitol (LARL), potassium gluconate (GNT), potassium 2-ketogluconate (2kg), potassium 5-ketogluconate (5kg), 2-nitrophenyl-β-D-galactopyranoside (ONPG), L-arginine (ADH), L-lysine (LDC), L-ornithine (ODC), trisodium citrate (CIT), sodium thiosulfate (H2S), urea (URE), L-tryptophane (TDA), L-tryptophane (IND), sodium pyruvate (VP), gelatin (GEL).
3.2.2. Vitek ID-GP card
The Bti4 and IP4444 strains presented similar biochemical profiles when tested with the
Vitek ID-GP card (Table 5). Vec8 and Bioflash strains biochemical profiles were similar, and
almost equal to Bti4 and IP4444 strains, just differing in the Phosphatidylinositol
phospholipase C reaction. Bti4, IP4444 and A19 strains showed positivity in the
Phosphatidylinositol phospholipase C reaction (33.3%, 66.7% and 50%, respectively). Only
A19 strain was able to grow in 6.5% NaCl, with 75% of positivity (Table 5).
Table 5. Vitek biochemical test.
Test Amount
(mg)
Reactions/
Enzymes
Results
A19 Vec8 Bioflash Bti4 IP4444
dRIB 0.3 fermentation 100% 100% 100% 100% 100%
NAG 0.3 fermentation 100% 100% 100% 100% 100%
dMAL 0.3 fermentation 100% 100% 100% 100% 100%
dTRE 0.3 fermentation 100% 100% 100% 100% 100%
PIPLC 1.50x10-02 phosphatidylinositol
phospholipase C 50% - - 33.3% 66.7%
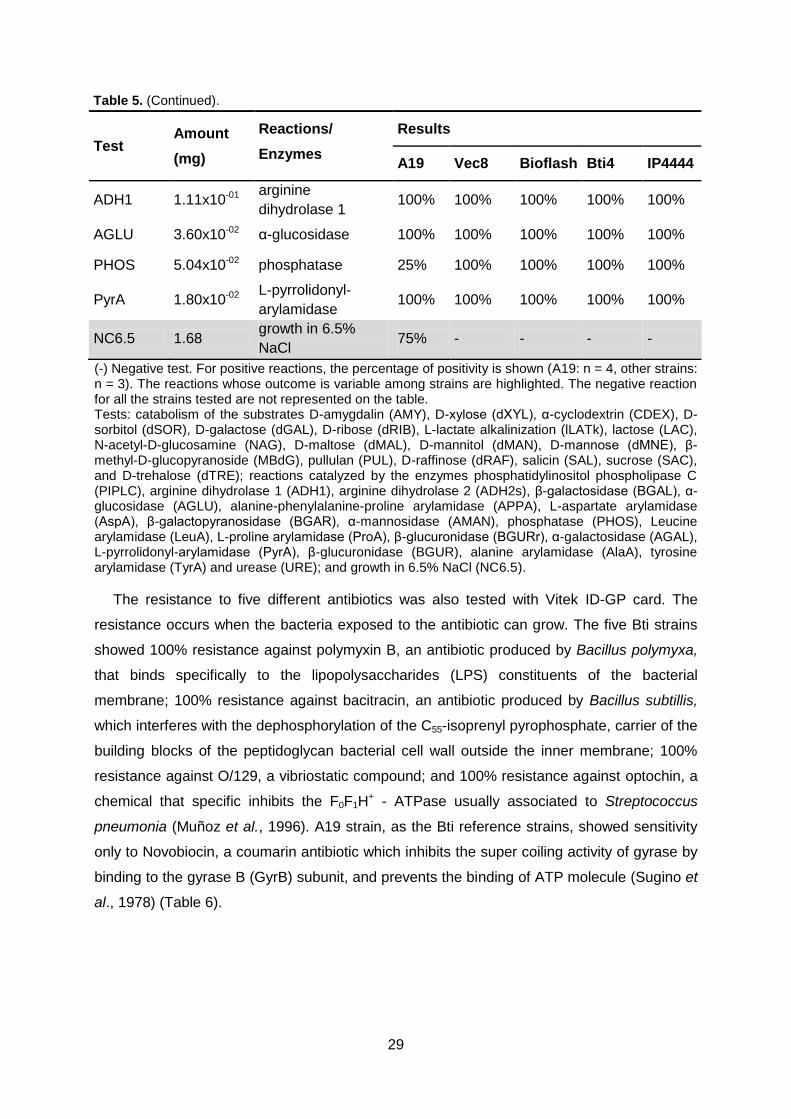
29
Table 5. (Continued).
(-) Negative test. For positive reactions, the percentage of positivity is shown (A19: n = 4, other strains: n = 3). The reactions whose outcome is variable among strains are highlighted. The negative reaction for all the strains tested are not represented on the table. Tests: catabolism of the substrates D-amygdalin (AMY), D-xylose (dXYL), α-cyclodextrin (CDEX), D-sorbitol (dSOR), D-galactose (dGAL), D-ribose (dRIB), L-lactate alkalinization (lLATk), lactose (LAC), N-acetyl-D-glucosamine (NAG), D-maltose (dMAL), D-mannitol (dMAN), D-mannose (dMNE), β-methyl-D-glucopyranoside (MBdG), pullulan (PUL), D-raffinose (dRAF), salicin (SAL), sucrose (SAC), and D-trehalose (dTRE); reactions catalyzed by the enzymes phosphatidylinositol phospholipase C (PIPLC), arginine dihydrolase 1 (ADH1), arginine dihydrolase 2 (ADH2s), β-galactosidase (BGAL), α-glucosidase (AGLU), alanine-phenylalanine-proline arylamidase (APPA), L-aspartate arylamidase (AspA), β-galactopyranosidase (BGAR), α-mannosidase (AMAN), phosphatase (PHOS), Leucine arylamidase (LeuA), L-proline arylamidase (ProA), β-glucuronidase (BGURr), α-galactosidase (AGAL), L-pyrrolidonyl-arylamidase (PyrA), β-glucuronidase (BGUR), alanine arylamidase (AlaA), tyrosine arylamidase (TyrA) and urease (URE); and growth in 6.5% NaCl (NC6.5).
The resistance to five different antibiotics was also tested with Vitek ID-GP card. The
resistance occurs when the bacteria exposed to the antibiotic can grow. The five Bti strains
showed 100% resistance against polymyxin B, an antibiotic produced by Bacillus polymyxa,
that binds specifically to the lipopolysaccharides (LPS) constituents of the bacterial
membrane; 100% resistance against bacitracin, an antibiotic produced by Bacillus subtillis,
which interferes with the dephosphorylation of the C55-isoprenyl pyrophosphate, carrier of the
building blocks of the peptidoglycan bacterial cell wall outside the inner membrane; 100%
resistance against O/129, a vibriostatic compound; and 100% resistance against optochin, a
chemical that specific inhibits the F0F1H+ - ATPase usually associated to Streptococcus
pneumonia (Muñoz et al., 1996). A19 strain, as the Bti reference strains, showed sensitivity
only to Novobiocin, a coumarin antibiotic which inhibits the super coiling activity of gyrase by
binding to the gyrase B (GyrB) subunit, and prevents the binding of ATP molecule (Sugino et
al., 1978) (Table 6).
Test Amount
(mg)
Reactions/
Enzymes
Results
A19 Vec8 Bioflash Bti4 IP4444
ADH1 1.11x10-01 arginine
dihydrolase 1 100% 100% 100% 100% 100%
AGLU 3.60x10-02 α-glucosidase 100% 100% 100% 100% 100%
PHOS 5.04x10-02 phosphatase 25% 100% 100% 100% 100%
PyrA 1.80x10-02 L-pyrrolidonyl-
arylamidase 100% 100% 100% 100% 100%
NC6.5 1.68 growth in 6.5%
NaCl 75% - - - -

30
Table 6. Vitek resistance test.
Test Amount
(mg)
Reactions/
Enzymes A19 Vec8 Bioflash Bti4 IP4444
POLYB 9.30x10-04 resistance 100% 100% 100% 100% 100%
BACI 6.00x10-04 resistance 100% 100% 100% 100% 100%
NOVO 7.50x10-05 resistance 25% - - 66.7% 66.7%
O129R 8.40x10-03 resistance 100% 100% 100% 100% 100%
OPTO 3.99x10-04 resistance 100% 100% 100% 100% 100%
(-) Negative test. For positive reactions, the percentage of positivity is shown (A19: n = 4, other strains: n = 3). The reactions whose outcome is variable among strains are highlighted. Tests: polymyxin B resistance (POLYB), bacitracin resistance (BACI), novobiocin resistance (NOVO), O/129 resistance (O129R), and optochin resistance (OPTO).
3.2.3. Oxidase tests
The oxidase test result was negative for A19 strain, as for the Bti reference strains.
3.2.4. Serotyping
The results obtained with the serotyping were not very clear. The A19 strain showed
different reactions comparing with the other strains (Table 7). A19 strain’s cells deposit at the
bottom of the U-wells, forming a halo, while the other Bti strains showed a floccular
deposition, although not clear (Table 7, Bioflash). The negative control Btk5 presented a non-
floccular and more homogeneous deposition than the ones verified for Bti reference strains
(Table 7, Btk5). Since the A19 strain’s result differed from the positive results verified in the
reference strains, its reaction was considered negative. The auto-agglutination test and the
controls without NaCl and anti-H-14 serum were negative for all the strains tested.
Table 7. Serotyping reactions.
Reaction Bt strains
A19 Bioflash‡ Btk5
With NaCl (0.15 M) and anti
- H-14 serum
With NaCl (0.15 M) without
anti - H-14 serum*
Without NaCl (0.15 M)
without anti - H-14 serum
*Auto-agglutination test. For the interpretation was considered the Laurent and collaborators (1996) description of a positive agglutination reaction: a floccular deposit on the well bottom. ‡ Bioflash strain was
shown as example for Bti strains.
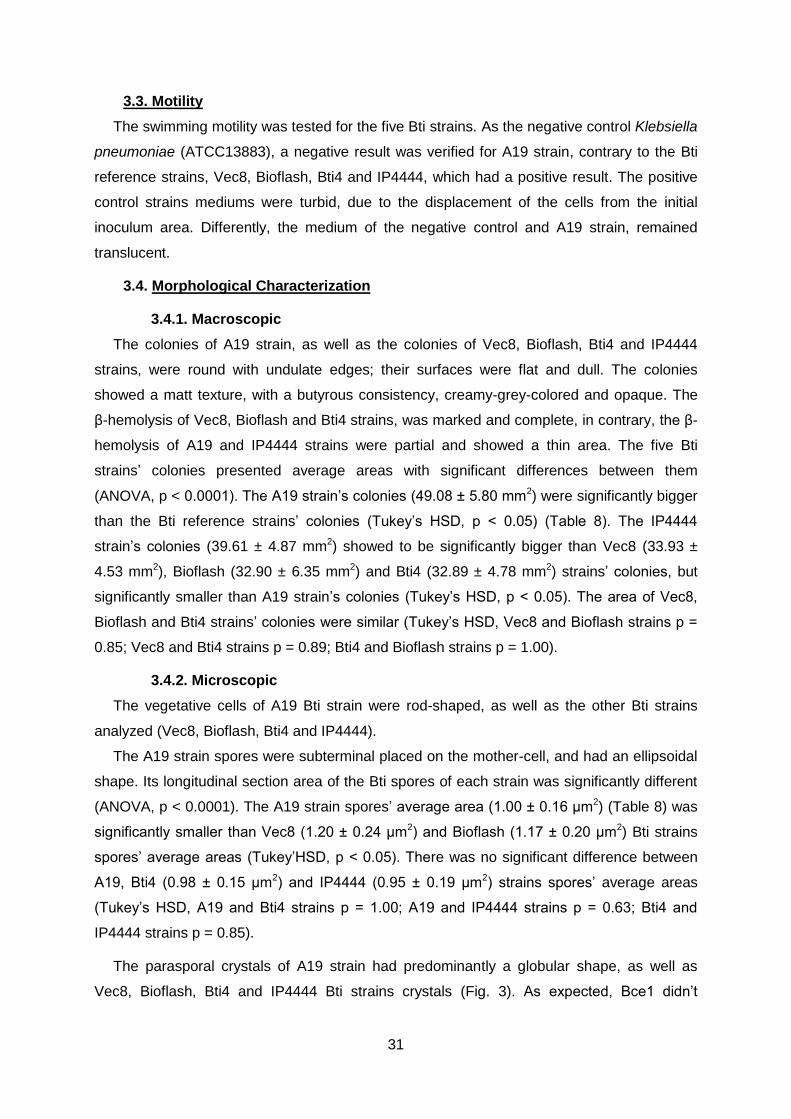
31
3.3. Motility
The swimming motility was tested for the five Bti strains. As the negative control Klebsiella
pneumoniae (ATCC13883), a negative result was verified for A19 strain, contrary to the Bti
reference strains, Vec8, Bioflash, Bti4 and IP4444, which had a positive result. The positive
control strains mediums were turbid, due to the displacement of the cells from the initial
inoculum area. Differently, the medium of the negative control and A19 strain, remained
translucent.
3.4. Morphological Characterization
3.4.1. Macroscopic
The colonies of A19 strain, as well as the colonies of Vec8, Bioflash, Bti4 and IP4444
strains, were round with undulate edges; their surfaces were flat and dull. The colonies
showed a matt texture, with a butyrous consistency, creamy-grey-colored and opaque. The
β-hemolysis of Vec8, Bioflash and Bti4 strains, was marked and complete, in contrary, the β-
hemolysis of A19 and IP4444 strains were partial and showed a thin area. The five Bti
strains’ colonies presented average areas with significant differences between them
(ANOVA, p < 0.0001). The A19 strain’s colonies (49.08 ± 5.80 mm2) were significantly bigger
than the Bti reference strains’ colonies (Tukey’s HSD, p < 0.05) (Table 8). The IP4444
strain’s colonies (39.61 ± 4.87 mm2) showed to be significantly bigger than Vec8 (33.93 ±
4.53 mm2), Bioflash (32.90 ± 6.35 mm2) and Bti4 (32.89 ± 4.78 mm2) strains’ colonies, but
significantly smaller than A19 strain’s colonies (Tukey’s HSD, p < 0.05). The area of Vec8,
Bioflash and Bti4 strains’ colonies were similar (Tukey’s HSD, Vec8 and Bioflash strains p =
0.85; Vec8 and Bti4 strains p = 0.89; Bti4 and Bioflash strains p = 1.00).
3.4.2. Microscopic
The vegetative cells of A19 Bti strain were rod-shaped, as well as the other Bti strains
analyzed (Vec8, Bioflash, Bti4 and IP4444).
The A19 strain spores were subterminal placed on the mother-cell, and had an ellipsoidal
shape. Its longitudinal section area of the Bti spores of each strain was significantly different
(ANOVA, p < 0.0001). The A19 strain spores’ average area (1.00 ± 0.16 μm2) (Table 8) was
significantly smaller than Vec8 (1.20 ± 0.24 μm2) and Bioflash (1.17 ± 0.20 μm2) Bti strains
spores’ average areas (Tukey’HSD, p < 0.05). There was no significant difference between
A19, Bti4 (0.98 ± 0.15 μm2) and IP4444 (0.95 ± 0.19 μm2) strains spores’ average areas
(Tukey’s HSD, A19 and Bti4 strains p = 1.00; A19 and IP4444 strains p = 0.63; Bti4 and
IP4444 strains p = 0.85).
The parasporal crystals of A19 strain had predominantly a globular shape, as well as
Vec8, Bioflash, Bti4 and IP4444 Bti strains crystals (Fig. 3). As expected, Bce1 didn’t
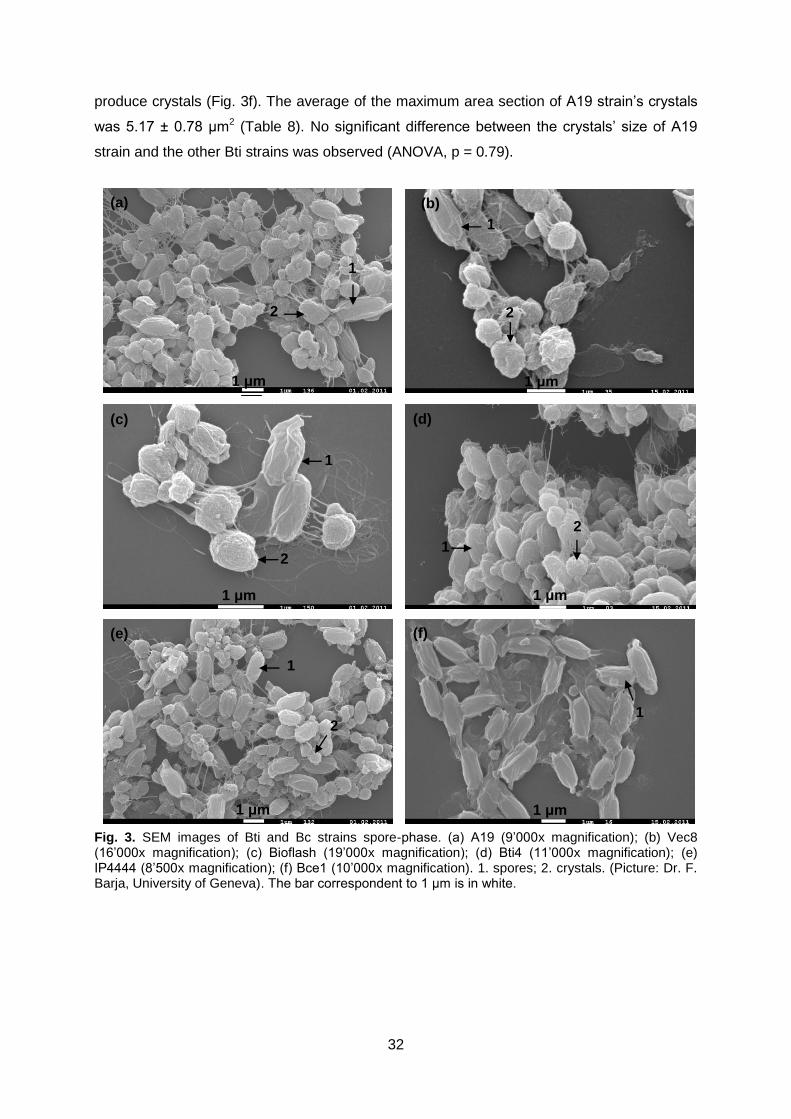
32
produce crystals (Fig. 3f). The average of the maximum area section of A19 strain’s crystals
was 5.17 ± 0.78 μm2 (Table 8). No significant difference between the crystals’ size of A19
strain and the other Bti strains was observed (ANOVA, p = 0.79).
Fig. 3. SEM images of Bti and Bc strains spore-phase. (a) A19 (9’000x magnification); (b) Vec8 (16’000x magnification); (c) Bioflash (19’000x magnification); (d) Bti4 (11’000x magnification); (e) IP4444 (8’500x magnification); (f) Bce1 (10’000x magnification). 1. spores; 2. crystals. (Picture: Dr. F. Barja, University of Geneva). The bar correspondent to 1 μm is in white.
(a) (b)
(d)
(e) (f)
(c)
1
1
1
1
1
1
2 2
2
2
2
1 μm 1 μm
1 μm 1 μm
1 μm 1 μm

33
Table 8. Morphological measurements.
Bti Strains Colony area (mm2) Spore longitudinal
section area (μm2)
Crystal maximum
sectional area
(μm2)
A19 49.08 ± 5.80 1.00 ± 0.16 5.17 ± 0.78
Vec8 33.93 ± 4.53 1.20 ± 0.24 4.85 ± 1.35
Bioflash 32.90 ± 6.35 1.17 ± 0.20 4.92 ± 1.01
Bti4 32.89 ± 4.78 0.98 ± 0.15 5.04 ± 1.03
IP4444 39.61 ± 4.87 0.95 ± 0.20 ND
(ND) Not Determined. Values are expressed as average ± SD. Colonies measurements: n = 43; spores measurements: n = 60; crystal measurements: n = 20.
Among the five Bti strains tested, A19 strain was the only one without flagella (Fig. 4a).
Vec8, Bioflash and Bti4 strains showed peritrichous flagella (Fig. 4b, 4c and 4d). The strain
IP4444 seemed to be monotrichous or lophotrichous (Fig. 4e).
Fig. 4. Highlighted flagella by the Leifson flagellar staining. (a) A19 strain; (b) Vec8 strain; (c) Bioflash strain (100x objective).
(b) (c)
(a)

34
Fig. 4. (Continued). (d) Bti4 strain; and (e) IP4444 strain; (100x objective).
3.4. Toxicological test
3.4.1. Amount of toxin per spore
The amount of toxin per spore was determined, to compare the productivity of the strains.
The A19 strain produced on average ± SD, 1.64x10⁻⁴ ± 5.84x10⁻⁶ ng of toxin per spore, Vec8
strain 1.34x10⁻⁴ ± 4.99x10⁻⁶ ng, Bioflash strain 1.32x10⁻⁴ ± 9.38x10⁻⁶ ng, Bti4 strain 9.91x10⁻⁵
± 4.99x10⁻⁶ ng and IP4444 strain 6.89x10⁻⁵ ± 7.60x10⁻⁶ ng of toxin per spore (Fig. 5).
Significant differences were obtained in the amount of toxin produced by the Bti strains
tested (ANOVA, p < 0.0001). A19 strain produced significantly more toxin per spore than the
other Bti strains (Tukey’s HSD, p < 0.05). The amount of toxin per spore produced by the Bti
IP4444 strain was significantly smaller than the other strains (Tukey’s HSD, p < 0.05). Vec8
and Bioflash Bti strains produced a similar quantity of toxin per spore (Tukey’s HSD, p =
0.97), and both produced significantly more toxin per spore than Bti4 (Tukey’s HSD, p <
0.05).
Fig. 5. Graphical representation of the amounts of toxin per spore of Bti strains tested. Bars represent standard deviations (n = 3).
0.00E+00
2.00E-05
4.00E-05
6.00E-05
8.00E-05
1.00E-04
1.20E-04
1.40E-04
1.60E-04
1.80E-04
To
xin
pe
r sp
ore
(n
g)
A19 Vec8 Bioflash Bti4 IP4444A19
1.8x10⁻⁴
1.6x10⁻⁴
1.4x10⁻⁴
1.2x10⁻⁴
1.0x10⁻⁴
8.0x10⁻⁵
6.0x10⁻⁵
4.0x10⁻⁵
2.0x10⁻⁵
0.0x10-0
(d) (e)
Vec8 Bioflash Bti4 IP4444
Toxin
pe
r sp
ore
(n
g)
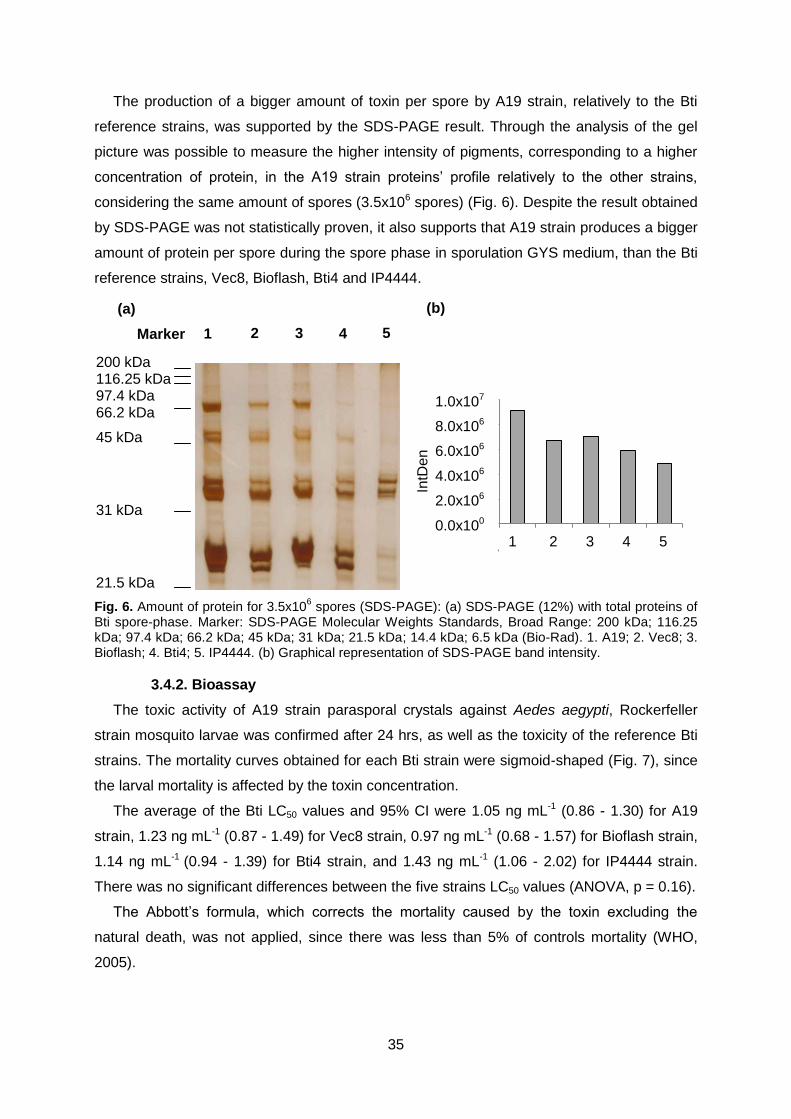
35
The production of a bigger amount of toxin per spore by A19 strain, relatively to the Bti
reference strains, was supported by the SDS-PAGE result. Through the analysis of the gel
picture was possible to measure the higher intensity of pigments, corresponding to a higher
concentration of protein, in the A19 strain proteins’ profile relatively to the other strains,
considering the same amount of spores (3.5x10⁶ spores) (Fig. 6). Despite the result obtained
by SDS-PAGE was not statistically proven, it also supports that A19 strain produces a bigger
amount of protein per spore during the spore phase in sporulation GYS medium, than the Bti
reference strains, Vec8, Bioflash, Bti4 and IP4444.
Fig. 6. Amount of protein for 3.5x10⁶ spores (SDS-PAGE): (a) SDS-PAGE (12%) with total proteins of
Bti spore-phase. Marker: SDS-PAGE Molecular Weights Standards, Broad Range: 200 kDa; 116.25 kDa; 97.4 kDa; 66.2 kDa; 45 kDa; 31 kDa; 21.5 kDa; 14.4 kDa; 6.5 kDa (Bio-Rad). 1. A19; 2. Vec8; 3. Bioflash; 4. Bti4; 5. IP4444. (b) Graphical representation of SDS-PAGE band intensity.
3.4.2. Bioassay
The toxic activity of A19 strain parasporal crystals against Aedes aegypti, Rockerfeller
strain mosquito larvae was confirmed after 24 hrs, as well as the toxicity of the reference Bti
strains. The mortality curves obtained for each Bti strain were sigmoid-shaped (Fig. 7), since
the larval mortality is affected by the toxin concentration.
The average of the Bti LC50 values and 95% CI were 1.05 ng mL-1 (0.86 - 1.30) for A19
strain, 1.23 ng mL-1 (0.87 - 1.49) for Vec8 strain, 0.97 ng mL-1 (0.68 - 1.57) for Bioflash strain,
1.14 ng mL-1 (0.94 - 1.39) for Bti4 strain, and 1.43 ng mL-1 (1.06 - 2.02) for IP4444 strain.
There was no significant differences between the five strains LC50 values (ANOVA, p = 0.16).
The Abbott’s formula, which corrects the mortality caused by the toxin excluding the
natural death, was not applied, since there was less than 5% of controls mortality (WHO,
2005).
0.E+00
2.E+06
4.E+06
6.E+06
8.E+06
1.E+07
1 2 3 4 5 Marker
1.0x10⁷
8.0x10⁶
6.0x10⁶
4.0x10⁶
2.0x10⁶
0.0x100
IntD
en
(a) (b)
1 2 3 4 5
200 kDa 116.25 kDa 97.4 kDa 66.2 kDa
45 kDa
31 kDa
21.5 kDa

36
It was observed that, after 24 hrs in contact with the A19 strain toxin maximum
concentration (10 ng mL-1), one of the 150 tested larvae was alive. This was not observed in
the other Bti strain tested.
-1.0 -0.5 0.0 0.5 1.00.0
0.2
0.4
0.6
0.8
1.0
A19
Vec8
Bioflash
Bti4
IP4444
Log (toxin concentration [ng mL-1
])
Mo
rta
lity
Fig. 7. Mortality curves of L3-early instars larvae of the biological model Ae. aegypti Rockefeller exposed to different Bti strains.
3.5. Proteomics
3.5.1. Total Bti spore-phase protein profile (SDS-PAGE)
From the spore-phase protein profiles obtained through SDS-PAGE, the distinction
between the Bti strains and the 2 non-Bti strains (B. sphaericus strain and B. thuringiensis
var. kurstaki) is clear. The A19 strain spore-phase protein profile was very similar to the ones
of the Bti reference strains (Fig. 8).
The bands corresponding to Cry4Aa, Cry4Ba, Cry10Aa, Cry11Aa, Cyt1Aa and Cyt2Ba
toxins were identified, despite the bands corresponding to the Cry4 proteins were very thin
(Fig. 8).
Were also observed protein bands with molecular weights that don’t correspond to any of
the 6 toxic proteins referred above, which constitute the parasporal crystal. These unknown
bands were not identified.
Mo
rta
lity
A19
Vec8
Bioflash
Bti4
IP4444
1.0
0.8
0.6
0.4
0.2
0.0
-1.0 -0.5 0.0 0.5 1.0
Log (toxin concentration [ng mL-1])
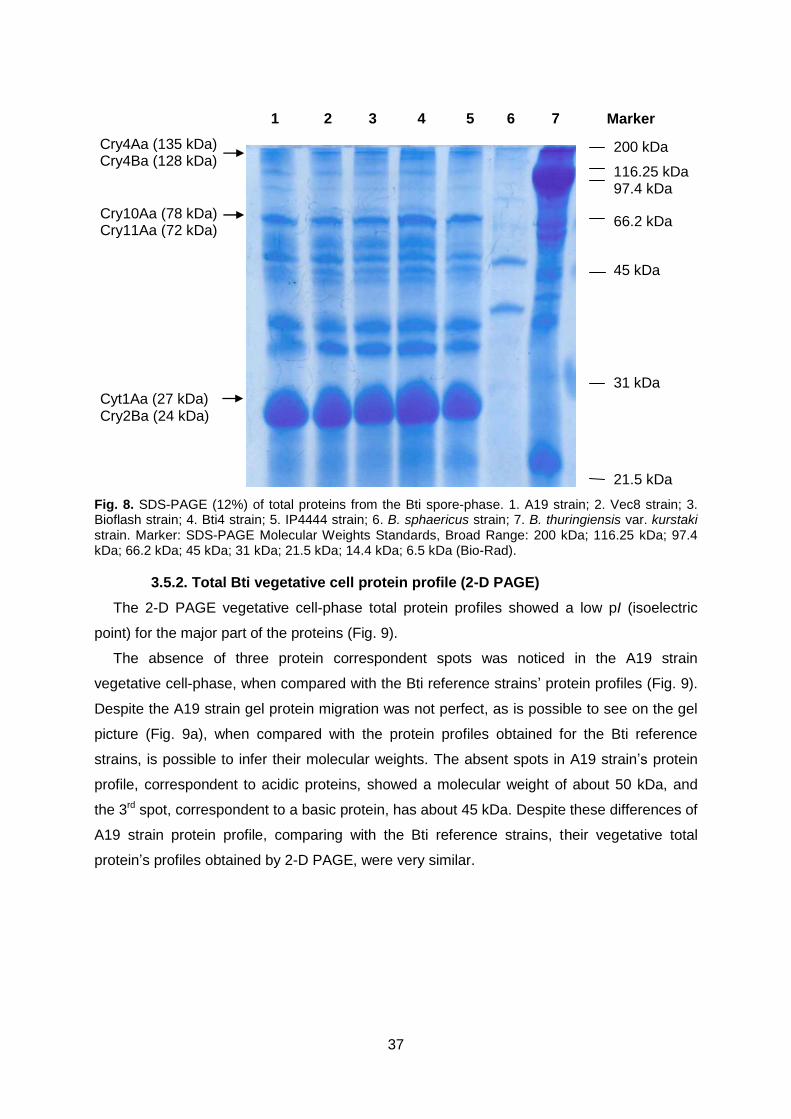
37
Fig. 8. SDS-PAGE (12%) of total proteins from the Bti spore-phase. 1. A19 strain; 2. Vec8 strain; 3. Bioflash strain; 4. Bti4 strain; 5. IP4444 strain; 6. B. sphaericus strain; 7. B. thuringiensis var. kurstaki strain. Marker: SDS-PAGE Molecular Weights Standards, Broad Range: 200 kDa; 116.25 kDa; 97.4 kDa; 66.2 kDa; 45 kDa; 31 kDa; 21.5 kDa; 14.4 kDa; 6.5 kDa (Bio-Rad).
3.5.2. Total Bti vegetative cell protein profile (2-D PAGE)
The 2-D PAGE vegetative cell-phase total protein profiles showed a low pI (isoelectric
point) for the major part of the proteins (Fig. 9).
The absence of three protein correspondent spots was noticed in the A19 strain
vegetative cell-phase, when compared with the Bti reference strains’ protein profiles (Fig. 9).
Despite the A19 strain gel protein migration was not perfect, as is possible to see on the gel
picture (Fig. 9a), when compared with the protein profiles obtained for the Bti reference
strains, is possible to infer their molecular weights. The absent spots in A19 strain’s protein
profile, correspondent to acidic proteins, showed a molecular weight of about 50 kDa, and
the 3rd spot, correspondent to a basic protein, has about 45 kDa. Despite these differences of
A19 strain protein profile, comparing with the Bti reference strains, their vegetative total
protein’s profiles obtained by 2-D PAGE, were very similar.
1 2 3 4 5 6 7 Marker
Cry4Aa (135 kDa) Cry4Ba (128 kDa)
Cry10Aa (78 kDa) Cry11Aa (72 kDa)
Cyt1Aa (27 kDa) Cry2Ba (24 kDa)
200 kDa
116.25 kDa 97.4 kDa
66.2 kDa
45 kDa
31 kDa
21.5 kDa
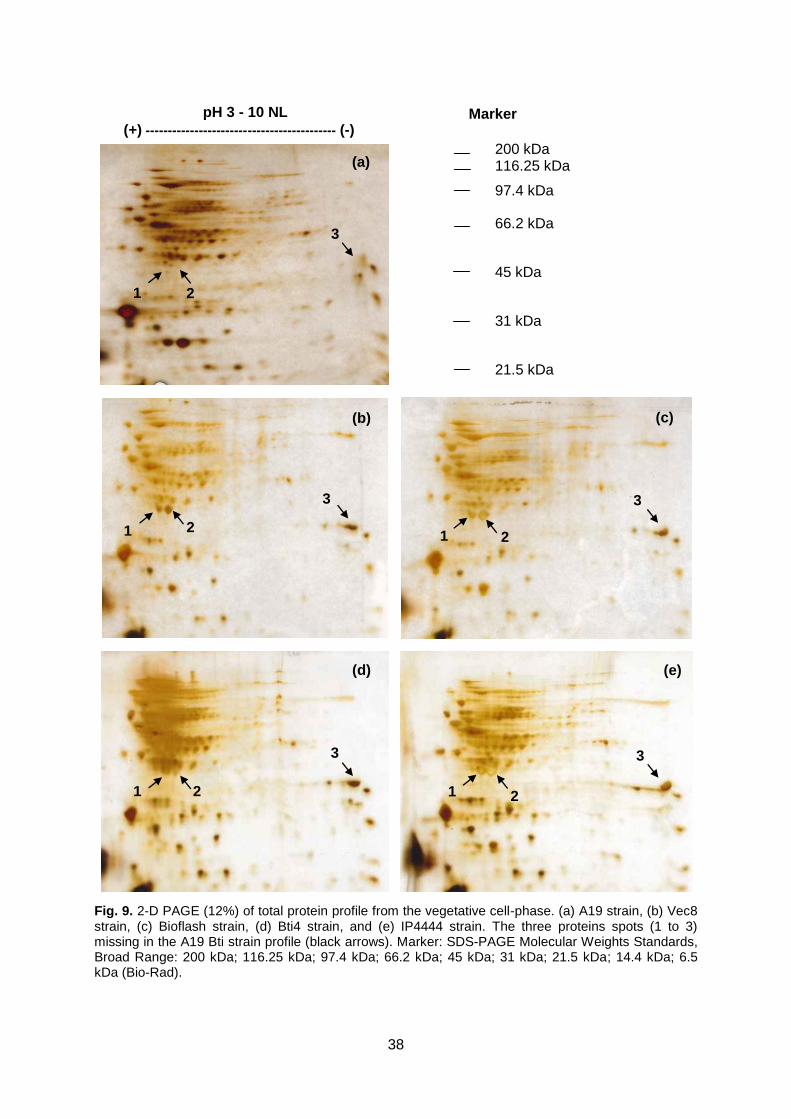
38
Fig. 9. 2-D PAGE (12%) of total protein profile from the vegetative cell-phase. (a) A19 strain, (b) Vec8 strain, (c) Bioflash strain, (d) Bti4 strain, and (e) IP4444 strain. The three proteins spots (1 to 3) missing in the A19 Bti strain profile (black arrows). Marker: SDS-PAGE Molecular Weights Standards, Broad Range: 200 kDa; 116.25 kDa; 97.4 kDa; 66.2 kDa; 45 kDa; 31 kDa; 21.5 kDa; 14.4 kDa; 6.5 kDa (Bio-Rad).
pH 3 - 10 NL
(+) ------------------------------------------- (-)
1 2
3
(a)
(b) (c)
(d) (e)
Marker
200 kDa 116.25 kDa
97.4 kDa
66.2 kDa
45 kDa
31 kDa
21.5 kDa
1
1 1
1 2 2
2 2
3 3
3 3
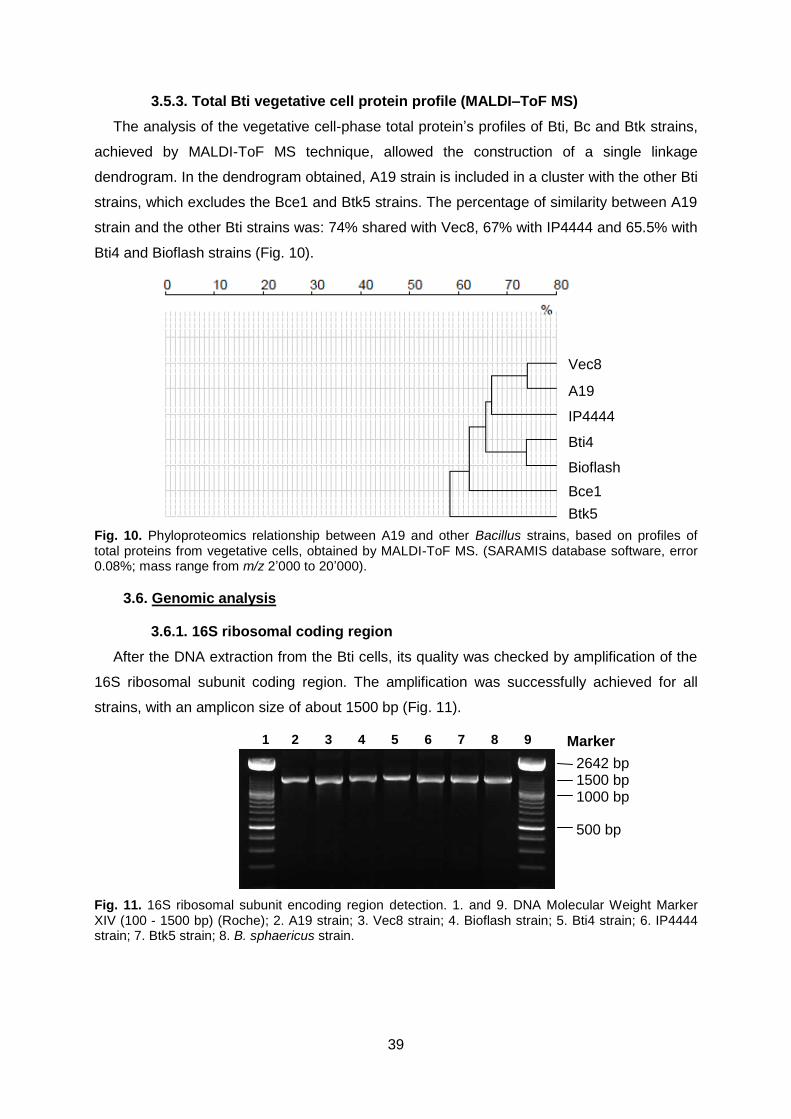
39
3.5.3. Total Bti vegetative cell protein profile (MALDI–ToF MS)
The analysis of the vegetative cell-phase total protein’s profiles of Bti, Bc and Btk strains,
achieved by MALDI-ToF MS technique, allowed the construction of a single linkage
dendrogram. In the dendrogram obtained, A19 strain is included in a cluster with the other Bti
strains, which excludes the Bce1 and Btk5 strains. The percentage of similarity between A19
strain and the other Bti strains was: 74% shared with Vec8, 67% with IP4444 and 65.5% with
Bti4 and Bioflash strains (Fig. 10).
Fig. 10. Phyloproteomics relationship between A19 and other Bacillus strains, based on profiles of total proteins from vegetative cells, obtained by MALDI-ToF MS. (SARAMIS database software, error 0.08%; mass range from m/z 2’000 to 20’000).
3.6. Genomic analysis
3.6.1. 16S ribosomal coding region
After the DNA extraction from the Bti cells, its quality was checked by amplification of the
16S ribosomal subunit coding region. The amplification was successfully achieved for all
strains, with an amplicon size of about 1500 bp (Fig. 11).
Fig. 11. 16S ribosomal subunit encoding region detection. 1. and 9. DNA Molecular Weight Marker XIV (100 - 1500 bp) (Roche); 2. A19 strain; 3. Vec8 strain; 4. Bioflash strain; 5. Bti4 strain; 6. IP4444 strain; 7. Btk5 strain; 8. B. sphaericus strain.
1 2 3 4 5 6 7 8 9
Vec8
A19
IP4444
Bti4
Bioflash
Bce1
Btk5
2642 bp 1500 bp 1000 bp
500 bp
Marker

40
3.6.2. cry and cyt genes detection
All Cry (Cry4Aa, Cry4Ba, Cry10Aa and Cry11Aa) and Cyt (Cyt1Aa and Cyt2Ba) protein
encoding genes were present in all Bti strains tested, A19, Vec8, Bioflash, Bti4 and IP4444
(Fig.12 shows the amplification products for the A19 Bti strain).
Fig. 12. A19 strain’s cry and cyt genes detection. 1. cry4Aa (459 bp); 2. cry4Ba (321 bp); 3. cry10Aa (358 bp); 4. cry11Aa (342 bp); 5. cyt1Aa (477 bp); 6. cyt2Aa (355 bp); 7. DNA Molecular Weight Marker XIII (50 - 750 bp) (Roche).
3.6.3. Total Bti vegetative cell DNA profile (RAPD-PCR)
No DNA amplification occurred.
4. DISCUSSION
Throughout this thesis work the A19 Bti strain, first isolated from Bolle di Magadino by
Chappuis (2002), was characterized and compared with four different Bti reference strains,
among which stands out Vec8, the Bti strain currently applied at the Bolle di Magadino to
control floodwater mosquitoes population. Despite the many similarities among the A19
strain and the other Bti reference strains, the differences at morphological and molecular
levels suggested that this is an autochthonous strain.
The A19 strain growth curve was analysed so that the strain’s growth profile and doubling
time could be known, as well as its comparison with Vec8 strain under rich conditions could
be performed. For both strains a typical growth profile, with evident exponential and
stationary phases, was obtained, with no significant differences between their doubling times.
The stationary phase, achieved as result of the depletion of the medium nutrients or the
accumulation of fermentation end-products (Landwall & Holme, 1977), was attained for both
strains at the same time and at the same maximum OD (approximately 10). These result
showed that, in rich conditions, A19 strain needs an equivalent growth time to Vec8 strain.
It is known, by the literature, that the biochemical characterization is not enough to
distinguish between Bt strains, due to the high variability of the biochemical reactions among
them (De Barjac & Frachon, 1990; Ben-dov et al., 1997; Pérez et al., 2005). As phenotypical
features, they can be influenced by environmental factors. Nevertheless, it complements the
information about the microorganism. As a complementary method for API galleries Vitek ID-
1 2 3 4 5 6 7
2642 bp
750 bp 500 bp
250 bp
Marker
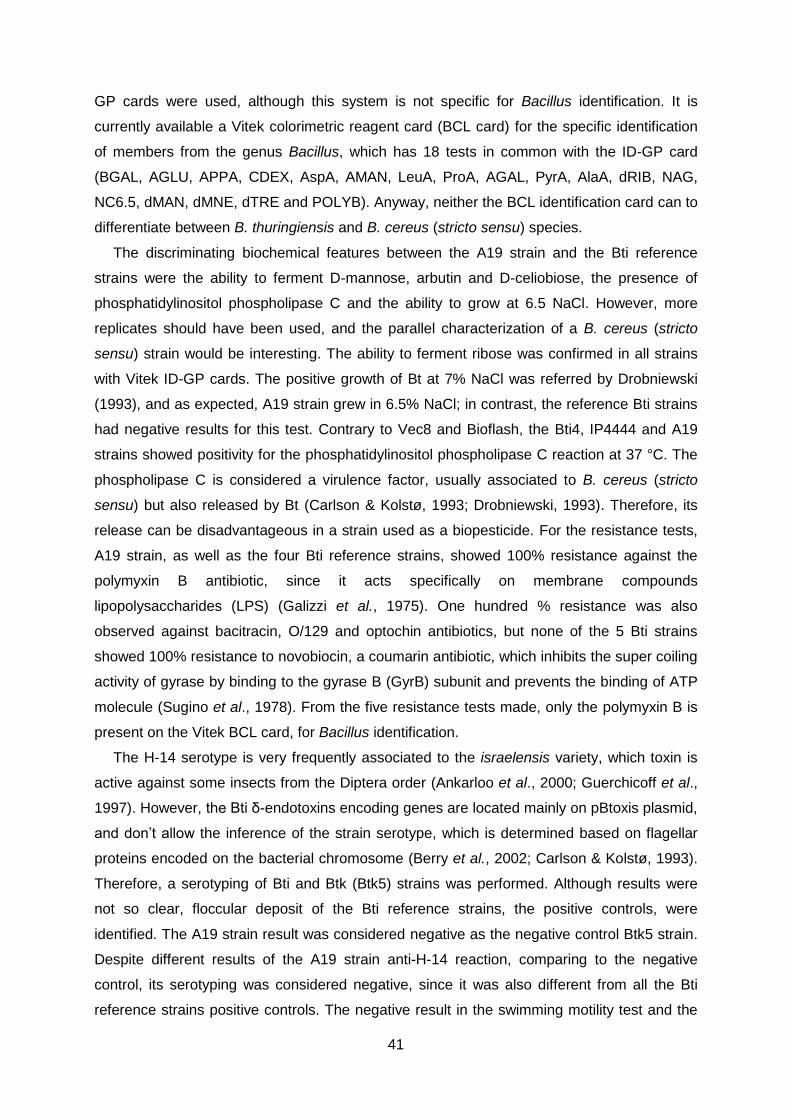
41
GP cards were used, although this system is not specific for Bacillus identification. It is
currently available a Vitek colorimetric reagent card (BCL card) for the specific identification
of members from the genus Bacillus, which has 18 tests in common with the ID-GP card
(BGAL, AGLU, APPA, CDEX, AspA, AMAN, LeuA, ProA, AGAL, PyrA, AlaA, dRIB, NAG,
NC6.5, dMAN, dMNE, dTRE and POLYB). Anyway, neither the BCL identification card can to
differentiate between B. thuringiensis and B. cereus (stricto sensu) species.
The discriminating biochemical features between the A19 strain and the Bti reference
strains were the ability to ferment D-mannose, arbutin and D-celiobiose, the presence of
phosphatidylinositol phospholipase C and the ability to grow at 6.5 NaCl. However, more
replicates should have been used, and the parallel characterization of a B. cereus (stricto
sensu) strain would be interesting. The ability to ferment ribose was confirmed in all strains
with Vitek ID-GP cards. The positive growth of Bt at 7% NaCl was referred by Drobniewski
(1993), and as expected, A19 strain grew in 6.5% NaCl; in contrast, the reference Bti strains
had negative results for this test. Contrary to Vec8 and Bioflash, the Bti4, IP4444 and A19
strains showed positivity for the phosphatidylinositol phospholipase C reaction at 37 °C. The
phospholipase C is considered a virulence factor, usually associated to B. cereus (stricto
sensu) but also released by Bt (Carlson & Kolstø, 1993; Drobniewski, 1993). Therefore, its
release can be disadvantageous in a strain used as a biopesticide. For the resistance tests,
A19 strain, as well as the four Bti reference strains, showed 100% resistance against the
polymyxin B antibiotic, since it acts specifically on membrane compounds
lipopolysaccharides (LPS) (Galizzi et al., 1975). One hundred % resistance was also
observed against bacitracin, O/129 and optochin antibiotics, but none of the 5 Bti strains
showed 100% resistance to novobiocin, a coumarin antibiotic, which inhibits the super coiling
activity of gyrase by binding to the gyrase B (GyrB) subunit and prevents the binding of ATP
molecule (Sugino et al., 1978). From the five resistance tests made, only the polymyxin B is
present on the Vitek BCL card, for Bacillus identification.
The H-14 serotype is very frequently associated to the israelensis variety, which toxin is
active against some insects from the Diptera order (Ankarloo et al., 2000; Guerchicoff et al.,
1997). However, the Bti δ-endotoxins encoding genes are located mainly on pBtoxis plasmid,
and don’t allow the inference of the strain serotype, which is determined based on flagellar
proteins encoded on the bacterial chromosome (Berry et al., 2002; Carlson & Kolstø, 1993).
Therefore, a serotyping of Bti and Btk (Btk5) strains was performed. Although results were
not so clear, floccular deposit of the Bti reference strains, the positive controls, were
identified. The A19 strain result was considered negative as the negative control Btk5 strain.
Despite different results of the A19 strain anti-H-14 reaction, comparing to the negative
control, its serotyping was considered negative, since it was also different from all the Bti
reference strains positive controls. The negative result in the swimming motility test and the
42
confirmation of the absence of flagella in the A19 strain, contrary to the Bti reference strains,
supported its negative result in the serotyping. According to the classification of Lee and
collaborators (2003), A19 strain can be classified as an "un-testable" strain, concerning the
serotyping, since it doesn’t present flagella.
The morphological characteristics of the A19 strain presented similarities with the Bti
reference strains both at macro and microscopic levels and respect the standards of Bacillus
thuringiensis described in “Bergey’s manual of systematic bacteriology” (Vos et al., 2009).
However, the bigger colonies, as well as the absence of flagella in A19 strain, supported that
A19 and Vec8 are two different strains.
The presence of globular proteinaceous parasporal bodies in the A19 strain as in the Bti
reference strains tested, was confirmed and supports the Bacillus thuringiensis nature of this
strain (Angsuthanasombat et al., 2004). The predominant globular shape of the A19 strain
parasporal crystals is a feature usually found in israelensis variety (Boisvert, 2005; Lecadet
et al., 1999). The crystals’ shape depends on its protoxin composition, and the globular
shape detected in all Bti strains observed is usually associated to the Cry4A and Cry4B
protoxins (Boisvert, 2005; Lecadet et al., 1999; Schnepf et al., 1998). The SEM images of the
Bti spores-crystals suspensions showed that the crystal shape is not perfectly round, which
could be associated to its diverse components, since the crystals are not only composed by
Cry4, but also by other protoxins, such as Cry11, associated to a rhomboid shape (Schnepf
et al., 1998). The components of the culture growth medium, as well as their concentrations,
can interfere with the dimension of the parasporal crystals produced (Obeta & Okafor, 1984;
Rajalakshmi & Shethna, 1980; Scherrer et al., 1973). Furthermore, the parasporal bodies
production is not limited to one per spore (Tyrell et al., 1981). Thus, to obtain comparable
spores-crystals suspensions, the conditions of growth used were the same for all strains
(A19, Vec8, Bioflash, Bti4 and IP4444), and the amount of toxin was quantified considering
the same amount of spores. A bigger amount of proteins per spore in A19 strain’s spores-
toxins suspension was measured, when compared to the Bti reference strains. The bigger
amount of toxin produced by the A19 strain was verified in both solid and liquid GYS
medium, but only the results obtained from the solid medium were statistically confirmed.
Previous studies (Guidi et al., 2011; De Respinis et al., 2006) showed that the long-term
applications of the Bti-based product VectoBac-G® increases the Bti spores’ number in the
soil, although a major ecological impact on Bolle di Magadino was excluded. Therefore, a
bigger production of toxin could mean not only an economic advantage of A19 strain as
biopesticide, but also an environmental advantage since for the same amount of toxin
currently applied, fewer spores would be introduced in the environment.
The presence of Cry4A, Cry4B, Cry10Aa, Cry11Aa, Cyt1Aa and Cyt2Ba δ-endotoxins
encoding genes was confirmed, which suggests the presence of whole pBtoxis plasmid,

43
since the toxin genes are usually all located on the same plasmid (Ben-dov et al., 1997;
Pérez et al., 2005). It also supports the attribution of the israelensis variety to A19 strain and
gives an indication about its target organism (Schnepf et al., 1998), since this δ-endotoxins
are responsible for the toxicity of Bti against members from Diptera order (Ben-dov et al.,
1997; Pérez et al., 2005).
The toxic activity of A19 strain against mosquito larvae was confirmed. A19 strain showed
to produce parasporal crystals with a toxic activity similar to the Bti reference strains tested.
From the literature is known that the activity of a Bti strain is influenced by the proportion of
the δ-endotoxins that constitute the crystal (Aronson et al., 1991; Otieno-Ayayo et al., 2008).
According to this, and considering the similar results obtained between the strains with the
bioassay, it can be hypothesized that the composition of crystal of the five strains tested is
similar. After 24 hrs of exposure to the A19 toxin, only a living mosquito larva was observed
at the maximum toxin concentration. Since the LC50 values were similar for the five strains, it
could be hypothesized the non-ingestion of the toxin by the larva due to the erroneous use of
a larva in a more advanced stage, that had already stopped feeding itself (Boisvert, 2005).
Considering the SDS-PAGE proteomics analysis of the Bti spore-phase, there was no
detectable difference between the A19 strain and the Bti reference strains. When compared
to the Bti reference strains (Vec8, Bioflash, Bti4 and IP4444), a B. sphaericus strain and a B.
thuringiensis var. kurstaki (Btk) strain profiles, A19 strain showed to be clearly more similar to
the Bti reference strains than to the non-Bti reference strains. This confirmed the similar
composition of the parasporal crystal produced by A19 and the other Bti strains tested, in
agreement with the bioassay’s results; and supports the presence of whole pBtoxis plasmid
in A19 strain. The spore-phase protein profiles obtained, presented similarities with the Bti
protein spore-phase profile obtained by Chaves and collaborators (2008), and Lecadet and
collaborators (1999). Although quite thin, the bands corresponding to the Cry4Aa and
Cry4Ba toxins were identified in all Bti strains’ profiles. The thinness of Cry4 bands could be
explained by imperfect migration conditions, or a rapid degradation of the Cry toxins could
have influenced the visibility of the Cry4 toxins on the gel (Stotzky, 1998). The difficult
separation of Cry10Aa from the Cry11Aa bands, as well as the Cyt1Aa from the Cyt2Ba
bands, was due to the proximity of their molecular weights. Moreover, the Cyt toxins were
present in a big concentration, making the separation difficult. The high quantity of the Cyt
proteins is in accordance to the studies of Charles and collaborators (2000), indicating that
the 28 kDa protein represents 54% of total crystal proteins. All the Bti protein profiles
presented other bands beyond the Cry and Cyt protoxins, which could correspond to other
spores-surface proteins (Tyrell et al., 1981).
Considering the vegetative cell-phase total proteins’ profile, represented in a 2-D PAGE,
A19 strain showed to be very similar when compared with the Bti reference strains. Despite
44
the similarities, three spots lacked in the 2-D PAGE protein profile of A19 strain. Based on
the theoretical isoelectric points, molecular weight of the missing proteins (Apweiler et al.,
2011; Gasteiger, 2003), and considering the absence of flagella in the A19 strain, it is very
likely that some of the missing spots correspond to flagellum related proteins. The 1 and 2-
marked missing proteins, with acidic characteristics, could be the flagellar biosynthesis
protein FlhF (pI = 5.55 and Mw = 49.85 kDa; SwissProt: Q3EP41), a GTP-binding protein
without which cells are non-motile (Carpenter et al., 1992), and the flagellar hook-associated
protein 2 (pI = 5.67 and Mw = 49.90 kDa; SwissProt: Q6HKR1), that is involved in the
filament formation (Homma et al., 1984). The third spot, corresponding to a basic protein,
seems to correspond to the B6 spot labelled by Hirose and collaborators (2000) in Bacillus
subtilis, but it was not identified. The use of Bce1 as control for the 2-D PAGE whole protein
profile analysis would be helpful to identify some proteins and control some eventual
differences between Bt and Bc. Despite Bt was considered safe for many of non-target
organisms, including humans, due to the high specificity of its toxins (Boisvert, 2005), this
bacterium can sporadically produce virulence factors that are problematic for humans health
(Carlson & Kolstø, 1993; Drobniewski, 1993; Hansen & Hendriksen, 2001). From the
literature it is known that flagella and motility are involved in the parasite - host interactions
(Ghelardi et al., 2002). Moreover, it was proved that an anomaly that compromises the
flagellar transport can interfere with the release of virulence factors (Ghelardi et al., 2002).
Thus, the identification of A19 strain missing proteins would be interesting to better
understand if they affect the releasing of virulence factors. Their identification could be
performed, for example, through the analysis of their peptide mass fingerprinting (PMF)
obtained by the MALDI-ToF MS/MS technique.
The Bti vegetative cell-phase total protein’s profile was also achieved using the MALDI-
ToF MS technique. This technique enables the mass determination of high molecular weight
biomolecules, as the proteins (Pieles et al., 1993). It is a rapid and reliable technique to
perform phyloproteomics (Conway et al., 2001). Since it allows to obtain the whole cell
proteins profile, the comparison with other organisms' protein profiles is possible. The
dendrogram based on the comparison of the proteins’ profiles, obtained for the different
strains, allowed us to confirm the similarity of A19 strain with the Bti reference strains. The
obtained low percentages of similarity between the strains is not uncommon when this
technique is used (Kallow et al., 2006). This can be due to the interference of different factors
which create variations on each reading made, such as fluctuations on the laser power,
changes on the detector answer, but mainly due to the heterogeneous incorporation of the
analyte on the matrix, when the samples are prepared (Duncan et al., 2008). Nevertheless,
the dendrograms obtained through this technique are reliable, clustering together the related
organisms (Kallow et al., 2006). A19 strain was in the same cluster together with the Bti

45
reference strains, and showed a bigger similarity to Vec8 strain (74%) than to the other Bti
strains tested. Bce1 strain was closer to the Bti strains (62% similarity) than Btk5 strain (58%
similarity), but this can be due to the great taxonomic proximity between Bt and Bc species
(Bavykin et al., 2004; Drobniewski, 1993; Vilas-Bôas et al., 2007).
Finally, to clarify the origin of A19 strain, a genomic method was employed, the random
amplified polymorphic DNA – PCR (RAPD-PCR) technique, which allows to create a DNA
fingerprint of each microorganism, and thus understand better their phylogenetic relationship
(Chaves et al., 2010). The polymorphic regions on the DNA allow the discrimination among
strains from the same serotype or from different serotypes (Brousseau et al., 1993), thus the
RAPD-PCR technique can be used to classify new strains when the serotyping is not
possible (Chaves et al., 2010). Since the quality of the DNA extracted from the Bti strains
was confirmed by the amplification of the 16S ribosomal subunit coding region, the reason
why the amplification of the Bti strains’ DNA sequences with the RAPD-PCR method was not
successful could be due to the unreached low stringency conditions. To promote low
stringent RAPD-PCR conditions, the annealing temperature should be low, and the PCR
buffer should have a high salt concentration (Kumar et al., 2009). In addition, the use of
HotStarTaq DNA Polymerase was inadequate, since this enzyme is very specific. Its use was
due to the unavailability of a more appropriate DNA polymerase enzyme when the
experiment was performed. Moreover, the MasterMix also used in a separate assay, already
included a PCR buffer that doesn't promote the low stringency conditions required. It would
be interesting to repeat this experiment using an adequate Taq DNA polymerase enzyme
(non-high specific), since this technique would allow the acquirement of more information
about the similarity between the Bti strains tested, particularly between A19 strain and the Bti
strain currently applied at the Bolle di Magadino, Vec8.
5. CONCLUSION
This study supported A19 strain’s classification as Bacillus thuringiensis var. israelensis,
and allowed to deepen the knowledge about A19 strain, a potential biopesticide, and thus for
a possible improve of the maintenance of mosquitoes’ population on the Swiss natural
reserve, Bolle di Magadino.
It was confirmed that A19 and Vec8 are independent strains. Differences at morphological
and molecular levels between A19 strain and the Bti reference strains used in this study,
including the Bti strain used at Bolle di Magadino for the control of mosquitoes’ population,
support the hypothesis that A19 strain is an autochthonous microorganism. Despite this, the
dendrogram obtained based on total protein profiles revealed a bigger similarity between the
strains A19 and Vec8. Therefore, to understand better the similarity level between these two

46
strains, and to confirm the origin of A19 strain, it would be important to finalize the genomic
analysis through the RAPD-PCR technique, and perform a phylogeny.
The A19 strain showed to have potential as biopesticide. Its toxicity against mosquito
larvae was confirmed, and showed to be equivalent to the Bti reference strains tested. As
biopesticide, A19 strain could be economically more advantageous than the Bti reference
strains tested, since it produces a bigger amount of toxin per spore than the other Bti strains
analyzed, which means higher profitability. It could also be environmentally more
advantageous, since A19 strain’s higher production of toxin per spore would allow a
reduction in the number of spores introduced in the environment during a treatment, without
reducing the toxin concentration. The autochthonous condition of A19 strain is also an
environmental advantage, since it will avoid the introduction of an external microorganism on
the Bolle di Magadino natural reserve. Moreover, A19 strain showed to be a non-motile strain
and the absence of flagella was confirmed. This characteristic could also be environmentally
advantageous, since it can be associated to a defective release of virulence factors and
consequently to a lower pathogenicity level; however, this hypothesis needs to be confirmed.
The A19 strain missing proteins should be identified through MALDI-ToF MS/MS technique;
and the A19 strain’s safety for animals’ health, should be tested.
47
6. REFERENCES
Angsuthanasombat, C., Crickmore, N. & Ellar, D. (1993). Effects on toxicity of eliminating a cleavage site in a predicted inter-helical loop in Bacillus thuringiensis CryIVB δ-endotoxin. FEMS Microbiol Lett 111, 255-261.
Angsuthanasombat, C., Uawithya, P., Leetachewa, S., Pornwiroon, W., Ounjai, P., Kerdcharoen, T., Katzenmeier, G. & Panyim, S. (2004). Bacillus thuringiensis Cry4A and Cry4B mosquito-larvicidal proteins: homology-based 3D model and implications for toxin activity. J Biochem Mol Biol 37, 304-313.
Ankarloo, J., Caugant, D. A, Hansen, B. M., Berg, A., Kolstø, A.-B. & Lövgren, A. (2000). Genome stability of Bacillus thuringiensis subsp. israelensis isolates. Curr Microbiol 40, 51-56.
Apweiler, R., Wu, C. & Xenarios, I. (2011). Ongoing and future developments at the Universal Protein Resource. Nucleic Acids Res 39, D214-D219.
Aronson, A. I., Han, E.-soo, Mcgaughey, W. & Johnson, D. (1991). The solubility of inclusion proteins from Bacillus thuringiensis is dependent upon protoxin composition and is a factor in toxicity. Appl Environ Microbiol 57, 981-986.
Attathom, T., Chongrattanameteekul, W., Chanpaisang, J. & Siriyan, R. (1995). Morphological diversity and toxocity of delta-endotoxin produced by various strains of Bacillus thuringiensis. Bulletin of Entomological Research 85, 167-173.
Barritt, M. M. (1936). The intensification of the Voges-Proskauer reaction by the addition of α-naphthol. J Pathol Bacteriol 42, 441-454.
Bavykin, S. G., Lysov, Y. P., Zakhariev, V., Kelly, J. J., Jackman, J., Stahl, D. A. & Cherni, A. (2004). Use of 16S rRNA, 23S rRNA, and gyrB gene sequence analysis to determine phylogenetic relationships of Bacillus cereus group microorganisms. J Clin Microbiol 42, 3711-4730. Am Soc Microbiol.
Ben-dov, E., Zaritsky, A., Dahan, E., Barak, Z. E. E. V., Sinai, R., Manasherob, R., Khamraev, A., Troitskaya, E., Dubitsky, A., & other authors. (1997). Extended screening by PCR for seven cry-group genes from field-collected strains of Bacillus thuringiensis. Appl Environ Microbiol 63, 4883-4890.
Berber, I. (2004). Characterization of Bacillus species by numerical analysis of their SDS-PAGE protein profiles. J Cell Mol Biol 3, 33–37.
Berry, C., Neil, S. O., Ben-dov, E., Jones, A. F., Murphy, L., Quail, M. A., Holden, M. T. G., Harris, D., Zaritsky, A. & Parkhill, J. (2002). Complete sequence and organization of pBtoxis , the toxin-coding plasmid of Bacillus thuringiensis subsp. israelensis. Appl Environ Microbiol 68, 5082-5095.
Black, J. G. (2004). An introduction to taxonomy: the bacteria. In Microbiology: Principles and Explorations, 6
th edn., pp. 232-263. Edited by J. G. Black. Wiley
Boisvert, M. (2005). Utilization of Bacillus thuringiensis var. israelensis (Bti) - based formulations for the biological control of mosquitoes in Canada. In 6
th Pacific Rim Conference on the Biotechnology
of Bacillus thuringiensis and its Environmental Impact, Victoria BC, pp. 87-93. Bradford, M. M. (1976). A rapid and sensitive method for the quantitation of microgram quantities of
protein utilizing the principle of protein-dye binding. Anal Biochem 72, 248-254. Braga, I. A. & Valle, D. (1998). Aedes aegypti: vigilância, monitoramento da resistência e alternativas
de controle no Brasil. Epidemiol Serv Saúde 16, 295-302. Bravo, A. (1997). Phylogenetic relationships of Bacillus thuringiensis δ-endotoxin family proteins and
their functional domains. J Bacteriol 179, 2793-2801. Bravo, A., Gill, S. S. & Soberón, M. (2008). Mode of action of Bacillus thuringiensis Cry and Cyt
toxins and their potential for insect control. Toxicon 49, 423-435. Bravo, A., Likitvivatanavong, S., Gill, S. S. & Soberón, M. (2011). Bacillus thuringiensis: a story of a
successful bioinsecticide. Insect Biochem Mol Biol 41, 423-431. Elsevier Ltd. Brousseau, R., Saint-Onge, A., Préfontaine, G., Masson, L. & Cabana, J. (1993). Arbitrary primer
polymerase chain reaction, a powerful method to identify Bacillus thuringiensis serovars and strains. Appl Environ Microbiol 59, 114-9.
Butko, P. (2003). Cytolytic toxin Cyt1A and its mechanism of membrane damage: data and hypotheses. Appl Environ Microbiol 69, 2415-2422.
Cahan, R., Friman, H. & Nitzan, Y. (2008). Antibacterial activity of Cyt1Aa from Bacillus thuringiensis subsp. israelensis. Microbiol 154, 3529-36.
Carlson, C. R. & Kolstø, A.-B. (1993). A complete physical map of a Bacillus thuringiensis chromosome. J Bacteriol 175, 1053-60.
Carpenter, P. B., Hanlon, D. W. & Ordal, G. W. (1992). flhF, a Bacillus subtilis flagellar gene that encodes a putative GTP-binding protein. Mol Microbiol 6, 2705-2713.
48
Cepleanu, F. (1993). Validation and application of three bench-top bioassays for screening of crude plant extracts and subsequent activity-guided isolation. Université de Lausanne.
Chappuis S. (2002). Approche moléculaire de l'impact de Bacillus thuringiensis israelensis en tant qie biopesticide. Université de Genève
Charles, J.-F., A. Delécluse, & C. Nielsen-Le Roux (2000). Entomopathogenic bacteria: from laboratory to field application, 1
st edn. (J.-F. Charles, A. Delécluse & C. N.-le Roux, Eds). Springer.
Chaves, J. Q., Cavados, C. F. G. & Rabinovitch, L. (2008). Phenotypic and genotypic features of new autoagglutinating Bacillus thuringiensis strains. J Invertbr Pathol 98, 85-92.
Chaves, J., Stringuini, F. & Pires, E. (2010). Genotypic analysis of Bacillus thuringiensis serovars by RAPD-PCR. Neotropic Biol Conservat 5, 106-112.
Ciccia, G., Coussio, J. & Mongelli, E. (2000). Insecticidal activity against Aedes aegypti larvae of some medicinal South American plants. J Ethnopharmacol 72, 185-189.
Clark, W. A. (1976). A simplified Leifson flagella stain. J Clin Microbiol 3, 632-634. Conway, G. C., Smole, S. C., Sarracino, D. a, Arbeit, R. D. & Leopold, P. E. (2001).
Phyloproteomics: species identification of Enterobacteriaceae using matrix-assisted laser desorption/ionization time-of-flight mass spectrometry. J Mol Microbiol Biotechnol 3, 103-12.
De Barjac, H. & Frachon, E. (1990). Classification of Bacillus thuringiensis. Entomophaga 35, 233-240.
De Barjac, H. (1978). A new subspecies of Bacillus thuringiensis very toxic for mosquitoes Bacillus thuringiensis var. israelensis serotype 14. C R Acad Sci Paris 286, 797-800.
De Respinis, S., Demarta, A., Patocchi, N., Lüthy, P., Peduzzi, R. & Tonolla, M. (2006). Molecular identification of Bacillus thuringiensis var. israelensis to trace its fate after application as a biological insecticide in wetland ecosystems. Lett Appl Microbiol 43, 495-501.
Demarta, A., Tonolla, M., Caminada, A., Ruggeri, N. & Peduzzi, R. (1999). Signature region within the 16S rDNA sequences of Aeromonas popoffii. FEMS Microbiology Letters 172, 239-246.
Drobniewski, F. A. (1993). Bacillus cereus and related species. Clin Microbiol Rev 6, 324-338. Duncan, M. W., Roder, H. & Hunsucker, S. W. (2008). Quantitative matrix-assisted laser
desorption/ionization mass spectrometry. Briefings in Functional Genomics & Proteomics 7, 355-70.
Ederer, G. M. & Clark, M. (1970). Motility-indole-ornithine medium. Appl Microbiol 20, 849-50. Eilenberg, J. & Hokkanen, H. M. T. (2006). An ecological and societal approach to biological control,
1st edn. (J. Eilenberg & H. M. T. Hokkanen, Eds.). Dordrecht: Springer.
Galizzi, A., Cacco, G., Siccardi, A. G. & Mazza, G. (1975). Mode of action of polymyxin B: physiological studies with a Bacillus subtilis-resistant mutant. Antimicrobial Agents and Chemotherapy 8, 366-9.
Gasteiger, E. (2003). ExPASy: the proteomics server for in-depth protein knowledge and analysis. Nucleic Acids Res 31, 3784-3788.
Ghelardi, E., Celandroni, F., Salvetti, S., Beecher, D. J., Gominet, M., Lereclus, D., Wong, A. C. L. & Senesi, S. (2002). Requirement of flhA for swarming differentiation, flagellin export, and secretion of virulence-associated proteins in Bacillus thuringiensis. J Bacteriol 184, 6424-6433.
Glare, T. R. & O’Callaghan, M. (1998). Environmental and health impacts of Bacillus thuringiensis israelensis. Report for the ministry of health. Lincoln.
Goldberg, L. H. & Margalit, J. (1977). A bacterial spore demonstrating rapid larvicidal activity against Anopheles sergentii, Uranotaemia unguiculata, Culex univittatus, Aedes aegypti and Culex pipiens. Mosq News 37, 355-358.
Gómez, I., Pardo-López, L., Muñoz-Garay, C., Fernandez, L. E., Pérez, C., Sánchez, J., Soberón, M. & Bravo, A. (2007). Role of receptor interaction in the mode of action of insecticidal Cry and Cyt toxins produced by Bacillus thuringiensis. Peptides 28, 169-73.
Gonet, C. (Office fédéral de l’environnement des forêts et du paysage (OFEFP)). (2004). Fiche descriptive sur les zones humides Ramsar (FDR). Berne.
Guerchicoff, a, Ugalde, R. a & Rubinstein, C. P. (1997). Identification and characterization of a previously undescribed cyt gene in Bacillus thuringiensis subsp. israelensis. Appl Environ Microbiol 63, 2716-21.
Guerchicoff, A., Delécluse, A. & Clara, P. (2001). The Bacillus thuringiensis cyt genes for hemolytic endotoxins constitute a gene family. Society 67, 1090-1096.
Guidi, V., Patocchi, N., Lüthy, P. & Tonolla, M. (2011). Distribution of Bacillus thuringiensis subsp. israelensis in soil of a swiss wetland reserve after 22 years of mosquito control. Appl Environ Microbiol 77, 3663-3668.
49
Guidi, V., De Respinis, S., Benagli, C., Lüthy, P. & Tonolla, M. (2010). A real-time PCR method to quantify spores carrying the Bacillus thuringiensis var. israelensis cry4Aa and cry4Ba genes in soil. J Appl Microbiol 109, 1209-17.
Gyapong, J. O. & Twum-Danso, N. A. Y. (2006). Global elimination of lymphatic filariasis: fact or fantasy? TM & IH 11, 125-8.
Hansen, B. M. & Hendriksen, N. B. (2001). Detection of enterotoxic Bacillus cereus and Bacillus thuringiensis strains by PCR analysis. Appl Environ Microbiol 67, 185-9.
Hirose, I., Sano, K., Shioda, I., Kumano, M., Nakamura, K. & Yamane, K. (2000). Proteome analysis of Bacillus subtilis extracellular proteins: a two-dimensional protein electrophoretic study. Microbiol 146, 65-75.
Hill, K. K., Ticknor, L. O., Okinaka, R. T., Asay, M., Blair, H., Bliss, K. A., Laker, M., Pardington, P. E., Richardson, A. P., & other authors. (2004). Fluorescent amplified fragment length polymorphism analysis of Bacillus anthracis, Bacillus cereus, and Bacillus thuringiensis isolates. Society 70, 1068-1080.
Hofte, H. & Whiteley, H. R. (1989). Insecticidal crystal proteins of Bacilllus thuringiensis. Microbiologic Rev 53, 242-255.
Homma, M., Kutsukake, K., Iino, T. & Yamaguchi, S. (1984). Hook-associated proteins essential for flagellar filament formation in Salmonella typhimurium. J Bacteriol 157, 100-108.
Ibarra, J. E., Rincón, M. C., Ordúz, S., Noriega, D., Benintende, G., Monnerat, R., Regis, L., Oliveira, M. F. D., Lanz, H., & other authors. (2003). Diversity of Bacillus thuringiensis strains from Latin America with insecticidal activity against different mosquito species. Appl Environ Microbiol 69, 5269-5274.
Kallow, W., Erhard, M., Lima, N., Santos, I., Serra, R., Venâancio, A., Fridl, T., Muller, J., Sybren de Hoog, G. & Verkley, G. (2006). Microbial strain characterisation by MALDI-TOF MS -possibilities and limits. In Annual General Meeting of the European Culture Collections Organisation - ECO XXV: Proceedings. Edited by W. Kallow, M. Erhard, N. Lima, I. M. Santos, R. Serra, A. Venâncio, T. Friedl, J. Müller, G. S. de Hoog & G. J. M. Verkley. Budapeste: Annual General Meeting of the European Culture Collections Organisation - ECO XXV: Proceedings.
Kovacs, N. (1956). Identification of Pseudomonas pyocyanea by the Oxidase Reaction. Nature 178, 703.
Kumar, D., Chaudhary, K. & Boora, K. S. (2009). Characterization of native Bacillus thuringiensis strains by PCR-RAPD based fingerprinting. Indian J Microbiol 50, 27-32.
Laemmli, U. K. (1970). Cleavage of structural proteins during the assembly of the head of bacteriophage T4. Nature 227, 680-685.
Landwall, P. & Holme, T. (1977). Influence of glucose and dissolved oxygen concentrations on yields of Escherichia coli B in dialysis culture. J Gen Microbiol 103, 353-358.
Laurent, P., Ripouteau, H., Dumanoir, V. C., Frachon, E. & Lecadet, M. M. (1996). A micromethod for serotyping Bacillus thuringiensis. Lett Appl Microbiol 22, 259-61.
Lecadet, M., Frachon, E., Dumanoir, V. C., Ripouteau, H., Hamon, S., Laurent, P. & Thie, I. (1999). Updating the H-antigen classification of Bacillus thuringiensis. J Appl Microbiol 86, 660-672.
Lee, D.-H., Shisa, N., Wasano, N., Ohgushi, A. & Ohba, M. (2003). Characterization of flagellar antigens and insecticidal activities of Bacillus thuringiensis populations in animal feces. Curr Microbiol 46, 287-90.
Lucchini, G., Zenone, E., Martini, E. & Pellandini, W. (1990). I macromiceti delle Bolle di Magadino (Ticino, Svizzera). Boll Soc Tic Natur LXXVIII, 33-132.
Madigan, M. T. & Martinko, J. M. (2006). Brock biology of microorganisms, 11th edn. San Francisco: Pearson/Benjamin Cummings.
Magge, A., Setlow, B., Cowan, A. E. & Setlow, P. (2009). Analysis of dye binding by and membrane potential in spores of Bacillus species. J Appl Microbiol 106, 814–824. Wiley Online Library.
Margalit, J. & Dean, D. (1985). The story of Bacillus thuringiensis var. israelensis (B.t.i.). J Am Mosq Control Assoc 1, 1-7.
Muñoz, R., García, E. & De la Campa, a G. (1996). Quinine specifically inhibits the proteolipid subunit of the F0F1 H+ -ATPase of Streptococcus pneumoniae. Journal of Bacteriology 178, 2455-8.
Obeta, J. a & Okafor, N. (1984). Medium for the production of primary powder of Bacillus thuringiensis subsp. israelensis. Appl Environ Microbiol 47, 863-7.
Otieno-Ayayo, Z. N., Zaritsky, A., Wirth, M. C., Manasherob, R., Khasdan, V., Cahan, R. & Ben-Dov, E. (2008). Variations in the mosquito larvicidal activities of toxins from Bacillus thuringiensis ssp. israelensis. Environ Microbiol 10, 2191-9.
50
Pérez, C., Fernandez, L. E., Sun, J., Folch, J. L., Gill, S. S., Soberón, M. & Bravo, A. (2005). Bacillus thuringiensis subsp. israelensis Cyt1Aa synergizes Cry11Aa toxin by functioning as a membrane-bound receptor. PNAS 102, 18303-18308.
Rabilloud, T., Vuillard, L., Gilly, C., and Lawrence, J. J. (1994). Silver-staining of proteins in polyacrylamide gels: a general overview. Cell Mol Biol 40:57-75.
Rajalakshmi, S. & Shethna, Y. I. (1980). Spore and crystal formation in Bacillus thuringiensis var . thuringiensis during growth in cystine and cysteine. J Biosci 2, 321-328.
Rampersad, J., Ammons, D. & Khan, A. (2002). Usefulness of staining parasporal bodies when screening for Bacillus thuringiensis. J Invert Pathol 79, 203-204.
Robinson, R. A. & Stokes, R. H. (1968). Electrolyte solutions, 2nd edn. London: Butterworths. Scherrer, P., Lüthy, P. & Trumpi, B. (1973). Production of δ-endotoxin by Bacillus thuringiensis as a
function of glucose concentrations. Appl Microbiol 25, 644-6. Schnepf, E., Crickmore, N., Rie, J. V. A. N., Lereclus, D., Baum, J., Feitelson, J., Zeigler, D. R. &
Dean, D. H. (1998). Bacillus thuringiensis and its pesticidal crystal proteins. Microbiol Mol Biol Rev 62, 775-806.
Seki, T., Chung, C.-K., Mikami, H. & Oshima, Y. (1978). Deoxyribonucleic acid homology and taxonomy of the genus Bacillus. Int J Syst Bacteriol 28, 182-189.
Stotzky, C. et. (1998). Insecticidal activity and biodegradation of the toxin from Bacillus thuringiensis subsp. kurstaki bound to humic acids from soil. Soil Biol Biochem 30, 463-470.
Sugino, A., Higginst, N. P., Brownt, P., Peeblesf, C. L. & Cozzarellitf, N. R. (1978). Energie coupling in DNA gyrase and the mechanism of action of novobiocin. PNAS 75, 4838-4842.
Thomas, W. E. & Ellar, D. J. (1983a). Mecanism of action of Bacillus thuringiensis var israelensis insecticidal delta-endotoxin. FEBS Lett 154, 362-368.
Thomas, W. E. & Ellar, D. J. (1983b). Bacillus thuringiensis var israelensis crystal delta-endotoxin: effects on insect and mammalian cells in vitro and in vivo. J Cell Sci 60, 181-97.
Tyrell, D. J., Bulla, L. E. E. A., Andrews, R. E., Kramer, K. J., Davidson, L. I. & Nordin, P. (1981). Comparative biochemistry of entomocidal parasporal crystals of selected Bacillus thuringiensis strains. J Bacteriol 145, 1052-1062.
Vilas-Bôas, G. T., Peruca, A. P. S. & Arantes, O. M. N. (2007). Biology and taxonomy of Bacillus cereus, Bacillus anthracis, and Bacillus thuringiensis. Can J Microbiol 53, 673-87.
Vos, P., Garrity, G., Jones, D., Krieg, N. R., Ludwig, W., Rainey, F. A., Schleifer, K.-H. & Whitman, W. B. (Eds.). (2009). Bergey’s manual of systematic bacteriology, Volume 3: The Firmicutes, 2nd edn. New York: Springer New York, Inc.
WHO, W. H. O. (1997). Disease surveillance and outbreak prevention and control. In Dengue haemorrhagic fever: diagnosis, treatment, prevention and control, 2nd edn., pp. 60-66. Geneva: WHO publications.
WHO, W. H. O. (1999). Microbial pest control agent: Bacillus thuringiensis. World Health. Geneva: WHO publications.
WHO. (2005). Guidelines for laboratory and field testing of mosquito larvicides. Public Health. Geneva. WHO, W. H. O. (2006). Malaria vector control and personal protection, Technical. Geneva: WHO
publications. Ward, E. S. & Ellar, D. J. (1986). Bacillus thuringiensis var. israelensis delta-endotoxin. nucleotide
sequence and characterization of the transcripts in Bacillus thuringiensis and Escherichia coli. J Mol Biol 191, 1-11.
Yamagiwa, M., Sakagawa, K. & Sakai, H. (2004). Functional analysis of two processed fragments of Bacillus thuringiensis Cry11A toxin. Biosci Biotechnol Biochem 68, 523-8.
Yousten, A., & M. Rogoff. 1969. Metabolism of Bacillus thuringiensis in relation to spore and crystal formation. J Bacteriol 100, 1229-1236.
Yu, S. J. (2008). Evaluation of toxicity. In The Toxicology and Biochemistry of Insecticides, pp. 87-104. Gainesville: CRC Press Taylor & Francis.
Yuan, Z., Hansen, B. M., Andrup, L. & Eilenberg, J. (2002). Detection of enterotoxin genes in mosquito-larvicidal Bacillus species. Curr Microbiol 45, 221-5.