Embed Size (px)
Citation preview
CHARACTERIZATION OF SHEET MOLDING COMPOUND MATURATION BY DISCONTINUOUS VISCOSITY MEASUREMENTS OF
THE RESIN-FILLER PASTE
Christoph Keckl, Jan Kuppinger, Frank Henning
Fraunhofer Institute for Chemical Technology, Pfinztal, Germany
Abstract Sheet Molding Compound (SMC) enables the production of exterior body parts for automotive applications with high-dimensional accuracy and Class A surfaces. The manufacturing process itself is divided into the production of SMC mats and compression molding with subsequent post-processing. The viscosity of the SMC mats has an important influence on the molding process and component properties such as fiber orientation and surface quality. The increase in viscosity during maturation caused by the use of magnesium oxide, which reacts with the unsaturated polyester resin and styrene in the SMC paste, is an applied quality criterion for SMC mats. The current paper presents an innovative and simple method of discontinuous measurement of the viscosity increase of highly filled SMC pastes allowing for quasi-parallel rheometry measurements during the maturation process. Further, the influences of temperature, thickener content and filler moisture on viscosity are investigated. It is shown that by measuring the initial viscosity increase the further viscosity curve can be anticipated for a certain range of thickener contents and temperatures.
Introduction Sheet Molding Compound (SMC) on the basis of unsaturated polyester resins offers the possibility to produce parts with complex geometries, semi-structural properties and high quality surface finishes [1, 2]. For Class A applications the molding process demands high quality standards on the SMC material. Here, the viscosity of the SMC plays an important role in terms of flow characteristics, fiber transport, fiber orientation, formation of pores and, consequentially, surface quality [3].
The production of SMC parts with Class A surface finishes is a multistage process. First, the resin-filler paste consisting of unsaturated polyester resins with low profile and low shrink additives, several process additives, inhibitors, fillers and an initiator is mixed by a dissolver. Immediately prior to the sheet making the thickening agent is added to the resin-filler paste. Successive doctor blades spread two thin films of resin-filler paste on a SMC line and chopped glass fibers are added. After the glass fibers have been impregnated with the resin-filler paste the sheets are stored to maturate in a temperature- and humidity-controlled environment. Once a certain viscosity has been achieved or after a certain time, the SMC is stored at temperatures below 20 °C to slow down the thickening process. During a certain time window the material can be compression molded to parts with Class A surfaces. For this purpose, the SMC is cut into pieces and stacked to charge patterns in the hot mold [1]. Figure 1 outlines the sheet molding compound process.
Page 1
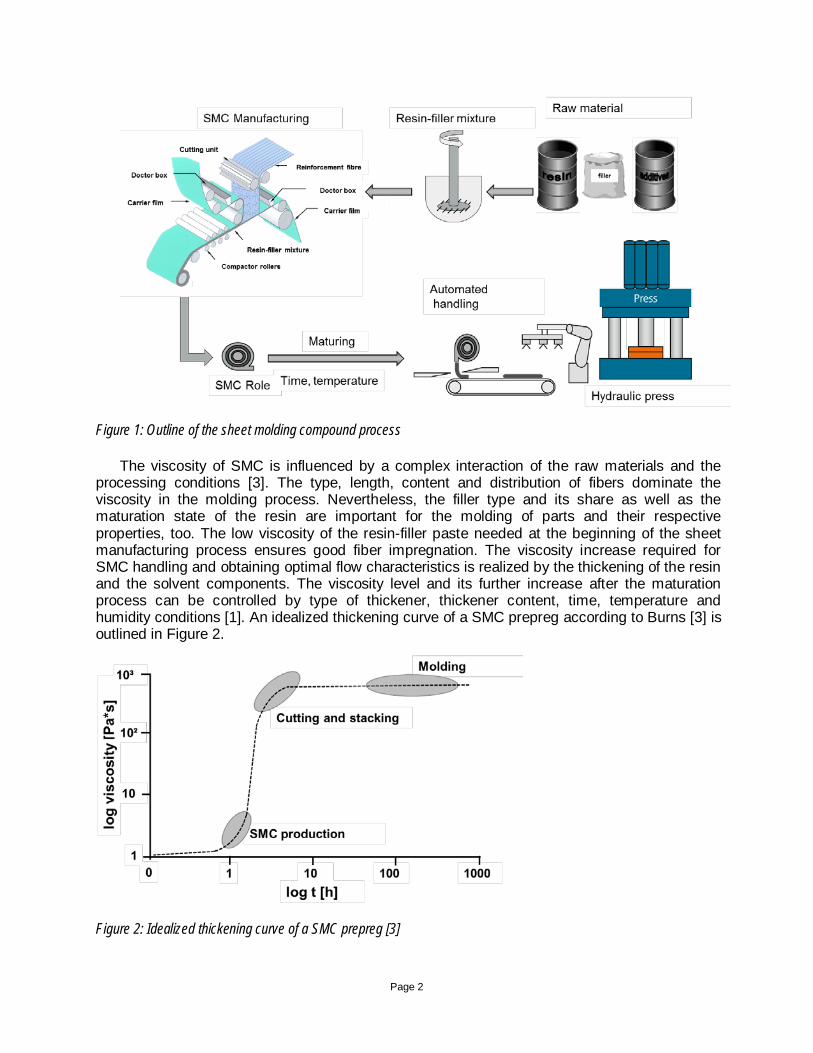
Figure 1: Outline of the sheet molding compound process
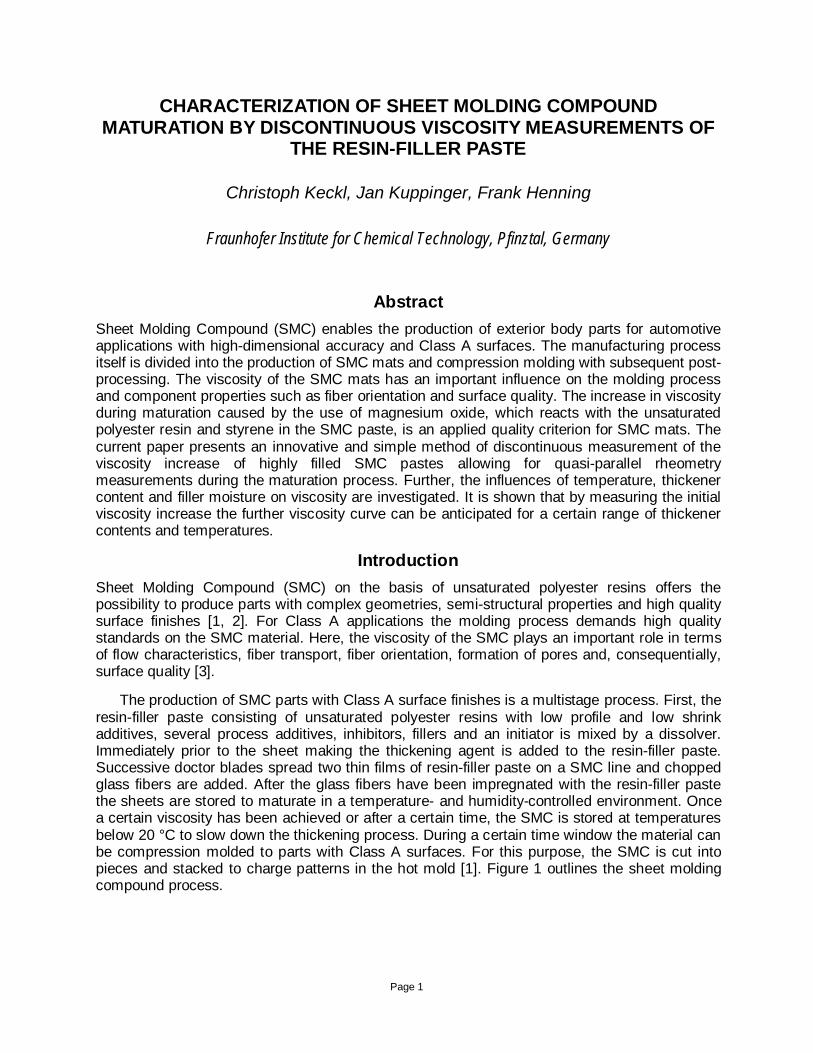
The viscosity of SMC is influenced by a complex interaction of the raw materials and the processing conditions [3]. The type, length, content and distribution of fibers dominate the viscosity in the molding process. Nevertheless, the filler type and its share as well as the maturation state of the resin are important for the molding of parts and their respective properties, too. The low viscosity of the resin-filler paste needed at the beginning of the sheet manufacturing process ensures good fiber impregnation. The viscosity increase required for SMC handling and obtaining optimal flow characteristics is realized by the thickening of the resin and the solvent components. The viscosity level and its further increase after the maturation process can be controlled by type of thickener, thickener content, time, temperature and humidity conditions [1]. An idealized thickening curve of a SMC prepreg according to Burns [3] is outlined in Figure 2.
Figure 2: Idealized thickening curve of a SMC prepreg [3]
Page 2
The thickening of unsaturated polyester resins in SMC applications is commonly realized through the use of metal oxides, mostly magnesium oxide (MgO) [1, 4]. However, practice shows that the viscosity of unsaturated polyester resins thickened with MgO does not stop at a certain level, but increases continuously [5]. Figure 3 outlines the viscosity curve for resin-filler pastes on the basis of unsaturated polyester thickened with MgO.
Figure 3: Viscosity curve of SMC on the basis of unsaturated polyester resins thickened with MgO according to [5]
A specific SMC target viscosity can be achieved in different ways. It is important for the SMC molder to have a large processing window at constant processing conditions. Therefore, the thickening curve should be designed in such a way that the viscosity only increases slowly after the target viscosity has been reached. Hence, an efficient quality control in the SMC prepreg production requires a quick and reliable measuring method that can predict the viscosity curve and allows for adjustments of the SMC formulation in time.
Within this paper the effects of temperature, MgO content and moisture on the viscosity of a SMC Class A formulation are investigated. It is shown that process-accompanying quality assurance can be realized by using discontinuous viscosity measurement. Further, the discontinuous measuring method is compared to conventional continuous measurement. It is shown that by measuring the initial viscosity the further viscosity increase can be predicted.
Materials Unsaturated Polyester: An unsaturated polyester resin system with low profile and low shrink additives and a density of approx. 1.10 g/cm³ at 23 °C was investigated in this study. The resin system has a high content of monomer styrene.
Magnesium Oxide: The unsaturated polyester resin based thickening agent Luvatol MK35® with a density of 1.65 g/cm³ at 20 °C was supplied by Lehmann & Voss & Co. KG and contains 35 parts magnesium oxide by weight.
Page 3
Fillers: The paste was filled with milled calcium carbonate Millicarb® from Omya AG with a density of 2.70 g/cm³ and with hollow glass microspheres VS5500® from 3M Deutschland GmbH with an average density of 0.38 g/cm³.
Additives: A dispersing additive with a density of 1.16 g/cm³ at 20 °C was used. Also, a mold release agent with a density of 0.97 g/cm³ obtained from Baerlocher GmbH was added to the resin-filler paste.
Experimentals Mixing of resin-filler paste: The resin-filler paste was mixed by a Dispermat® LC laboratory dissolver from VMA Getzmann GmbH. The mixing procedure was time-and temperature-controlled and carried out in a cylindrical container with a diameter of 100 mm and a dissolver disc diameter of 42 mm. Table 1 outlines the mixing procedure.
parts by weight
weight [g]
density [g/cm³]
dissolver speed [rpm]
mixing time [s]
temperature [°C]
unsaturated polyester resin
100.0 200.0 1.10 0 30 < 30 (max. 30 °C)
monomer styrene 6.0 12.0 0.91 0 30 < 30 process additives 8.7 17.4 1.102 800 120 < 30 CaCo³ filler 105 210,0 2.70 800 60 < 30 hollow glass microspheres
28.0 56.0 0.38 500 -> 1500 60 < 30
9500 120 = 30 200 cooling to 20 thickening paste (Luvatol MK35®) x x 1.65 1800 300
9.500 = thickening temperature
total 249.8 499.6 1.14
Table 1: Procedure for mixing the resin-filler paste
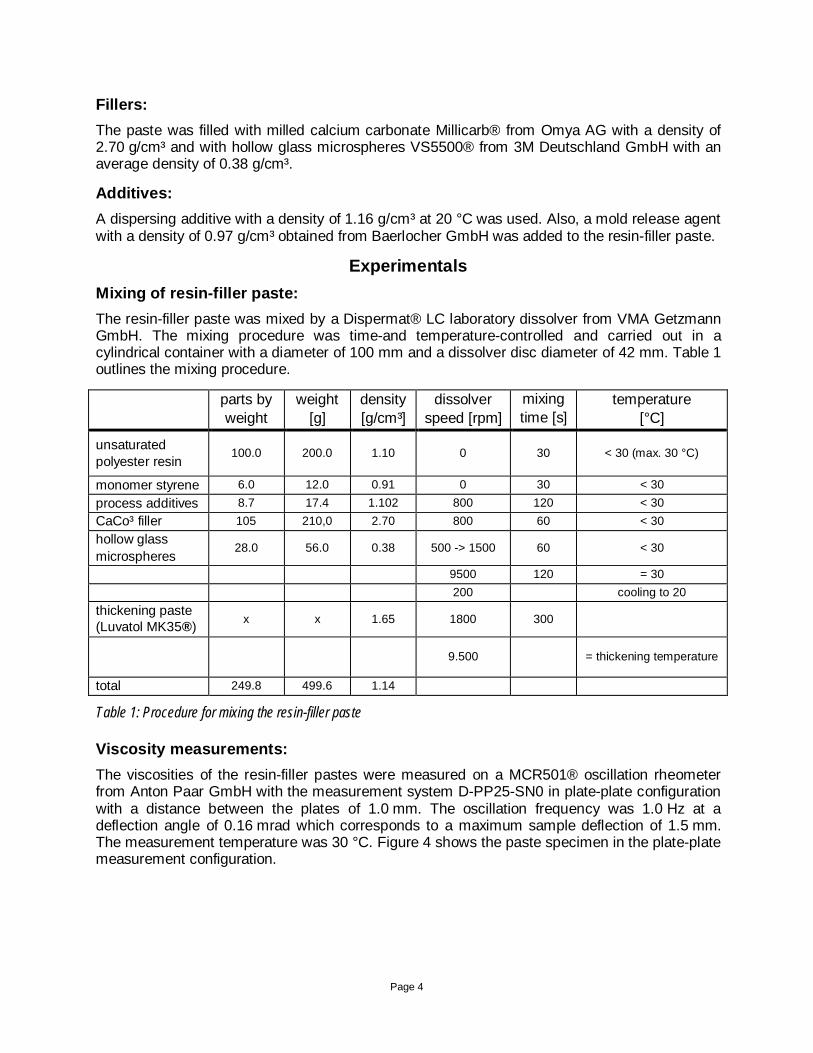
Viscosity measurements: The viscosities of the resin-filler pastes were measured on a MCR501® oscillation rheometer from Anton Paar GmbH with the measurement system D-PP25-SN0 in plate-plate configuration with a distance between the plates of 1.0 mm. The oscillation frequency was 1.0 Hz at a deflection angle of 0.16 mrad which corresponds to a maximum sample deflection of 1.5 mm. The measurement temperature was 30 °C. Figure 4 shows the paste specimen in the plate-plate measurement configuration.
Page 4
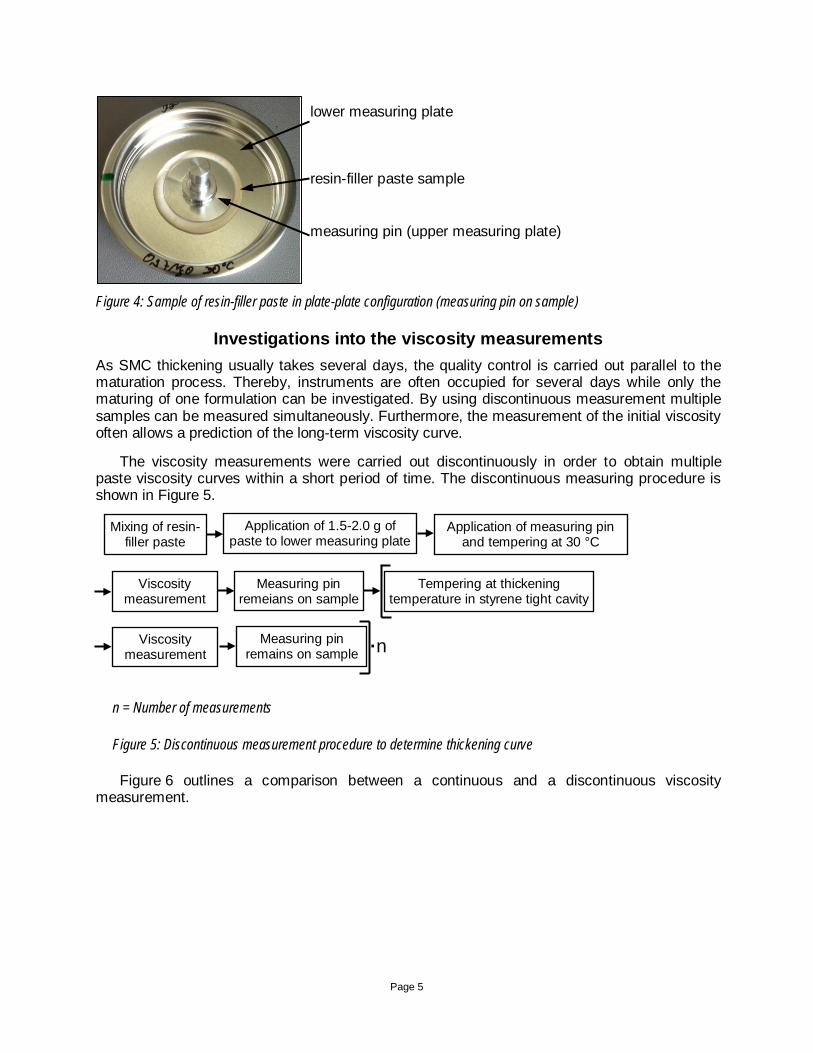
Figure 4: Sample of resin-filler paste in plate-plate configuration (measuring pin on sample)
Investigations into the viscosity measurements As SMC thickening usually takes several days, the quality control is carried out parallel to the maturation process. Thereby, instruments are often occupied for several days while only the maturing of one formulation can be investigated. By using discontinuous measurement multiple samples can be measured simultaneously. Furthermore, the measurement of the initial viscosity often allows a prediction of the long-term viscosity curve.
The viscosity measurements were carried out discontinuously in order to obtain multiple paste viscosity curves within a short period of time. The discontinuous measuring procedure is shown in Figure 5.
Viscosity measurements results Figure 6 outlines a comparison between a continuous and a discontinuous viscosity
measurement.
Mixing of resin-filler paste
Application of 1.5-2.0 g of paste to lower measuring plate
Application of measuring pin and tempering at 30 °C
Viscosity measurement
Measuring pin remeians on sample
Tempering at thickening temperature in styrene tight cavity
Viscosity measurement
n = Number of measurements
Figure 5: Discontinuous measurement procedure to determine thickening curve
lower measuring plate
measuring pin (upper measuring plate)
resin-filler paste sample
Measuring pin remains on sample ·n
Page 5
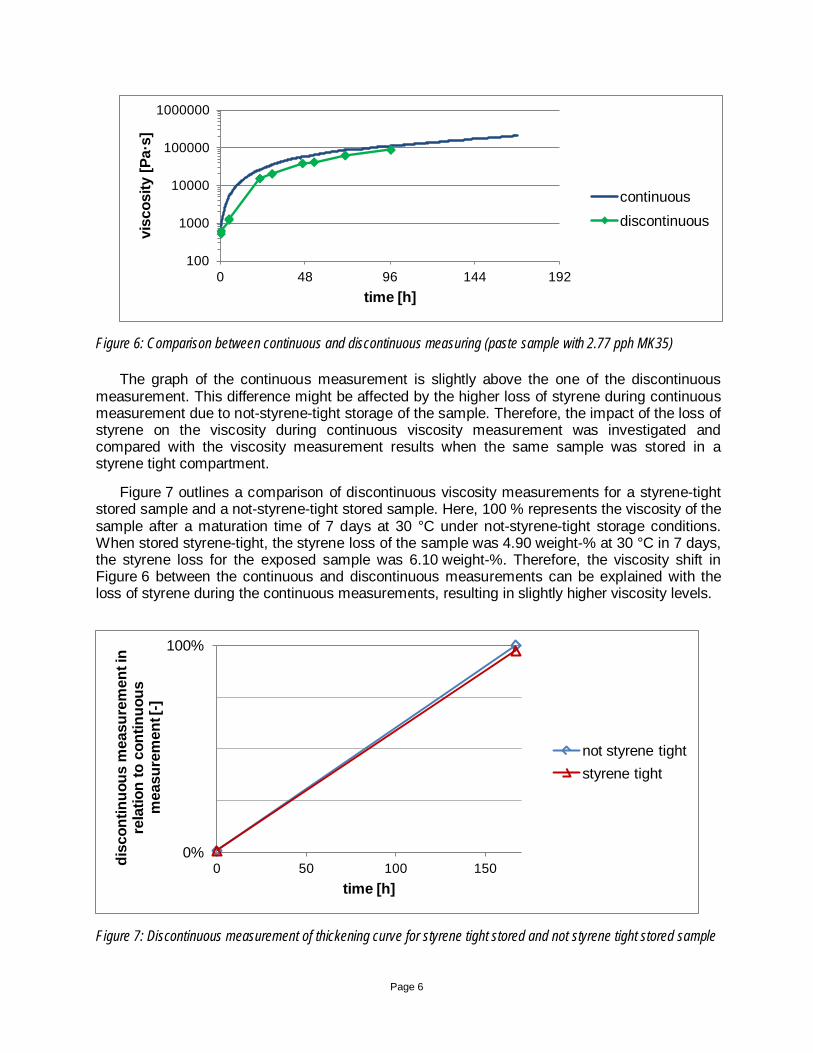
Figure 6: Comparison between continuous and discontinuous measuring (paste sample with 2.77 pph MK35)
The graph of the continuous measurement is slightly above the one of the discontinuous measurement. This difference might be affected by the higher loss of styrene during continuous measurement due to not-styrene-tight storage of the sample. Therefore, the impact of the loss of styrene on the viscosity during continuous viscosity measurement was investigated and compared with the viscosity measurement results when the same sample was stored in a styrene tight compartment.
Figure 7 outlines a comparison of discontinuous viscosity measurements for a styrene-tight stored sample and a not-styrene-tight stored sample. Here, 100 % represents the viscosity of the sample after a maturation time of 7 days at 30 °C under not-styrene-tight storage conditions. When stored styrene-tight, the styrene loss of the sample was 4.90 weight-% at 30 °C in 7 days, the styrene loss for the exposed sample was 6.10 weight-%. Therefore, the viscosity shift in Figure 6 between the continuous and discontinuous measurements can be explained with the loss of styrene during the continuous measurements, resulting in slightly higher viscosity levels.
Figure 7: Discontinuous measurement of thickening curve for styrene tight stored and not styrene tight stored sample
100
1000
10000
100000
1000000
0 48 96 144 192
visc
osity
[Pa·
s]
time [h]
continuous discontinuous
0%
100%
0 50 100 150 disc
ontin
uous
mea
sure
men
t in
rela
tion
to c
ontin
uous
m
easu
rem
ent [
-]
time [h]
not styrene tight styrene tight
Page 6
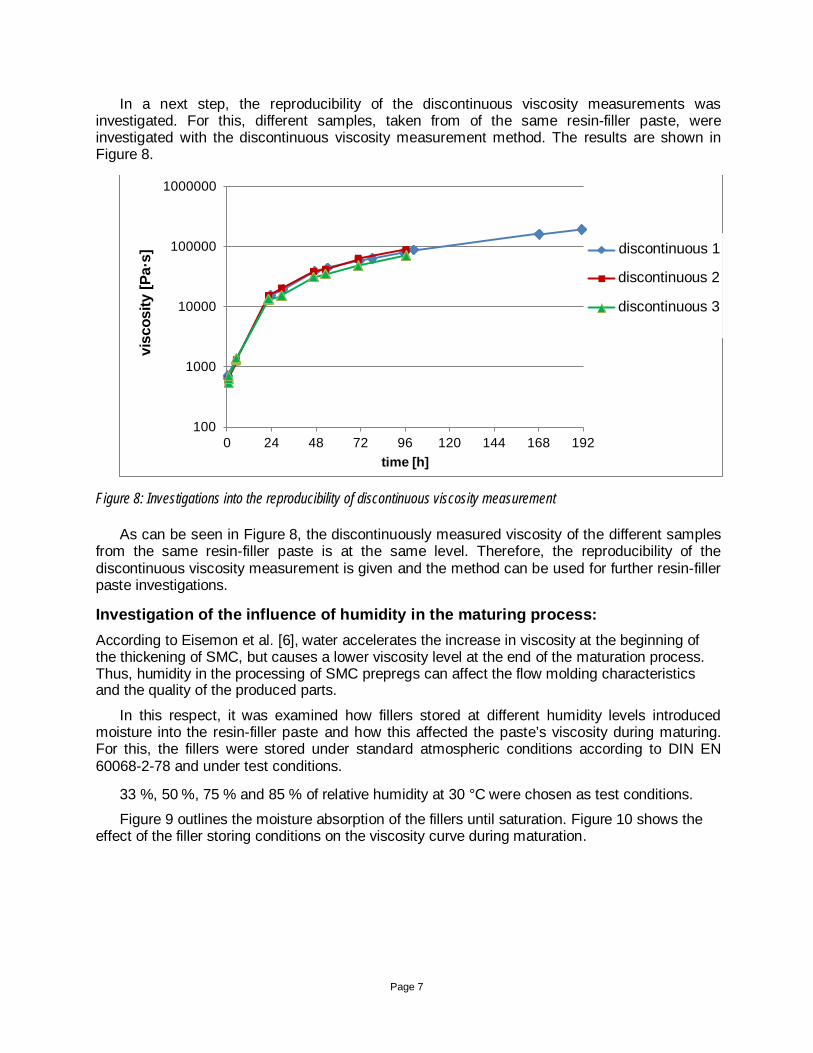
In a next step, the reproducibility of the discontinuous viscosity measurements was investigated. For this, different samples, taken from of the same resin-filler paste, were investigated with the discontinuous viscosity measurement method. The results are shown in Figure 8.
Figure 8: Investigations into the reproducibility of discontinuous viscosity measurement
As can be seen in Figure 8, the discontinuously measured viscosity of the different samples from the same resin-filler paste is at the same level. Therefore, the reproducibility of the discontinuous viscosity measurement is given and the method can be used for further resin-filler paste investigations.
Investigation of the influence of humidity in the maturing process: According to Eisemon et al. [6], water accelerates the increase in viscosity at the beginning of the thickening of SMC, but causes a lower viscosity level at the end of the maturation process. Thus, humidity in the processing of SMC prepregs can affect the flow molding characteristics and the quality of the produced parts.
In this respect, it was examined how fillers stored at different humidity levels introduced moisture into the resin-filler paste and how this affected the paste’s viscosity during maturing. For this, the fillers were stored under standard atmospheric conditions according to DIN EN 60068-2-78 and under test conditions.
33 %, 50 %, 75 % and 85 % of relative humidity at 30 °C were chosen as test conditions.
Figure 9 outlines the moisture absorption of the fillers until saturation. Figure 10 shows the effect of the filler storing conditions on the viscosity curve during maturation.
100
1000
10000
100000
1000000
0 24 48 72 96 120 144 168 192
visc
osity
[Pa·
s]
time [h]
Diskontinuierliche Messung 1 Diskontinuierliche Messung 2 Diskontinuierliche Messung 3
discontinuous 1
discontinuous 2
discontinuous 3
Page 7
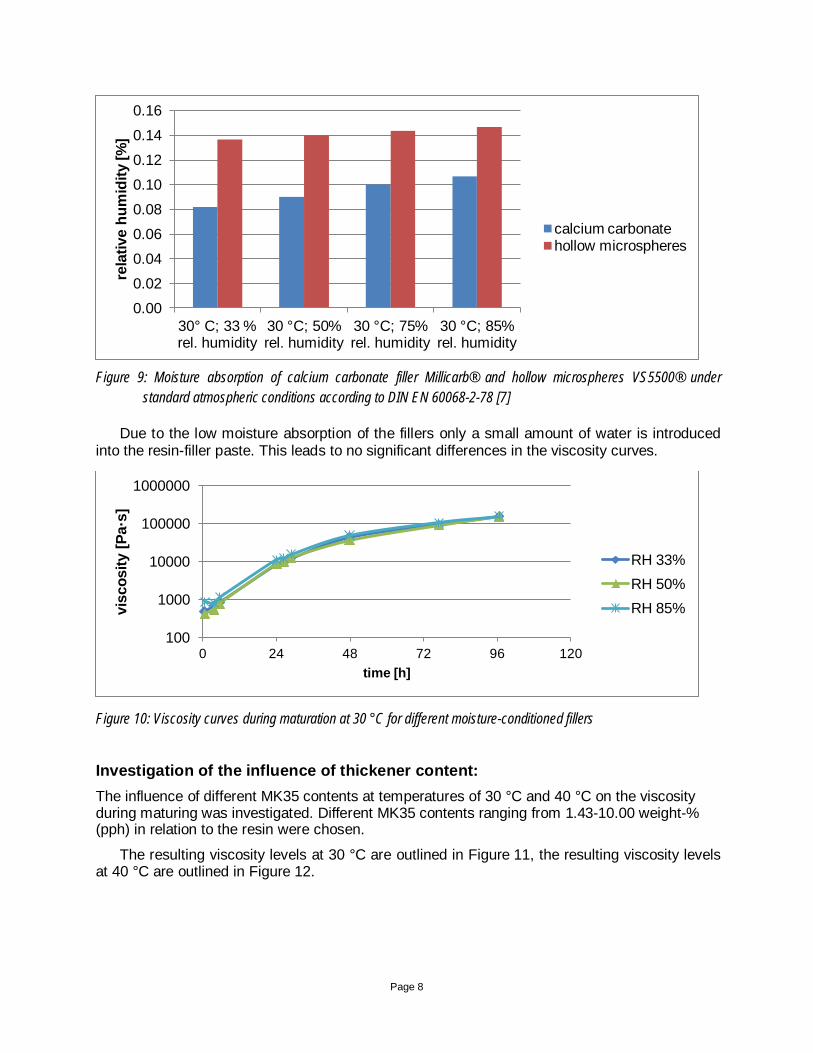
Figure 9: Moisture absorption of calcium carbonate filler Millicarb® and hollow microspheres VS5500® under
standard atmospheric conditions according to DIN EN 60068-2-78 [7]
Due to the low moisture absorption of the fillers only a small amount of water is introduced into the resin-filler paste. This leads to no significant differences in the viscosity curves.
Figure 10: Viscosity curves during maturation at 30 °C for different moisture-conditioned fillers
Investigation of the influence of thickener content: The influence of different MK35 contents at temperatures of 30 °C and 40 °C on the viscosity during maturing was investigated. Different MK35 contents ranging from 1.43-10.00 weight-% (pph) in relation to the resin were chosen.
The resulting viscosity levels at 30 °C are outlined in Figure 11, the resulting viscosity levels at 40 °C are outlined in Figure 12.
0.00
0.02
0.04
0.06
0.08
0.10
0.12
0.14
0.16
30° C; 33 % rel. humidity
30 °C; 50% rel. humidity
30 °C; 75% rel. humidity
30 °C; 85% rel. humidity
rela
tive
hum
idity
[%]
calcium carbonate hollow microspheres
100
1000
10000
100000
1000000
0 24 48 72 96 120
visc
osity
[Pa·
s]
time [h]
RH 33% RH 50% RH 85%
Page 8
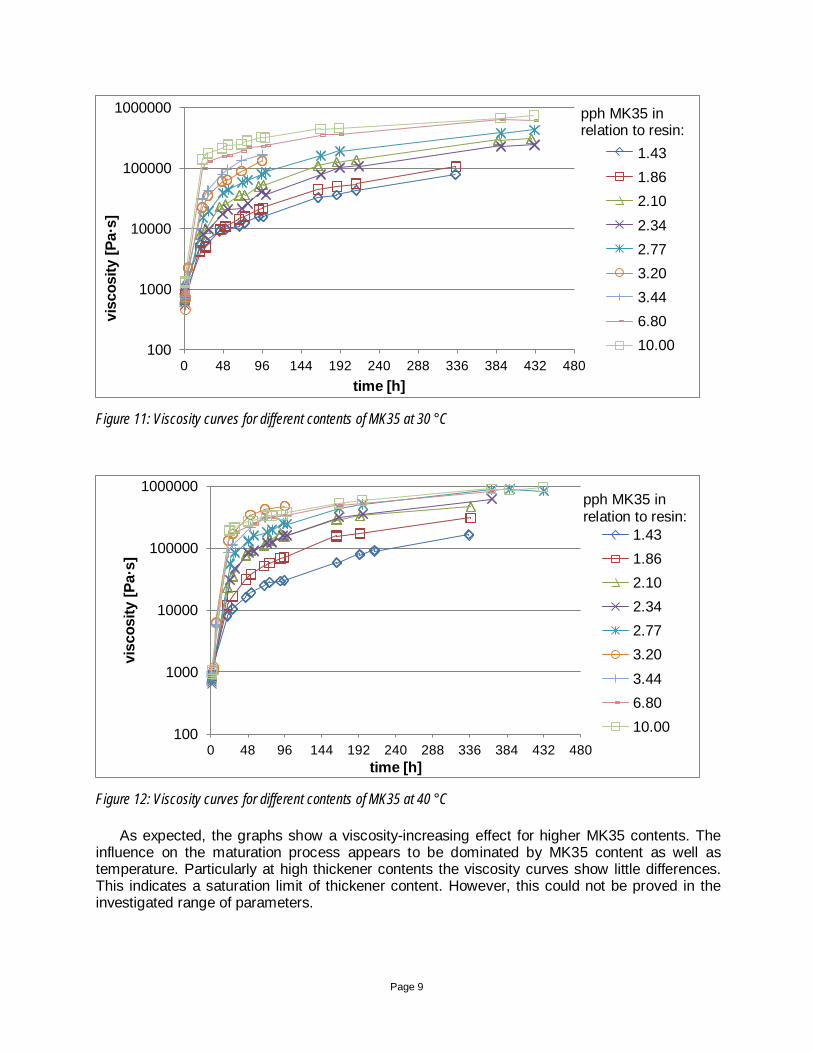
Figure 11: Viscosity curves for different contents of MK35 at 30 °C
Figure 12: Viscosity curves for different contents of MK35 at 40 °C
As expected, the graphs show a viscosity-increasing effect for higher MK35 contents. The influence on the maturation process appears to be dominated by MK35 content as well as temperature. Particularly at high thickener contents the viscosity curves show little differences. This indicates a saturation limit of thickener content. However, this could not be proved in the investigated range of parameters.
100
1000
10000
100000
1000000
0 48 96 144 192 240 288 336 384 432 480
visc
osity
[Pa·
s]
time [h]
0,5
0,65
0,735
0,82
0,97
1,12
1,205
2,381
3,5
100
1000
10000
100000
1000000
0 48 96 144 192 240 288 336 384 432 480
visc
osity
[Pa·
s]
time [h]
0,5
0,65
0,735
0,82
0,97
1,12
1,205
2,381
3,5
1.43 1.86 2.10 2.34 2.77 3.20 3.44 6.80 10.00
pph MK35 in relation to resin:
1.43 1.86 2.10 2.34 2.77 3.20 3.44 6.80 10.00
pph MK35 in relation to resin:
Page 9
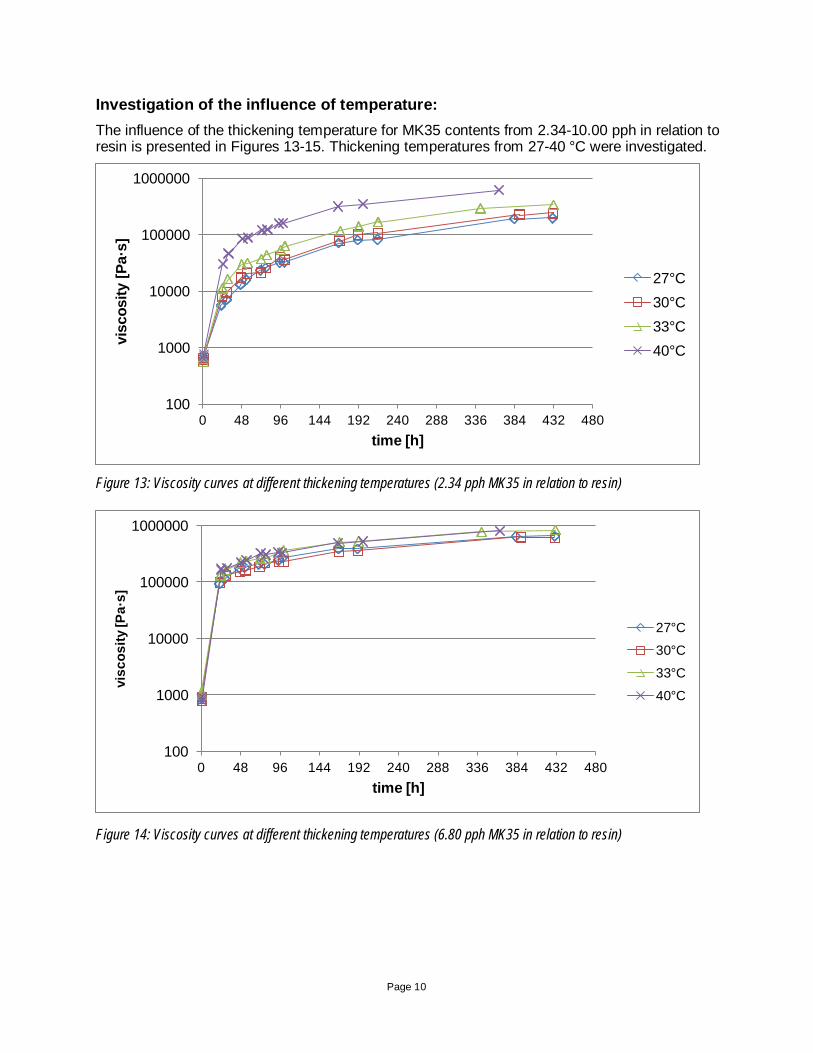
Investigation of the influence of temperature: The influence of the thickening temperature for MK35 contents from 2.34-10.00 pph in relation to resin is presented in Figures 13-15. Thickening temperatures from 27-40 °C were investigated.
Figure 13: Viscosity curves at different thickening temperatures (2.34 pph MK35 in relation to resin)
Figure 14: Viscosity curves at different thickening temperatures (6.80 pph MK35 in relation to resin)
100
1000
10000
100000
1000000
0 48 96 144 192 240 288 336 384 432 480
visc
osity
[Pa·
s]
time [h]
27°C 30°C 33°C 40°C
100
1000
10000
100000
1000000
0 48 96 144 192 240 288 336 384 432 480
visc
osity
[Pa·
s]
time [h]
27°C
30°C
33°C
40°C
Page 10
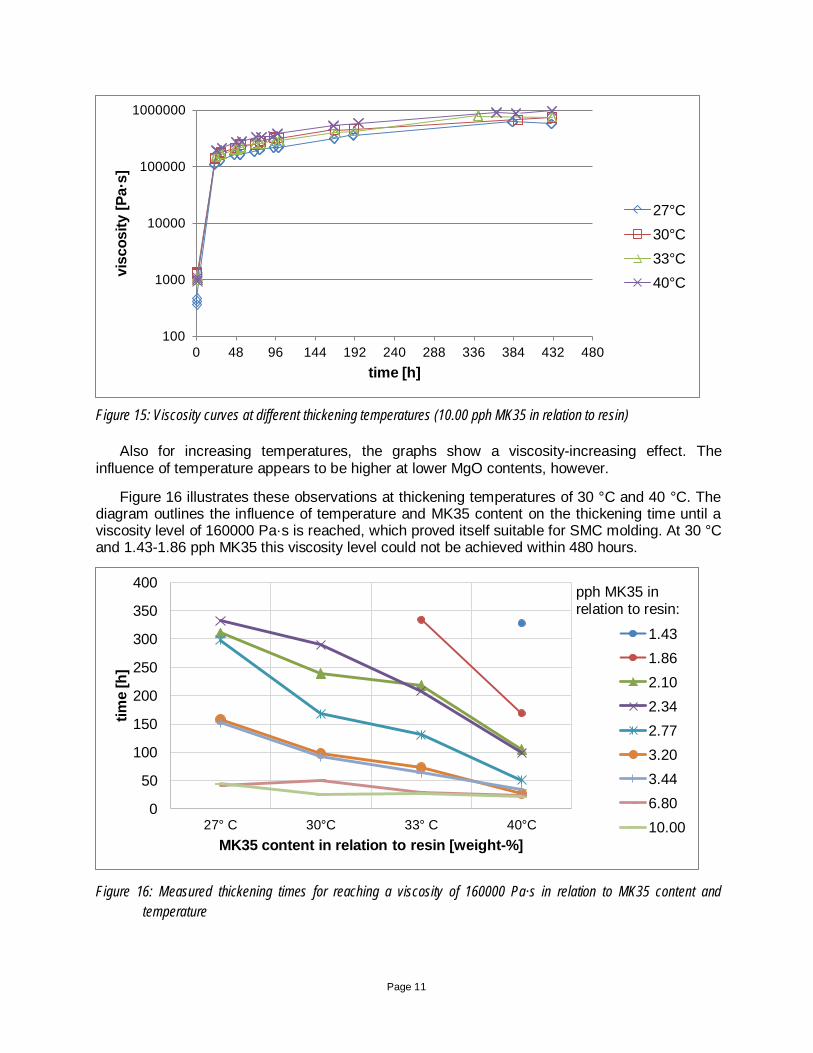
Figure 15: Viscosity curves at different thickening temperatures (10.00 pph MK35 in relation to resin)
Also for increasing temperatures, the graphs show a viscosity-increasing effect. The influence of temperature appears to be higher at lower MgO contents, however.
Figure 16 illustrates these observations at thickening temperatures of 30 °C and 40 °C. The diagram outlines the influence of temperature and MK35 content on the thickening time until a viscosity level of 160000 Pa·s is reached, which proved itself suitable for SMC molding. At 30 °C and 1.43-1.86 pph MK35 this viscosity level could not be achieved within 480 hours.
Figure 16: Measured thickening times for reaching a viscosity of 160000 Pa·s in relation to MK35 content and temperature
100
1000
10000
100000
1000000
0 48 96 144 192 240 288 336 384 432 480
visc
osity
[Pa·
s]
time [h]
27°C 30°C 33°C 40°C
0
50
100
150
200
250
300
350
400
27° C 30°C 33° C 40°C
time
[h]
MK35 content in relation to resin [weight-%]
1.43 1.86 2.10 2.34 2.77 3.20 3.44 6.80 10.00
pph MK35 in relation to resin:
Page 11
The influences, both of temperature and of MK35 content, decrease at higher parameter settings. In a parameter range from 2.10-3.20 pph MK35, which is practically applied for this SMC formulation, temperature and MgO content have a high effect on the viscosity.
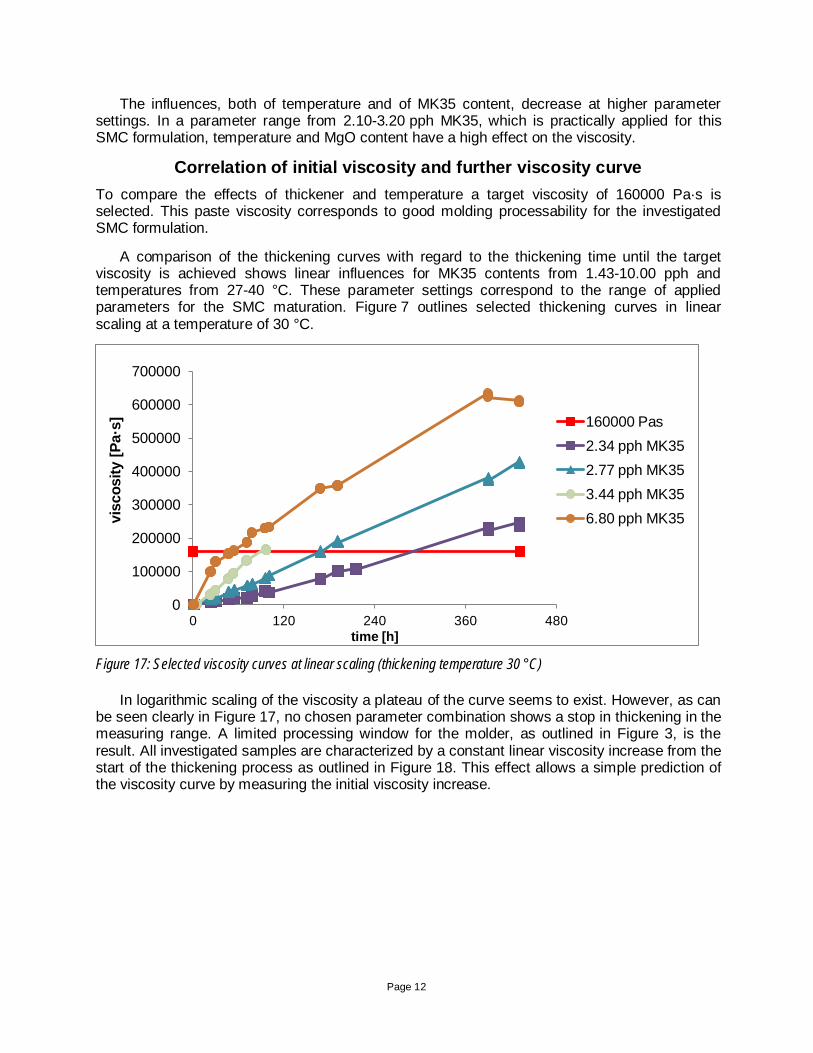
Correlation of initial viscosity and further viscosity curve To compare the effects of thickener and temperature a target viscosity of 160000 Pa·s is selected. This paste viscosity corresponds to good molding processability for the investigated SMC formulation.
A comparison of the thickening curves with regard to the thickening time until the target viscosity is achieved shows linear influences for MK35 contents from 1.43-10.00 pph and temperatures from 27-40 °C. These parameter settings correspond to the range of applied parameters for the SMC maturation. Figure 7 outlines selected thickening curves in linear scaling at a temperature of 30 °C.
Figure 17: Selected viscosity curves at linear scaling (thickening temperature 30 °C)
In logarithmic scaling of the viscosity a plateau of the curve seems to exist. However, as can be seen clearly in Figure 17, no chosen parameter combination shows a stop in thickening in the measuring range. A limited processing window for the molder, as outlined in Figure 3, is the result. All investigated samples are characterized by a constant linear viscosity increase from the start of the thickening process as outlined in Figure 18. This effect allows a simple prediction of the viscosity curve by measuring the initial viscosity increase.
0
100000
200000
300000
400000
500000
600000
700000
0 120 240 360 480
visc
osity
[Pa·
s]
time [h]
160000 Pas 2.34 pph MK35 2.77 pph MK35 3.44 pph MK35 6.80 pph MK35
Page 12
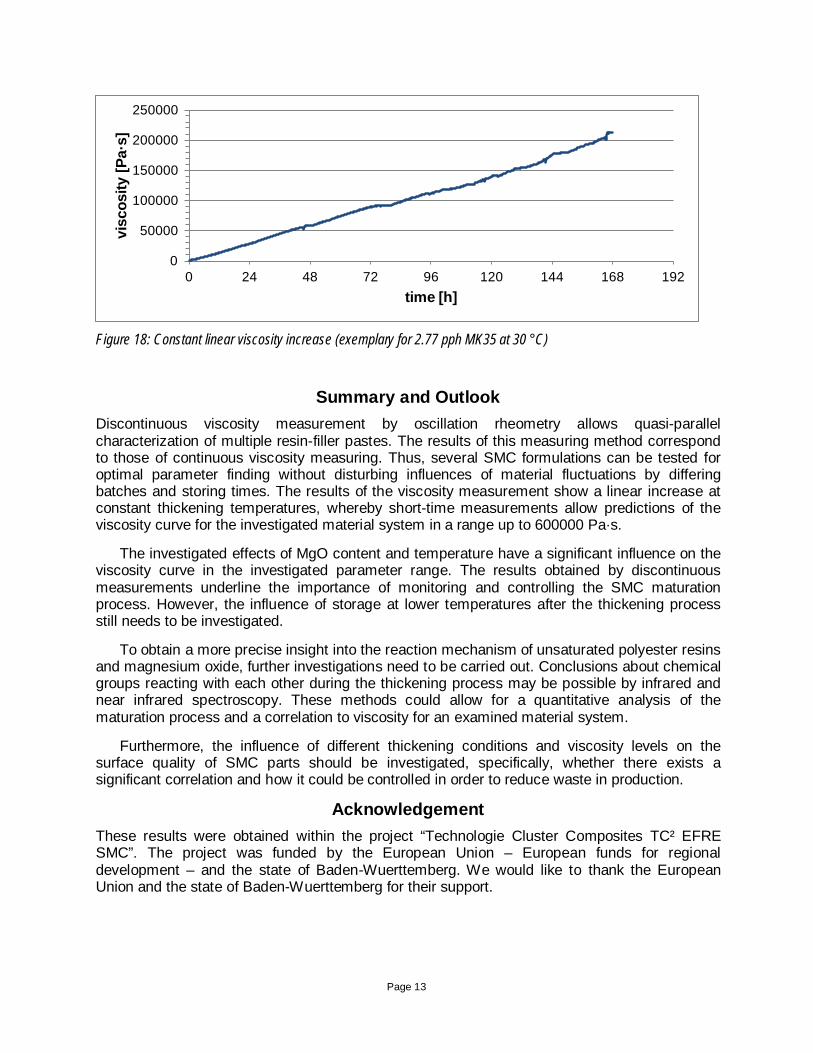
Figure 18: Constant linear viscosity increase (exemplary for 2.77 pph MK35 at 30 °C)
Summary and Outlook Discontinuous viscosity measurement by oscillation rheometry allows quasi-parallel characterization of multiple resin-filler pastes. The results of this measuring method correspond to those of continuous viscosity measuring. Thus, several SMC formulations can be tested for optimal parameter finding without disturbing influences of material fluctuations by differing batches and storing times. The results of the viscosity measurement show a linear increase at constant thickening temperatures, whereby short-time measurements allow predictions of the viscosity curve for the investigated material system in a range up to 600000 Pa·s.
The investigated effects of MgO content and temperature have a significant influence on the viscosity curve in the investigated parameter range. The results obtained by discontinuous measurements underline the importance of monitoring and controlling the SMC maturation process. However, the influence of storage at lower temperatures after the thickening process still needs to be investigated.
To obtain a more precise insight into the reaction mechanism of unsaturated polyester resins and magnesium oxide, further investigations need to be carried out. Conclusions about chemical groups reacting with each other during the thickening process may be possible by infrared and near infrared spectroscopy. These methods could allow for a quantitative analysis of the maturation process and a correlation to viscosity for an examined material system.
Furthermore, the influence of different thickening conditions and viscosity levels on the surface quality of SMC parts should be investigated, specifically, whether there exists a significant correlation and how it could be controlled in order to reduce waste in production.
Acknowledgement These results were obtained within the project “Technologie Cluster Composites TC² EFRE SMC”. The project was funded by the European Union – European funds for regional development – and the state of Baden-Wuerttemberg. We would like to thank the European Union and the state of Baden-Wuerttemberg for their support.
0
50000
100000
150000
200000
250000
0 24 48 72 96 120 144 168 192
visc
osity
[Pa·
s]
time [h]
Page 13
References [1] Kia, Hamid G.; Sheet Molding Compounds: Science and Technology. Hanser Verlag,
München, 1993. [2] McConnell, V. P.: SMC has plenty of road to run in automotive applications. Reinforced
Plastics, 2007. [3] Wacker, M.; Liebold, R.; Ehrenstein, G. W.: Charakterisierung des Eindickverhaltens von
Class-A SMC mittels unterschiedlicher Untersuchungsmethoden. 5. Internationale AVK-TV Tagung für verstärkte Kunststoffe und duroplastische Formmassen, 17.-18. September 2002, Kongresshaus Baden-Baden, 2002.
[4] Becker, G. W., Braun, D., Woebcken, W.; Duroplaste - Kunststoff-Handbuch Band 10. Hanser-Verlag, München, 1988. 3-446-14418-8.
[5] AVK - Industrievereinigung Verstärkte Kunststoffe e. V.; Handbuch Faserverbund-kunststoffe. Springer Fachmedien, Wiesbaden, 2010.
[6] Eisemon, K. E., Lewis, J. D.; New Proposed Mechanism for the Reaction of Unsaturated Polyester Resins by Alkaline Earth Metal Oxides. Tampa,: s.n., 2004.
[7] DIN EN 60068-2-78: Environmental testing; Test cab: damp heat, steady state, 2002.
Page 14