Embed Size (px)
Citation preview
CHARACTERIZATION OF POST-TRANSLATIONALLY MODIFIED
PEPTIDES AND PROTEINS USING LANTHANIDE-BASED LABELING
STRATEGIES
By
Randi Lee Gant-Branum
Dissertation
Submitted to the Faculty of the
Graduate School of Vanderbilt University
in partial fulfillment of the requirements for the degree of
DOCTOR OF PHILOSOPHY
in
Chemistry
August 2011
Nashville, Tennessee
Approved:
Professor John A. McLean
Professor Donna J. Webb
Professor Eva M. Harth
Professor David E. Cliffel

ii
Dedicated to my family,
Josh and Gradie Branum, who are my source of complete peace and joy
and to my parents,
Randall and Carrie Gant, who have been my lifelong source of inspiration and
encouragement.

iii
ACKNOWLEDGEMENTS
I would first like to profoundly thank my advisor, Dr. John McLean, for all
of his guidance, support, and mentorship throughout this graduate journey.
Graduate school has been an experience of both personal and professional
growth, and he played a critical role in shaping both aspects of the person I am
today. Working in his lab, I have built lasting friendships with Larissa Fenn,
Michal Kliman, Josh Kerr, Jeff Enders, Cody Goodwin, Jody May, Sevu
Sundarapandian, Kelly Hines, Jay Forsythe, and Seth Byers. I hope for the
chance to continue our very engaging conversations in our professional lives and
I wish them all the best in what life after Vanderbilt brings.
My research has also been guided by three other fantastic professors -
Dr. David Cliffel, Dr. Eva Harth, and Dr. Donna Webb. Their support and
insightful questions and suggestions have improved my critical thinking and
strengthened my research. The Mass Spectrometry Research Core helped me
process numerous samples, and Drs. Amy Ham, Hayes McDonald, and David
Friedman provided me with invaluable guidance on how to interpret and validate
tandem spectra.
Generous grants from Vanderbilt University, the Vanderbilt Institute for
Chemical Biology, and the American Society for Mass spectrometry funded my
research projects.
In the times after coursework and research were finished for the day, I
greatly enjoyed the company of Heather McMillen, Rachel Snider, Jennifer
McKenzie, Leslie Hiatt, Jessica Sammons, Danielle Kimmel, and Laura Engerer.
We formed a tight-knit group on the first day of student orientation, and their
friendship made my days at Vanderbilt all the better.

iv
I wouldn’t have realized my love of Chemistry without the inspiration and
enthusiasm of the wonderful professors at the University of Tennessee at
Chattanooga. Drs. Gail Meyer, Thomas Waddell, Douglas Kutz, Thomas Rybolt,
Gregory Grant, Gretchen Potts, Stephen Symes, and John Lynch made the
subject simple and elegant. Each professor brought their own unique flavor and
excitement to the subject, and I continue to carry their lessons with me. My
undergraduate mentor, Dr. Manuel Santiago, inspired me to try harder and reach
higher to master the subject. His continued friendship and helpful advice long
after my UTC graduation have been a great source of support.
But at the end of the day, no one is more responsible for the completion
of this degree than my family. My parents’ love and encouragement gave me the
self-esteem to believe that anything was possible. My husband, Joshua Branum,
supported me through every tough day and celebrated every victory with me. He
is my rock of strength and I am proud to be married to him. Finally, I’d like to
thank the most important person in my life - my daughter, Gradie Lynne Branum.
Gradie, I have never loved anyone more. You fill me with more joy and
happiness than I ever knew I could feel, and you, most of all, are my reason for
reaching for the stars.
v
TABLE OF CONTENTS
Page
DEDICATION ........................................................................................................ ii
ACKNOWLEDGEMENTS ...................................................................................... iii
LIST OF TABLES .................................................................................................. ix
LIST OF FIGURES ................................................................................................ x
Chapter
1. INTRODUCTION .............................................................................................. 1
1.1 Post-translational modifications in biological systems ........................... 1
1.1.1 The relevance of protein phosphorylation and
glycosylation ...................................................................... 1
1.1.2 Protein phosphorylation ......................................................... 2
1.1.3 Protein glycosylation ............................................................. 3
1.2 Current characterization strategies for PTMs........................................ 4
1.2.1 Characterization of phosphorylated proteins ........................... 4
1.2.2 Characterization of glycosylated proteins ............................... 12
1.3 Mobility shift labeling using ion mobility-mass spectrometry .................. 14
1.3.1 Mobility shift strategies ........................................................... 20
1.3.1.1 Lanthanide-based labeling strategies .......................... 20
1.4 Summary and Objectives .................................................................... 24
2. IDENTIFICATION OF PHOSPHORYLATION SITES WITHIN THE SIGNALLING ADAPTOR APPL1 BY MASS SPECTROMETRY ............................ 28 2.1 Introduction .......................................................................................... 28
2.2 Experimental ........................................................................................ 30
2.2.1 Reagents and plasmids .......................................................... 30
2.2.2 Protein expression .................................................................. 30
2.2.3 Proteolytic digestion ............................................................... 31
2.2.4 Western blot analysis ............................................................. 32
2.2.5 Linear ion trap and LTQ-Orbitrap MS ..................................... 32
2.2.6 Bioinformatic analysis ............................................................. 33
2.3 Results and Discussion ........................................................................ 33
vi
2.3.1 Comprehensive phosphorylation map of human APPL1 by
LTQ- and Orbitrap-MS..................................................................... 33
2.3.2 Phosphorylation sites within APPL1 functional domains ......... 40
2.3.3 Advantages and challenges to contemporary
phosphoproteomic methodologies ................................................... 42
2.4 Conclusion ............................................................................................ 45
2.5 Acknowledgements ............................................................................... 46
3. SIMULTANEOUS RELATIVE QUANTITATION AND SITE IDENTIFICATION OF PHOSPHORYLATED PEPTIDES AND PROTEINS USING LANTHANIDE-
BASED LABELING FOR MALDI-TOFMS ANALYSIS ........................................... 47 3.1 Introduction .......................................................................................... 47
3.2 Experimental ......................................................................................... 48
3.2.1 Materials and preparation ...................................................... 48
3.2.2 Digestion of phosphorylated proteins ..................................... 49
3.2.3 Selective derivatization of phosphorylated peptides and
proteins .......................................................................................... 49
3.2.4 Instrumentation and data analysis ......................................... 51
3.3 Results and Discussion ........................................................................ 52
3.3.1 Relative quantitation of phosphorylated peptides and
proteins using PhECAT .................................................................. 53
3.3.2 Fragmentation and phosphorylation site identification ............ 59
3.3.3 Challenges in quantitation of phosphorylated threonine ......... 59
3.3.4 The role of arginine in phosphorylation site stabilization ......... 62
3.4 Conclusions .......................................................................................... 65
3.5 Acknowledgements ............................................................................... 67
4. RAPID SEPARATION, IDENTIFICATION, AND QUANTITATION OF PHOSPHORYLATED PEPTIDES AND PROTEINS USING LANTHANIDE-BASED LABELS AS ION MOBILITY-MASS SPECTROMETRY MOBILITY SHIFT LABELS ................................................................................................................. 68
4.1 Introduction .......................................................................................... 68
4.2 Experimental ........................................................................................ 69
4.2.1 Materials ................................................................................ 69
4.2.2 Digestion of phosphorylated proteins ..................................... 70
vii
4.2.3 Selective derivatization of phosphorylated peptides and
proteins .......................................................................................... 70
4.2.4 Instrumentation and data analysis ......................................... 72
4.3 Results and Discussion ....................................................................... 73
4.3.1 Relative quantitation of phosphorylated peptides and
proteins using PhECAT .................................................................. 77
4.3.2 Selection, fragmentation, and identification of the site of
phosphorylation ............................................................................... 80
4.4 Conclusions ........................................................................................ 83
4.5 Acknowledgements ............................................................................. 84
5. ENHANCED SEPARATION AND CHARACTERIZATION OF GLYCOSYLATED PEPTIDES USING LANTHANIDE-BASED LABELING AND ION MOBILITY-MASS SPECTROMETRY ............................................................... 85
5.1 Introduction ........................................................................................... 85
5.2 Experimental ......................................................................................... 86
5.2.1 Materials ............................................................................... 86
5.2.2 Selective derivatization of glycosylated peptides and
proteins using lanthanide-encoded labeling strategies ................... 87
5.2.3 Instrumentation and data analysis ......................................... 90
5.3 Results and Discussion ......................................................................... 90
5.4 Conclusions .......................................................................................... 95
5.5 Acknowledgements ............................................................................... 96
6. CONCLUSIONS AND FUTURE DIRECTIONS .................................................... 97
6.1 Summary and conclusions .................................................................... 97
6.2 Future directions ................................................................................... 99
6.2.1 Custom labels for labeling and ionization efficiency ............... 99
6.2.2 Mobility shift labeling for selective separation and structural
analysis of glycosylated peptides ................................................... 101
6.2.3 Relative quantitation of dynamic interchange between
protein phosphorylation and protein glycosylation .......................... 102
Appendix ............................................................................................................... 103
viii
A. Supplementary Information for Mass Spectrometry Data Acquisition according to MIAPE-MS format ................................................ 103
B. Table of initial APPL1 phosphorylation site identifications by
LTQ-MS and reasons for acceptance or rejection ...................................... 104
C. Table of initial APPL1 phosphorylation site identifications by LTQ-Orbitrap-MS and reasons for acceptance or rejection ........................ 106
D. Supplementary data for confirmation of BEMA in labeling on
beta-casein ................................................................................................ 109
E. Normalized peak area ratios for varying molar concentrations of Tb- and Ho-labeled phosphorylated peptides in MALDI-TOFMS ............ 110
F. Spectra of relative quantitation of phosphorylated peptides by
PhECAT in MALDI-TOFMS ........................................................................ 114
G. Predicted and observed ions for Tb-labeled FQSEEQQQTEDELQDK as represented in Figure 18 ............................... 138
H. Normalized peak area ratios for varying molar concentrations
of Tb and Ho labeled phosphorylated peptides in MALDI-IM-TOFMS ..................................................................................... 139
I. Sample spectra and data from relative quantitation of
phosphorylated peptides by PhECAT in MALDI-IM-TOFMS ....................... 141
J. Predicted and observed ions for Tb-labeled FQSEEQQQTEDELQDK as represented in Figure 27 ............................... 155
K. Beta-elimination/Michael addition typical spectra for labeled
Erythropoietin as discussed in Chapter 5 ................................................... 157
L. Preliminary relative quantitation data for 1:1 molar ratios of Tb- and Ho-labeled erythropoietin .............................................................. 159
N. References for the adaptation of chapters .................................................. 168 References ........................................................................................................... 169
ix
LIST OF TABLES
Table Page
1. Purification and Quantitation Methods for Phosphoproteomics ....................... 6
2. Phosphorylation Sites within APPL1 Identified by LTQMS ............................. 36
3. Phosphorylation Sites Identified within APPL1 by LTQ-Orbitrap-MS ............. 38
4. Comparison of Peptide Sequence Surrounding Identified Phosphorylation
Sites in APPL1 ................................................................................................ 39
5. Relative Quantitation of phosphorylated peptides and proteins using
lanthanide-chelating tags in MALDI-TOFMS ................................................... 56
6. Relative Quantitation of phosphorylated peptides and proteins using
lanthanide-chelating tags in MALDI-IM-TOFMS .............................................. 78
7. Relative Quantitation of O-GlcNAc modified peptide erythropoietin using
lanthanide-chelating tags in MALDI-IM-TOFMS .............................................. 94
x
LIST OF FIGURES
Figure Page
1. Typical isotopically encoded quantitation experiment ...................................... 10
2. Traditional protocol for full glycoprotein characterization by MS ..................... 13
3. Ion mobility separations coupled to mass spectrometry .................................. 15
4. Schematic diagram of the MALDI-TWIM-TOFMS Instrument .......................... 17
5. Data projection for IM-MS ............................................................................... 18
6. Differences in the relative gas-phase packing efficiencies of
each type of biomolecule ................................................................................ 19
7. IM-MS shift strategies ..................................................................................... 21
8. Structure of lanthanide based shift reagents ................................................... 22
9. Beta-elimination/Michael addition strategy for labeling phosphorylated and
glycosylated peptides and proteins ................................................................. 25
10. FLAG and western blot purification of APPL1 ................................................. 35
11. Phosphorylation map and domains of APPL1 ................................................. 41
12. Example of incorrect precursor assignment for LTQ-Orbitrap ......................... 43
13. Example of incorrect ion assignment requiring valdidation .............................. 44
14. Reaction scheme for PhECAT ........................................................................ 50
15. Multiplexed labeling strategy ........................................................................... 54
16. Relative quantitation of WAGGDApSGE ......................................................... 55
17. Relative quantitation of FQpSEEQQQTEDELQDK ......................................... 58
18. Fragmentation spectrum for terbium-labeled FQpSEEQQQTEDELQDK ......... 60
19. Beta-elimination/Michael addition progress of peptides
containing phosphothreonine with increasing incubation time ......................... 61
20. Beta-elimination/Michael addition progress of peptides
containing phosphothreonine with a 24-hr incubation time .............................. 63
21. Beta-elimination/Michael addition of a triply phosphorylated phosphopeptide . 64
22. Relative quantitation of a triply phosphorylated phosphopeptide ..................... 66
23. Labeling reaction scheme for PhECAT in IM-MS ............................................ 71
24. Schematic of mobility cell and mobility organized fragmentation ..................... 74
25. Labeling strategy for both MALDI-IM-TOFMS and MALDI-TOFMS platforms . 76
26. Relative quantitation of FQpSEEQQQTEDELQDK in MALDI-IM-TOFMS ....... 79
xi
27. Derivatization, selection, and fragmentation of FQpSEEQQQTEDELQDK ...... 81
28. Reaction scheme for using PhECAT for O-linked glycans ............................... 89
29. Proposed strategy for the selective separation, site identification, and relative
quantitation of glycosylated and phosphorylated peptides and proteins .......... 92
30. Derivatization, selection, and relative quantitation of a O-GlcNAc-modified
peptide ............................................................................................................ 93
31. Structures of proposed shift reagents .............................................................. 100
1
CHAPTER 1
INTRODUCTION
1.1 Post-translational modifications in biological systems
Post-translational modifications (PTMs) on proteins are known to play a
substantial role in the complexity and diversity of biological systems. This chapter
discusses two key PTMs- protein phosphorylation and glycosylation – including
their biological roles, associated diseases, significance in relation to each other,
and how they are currently characterized. A number of challenges exist in
characterizing each type of PTM, such as lability of the modification during MS
fragmentation, substoichiometry, and difficulty in separation of the modified
protein or peptide from complex mixtures. New methodologies that circumvent
many of these challenges using lanthanide-based labeling and two mass
spectrometry (MS) platforms - MALDI-TOFMS and ion mobility-mass
spectrometry (IM-MS) - are proposed. An outline of objectives and research
goals is highlighted.
1.1.1 The relevance of protein phosphorylation and glycosylation
The majority of cellular processes, particularly cell to cell interaction, cell
differentiation, proliferation, mobility, division, and apoptosis, are governed by
protein expression and post-translational modifications (PTMs) on proteins,
which commonly take the form of phosphorylation, glycosylation, acetylation,
methylation, etc. O-linked protein phosphorylation and glycosylation are
2
considered two of the most common PTMs and often compete for the same
positions during a number of cellular functions. It has been shown that regulation
of phosphorylation vs. glycosylation stoichiometries govern many cellular
processes, outlined below. For this reason, phosphoproteomics and glycomics
have moved to evaluate the direct role of these PTMs in regulating proteins
responsible for the progression of Alzheimer’s disease,1-4 cancer proliferation,5, 6
inflammatory diseases,7, 8 and the onset of developmental neurological
diseases.9
1.1.1.2 Protein phosphorylation
Phosphorylation of serine (Ser), threonine (Thr), and tyrosine (Tyr)
residues (O-phosphorylation) occur with the assistance of kinases, which
account for approximately 2% of the human genome.10 It has been estimated that
50% of all proteins in a typical eukaryotic cell are phosphorylated.11, 12 Protein
phosphorylation is reported to play a critical role in the regulation of cell
proliferation,11 differentiation,13 migration,14-18 signalling,11 survival,11, 19 and
apoptosis20 Moreover, varying the stoichiometry of protein phosphorylation has
been shown to regulate signaling cascades and rates of turnover of cell migration
proteins, which are known to play a significant role in neurological disorders, pro-
inflammatory disorders (e.g., psoriasis and rheumatoid arthritis) and cellular
behaviors associated with cancer cell proliferation.10, 21, 22
Protein phosphorylation is challenging to characterize due to the dynamic
nature of the modification. There exist significant differences in the occurrence of
pSer, pThr, and pTyr residues, in that these residues are typically observed in a
ratio of 1800:200:1, respectively.23 Adding to the complexity, the degree of
phosphorylation changes according to the temporal cellular response. Moreover,
3
phosphorylated serine and threonine residues are labile in basic conditions
encountered in common buffers and also during tandem MS fragmentation.
Phosphates have been reported to rearrange in collision cells of MS instruments,
resulting in increased noise, false positives, and reduction of signal
corresponding to the original site of modification.24, 25 These factors often result in
substoichiometric levels of phosphorylated proteins available for analysis, which
compound the challenges in phosphoproteomic characterization.
1.1.1.3 Protein glycosylation
Protein glycosylation is a common and complex form of post-translational
modification which regulates the structure, stability, and function of proteins
within the cell. Glycosylation is ubiquitous among all eukaryotes, and it is
estimated that glycosylation occurs on 50% of all eukaryotic proteins.26 It is
reported to play a key role in functions on the cell membrane such as hormone
uptake,27 recognition of toxins or pathogens,28, 29 and signaling to other cells.30 It
also plays a further role in cellular processes such as organization31 and
division.6 Furthermore, glycosylation is required for the biological function of
certain proteins, such as the Fc-effector function of immunoglobulin G (IgG).7, 32-35
Moreover, glycosylation has been linked to reproduction,36 embryonic stem cell
development,37 and the development of Alzheimer’s disease,3 arthritis,8 and
diabetes.38 O-linked glycosylation exists on serine, threonine, and tyrosine
residues, and occurs most frequently on serine. Proteins bearing O-linked N-
Acetyl Glucoseamine (O-GlcNAc) have been implicated in AIDS-related
lymphomas and viral and parasitic proteins.31
4
Characterization of protein glycosylation is challenging for a number of
reasons, including substoichiometry and difficulty in determining the glycan
structure. For example, O-GlcNAc (O-linked N-acetylglucosamine) is highly
dynamic and deglycosylation is a rapid step for regulatory functions, resulting in
substoichiometric amounts. Glycan branching is often complex and positional
isomers are difficult to separate using traditional online separation methods for
MS. Building blocks for the glycan comprise a large number of carbohydrates,
and the functionality of the glycan is dependent upon its branching structure and
terminal saccharides. Furthermore, glycosylation may be interchangeable with
phosphorylation in some regulatory systems. Moreover, glycans are difficult to
separate from complex biological mixtures, and often require a number of
laborious chromatography steps to generate a pure mixture for analysis.
1.2 Current characterization strategies for PTMs
1.2.1 Characterization of phosphorylated proteins
Characterization of a phosphoprotein involves determination of the site of
phosphorylation and determination of stoichiometry between different states.
Traditionally, these two analyses are performed in separate experiments, as a
priori knowledge of the sites of phosphorylation greatly facilitate targeted
quantitative approaches. Moreover, site identification typically requires
enrichment, as sequence coverage detected may be suppressed by more
abundant concomitant species.
5
Classical phosphoproteomic enrichment includes separation and
purification by 2-D gels, immunoprecipitation, immobilized metal affinity columns
(IMAC), reversed-phase liquid chromatography (RPLC), or the use of selective
enrichment via phospho-specific antibodies and 2-D gel separation. Each method
offers advantages and disadvantages. A brief overview of separation
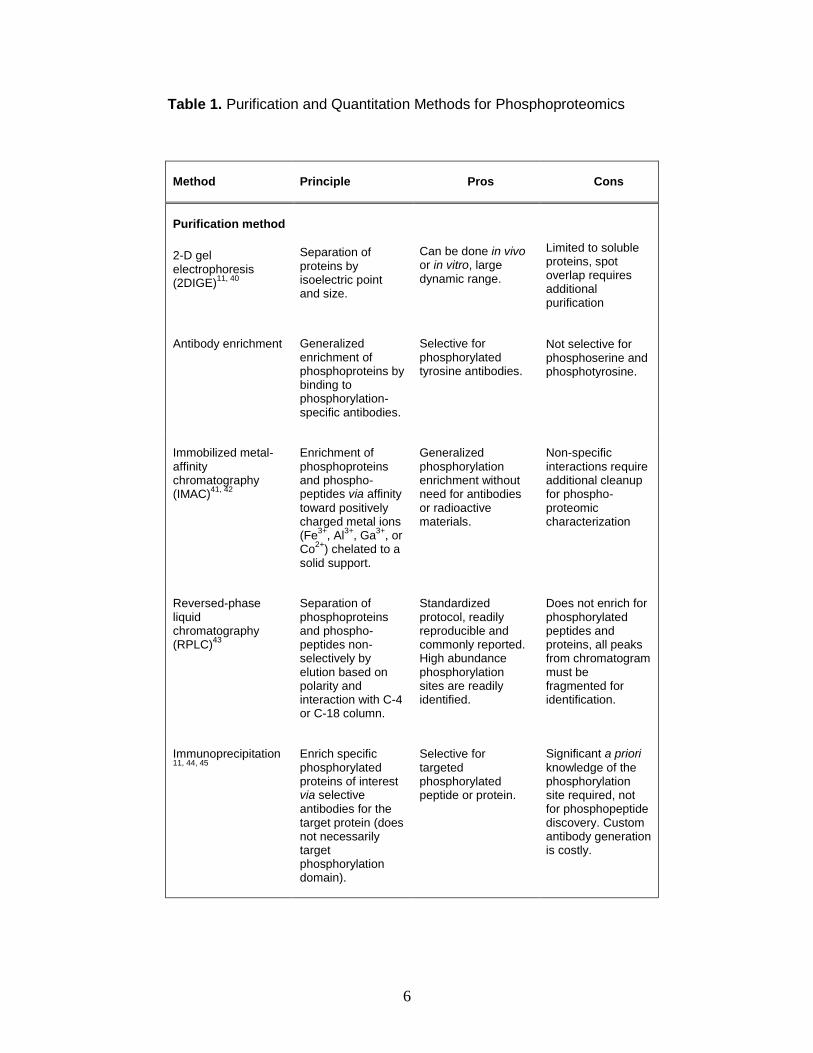
methodologies and quantitative methodologies discussed below is provided in
Table 1.
Classical phosphoproteomic quantitative and site elucidation
methodologies include the use of 32P radiolabels.39 In this method, protein
mixtures are typically separated by 2-D gel electrophoresis and subsequently
imaged. Varying samples may quantitated by the relative amounts of radiation
emitted, and site elucidation is performed by Edman degradation. This method is
still in common use because of demonstrated dynamic range, but is restricted by
three important limitations. First, this method requires the use of 2-D gels, which
limit applicability to soluble and relatively abundant proteins. In many cases,
protein phosphorylation occurs rapidly and is frequently observed in low
abundance. Second, phosphoaminoacid analysis suffers from poor site
specificity, and a significant amount of a priori knowledge is required about the
sequence and potential sites of phosphorylation. Third, this method is labor-
intensive, time consuming, and requires the use of radioactive labeling. Typical
labeling experiments take between 3-7 days and
6
Table 1. Purification and Quantitation Methods for Phosphoproteomics
Method Principle Pros Cons
Purification method
2-D gel electrophoresis (2DIGE)
11, 40
Separation of proteins by isoelectric point and size.
Can be done in vivo or in vitro, large dynamic range.
Limited to soluble proteins, spot overlap requires additional purification
Antibody enrichment Generalized enrichment of phosphoproteins by binding to phosphorylation-specific antibodies.
Selective for phosphorylated tyrosine antibodies.
Not selective for phosphoserine and phosphotyrosine.
Immobilized metal-affinity chromatography (IMAC)
41, 42
Enrichment of phosphoproteins and phospho-peptides via affinity
toward positively charged metal ions (Fe
3+, Al
3+, Ga
3+, or
Co2+
) chelated to a solid support.
Generalized phosphorylation enrichment without need for antibodies or radioactive materials.
Non-specific interactions require additional cleanup for phospho-proteomic characterization
Reversed-phase liquid chromatography (RPLC)
43
Separation of phosphoproteins and phospho-peptides non-selectively by elution based on polarity and interaction with C-4 or C-18 column.
Standardized protocol, readily reproducible and commonly reported. High abundance phosphorylation sites are readily identified.
Does not enrich for phosphorylated peptides and proteins, all peaks from chromatogram must be fragmented for identification.
Immunoprecipitation 11, 44, 45
Enrich specific phosphorylated proteins of interest via selective antibodies for the target protein (does not necessarily target phosphorylation domain).
Selective for targeted phosphorylated peptide or protein.
Significant a priori
knowledge of the phosphorylation site required, not for phosphopeptide discovery. Custom antibody generation is costly.
7
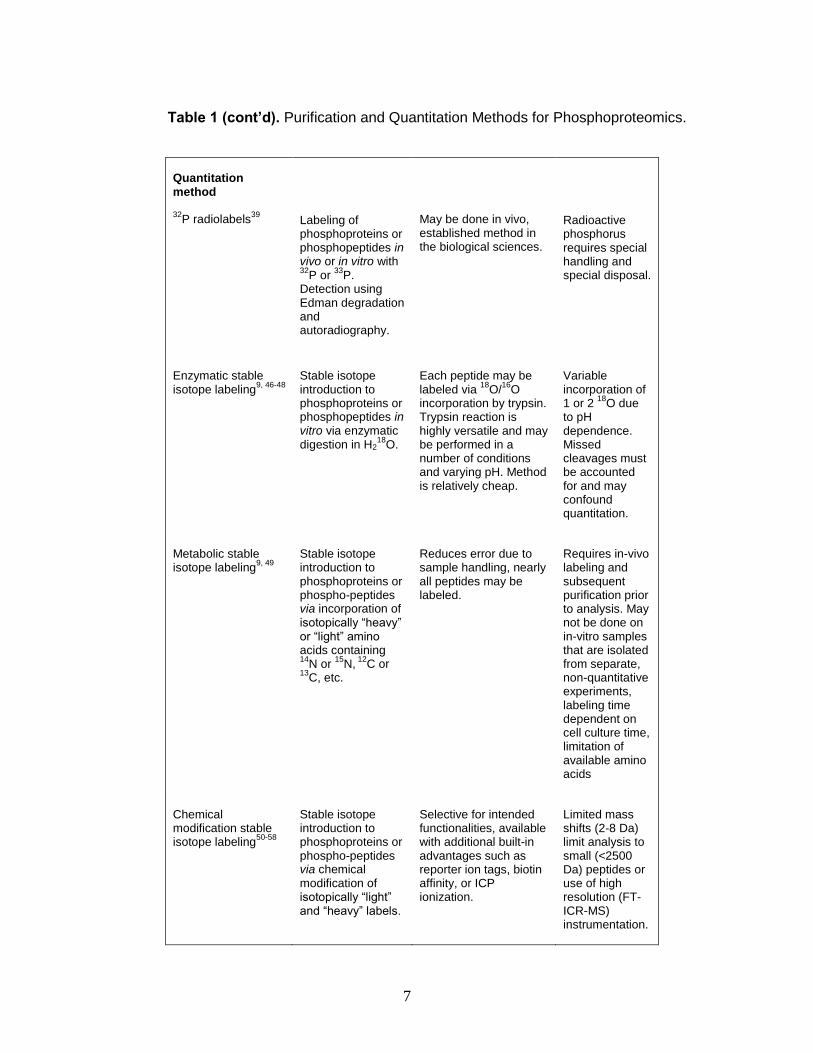
Table 1 (cont’d). Purification and Quantitation Methods for Phosphoproteomics.
Quantitation method
32P radiolabels
39
Labeling of phosphoproteins or phosphopeptides in vivo or in vitro with 32
P or 33
P. Detection using Edman degradation and autoradiography.
May be done in vivo, established method in the biological sciences.
Radioactive phosphorus requires special handling and special disposal.
Enzymatic stable isotope labeling
9, 46-48
Stable isotope introduction to phosphoproteins or phosphopeptides in vitro via enzymatic digestion in H2
18O.
Each peptide may be labeled via
18O/
16O
incorporation by trypsin. Trypsin reaction is highly versatile and may be performed in a number of conditions and varying pH. Method is relatively cheap.
Variable incorporation of 1 or 2
18O due
to pH dependence. Missed cleavages must be accounted for and may confound quantitation.
Metabolic stable isotope labeling
9, 49
Stable isotope introduction to phosphoproteins or phospho-peptides via incorporation of isotopically “heavy” or “light” amino acids containing 14
N or 15
N, 12
C or 13
C, etc.
Reduces error due to sample handling, nearly all peptides may be labeled.
Requires in-vivo labeling and subsequent purification prior to analysis. May not be done on in-vitro samples that are isolated from separate, non-quantitative experiments, labeling time dependent on cell culture time, limitation of available amino acids
Chemical modification stable isotope labeling
50-58
Stable isotope introduction to phosphoproteins or phospho-peptides via chemical modification of isotopically “light” and “heavy” labels.
Selective for intended functionalities, available with additional built-in advantages such as reporter ion tags, biotin affinity, or ICP ionization.
Limited mass shifts (2-8 Da) limit analysis to small (<2500 Da) peptides or use of high resolution (FT-ICR-MS) instrumentation.
8
require extensive prior purification using affinity purification and treatment before
analysis.
Many of these challenges can be addressed using mass spectrometry
(MS) techniques. To circumvent the time intensive requirements of affinity
chromatography methods, data-dependent scanning (tandem MS/MS
experiments, typically on triple quadrupole instruments) followed by bioinformatic
analysis is often used for PTM site localization. Although these methods are
sufficiently sensitive to the substoichiometric amounts of phosphorylated
sequences, they make inefficient use of chromatography time and require
tandem spectra acquisition for each peak in the chromatogram regardless of
whether the peak corresponds to the modifications of interest. Moreover, a
substantial amount of manual validation is required, as phosphorylation site
rearrangement has been noted.24
Quantitation is routinely performed using mass spectrometry. Current
methods for MS-based quantitation include stable isotope and metal labeling
techniques that take advantage of nearly identical labeled structures, differing
only by the incorporation of a limited number of heavy isotopes. Contemporary
stable isotope labeling was first introduced by three independent labs in the late
1990’s and is now implemented enzymatically (e.g. O18 labeling), 46-48
metabolically (e.g. SILAC),49, 56 or by chemical modification.53, 59-61 Typically,
these labeling strategies provide relative quantitation through incorporation of
different stable isotopes for comparing relative protein expression profiles.
Relative quantitation information can be expected, because the labeled peptides
are isotopologues and hence their ionization efficiencies are assumed to be
9
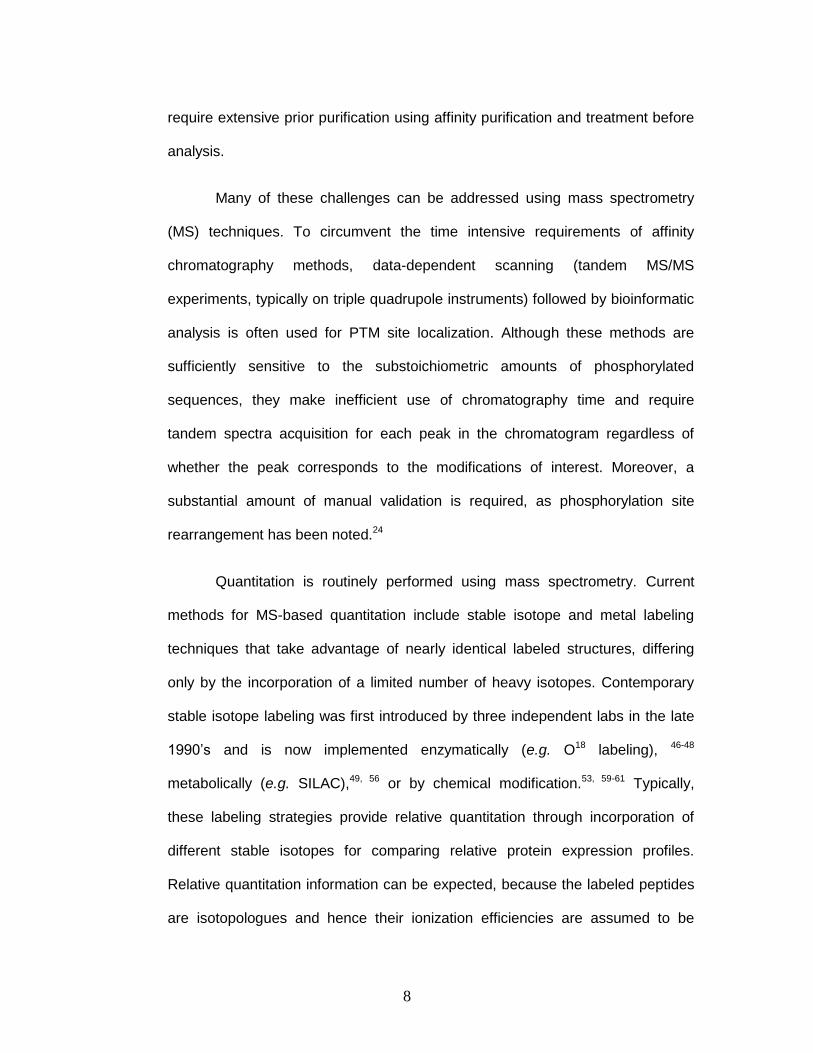
identical. Protein expression is then elucidated by comparing the relative peak
areas of each differentially labeled peptide (Figure 1).
The most prevalent method for enzymatic introduction of stable isotope
labels is proteolytic 18O-labeling first reported by Desiderio et al.46 in 1983 and
later improved by Mirgorodskaya et al. in 2000.47 In this experiment, proteolytic
enzymes are reacted with the protein of interest in H218O, resulting in
incorporation of an 18O atom at the carboxyl terminus of each enzymatically
cleaved peptide. This method suffers from variable incorporation of the isotope
(one or two atoms can be incorporated, depending on pH and time scale of
digestion), resulting in reduced signal intensity and moderate convolution of peak
intensity comparisons.9
The most prevalent method for metabolic introduction of stable isotope
labels is the stable isotope labeling by amino acids in cell culture (SILAC) method
reported by Ong et al.49 In this method, differentially expressed cells are grown in
separate medium containing either native arginine and lysine or isotope labeled
13C6-arginine and 13C6-lysine that is taken into the cell and incorporated into the
proteome. This ensures that all tryptic peptides carry at least one labeled residue
corresponding to its unlabeled counterpart. An advantage of this method is that
differentially labeled peptides may be combined at the culture level, eliminating
errors typical of late-stage combination quantification techniques. It suffers,
however, from high cost, insufficient selectivity, and relatively high time
requirements for total isotope incorporation and preparation. Additionally, in
10
Figure 1. In a typical relative quantitation experiment, differentially expressed samples are encoded with isotopically “light” or “heavy” labels enzymatically, metabolically, or by chemical modification that generates mass shifts of 2-8 Da. Relative peak areas provide relative quantitation information. Adapted from reference.9
11
order for the method to be useful in phosphoproteomic determination, additional
purification steps are also required to improve detection.
Chemical modification of phosphorylation sites has been achieved using
several different methods. Aebersold and colleagues reported a tagging method
in which a cysteamine linker is covalently bound to the phosphate group via an
N,N’-dimethylaminopropyl ethyl carbodiimide (EDC) coupling reaction.62 Smith
and colleagues reported a method for relative quantitation of phosphorylated
peptides and proteins (i.e. Phosphoprotein Isotope-Coded Affinity Tags, or
PhIAT)52 analogous to a protein quantitation method previously described by
Gygi and colleagues termed isotope-coded affinity tags, or ICAT, which labels at
cysteine residues. In the PhIAT method, phosphorylation at serine and threonine
is converted to a cysteine-like moiety containing a free thiol via beta-elimination
to yield dehydrobetaalanine or dehydroaminobutyric acid, respectively.
Subsequent thiol Michael addition of an isotopically labeled dithiol linker provides
the isotopologues and chemical reactivity for a covalent attachment to biotin. The
labeled phosphorylated peptides are then digested, purified by affinity
chromatography, and analyzed by LC-MS/MS. Relative quantitation information
is gained by comparing relative peak areas for the isotopically “light” and “heavy”
labeled peptides.52, 57
PhIAT provides versatile, selective relative quantitation information for
phosphorylated peptides. However, all of these strategies limit the peptide mass
that can be quantitated by a limited range of isotopic mass differences. For
example, peptide mass is limited by the 2-8 Dalton mass shift afforded by the
isotopically enriched linker portion of the label. At higher masses, (greater than
12
ca. 2500 Da), the natural isotopic envelopes of the isotopologues begin to
overlap resulting in poorer relative quantitation accuracy.9
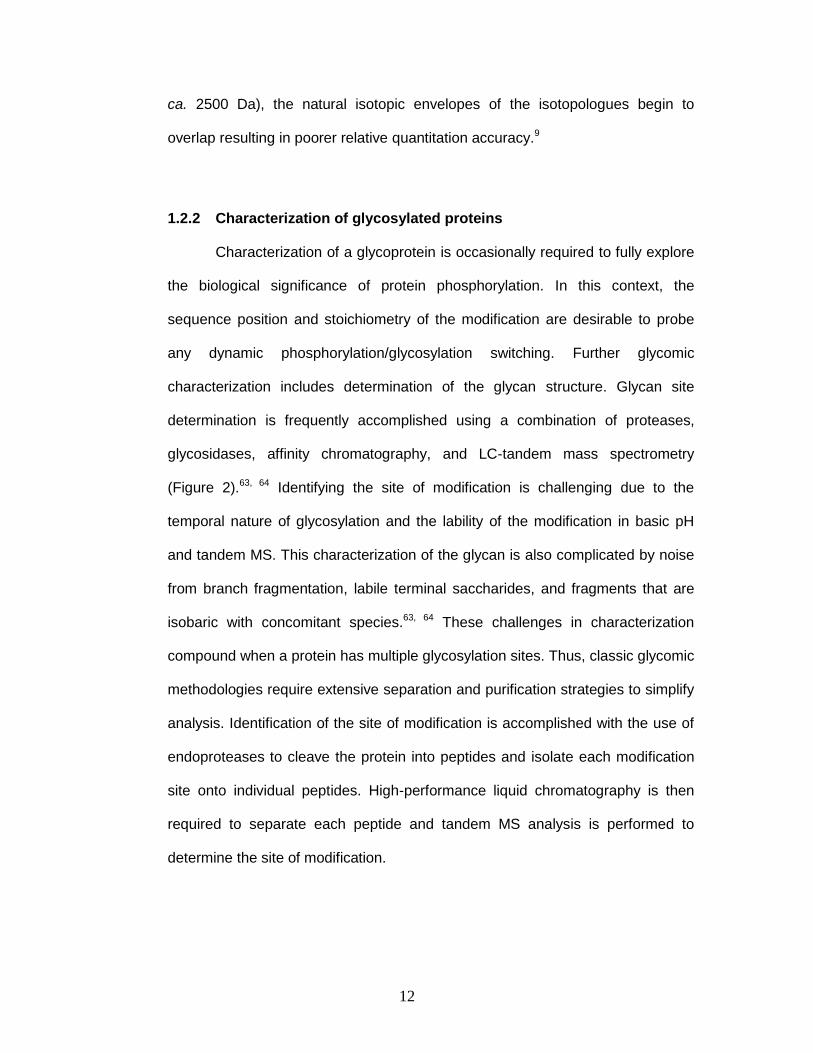
1.2.2 Characterization of glycosylated proteins
Characterization of a glycoprotein is occasionally required to fully explore
the biological significance of protein phosphorylation. In this context, the
sequence position and stoichiometry of the modification are desirable to probe
any dynamic phosphorylation/glycosylation switching. Further glycomic
characterization includes determination of the glycan structure. Glycan site
determination is frequently accomplished using a combination of proteases,
glycosidases, affinity chromatography, and LC-tandem mass spectrometry
(Figure 2).63, 64 Identifying the site of modification is challenging due to the
temporal nature of glycosylation and the lability of the modification in basic pH
and tandem MS. This characterization of the glycan is also complicated by noise
from branch fragmentation, labile terminal saccharides, and fragments that are
isobaric with concomitant species.63, 64 These challenges in characterization
compound when a protein has multiple glycosylation sites. Thus, classic glycomic
methodologies require extensive separation and purification strategies to simplify
analysis. Identification of the site of modification is accomplished with the use of
endoproteases to cleave the protein into peptides and isolate each modification
site onto individual peptides. High-performance liquid chromatography is then
required to separate each peptide and tandem MS analysis is performed to
determine the site of modification.
13
Figure 2. Traditional protocol for full glycoprotein characterization by MS.
Stoichiometric information is typically not obtained.
14
Structural characterization of the attached glycan is then accomplished
through the use of glycosidases, which cleave the attached glycan from the
protein. Lectin chromatography is used to separate glycans from peptides, and
high-performance liquid chromatography is used prior to tandem MS analysis.
Although these separation methods can resolve glycans and facilitate
characterization, similar polarities and size of the carbohydrate limits complete
separation. Furthermore, offline chromatographic and affinity separations are
known to be laborious and time consuming, requiring hours to days to complete.
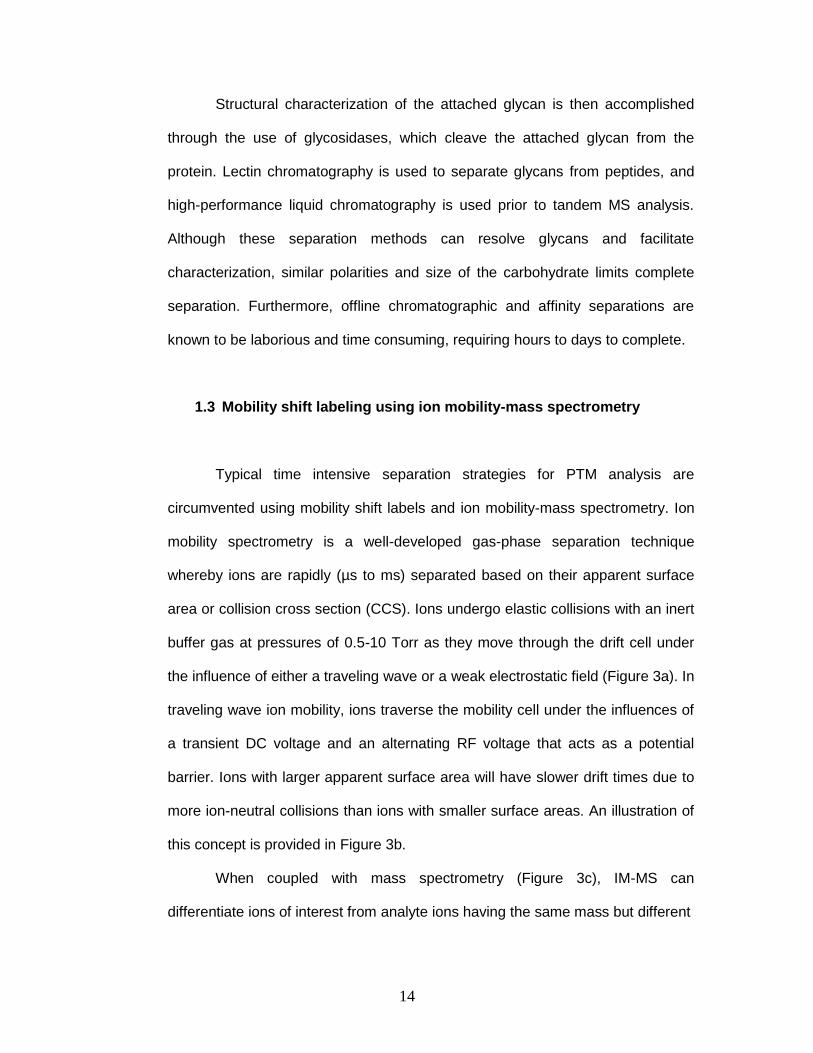
1.3 Mobility shift labeling using ion mobility-mass spectrometry
Typical time intensive separation strategies for PTM analysis are
circumvented using mobility shift labels and ion mobility-mass spectrometry. Ion
mobility spectrometry is a well-developed gas-phase separation technique
whereby ions are rapidly (µs to ms) separated based on their apparent surface
area or collision cross section (CCS). Ions undergo elastic collisions with an inert
buffer gas at pressures of 0.5-10 Torr as they move through the drift cell under
the influence of either a traveling wave or a weak electrostatic field (Figure 3a). In
traveling wave ion mobility, ions traverse the mobility cell under the influences of
a transient DC voltage and an alternating RF voltage that acts as a potential
barrier. Ions with larger apparent surface area will have slower drift times due to
more ion-neutral collisions than ions with smaller surface areas. An illustration of
this concept is provided in Figure 3b.
When coupled with mass spectrometry (Figure 3c), IM-MS can
differentiate ions of interest from analyte ions having the same mass but different
15
Figure 3. a) Ion mobility separates on the basis of collisions with a neutral buffer gas under the influence of a weak electrostatic field, resulting in differing arrival time distributions for conformers of a peptide. b) An example of two conformations of example peptide [Ac-Y(AEAAKA)5F-NH2+Na]+. The folded version (blue, also indicated above in blue), exhibits a faster arrival time than the extended version (red, also indicated above in red) due to a reduction in apparent surface area for collisions in the mobility cell. Structures shown are two representative conformers obtained through molecular dynamics calculations and represent local maxima. c) Ion mobility may be coupled to mass spectrometry using a number of platforms, but the general arrangement is presented in this schematic.
16
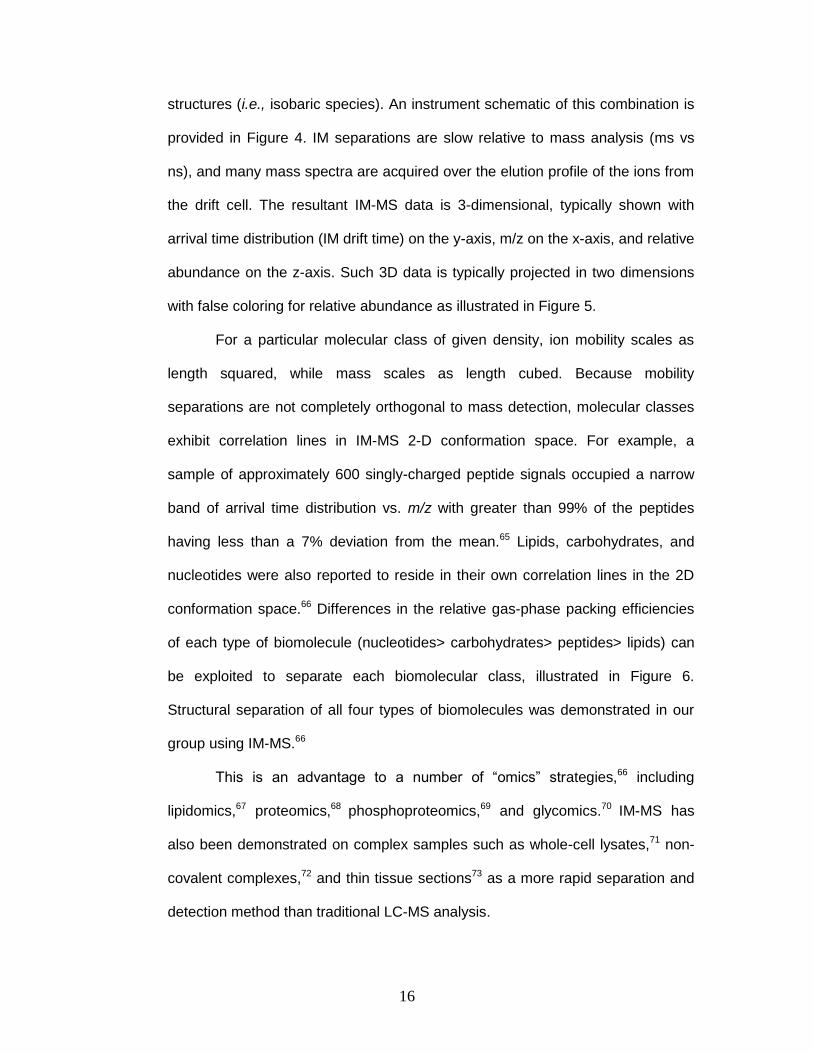
structures (i.e., isobaric species). An instrument schematic of this combination is
provided in Figure 4. IM separations are slow relative to mass analysis (ms vs
ns), and many mass spectra are acquired over the elution profile of the ions from
the drift cell. The resultant IM-MS data is 3-dimensional, typically shown with
arrival time distribution (IM drift time) on the y-axis, m/z on the x-axis, and relative
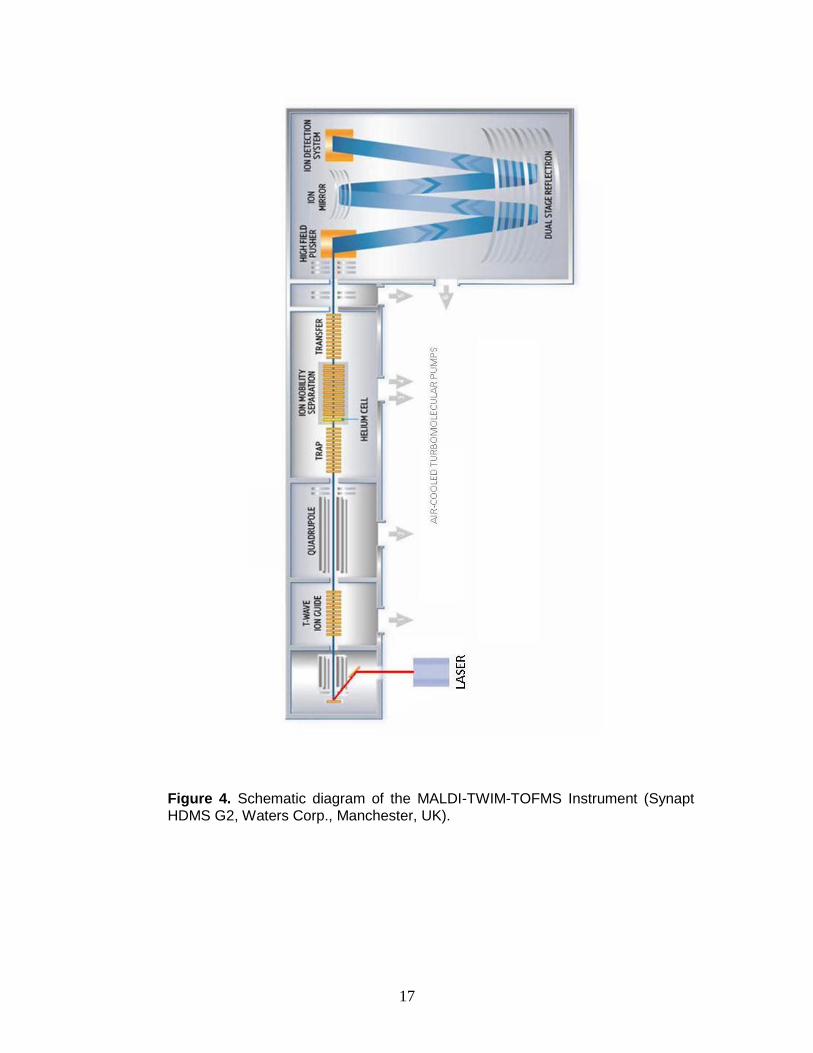
abundance on the z-axis. Such 3D data is typically projected in two dimensions
with false coloring for relative abundance as illustrated in Figure 5.
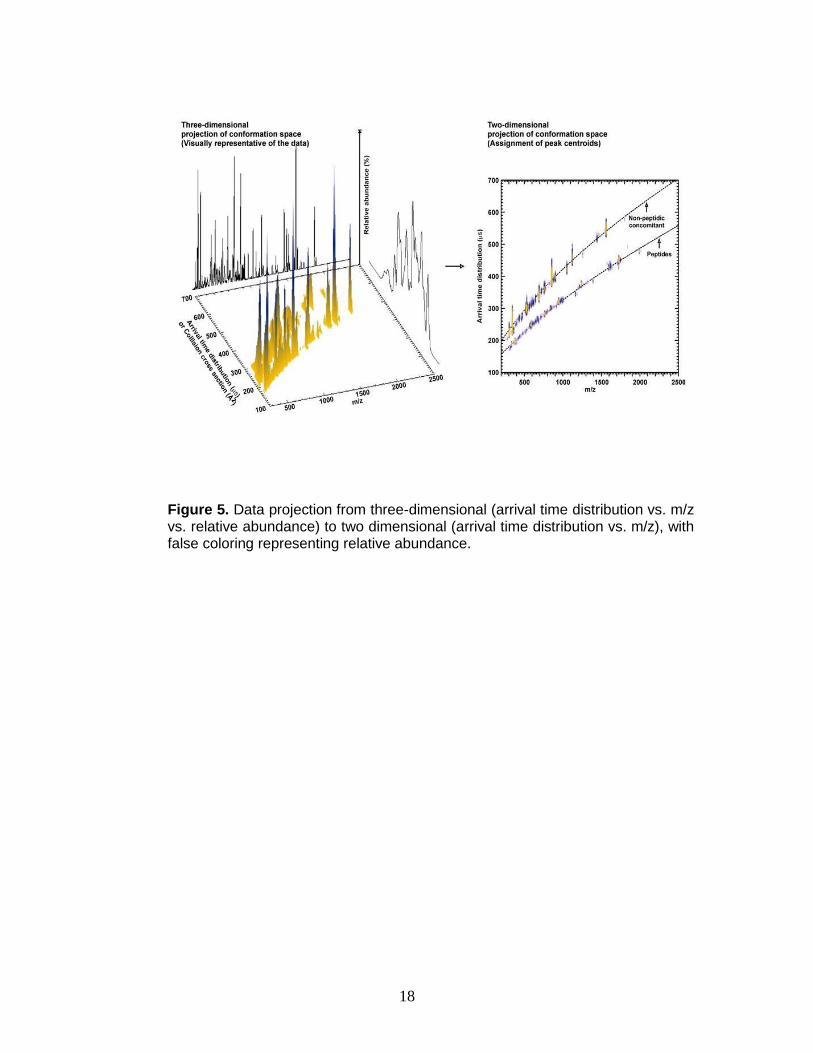
For a particular molecular class of given density, ion mobility scales as
length squared, while mass scales as length cubed. Because mobility
separations are not completely orthogonal to mass detection, molecular classes
exhibit correlation lines in IM-MS 2-D conformation space. For example, a
sample of approximately 600 singly-charged peptide signals occupied a narrow
band of arrival time distribution vs. m/z with greater than 99% of the peptides
having less than a 7% deviation from the mean.65 Lipids, carbohydrates, and
nucleotides were also reported to reside in their own correlation lines in the 2D
conformation space.66 Differences in the relative gas-phase packing efficiencies
of each type of biomolecule (nucleotides> carbohydrates> peptides> lipids) can
be exploited to separate each biomolecular class, illustrated in Figure 6.
Structural separation of all four types of biomolecules was demonstrated in our
group using IM-MS.66
This is an advantage to a number of “omics” strategies,66 including
lipidomics,67 proteomics,68 phosphoproteomics,69 and glycomics.70 IM-MS has
also been demonstrated on complex samples such as whole-cell lysates,71 non-
covalent complexes,72 and thin tissue sections73 as a more rapid separation and
detection method than traditional LC-MS analysis.
17
Figure 4. Schematic diagram of the MALDI-TWIM-TOFMS Instrument (Synapt HDMS G2, Waters Corp., Manchester, UK).
18
Figure 5. Data projection from three-dimensional (arrival time distribution vs. m/z vs. relative abundance) to two dimensional (arrival time distribution vs. m/z), with false coloring representing relative abundance.
19
Figure 6. Differences in the relative gas-phase packing efficiencies of each type of biomolecule (nucleotides> carbohydrates> peptides> lipids) are shown. a) Ion surface areas vs. m/z from a pool of 53 lipids, 610 peptides, 191 carbohydrates, and 110 oligonucleotides. b) Mean correlation lines ion surface area vs. m/z for each biomolecular class. c) Separation of biomolecular class in real time (as acquired from the Synapt HDMS IM-MS instrument). Adapted from reference 66.
20
It should be noted, however, that minor modifications (e.g.,
phosphorylation sites) within each biomolecular class were not significantly
resolved (0-6% deviation) from unmodified molecules.69
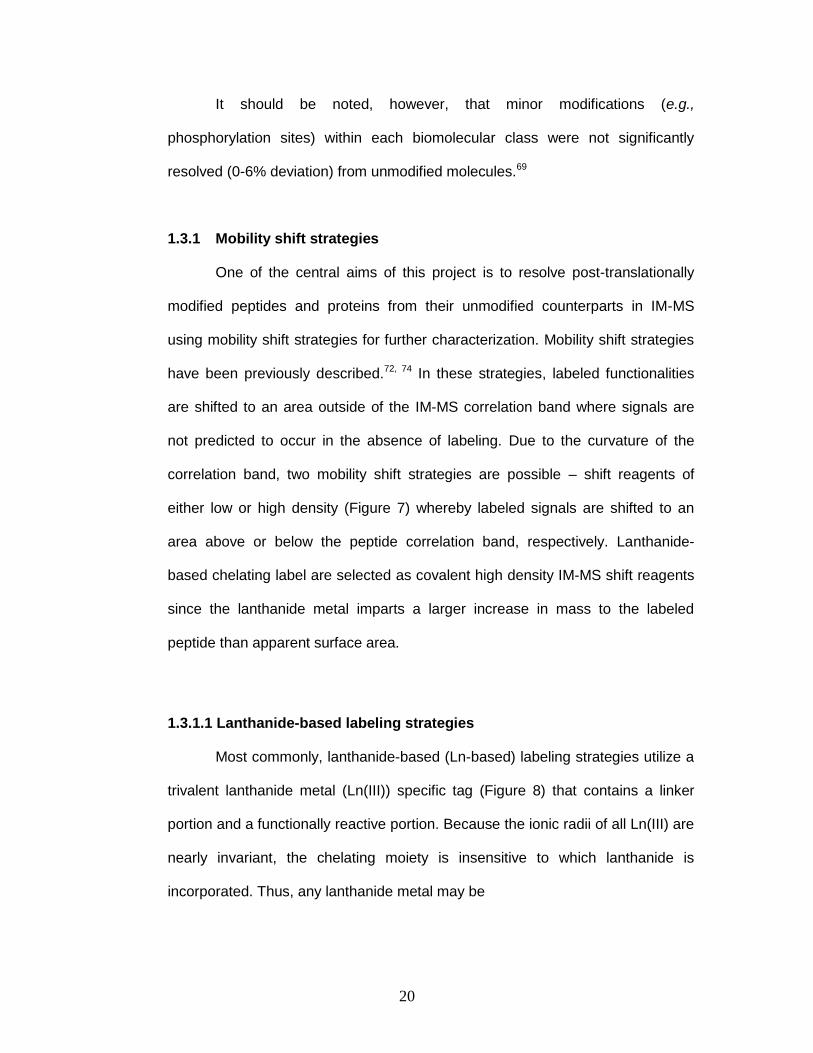
1.3.1 Mobility shift strategies
One of the central aims of this project is to resolve post-translationally
modified peptides and proteins from their unmodified counterparts in IM-MS
using mobility shift strategies for further characterization. Mobility shift strategies
have been previously described.72, 74 In these strategies, labeled functionalities
are shifted to an area outside of the IM-MS correlation band where signals are
not predicted to occur in the absence of labeling. Due to the curvature of the
correlation band, two mobility shift strategies are possible – shift reagents of
either low or high density (Figure 7) whereby labeled signals are shifted to an
area above or below the peptide correlation band, respectively. Lanthanide-
based chelating label are selected as covalent high density IM-MS shift reagents
since the lanthanide metal imparts a larger increase in mass to the labeled
peptide than apparent surface area.
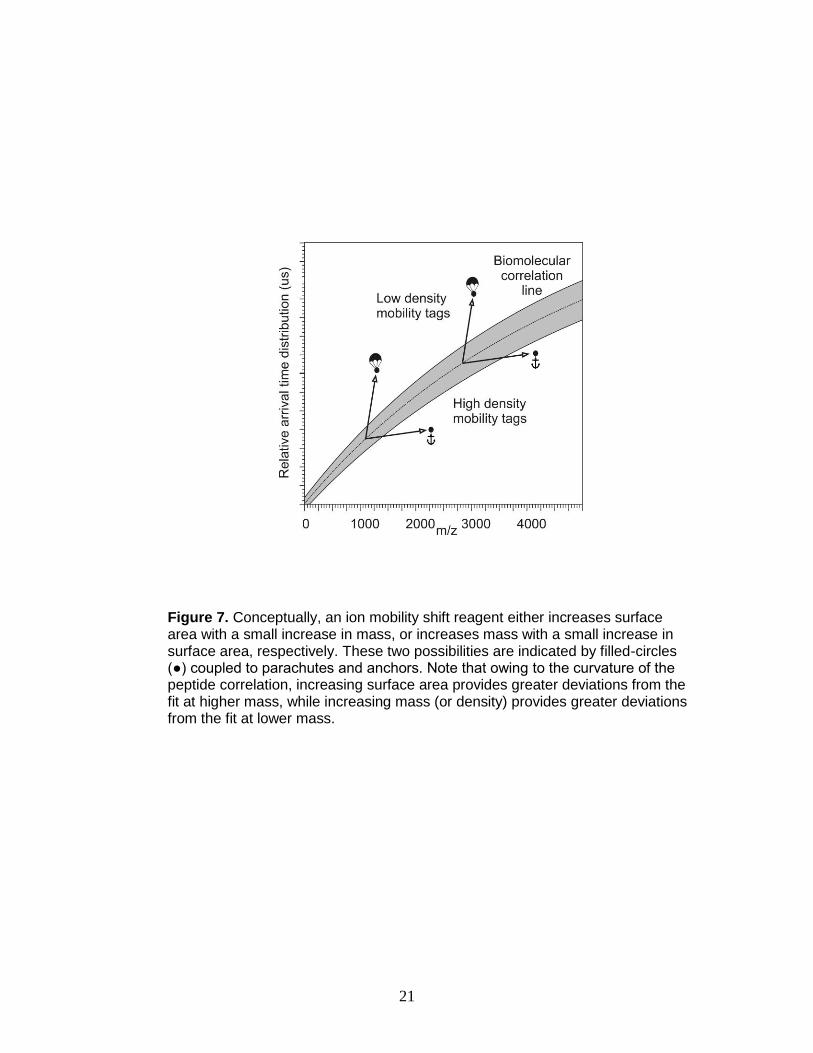
1.3.1.1 Lanthanide-based labeling strategies
Most commonly, lanthanide-based (Ln-based) labeling strategies utilize a
trivalent lanthanide metal (Ln(III)) specific tag (Figure 8) that contains a linker
portion and a functionally reactive portion. Because the ionic radii of all Ln(III) are
nearly invariant, the chelating moiety is insensitive to which lanthanide is
incorporated. Thus, any lanthanide metal may be
21
Figure 7. Conceptually, an ion mobility shift reagent either increases surface area with a small increase in mass, or increases mass with a small increase in surface area, respectively. These two possibilities are indicated by filled-circles (●) coupled to parachutes and anchors. Note that owing to the curvature of the peptide correlation, increasing surface area provides greater deviations from the fit at higher mass, while increasing mass (or density) provides greater deviations from the fit at lower mass.
22
Figure 8. An illustration of the structure of lanthanide-based relative quantitation reagents. The tag consists of a (i) metal chelation region, (ii) a linker region, and a (iii) region chemically selective for cysteine.
23
selected to encode a particular quantitative sample for up to 15 multiplexed
analyses. The subsequent mass shift between differentially labeled samples can
then be tuned by selection of the Ln(III), (e.g. La/Lu result in a mass difference of
36 Da), which are sufficiently large to circumvent limitations for quantitation of
larger peptides using isotopologue quantitation strategies. Ionization efficiency of
different lanthanide metals can be expected to be nearly identical. Another
advantage to using DOTA-Ln complexes is that it may be bound to a natural
antibody (i.e., antibody 2d12.5) with no known analogues for selective purification
of Ln-labeled peptides.75
Two common strategies using lanthanide-based labeling are termed
element-coded affinity tagging (ECAT)58 and metal-coded affinity tagging
(MeCAT).50 Note that in principle both strategies are specific to labeling at the
sulfhydryl group of cysteine. Labeling for primary amines has been reported,55
however Ln-labeling strategies have been reported for PTMs have not been
reported to date.
Here, the potential for lanthanide-based labeling strategies as mobility
shift reagents for ion mobility-mass spectrometry is explored. It is hypothesized
that addition of Ln-chelated labels will shift labeled peptides out of IM-MS regions
where signals are predicted to occur and that this approach will provide a rapid
means for identifying a separated modified peptide for subsequent analysis. This
approach will reduce extensive online separations prior to analysis and will
circumvent processing of hundreds of thousands of spectra as is typical in LC-
MS analysis. Furthermore, incorporation of different metals provides both a shift
in IM and the potential for relative quantitation information. This is significant,
because in contrast with MS-only measurements, shifting signals away from
24
endogenous chemical noise improves the accuracy in peak area analysis for
relative quantitation of protein expression profiles.
In this work, I explore the potential for lanthanide-based labeling as an an
alternative to isotopologue-based quantitation labels and as IM-MS mobility shift
reagents for protein phosphorylation and glycosylation. Phosphorylated and
glycosylated peptides and proteins may be modified by beta-elimination/Michael
addition (BEMA) chemistry that converts the labile phosphorylation site to a
functionality that is readily labeled.76-81 In the proposed strategy, phosphorylated
and glycosylated peptides are converted into free thiols using BEMA chemistry
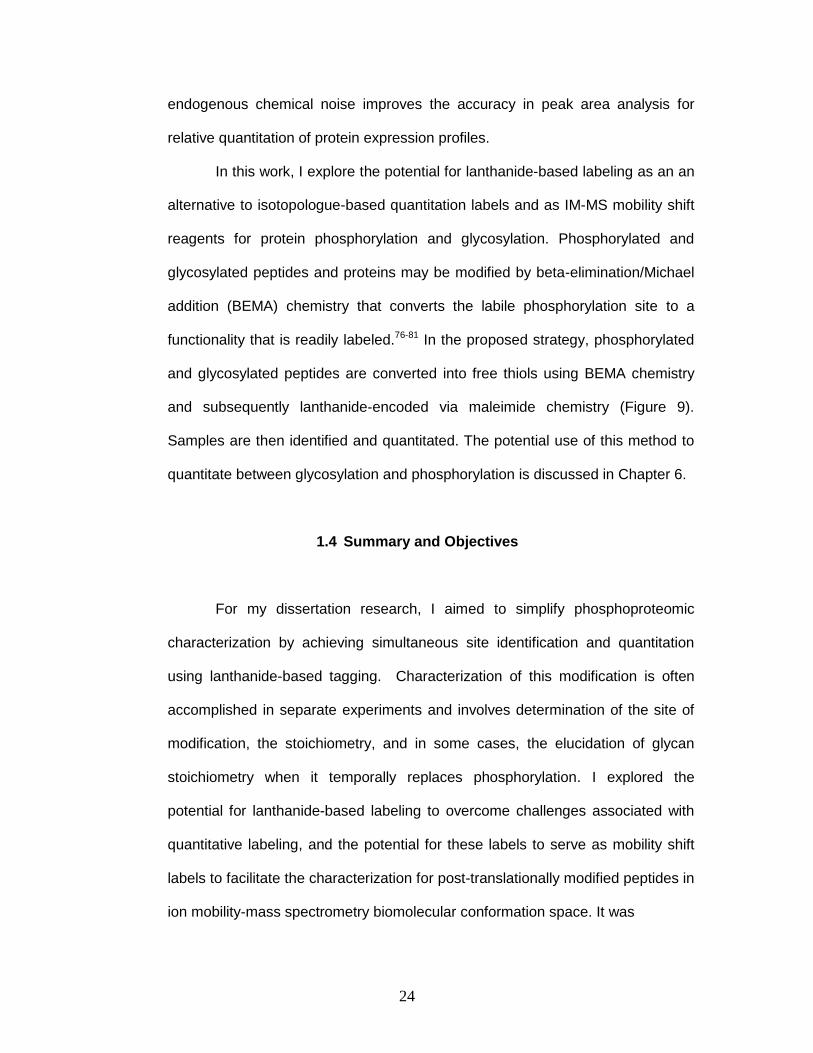
and subsequently lanthanide-encoded via maleimide chemistry (Figure 9).
Samples are then identified and quantitated. The potential use of this method to
quantitate between glycosylation and phosphorylation is discussed in Chapter 6.
1.4 Summary and Objectives
For my dissertation research, I aimed to simplify phosphoproteomic
characterization by achieving simultaneous site identification and quantitation
using lanthanide-based tagging. Characterization of this modification is often
accomplished in separate experiments and involves determination of the site of
modification, the stoichiometry, and in some cases, the elucidation of glycan
stoichiometry when it temporally replaces phosphorylation. I explored the
potential for lanthanide-based labeling to overcome challenges associated with
quantitative labeling, and the potential for these labels to serve as mobility shift
labels to facilitate the characterization for post-translationally modified peptides in
ion mobility-mass spectrometry biomolecular conformation space. It was
25
Figure 9. Beta-elimination/Michael addition strategy for labeling phosphorylated and glycosylated peptides and proteins. i) The site of modification is beta-eliminated in basic conditions, resulting in dehydroalanine or dehydroamino-butyric acid for modified serine and threonine residues, respectively. ii) A dithiol linker is added by Michael addition chemistry. iii) A bifunctional ligand containing a lanthanide-chelating moiety and a thiol-selective moiety is added via maleimide chemistry. iv) Finally, the samples are encoded with lanthanide metals via chelation to the Ln-chelation region.
26
hypothesized that, when used as mobility shift reagents, lanthanide-based labels
would provide enhanced separation of selected PTMs from the peptide
correlation line in IM-MS, facilitating additional analysis such as quantitation and
site identification. Furthermore, I also evaluated the utility of these labels in
profiling glycan stoichiometry. The objectives, which are addressed in the
following chapters, are outlined below:
1. What are the advantages and challenges in performing traditional data-
dependent analysis for phosphorylation characterization when analyzing a
previously uncharacterized, non-model phosphorylated protein? What areas of
these routine analyses can be improved? Evaluation of this question is
addressed in the work detailing phosphorylation site analysis on the cell
migration signaling protein APPL1 in Chapter 2: Identification of phosphorylation
sites within the signaling adaptor APPL1 by mass spectrometry.
2. Can lanthanide-based labeling strategies be used to circumvent
challenges associated with the quantitation and site identification of
phosphorylated peptides and proteins? These questions are explored in Chapter
3: Simultaneous relative quantitation and site identification of phosphorylated
peptides and proteins using lanthanide-based labeling for MALDI-TOFMS
analysis.
3. Can lanthanide-based labels effectively be used as mobility shift labels
to separate phosphorylated peptides and proteins from their unphosphorylated
counterparts in IM-MS conformation space? What advantages does this
separation method provide over traditional phosphoproteomic characterization by
27
data-dependent MS analysis? This is discussed in Chapter 4: Rapid separation,
identification, and quantitation of phosphorylated peptides and proteins using
lanthanide-based labels as ion mobility-mass spectrometry mobility shift labels.
4. Can lanthanide-based mobility shift labeling be applied to probe the
stoichiometry of phosphorylation vs. glycosylation? This is addressed in Chapter
5: Enhanced separation and characterization of glycosylated peptides using
lanthanide-based labeling and ion mobility-mass spectrometry.
Completion of these experiments revealed that lanthanide-based labels
have great utility in circumventing challenges associated with phoshoproteomic
and glycomic characterization by reducing separation steps and reducing
analysis time while provided the added advantages of more versatile
quantitation. Overall, the strategies described in the following chapters present
simplify phosphoproteomic and glycoproteomic analysis by providing
simultaneous modification site identification and stoichiometric information while
facilitating rapid separation when used as a mobility shift label in IM-MS
conformation space.
28
CHAPTER 2
IDENTIFICATION OF PHOSPHORYLATION SITES WITHIN THE SIGNALLING ADAPTOR APPL1 BY MASS SPECTROMETRY
2.1 Introduction
In this chapter, phosphopeptide site identification, one segment of full
phosphoproteomic characterization, is performed using established data-
dependent tandem MS methods to evaluate the robustness and to identify the
challenges associated with phosphoproteomics using data-dependent
methodologies and the subsequent bioinformatics processing. Site identification
is accomplished for the uncharacterized protein Adaptor protein containing a PH
domain, PTB domain and Leucine zipper motif (APPL1), speculated to play a role
in the signaling cascade that governs cell migration. APPL1 is a 709 amino acid
membrane associated protein that has been reported to play a key role in the
regulation of apoptosis, cell proliferation, cell survival, and vesicular trafficking.82,
83 APPL1 is widely expressed and found in high levels in the heart, brain, ovary,
pancreas, and skeletal muscle.82 Although a significant amount of interest has
been generated in the interactions and function of APPL1, the complete
phosphorylation profile of this protein has not been described. To date,
phosphorylation of three residues, threonine 399, and serines 401 and 691,
which were identified from global profiling studies,19, 84-87 are reported in protein
databases, including Phosphosite, Proteinpedia/Human Protein Reference
Database, and Expasy-SwissProt.
APPL1 mediates its function through a series of domains, including an N-
terminal Bin-Amphiphysin-Rvs (BAR), a central Pleckstrin homology (PH), and a
29
C-terminal phospho-tyrosine binding domain (PTB).82, 88 Both the BAR and PH
domains are involved in binding to cell membranes. The BAR domain is a
dimerization motif associated with the sensing and/or induction of membrane
curvature, while the PH domain binds to phosphoinositol lipids.89, 90 The BAR
domain has also been shown to be critical in the ability of APPL1 to localize to
endosomal structures.91 In APPL1, the BAR and PH domains are thought to act
together as a functional unit forming an integrated, crescent-shaped, symmetrical
dimer that mediates membrane interactions.92, 93 Moreover, the BAR and PH
domains function together to create the binding sites for Rab5, which is a small
GTPase involved in endosomal trafficking.93, 94 The C-terminal PTB domain of
APPL1 has been shown to be critical in the ability of APPL1 to bind to several
signaling molecules, including the serine/threonine kinase Akt, the neurotrophin
receptor TrkA, the adiponectin receptors AdipoR1 and AdipoR2, Human Follicle-
Stimulating Hormone (FSHR), and the tumor suppressor DCC (deleted in
colorectal cancer).82, 95-98
In this study, phosphorylation sites were identified on APPL1 using both
contemporary mass spectrometry (MS)-based methods, namely, by liquid
chromatography (LC)-coupled to data-dependent tandem MS on both an LTQMS
and LTQ-Orbitrap-MS. The bioinformatic algorithm SEQUEST was used to
process the MS/MS data obtained in these phosphorylation mapping
experiments. However, spectral assignments required manual validation of all
identified phosphorylation site spectra. To obtain near-complete coverage of
APPL1, multiple proteases were used in parallel phosphorylation site mapping
experiments in the contemporary approaches. Proteolytic digestion with Glu C,
trypsin, and chymotrypsin yielded sequence coverages of 44.6%, 88.3%, and
81.1%, respectively, with a combined sequence coverage of APPL1 of greater
30
than 99%. A total of 13 phosphorylation sites were detected and four of these
sites were found within APPL1 interacting domains, suggesting a potential
regulatory role in APPL1 function.
2.2 Experimental
2.2.1 Reagents and plasmids
FLAG M2-agarose affinity gel, FLAG peptide (DYKDDDDK), and mouse
IgG agarose were purchased from Sigma (St. Louis, MO). Calyculin A was
purchased from Calbiochem (San Diego, CA). Sodium vanadate was obtained
from Fischer Scientific (Fairlawn, NJ). Peroxovanadate was prepared as
previously described.99 FLAG-GFP plasmid was prepared by inserting the FLAG
epitope sequence into pcDNA3 (Invitrogen, Carlsbad, CA) and cloning EGFP C1
(Clonetech) into the vector at KpnI and BamHI sites. Human APPL1 (accession
number GI: 124494248) was then cloned into the FLAG-GFP plasmid at EcoRI
and the insertion, as well as orientation, of APPL1 was confirmed by sequencing.
Proteases were purchased from Promega Corp. (Madison, WI), and all additional
buffers were purchased in solid form from Sigma and prepared as stated.
2.2.2 Protein expression
Protein expression was performed in collaboration with Donna J. Webb
and colleagues. Human embryonic kidney 293 (HEK-293) cells were maintained
in Dulbecco’s Modified Eagle’s Medium (DMEM) (Invitrogen) supplemented with
10% fetal bovine serum (FBS) (Hyclone) and penicillin/streptomycin (Invitrogen).
HEK-293 cells were transfected with FLAG-GFP-APPL1 (12 μg per 150 mm dish)
using Lipofectamine 2000 (Invitrogen). After 36 h, cells were incubated with 1
31
mM peroxovanadate and 50 nM calyculin A in DMEM with 10% FBS for 30 min
and extracted with 25 mM Tris, 100 mM NaCl, and 0.1% NP-40 (pH 7.4). The
lysates were precleared twice with mouse IgG-agarose for 1 h at 4 °C, and
immunoprecipitated with FLAG-agarose (Sigma, St. Louis, MO) for 2 h at 4 °C.
Samples were washed three times with 25 mM Tris and 100 mM NaCl, pH 7.4,
and FLAG tagged APPL1 was eluted by incubation of the beads with 0.2 mg/mL
FLAG peptide in 25 mM Tris, pH 7.4, for 1 h at 4 °C. Purified APPL1 protein was
subjected to sodium dodecyl sulfate−polyacrylamide gel electrophoresis (SDS-
PAGE) followed by Coomassie blue staining. The concentration of APPL1 was
quantified with a LI-COR Biosciences ODYSSEY Infrared Imaging System using
bovine serum albumin (BSA) as a standard.
2.2.3 Proteolytic digestion
For MS analyses, APPL1 was separated into three equal aliquots and
proteolytically digested by trypsin, chymotrypsin, and Glu C proteases,
respectively. Briefly, proteolysis was performed by taking 2.6 μg of APPL1 (20
μL) and diluting to 25 μL with 25 mM ammonium bicarbonate. Cysteine sulfhydryl
groups were reduced by the addition of 1.5 μL of 45 mM dithiothreitol (DTT) for
30 min at 55 °C followed by alkylation with 2.5 μL of 100 mM iodoacetamide for
30 min at room temperature in the dark. Digestion was performed using 100 ng
(1:40 enzyme/substrate, w/w) of trypsin gold (Promega, Madison, WI),
chymotrypsin (Princeton Separations, Freehold, NJ), or endoproteinase Glu C
(Calbiochem EMD Biosciences, Gibbstown, NJ) at 37 °C for 16, 4, or 6 h,
respectively. Proteolysis was quenched by adding 1 μL of 88% formic acid.
Subsequently, the digest was lyophilized and then reconstituted in 25 μL of 0.1%
formic acid.
32
2.2.4 Western blot analysis
Western blot analysis was performed in collaboration with Donna J. Webb
and colleagues. Briefly, purified APPL1 protein was subjected to SDS-PAGE,
and then transferred to a nitrocellulose membrane. The membrane was
incubated with primary antibody against GFP (Invitrogen) or 4G10 (a kind gift
from Steve Hanks, Vanderbilt University) at a dilution of 1 μg/mL. The membrane
was then incubated with IR Dye 800 Conjugated Affinity Purified anti-Rabbit IgG
or anti-Mouse IgG (Rockland) at a dilution of 0.1 μg/mL, and visualized using a
LI-COR Biosciences ODYSSEY Infrared Imaging System.
2.2.5 Linear ion trap and LTQ-Orbitrap MS
LC-MS/MS analyses of APPL1 digests were performed using a linear ion
trap mass spectrometer (LTQ, Thermo Electron, San Jose, CA) equipped with an
autosampler (MicroAS, Thermo) and an HPLC pump (Surveyor, Thermo), and
Xcalibur 2.0 SR2 instrument control. Ionization was performed by using
nanospray in the positive ion mode. Spectra were obtained using data-dependent
scanning tandem mass spectrometry in which one full MS scan, using a mass
range of 400−2000 amu, was followed by up to 5 MS/MS scans of the most
intense peaks at each time point in the HPLC separation. Incorporated into the
method was data-dependent scanning for the neutral loss of phosphoric acid or
phosphate (−98 m/z, −80 m/z), for which MS3 was performed. Dynamic exclusion
was enabled to minimize redundant spectral acquisitions. High resolution data
was collected using a similar strategy on a LTQ-Orbitrap mass spectrometer with
the exception that the full MS scan was performed in the Orbitrap at 30,000 m/z
33
resolution, rather than at unit mass resolution on the LTQMS. Further
instrumental details are available in the supplementary information.
2.2.6 Bioinformatic analysis
Tandem MS/MS spectra acquired in LTQMS and LTQ-Orbitrap-MS
experiments were identified using SEQUEST (University of Washington). MS/MS
spectra were extracted from the raw data files into .dta format with spectra
containing fewer than 25 peaks being excluded. Files labeled as singly charged
were created if 90% of the total ion current occurred below the precursor ion, and
all other spectra were processed as both doubly- and triply charged ions.
Proteins were identified using the TurboSEQUEST version 27 (rev. 12) algorithm
(Thermo Electron) and the IPI Human database version 3.33 (67837) sequences.
Search parameters are outlined in the supplementary information. Manual
verification was performed on all phosphorylation assignments having an Xcorr
value above 1, 2, and 2.5 for charges +1, +2, and +3, respectively. Validation
was performed as previously described.100 All spectra are hosted online at the
address listed in the Appendices according to MIAPE standards.101
2.3 Results and Discussion
2.3.1 Comprehensive phosphorylation map of human APPL1 by LTQ- and Orbitrap-MS
In this study, a comprehensive phosphorylation profile of APPL1 is
described for the first time. To accomplish this, FLAG-GFP-APPL1 was
expressed in HEK-293 cells by the Webb group and subsequently
34
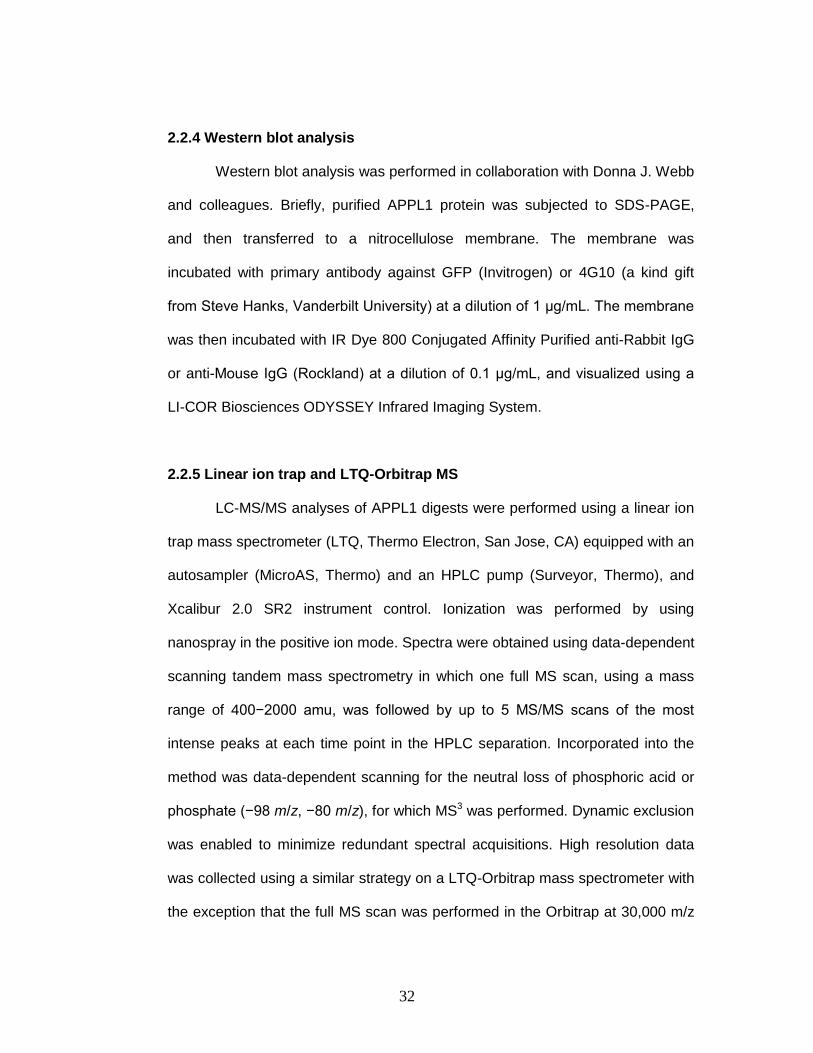
immunoprecipitated for MS analysis according to the purification scheme outlined
in Figure 10 a. A major band corresponding to the molecular mass of APPL1 was
observed when the immunoprecipitate was subjected to SDS-PAGE and stained
with Coomassie blue (Figure 10 b). The band was confirmed to be APPL1 by
Western blot analysis (Figure 10 c). A total of 15 μg was expressed for this
characterization and divided between multiple protease digests and instrumental
platforms. Before subjecting APPL1 to MS analysis, we examined the
phosphorylation state of this protein using 4G10 phosphotyrosine antibody.
APPL1 was phosphorylated on tyrosine residues as determined by Western blot
analysis with 4G10 (Figure 10 c). Several other minor bands were detected in the
immunoprecipated samples, which could correspond to endogenous APPL1 or
APPL1 binding proteins. However, insufficient peptide signal from MS analyses
precluded positive protein identification of these additional minor bands.
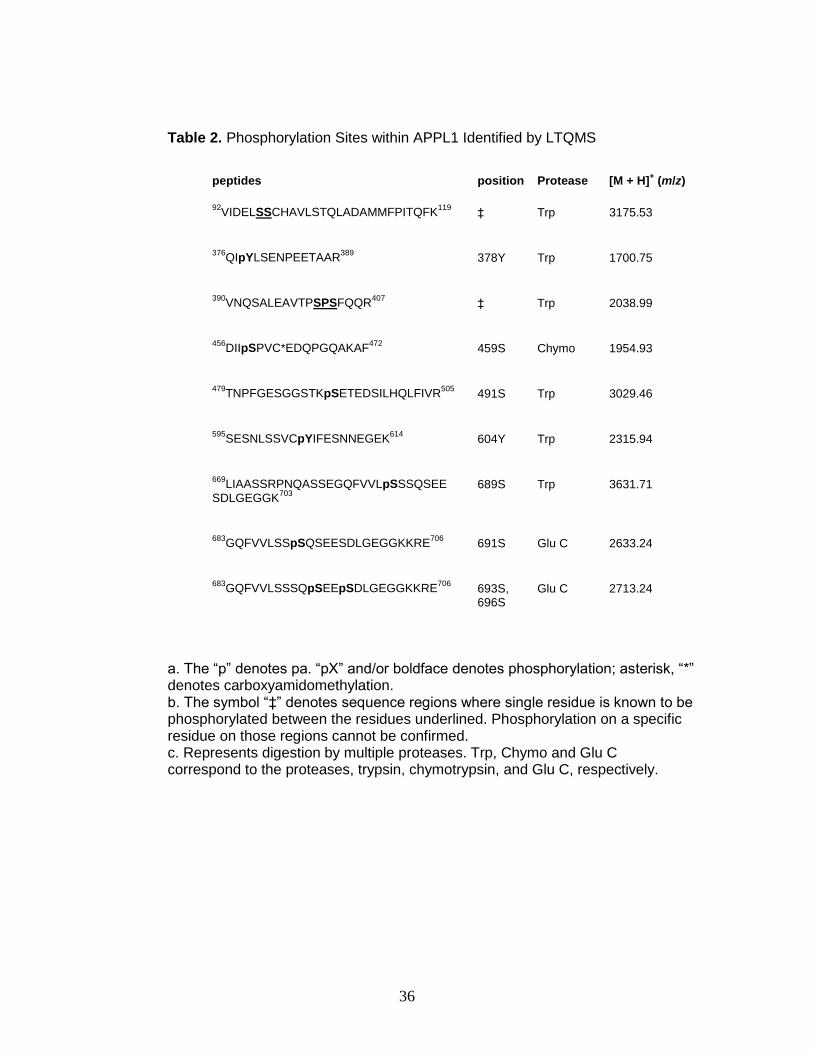
At least 13 (as discussed below) phosphorylation sites with 99.6% total
amino acid sequence coverage were identified using multiple proteases,
including trypsin, chymotrypsin, and Glu C, followed by LC-MS analyses using
both an LTQMS instrument and an LTQ-Orbitrap instrument. Of these reported
phosphorylation sites, three could not be located to a single amino acid (i.e.,
phosphorylation was determined to exist within a range of potential sites within a
peptide). Table 2 shows each confirmed phosphorylation site assignment by
sequence position using the LTQMS instrument. In total, 10 phosphorylation sites
were identified by combining the data obtained for trypsin, chymotrypsin, and Glu
C digests to obtain a sequence coverage of 95.3%. Of these 10 sites, only two
35
Figure 10. a) Schematic showing the generalized protocol used for purifying FLAG-tagged proteins. b) SDS-PAGE gel of immunoprecipiated FLAG-GFP-APPL1 stained with Coomassie blue. Arrow points to purified FLAG-GFP-APPL1. c) Western blot with GFP-specific antibody (left panel) or phospho-tyrosine antibody (right panel). Left panel shows the purified protein is FLAG-GFP-APPL1 (IB: GFP) and right panel shows that APPL1 is phosphorylated on tyrosine residues (IB: 4G10).
36
Table 2. Phosphorylation Sites within APPL1 Identified by LTQMS
a. The “p” denotes pa. “pX” and/or boldface denotes phosphorylation; asterisk, “*” denotes carboxyamidomethylation. b. The symbol “‡” denotes sequence regions where single residue is known to be phosphorylated between the residues underlined. Phosphorylation on a specific residue on those regions cannot be confirmed. c. Represents digestion by multiple proteases. Trp, Chymo and Glu C correspond to the proteases, trypsin, chymotrypsin, and Glu C, respectively.
peptides position Protease [M + H]+ (m/z)
92VIDELSSCHAVLSTQLADAMMFPITQFK
119
‡
Trp
3175.53
376QIpYLSENPEETAAR
389
378Y
Trp
1700.75
390VNQSALEAVTPSPSFQQR
407
‡
Trp
2038.99
456DIIpSPVC*EDQPGQAKAF
472
459S
Chymo
1954.93
479TNPFGESGGSTKpSETEDSILHQLFIVR
505
491S
Trp
3029.46
595SESNLSSVCpYIFESNNEGEK
614
604Y
Trp
2315.94
669LIAASSRPNQASSEGQFVVLpSSSQSEE
SDLGEGGK703
689S
Trp
3631.71
683GQFVVLSSpSQSEESDLGEGGKKRE
706
691S
Glu C
2633.24
683GQFVVLSSSQpSEEpSDLGEGGKKRE
706
693S, 696S
Glu C
2713.24
37
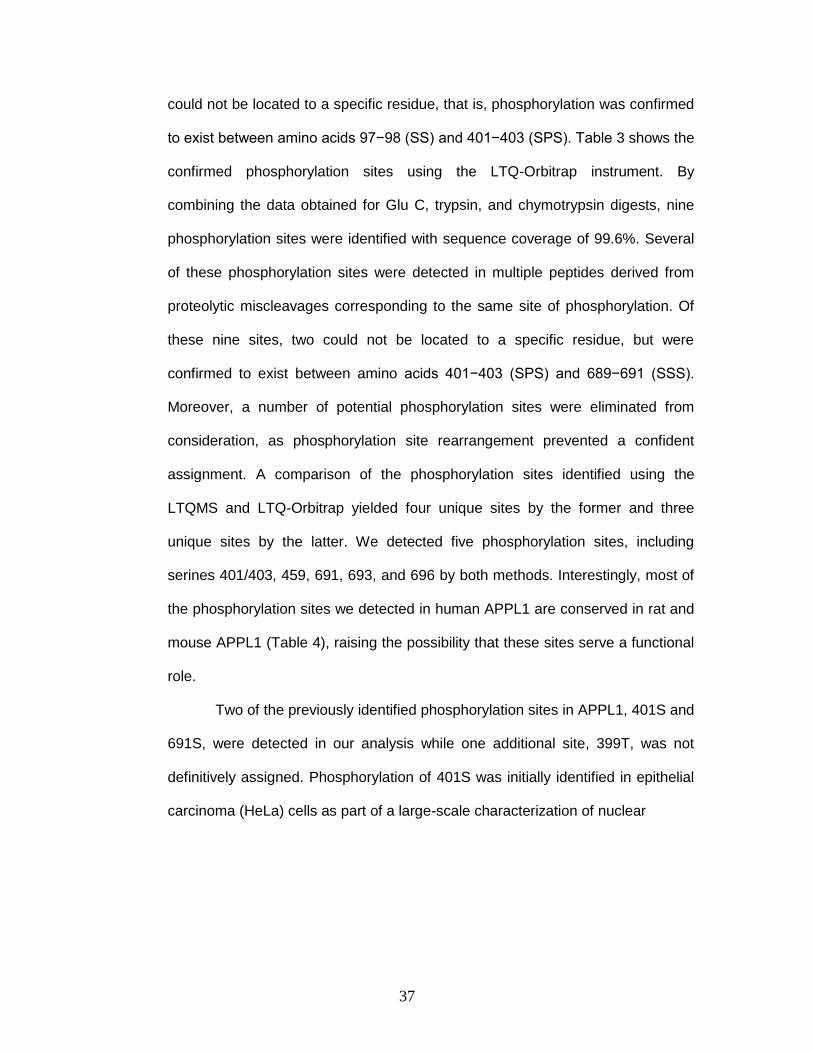
could not be located to a specific residue, that is, phosphorylation was confirmed
to exist between amino acids 97−98 (SS) and 401−403 (SPS). Table 3 shows the
confirmed phosphorylation sites using the LTQ-Orbitrap instrument. By
combining the data obtained for Glu C, trypsin, and chymotrypsin digests, nine
phosphorylation sites were identified with sequence coverage of 99.6%. Several
of these phosphorylation sites were detected in multiple peptides derived from
proteolytic miscleavages corresponding to the same site of phosphorylation. Of
these nine sites, two could not be located to a specific residue, but were
confirmed to exist between amino acids 401−403 (SPS) and 689−691 (SSS).
Moreover, a number of potential phosphorylation sites were eliminated from
consideration, as phosphorylation site rearrangement prevented a confident
assignment. A comparison of the phosphorylation sites identified using the
LTQMS and LTQ-Orbitrap yielded four unique sites by the former and three
unique sites by the latter. We detected five phosphorylation sites, including
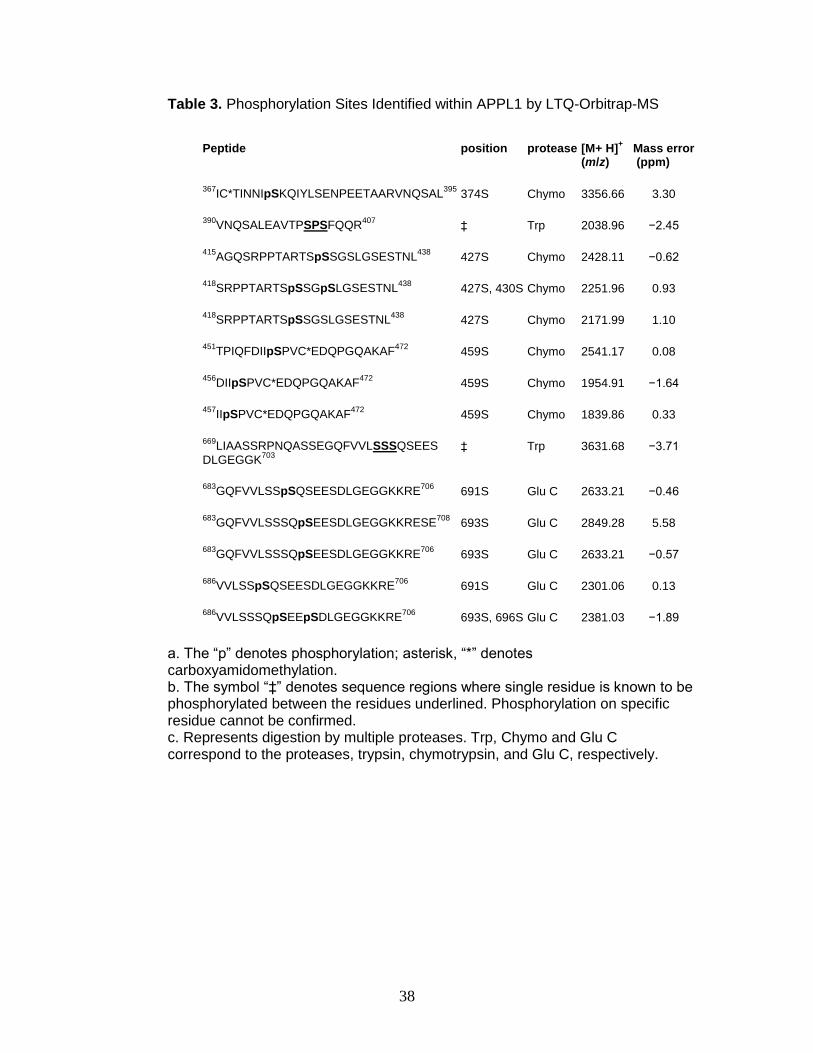
serines 401/403, 459, 691, 693, and 696 by both methods. Interestingly, most of
the phosphorylation sites we detected in human APPL1 are conserved in rat and
mouse APPL1 (Table 4), raising the possibility that these sites serve a functional
role.
Two of the previously identified phosphorylation sites in APPL1, 401S and
691S, were detected in our analysis while one additional site, 399T, was not
definitively assigned. Phosphorylation of 401S was initially identified in epithelial
carcinoma (HeLa) cells as part of a large-scale characterization of nuclear
38
Table 3. Phosphorylation Sites Identified within APPL1 by LTQ-Orbitrap-MS
a. The “p” denotes phosphorylation; asterisk, “*” denotes carboxyamidomethylation. b. The symbol “‡” denotes sequence regions where single residue is known to be phosphorylated between the residues underlined. Phosphorylation on specific residue cannot be confirmed. c. Represents digestion by multiple proteases. Trp, Chymo and Glu C correspond to the proteases, trypsin, chymotrypsin, and Glu C, respectively.
Peptide
position
protease
[M+ H]
+
(m/z)
Mass error (ppm)
367IC*TINNIpSKQIYLSENPEETAARVNQSAL
395 374S
Chymo
3356.66
3.30
390VNQSALEAVTPSPSFQQR
407
‡
Trp
2038.96
−2.45
415AGQSRPPTARTSpSSGSLGSESTNL
438
427S
Chymo
2428.11
−0.62
418SRPPTARTSpSSGpSLGSESTNL
438
427S, 430S
Chymo
2251.96
0.93
418SRPPTARTSpSSGSLGSESTNL
438
427S
Chymo
2171.99
1.10
451TPIQFDIIpSPVC*EDQPGQAKAF
472
459S
Chymo
2541.17
0.08
456DIIpSPVC*EDQPGQAKAF
472
459S
Chymo
1954.91
−1.64
457IIpSPVC*EDQPGQAKAF
472
459S
Chymo
1839.86
0.33
669LIAASSRPNQASSEGQFVVLSSSQSEES
DLGEGGK703
‡
Trp
3631.68
−3.71
683GQFVVLSSpSQSEESDLGEGGKKRE
706
691S
Glu C
2633.21
−0.46
683GQFVVLSSSQpSEESDLGEGGKKRESE
708
693S
Glu C
2849.28
5.58
683GQFVVLSSSQpSEESDLGEGGKKRE
706
693S
Glu C
2633.21
−0.57
686VVLSSpSQSEESDLGEGGKKRE
706
691S
Glu C
2301.06
0.13
686VVLSSSQpSEEpSDLGEGGKKRE
706
693S, 696S
Glu C
2381.03
−1.89
39
Table 4. Comparison of Peptide Sequence Surrounding Identified Phosphorylation Sites in APPL1
a. The symbol “‡” denotes sequence regions where single residue is known to be phosphorylated between the residues underlined. Phosphorylation on specific residue on those regions cannot be confirmed.
40
phosphoproteins and in an analysis of protein phosphorylation in developing
mice brains.86, 87 This site was subsequently shown to be phosphorylated in HeLa
cells in two additional studies.84, 85 Phosphorylation of 691S was detected in
HEK-293 cells in response to DNA damage using ionizing radiation.19 We also
identified phosphorylation of this site in HEK 293 cells under physiological
conditions. Phosphorylation at 399T was identified in a global profiling study,84
but a positive identification could not be definitively made in our experiments. Our
spectra potentially suggested phosphorylation at 399T, but in these spectra, this
site was not the highest confidence assignment. Furthermore, the previous study
examined protein phosphorylation during mitosis using HeLa cells arrested in the
mitotic phase of the cell cycle while our analysis was performed in HEK-293 cells
under conditions in which they were progressing through the cell cycle. Thus, it is
possible that phosphorylation of this site is transient if it is regulated by cell cycle
progression and difficult to detect.
2.3.2 Phosphorylation sites within APPL1 functional domains
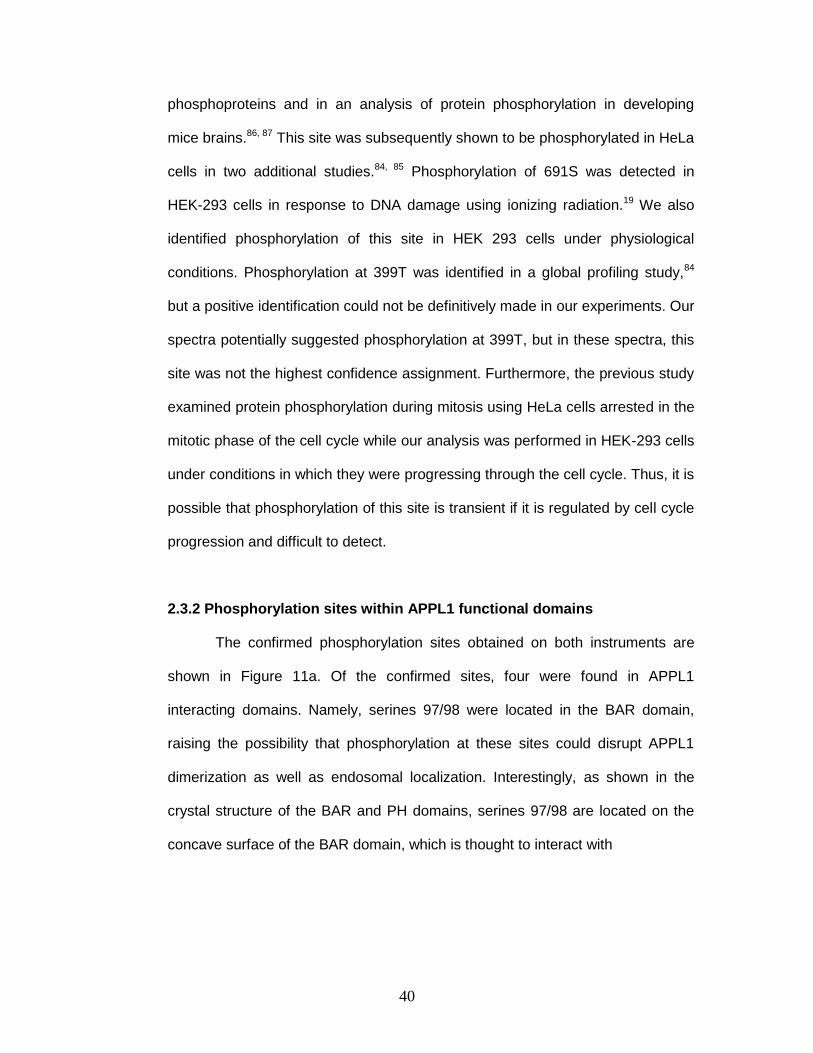
The confirmed phosphorylation sites obtained on both instruments are
shown in Figure 11a. Of the confirmed sites, four were found in APPL1
interacting domains. Namely, serines 97/98 were located in the BAR domain,
raising the possibility that phosphorylation at these sites could disrupt APPL1
dimerization as well as endosomal localization. Interestingly, as shown in the
crystal structure of the BAR and PH domains, serines 97/98 are located on the
concave surface of the BAR domain, which is thought to interact with
41
Figure 11. a) Phosphorylation sites identified in APPL1, using LTQMS and LTQ-Orbitrap MS. Underlined sites indicate that one phosphorylation is known to exist within the region. b) A schematic of APPL1 is shown with identified phosphorylation sites relative to the position of APPL1 domains. Interacting regions within APPL1 for several proteins and receptors are also indicated.
42
membranes (Figure 11b).92, 102
Therefore, phosphorylation at this site could potentially regulate
membrane interactions. Serine 374 and tyrosine 378 are clustered near the edge
of the PH domain (Figure 11b), suggesting a potential link to APPL1 localization.
Collectively, these sites in the BAR and PH domains may contribute to altered
APPL1 binding to Rab5, since together these domains are important for this
interaction. Finally, tyrosine 604 was found in the PTB domain, which is typically
involved in protein−protein interactions, and phosphorylation in this domain may
regulate the ability of APPL1 to bind to its interacting protein partners.
Interestingly, a significant number of identified phosphorylation sites are found
outside of known domains. Even though these sites are outside described
domains, it does not imply a lack of functional significance. These sites may have
importance in regulating the structure and molecular interactions of APPL1.
2.3.3 Advantages and challenges to contemporary phosphoproteomic methodologies
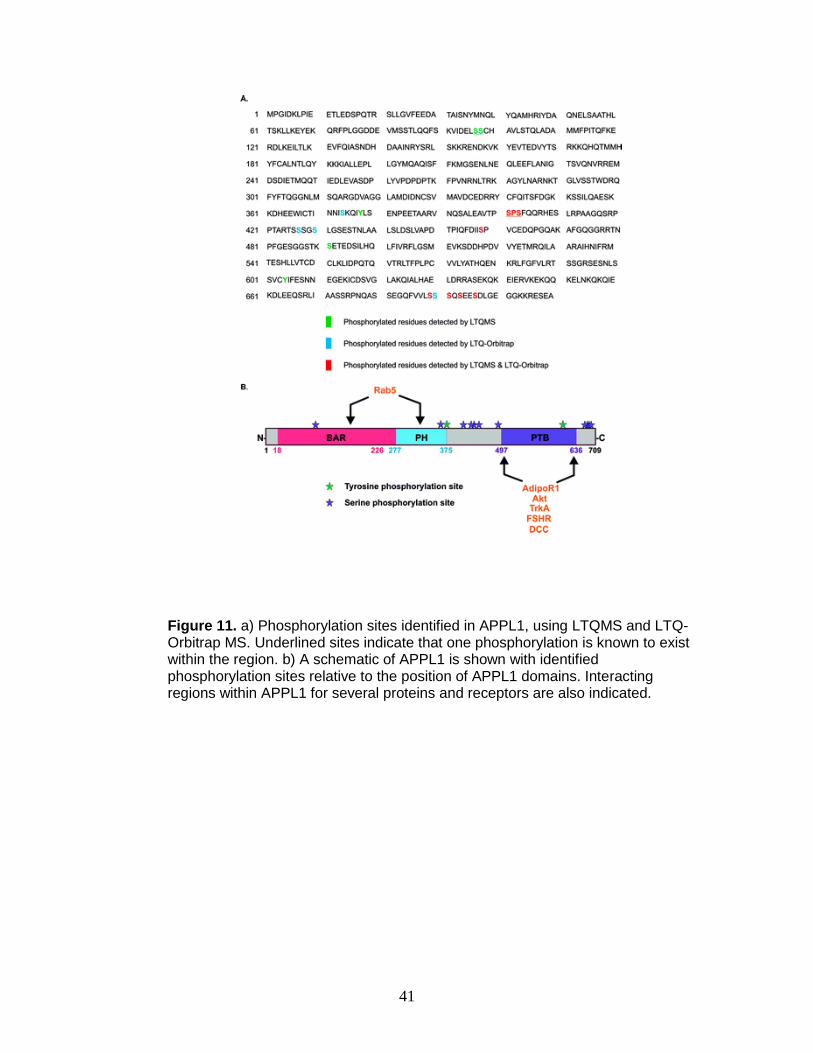
Figures 12 and 13 demonstrate the necessity of manual verification and
challenges associated with site identification using bioinformatics analyses. For
example, the peptide in Figure 12, GQFVVLSSSQpSEESDLGEGGKKRE, was
identified correctly, but because the incorrect peak was used as the monoisotopic
peak, the mass error of the precursor ion (−381 ppm) was outside of the
acceptable range (−5 to 5 ppm). Conversely, an example of an erroneous
SEQUEST assignment is shown in Figure 13. Although b and y ion coverage
bracketing the phosphorylation site is sufficient for a high X-corr value and high
43
Figure 12. Tandem MS/MS spectrum acquired using an LTQ-Orbitrap illustrates peak validation for accurate SEQUEST assignments. Inset illustrates a situation whereby the instrument selected the peak at 878.7426 as the monoisotopic peak resulting in erroneous mass accuracy (−381 ppm). Manual validation of the data correctly assigns the accurate monoisotopic peak at 878.4084 resulting in a mass accuracy for the parent species of 0.56 ppm.
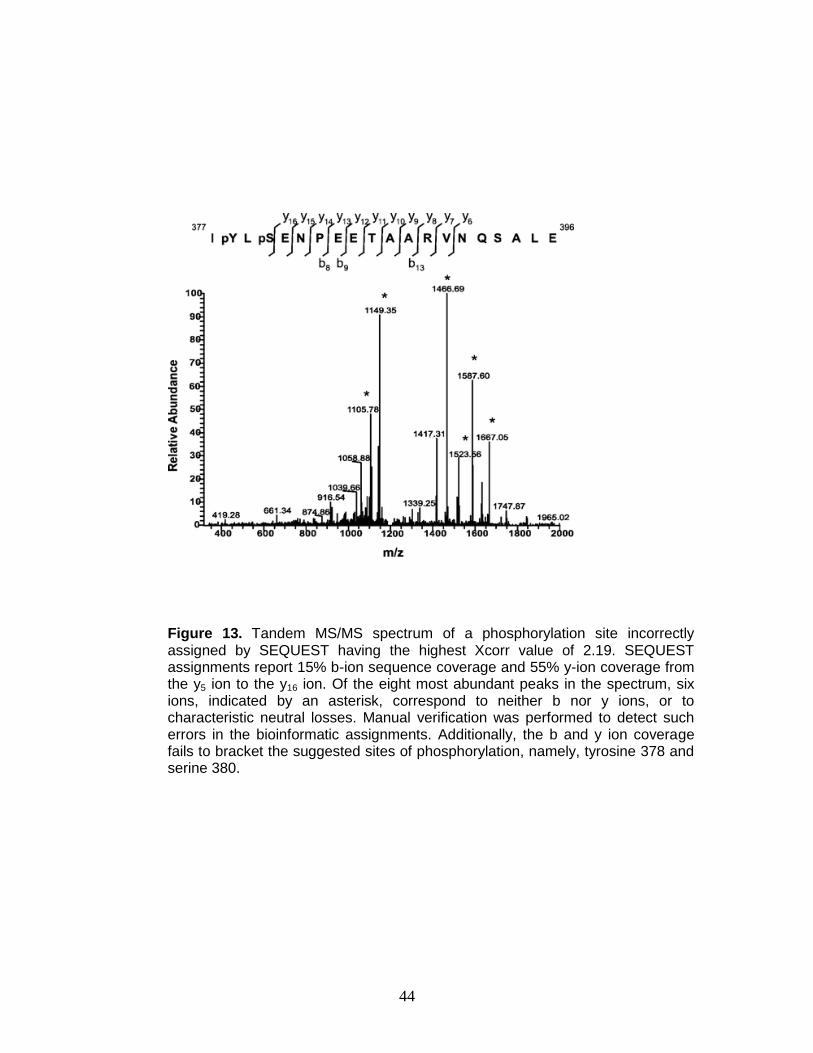
44
Figure 13. Tandem MS/MS spectrum of a phosphorylation site incorrectly assigned by SEQUEST having the highest Xcorr value of 2.19. SEQUEST assignments report 15% b-ion sequence coverage and 55% y-ion coverage from the y5 ion to the y16 ion. Of the eight most abundant peaks in the spectrum, six ions, indicated by an asterisk, correspond to neither b nor y ions, or to characteristic neutral losses. Manual verification was performed to detect such errors in the bioinformatic assignments. Additionally, the b and y ion coverage fails to bracket the suggested sites of phosphorylation, namely, tyrosine 378 and serine 380.
45
sequence coverage confidence, high abundance peaks do not correspond to b
and y ions or their respective neutral losses. Collectively, these examples and
ambiguity arising from gas-phase rearrangement illustrate the continuing need to
validate sequencing data in phosphorylation site mapping experiments.24, 25
Phosphorylation site validation is challenging for a number of reasons,
including low stoichiometries and co-elution of these low abundant peptides with
more abundant and easily ionized peptides. Furthermore, though the objective of
phosphorylation site discovery was met for characterization of APPL1, significant
laborious manual interpretation, validation, and confirmation were needed.
Moreover, due to the challenges associated with site discovery, quantitative
information is typically not gained in the same experiment, requiring additional
time and resources to complete a full characterization. Thus the need for a more
selective and rapid strategy for online separation of phosphorylated peptides to
facilitate protein phosphorylation characterization is evident.
2.4 Conclusion
Emerging data indicate an important role for APPL1 in regulating various
cellular processes, such as cell proliferation, apoptosis, and survival, which
points to a need to gain insight in to the regulation of this protein. Since
phosphorylation is an important regulatory mechanism, we generated a
comprehensive map of phosphorylation sites within APPL1. We
46
detected 13 phosphorylation sites within APPL1, with four of these being
identified in functional domains. These sites have potential implications in
regulating APPL1 function and interactions, which represents an important
avenue for future study. A number of challenges exist in determining the sites of
modification for an uncharacterized protein, such as coelution, reversible
phosphorylation, phosphorylation site rearrangement, and the impracticality of
performing quantitation in the same experiment. Lanthanide-based
phosphorylation-specific labeling is introduced in the following chapters, which
circumvents many of the challenges encountered in traditional data-dependent
protein phosphorylation characterization.
2.5 Acknowledgements
I would like to thank Donna J. Webb and Joshua A. Broussard for their
work in expression and purification of APPL1, and for their assistance in
interpretation of the results and their impact on our understanding of the
interactions of APPL1. I would also like to thank Hayes McDonald, Amy Ham,
and Salisha Hill of the Vanderbilt Proteomics Core for assistance and helpful
discussions. This work was supported by the Vanderbilt University College of
Arts and Sciences, the Vanderbilt Institute for Chemical Biology, the Vanderbilt
Institute of Integrative Biosystems Research and Education, the American
Society for Mass Spectrometry (Research Award to J.A.M.).
47
CHAPTER 3
SIMULTANEOUS RELATIVE QUANTITATION AND SITE IDENTIFICATION OF PHOSPHORYLATED PEPTIDES AND PROTEINS USING LANTHANIDE-
BASED LABELING FOR MALDI-TOFMS ANALYSIS
3.1 Introduction
As outlined in Chapter 2, there is a demonstrated need for a
comprehensive protein phosphorylation characterization strategy whereby
phosphorylated peptides are selectively separated from their unphosphorylated
counterparts and sites of phosphorylation are identified and quantitated in the
same experiment. In this chapter, challenges associated with phosphopeptide
quantitation and site identification are addressed.
Current mass spectrometry based strategies for quantifying sites of
protein phosphorylation include stable isotope techniques that take advantage of
mass shifts provided by isotopologues. Challenges associated with isotopologue
quantitative labeling include isotopic overlap of modified peptides of higher mass.
Lanthanide-based labeling strategies allow for greater mass separation than
current isotope-based strategies due to incorporation of lanthanide metals of
greater mass differences (2-36 Da), but have not been previously demonstrated
for selective phosphopeptide quantitation. In this chapter, we demonstrate a
strategy for site identification and relative quantitation of phosphorylated peptides
and proteins using a phosphorylation-specific lanthanide-based labeling strategy.
Because the chemistry is specific for phosphorylation, we term this labeling
strategy Phosphopeptide-Element Coded Affinity Tagging, or PhECAT. In this
benchmarking report, phosphorylated peptides are selectively modified at the
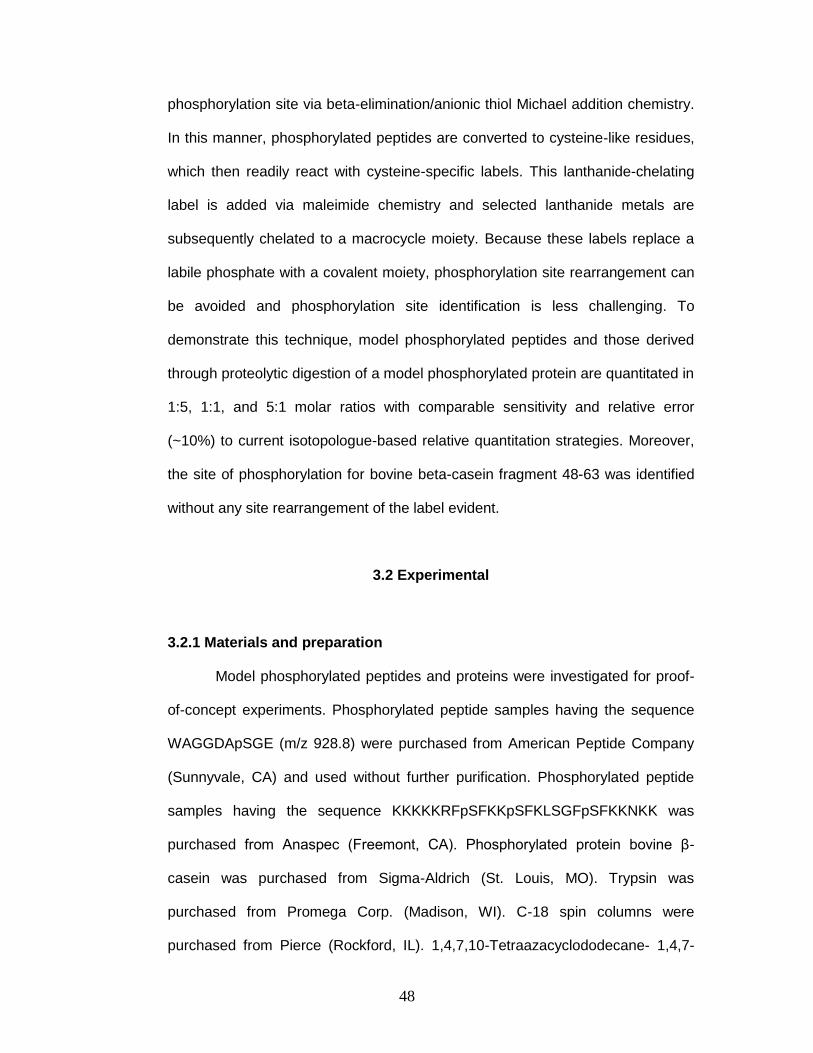
48
phosphorylation site via beta-elimination/anionic thiol Michael addition chemistry.
In this manner, phosphorylated peptides are converted to cysteine-like residues,
which then readily react with cysteine-specific labels. This lanthanide-chelating
label is added via maleimide chemistry and selected lanthanide metals are
subsequently chelated to a macrocycle moiety. Because these labels replace a
labile phosphate with a covalent moiety, phosphorylation site rearrangement can
be avoided and phosphorylation site identification is less challenging. To
demonstrate this technique, model phosphorylated peptides and those derived
through proteolytic digestion of a model phosphorylated protein are quantitated in
1:5, 1:1, and 5:1 molar ratios with comparable sensitivity and relative error
(~10%) to current isotopologue-based relative quantitation strategies. Moreover,
the site of phosphorylation for bovine beta-casein fragment 48-63 was identified
without any site rearrangement of the label evident.
3.2 Experimental
3.2.1 Materials and preparation
Model phosphorylated peptides and proteins were investigated for proof-
of-concept experiments. Phosphorylated peptide samples having the sequence
WAGGDApSGE (m/z 928.8) were purchased from American Peptide Company
(Sunnyvale, CA) and used without further purification. Phosphorylated peptide
samples having the sequence KKKKKRFpSFKKpSFKLSGFpSFKKNKK was
purchased from Anaspec (Freemont, CA). Phosphorylated protein bovine β-
casein was purchased from Sigma-Aldrich (St. Louis, MO). Trypsin was
purchased from Promega Corp. (Madison, WI). C-18 spin columns were
purchased from Pierce (Rockford, IL). 1,4,7,10-Tetraazacyclododecane- 1,4,7-
49
tris- acetic acid-1-maleimidoethylacetamide, or Maleimido-mono-amide-DOTA
was purchased from Macrocyclics (Dallas, TX) and dissolved in DMSO. 1,2-
ethanedithiol (EDT) was purchased from Fluka (St. Gallen, Switzerland). 2,5-
dihydroxybenzoic acid (DHB) was purchased from Sigma and dissolved in 50%
methanol to a final concentration of 30 mg/mL. Lanthanide metals were
purchased from Strem Chemicals (Newburyport, MA) and dissolved in distilled
deionized water (18 MΩ cm-1) to a final concentration of 25 mg/mL.
Dimethylsulfoxide, acetonitrile, and ethanol were purchased from Sigma.
3.2.2 Digestion of phosphorylated proteins
Proteins were dissolved in ammonium bicarbonate buffer (pH 8.0) and
thermally denatured at 90˚C for 20 minutes and quenched at -20˚C.34 Cysteine-
cysteine bonds and free cysteines were reduced with dithiothreitol (final molarity
of 4 mM) and alkylated with iodoacetamide (final molarity of 20 mM). Proteins
were subsequently digested with trypsin in a 1:40 weight to weight ratio for 16-20
hours at room temperature and purified by C-18 spin columns (Pierce, Rockford,
IL) prior to derivatization.
3.2.3 Selective derivatization of phosphorylated peptides and proteins
Model and tryptic peptides were subjected to a beta-elimination (Figure 14(i))
and anionic thiol Michael addition reaction (Figure 14(ii)) resulting in the selective
elimination of phosphoric acid followed by addition of ethanedithiol. In this
reaction, each sample was derivatized in a reaction mixture containing 2.5 mM
EDTA, 0.2 M ethanedithiol, 0.5 M NaOH, 1.5 M acetonitrile, 1.5 M ethanol, 5 M
DMSO, and water for 1-2 hrs under nitrogen at 55ºC in a manner similar to
50
Figure 14. Reaction scheme for PhECAT (i) Phosphoric acid is removed via Beta-elimination in basic conditions (ii) Ethanedithiol is subsequently added to the conjugated diene via anionic thiol Michael addition (iii) The remaining free thiol is attached to the macrocylic via maleimide chemistry (iv)Finally, lanthanides are chelated to the macrocyclic portion of the tag.
51
reaction conditions described previously.79, 103, 104 This resulted in conversion of
phosphorylated serine and threonine into dehydroalanine or dehydroaminobutyric
acid, respectively. The samples were then neutralized and purified by gel
filtration (Sephadex G-10, Sigma) and reaction completion was confirmed by
MALDI-TOFMS. Subsequently, the thiolated peptides were labeled with a 10-fold
excess of maleimido-DOTA (Figure 14(iii)) in a mixture containing acetate buffer
(pH 5.5) and DMSO in 1:1 ratio (v/v), resulting in a covalent bond between the
free sulfhydryl group and the maleimide portion of the lanthanide-based tag.
Finally, selected lanthanide metals were chelated to the maleimide portion of the
tag by adding a 100-fold molar excess of metal to peptide and heating to 80ºC for
45 minutes (Figure 14(iv)). Differentially labeled samples were then combined
and purified by C-18 spin columns and analyzed using MALDI-TOFMS.
3.2.4 Instrumentation and data analysis
Spectra were obtained using a Voyager-DE STR (Applied Biosystems,
Inc.) MALDI-TOFMS instrument in the delayed extraction (DE), positive, reflector
mode. MALDI matrix preparation consisted of 2,5-dihydroxybenzoic acid (DHB)
in 50% methanol. The samples were spotted using the dried-droplet method.
Data analysis was performed using Data Explorer software version 4.3 (Applied
Biosystems, Foster City, CA). At least 3 trials were analyzed for each relative
quantitation experiment. Spectra were acquired by rastering the MALDI laser at
random over the entire matrix spot. Relative molar amounts were calculated by
dividing the relative peak area of the derivatized state 1 by the relative peak area
of derivatized state 2.
Fragmentation of the labeled phosphorylated peptides and proteins were
performed on a Waters Synapt© HDMS (Waters, Inc. Milford, MA) instrument
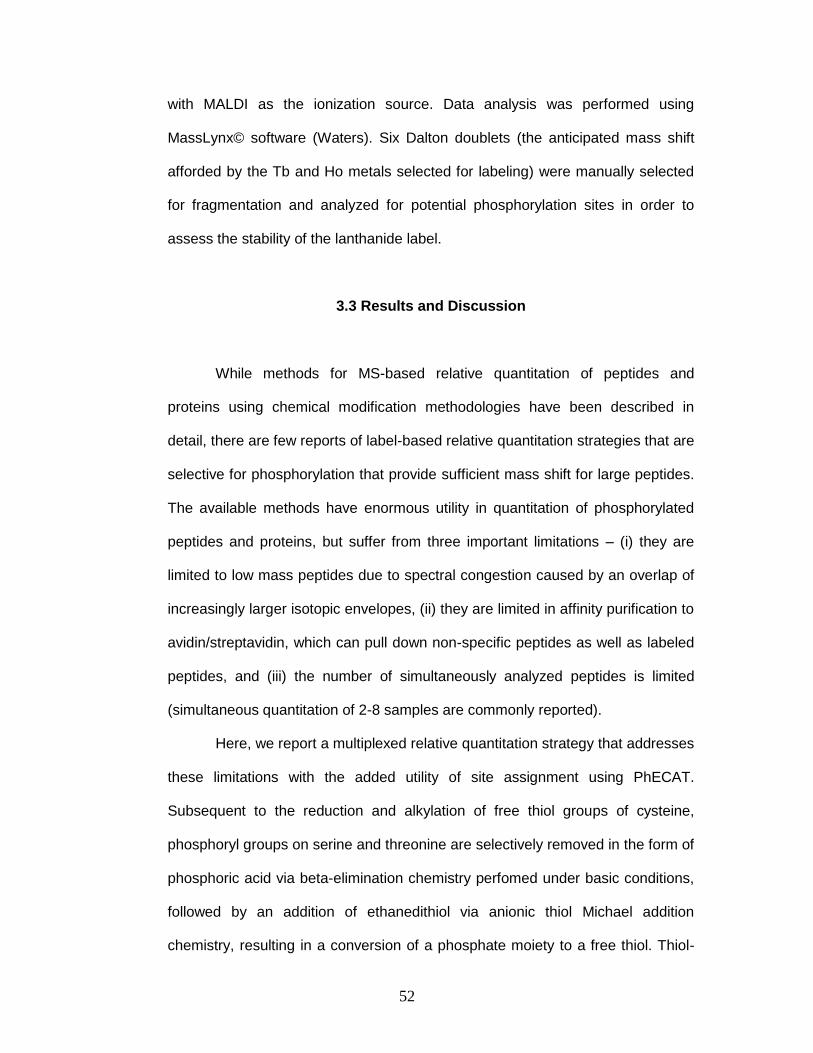
52
with MALDI as the ionization source. Data analysis was performed using
MassLynx© software (Waters). Six Dalton doublets (the anticipated mass shift
afforded by the Tb and Ho metals selected for labeling) were manually selected
for fragmentation and analyzed for potential phosphorylation sites in order to
assess the stability of the lanthanide label.
3.3 Results and Discussion
While methods for MS-based relative quantitation of peptides and
proteins using chemical modification methodologies have been described in
detail, there are few reports of label-based relative quantitation strategies that are
selective for phosphorylation that provide sufficient mass shift for large peptides.
The available methods have enormous utility in quantitation of phosphorylated
peptides and proteins, but suffer from three important limitations – (i) they are
limited to low mass peptides due to spectral congestion caused by an overlap of
increasingly larger isotopic envelopes, (ii) they are limited in affinity purification to
avidin/streptavidin, which can pull down non-specific peptides as well as labeled
peptides, and (iii) the number of simultaneously analyzed peptides is limited
(simultaneous quantitation of 2-8 samples are commonly reported).
Here, we report a multiplexed relative quantitation strategy that addresses
these limitations with the added utility of site assignment using PhECAT.
Subsequent to the reduction and alkylation of free thiol groups of cysteine,
phosphoryl groups on serine and threonine are selectively removed in the form of
phosphoric acid via beta-elimination chemistry perfomed under basic conditions,
followed by an addition of ethanedithiol via anionic thiol Michael addition
chemistry, resulting in a conversion of a phosphate moiety to a free thiol. Thiol-
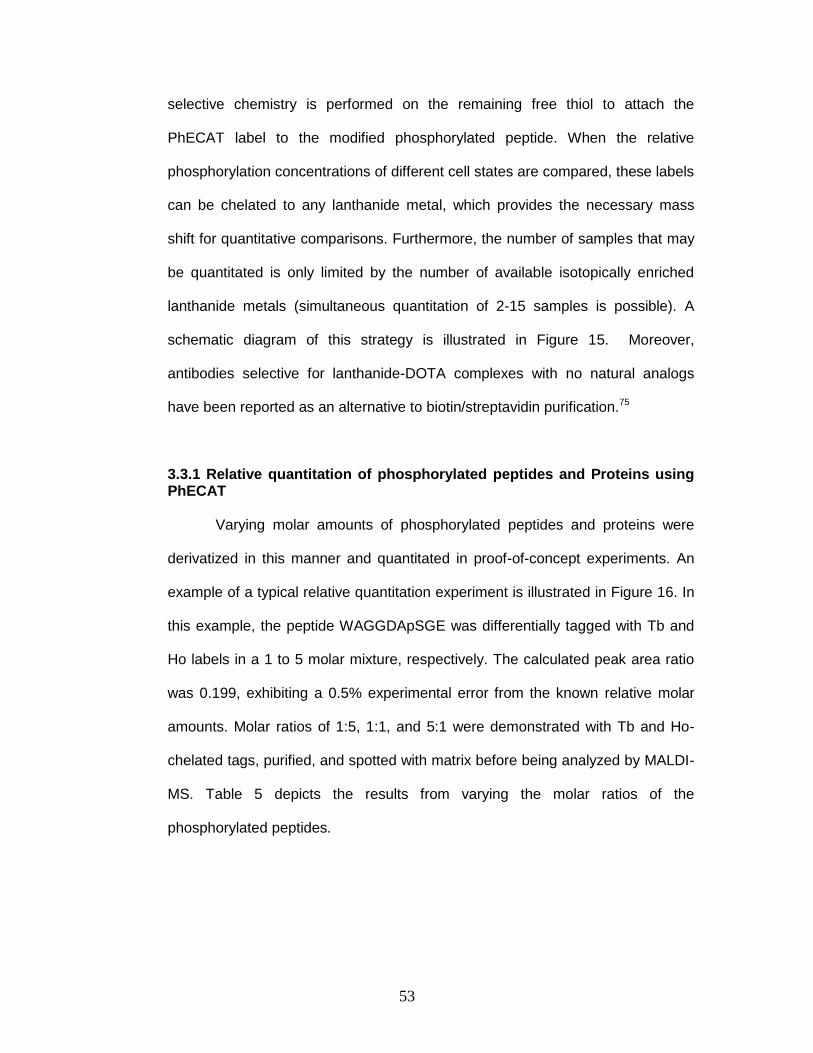
53
selective chemistry is performed on the remaining free thiol to attach the
PhECAT label to the modified phosphorylated peptide. When the relative
phosphorylation concentrations of different cell states are compared, these labels
can be chelated to any lanthanide metal, which provides the necessary mass
shift for quantitative comparisons. Furthermore, the number of samples that may
be quantitated is only limited by the number of available isotopically enriched
lanthanide metals (simultaneous quantitation of 2-15 samples is possible). A
schematic diagram of this strategy is illustrated in Figure 15. Moreover,
antibodies selective for lanthanide-DOTA complexes with no natural analogs
have been reported as an alternative to biotin/streptavidin purification.75
3.3.1 Relative quantitation of phosphorylated peptides and Proteins using PhECAT
Varying molar amounts of phosphorylated peptides and proteins were
derivatized in this manner and quantitated in proof-of-concept experiments. An
example of a typical relative quantitation experiment is illustrated in Figure 16. In
this example, the peptide WAGGDApSGE was differentially tagged with Tb and
Ho labels in a 1 to 5 molar mixture, respectively. The calculated peak area ratio
was 0.199, exhibiting a 0.5% experimental error from the known relative molar
amounts. Molar ratios of 1:5, 1:1, and 5:1 were demonstrated with Tb and Ho-
chelated tags, purified, and spotted with matrix before being analyzed by MALDI-
MS. Table 5 depicts the results from varying the molar ratios of the
phosphorylated peptides.
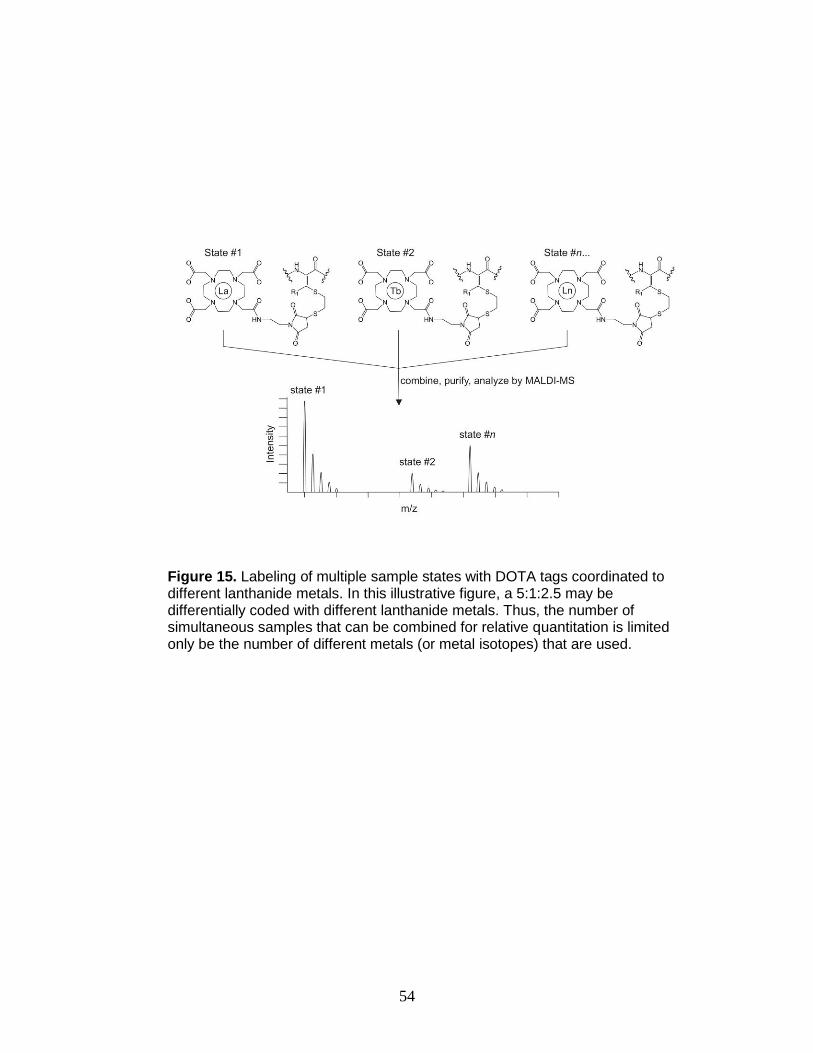
54
Figure 15. Labeling of multiple sample states with DOTA tags coordinated to different lanthanide metals. In this illustrative figure, a 5:1:2.5 may be differentially coded with different lanthanide metals. Thus, the number of simultaneous samples that can be combined for relative quantitation is limited only be the number of different metals (or metal isotopes) that are used.
55
Figure 16. The phosphorylated peptide having the sequence WAGGDApSGE was derivatized in the manner previously described. The full scan m/z is shown. Although there are several minor peaks associated with excess labeling reagent, the labeled peptide is the dominant peak in this spectrum. (Inset) Relative quantitation between Tb and Ho labeled peptides having a molar ratio of 1:5, respectively. The measured peak areas were 1898.93 and 9529.45 for Tb and Ho, respectively, resulting in a calculated molar ratio of 0.199.
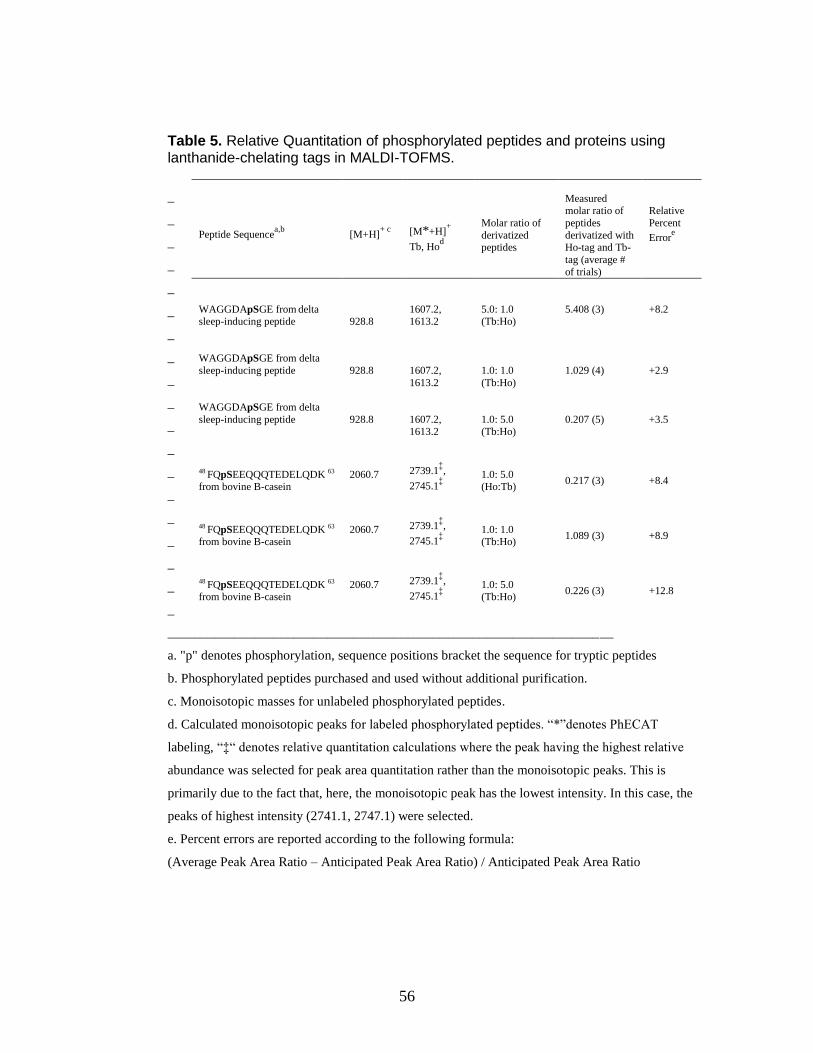
56
Table 5. Relative Quantitation of phosphorylated peptides and proteins using lanthanide-chelating tags in MALDI-TOFMS.
_
_
_
_
_
_
_
_
_
_
_
_
_
_
_
_
_
_
_
___________________________________________________________________
a. "p" denotes phosphorylation, sequence positions bracket the sequence for tryptic peptides
b. Phosphorylated peptides purchased and used without additional purification.
c. Monoisotopic masses for unlabeled phosphorylated peptides.
d. Calculated monoisotopic peaks for labeled phosphorylated peptides. “*”denotes PhECAT
labeling, “‡“ denotes relative quantitation calculations where the peak having the highest relative
abundance was selected for peak area quantitation rather than the monoisotopic peaks. This is
primarily due to the fact that, here, the monoisotopic peak has the lowest intensity. In this case, the
peaks of highest intensity (2741.1, 2747.1) were selected.
e. Percent errors are reported according to the following formula:
(Average Peak Area Ratio – Anticipated Peak Area Ratio) / Anticipated Peak Area Ratio
Peptide Sequencea,b
[M+H]+ c
[M*+H]+
Tb, Hod
Molar ratio of
derivatized peptides
Measured molar ratio of
peptides
derivatized with Ho-tag and Tb-
tag (average #
of trials)
Relative
Percent
Errore
WAGGDApSGE from delta sleep-inducing peptide
928.8
1607.2, 1613.2
5.0: 1.0 (Tb:Ho)
5.408 (3)
+8.2
WAGGDApSGE from delta
sleep-inducing peptide
928.8
1607.2,
1613.2
1.0: 1.0
(Tb:Ho)
1.029 (4)
+2.9
WAGGDApSGE from delta
sleep-inducing peptide
928.8
1607.2, 1613.2
1.0: 5.0 (Tb:Ho)
0.207 (5)
+3.5
48 FQpSEEQQQTEDELQDK 63 from bovine B-casein
2060.7
2739.1‡,
2745.1‡
1.0: 5.0 (Ho:Tb)
0.217 (3)
+8.4
48 FQpSEEQQQTEDELQDK 63 from bovine B-casein
2060.7
2739.1‡,
2745.1‡
1.0: 1.0 (Tb:Ho)
1.089 (3)
+8.9
48 FQpSEEQQQTEDELQDK 63 from bovine B-casein
2060.7
2739.1‡,
2745.1‡
1.0: 5.0 (Tb:Ho)
0.226 (3)
+12.8
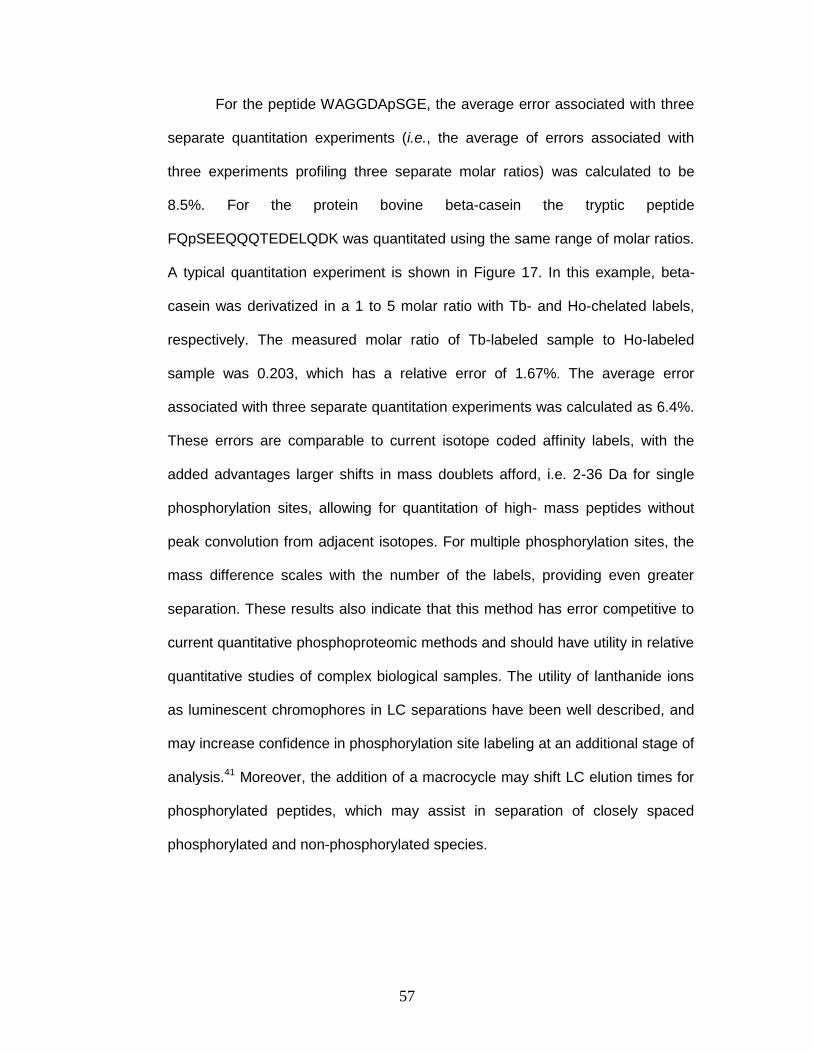
57
For the peptide WAGGDApSGE, the average error associated with three
separate quantitation experiments (i.e., the average of errors associated with
three experiments profiling three separate molar ratios) was calculated to be
8.5%. For the protein bovine beta-casein the tryptic peptide
FQpSEEQQQTEDELQDK was quantitated using the same range of molar ratios.
A typical quantitation experiment is shown in Figure 17. In this example, beta-
casein was derivatized in a 1 to 5 molar ratio with Tb- and Ho-chelated labels,
respectively. The measured molar ratio of Tb-labeled sample to Ho-labeled
sample was 0.203, which has a relative error of 1.67%. The average error
associated with three separate quantitation experiments was calculated as 6.4%.
These errors are comparable to current isotope coded affinity labels, with the
added advantages larger shifts in mass doublets afford, i.e. 2-36 Da for single
phosphorylation sites, allowing for quantitation of high- mass peptides without
peak convolution from adjacent isotopes. For multiple phosphorylation sites, the
mass difference scales with the number of the labels, providing even greater
separation. These results also indicate that this method has error competitive to
current quantitative phosphoproteomic methods and should have utility in relative
quantitative studies of complex biological samples. The utility of lanthanide ions
as luminescent chromophores in LC separations have been well described, and
may increase confidence in phosphorylation site labeling at an additional stage of
analysis.41 Moreover, the addition of a macrocycle may shift LC elution times for
phosphorylated peptides, which may assist in separation of closely spaced
phosphorylated and non-phosphorylated species.
58
Figure 17. Bovine beta-casein was derivatized in the manner previously described. The full m/z is shown. In addition to standard digest peaks (tryptic beta-casein peptides), the labeled phosphorylated peptide having the sequence FQpSEEQQQTEDELQDK is observed, and is one of the dominant peaks in this spectrum. (Inset) Relative quantitation between a 1:5 molar mixture of Tb and Ho labeled beta-casein. The measured peak areas are 455.77 and 2241.51 for Tb and Ho, respectively, resulting in a calculated molar ratio of 0.2039.
59
3.3.2 Fragmentation and phosphorylation site identification
PhECAT labeled peptides were examined by tandem MS to evaluate the
utility of these tags for phosphorylation site-identification. An example of a typical
tandem spectrum is shown in Figure 18. The expected b/y series ions were
observed, including full b ion coverage from the b3 to the b15 ion, all labeled and
several unlabeled y ions including y9, y11, and y13-15, and several labeled water
loss ions with little evidence for fragmentation of the label. It should be noted that
all fragment ions covalently bound to the PhECAT label exhibit higher intensities
than unlabeled fragment ions. The stability of this label enables predictable mass
shifts of anticipated b and y ions which gives an indication of the site of
modification previously phosphorylated. Furthermore, because this tag is not
labile and does not show phosphorylation site rearrangement (as is the case with
phosphoric acid and phosphate plus water loss), it has an added advantage of
more confident phosphorylation site assignment.
3.3.3 Challenges in quantitation of phosphorylated threonine.
Beta-elimination/Michael addition of phosphorylated threonine has been
reported to be more challenging due to steric hinderance caused by the
methylated alpha carbon.51 The PhECAT labeling strategy was applied toward
two peptides containing phosphorylated threonine. The peptide containing the
sequence KKALRRQEpTVDAL was incubated for 4 and 6 hours using the
reaction conditions described above. Although beta-elimination reacted to
completion, Michael addition was not achieved to completion. Figure 19
illustrates the minimal impact of increased incubation
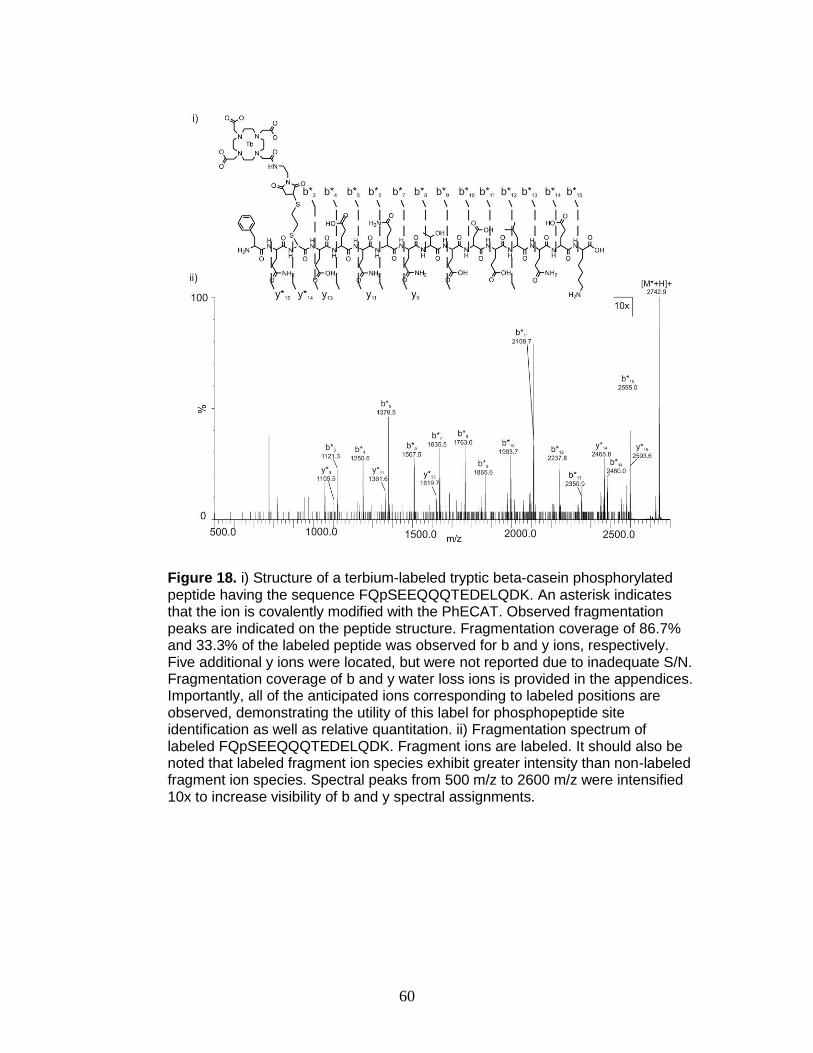
60
Figure 18. i) Structure of a terbium-labeled tryptic beta-casein phosphorylated peptide having the sequence FQpSEEQQQTEDELQDK. An asterisk indicates that the ion is covalently modified with the PhECAT. Observed fragmentation peaks are indicated on the peptide structure. Fragmentation coverage of 86.7% and 33.3% of the labeled peptide was observed for b and y ions, respectively. Five additional y ions were located, but were not reported due to inadequate S/N. Fragmentation coverage of b and y water loss ions is provided in the appendices. Importantly, all of the anticipated ions corresponding to labeled positions are observed, demonstrating the utility of this label for phosphopeptide site identification as well as relative quantitation. ii) Fragmentation spectrum of labeled FQpSEEQQQTEDELQDK. Fragment ions are labeled. It should also be noted that labeled fragment ion species exhibit greater intensity than non-labeled fragment ion species. Spectral peaks from 500 m/z to 2600 m/z were intensified 10x to increase visibility of b and y spectral assignments.
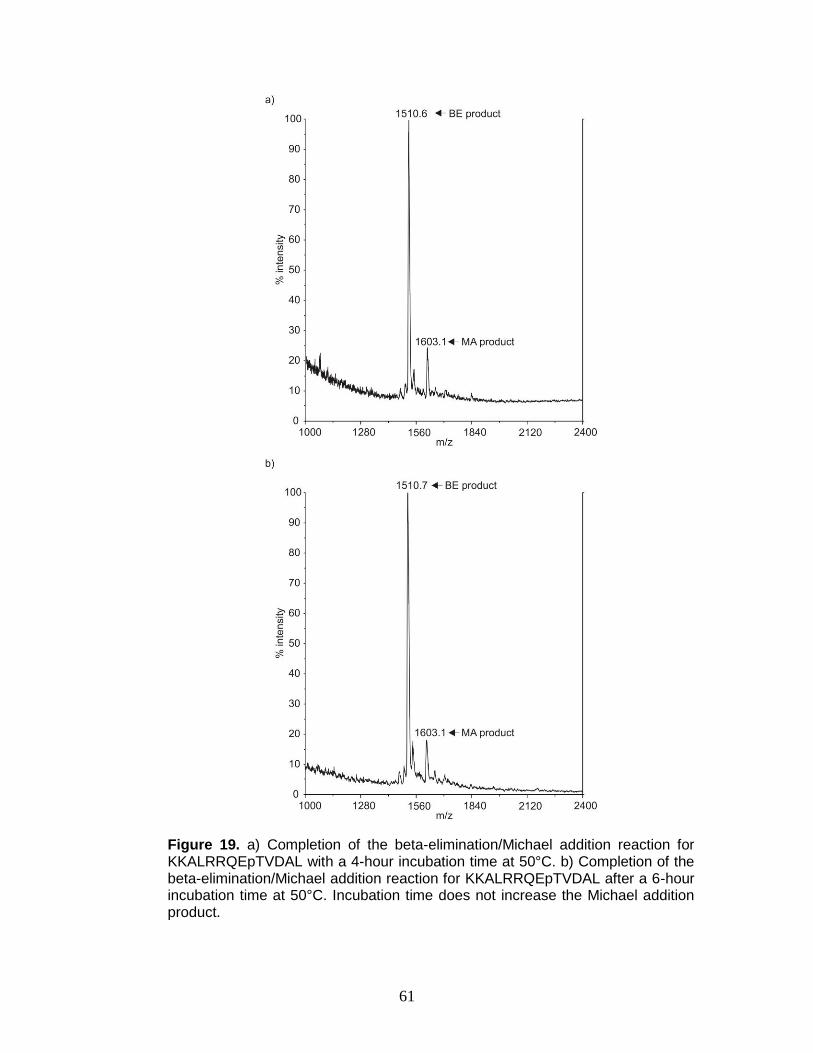
61
Figure 19. a) Completion of the beta-elimination/Michael addition reaction for KKALRRQEpTVDAL with a 4-hour incubation time at 50°C. b) Completion of the beta-elimination/Michael addition reaction for KKALRRQEpTVDAL after a 6-hour incubation time at 50°C. Incubation time does not increase the Michael addition product.
62
time on the Michael addition product. The peptide containing the sequence
LKRApTLG was incubated for 24 hours, resulting in a marginal increase of
Michael addition product (Figure 20). These results are consistent with a report
from Gross and colleagues,51 which describes minimal Michael addition product
increase with respect to increased incubation time (in the Supplementary
Material of Gross, et al). To circumvent this, Gross and colleagues included an
additional separation step between beta-elimination and Michael addition,
transforming the chemistry from a one-pot to a two-pot process. It can be
reasoned that even though phosphorylated threonine generates a low yield of
labeled product, the relative quantitation of phosphorylated threonine is still
possible to within acceptable error (<10%), and percent yields are expected to
remain consistent between samples with consistent labeling technique.
3.3.4 The role of arginine in phosphorylation site stabilization
Myristoylated Alanine-Rich C Kinase Substrate (MARCKS) peptide
fragment 151-175 (KKKKKRFpSFKKpSFKLSGFpSFKKNKK) was derivatized in
the manner above and beta-elimination/Michael addition was checked for
completeness. Although this peptide contains three phosphorylated serine
residues, beta-elimination/Michael addition was only observed for one
phosphorylated residue (Figure 21). This is consistent with observations made by
Woods and colleagues,105-107 where observations of non-covalent complexes of
phosphorylated residues and quarternary amines (i.e., arginines) were reported.
It is speculated that the two unlabeled phosphorylation sites form a strong
complex with the excess of quarternary amines in the peptide. Woods, et al.
suggests the addition of aromatic compounds (e.g., hexachlorobenzene) to
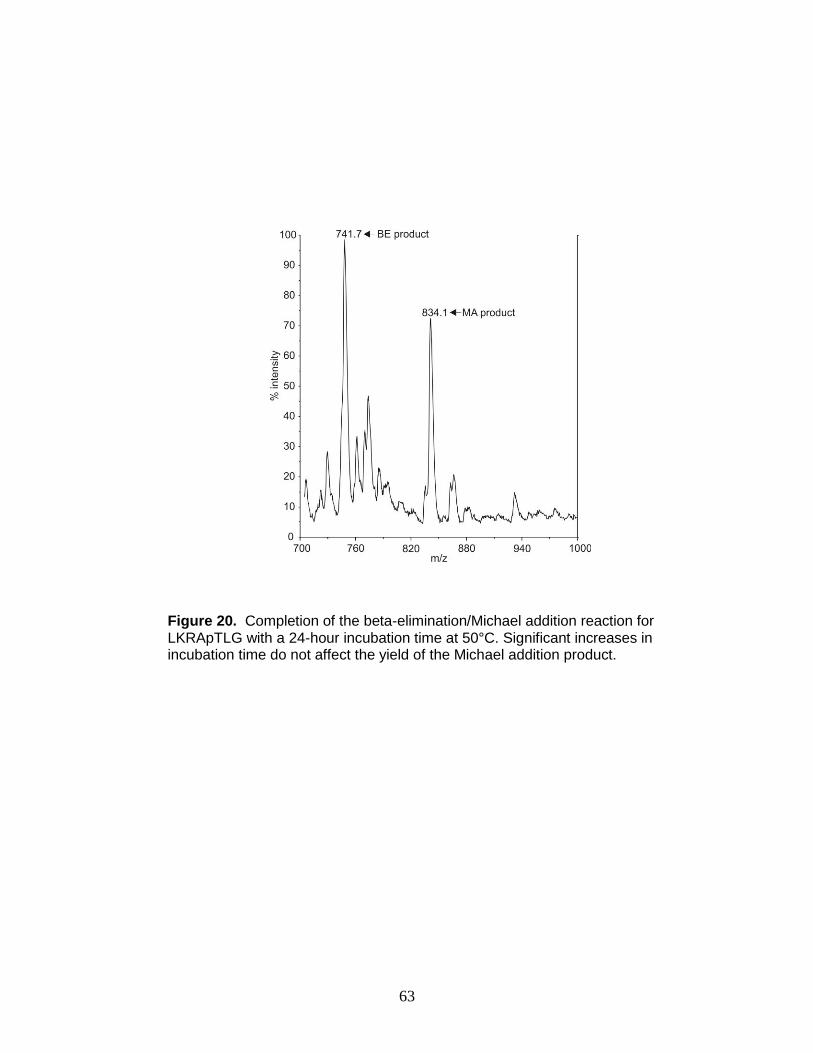
63
Figure 20. Completion of the beta-elimination/Michael addition reaction for LKRApTLG with a 24-hour incubation time at 50°C. Significant increases in incubation time do not affect the yield of the Michael addition product.
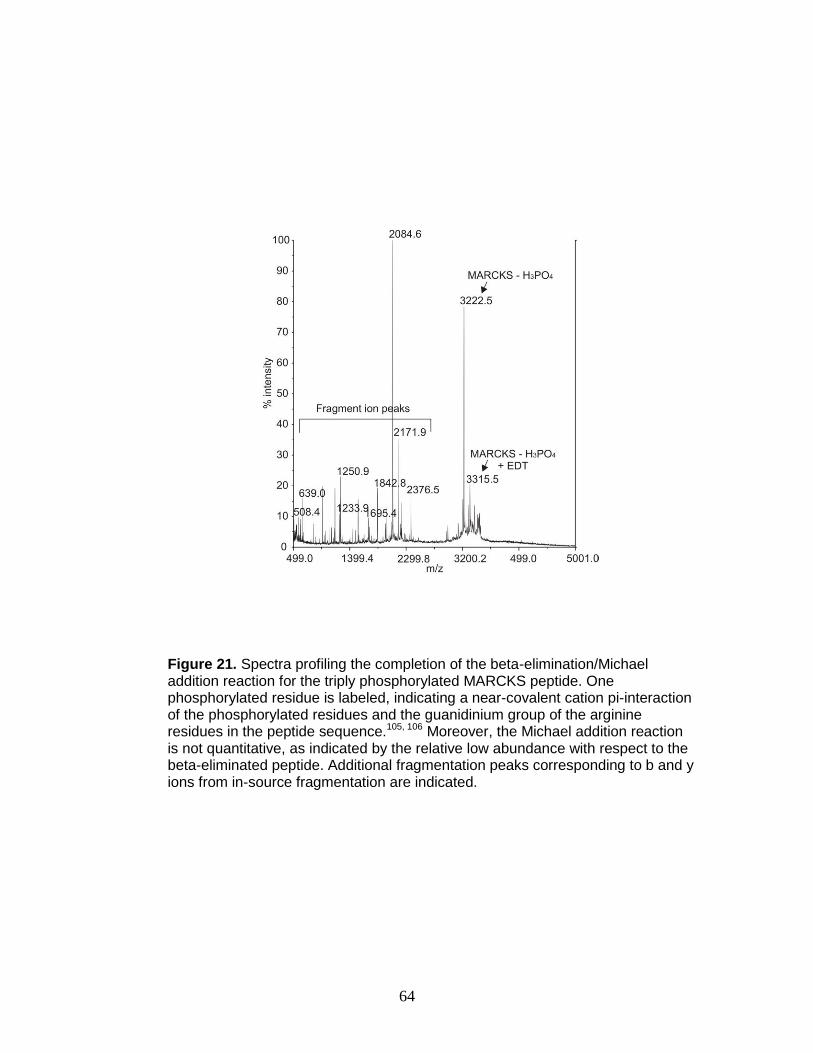
64
Figure 21. Spectra profiling the completion of the beta-elimination/Michael addition reaction for the triply phosphorylated MARCKS peptide. One phosphorylated residue is labeled, indicating a near-covalent cation pi-interaction of the phosphorylated residues and the guanidinium group of the arginine residues in the peptide sequence.105, 106 Moreover, the Michael addition reaction is not quantitative, as indicated by the relative low abundance with respect to the beta-eliminated peptide. Additional fragmentation peaks corresponding to b and y ions from in-source fragmentation are indicated.
65
solution to compete with electrostatic interactions between arginines and
phosphorylation sites. To circumvent unanticipated arginine-phosphorylation
interactions of peptides, peptides that contain arginine should be treated with
aromatic compounds prior to derivatization to ensure that the phosphorylation
site is available for modification.
The solvent-accessible phosphorylated residue on MARCKS was
quantitated using Tb- and Ho-chelated lanthanide labels. A typical quantitation
experiment is shown in Figure 22. In this experiment, a 1 to 3 (Tb to Ho,
respectively) molar mixture was quantitated. For peptides above 3000 Da, a 6-Da
shift was not adequate to resolve the differentially labeled peaks, illustrating the
need for labels to provide larger mass shifts and the utility of lanthanide- based
labels to design quantitative strategies using mass shifts that support the mass of
the peptides of interest.
3.4 Conclusions
Current methods of MS-based protein quantitation primarily focus on
quantifying relative expression profiles through labeling non-post-translationally
modified peptides. This offers a limited view of the biological activity of cells,
because many biological functions are dependent on temporal protein
modifications, specifically, protein phosphorylation. The available methods for
phosphoprotein quantitation provide good specificity for the site of
phosphorylation, however, they have limited applicability for peptides of
increasing mass. In this work, we have demonstrated the utility of PhECAT for
relative quantitation of phosphorylated peptides using
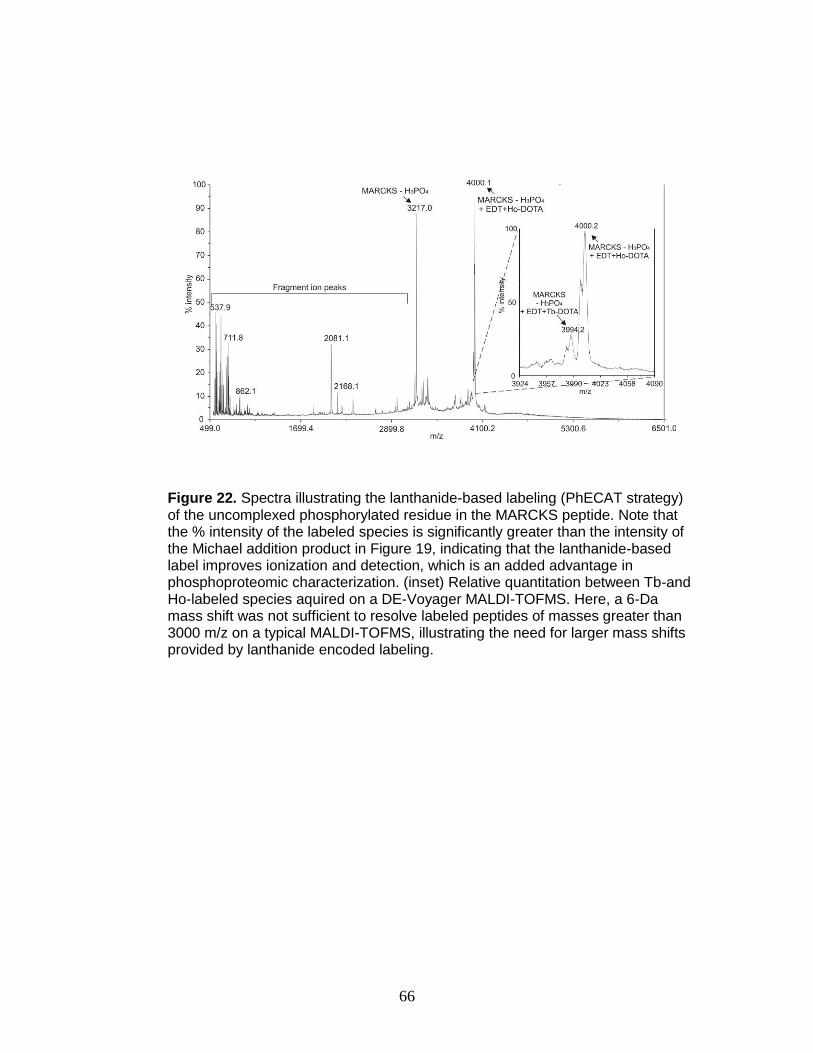
66
Figure 22. Spectra illustrating the lanthanide-based labeling (PhECAT strategy) of the uncomplexed phosphorylated residue in the MARCKS peptide. Note that the % intensity of the labeled species is significantly greater than the intensity of the Michael addition product in Figure 19, indicating that the lanthanide-based label improves ionization and detection, which is an added advantage in phosphoproteomic characterization. (inset) Relative quantitation between Tb-and Ho-labeled species aquired on a DE-Voyager MALDI-TOFMS. Here, a 6-Da mass shift was not sufficient to resolve labeled peptides of masses greater than 3000 m/z on a typical MALDI-TOFMS, illustrating the need for larger mass shifts provided by lanthanide encoded labeling.
67
MALDI-MS. We propose that this method may circumvent challenges
encountered by label-free quantitation, such as gas-phase phosphorylation site
rearrangement, and has potential utility in quantitating the relative expression of
protein phosphorylation with the additional utility of providing a confident
phosphorylation site assignment.
3.5 Acknowlegements
I would like to thank Dr. Thomas J. Kerr, Ms. Katie Dextraze (Georgia
Institute of Technology), Dr. Larissa S. Fenn, Mr. Michal Kliman, and Dr. Brian
Huffman for assistance in the initial stages of this work. Financial assistance for
this work was provided by the Vanderbilt University College of Arts and Sciences,
the Vanderbilt Institute for Chemical Biology (Pilot Project Grant), the Vanderbilt
Institute for Integrative Biosystems Research and Education, and the American
Society for Mass Spectrometry (Research Award to JAM).
68
CHAPTER 4
RAPID SEPARATION, IDENTIFICATION, AND QUANTITATION OF PHOSPHORYLATED PEPTIDES AND PROTEINS USING LANTHANIDE-BASED LABELS AS ION MOBILITY-MASS SPECTROMETRY MOBILITY
SHIFT LABELS
4.1 Introduction
The stoichiometry of protein phosphorylation regulates numerous
biological processes. As addressed in the previous chapter, current mass
spectrometry-based strategies for quantifying sites of protein phosphorylation
include isotopologue strategies that limit the size of the peptide quantitated and
require high resolution MS instruments, which are less common and costly to
operate. Lanthanide-based labeling strategies allow for greater mass separation
than current isotope-based strategies due to incorporation of lanthanide metals of
greater mass differences (2-36 Da), and may be used as mobility shift “anchors”
for rapid visualization in ion mobility-mass spectrometry (IM-MS) analysis.
Moreover, lanthanide-based labels may provide mobility shift and selective
separation of the labeled phosphorylated peptides. This facilitates rapid
identification and selection of labeled ions for further characterization.
In this chapter, we demonstrate lanthanide-based labeling for
phosphorylated peptides, or Phosphopeptide Element-Coded Affinity Tagging
(PhECAT), for rapid identification, relative quantitation, and phosphorylation site
identification of phosphorylated peptides and proteins in complex mixtures using
IM-MS as a separation platform. Briefly, in the PhECAT method, phosphorylated
peptides are selectively modified at the phosphorylation site via beta-
69
elimination/anionic thiol Michael addition chemistry. In this manner,
phosphorylated peptides are converted to cysteine-like residues, which then
readily react with cysteine-specific labels. A lanthanide-chelating label is added
via maleimide chemistry and selected lanthanide metals are subsequently
chelated to a macrocycle moiety. Labeled phosphorylated peptides are then
visually identified by a mobility shift from the anticipated peptide correlation line
generated in IM-MS, quantitated, and fragmented in the transfer portion of the
instrument to provide comprehensive phosphopeptide analysis. To demonstrate
this technique, phosphorylated peptides and protein mixtures from proteolytic
digestion are identified and quantitated in various molar ratios with comparable
sensitivity and relative error to current isotopologue-based relative quantitation
strategies. Moreover, site identification of the modified phosphorylation site is
achieved, demonstrating that the label is covalent on the site of modification and
more stable than b and y ions generated by cleaving peptide bonds. This
strategy provides more confident site identification than that obtained in data-
dependent LC-MS/MS strategies because this method circumvents
phosphorylation-site rearrangement in the collision cell.
4.2 Experimental
4.2.1 Materials
Model phosphorylated peptides and proteins were investigated for proof-
of-concept experiments. Phosphorylated protein bovine β-casein was purchased
from Sigma-Aldrich (St. Louis, MO). Trypsin was purchased from Promega Corp.
(Madison, WI). C-18 spin columns were purchased from Pierce (Rockford, IL).
Maleimido-mono-amide-DOTA was purchased from Macrocyclics (Dallas, TX)
70
and dissolved in DMSO. 1,2-ethanedithiol (EDT) was purchased from Fluka (St.
Gallen, Switzerland). 2,5-dihydroxybenzoic acid (DHB) was purchased from
Sigma and dissolved in 50% methanol to a final concentration of 30 mg/mL.
Lanthanide metals were purchased from Strem Chemicals (Newburyport, MA) in
chloride salt form and dissolved in distilled deionized water (18 MΩ cm-1) to a
final concentration of 25 mg/mL. Dimethylsulfoxide, acetonitrile, and ethanol were
purchased from Sigma.
4.2.2 Digestion of phosphorylated proteins
Proteins were dissolved in ammonium bicarbonate buffer (pH 8.0) and
thermally denatured at 90˚C for 20 minutes and quenched at -20˚C.34 Cysteine-
cysteine bonds and free cysteines were reduced with dithiothreitol (final molarity
of 4 mM) and alkylated with iodoacetamide (final molarity of 20 mM). Proteins
were subsequently digested with trypsin in a 1:40 weight to weight ratio for 16-20
hours at room temperature and purified by C-18 spin columns (Pierce, Rockford,
IL) prior to derivatization. Digestion was confirmed by MALDI-TOFMS (data not
shown).
4.2.3 Selective derivatization of phosphorylated peptides and proteins
Tryptic peptides were subjected to a beta-elimination (Figure 23(i)) and
anionic thiol Michael addition reaction (Figure 23(ii)) resulting in the selective
elimination of phosphoric acid followed by addition of ethanedithiol. In the beta-
elimination/Michael addition reaction, each sample was derivatized in a
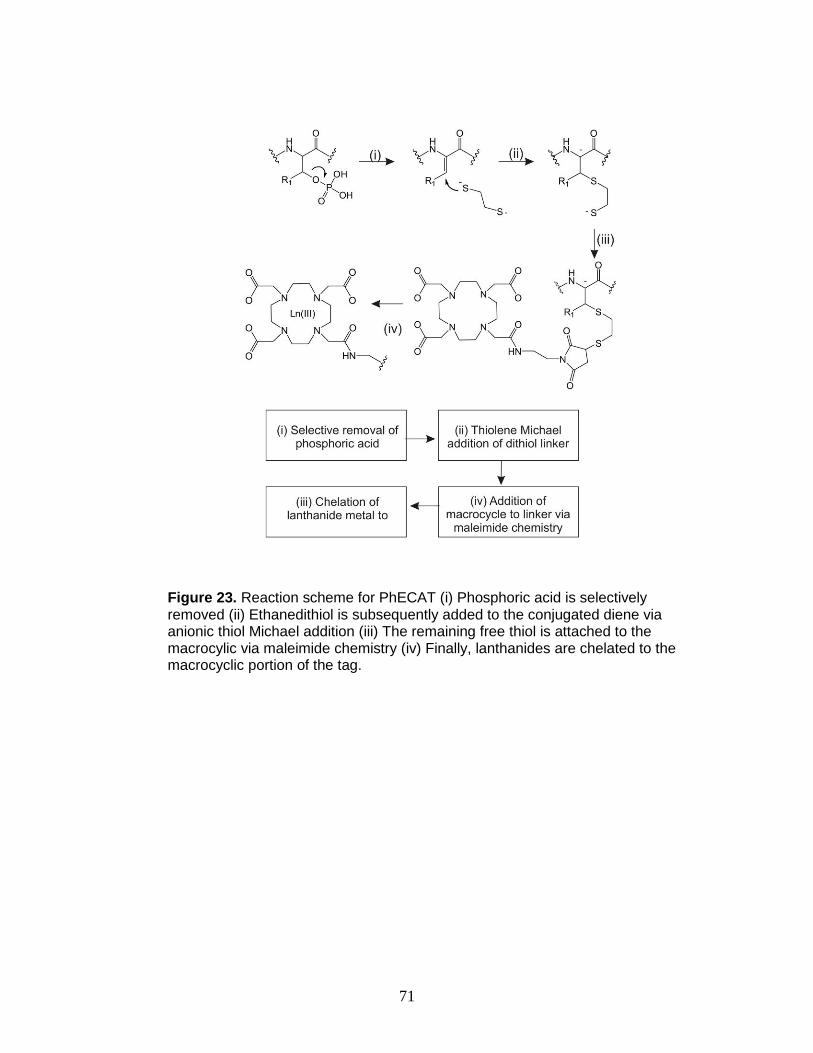
71
Figure 23. Reaction scheme for PhECAT (i) Phosphoric acid is selectively removed (ii) Ethanedithiol is subsequently added to the conjugated diene via anionic thiol Michael addition (iii) The remaining free thiol is attached to the macrocylic via maleimide chemistry (iv) Finally, lanthanides are chelated to the macrocyclic portion of the tag.
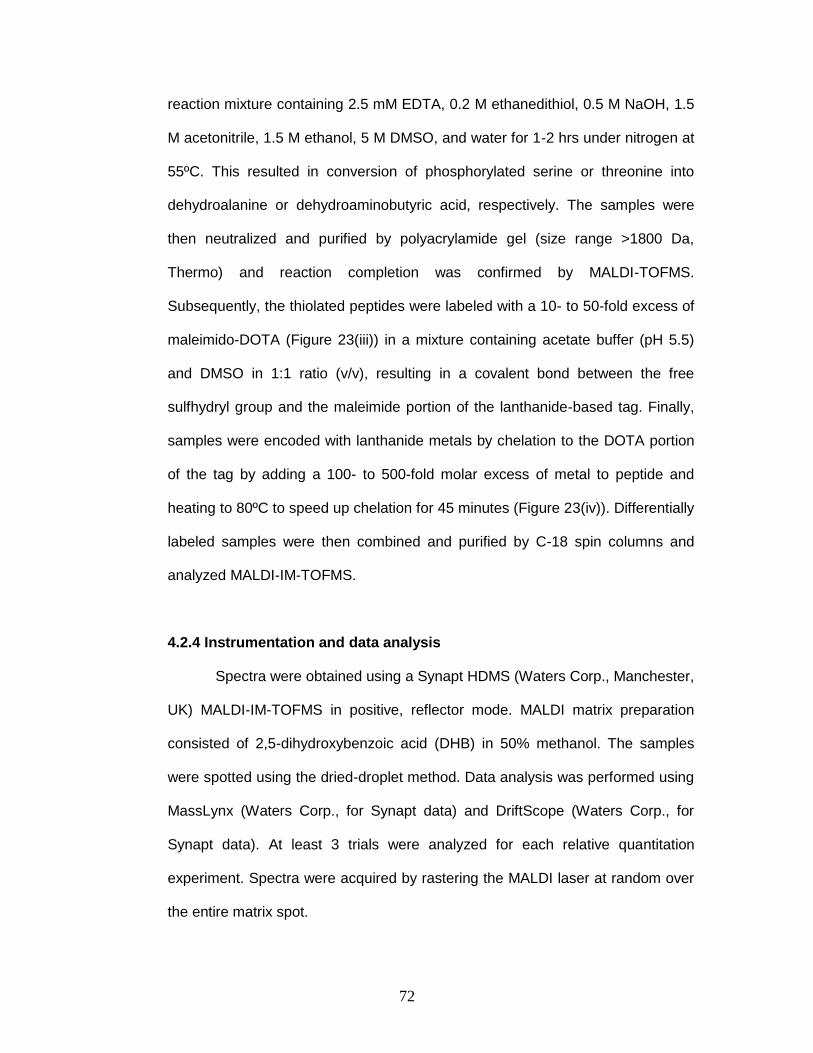
72
reaction mixture containing 2.5 mM EDTA, 0.2 M ethanedithiol, 0.5 M NaOH, 1.5
M acetonitrile, 1.5 M ethanol, 5 M DMSO, and water for 1-2 hrs under nitrogen at
55ºC. This resulted in conversion of phosphorylated serine or threonine into
dehydroalanine or dehydroaminobutyric acid, respectively. The samples were
then neutralized and purified by polyacrylamide gel (size range >1800 Da,
Thermo) and reaction completion was confirmed by MALDI-TOFMS.
Subsequently, the thiolated peptides were labeled with a 10- to 50-fold excess of
maleimido-DOTA (Figure 23(iii)) in a mixture containing acetate buffer (pH 5.5)
and DMSO in 1:1 ratio (v/v), resulting in a covalent bond between the free
sulfhydryl group and the maleimide portion of the lanthanide-based tag. Finally,
samples were encoded with lanthanide metals by chelation to the DOTA portion
of the tag by adding a 100- to 500-fold molar excess of metal to peptide and
heating to 80ºC to speed up chelation for 45 minutes (Figure 23(iv)). Differentially
labeled samples were then combined and purified by C-18 spin columns and
analyzed MALDI-IM-TOFMS.
4.2.4 Instrumentation and data analysis
Spectra were obtained using a Synapt HDMS (Waters Corp., Manchester,
UK) MALDI-IM-TOFMS in positive, reflector mode. MALDI matrix preparation
consisted of 2,5-dihydroxybenzoic acid (DHB) in 50% methanol. The samples
were spotted using the dried-droplet method. Data analysis was performed using
MassLynx (Waters Corp., for Synapt data) and DriftScope (Waters Corp., for
Synapt data). At least 3 trials were analyzed for each relative quantitation
experiment. Spectra were acquired by rastering the MALDI laser at random over
the entire matrix spot.
73
Labeled peaks were identified by mobility shift (<3%) in MALDI-IM-
TOFMS data and quantitated. Relative molar amounts were calculated by
dividing the relative peak area of the derivatized state 1 by the relative peak area
of derivatized state 2. Fragmentation of the labeled phosphorylated peptides and
proteins were performed on a Waters Synapt HDMS (Figure 24a) in the transfer
portion of the instrument, which was chosen because of the added advantage of
having fragmentation spectra organized by mobility (Figure 24b).
Peaks shifted out of peptide correlation space were manually selected for
fragmentation and analyzed for potential phosphorylation sites in order to assess
the stability of the lanthanide label and confirm the site of phosphorylation.
Fragmentation spectra were processed using MassLynx software using the
Subtract, Smooth, and Center processing tools and subsequently sequenced de
novo using an anticipated peak list generated from the ExPASy Peptide Mass ©
program.
4.3 Results and Discussion
While methods for MS-based relative quantitation of peptides and
proteins using chemical modification methodologies have been described in
detail, there are few reports of label-based relative quantitation strategies that are
selective for phosphorylation. The available methods have great utility in
quantitation of phosphorylated peptides and proteins, but three important
challenges exist – (i) they are limited to low mass peptides due to spectral
congestion caused by an overlap of increasingly larger isotopic envelopes, (ii)
identification of labeled species is challenging in complex mixtures, and
74
Figure 24. a) A schematic of the mobility cell portion of the Synapt HDMS G2. In these experiments, ions were separated in the mobility portion and subsequently fragmented in the transfer portion of the instrument. b) An advantage of this fragmentation strategy is that fragment ions are organized by mobility.
75
(iii) the number of simultaneously analyzed peptides is limited (simultaneous
quantitation of 2-8 samples are commonly reported).
Here, we report a multiplexed relative quantitation strategy that addresses
these limitations using lanthanide-based labels with MALDI-IM-MS in addition to
the MALDI-TOFMS platform described in Chapter 3. A schematic diagram of this
comprehensive phosphoproteomic strategy is illustrated in Figure 25. In this
strategy, phosphorylated peptides and proteins are selectively labeled with a
lanthanide-chelated tag. Quantitative information is obtained in both platforms by
encoding each sample with a different lanthanide, which provides the necessary
mass shift for quantitative comparisons (Figure 25, top and middle, right). The
number of samples that may be quantitated is only limited by the number of
available isotopically enriched lanthanide metals (simultaneous quantitation of 2-
14 samples is possible, excluding radioactive Promethium). Used in the MALDI-
TOFMS platform, these labels provide larger mass differences to avoid isotopic
overlap while quantitating phosphorylated peptides of higher mass. Used in the
MALDI-IM-TOFMS platform, these labels have added utility in converting the
phosphorylation site into a high-density “anchor” (Figure 25, bottom left). This
anchor shifts the labeled peptide below the peptide correlation line in IM-MS
space. Shifting labeled peaks away from unlabeled peaks facilitates selection
and identification in complex mixtures for further site localization. Site
identification is achieved by fragmenting peptides with an observed shift in IM-
MS conformation space and identifying b and y ions exhibiting the additional
mass of the covalent label (Figure 25, bottom right).
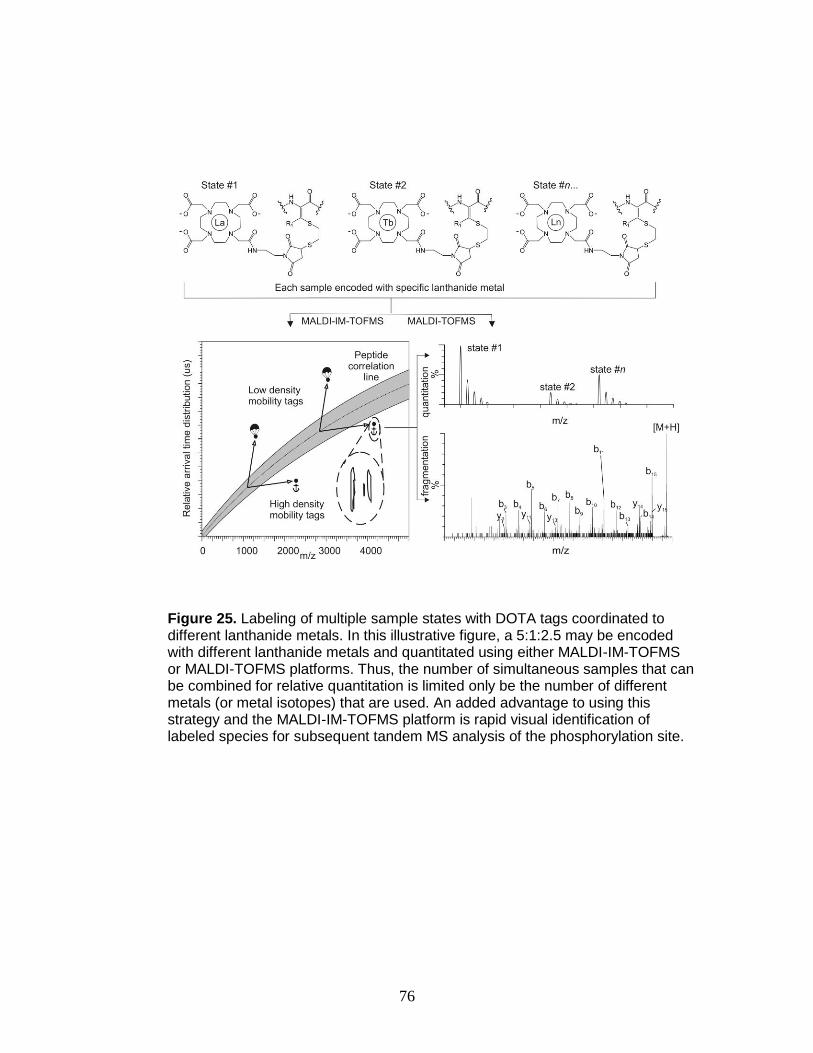
76
Figure 25. Labeling of multiple sample states with DOTA tags coordinated to different lanthanide metals. In this illustrative figure, a 5:1:2.5 may be encoded with different lanthanide metals and quantitated using either MALDI-IM-TOFMS or MALDI-TOFMS platforms. Thus, the number of simultaneous samples that can be combined for relative quantitation is limited only be the number of different metals (or metal isotopes) that are used. An added advantage to using this strategy and the MALDI-IM-TOFMS platform is rapid visual identification of labeled species for subsequent tandem MS analysis of the phosphorylation site.
77
4.3.1 Relative quantitation of phosphorylated peptides and proteins using PhECAT.
Varying molar amounts of phosphorylated peptides and proteins were
derivatized and quantitated in proof-of-concept experiments. The results of these
quantitation experiments are provided in Table 6. An example of a typical relative
quantitation experiment using the MALDI-IM-MS platform is illustrated in Figure
26. In this experiment, labeled phosphorylated peptides are visually identified by
their shift away from the peptide correlation line. A mass spectrum is extracted
from the 2D plot using MassLynx Chromatogram software and relative peak area
information is obtained (Figure 26, inset). In this example, a 1:5 molar ratio of Tb-
and Ho-labeled FQpSEEQQQTEDELQDK is shown. In conjunction with
fragmentation data, PhECAT strategies in IM-MS provide rapid identification and
relative quantitation of the labeled peptide for characterization of phosphorylated
peptides. Relative quantitation data and spectra for PhECAT strategies using
MALDI-IM-TOFMS is provided in the Appendices of this work.
The reported error for this strategy is comparable to current isotope
coded affinity labels, with the added advantages of larger shifts in mass doublets
(i.e. 2-36 Da for single phosphorylation sites), allowing for quantitation of high-
mass peptides without peak convolution from adjacent isotopes. For multiple
phosphorylation sites, the mass difference scales with the number of the labels,
which provides even greater separation. These results also indicate that this
method has error competitive to current quantitative phosphoproteomic methods
and should have utility in relative quantitative studies of complex biological
samples. The utility of lanthanide ions as luminescent chromophores in

78
Table 6. Relative Quantitation of phosphorylated peptides and proteins using lanthanide-chelating tags in MALDI-IM-TOFMS.
Peptide Sequencea,b
[M+H]+ c
[M*+H]+
Tb, Hod
Molar ratio of
derivatized
peptides
Measured
molar ratio of peptides
derivatized with
Ho-tag and Tb-tag
(average # of
trials) e
Relative Percent
Errorf
48 FQpSEEQQQTEDELQDK 63
from bovine B-casein
2060.7
2739.1‡,
2745.1‡
1.0: 5.0 (Ho:Tb)
0.172 (3)
+14.0
48 FQpSEEQQQTEDELQDK 63
from bovine B-casein
2060.7
2739.1‡,
2745.1‡
1.0: 1.0
(Tb:Ho)
1.159 (3)
+15.9
48 FQpSEEQQQTEDELQDK 63
from bovine B-casein
2060.7
2739.1‡,
2745.1‡
1.0: 5.0
(Tb:Ho)
0.293 (3)
+46.6
48 FQpSEEQQQTEDELQDK 63
from bovine B-casein
2060.7
2739.1‡,
2745.1‡
3.0: 1.0
(Ho:Tb)
2.341 (3)
-17.1
48 FQpSEEQQQTEDELQDK 63
from bovine B-casein
2060.7
2721.1‡,
2739.1‡,
2745.1‡
1.0: 1.0: 5.0
(Pr:Tb:Ho)
0.140, 0.130 (3)
-30.0,-35.0
__________________________________________________________________________
a. "p" denotes phosphorylation, sequence positions bracket the sequence for tryptic
peptides
b. Phosphorylated proteins purchased and used without additional purification.
c. Monoisotopic masses for unlabeled phosphorylated peptides.
d. Calculated monoisotopic peaks for labeled phosphorylated peptides. “*”denotes
PhECAT labeling, “‡“ denotes relative quantitation calculations where the peak having
the highest relative abundance was selected for peak area quantitation rather than the
monoisotopic peaks. This is primarily due to the fact that, here, the monoisotopic peak
has the lowest intensity. In this case, the peaks of highest intensity (2741.1, 2747.1) were
selected. [M*+H]+ of Pr, Tb, Ho
where applicable.
e. 1.0: 1.0: 5.0 (Pr:Tb:Ho) relative ratios expressed as Pr:Ho and Tb:Ho, respectively.
f. 1.0: 1.0: 5.0 (Pr:Tb:Ho) relative ratios expressed as Pr:Ho and Tb:Ho, respectively.
Percent errors are reported according to the following formula:
(Average Peak Area Ratio – Anticipated Peak Area Ratio) / Anticipated Peak Area Ratio
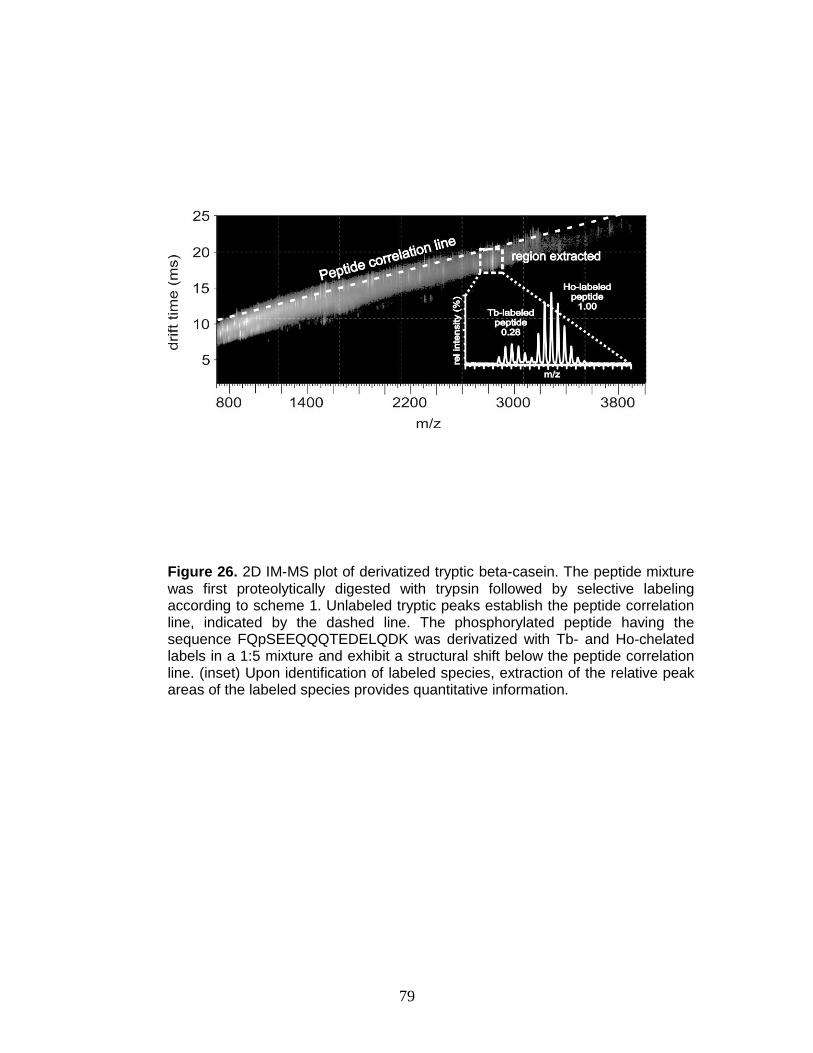
79
Figure 26. 2D IM-MS plot of derivatized tryptic beta-casein. The peptide mixture was first proteolytically digested with trypsin followed by selective labeling according to scheme 1. Unlabeled tryptic peaks establish the peptide correlation line, indicated by the dashed line. The phosphorylated peptide having the sequence FQpSEEQQQTEDELQDK was derivatized with Tb- and Ho-chelated labels in a 1:5 mixture and exhibit a structural shift below the peptide correlation line. (inset) Upon identification of labeled species, extraction of the relative peak areas of the labeled species provides quantitative information.
80
LC separations have been well described, and may increase confidence in
phosphorylation site labeling at an additional stage of analysis. Moreover, the
addition of a macrocycle may shift LC elution times for phosphorylated peptides,
which may assist in separation of closely spaced phosphorylated and non-
phosphorylated species.
4.3.2 Selection, fragmentation, and identification of the site of phosphorylation
PhECAT experiments performed using only MALDI-TOFMS as the
analysis platform utilize anticipated mass shifts (i.e., labeling with known
lanthanides generates predictable mass multiplets which can be identified with
quantitation software) to identify labeled quantitated species (data not shown).
PhECAT experiments performed using MALDI-IM-TOFMS as the analytical
platform take advantage of the high density of the PhECAT labels which result in
a shift of labeled phosphorylated peptides away from the anticipated peptide
correlation line, facilitating selection of phosphopeptides for fragmentation.
PhECAT selection and fragmentation using MALDI-IM-TOFMS is demonstrated
in Figure 27. Labeled peptides were first visually identified by their shift from
peptide correlation space (Figure 27(i)) and selected for fragmentation in the
transfer portion of the Synapt instrument. An example of a typical tandem
spectrum is shown in Figure 27(ii). The expected b/y series ions were observed,
including full b ion coverage from the b3 to the b15 ion, all labeled and several
unlabeled y ions including y8-12, several labeled water loss ions, and the intact
label with little evidence for fragmentation of the label. It should be noted that all
fragment ions
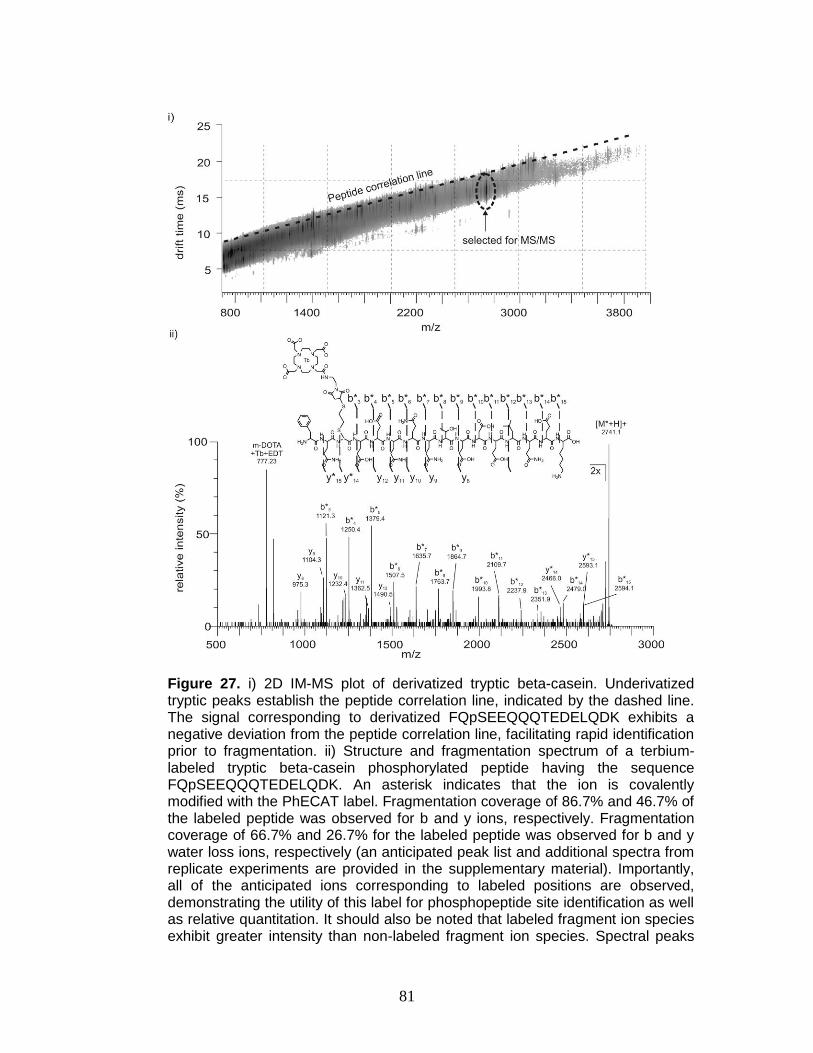
81
Figure 27. i) 2D IM-MS plot of derivatized tryptic beta-casein. Underivatized tryptic peaks establish the peptide correlation line, indicated by the dashed line. The signal corresponding to derivatized FQpSEEQQQTEDELQDK exhibits a negative deviation from the peptide correlation line, facilitating rapid identification prior to fragmentation. ii) Structure and fragmentation spectrum of a terbium-labeled tryptic beta-casein phosphorylated peptide having the sequence FQpSEEQQQTEDELQDK. An asterisk indicates that the ion is covalently modified with the PhECAT label. Fragmentation coverage of 86.7% and 46.7% of the labeled peptide was observed for b and y ions, respectively. Fragmentation coverage of 66.7% and 26.7% for the labeled peptide was observed for b and y water loss ions, respectively (an anticipated peak list and additional spectra from replicate experiments are provided in the supplementary material). Importantly, all of the anticipated ions corresponding to labeled positions are observed, demonstrating the utility of this label for phosphopeptide site identification as well as relative quantitation. It should also be noted that labeled fragment ion species exhibit greater intensity than non-labeled fragment ion species. Spectral peaks

82
from 500 m/z to 2600 m/z were intensified 2x to increase visibility of b and y spectral assignments.
83
covalently bound to the PhECAT label exhibit higher intensities than unlabeled
fragment ions. The stability of this label enables predictable mass shifts of
anticipated b and y ions which gives an indication of the site of modification
previously phosphorylated.44 Furthermore, because this tag is not labile and does
not show phosphorylation site rearrangement (as is the case with phosphoric
acid and phosphate plus water loss), it has an added advantage of more
confident phosphorylation site assignment. Thus, complete phosphoproteomic
characterization is accomplished using a single strategy.
4.4 Conclusions
Current methods of MS-based protein quantitation primarily focus on
quantifying relative expression profiles through labeling non-post-translationally
modified peptides. This offers a limited view of the biological activity of cells,
because many biological functions are dependent on protein modifications,
specifically, protein phosphorylation. The available methods for phosphoprotein
quantitation provide good specificity for the site of phosphorylation, however,
they have limited applicability for peptides of increasing mass and are seldom
used for phosphorylation site identification. In this work, we have demonstrated
the utility of lanthanide-based labels for phosphopeptides and proteins (PhECAT)
for relative quantitation of phosphorylated peptides using MALDI-MS and as
mobility shift labels using MALDI-IM-MS for rapid visual identification and
subsequent quantitative and site analysis. We propose that this method may
circumvent challenges encountered by quantitation and site localization, such as
gas-phase phosphorylation site rearrangement, with the added utilities described
above.

84
4.5 Acknowledgements
I would like to thank Dr. Thomas J. Kerr, Ms. Katie Dextraze (Georgia
Institute of Technology), Dr. Larissa S. Fenn, Mr. Michal Kliman, and Dr. Brian
Huffman for assistance in the initial stages of this work. Financial assistance for
this work was provided by the Vanderbilt University College of Arts and Sciences,
the Vanderbilt Institute for Chemical Biology (Pilot Project Grant), the Vanderbilt
Institute for Integrative Biosystems Research and Education, and the American
Society for Mass Spectrometry (Research Award to JAM).
85
CHAPTER 5
ENHANCED SEPARATION AND CHARACTERIZATION OF GLYCOSYLATED PROTEINS USING LANTHANIDE-BASED LABELING AND ION MOBILITY-
MASS SPECTROMETRY
5.1 Introduction
Much like protein phosphorylation, protein glycosylation regulates
numerous biological processes such as cell signaling, recognition, differentiation,
and proliferation and is often observed to dynamically occupy the same
sequence position that harbors phosphorylation as part of an ON/OFF switch in
biological systems.28 Thus, the stoichiometry between phosphorylation and
glycosylation is significant for a complete understanding of a phosphorylated
protein’s role in a system. As with any PTM characterization, elucidation of the
site of modification is critical to better understand the nature of modification-
dependent protein function and to design and optimize protocol to quantify and
structurally characterize the site of modification. Elucidation of the site of
glycosylation is challenging for similar reasons as phosphorylation localization,
namely – i) glycans are labile, and either beta-eliminate readily or fragment easily
in MS ion sources and collision cells, ii) these labile modifications predominate in
MS/MS spectra, as the bulk of fragmentation occurs at the site of modification
confounding MS sequencing attempts, and iii) due to the temporal nature of the
modification, only substoichiometric amounts are available and create difficulties
in detection of the modification.
Application of the previously described lanthanide-based labeling
strategies may provide relative quantitation information for glycosylated peptides
86
as well as phosphorylation occupation versus glycosylation occupation.
Furthermore, by modifying the site of glycosylation prior to analysis, the labile
glycosylation site is converted to a stable covalently bound label, which may
circumvent challenges associated with glycosylation site identification. Moreover,
removal of glycans through beta-elimination is routinely performed in glycan
structural analysis, and this chemistry is compatible with structural analysis of
glycans.
In this chapter, PhECAT strategies are applied toward the challenge of
glycan site quantitation. In this benchmarking report, labeling of a glycosylated
peptide from erythropoietin is demonstrated. In a manner similar to previously
discussed, glycosylated tryptic peptides are selectively modified at the
glycosylation site via beta-elimination/anionic thiol Michael addition chemistry.
Thus, glycosylated peptides are converted to cysteine-like residues, which then
readily react with cysteine-specific labels. This lanthanide-chelating label is
added via maleimide chemistry and selected lanthanide metals are subsequently
chelated to a macrocycle moiety.
5.2 Experimental
5.2.1 Materials
Model glycosylated peptides were investigated for proof-of-concept
experiments. Glycosylated erythropoietin was purchased from Anaspec
(Freemont, CA). Adrenocorticotropic hormone (ACTH) peptide clips 18-39, 1-17,
and 7-38 were purchased from American Peptide (Sunnyvale, CA) and used
without further purification. Polyacrylamide gel columns were purchased from
Thermo (San Jose, CA). C-18 spin columns were purchased from Pierce
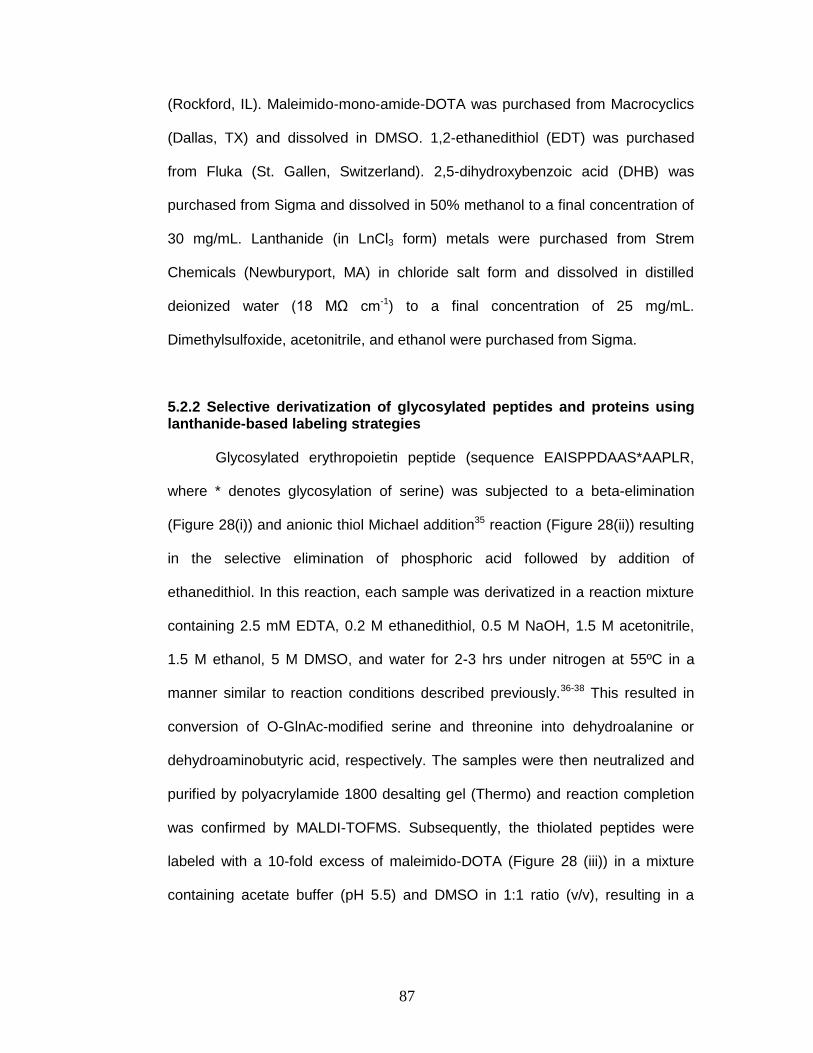
87
(Rockford, IL). Maleimido-mono-amide-DOTA was purchased from Macrocyclics
(Dallas, TX) and dissolved in DMSO. 1,2-ethanedithiol (EDT) was purchased
from Fluka (St. Gallen, Switzerland). 2,5-dihydroxybenzoic acid (DHB) was
purchased from Sigma and dissolved in 50% methanol to a final concentration of
30 mg/mL. Lanthanide (in LnCl3 form) metals were purchased from Strem
Chemicals (Newburyport, MA) in chloride salt form and dissolved in distilled
deionized water (18 MΩ cm-1) to a final concentration of 25 mg/mL.
Dimethylsulfoxide, acetonitrile, and ethanol were purchased from Sigma.
5.2.2 Selective derivatization of glycosylated peptides and proteins using lanthanide-based labeling strategies
Glycosylated erythropoietin peptide (sequence EAISPPDAAS*AAPLR,
where * denotes glycosylation of serine) was subjected to a beta-elimination
(Figure 28(i)) and anionic thiol Michael addition35 reaction (Figure 28(ii)) resulting
in the selective elimination of phosphoric acid followed by addition of
ethanedithiol. In this reaction, each sample was derivatized in a reaction mixture
containing 2.5 mM EDTA, 0.2 M ethanedithiol, 0.5 M NaOH, 1.5 M acetonitrile,
1.5 M ethanol, 5 M DMSO, and water for 2-3 hrs under nitrogen at 55ºC in a
manner similar to reaction conditions described previously.36-38 This resulted in
conversion of O-GlnAc-modified serine and threonine into dehydroalanine or
dehydroaminobutyric acid, respectively. The samples were then neutralized and
purified by polyacrylamide 1800 desalting gel (Thermo) and reaction completion
was confirmed by MALDI-TOFMS. Subsequently, the thiolated peptides were
labeled with a 10-fold excess of maleimido-DOTA (Figure 28 (iii)) in a mixture
containing acetate buffer (pH 5.5) and DMSO in 1:1 ratio (v/v), resulting in a

88
covalent bond between the free sulfhydryl group and the maleimide portion of the
lanthanide-based tag. Finally, selected lanthanide
89
Figure 28. Reaction scheme for using PhECAT for O-linked glycans (i) O-linked glycans are removed via beta-elimination in basic conditions, generating a conjugated diene (ii) Ethanedithiol is subsequently added to the conjugated diene via anionic thiol Michael addition (iii) The remaining free thiol is attached to the macrocylic via maleimide chemistry (iv) Finally, samples are encoded by chelating lanthanides to the macrocyclic portion of the tag.
90
metals were chelated to the maleimide portion of the tag by adding a 100-fold
molar excess of metal to peptide and heating to 80ºC to speed up chelation for
45 minutes (Figure 28(iv)).39 Differentially labeled samples were then combined
and purified by C-18 spin columns and analyzed using MALDI-IM-TOFMS.
5.2.3 Instrumentation and data analysis
Spectra were obtained using a Voyager MALDI-TOFMS in positive,
reflector mode. MALDI matrix preparation consisted of 2,5-dihydroxybenzoic acid
(DHB) in 50% methanol. The samples were spotted using the dried-droplet
method.40 Data analysis was performed using Data Explorer software version 4.3
(Applied Biosystems, Foster City, CA). At least 3 trials were analyzed for each
relative quantitation experiment. Spectra were acquired by rastering the MALDI
laser at random over the entire matrix spot.
Peaks were identified manually and quantitation spectra were processed
using the baseline correction, noise filter/smooth, and centroiding processing
tools of Data Explorer.
5.3 Results and Discussion
Here, we report successful labeling of a glycosylated peptide with
lanthanide-based labels, termed “PhECAT” when used to characterize
phosphorylated peptides. Lanthanide-based labeling of glycosylation sites
circumvents challenges associated with the lability of the modification and
provides quantitative information and selective separation of glycosylated
peptides from concomitants. The stoichiometry of glycosylation vs.
phosphorylation occupation may be elucidated with a selective purification
91
strategy outlined in Figure 29 prior to lanthanide encoding. In this proposed
strategy, a glycosylated and phosphorylated protein mixture is digested before
being subjected to antibody purification and divided out into two samples of
phosphopeptides and glycopeptides. Each sample is then derivatized and
encoded with a specific lanthanide and characterized by MS. If structural
information is desired, the beta-elimination step of the labeling may be used to
release the glycans for subsequent structural analysis. Simultaneous glycomics
and proteomics has been reported in our group and can be applied toward
comprehensive glycoproteomics as well.70
Preliminary data demonstrating the labeling of glycosylated peptides is
presented in Figure 30. The GlcNAc-modified peptide was derivatized using
beta-elimination/Michael addition chemistry followed by maleimide and
lanthanide chelation chemistry as used previously for the derivatization of
phosphorylated peptides. Erythropoietin (EAISPPDAAS*AAPLR, where *
denotes glycosylation of serine) was derivatized in a 1:1 mixture of Tb to Ho-
labeled peptides. A peptide mixture containing ACTH peptides was spiked into
the sample to establish the underivatized peptide correlation line in IM-MS 2D
conformation space (Figure 30, top). One sample was quantitated so that
application of this strategy resembled characterization of an unknown biological
sample, which is frequently limited in concentration. Labeled erythropoietin signal
was identified by its negative deviation from the established peptide correlation
line and mass spectra were subsequently extracted for quantitative information
(Figure 30, bottom). Table 7 presents the results from this single quantitation
experiment. Extracted mass spectra and quantitation raw data are provided in
the Appendices. The relative percent error associated with this experiment was
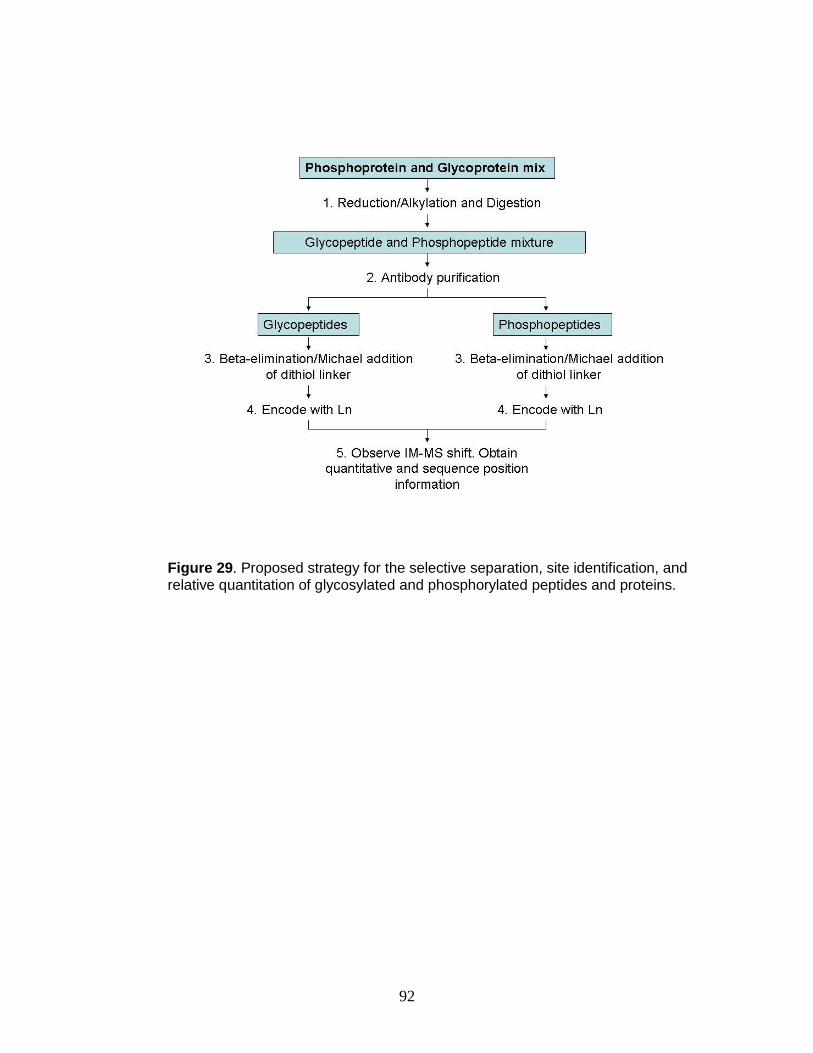
92
Figure 29. Proposed strategy for the selective separation, site identification, and relative quantitation of glycosylated and phosphorylated peptides and proteins.
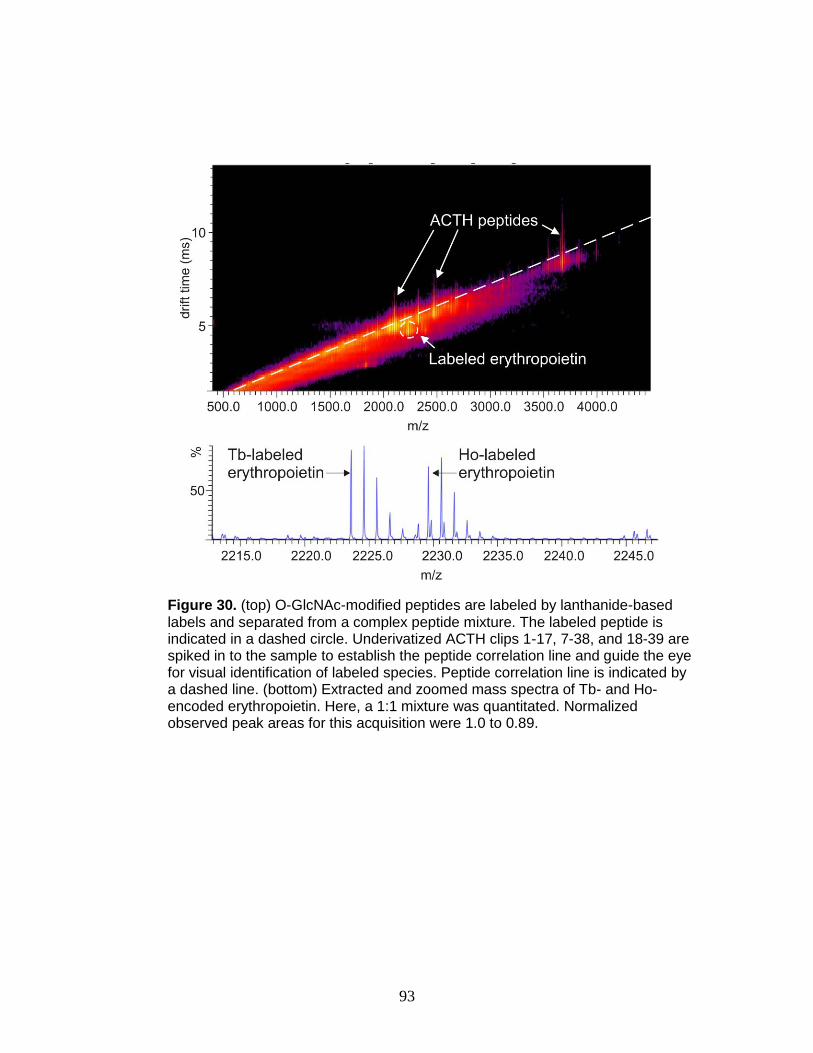
93
Figure 30. (top) O-GlcNAc-modified peptides are labeled by lanthanide-based labels and separated from a complex peptide mixture. The labeled peptide is indicated in a dashed circle. Underivatized ACTH clips 1-17, 7-38, and 18-39 are spiked in to the sample to establish the peptide correlation line and guide the eye for visual identification of labeled species. Peptide correlation line is indicated by a dashed line. (bottom) Extracted and zoomed mass spectra of Tb- and Ho-encoded erythropoietin. Here, a 1:1 mixture was quantitated. Normalized observed peak areas for this acquisition were 1.0 to 0.89.
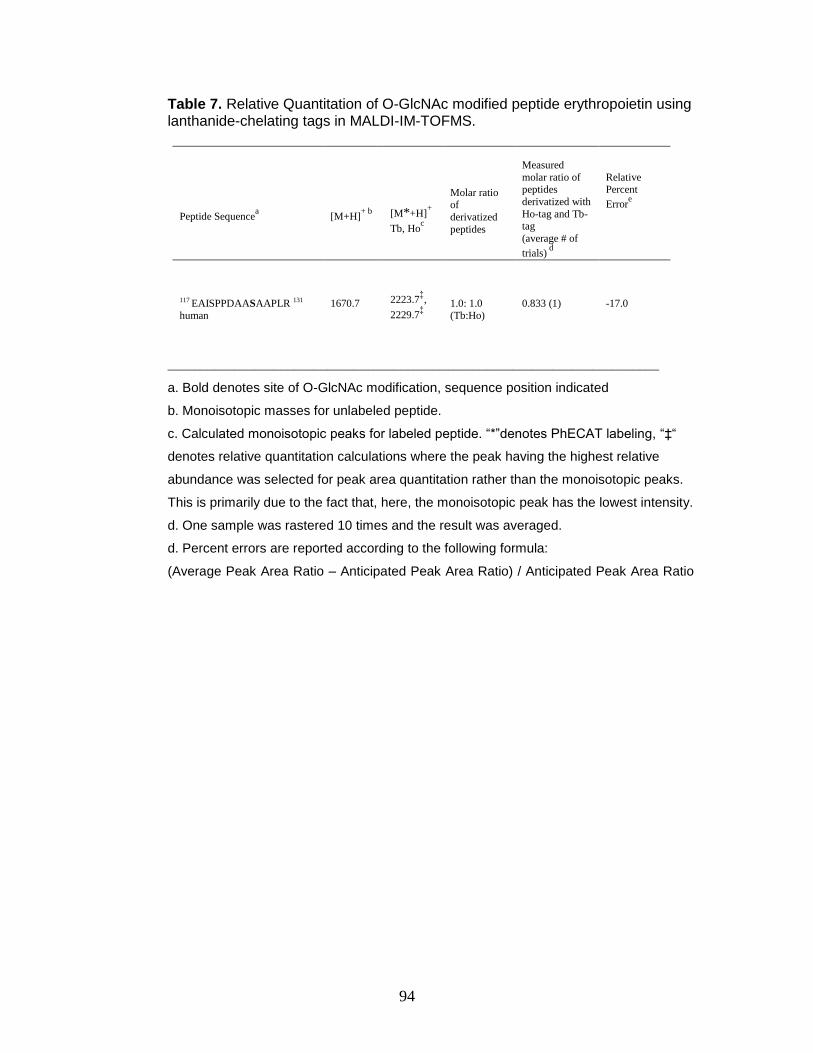
94
Table 7. Relative Quantitation of O-GlcNAc modified peptide erythropoietin using lanthanide-chelating tags in MALDI-IM-TOFMS.
Peptide Sequencea
[M+H]+ b
[M*+H]+
Tb, Hoc
Molar ratio of
derivatized
peptides
Measured
molar ratio of peptides
derivatized with
Ho-tag and Tb-tag
(average # of
trials) d
Relative Percent
Errore
117 EAISPPDAASAAPLR 131
human
1670.7
2223.7‡,
2229.7‡
1.0: 1.0 (Tb:Ho)
0.833 (1)
-17.0
__________________________________________________________________________
a. Bold denotes site of O-GlcNAc modification, sequence position indicated
b. Monoisotopic masses for unlabeled peptide.
c. Calculated monoisotopic peaks for labeled peptide. “*”denotes PhECAT labeling, “‡“
denotes relative quantitation calculations where the peak having the highest relative
abundance was selected for peak area quantitation rather than the monoisotopic peaks.
This is primarily due to the fact that, here, the monoisotopic peak has the lowest intensity.
d. One sample was rastered 10 times and the result was averaged.
d. Percent errors are reported according to the following formula:
(Average Peak Area Ratio – Anticipated Peak Area Ratio) / Anticipated Peak Area Ratio
95
found to be 17%, which is comparable to current isotopologue quantitation
strategies. It should also be noted that these isotopologue quantitation strategies
are generally not demonstrated for PTMs and particularly not demonstrated as
quantitative strategies between two PTMs occupying the same site of
modification.
5.4 Conclusions
Glycosylation and phosphorylation have been shown to occupy the same
site of modification in a number of cases, and switching modifications has been
shown to be a critical regulatory mechanism for a number of cellular functions.
Characterization of glycopeptides provides a more complete picture of a picture
of the resident modification, and quantitation of phosphorylated vs. glycosylated
species may provide a better understanding of the mechanisms controlled by
modification switching. A 1:1 molar mixture of O-GlcNAc-modified peptide
erythropoietin was quantitated using Tb- and Ho-chelated labels. In this initial
experiment, performed with a single sample in the manner expected for unknown
samples, the relative percent error was calculated to be 17%, which is
comparable to current quantitative experiments that do not profile glycosylation
stoichiometry. Moreover, labeled glycosylated species were visually identified by
their negative deviation from the peptide correlation in 2D IM-MS conformation
space, illustrating the additional advantage of lanthanide-based labeling for IM
separations.

96
5.5 Acknowledgments
I would like to acknowledge Larissa S. Fenn for her assistance with
setting up the experiments. This work was supported by the Vanderbilt University
College of Arts and Sciences, the Vanderbilt Institute for Chemical Biology, the
Vanderbilt Institute of Integrative Biosystems Research and Education, the
American Society for Mass Spectrometry (Research Award to J.A.M.).
97
CHAPTER 6
CONCLUSIONS AND FUTURE DIRECTIONS
6.1 Summary and conclusions
The primary aim of this dissertation research was to simplify
characterization of phosphorylated and glycosylated peptides and proteins.
These post-translational modifications have profound significance in molecular
biology and understanding the mechanisms of disease.
Complete phosphoproteomic characterization is accomplished through
elucidating the site of phosphorylation and its stoichiometry. These are typically
performed in separate experiments, and each determination has demonstrated
challenges. Site identification by data-dependent tandem MS is often confounded
by phosphorylation site rearrangement, HPLC co-elution, and heterogeneous
phosphorylation. Quantitation between two states is typically accomplished using
isotopologue labeling and subsequent MS analysis, which provides limited mass
shift and requires high resolution instrumentation. These challenges are
described in detail in Chapters 1 and 2. Chapters 3 and 4 address these
challenges using lanthanide-based labeling. Chapter 4 introduces the utility of ion
mobility-mass spectrometry separations and the use of these labels as mobility
shift reagents for rapid visual identification of labeled ions. Lanthanide-based
tagging provides increased mass separation to quantitate peptides of increasing
mass and also provides separation from concomitant species in IM-MS
conformation space so that site identification is more easily achieved. Together,
98
these strategies provide comprehensive phosphoproteomic characterization. This
was demonstrated in a benchmarking experiment using the model
phosphorylated protein, bovine beta-casein. In Chapter 3, the quantitative
advantages of lanthanide-based labeling were first explored. Error comparable to
current isotopologue strategies (including those that do not label
phosphopeptides) was achieved. Moreover, fragmentation of labeled species
indicated that derivatization of the phosphorylation site produced a more stable
modification in which to identify the site of phosphorylation. In Chapter 4, the
additional utility of lanthanide-based labeling as mobility shift tags for separation
from unphosphorylated peptides in IM-MS conformation space was explored.
Lanthanide tags provided sufficient mobility and mass shift to successfully
separate phosphorylated peptides away from the anticipated peptide
conformation space, facilitating further characterization without concomitant
contamination.
A number of reports have described a dynamic “ON/OFF” switching of
phosphorylation sites with glycosylation. Thus, contemporary phosphoproteomics
must incorporate glycoproteomic identification and quantitation. Contemporary
glycoproteomic characterization includes identification of the site of modification
and determination of the glycan’s stoichiometry. Glycoproteomic characterization
entails the same challenges as phosphoproteomic characterization. Lanthanide-
based labeling and IM-MS separations for selective separation may circumvent
these challenges and moreover provide quantitative information. This is
discussed in detail in Chapter 5. In this experiment, a O-GlcNAc-modified
peptide, human erythropoietin, was labeled and visually identified by its negative
deviation form the peptide correlation line in 2D conformation space.
99
Furthermore, a 1:1 molar ratio of Tb- to Ho-labeled sample was quantitated with
comparable error to current isotopologue-based quantitation strategies.
6.2 Future directions
6.2.1 Custom labels for labeling and ionization efficiency
Through these studies, significant progress was made in developing a
simplified, comprehensive strategy for multiplexed characterization of
phosphorylated and glycosylated peptides and proteins, but there are many
opportunities for further research. Our laboratory is presently pursuing a number
of custom labels that further enhance the ionization efficiency of the label and
that accommodate single reaction, or “one-pot,” phosphoproteomic labeling.
One label that was conceptualized in our laboratory, illustrated in Figure
30a, contains an arginine residue, which through labeling substitutes the
negatively charged phosphorylation or glycosylation residue for a positively
charged residue. This is especially advantageous to improve ionization efficiency
and to enhance detection of phosphopeptides or glycopeptides for relative
quantitation strategies. Another label envisioned, illustrated in Figure 30b,
contains a DOTA macrocycle and a reactive thiol replacing the maleimide. Using
this label, phosphopeptides may be labeled without a dithiol linker, reducing
reaction time and desalting steps required when converting the phosphorylation
site to a thiol-terminated residue. Reducing desalting and chromatographic steps
in phosphoproteomic labeling reduces losses associated with each process, and
can potentially improve the overall limit of detection of the method.
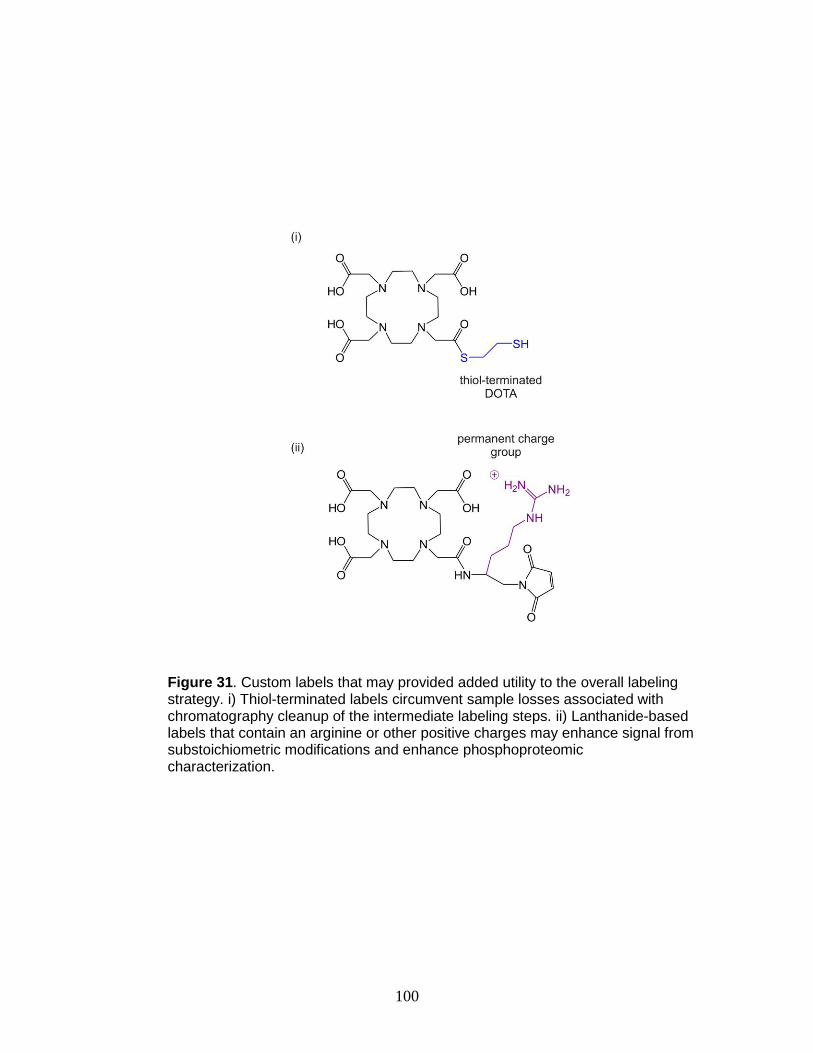
100
Figure 31. Custom labels that may provided added utility to the overall labeling strategy. i) Thiol-terminated labels circumvent sample losses associated with chromatography cleanup of the intermediate labeling steps. ii) Lanthanide-based labels that contain an arginine or other positive charges may enhance signal from substoichiometric modifications and enhance phosphoproteomic characterization.
101
6.2.2 Mobility shift labeling for selective separation and structural analysis of glycosylated peptides
Another avenue envisioned for future research is the use of mobility shift
“balloon” labels for structural analysis of glycans, illustrated in detail in Chapter 1.
Although lanthanide-based labeling provides quantitative and site identification
information of the glycan, structural information is lost. A number of biological
processes are highly dependent on glycan structure and the composition of
terminal saccharides on the glycan.3, 4, 8, 33-35, 37, 108-110 Thus, this information is of
critical importance to comprehensive glycoproteomics.
The potential for balloon mobility shift labeling of post-translationally
modified peptides in IM-MS has not been explored. Due to the curvature of each
biomolecular class, mobility shift separation experiments must be tuned to the
target biomolecule class to achieve maximum separation. For underivatized
glycosylated peptides and proteins, mobility shift strategies that place labeled
glycopeptides signals above the carbohydrate/protein correlation line may
provide the optimal separation for rapid visual identification and further
characterization. Characteristics of “balloon” shift reagents include labels with
high surface area and low mass such that surface area scales disproportionately
with mass.
Addition of a balloon mobility shift reagent may provide enhanced
separation of a glycosylated peptide having a labeled terminal group from its
isobaric counterparts. This separation also provides added utility by reducing
concomitant species fragmented in structural elucidation. Moreover, O-GlcNAc-
modified peptides separated by labeling strategies may be selected for
fragmentation to obtain structural information on the glycan.
102
6.2.3 Relative quantitation of dynamic interchange between protein phosphorylation and protein glycosylation
Lanthanide-based quantitative mobility-shift labeling may also be applied
toward characterization between PTM states such as glycosylation vs.
phosphorylation states. As mentioned previously, glycosylation and
phosphorylation are known to occupy the same sequence position, and dynamic
regulation between the modifications are known to control signaling functions of
the cell. A strategy for glyco/phospho quantitation is illustrated in figure 29 in
Chapter 5.
103
APPENDIX A
Supplementary Information for Mass Spectrometry Data Acquisition according to MIAPE-MS format.
General Features
Global Descriptors Dates obtained can be found in the file names behind “sh_RG_1270_” or “sh_RG_1368_.”
These samples were processed and analyzed by the Vanderbilt Proteomics Core.
Contact info: Hayes McDonald – Assistant Director Email: [email protected] Contact info: Salisha Hill – Laboratory Technician
Email: [email protected] Phone: (615) 343-7334
Instrument Manufacturer and Model :
LTQMS : ThermoFinnigan LTQ LC-MS-MS LTQ-Orbitrap : Thermo Scientific LTQ XL™ Customizations : none
Control and Analysis Software : Software Name and Version: Thermo Xcalibur 1.3 and Bioworks 3.1 software
Switching criteria: available in supplementary raw MS files Isolation Width: 2.00 Ion Sources: Electrospray Ionisation (ESI): Instrumental, source,
and tune parameter settings are available in the raw data files provided at the following url: http://www.mc.vanderbilt.edu/msrc/bioinformatics/data.php or at
the following link: https://proteomecommons.org/tranche/data-downloader.jsp?fileName=ZEb8WJQd75%2Fi4%2FPOlusCyfWI7czMK%2BUT3kcIGy8P6caR3iYgUJdGR958BvUpwYS8v6Q56Pe1eiGKjK5H2Y8L%2FYG%2FA3kAAAAAAAAEDg%3D%3D
Post-Source Component:
Ion Trap Final MS Stage Achieved: MS3

104
APPENDIX B
Table of initial APPL1 phosphorylation site identifications by LTQ-MS and reasons for acceptance or rejection.
LTQ-MS/MS DATA
Sequence position X-corr z mh MS3 comments
[email protected] 90-103 2.49 2 1580.77 NO
Top 3 ions don't match prospector output, losses
[email protected] 605-627 4.10 3 2558.25 NO
Top 4 out of 10 ions don't match prospector output
F.DIIS@PVC*EDQPGQAKAF.G 456-472 3.76 2 1954.93 YES
Triggered MS3, top ions match prospector output
F.DIIS@PVC*EDQPGQAKAF.G 456-472 3.85 2 1954.93 YES
Top ions match prospector output
[email protected] 683-706 4.62 3 2633.24 YES
Triggered MS3, top ions match prospector output
[email protected] 683-706 5.53 3 2633.24 ----
Replicate of previously confirmed assignment.
E.GQFVVLSSSQS@[email protected] 683-706 4.40 3 2713.24 YES
Top ions match prospector output. Some ambiguity of site assignment. Reasonably confident.
[email protected] 683-706 5.38 3 2633.24 ----
Replicate of previously confirmed assignment.
[email protected] 683-706 5.03 3 2633.24 ----
Replicate of previously confirmed assignment.
[email protected] 683-706 3.23 3 2633.24 NO
No neutral loss, some mismatched assignments, sites of phosphorylation not bracketed.
Q.IY@[email protected] 377-396 2.19 2 2394.09 YES
Top 6 of 10 ions don't correspond to b ions, y ions or any losses of b and y ions.
[email protected] 683-706 4.52 3 2633.24 YES
Ions bracketing sites not confident.
A.AS@[email protected] 672-706 3.27 3 3827.74 NO
Proposed phosphorylation sites not bracketed
[email protected] 669-703 6.32 3 3631.71 YES
Top ions match prospector output. Some ambiguity of site assignment. Reasonably confident.
[email protected] 92-119 5.56 3 3175.53 NO
Top ions match prospector output. Some ambiguity of site assignment. Reasonably confident.
[email protected] 669-703 5.86 3 3631.71 ----
Replicate of previously confirmed assignment.
[email protected] 213-237 3.46 3 2872.35 NO
Top ions don't match prospector output.
R.LIAASSRPNQASSEGQFVVLS@SSQSE 669-703 5.94 3 3631.71 ---
Replicate of previously confirmed assignment.
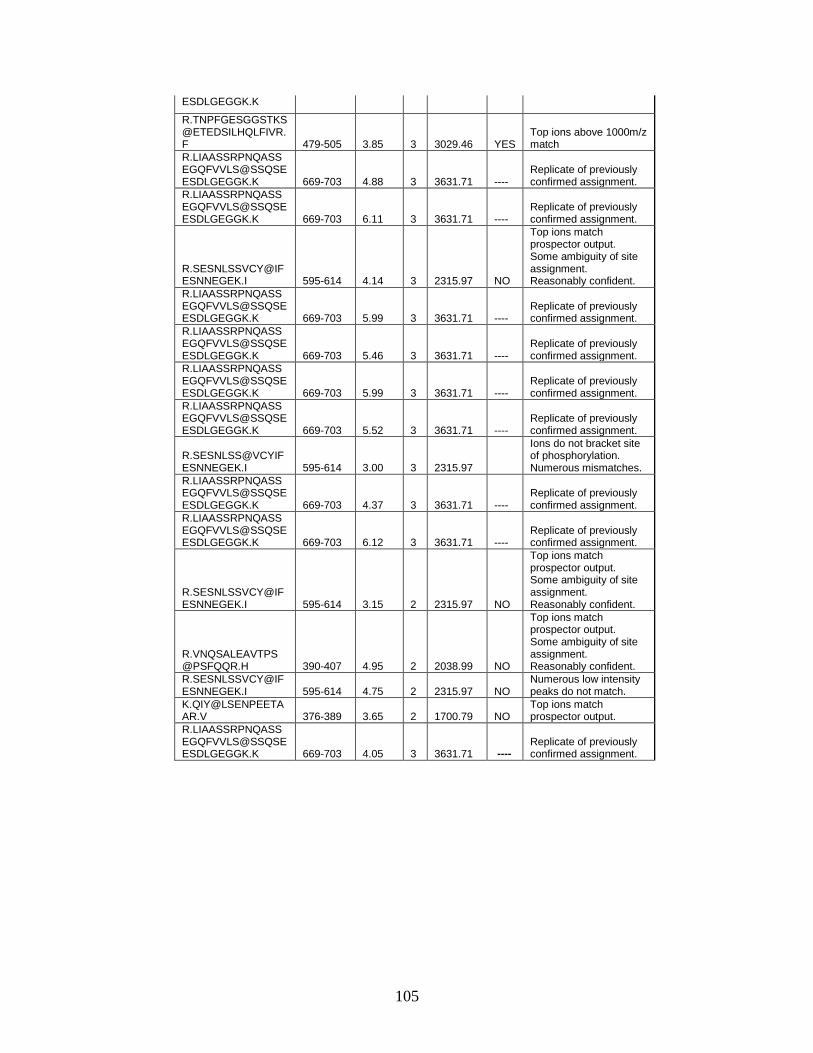
105
ESDLGEGGK.K
[email protected] 479-505 3.85 3 3029.46 YES
Top ions above 1000m/z match
[email protected] 669-703 4.88 3 3631.71 ----
Replicate of previously confirmed assignment.
[email protected] 669-703 6.11 3 3631.71 ----
Replicate of previously confirmed assignment.
[email protected] 595-614 4.14 3 2315.97 NO
Top ions match prospector output. Some ambiguity of site assignment. Reasonably confident.
[email protected] 669-703 5.99 3 3631.71 ----
Replicate of previously confirmed assignment.
[email protected] 669-703 5.46 3 3631.71 ----
Replicate of previously confirmed assignment.
[email protected] 669-703 5.99 3 3631.71 ----
Replicate of previously confirmed assignment.
[email protected] 669-703 5.52 3 3631.71 ----
Replicate of previously confirmed assignment.
[email protected] 595-614 3.00 3 2315.97
Ions do not bracket site of phosphorylation. Numerous mismatches.
[email protected] 669-703 4.37 3 3631.71 ----
Replicate of previously confirmed assignment.
[email protected] 669-703 6.12 3 3631.71 ----
Replicate of previously confirmed assignment.
[email protected] 595-614 3.15 2 2315.97 NO
Top ions match prospector output. Some ambiguity of site assignment. Reasonably confident.
[email protected] 390-407 4.95 2 2038.99 NO
Top ions match prospector output. Some ambiguity of site assignment. Reasonably confident.
[email protected] 595-614 4.75 2 2315.97 NO
Numerous low intensity peaks do not match.
[email protected] 376-389 3.65 2 1700.79 NO
Top ions match prospector output.
[email protected] 669-703 4.05 3 3631.71 ----
Replicate of previously confirmed assignment.
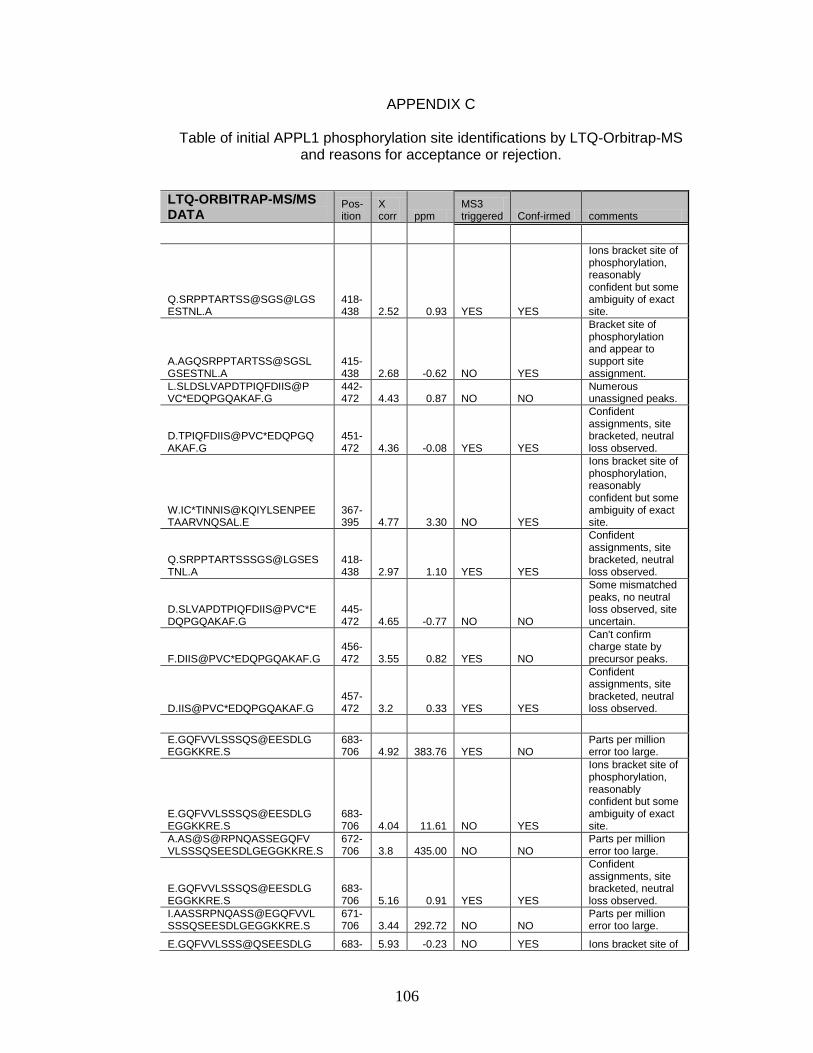
106
APPENDIX C
Table of initial APPL1 phosphorylation site identifications by LTQ-Orbitrap-MS and reasons for acceptance or rejection.
LTQ-ORBITRAP-MS/MS DATA
Pos-ition
X corr ppm
MS3 triggered Conf-irmed comments
Q.SRPPTARTSS@SGS@LGS ESTNL.A
418-438 2.52 0.93 YES YES
Ions bracket site of phosphorylation, reasonably confident but some ambiguity of exact site.
A.AGQSRPPTARTSS@SGSL GSESTNL.A
415-438 2.68 -0.62 NO YES
Bracket site of phosphorylation and appear to support site assignment.
L.SLDSLVAPDTPIQFDIIS@P VC*EDQPGQAKAF.G
442-472 4.43 0.87 NO NO
Numerous unassigned peaks.
D.TPIQFDIIS@PVC*EDQPGQ AKAF.G
451-472 4.36 -0.08 YES YES
Confident assignments, site bracketed, neutral loss observed.
W.IC*TINNIS@KQIYLSENPEE TAARVNQSAL.E
367-395 4.77 3.30 NO YES
Ions bracket site of phosphorylation, reasonably confident but some ambiguity of exact site.
Q.SRPPTARTSSSGS@LGSES TNL.A
418-438 2.97 1.10 YES YES
Confident assignments, site bracketed, neutral loss observed.
D.SLVAPDTPIQFDIIS@PVC*E DQPGQAKAF.G
445-472 4.65 -0.77 NO NO
Some mismatched peaks, no neutral loss observed, site uncertain.
F.DIIS@PVC*EDQPGQAKAF.G 456-472 3.55 0.82 YES NO
Can't confirm charge state by precursor peaks.
D.IIS@PVC*EDQPGQAKAF.G 457-472 3.2 0.33 YES YES
Confident assignments, site bracketed, neutral loss observed.
E.GQFVVLSSSQS@EESDLG EGGKKRE.S
683-706 4.92 383.76 YES NO
Parts per million error too large.
E.GQFVVLSSSQS@EESDLG EGGKKRE.S
683-706 4.04 11.61 NO YES
Ions bracket site of phosphorylation, reasonably confident but some ambiguity of exact site.
A.AS@S@RPNQASSEGQFV VLSSSQSEESDLGEGGKKRE.S
672-706 3.8 435.00 NO NO
Parts per million error too large.
E.GQFVVLSSSQS@EESDLG EGGKKRE.S
683-706 5.16 0.91 YES YES
Confident assignments, site bracketed, neutral loss observed.
I.AASSRPNQASS@EGQFVVL SSSQSEESDLGEGGKKRE.S
671-706 3.44 292.72 NO NO
Parts per million error too large.
E.GQFVVLSSS@QSEESDLG 683- 5.93 -0.23 NO YES Ions bracket site of

107
EGGKKRE.S 706 phosphorylation, reasonably confident but some ambiguity of exact site.
E.GQFVVLSSS@QSEESDLG EGGKKRE.S
683-706 4.08 2.28 YES YES
Replicate of previously confirmed assignment.
E.GQFVVLSSSQS@EESDLG EGGKKRESE.A
683-708 4.45 5.58 YES YES
Replicate of previously confirmed assignment.
F.VVLSSSQS@EES@DLGEG GKKRE.S
686-706 2.83 -4.53 YES YES
Confident assignments, site bracketed, neutral loss observed.
G.QFVVLS@S@S@QSEESDLG EGGKKRE.S
684-706 3.41
-858.54 NO NO
Parts per million error too large.
[email protected] 612-630 3.65 YES NO
Isotopic overlap of potential precursor peaks confounds precursor assignment.
E.GQFVVLSSSQS@EESDLGEG GKKRE.S
683-706 4.75 378.98 NO NO
Parts per million error too large.
A.AS@S@RPNQASSEGQFVVL SSSQSEESDL GEGGKKRE.S
672-706 3.96 445.65 NO NO
Parts per million error too large.
E.GQFVVLSSSQS@EESDLGEG GKKRE.S
683-706 5.66 0.23 YES ----
Replicate of previously confirmed assignment.
F.VVLSSS@QSEESDLGEGGKK RE.S
686-706 2.9 -2.34 YES YES
Ions bracket site of phosphorylation, reasonably confident but some ambiguity of exact site.
P.NQAS@S@EGQFVVLSSSQS EESDLGEGGKKRE.S
677-706 3.73 516.98 NO NO
Parts per million error too large.
R.LIAASSRPNQASSEGQFVVL [email protected]
669-703 6.99 -7.93 YES YES
Ions bracket site of phosphorylation, reasonably confident but some ambiguity of exact site.
R.SESNLSSVCY@IFESNNEG EK.I
595-614 4.08
-415.58 NO NO
Parts per million error too large.
R.TSSSGS@LGSESTNLAAL SLDSLVAPDTPIQFDIISPVC* EDQPGQAK.A
425-470 4.68 210.77 NO NO
Parts per million error too large.
R.TNPFGESGGSTKS@ETE DSILHQLFIVR.F
479-505 4.67 YES NO
Isotopic overlap of potential precursor peaks confounds precursor assignment.
R.SESNLSSVCY@IFESNNE GEK.I
595-614 4.49
-836.53 NO NO
Precursor peak not readily evident, error too large.
R.LIAASSRPNQASSEGQFV [email protected]
669-703 5.17 NO NO
Isotopic overlap of potential precursor peaks confounds precursor assignment.
R.LIAASSRPNQASSEGQFV [email protected]
669-703 7.16 277.49 NO NO
Parts per million error too large.
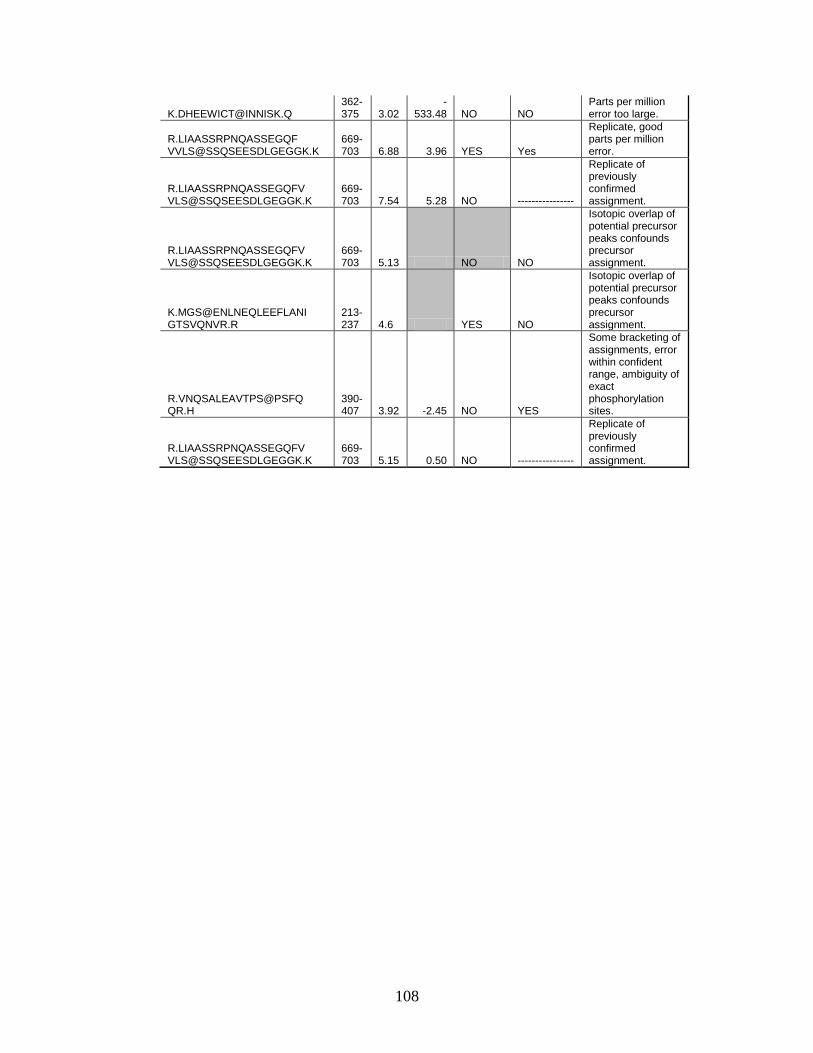
108
[email protected] 362-375 3.02
-533.48 NO NO
Parts per million error too large.
R.LIAASSRPNQASSEGQF [email protected]
669-703 6.88 3.96 YES Yes
Replicate, good parts per million error.
R.LIAASSRPNQASSEGQFV [email protected]
669-703 7.54 5.28 NO ----------------
Replicate of previously confirmed assignment.
R.LIAASSRPNQASSEGQFV [email protected]
669-703 5.13 NO NO
Isotopic overlap of potential precursor peaks confounds precursor assignment.
K.MGS@ENLNEQLEEFLANI GTSVQNVR.R
213-237 4.6 YES NO
Isotopic overlap of potential precursor peaks confounds precursor assignment.
R.VNQSALEAVTPS@PSFQ QR.H
390-407 3.92 -2.45 NO YES
Some bracketing of assignments, error within confident range, ambiguity of exact phosphorylation sites.
R.LIAASSRPNQASSEGQFV [email protected]
669-703 5.15 0.50 NO ----------------
Replicate of previously confirmed assignment.
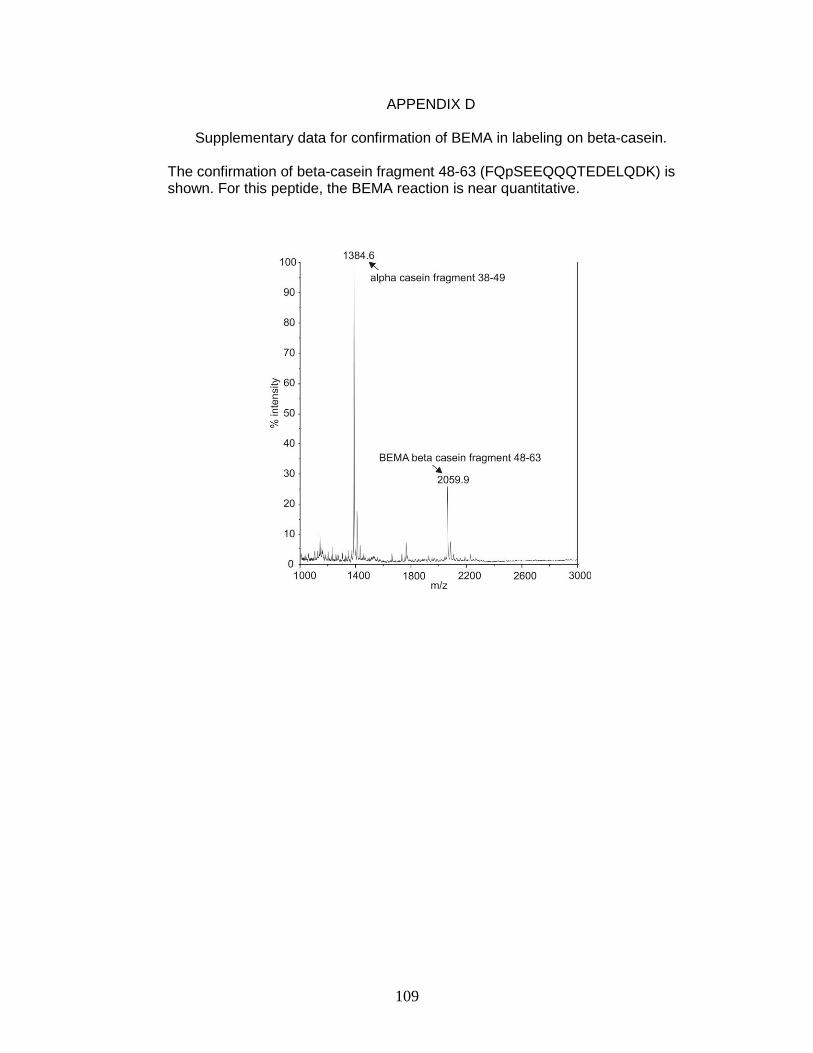
109
APPENDIX D
Supplementary data for confirmation of BEMA in labeling on beta-casein.
The confirmation of beta-casein fragment 48-63 (FQpSEEQQQTEDELQDK) is shown. For this peptide, the BEMA reaction is near quantitative.
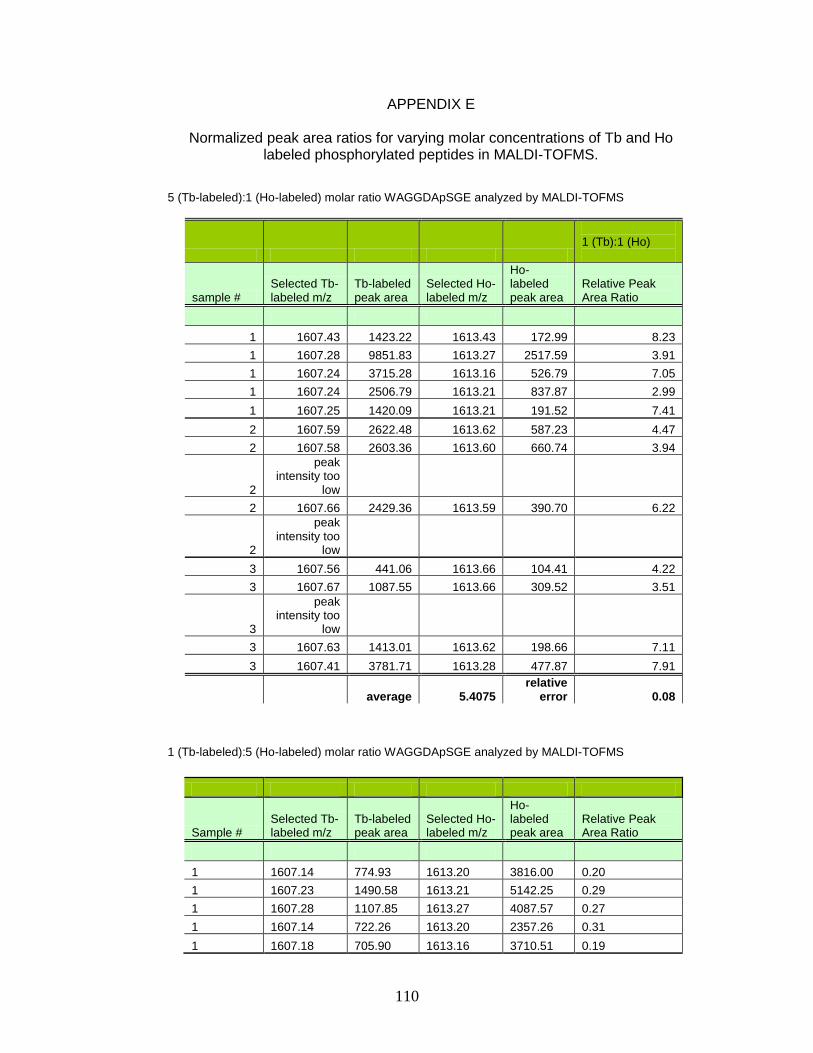
110
APPENDIX E
Normalized peak area ratios for varying molar concentrations of Tb and Ho labeled phosphorylated peptides in MALDI-TOFMS.
5 (Tb-labeled):1 (Ho-labeled) molar ratio WAGGDApSGE analyzed by MALDI-TOFMS
1 (Tb):1 (Ho)
sample # Selected Tb-labeled m/z
Tb-labeled peak area
Selected Ho-labeled m/z
Ho-labeled peak area
Relative Peak Area Ratio
1 1607.43 1423.22 1613.43 172.99 8.23
1 1607.28 9851.83 1613.27 2517.59 3.91
1 1607.24 3715.28 1613.16 526.79 7.05
1 1607.24 2506.79 1613.21 837.87 2.99
1 1607.25 1420.09 1613.21 191.52 7.41
2 1607.59 2622.48 1613.62 587.23 4.47
2 1607.58 2603.36 1613.60 660.74 3.94
2
peak intensity too
low
2 1607.66 2429.36 1613.59 390.70 6.22
2
peak intensity too
low
3 1607.56 441.06 1613.66 104.41 4.22
3 1607.67 1087.55 1613.66 309.52 3.51
3
peak intensity too
low
3 1607.63 1413.01 1613.62 198.66 7.11
3 1607.41 3781.71 1613.28 477.87 7.91
average 5.4075 relative
error 0.08
1 (Tb-labeled):5 (Ho-labeled) molar ratio WAGGDApSGE analyzed by MALDI-TOFMS
Sample # Selected Tb-labeled m/z
Tb-labeled peak area
Selected Ho-labeled m/z
Ho-labeled peak area
Relative Peak Area Ratio
1 1607.14 774.93 1613.20 3816.00 0.20
1 1607.23 1490.58 1613.21 5142.25 0.29
1 1607.28 1107.85 1613.27 4087.57 0.27
1 1607.14 722.26 1613.20 2357.26 0.31
1 1607.18 705.90 1613.16 3710.51 0.19
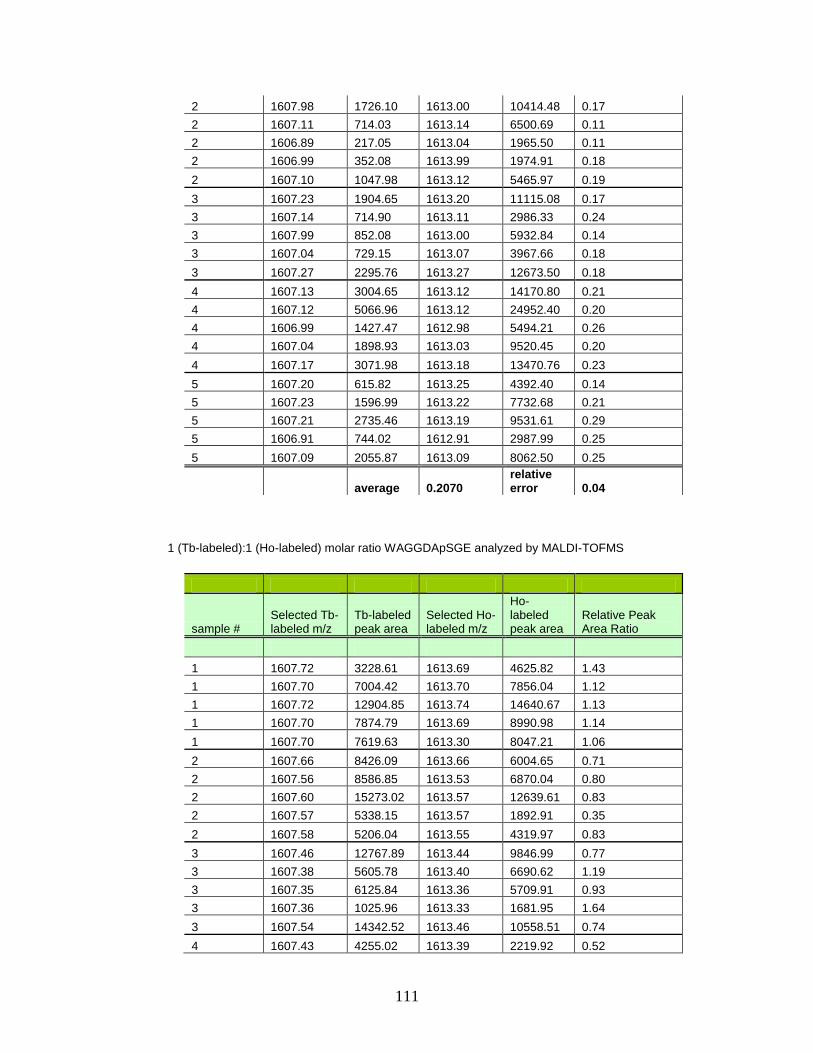
111
2 1607.98 1726.10 1613.00 10414.48 0.17
2 1607.11 714.03 1613.14 6500.69 0.11
2 1606.89 217.05 1613.04 1965.50 0.11
2 1606.99 352.08 1613.99 1974.91 0.18
2 1607.10 1047.98 1613.12 5465.97 0.19
3 1607.23 1904.65 1613.20 11115.08 0.17
3 1607.14 714.90 1613.11 2986.33 0.24
3 1607.99 852.08 1613.00 5932.84 0.14
3 1607.04 729.15 1613.07 3967.66 0.18
3 1607.27 2295.76 1613.27 12673.50 0.18
4 1607.13 3004.65 1613.12 14170.80 0.21
4 1607.12 5066.96 1613.12 24952.40 0.20
4 1606.99 1427.47 1612.98 5494.21 0.26
4 1607.04 1898.93 1613.03 9520.45 0.20
4 1607.17 3071.98 1613.18 13470.76 0.23
5 1607.20 615.82 1613.25 4392.40 0.14
5 1607.23 1596.99 1613.22 7732.68 0.21
5 1607.21 2735.46 1613.19 9531.61 0.29
5 1606.91 744.02 1612.91 2987.99 0.25
5 1607.09 2055.87 1613.09 8062.50 0.25
average 0.2070 relative error 0.04
1 (Tb-labeled):1 (Ho-labeled) molar ratio WAGGDApSGE analyzed by MALDI-TOFMS
sample # Selected Tb-labeled m/z
Tb-labeled peak area
Selected Ho-labeled m/z
Ho-labeled peak area
Relative Peak Area Ratio
1 1607.72 3228.61 1613.69 4625.82 1.43
1 1607.70 7004.42 1613.70 7856.04 1.12
1 1607.72 12904.85 1613.74 14640.67 1.13
1 1607.70 7874.79 1613.69 8990.98 1.14
1 1607.70 7619.63 1613.30 8047.21 1.06
2 1607.66 8426.09 1613.66 6004.65 0.71
2 1607.56 8586.85 1613.53 6870.04 0.80
2 1607.60 15273.02 1613.57 12639.61 0.83
2 1607.57 5338.15 1613.57 1892.91 0.35
2 1607.58 5206.04 1613.55 4319.97 0.83
3 1607.46 12767.89 1613.44 9846.99 0.77
3 1607.38 5605.78 1613.40 6690.62 1.19
3 1607.35 6125.84 1613.36 5709.91 0.93
3 1607.36 1025.96 1613.33 1681.95 1.64
3 1607.54 14342.52 1613.46 10558.51 0.74
4 1607.43 4255.02 1613.39 2219.92 0.52
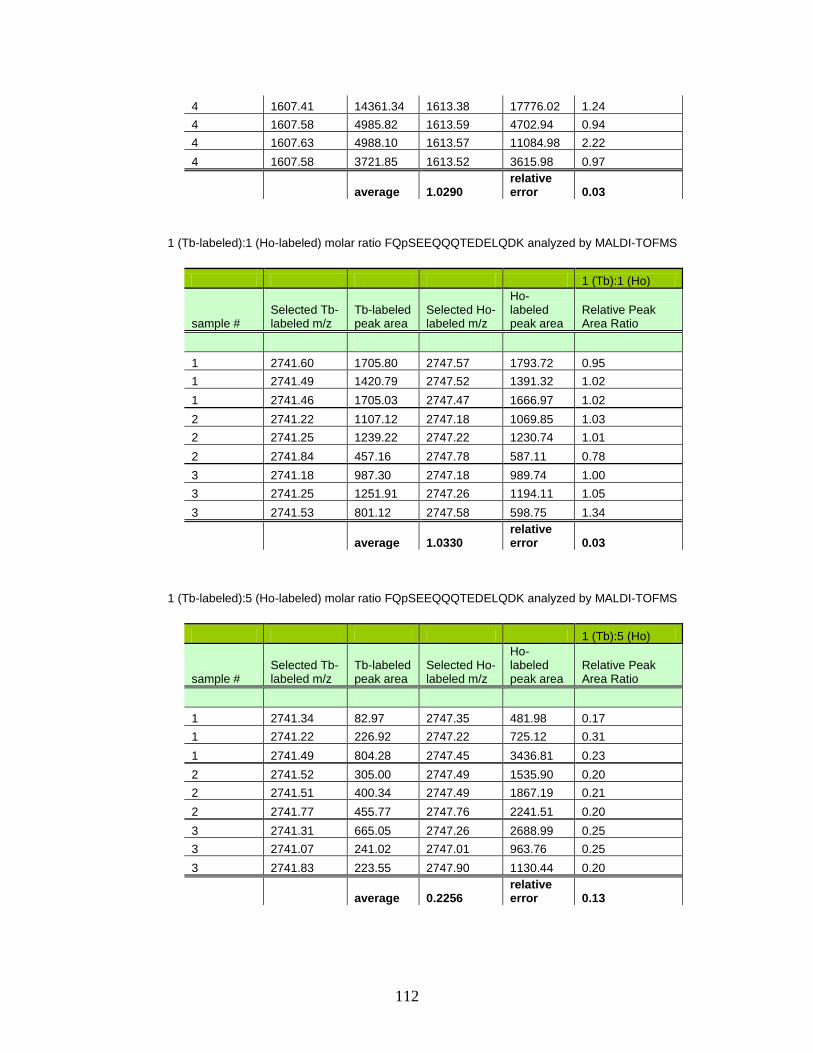
112
4 1607.41 14361.34 1613.38 17776.02 1.24
4 1607.58 4985.82 1613.59 4702.94 0.94
4 1607.63 4988.10 1613.57 11084.98 2.22
4 1607.58 3721.85 1613.52 3615.98 0.97
average 1.0290 relative error 0.03
1 (Tb-labeled):1 (Ho-labeled) molar ratio FQpSEEQQQTEDELQDK analyzed by MALDI-TOFMS
1 (Tb):1 (Ho)
sample # Selected Tb-labeled m/z
Tb-labeled peak area
Selected Ho-labeled m/z
Ho-labeled peak area
Relative Peak Area Ratio
1 2741.60 1705.80 2747.57 1793.72 0.95
1 2741.49 1420.79 2747.52 1391.32 1.02
1 2741.46 1705.03 2747.47 1666.97 1.02
2 2741.22 1107.12 2747.18 1069.85 1.03
2 2741.25 1239.22 2747.22 1230.74 1.01
2 2741.84 457.16 2747.78 587.11 0.78
3 2741.18 987.30 2747.18 989.74 1.00
3 2741.25 1251.91 2747.26 1194.11 1.05
3 2741.53 801.12 2747.58 598.75 1.34
average 1.0330 relative error 0.03
1 (Tb-labeled):5 (Ho-labeled) molar ratio FQpSEEQQQTEDELQDK analyzed by MALDI-TOFMS
1 (Tb):5 (Ho)
sample # Selected Tb-labeled m/z
Tb-labeled peak area
Selected Ho-labeled m/z
Ho-labeled peak area
Relative Peak Area Ratio
1 2741.34 82.97 2747.35 481.98 0.17
1 2741.22 226.92 2747.22 725.12 0.31
1 2741.49 804.28 2747.45 3436.81 0.23
2 2741.52 305.00 2747.49 1535.90 0.20
2 2741.51 400.34 2747.49 1867.19 0.21
2 2741.77 455.77 2747.76 2241.51 0.20
3 2741.31 665.05 2747.26 2688.99 0.25
3 2741.07 241.02 2747.01 963.76 0.25
3 2741.83 223.55 2747.90 1130.44 0.20
average 0.2256 relative error 0.13
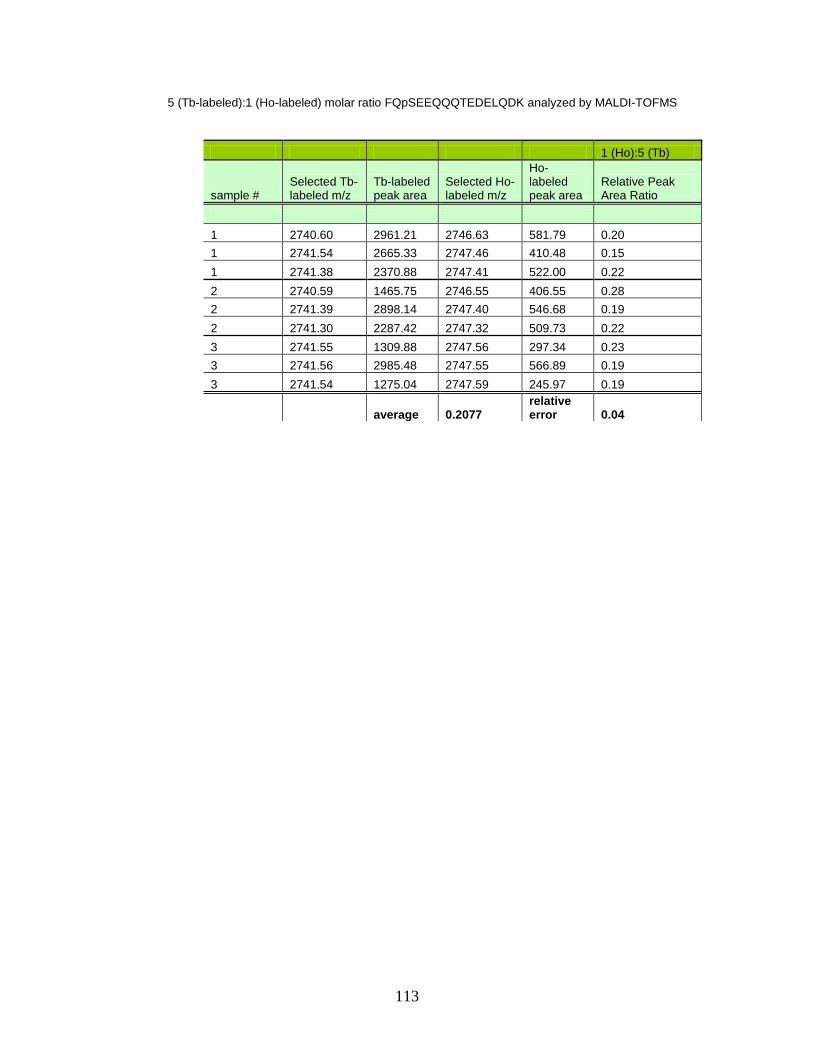
113
5 (Tb-labeled):1 (Ho-labeled) molar ratio FQpSEEQQQTEDELQDK analyzed by MALDI-TOFMS
1 (Ho):5 (Tb)
sample # Selected Tb-labeled m/z
Tb-labeled peak area
Selected Ho-labeled m/z
Ho-labeled peak area
Relative Peak Area Ratio
1 2740.60 2961.21 2746.63 581.79 0.20
1 2741.54 2665.33 2747.46 410.48 0.15
1 2741.38 2370.88 2747.41 522.00 0.22
2 2740.59 1465.75 2746.55 406.55 0.28
2 2741.39 2898.14 2747.40 546.68 0.19
2 2741.30 2287.42 2747.32 509.73 0.22
3 2741.55 1309.88 2747.56 297.34 0.23
3 2741.56 2985.48 2747.55 566.89 0.19
3 2741.54 1275.04 2747.59 245.97 0.19
average 0.2077 relative error 0.04
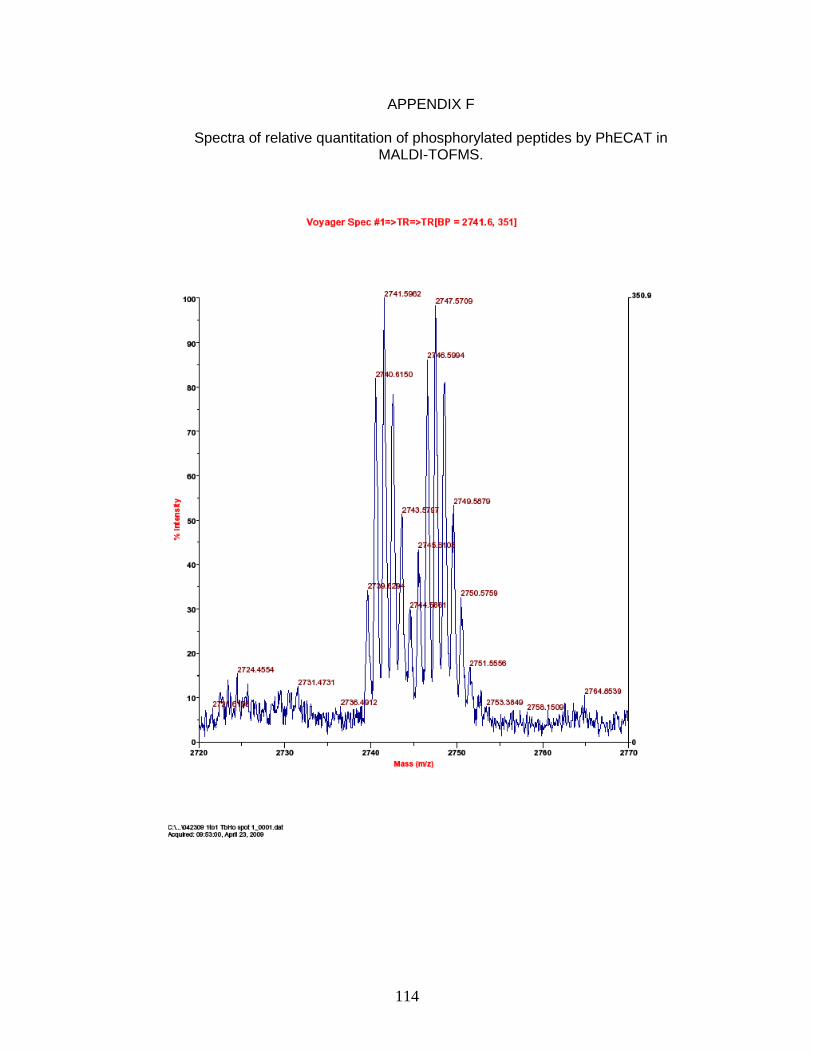
114
APPENDIX F
Spectra of relative quantitation of phosphorylated peptides by PhECAT in MALDI-TOFMS.
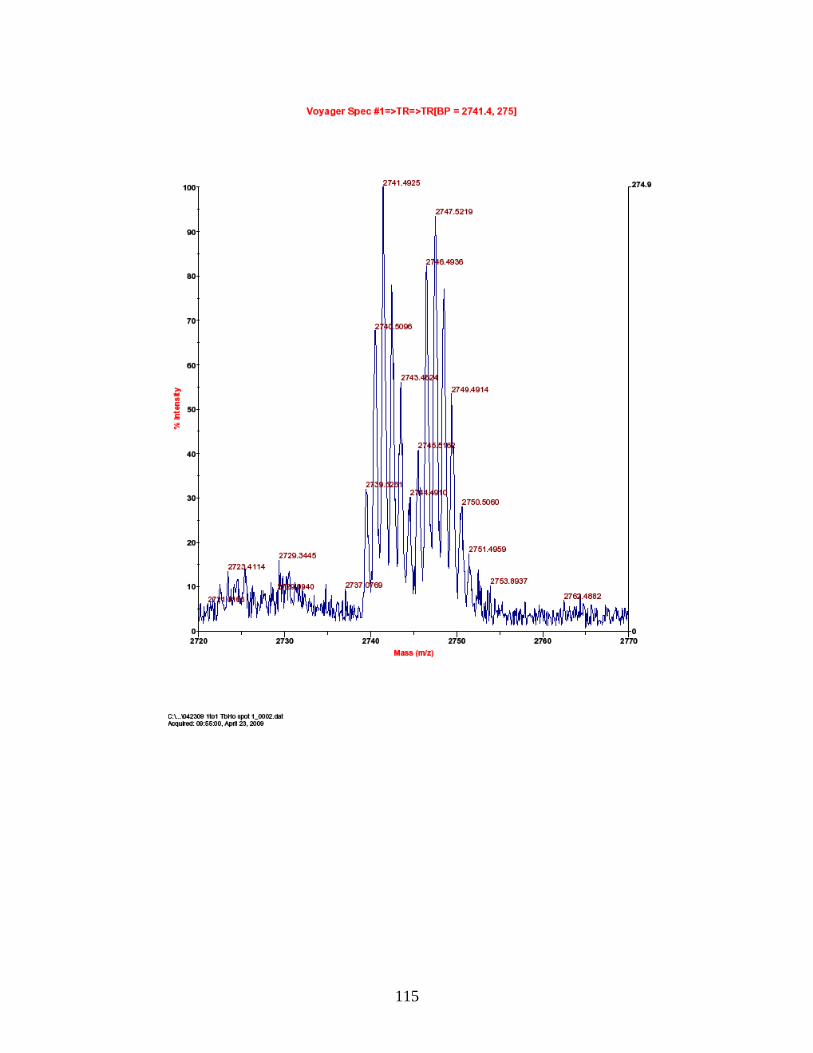
115
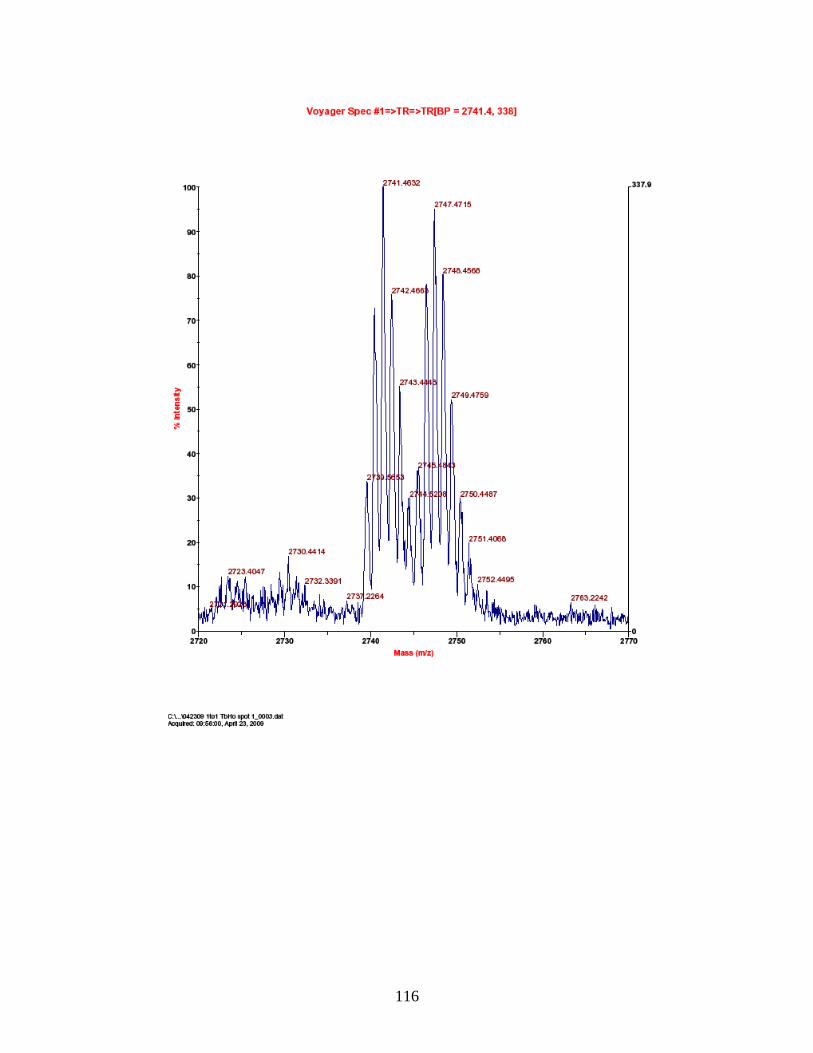
116
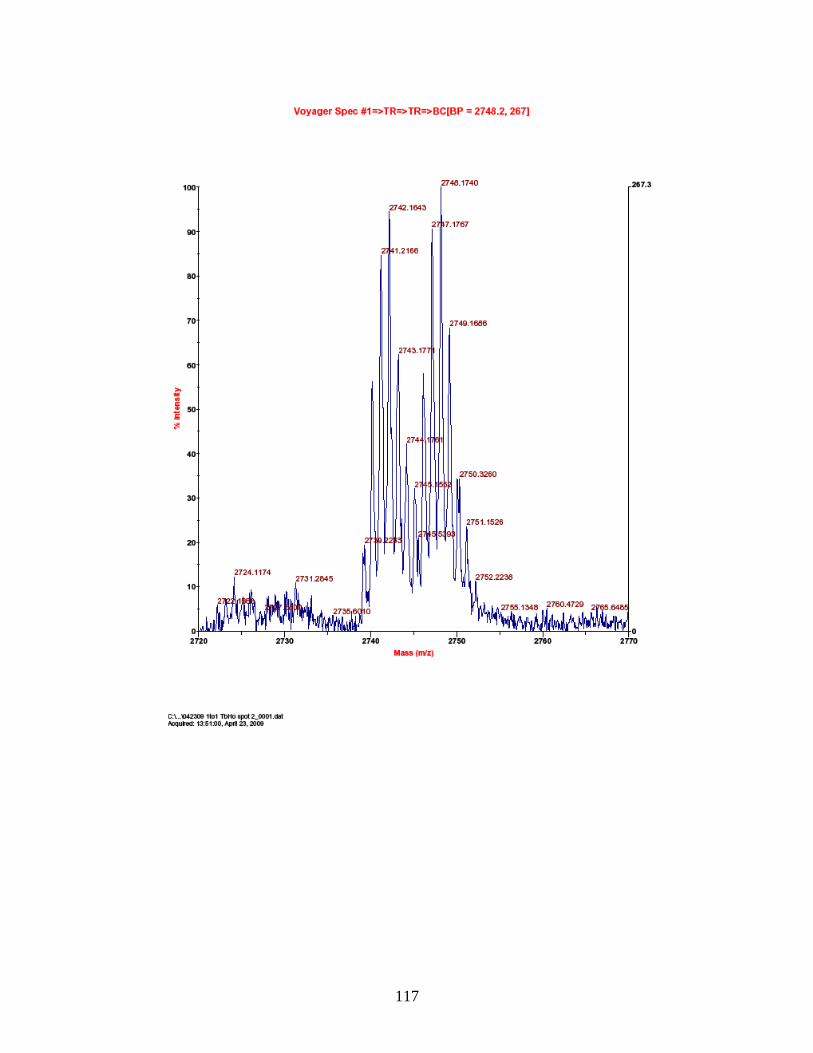
117
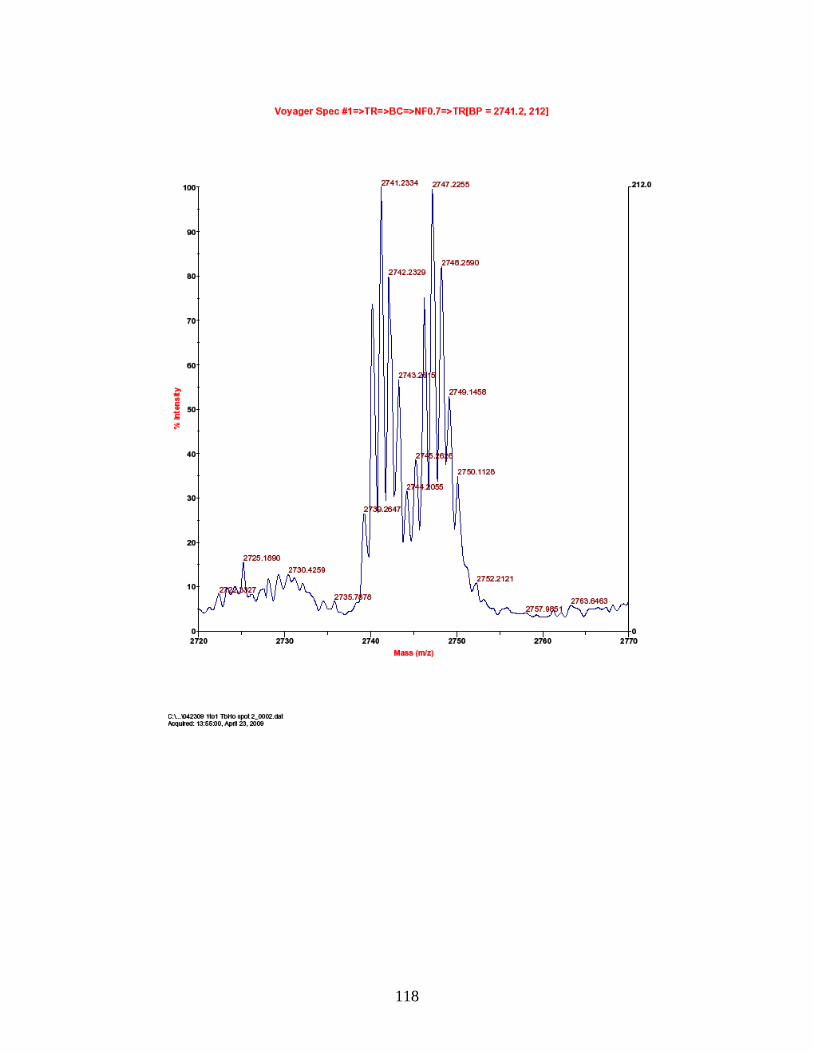
118
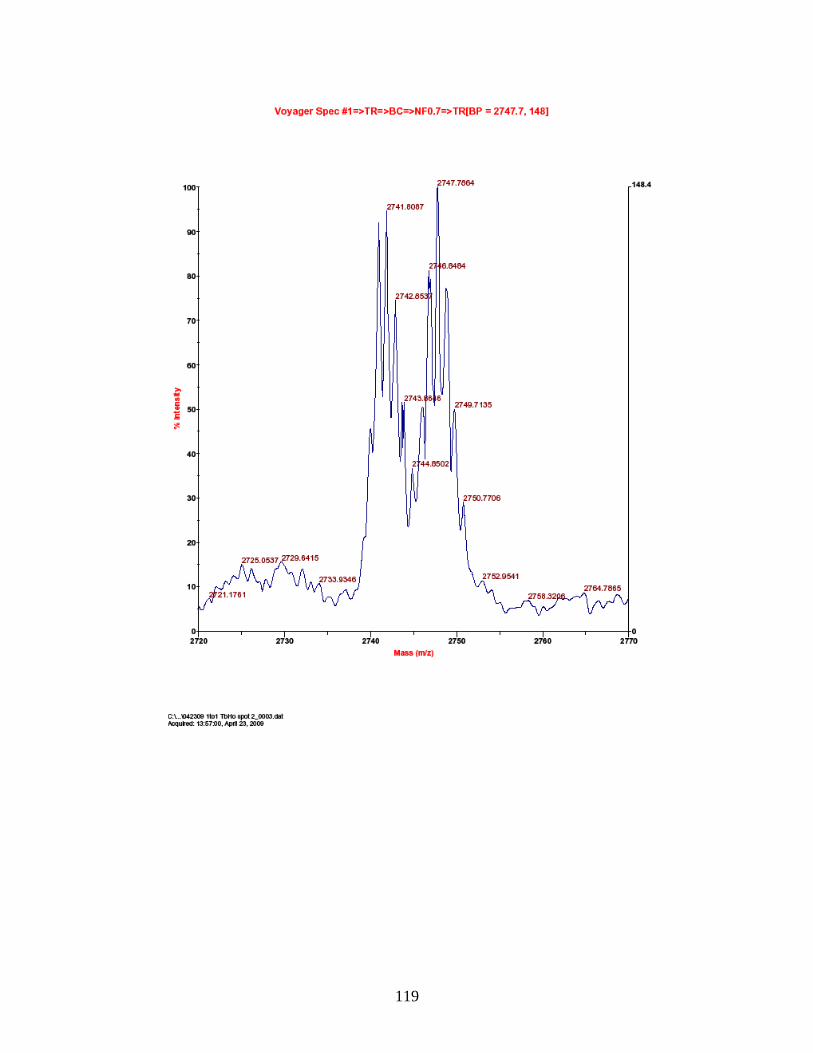
119
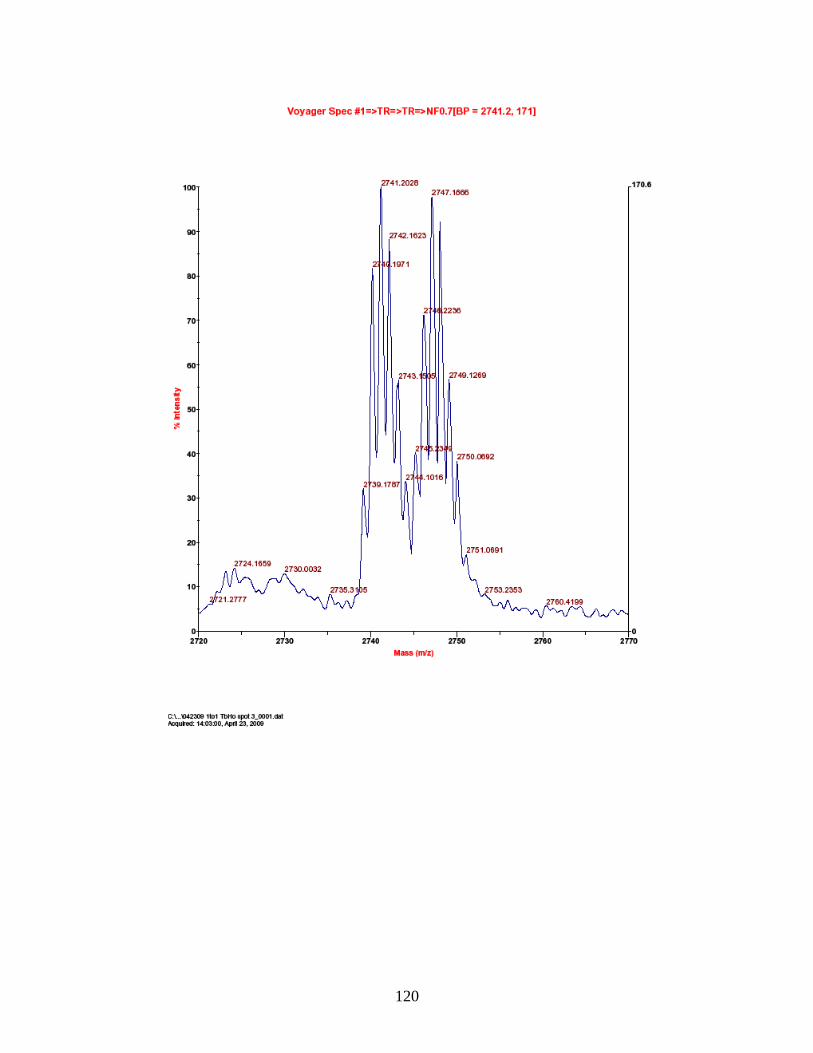
120
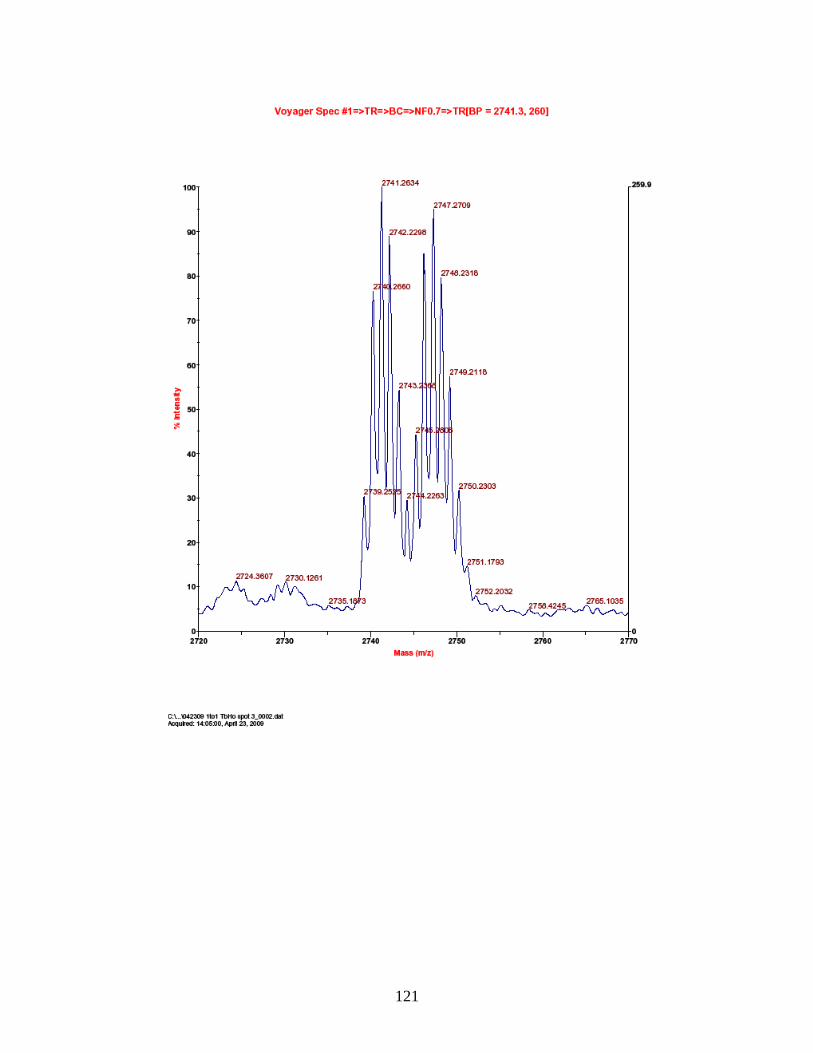
121
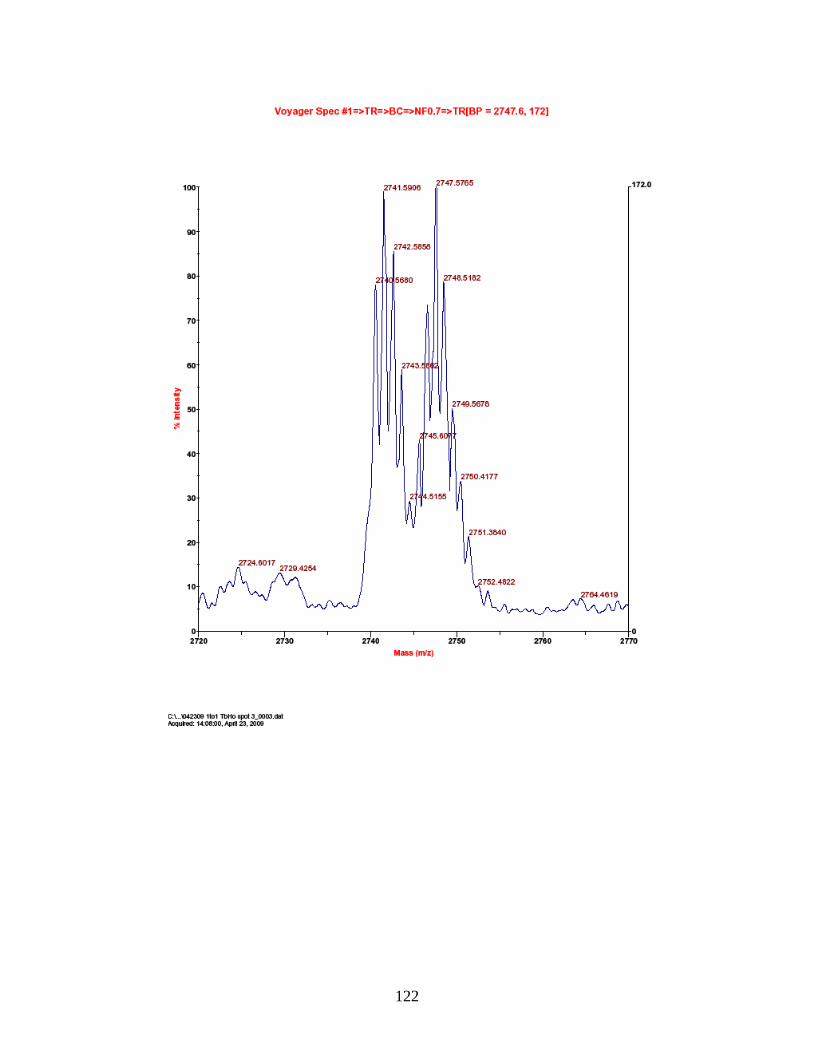
122
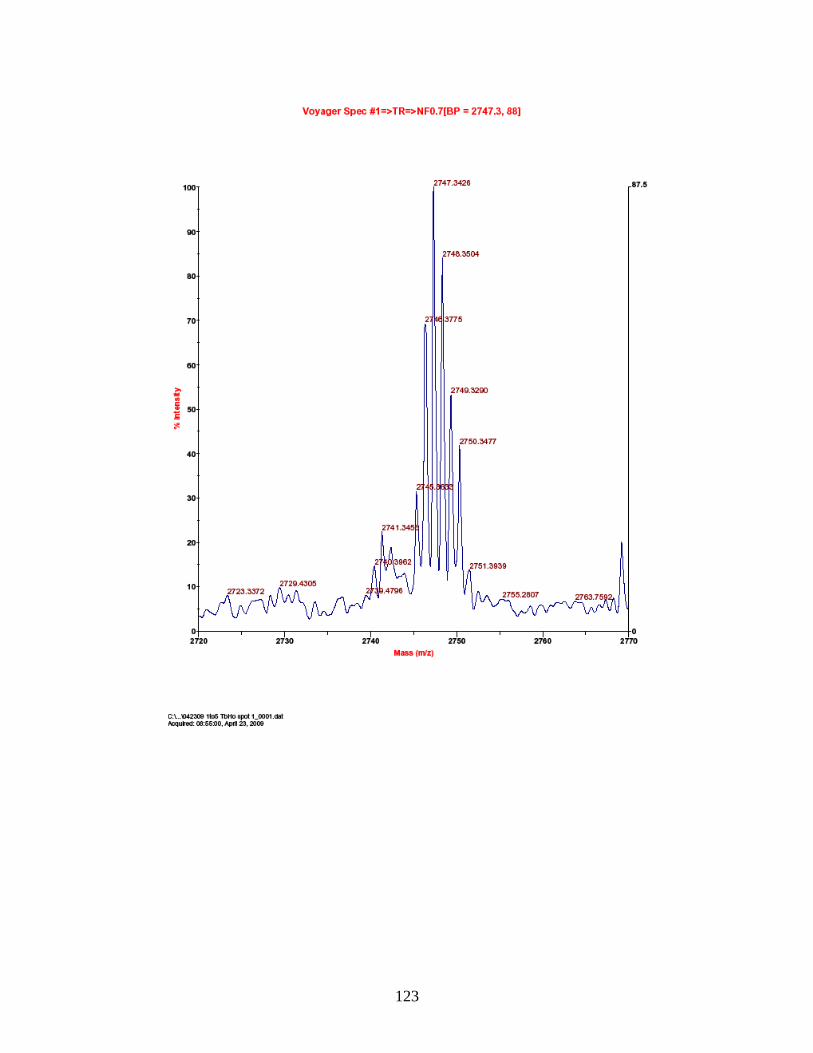
123
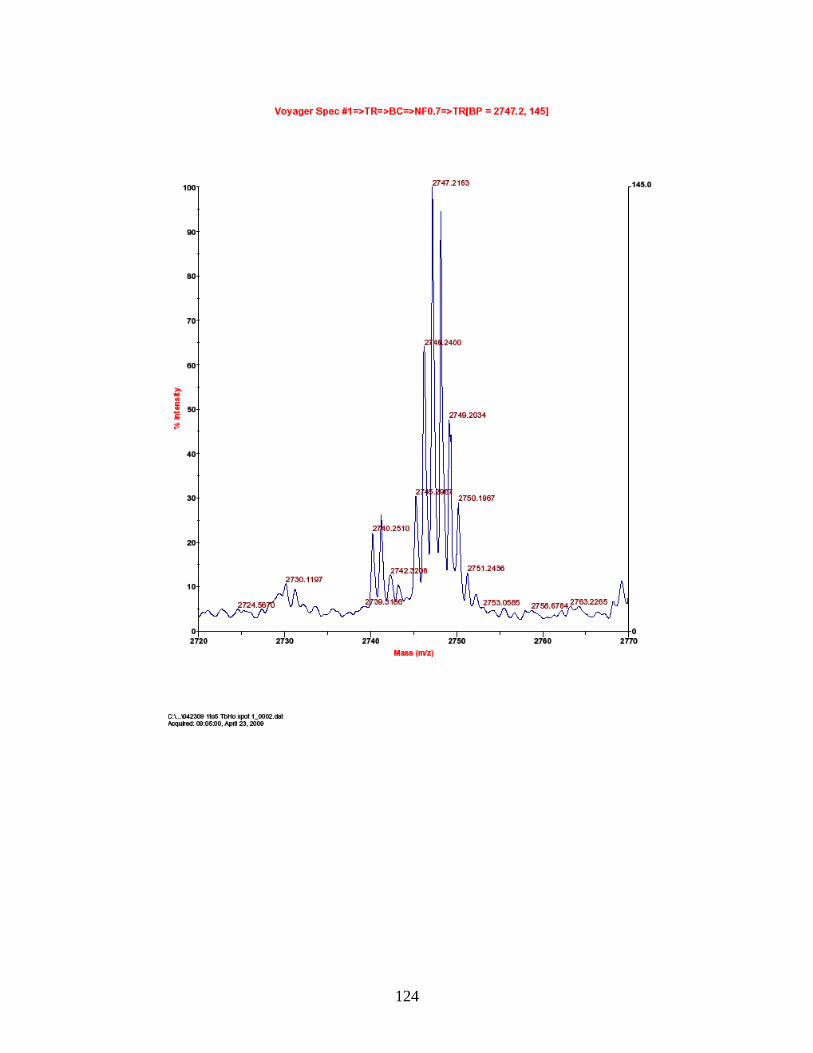
124
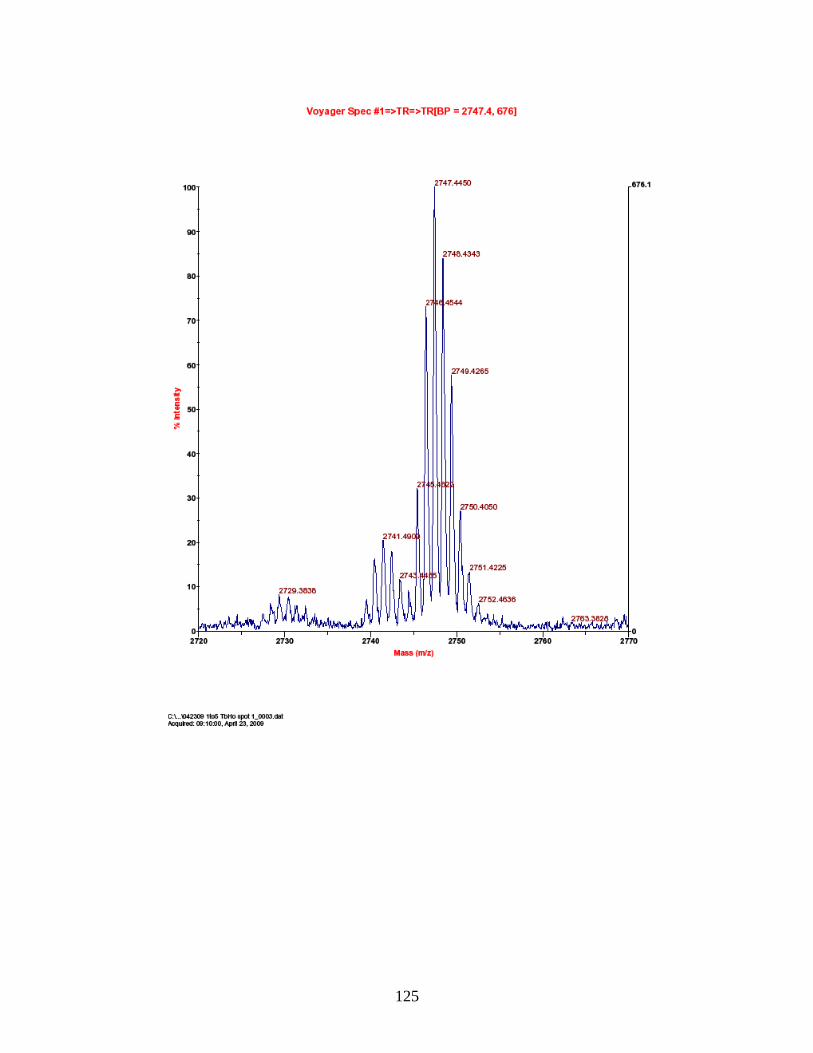
125
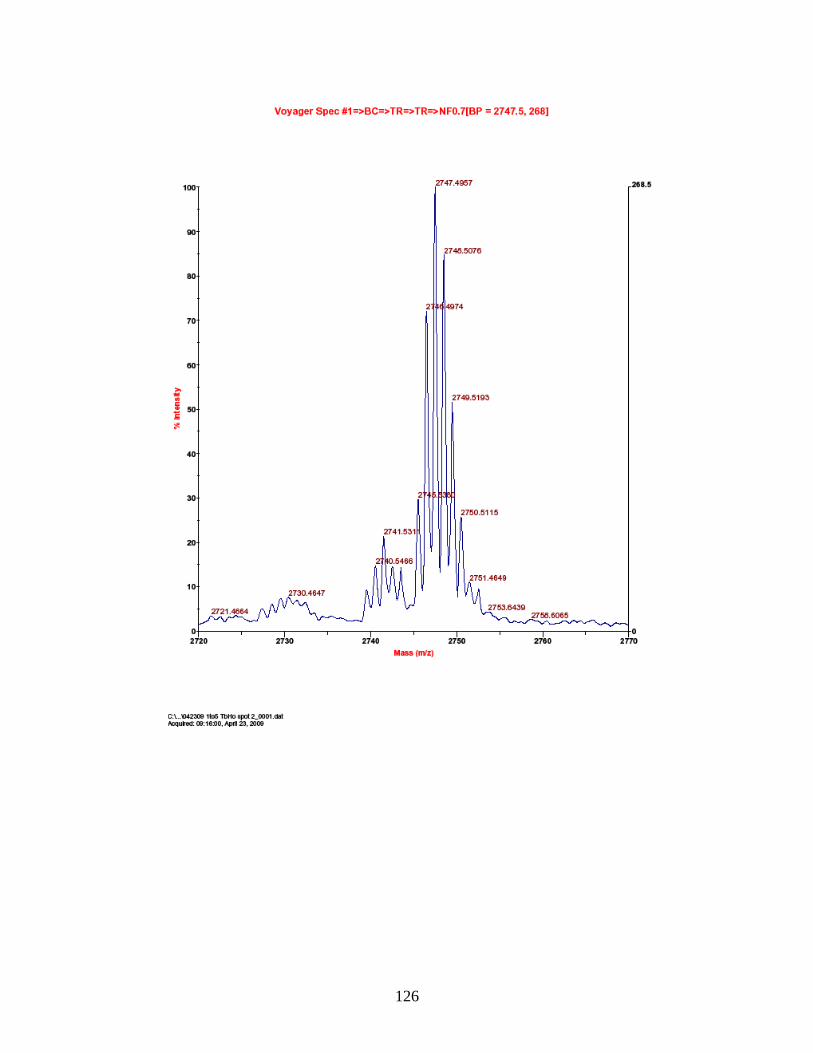
126
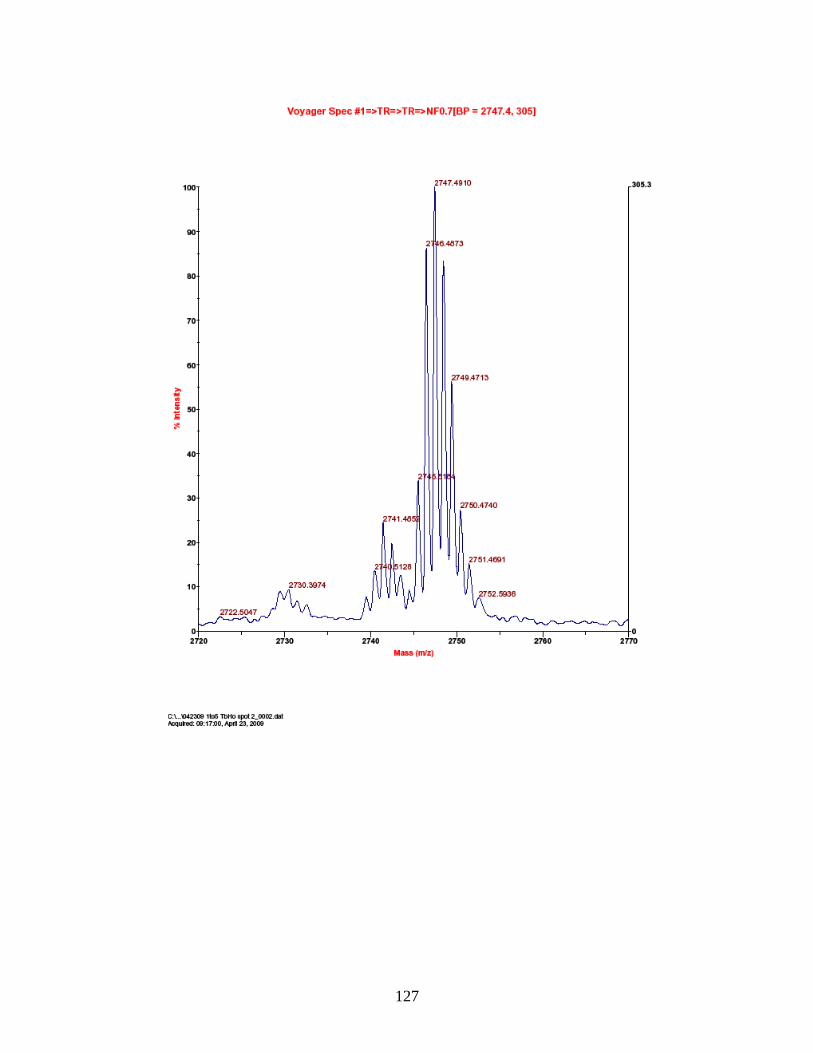
127
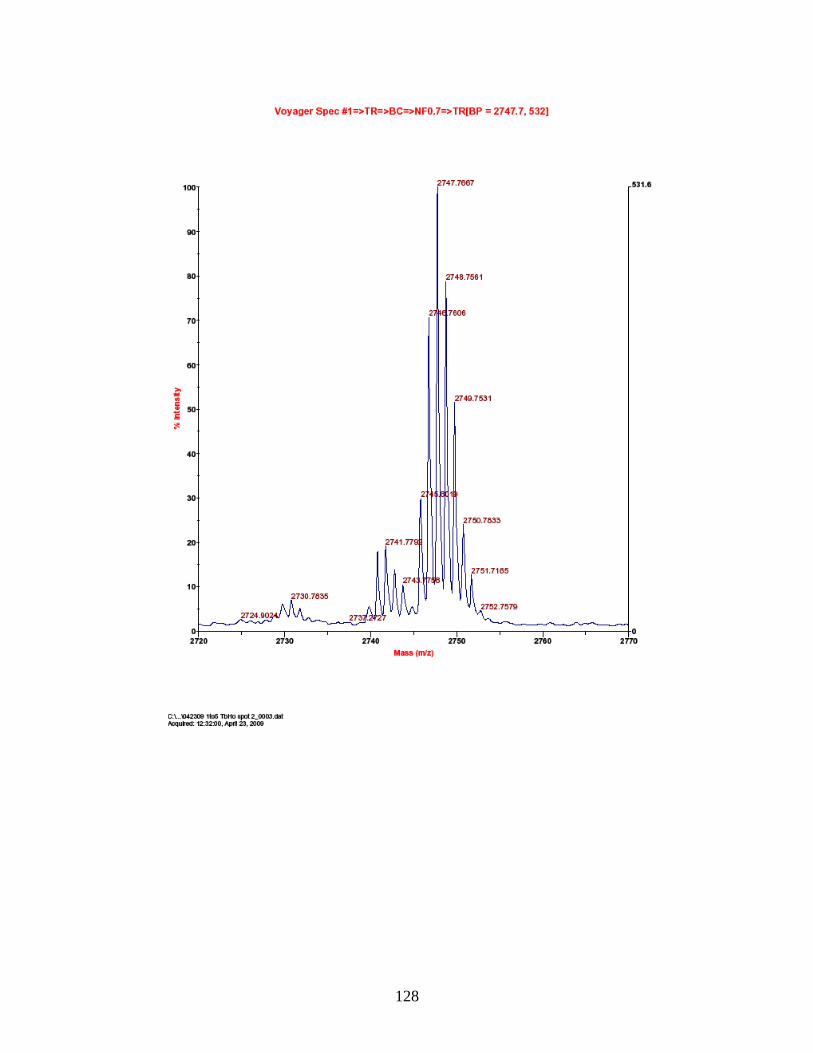
128
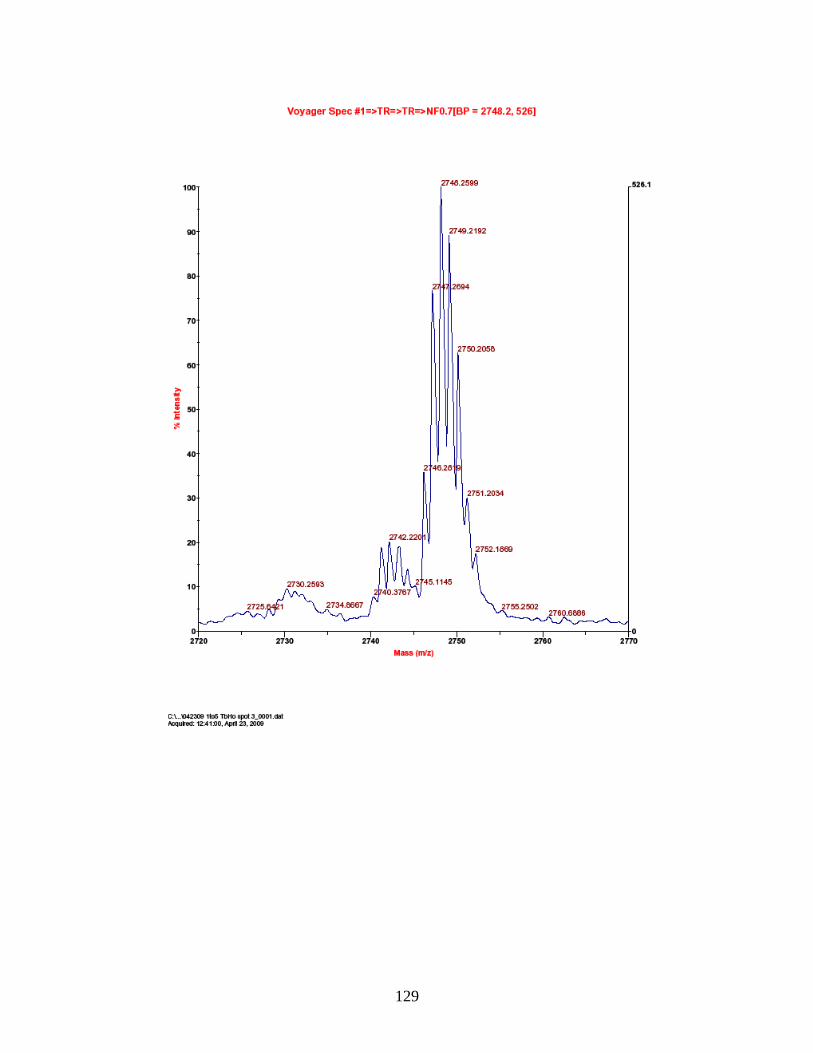
129

130
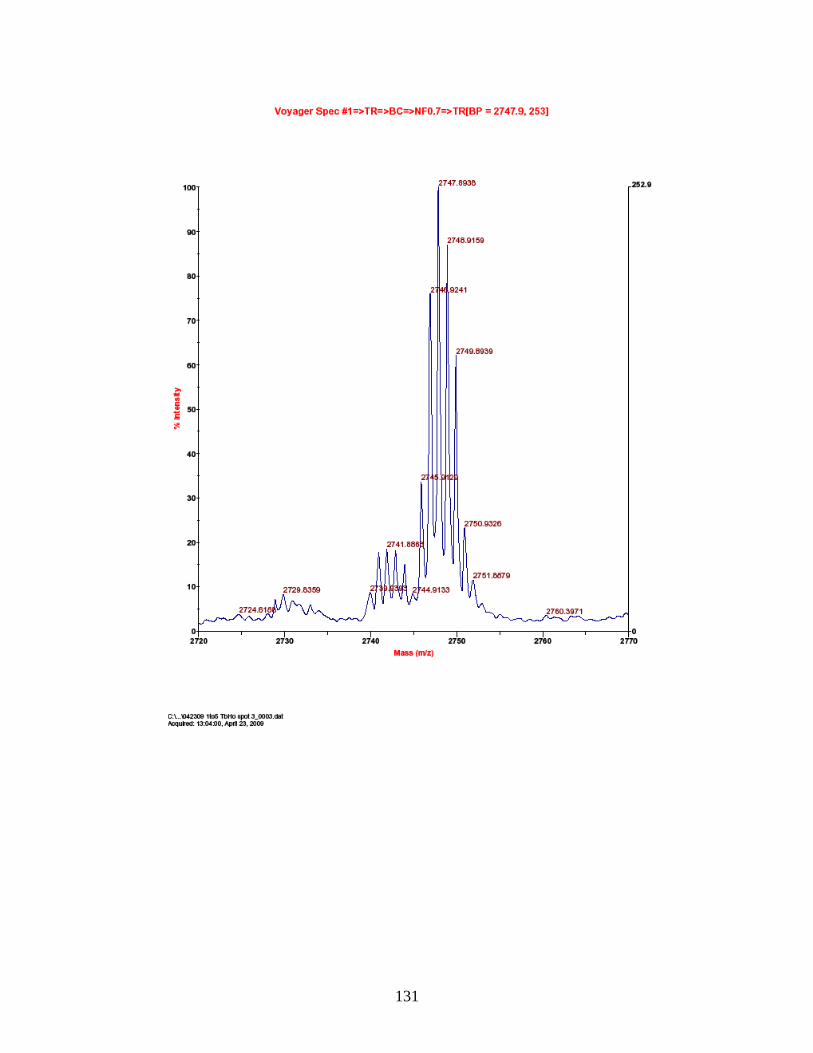
131
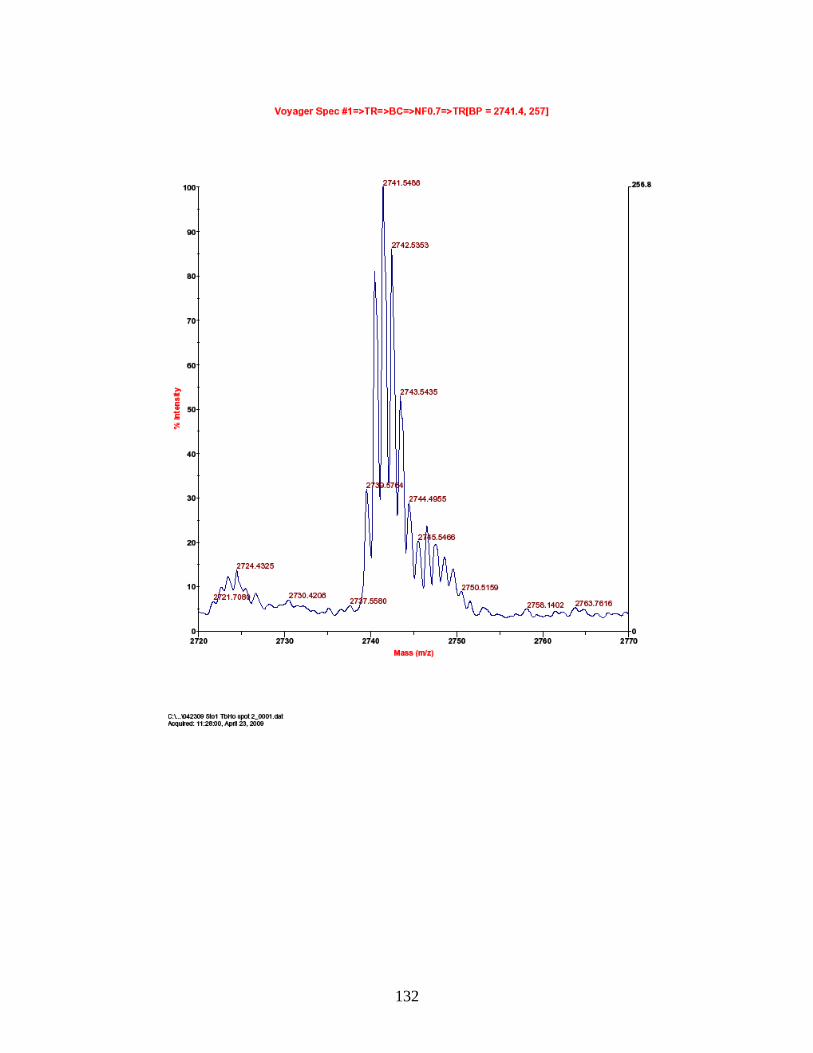
132
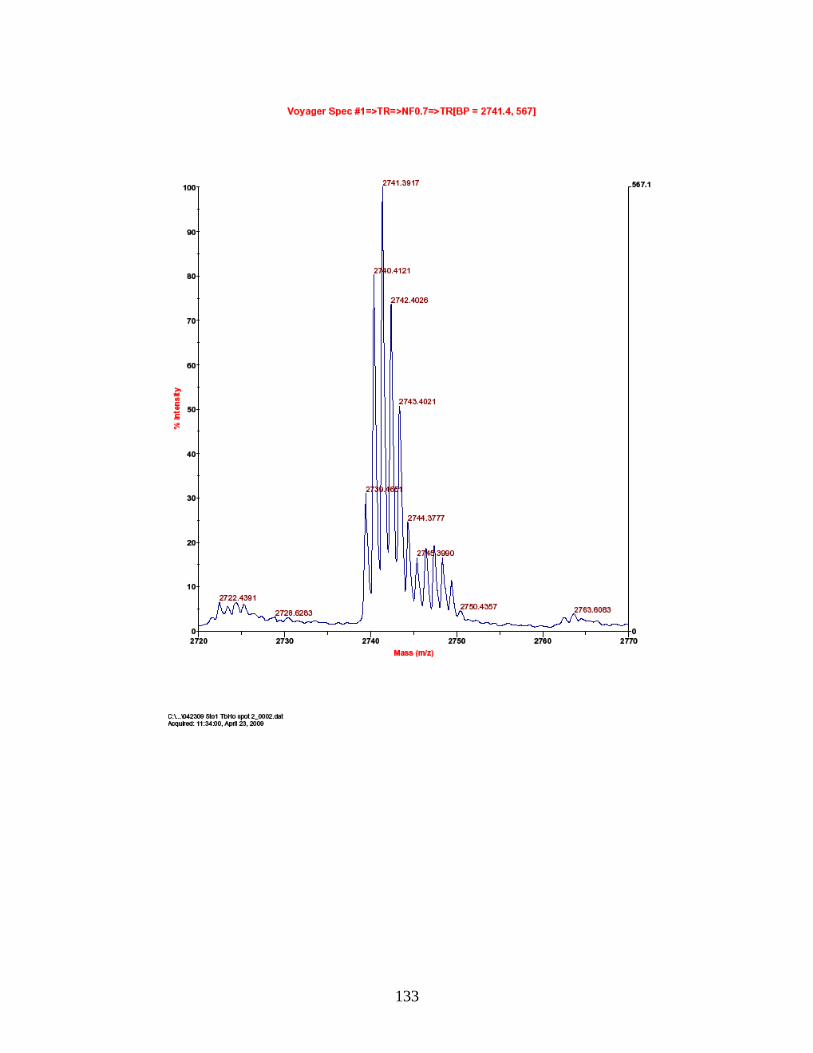
133
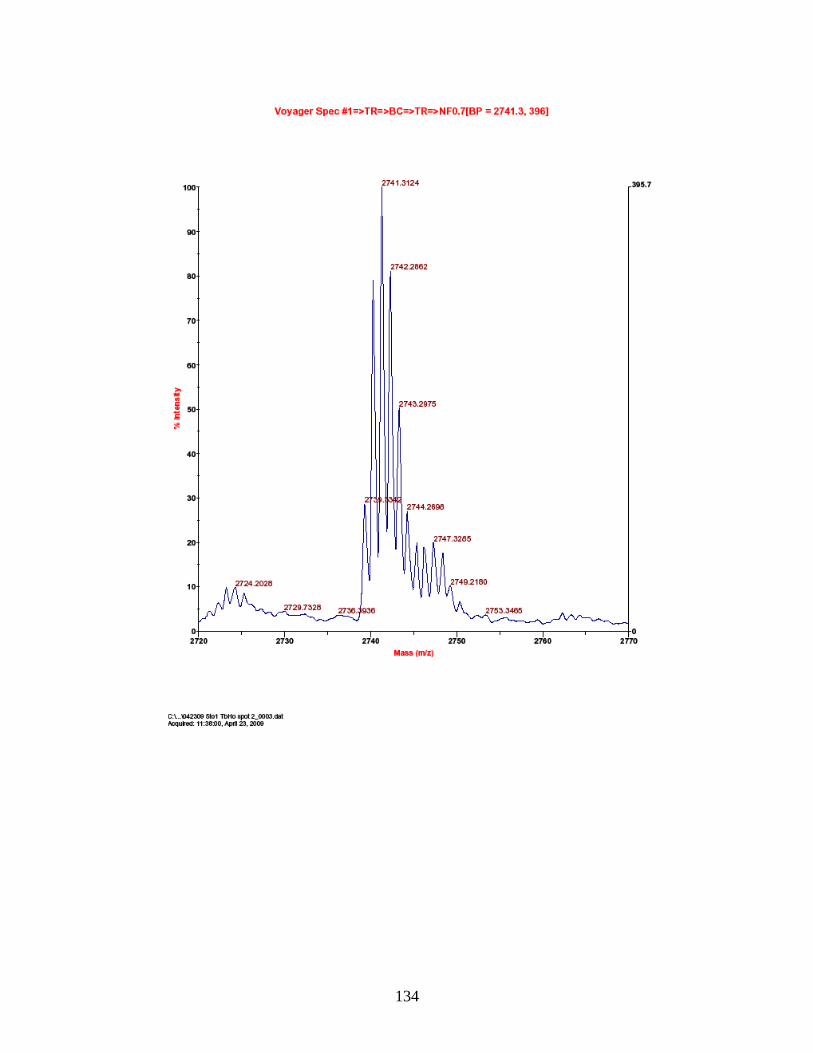
134
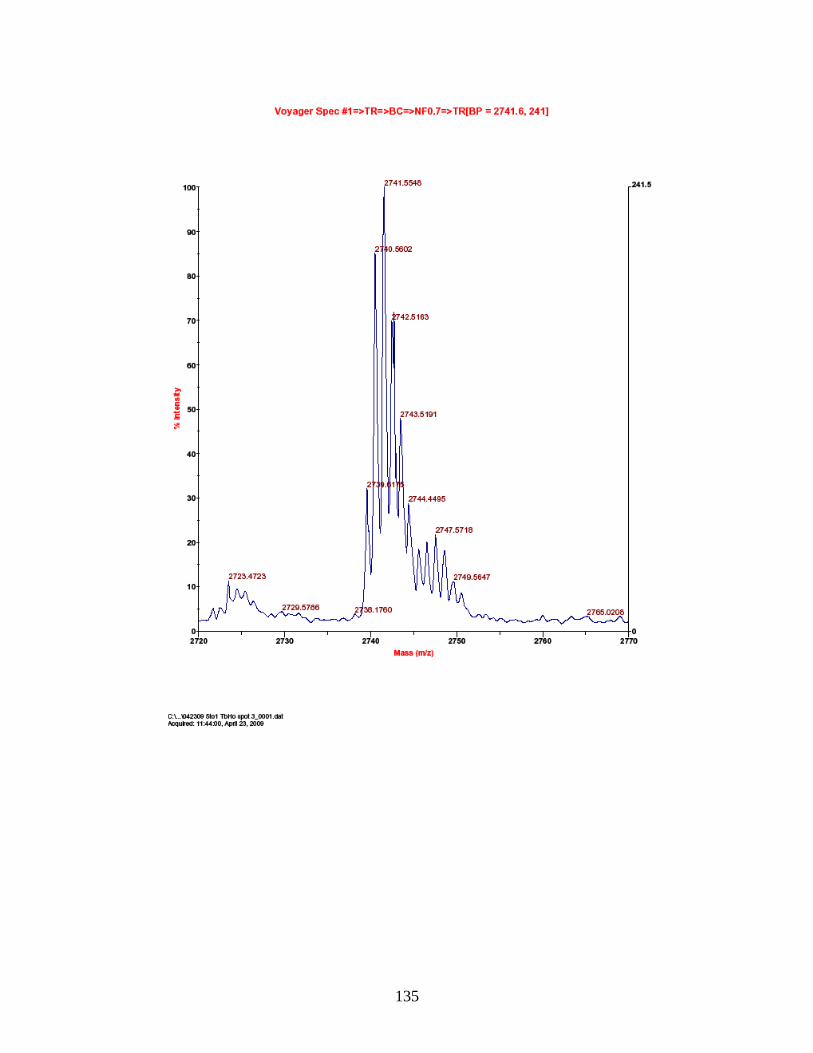
135
136
137
138
APPENDIX G
G. Predicted and observed ions for Tb-labeled FQSEEQQQTEDELQDK as represented in Figure 18.
*s,y,t = phosphorylated S,Y,T
Predicted b ion m/z Predicted b-H2O ion m/z
# Predicted b ion m/z Tb-labeled Observed
Predicted b-H2O ion m/z Tb-labeled Observed
F 1 --- --- --- --- --- ---
Q 2 276.13 --- --- --- --- ---
s* 3 443.13 1121.58 1121.33 --- ---
E 4 572.18 1250.62 1250.62 554.16 1232.61 1232.53
E 5 701.22 1379.66 1379.47 683.21 1361.65 1361.73
Q 6 829.28 1507.72 1507.50 811.27 1489.71 ---
Q 7 957.34 1635.78 1635.51 939.32 1617.77 1618.54
Q 8 1085.39 1763.84 1763.60 1067.38 1745.83 1745.51
T 9 1186.44 1864.89 1865.58 1168.43 1846.87 1846.73
E 10 1315.48 1993.93 1993.68 1297.47 1975.92 1975.82
D 11 1430.51 2108.95 2108.74 1412.50 2090.94 2090.29
E 12 1559.55 2238.00 2237.80 1541.54 2219.99 ---
L 13 1672.64 2351.08 2350.86 1654.63 2333.07 2332.80
Q 14 1800.70 2479.14 2479.96 1782.69 2461.13 2461.77
D 15 1915.72 2594.17 2594.97 1897.71 2576.16 2576.87
K 16 --- --- --- --- ---
Predicted y ion m/z
Predicted y-H2O ion m/z
ion #
Predicted y ion m/z
Tb-Labeled Observed
Predicted y-H2O ion m/z Tb-labeled Observed
F 16 --- --- --- --- --- ---
Q 15 1914.76 2593.20 2593.55 1896.75 2575.19 ---
s* 14 1786.70 2465.15 2465.85 1768.69 2447.13 2447.90
E 13 1619.70 --- --- 1601.69 --- ---
E 12 1490.66 --- --- 1472.65 --- ---
Q 11 1361.62 --- --- 1343.61 --- ---
Q 10 1233.56 --- --- 1215.55 --- ---
Q 9 1105.50 --- --- 1087.49 --- ---
T 8 977.44 --- --- 959.43 --- ---
E 7 876.39 --- --- 858.38 --- ---
D 6 747.35 --- --- 729.34 --- ---
E 5 632.33 --- --- 614.31 --- ---
L 4 503.28 --- --- 485.27 --- ---
Q 3 390.20 --- --- 372.19 --- ---
D 2 262.14 --- --- 244.13 --- ---
K 1 147.11 --- --- --- --- ---
139
APPENDIX H
Normalized peak area ratios for varying molar concentrations of Tb and Ho labeled phosphorylated peptides in MALDI-IM-TOFMS.
1(Pr-labeled):1(Tb-labeled):5(Ho-labeled) FQpSEEQQQTEDELQDK analyzed by MALDI-IM-TOFMS
1(Pr):5(Ho), 1(Tb):5(Ho)
sam-ple #
Pr, Tb, and Ho-labeled m/z
Pr-labeled peak area
Tb-labeled peak area
Ho-labeled peak area
Relative Peak Area Ratio
1 2723.30, 2741.77, 2747.20 36.31 31.14 375.00 0.10, 0.08
1 2723.17, 2741.23, 2747.21 27.81 30.19 451.00 0.06, 0.07
1 2723.25, 2741.09, 2747.19 55.64 42.56 551.70 0.10, 0.08
2 2723.30, 2741.50, 2747.23 79.97 74.28 380.40 0.21, 0.20
2 2723.37, 2741.42, 2747.24 101.00 81.28 458.40 0.22, 0.18
2 2723.27, 2741.43, 2747.24 65.38 66.75 448.60 0.15, 0.15
3 2723.37, 2741.43, 2747.23 85.00 179.00 507.00 0.17, 0.35
3 2723.22, 2741.68, 2747.23 43.25 52.57 364.40 0.12, 0.14
3 2723.30, 2741.72, 2747.23 55.58 39.42 413.80 0.13, 0.10
average 0.1400, 0.1300
relative error -0.30, -0.35
3 (Tb-labeled):1 (Ho-labeled) molar ratio FQpSEEQQQTEDELQDK analyzed by MALDI-IM-TOFMS
3 (Tb):1 (Ho)
sam-ple #
Selected Tb-labeled m/z
Tb-labeled peak area
Selected Ho-labeled m/z
Ho-labeled peak area
Relative Peak Area Ratio
1 2741.99 168.40 2747.01 64.19 2.62
2 2741.00 142.40 2747.01 58.98 2.41
3 2740.98 377.10 2747.01 132.00 2.86
4 2740.99 61.52 2747.00 36.29 1.70
5 2740.98 559.70 2747.00 241.50 2.32
6 2740.99 485.00 2747.01 226.40 2.14
average 2.3416 relative error -0.22
1 (Tb-labeled):1 (Ho-labeled) molar ratio FQpSEEQQQTEDELQDK
1 (Tb):1 (Ho)
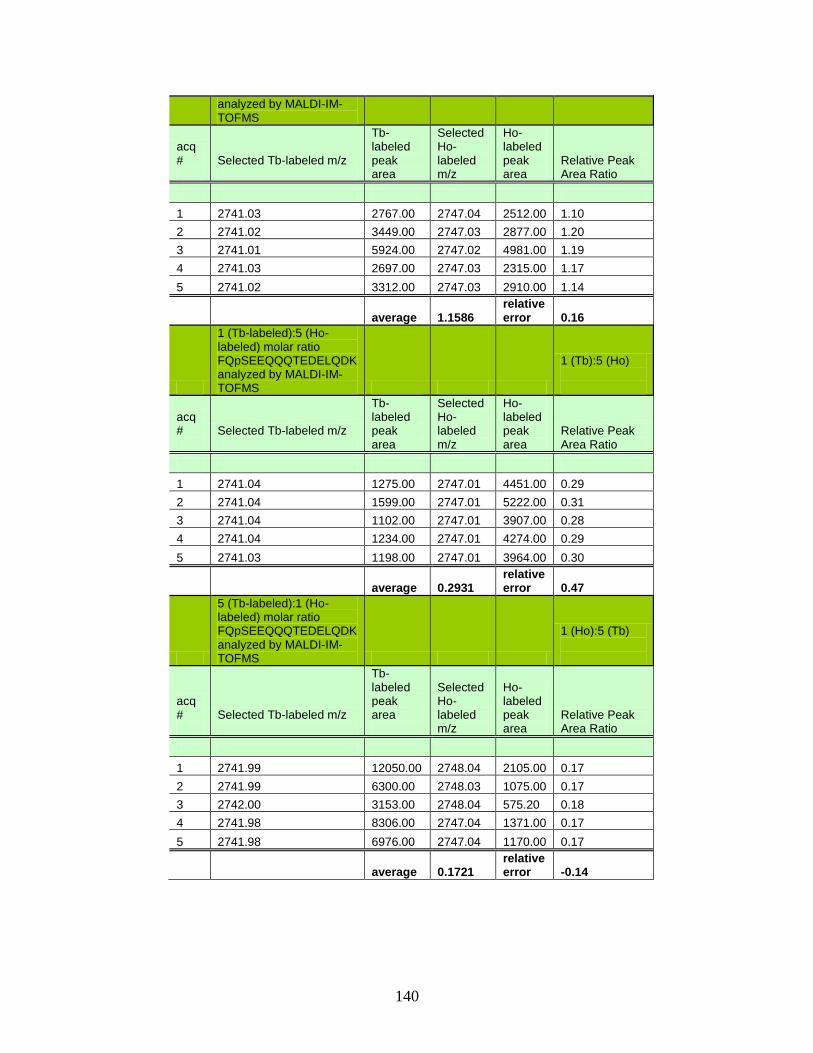
140
analyzed by MALDI-IM-TOFMS
acq #
Selected Tb-labeled m/z
Tb-labeled peak area
Selected Ho-labeled m/z
Ho-labeled peak area
Relative Peak Area Ratio
1 2741.03 2767.00 2747.04 2512.00 1.10
2 2741.02 3449.00 2747.03 2877.00 1.20
3 2741.01 5924.00 2747.02 4981.00 1.19
4 2741.03 2697.00 2747.03 2315.00 1.17
5 2741.02 3312.00 2747.03 2910.00 1.14
average 1.1586 relative error 0.16
1 (Tb-labeled):5 (Ho-labeled) molar ratio FQpSEEQQQTEDELQDK analyzed by MALDI-IM-TOFMS
1 (Tb):5 (Ho)
acq #
Selected Tb-labeled m/z
Tb-labeled peak area
Selected Ho-labeled m/z
Ho-labeled peak area
Relative Peak Area Ratio
1 2741.04 1275.00 2747.01 4451.00 0.29
2 2741.04 1599.00 2747.01 5222.00 0.31
3 2741.04 1102.00 2747.01 3907.00 0.28
4 2741.04 1234.00 2747.01 4274.00 0.29
5 2741.03 1198.00 2747.01 3964.00 0.30
average 0.2931 relative error 0.47
5 (Tb-labeled):1 (Ho-labeled) molar ratio FQpSEEQQQTEDELQDK analyzed by MALDI-IM-TOFMS
1 (Ho):5 (Tb)
acq #
Selected Tb-labeled m/z
Tb-labeled peak area
Selected Ho-labeled m/z
Ho-labeled peak area
Relative Peak Area Ratio
1 2741.99 12050.00 2748.04 2105.00 0.17
2 2741.99 6300.00 2748.03 1075.00 0.17
3 2742.00 3153.00 2748.04 575.20 0.18
4 2741.98 8306.00 2747.04 1371.00 0.17
5 2741.98 6976.00 2747.04 1170.00 0.17
average 0.1721 relative error -0.14
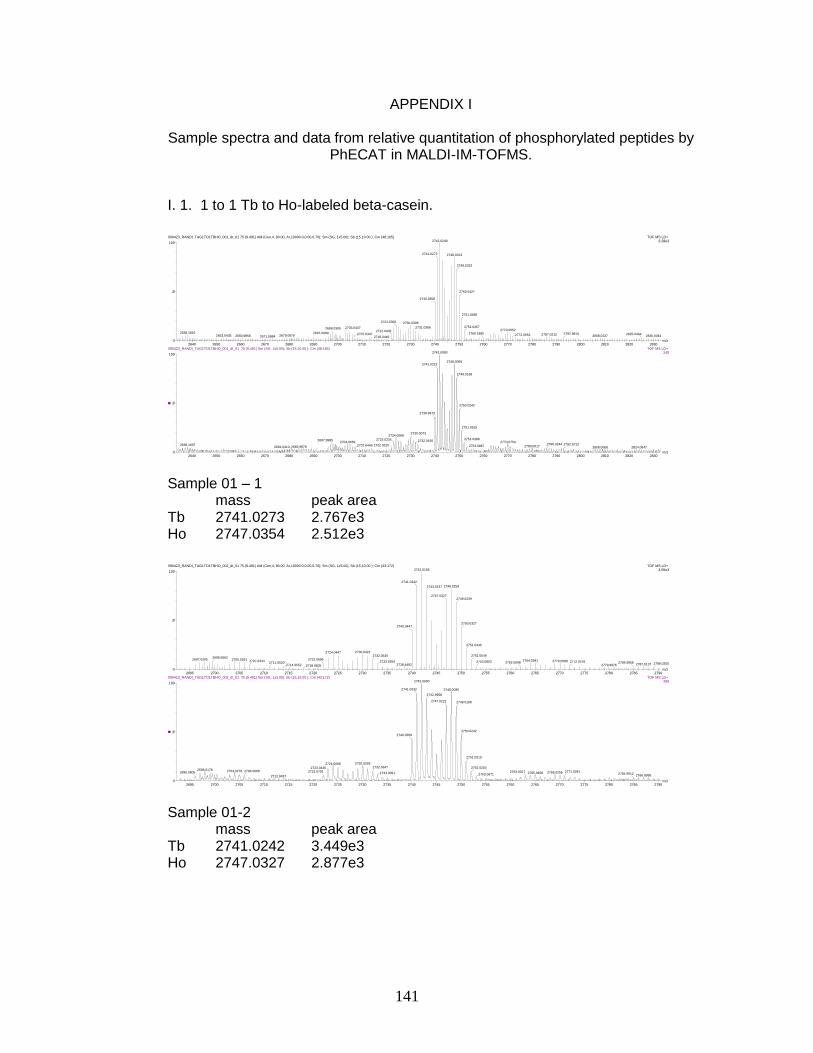
141
APPENDIX I
Sample spectra and data from relative quantitation of phosphorylated peptides by PhECAT in MALDI-IM-TOFMS.
I. 1. 1 to 1 Tb to Ho-labeled beta-casein.
m/z2640 2650 2660 2670 2680 2690 2700 2710 2720 2730 2740 2750 2760 2770 2780 2790 2800 2810 2820 2830
%
0
100
m/z2640 2650 2660 2670 2680 2690 2700 2710 2720 2730 2740 2750 2760 2770 2780 2790 2800 2810 2820 2830
%
0
100
090423_RANDI_TAG1TO1TBHO_001_dt_01 75 (9.491) AM (Cen,4, 80.00, Ar,10000.0,0.00,0.70); Sm (SG, 1x5.00); Sb (15,10.00 ); Cm (48:165) TOF MS LD+ 3.28e32742.0249
2741.0273
2740.0508
2730.03082724.0300
2698.0305
2638.1816 2697.09992679.08792653.0435 2660.9856 2671.0884
2703.04372722.0435
2707.03472718.0449
2731.0366
2748.0313
2749.0322
2750.0427
2751.0488
2752.04572770.0552
2760.1865 2787.02122772.0652 2830.00442808.01372792.9810 2825.0464
090423_RANDI_TAG1TO1TBHO_001_dt_01 75 (9.491) Sm (SG, 1x5.00); Sb (15,10.00 ); Cm (48:165) TOF MS LD+ 2452742.0090
2741.0222
2739.9973
2724.0068
2723.02342704.0659
2697.9985
2638.16972683.98782681.0410
2722.02102707.0449
2730.0073
2732.0156
2748.0095
2749.0168
2750.0242
2751.0515
2752.03982770.0754
2753.0867 2780.00172786.0244 2792.9712
2824.08472808.0068
Sample 01 – 1
mass peak area Tb 2741.0273 2.767e3 Ho 2747.0354 2.512e3
m/z2695 2700 2705 2710 2715 2720 2725 2730 2735 2740 2745 2750 2755 2760 2765 2770 2775 2780 2785 2790
%
0
100
m/z2695 2700 2705 2710 2715 2720 2725 2730 2735 2740 2745 2750 2755 2760 2765 2770 2775 2780 2785 2790
%
0
100
090423_RANDI_TAG1TO1TBHO_002_dt_01 75 (9.491) AM (Cen,4, 80.00, Ar,10000.0,0.00,0.70); Sm (SG, 1x5.00); Sb (15,10.00 ); Cm (43:172) TOF MS LD+ 4.05e32742.0166
2741.0242
2740.0447
2730.04222724.0447
2697.0205 2705.02912699.5562
2722.06962707.0344
2711.05202714.0552 2718.0605
2732.0530
2733.02642738.4492
2748.02592743.0137
2747.03272749.0239
2750.0327
2751.0435
2752.0549
2764.03912753.0803 2762.0698 2770.0588 2772.04762787.0137
2784.99562779.9976 2789.0200
090423_RANDI_TAG1TO1TBHO_002_dt_01 75 (9.491) Sm (SG, 1x5.00); Sb (15,10.00 ); Cm (43:172) TOF MS LD+ 2892742.0090
2741.0032
2740.0359
2730.02692724.0068
2723.04302698.0176
2696.0605 2704.0278 2706.0068 2722.0791
2712.9497
2732.0347
2733.0391
2748.0095
2742.9958
2747.0222 2749.0168
2750.0242
2751.0515
2752.0203
2769.02562765.06082763.00172753.0671
2771.02812786.9995
2784.9912
Sample 01-2
mass peak area Tb 2741.0242 3.449e3 Ho 2747.0327 2.877e3
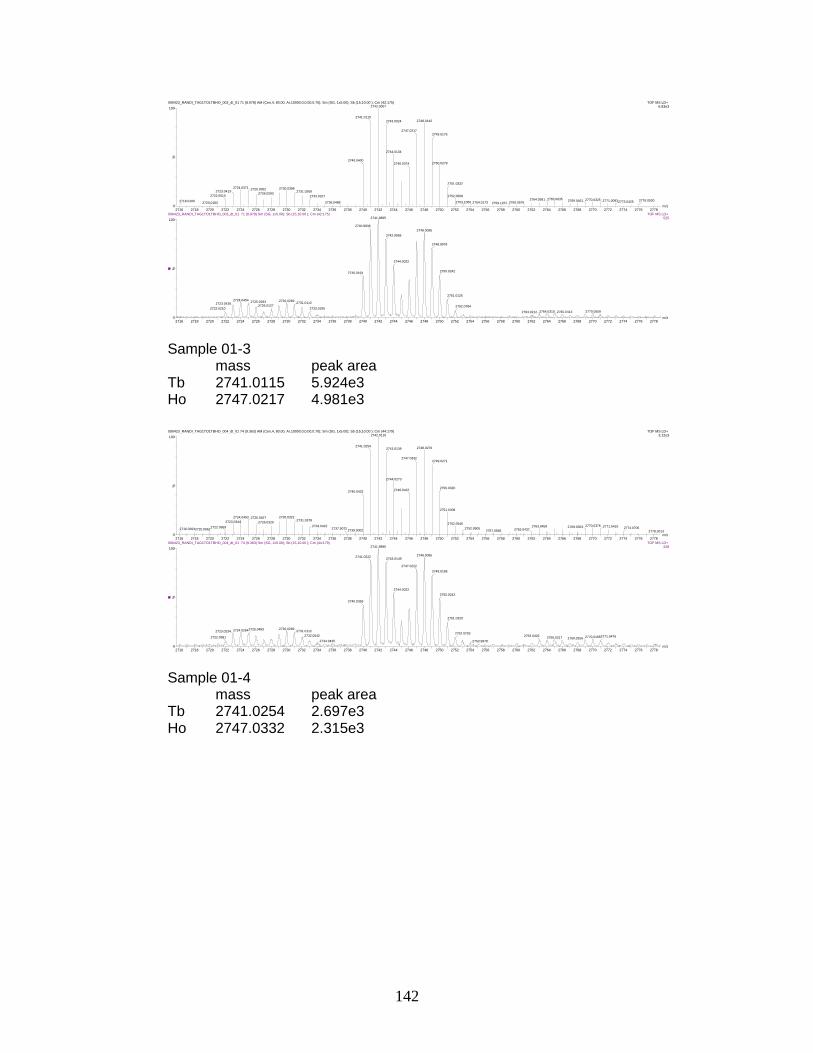
142
m/z2716 2718 2720 2722 2724 2726 2728 2730 2732 2734 2736 2738 2740 2742 2744 2746 2748 2750 2752 2754 2756 2758 2760 2762 2764 2766 2768 2770 2772 2774 2776 2778
%
0
100
m/z2716 2718 2720 2722 2724 2726 2728 2730 2732 2734 2736 2738 2740 2742 2744 2746 2748 2750 2752 2754 2756 2758 2760 2762 2764 2766 2768 2770 2772 2774 2776 2778
%
0
100
090423_RANDI_TAG1TO1TBHO_003_dt_01 71 (8.978) AM (Cen,4, 80.00, Ar,10000.0,0.00,0.70); Sm (SG, 1x5.00); Sb (15,10.00 ); Cm (42:175) TOF MS LD+ 6.83e32742.0007
2741.0115
2740.0400
2724.03712723.0413
2722.0510
2720.01832716.0100
2730.03982725.0352
2726.02932731.0269
2733.0327
2736.0488
2748.01422743.0024
2747.0217
2744.0134
2746.0374
2749.0176
2750.0278
2751.0332
2752.05082765.06352764.0581
2753.1060 2760.05762754.0173 2759.12572770.03252769.0461 2771.00932773.0425 2776.0530
090423_RANDI_TAG1TO1TBHO_003_dt_01 71 (8.978) Sm (SG, 1x5.00); Sb (15,10.00 ); Cm (42:175) TOF MS LD+ 5252741.9895
2740.9836
2740.0164
2724.04542723.0430
2722.0210
2730.02692725.02932726.0127
2731.0112
2733.0195
2748.0095
2742.9958
2744.0022
2748.9978
2750.0242
2751.0125
2752.0784
2764.03102763.0212 2770.05592765.0413
Sample 01-3 mass peak area Tb 2741.0115 5.924e3 Ho 2747.0217 4.981e3
m/z2716 2718 2720 2722 2724 2726 2728 2730 2732 2734 2736 2738 2740 2742 2744 2746 2748 2750 2752 2754 2756 2758 2760 2762 2764 2766 2768 2770 2772 2774 2776 2778
%
0
100
m/z2716 2718 2720 2722 2724 2726 2728 2730 2732 2734 2736 2738 2740 2742 2744 2746 2748 2750 2752 2754 2756 2758 2760 2762 2764 2766 2768 2770 2772 2774 2776 2778
%
0
100
090423_RANDI_TAG1TO1TBHO_004_dt_01 74 (9.363) AM (Cen,4, 80.00, Ar,10000.0,0.00,0.70); Sm (SG, 1x5.00); Sb (15,10.00 ); Cm (44:179) TOF MS LD+ 3.12e32742.0110
2741.0254
2740.0432
2730.03222724.0493
2723.0344
2722.09592716.03642720.0662
2725.0457
2726.03202731.0378
2733.0422
2739.00022737.9072
2748.02762743.0139
2747.0332
2744.0273
2746.0437
2749.0271
2750.0320
2751.0408
2752.05402770.03762763.0459
2752.9905 2762.04372757.0566
2769.0303 2771.0410 2774.07062778.3013
090423_RANDI_TAG1TO1TBHO_004_dt_01 74 (9.363) Sm (SG, 1x5.00); Sb (15,10.00 ); Cm (44:179) TOF MS LD+ 2282741.9895
2741.0222
2740.0359
2730.02692724.02642723.0234
2722.0981
2725.04832731.0112
2732.0542
2734.0435
2748.00952743.0149
2747.0222
2744.0022
2749.0168
2750.0242
2751.0320
2752.02032770.01682765.0217
2763.0403
2753.99782769.0256
2771.0476
Sample 01-4 mass peak area Tb 2741.0254 2.697e3 Ho 2747.0332 2.315e3

143
m/z2716 2718 2720 2722 2724 2726 2728 2730 2732 2734 2736 2738 2740 2742 2744 2746 2748 2750 2752 2754 2756 2758 2760 2762 2764 2766 2768 2770 2772 2774 2776 2778
%
0
100
m/z2716 2718 2720 2722 2724 2726 2728 2730 2732 2734 2736 2738 2740 2742 2744 2746 2748 2750 2752 2754 2756 2758 2760 2762 2764 2766 2768 2770 2772 2774 2776 2778
%
0
100
090423_RANDI_TAG1TO1TBHO_005_dt_01 74 (9.363) AM (Cen,4, 80.00, Ar,10000.0,0.00,0.70); Sm (SG, 1x5.00); Sb (15,10.00 ); Cm (46:177) TOF MS LD+ 3.92e32742.0110
2741.0166
2740.0447
2724.03002723.0500
2722.0635
2720.16632718.0459
2730.03782725.0259 2731.04032732.0344
2734.01002739.1648
2748.01762743.0078
2747.0295
2744.0154
2746.0342
2749.0247
2750.0361
2751.0352
2752.04472764.0134
2763.03172753.07132758.1350
2754.1707
2770.02982769.0325 2771.0378
2773.0222 2777.9946
090423_RANDI_TAG1TO1TBHO_005_dt_01 74 (9.363) Sm (SG, 1x5.00); Sb (15,10.00 ); Cm (46:177) TOF MS LD+ 2802742.0090
2741.0032
2740.0359
2725.02932724.0264
2723.0234
2722.0596
2730.00732729.04202731.0498
2733.0581
2734.0244
2748.0095
2742.9958
2747.0027
2744.0022
2748.9978
2750.0242
2751.0125
2752.03982763.9924
2763.02122753.1057 2770.03642769.0256 2771.0476 2774.1023
Sample 01-5 mass peak area Tb 2741.0166 3.312e3 Ho 2747.0295 2.910e3
m/z2716 2718 2720 2722 2724 2726 2728 2730 2732 2734 2736 2738 2740 2742 2744 2746 2748 2750 2752 2754 2756 2758 2760 2762 2764 2766 2768 2770 2772 2774 2776 2778
%
0
100
m/z2716 2718 2720 2722 2724 2726 2728 2730 2732 2734 2736 2738 2740 2742 2744 2746 2748 2750 2752 2754 2756 2758 2760 2762 2764 2766 2768 2770 2772 2774 2776 2778
%
0
100
090423_RANDI_TAG1TO5TBHO_001_dt_01 74 (9.363) AM (Cen,4, 80.00, Ar,10000.0,0.00,0.70); Sm (SG, 1x5.00); Sb (15,10.00 ); Cm (37:180) TOF MS LD+ 5.11e32747.9946
2747.0068
2746.0352
2742.02172741.0381
2730.02222729.0391
2728.0549
2724.03832723.05402719.9260
2731.0200
2732.02712740.0576
2733.0334
2734.99492737.0630
2743.0281
2748.9998
2750.0120
2751.0325
2752.0281
2770.03492753.0215 2769.02512765.03222764.02812760.12162756.4512
2771.0459 2774.01292777.1250
090423_RANDI_TAG1TO5TBHO_001_dt_01 74 (9.363) Sm (SG, 1x5.00); Sb (15,10.00 ); Cm (37:180) TOF MS LD+ 3832747.9709
2747.0027
2746.0154
2742.0281
2741.0417
2731.01122730.0269
2728.05812724.02642723.0234
2732.0156 2740.0554
2733.0195
2743.0149
2748.9783
2750.0051
2751.0320
2752.0203
2769.99782769.06422753.0090 2771.0476
Sample 02-1 mass peak area Tb 2741.0381 1.279e3 Ho 2747.0068 4.451e3

144
m/z2716 2718 2720 2722 2724 2726 2728 2730 2732 2734 2736 2738 2740 2742 2744 2746 2748 2750 2752 2754 2756 2758 2760 2762 2764 2766 2768 2770 2772 2774 2776 2778
%
0
100
m/z2716 2718 2720 2722 2724 2726 2728 2730 2732 2734 2736 2738 2740 2742 2744 2746 2748 2750 2752 2754 2756 2758 2760 2762 2764 2766 2768 2770 2772 2774 2776 2778
%
0
100
090423_RANDI_TAG1TO5TBHO_002_dt_01 75 (9.491) AM (Cen,4, 80.00, Ar,10000.0,0.00,0.70); Sm (SG, 1x5.00); Sb (15,10.00 ); Cm (45:174) TOF MS LD+ 5.95e32747.9968
2747.0085
2746.0337
2742.03442741.0381
2730.02642729.0405
2728.0471
2724.02862723.05182715.95852717.9878
2731.03472740.0430
2732.0322
2734.0286
2738.0227
2743.0278
2749.0012
2750.0134
2751.0254
2752.0369
2770.04662769.03542753.0283
2765.06712764.0500
2760.06132758.0471 2771.0283
2778.03272774.0154
090423_RANDI_TAG1TO5TBHO_002_dt_01 75 (9.491) Sm (SG, 1x5.00); Sb (15,10.00 ); Cm (45:174) TOF MS LD+ 4512747.9905
2747.0027
2746.0344
2742.0281
2741.0222
2730.04592729.0229
2728.0581
2724.06492723.0430
2731.03082740.0554
2732.0156
2734.0244
2743.0344
2748.9783
2750.0051
2751.0125
2752.0398
2770.07542752.9700 2768.9866 2772.0007
Sample 02-2 mass peak area Tb 2741.0381 1.599e3 Ho 2747.0085 5.222e3
m/z2716 2718 2720 2722 2724 2726 2728 2730 2732 2734 2736 2738 2740 2742 2744 2746 2748 2750 2752 2754 2756 2758 2760 2762 2764 2766 2768 2770 2772 2774 2776 2778
%
0
100
m/z2716 2718 2720 2722 2724 2726 2728 2730 2732 2734 2736 2738 2740 2742 2744 2746 2748 2750 2752 2754 2756 2758 2760 2762 2764 2766 2768 2770 2772 2774 2776 2778
%
0
100
090423_RANDI_TAG1TO5TBHO_003_dt_01 74 (9.363) AM (Cen,4, 80.00, Ar,10000.0,0.00,0.70); Sm (SG, 1x5.00); Sb (15,10.00 ); Cm (33:171) TOF MS LD+ 4.59e32748.0051
2747.0149
2746.0393
2742.0330
2741.0422
2730.03592729.0383
2728.05692724.04352723.0513
2718.9968 2727.0386
2731.0266 2740.05442733.0188
2735.03522737.0637
2743.0281
2749.0112
2750.0149
2751.0278
2752.0325
2770.04392769.03912753.02122763.07932758.2593
2755.0435 2760.0430 2771.04792776.0425
2778.0190
090423_RANDI_TAG1TO5TBHO_003_dt_01 74 (9.363) Sm (SG, 1x5.00); Sb (15,10.00 ); Cm (33:171) TOF MS LD+ 3462747.9905
2747.0027
2746.0344
2742.02812741.0417
2730.02692729.0034
2728.03862724.99072724.0264
2730.9922 2740.0745
2733.0005
2734.0435
2743.0344
2748.9978
2749.9856
2751.0125
2752.0203
2769.04472753.0286 2770.0168
Sample 02-3 mass peak area Tb 2741.0422 1.102e3 Ho 2747.0149 3.907e3
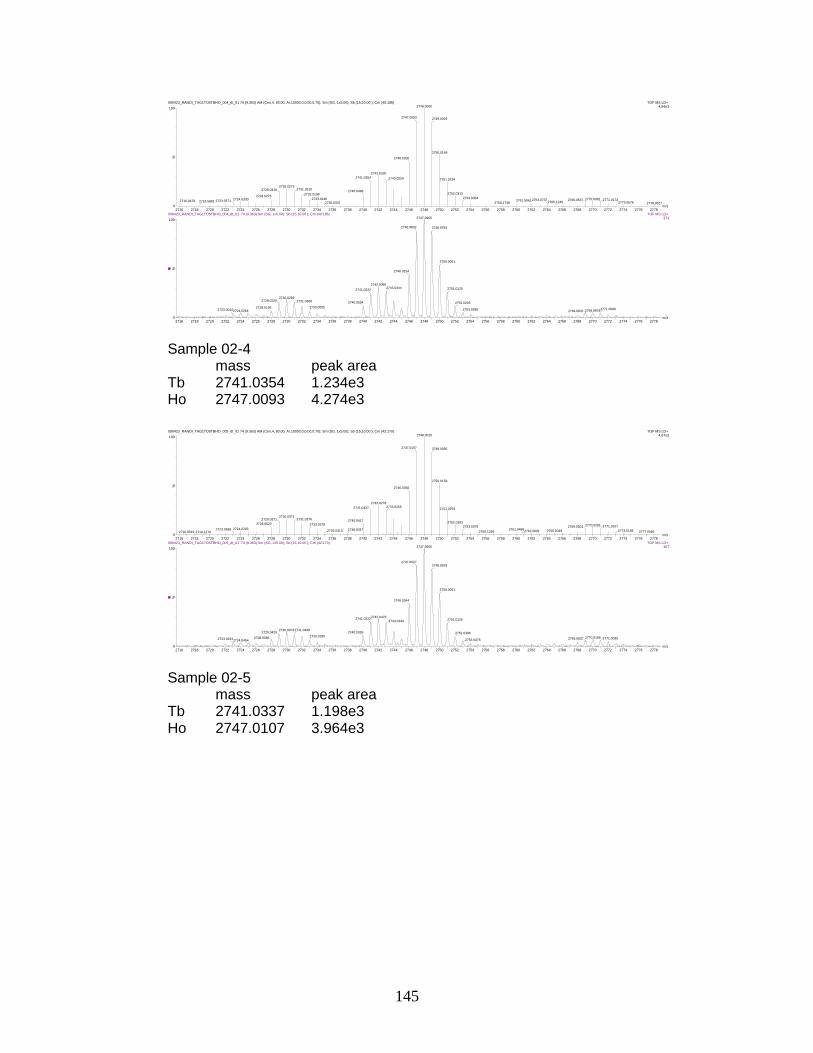
145
m/z2716 2718 2720 2722 2724 2726 2728 2730 2732 2734 2736 2738 2740 2742 2744 2746 2748 2750 2752 2754 2756 2758 2760 2762 2764 2766 2768 2770 2772 2774 2776 2778
%
0
100
m/z2716 2718 2720 2722 2724 2726 2728 2730 2732 2734 2736 2738 2740 2742 2744 2746 2748 2750 2752 2754 2756 2758 2760 2762 2764 2766 2768 2770 2772 2774 2776 2778
%
0
100
090423_RANDI_TAG1TO5TBHO_004_dt_01 74 (9.363) AM (Cen,4, 80.00, Ar,10000.0,0.00,0.70); Sm (SG, 1x5.00); Sb (15,10.00 ); Cm (40:186) TOF MS LD+ 4.94e32748.0000
2747.0093
2746.0330
2742.0330
2741.0354
2730.02732729.0320
2728.02762724.0330
2723.03712716.0479 2718.5881
2731.03102740.0498
2732.0198
2733.0146
2736.0337
2743.0259
2749.0029
2750.0149
2751.0234
2752.0313
2770.00812769.05372753.0364
2765.12452764.07372761.9961
2758.17382771.0173
2773.0576 2778.0527
090423_RANDI_TAG1TO5TBHO_004_dt_01 74 (9.363) Sm (SG, 1x5.00); Sb (15,10.00 ); Cm (40:186) TOF MS LD+ 3732747.9905
2746.9832
2746.0154
2742.0090
2741.0222
2730.02692729.0229
2728.01952724.02642723.0044
2731.0308 2740.0554
2733.0005
2743.0344
2748.9783
2750.0051
2751.0125
2752.0203
2769.99782769.08372753.0286 2771.0090
Sample 02-4 mass peak area Tb 2741.0354 1.234e3 Ho 2747.0093 4.274e3
m/z2716 2718 2720 2722 2724 2726 2728 2730 2732 2734 2736 2738 2740 2742 2744 2746 2748 2750 2752 2754 2756 2758 2760 2762 2764 2766 2768 2770 2772 2774 2776 2778
%
0
100
m/z2716 2718 2720 2722 2724 2726 2728 2730 2732 2734 2736 2738 2740 2742 2744 2746 2748 2750 2752 2754 2756 2758 2760 2762 2764 2766 2768 2770 2772 2774 2776 2778
%
0
100
090423_RANDI_TAG1TO5TBHO_005_dt_01 74 (9.363) AM (Cen,4, 80.00, Ar,10000.0,0.00,0.70); Sm (SG, 1x5.00); Sb (15,10.00 ); Cm (42:170) TOF MS LD+ 4.67e32748.0015
2747.0107
2746.0356
2742.0278
2741.0337
2730.03712729.0371
2728.0520
2724.02932723.04882716.9519 2719.1270
2731.0276 2740.0417
2733.0278
2735.0313 2738.0037
2743.0256
2749.0056
2750.0159
2751.0293
2752.03932770.02812769.05032753.0378
2765.00492762.06912761.0488
2756.1326
2771.0107
2773.0168 2777.0566
090423_RANDI_TAG1TO5TBHO_005_dt_01 74 (9.363) Sm (SG, 1x5.00); Sb (15,10.00 ); Cm (42:170) TOF MS LD+ 3672747.9905
2747.0027
2746.0344
2742.04762741.0222
2730.00732729.0420
2728.03862724.04542723.0234
2731.04982740.0359
2733.0195
2743.0344
2748.9978
2750.0051
2751.0125
2752.0398
2770.01682769.08372753.0476 2771.0090
Sample 02-5 mass peak area Tb 2741.0337 1.198e3 Ho 2747.0107 3.964e3

146
m/z2716 2718 2720 2722 2724 2726 2728 2730 2732 2734 2736 2738 2740 2742 2744 2746 2748 2750 2752 2754 2756 2758 2760 2762 2764 2766 2768 2770 2772 2774 2776 2778
%
0
100
m/z2716 2718 2720 2722 2724 2726 2728 2730 2732 2734 2736 2738 2740 2742 2744 2746 2748 2750 2752 2754 2756 2758 2760 2762 2764 2766 2768 2770 2772 2774 2776 2778
%
0
100
090423_RANDI_TAG5TO1TBHO_001_dt_01 75 (9.491) AM (Cen,4, 80.00, Ar,10000.0,0.00,0.70); Sm (SG, 1x5.00); Sb (15,10.00 ); Cm (41:175) TOF MS LD+ 1.21e42741.9856
2740.9980
2740.0244
2724.02592723.0264
2722.0457
2718.0759 2721.4893
2725.0186
2726.0251
2727.0193 2730.03882732.0337 2738.06182735.9636
2742.9878
2744.0012
2745.0134
2748.03712749.0349
2750.0403 2764.03032763.03712751.0420
2759.03082753.9221
2765.02472769.0288 2770.0320 2773.0398 2775.9971
090423_RANDI_TAG5TO1TBHO_001_dt_01 75 (9.491) Sm (SG, 1x5.00); Sb (15,10.00 ); Cm (41:175) TOF MS LD+ 8962741.9700
2740.9836
2740.0164
2724.02642723.0234
2722.0596
2725.0098
2726.0127
2729.0420 2730.0459
2742.9763
2743.9827
2745.0085
2748.02912749.0364
2750.02422764.03102763.02122751.0320 2765.0022
Sample 03-1 mass peak area Tb 2741.9856 1.205e4 Ho 2748.0371 2.105e3
m/z2716 2718 2720 2722 2724 2726 2728 2730 2732 2734 2736 2738 2740 2742 2744 2746 2748 2750 2752 2754 2756 2758 2760 2762 2764 2766 2768 2770 2772 2774 2776 2778
%
0
100
m/z2716 2718 2720 2722 2724 2726 2728 2730 2732 2734 2736 2738 2740 2742 2744 2746 2748 2750 2752 2754 2756 2758 2760 2762 2764 2766 2768 2770 2772 2774 2776 2778
%
0
100
090423_RANDI_TAG5TO1TBHO_002_dt_01 71 (8.978) AM (Cen,4, 80.00, Ar,10000.0,0.00,0.70); Sm (SG, 1x5.00); Sb (15,10.00 ); Cm (43:180) TOF MS LD+ 6.30e32741.9883
2740.9990
2740.0308
2724.02662723.0308
2722.0518
2721.04862718.1470
2725.0247
2727.0181
2730.0518 2731.03322738.0242
2736.9653
2742.9939
2744.0061
2745.0200
2747.0354 2748.0310
2750.0505
2764.01442751.0466 2763.02292758.0955
2757.0342 2765.0176 2768.03742770.03562772.0576 2778.0122
090423_RANDI_TAG5TO1TBHO_002_dt_01 71 (8.978) Sm (SG, 1x5.00); Sb (15,10.00 ); Cm (43:180) TOF MS LD+ 4722741.9700
2740.9836
2740.0164
2724.02642723.0044
2722.04052725.0293
2727.01612729.0420
2742.9763
2743.9827
2745.0281
2748.02912749.0559
2750.0437
2763.99242751.0706 2763.0212 2764.9832
Sample 03-2 mass peak area Tb 2741.9883 6.300e3 Ho 2748.0310 1.075e3
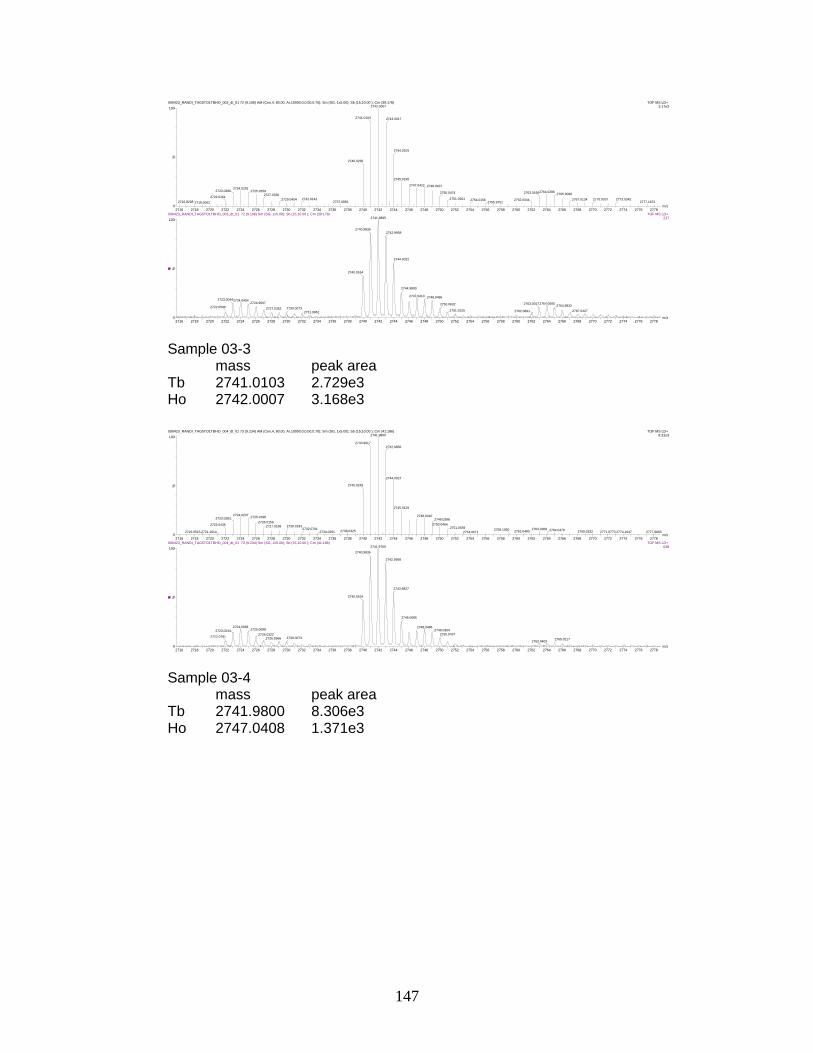
147
m/z2716 2718 2720 2722 2724 2726 2728 2730 2732 2734 2736 2738 2740 2742 2744 2746 2748 2750 2752 2754 2756 2758 2760 2762 2764 2766 2768 2770 2772 2774 2776 2778
%
0
100
m/z2716 2718 2720 2722 2724 2726 2728 2730 2732 2734 2736 2738 2740 2742 2744 2746 2748 2750 2752 2754 2756 2758 2760 2762 2764 2766 2768 2770 2772 2774 2776 2778
%
0
100
090423_RANDI_TAG5TO1TBHO_003_dt_01 72 (9.106) AM (Cen,4, 80.00, Ar,10000.0,0.00,0.70); Sm (SG, 1x5.00); Sb (15,10.00 ); Cm (39:178) TOF MS LD+ 3.17e32742.0007
2741.0103
2740.0295
2724.02912723.0286
2722.0461
2716.8298 2719.0002
2725.02592727.0330
2729.0454 2732.01422737.0881
2743.0017
2744.0105
2745.0195
2747.0422 2748.0437
2764.02862750.0474 2763.0166
2751.0161 2762.03442754.01562755.9751
2765.0090
2767.0134 2770.0337 2773.03422777.1672
090423_RANDI_TAG5TO1TBHO_003_dt_01 72 (9.106) Sm (SG, 1x5.00); Sb (15,10.00 ); Cm (39:178) TOF MS LD+ 2372741.9895
2740.9836
2740.0164
2724.04542723.0044
2722.0596
2724.9907
2727.0352 2730.00732731.9961
2742.9958
2744.0022
2744.9890
2747.0413 2748.0486
2764.05052763.00172750.0632
2751.0125 2762.0891
2764.9832
2767.0427
Sample 03-3 mass peak area Tb 2741.0103 2.729e3 Ho 2742.0007 3.168e3
m/z2716 2718 2720 2722 2724 2726 2728 2730 2732 2734 2736 2738 2740 2742 2744 2746 2748 2750 2752 2754 2756 2758 2760 2762 2764 2766 2768 2770 2772 2774 2776 2778
%
0
100
m/z2716 2718 2720 2722 2724 2726 2728 2730 2732 2734 2736 2738 2740 2742 2744 2746 2748 2750 2752 2754 2756 2758 2760 2762 2764 2766 2768 2770 2772 2774 2776 2778
%
0
100
090423_RANDI_TAG5TO1TBHO_004_dt_01 73 (9.234) AM (Cen,4, 80.00, Ar,10000.0,0.00,0.70); Sm (SG, 1x5.00); Sb (15,10.00 ); Cm (41:186) TOF MS LD+ 8.31e32741.9800
2740.9917
2740.0249
2724.02372723.0283
2722.0435
2721.16142719.0515
2725.0198
2726.0159
2727.0168 2730.0193
2738.03252732.0701
2734.0291
2742.9856
2744.0027
2745.0129
2748.04102749.0398
2750.04642751.0559 2763.0369
2762.04832759.1060
2754.06712764.0479 2769.0332 2771.9773 2774.1047 2777.9893
090423_RANDI_TAG5TO1TBHO_004_dt_01 73 (9.234) Sm (SG, 1x5.00); Sb (15,10.00 ); Cm (41:186) TOF MS LD+ 6382741.9700
2740.9836
2740.0164
2724.0068
2723.0234
2722.0791
2725.0098
2726.0322
2726.9966 2730.0073
2742.9568
2743.9827
2745.0085
2748.04862749.0364
2750.0437
2763.04032765.0217
Sample 03-4 mass peak area Tb 2741.9800 8.306e3 Ho 2747.0408 1.371e3
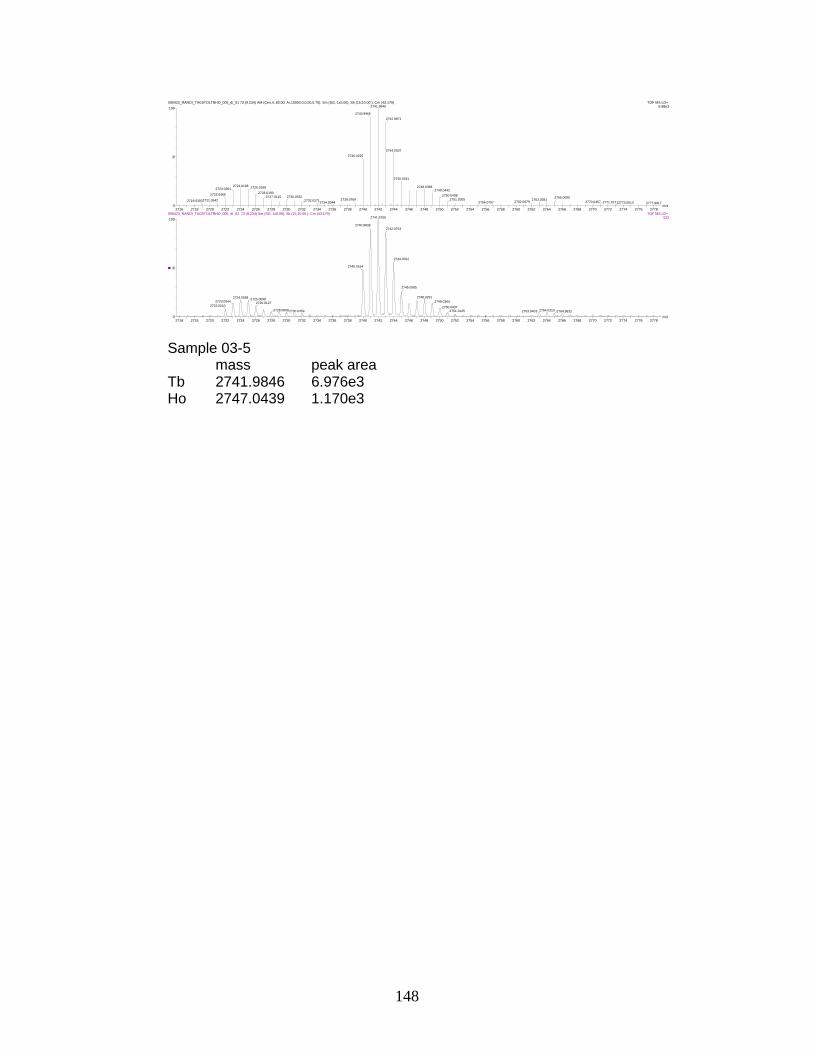
148
m/z2716 2718 2720 2722 2724 2726 2728 2730 2732 2734 2736 2738 2740 2742 2744 2746 2748 2750 2752 2754 2756 2758 2760 2762 2764 2766 2768 2770 2772 2774 2776 2778
%
0
100
m/z2716 2718 2720 2722 2724 2726 2728 2730 2732 2734 2736 2738 2740 2742 2744 2746 2748 2750 2752 2754 2756 2758 2760 2762 2764 2766 2768 2770 2772 2774 2776 2778
%
0
100
090423_RANDI_TAG5TO1TBHO_005_dt_01 73 (9.234) AM (Cen,4, 80.00, Ar,10000.0,0.00,0.70); Sm (SG, 1x5.00); Sb (15,10.00 ); Cm (43:179) TOF MS LD+ 6.98e32741.9846
2740.9966
2740.0225
2724.01982723.0361
2722.0469
2721.05422719.0303
2725.0168
2726.0190
2727.0115 2730.03322732.0271 2739.0769
2734.0544
2742.9871
2744.0037
2745.0181
2748.03882749.0442
2750.0498
2751.0305 2763.03912762.06792756.0757
2765.0095
2770.0457 2771.01712773.0513 2777.9917
090423_RANDI_TAG5TO1TBHO_005_dt_01 73 (9.234) Sm (SG, 1x5.00); Sb (15,10.00 ); Cm (43:179) TOF MS LD+ 5232741.9700
2740.9836
2740.0164
2724.00682723.0044
2722.0210
2725.00982726.0127
2728.00002730.0459
2742.9763
2744.0022
2745.0085
2748.0291
2749.0364
2750.04372764.03102751.0125 2763.0403 2764.9832
Sample 03-5 mass peak area Tb 2741.9846 6.976e3 Ho 2747.0439 1.170e3
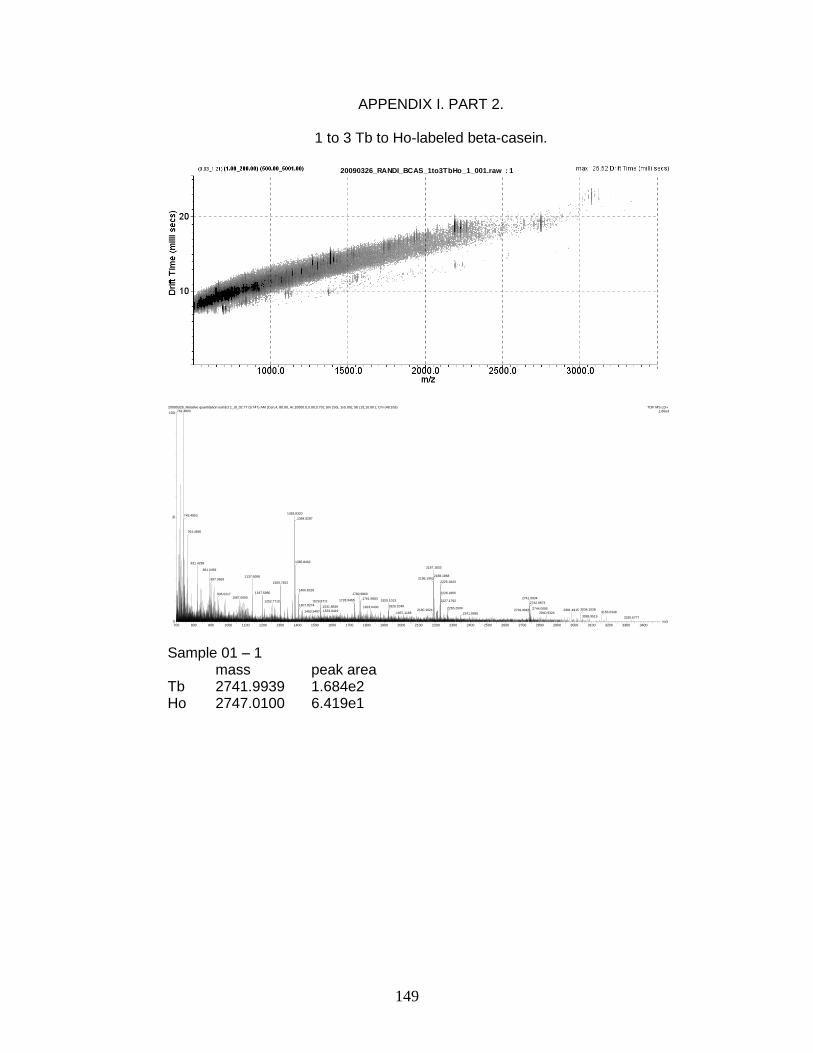
149
APPENDIX I. PART 2.
1 to 3 Tb to Ho-labeled beta-casein.
20090326_RANDI_BCAS_1to3TbHo_1_001.raw : 1
m/z700 800 900 1000 1100 1200 1300 1400 1500 1600 1700 1800 1900 2000 2100 2200 2300 2400 2500 2600 2700 2800 2900 3000 3100 3200 3300 3400
%
0
100
20090326_Relative quantitation extract 1_dt_02 77 (9.747) AM (Cen,4, 80.00, Ar,10000.0,0.00,0.70); Sm (SG, 1x5.00); Sb (15,10.00 ); Cm (48:163) TOF MS LD+ 1.60e3742.4800
1383.8320743.4853
764.4696
821.4299
891.0459
1137.6088897.0669
935.02171067.0660
1300.7452
1197.5980
1252.7710
1384.8287
1385.8462
2187.1833
2186.1963
1406.83181760.9860
1529.8711
1407.8274
1483.9487
1728.9465
1531.8839
1533.9419
1761.96831925.1013
1823.0430 1926.10492180.1624
1957.1166
2188.1868
2225.1843
2226.1865
2741.99342227.1792
2265.20002739.9863
2341.9995
2742.9673
2744.0085 2981.49152840.9324
3034.10383155.0349
3088.9519 3330.6777
Sample 01 – 1 mass peak area Tb 2741.9939 1.684e2 Ho 2747.0100 6.419e1

150
20090326_RANDI_BCAS_1to3TbHo_2_001.raw : 1
m/z2730 2732 2734 2736 2738 2740 2742 2744 2746 2748 2750 2752 2754 2756 2758 2760 2762 2764 2766 2768
%
0
100
m/z2730 2732 2734 2736 2738 2740 2742 2744 2746 2748 2750 2752 2754 2756 2758 2760 2762 2764 2766 2768
%
0
100
20090326_Relative quantitation extract 2_dt_01 77 (9.747) AM (Cen,4, 80.00, Ar,10000.0,0.00,0.70); Sm (SG, 1x5.00); Sb (15,10.00 ); Cm (50:172) TOF MS LD+ 1652741.9949
2740.9956
2739.9863
2734.9717
2733.93462733.0911
2728.94872730.9229
2739.4324
2737.81982735.9631
2742.9690
2744.0066
2747.0051
2745.0012
2746.0129
2747.9832
2763.99342748.95262750.9685
2749.9524 2763.03252762.0518
2759.23102756.9412
2756.0002
2752.96312755.2488
2760.2305
2765.9636
2764.9482
2767.09202768.5085
20090326_Relative quantitation extract 2_dt_01 77 (9.747) Sm (SG, 1x5.00); Sb (15,10.00 ); Cm (50:172) TOF MS LD+ 12.92741.9895
2740.9836
2739.9973
2728.96482739.4363
2731.0112
2729.91062733.9277 2734.9707
2737.0386 2737.9277
2742.9568
2744.0022
2747.0027
2745.0471
2746.0154
2747.9709
2748.9783
2749.0750
2764.94412750.0437 2764.01152756.9265
2752.9509 2756.0144
2757.93532763.0793
2765.83762767.9172
Sample 01-2 mass peak area Tb 2740.9956 1.424e2 Ho 2747.0051 5.898e1
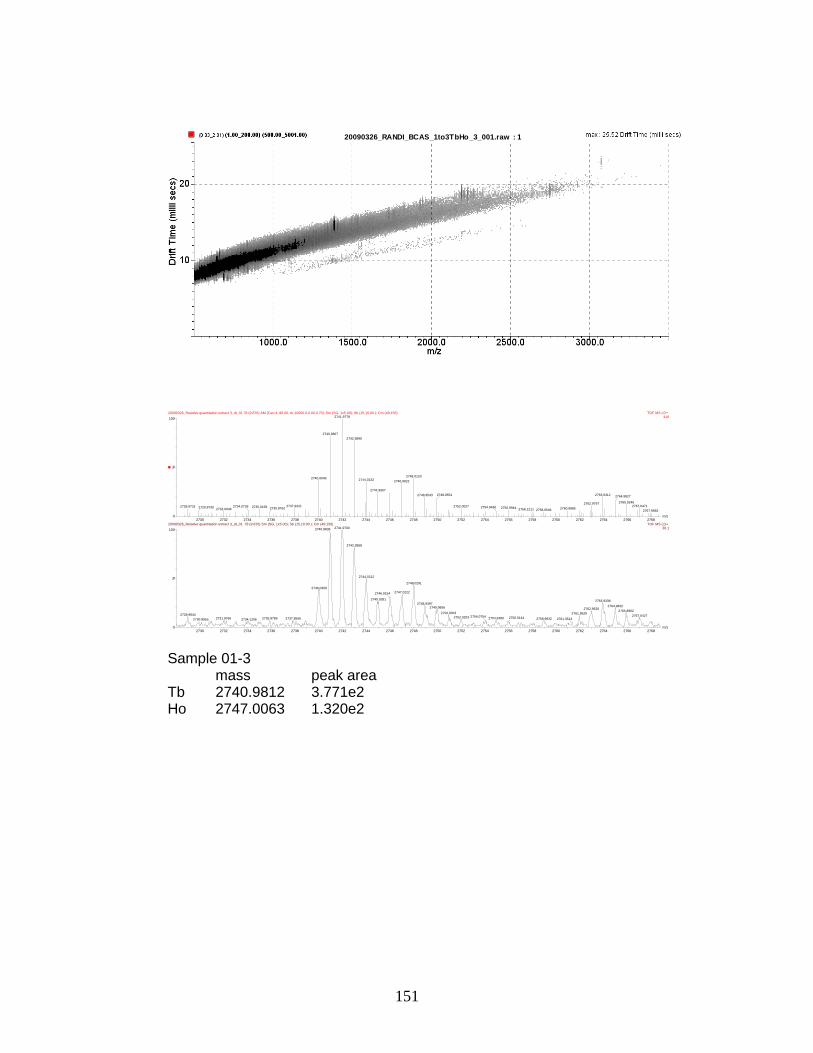
151
20090326_RANDI_BCAS_1to3TbHo_3_001.raw : 1
m/z2730 2732 2734 2736 2738 2740 2742 2744 2746 2748 2750 2752 2754 2756 2758 2760 2762 2764 2766 2768
%
0
100
m/z2730 2732 2734 2736 2738 2740 2742 2744 2746 2748 2750 2752 2754 2756 2758 2760 2762 2764 2766 2768
%
0
100
20090326_Relative quantitation extract 3_dt_01 78 (9.876) AM (Cen,4, 80.00, Ar,10000.0,0.00,0.70); Sm (SG, 1x5.00); Sb (15,10.00 ); Cm (49:156) TOF MS LD+ 4102741.9778
2740.9807
2740.0046
2737.92212728.9731 2735.01592734.07282732.0046
2729.8730 2735.8762
2742.9895
2748.01202744.0132 2746.9922
2744.9907
2763.93122748.9543 2749.9551
2762.97972752.0027 2755.99442754.9436 2760.98852758.95462758.1211
2764.9827
2765.92462767.0471
2767.9583
20090326_Relative quantitation extract 3_dt_01 78 (9.876) Sm (SG, 1x5.00); Sb (15,10.00 ); Cm (49:156) TOF MS LD+ 30.12741.97002740.9836
2740.0359
2728.98442735.87892731.97662730.8955 2734.1206 2737.8506
2742.9958
2744.0212
2748.0291
2747.02222746.0154
2745.02812763.9338
2748.93972749.9856 2762.9626
2750.9353 2761.9529
2752.0203 2754.94802754.0754
2758.98322756.0144 2761.3513
2764.9832
2765.8962
2767.0427
Sample 01-3 mass peak area Tb 2740.9812 3.771e2 Ho 2747.0063 1.320e2
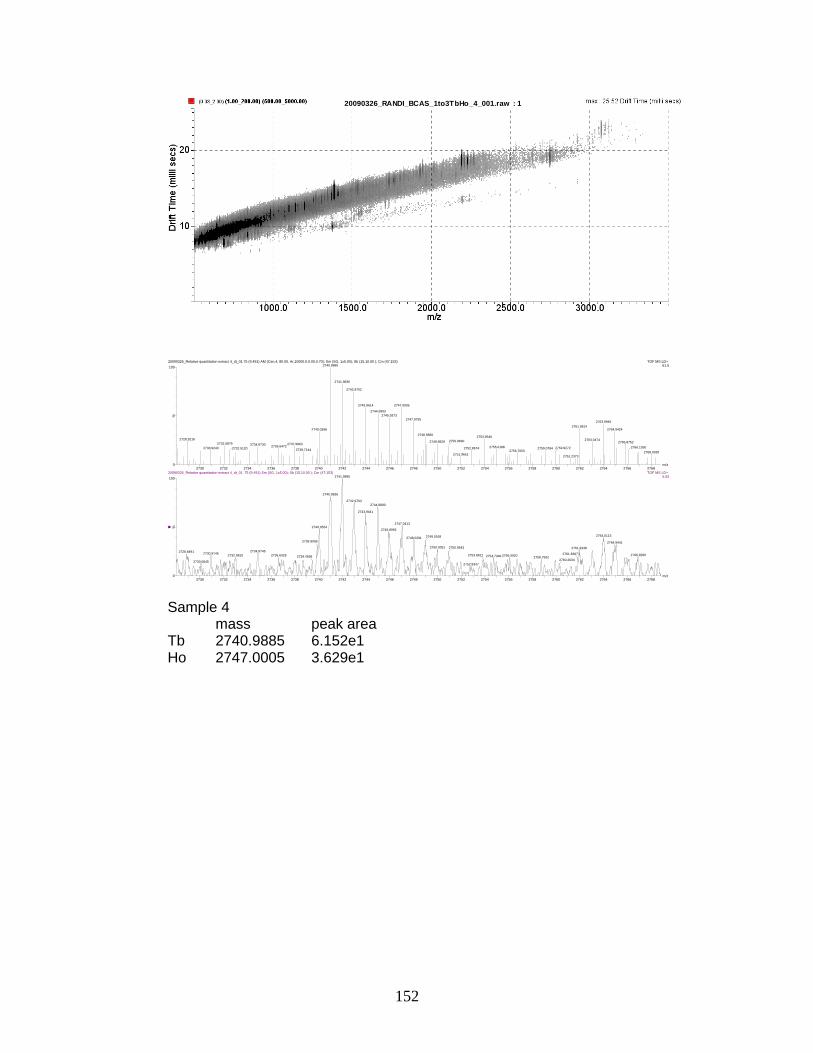
152
20090326_RANDI_BCAS_1to3TbHo_4_001.raw : 1
m/z2730 2732 2734 2736 2738 2740 2742 2744 2746 2748 2750 2752 2754 2756 2758 2760 2762 2764 2766 2768
%
0
100
m/z2730 2732 2734 2736 2738 2740 2742 2744 2746 2748 2750 2752 2754 2756 2758 2760 2762 2764 2766 2768
%
0
100
20090326_Relative quantitation extract 4_dt_01 75 (9.491) AM (Cen,4, 80.00, Ar,10000.0,0.00,0.70); Sm (SG, 1x5.00); Sb (15,10.00 ); Cm (47:153) TOF MS LD+ 61.52740.9885
2740.0398
2728.9216
2732.0879
2730.9243
2737.99632734.87302732.5120
2736.64722738.7144
2741.9836
2742.9702
2747.00052743.9614
2744.9993
2745.9373
2747.97952763.9946
2761.9614
2748.98662753.9546
2749.9829 2750.9690
2752.8674
2751.9651
2755.0188 2759.07842756.7053
2759.9272
2761.2373
2763.0474
2764.9424
2765.8752
2766.1050
2768.0330
20090326_Relative quantitation extract 4_dt_01 75 (9.491) Sm (SG, 1x5.00); Sb (15,10.00 ); Cm (47:153) TOF MS LD+ 5.632741.9895
2740.9836
2740.0554
2739.9006
2734.87452728.84912730.9146
2730.0845
2732.9810 2736.6328 2739.4558
2742.9763
2744.9890
2743.9441
2747.0413
2745.8992
2764.01152748.0291 2749.0168
2750.0051 2761.93382750.9543
2756.09202754.73462753.8621
2752.8347
2761.83672758.7502
2760.2634
2764.9441
2766.9260
Sample 4 mass peak area Tb 2740.9885 6.152e1 Ho 2747.0005 3.629e1
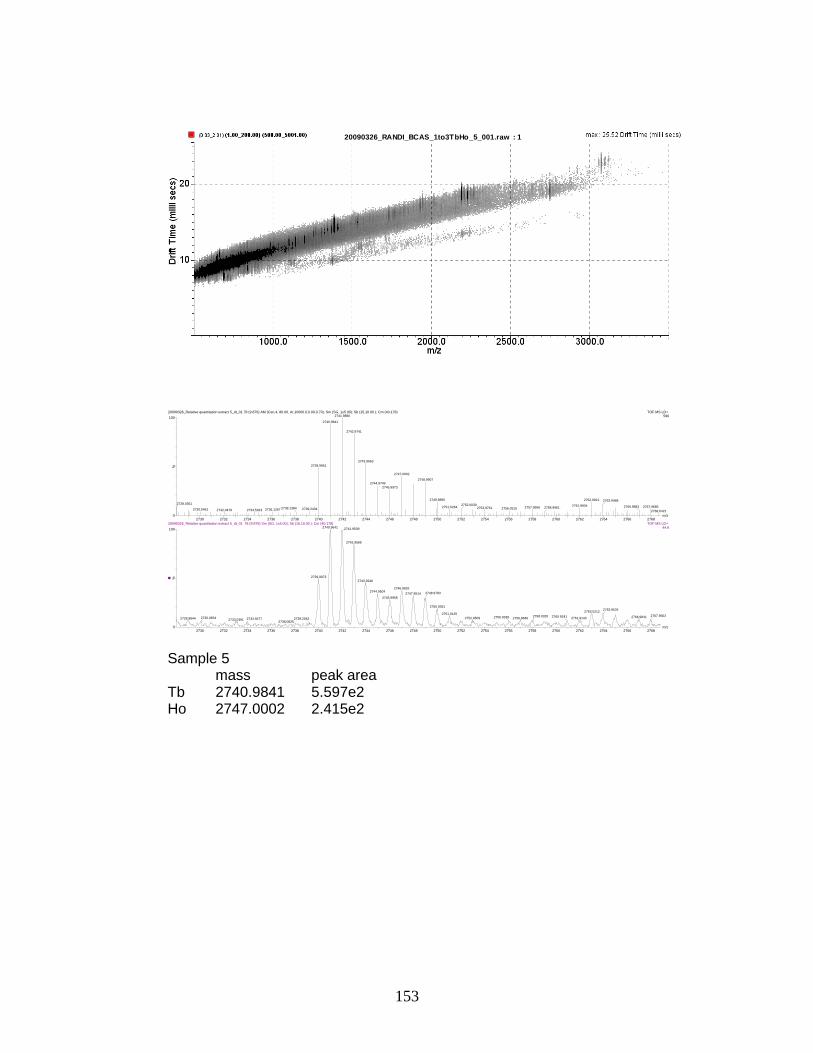
153
20090326_RANDI_BCAS_1to3TbHo_5_001.raw : 1
m/z2730 2732 2734 2736 2738 2740 2742 2744 2746 2748 2750 2752 2754 2756 2758 2760 2762 2764 2766 2768
%
0
100
m/z2730 2732 2734 2736 2738 2740 2742 2744 2746 2748 2750 2752 2754 2756 2758 2760 2762 2764 2766 2768
%
0
100
20090326_Relative quantitation extract 5_dt_01 78 (9.876) AM (Cen,4, 80.00, Ar,10000.0,0.00,0.70); Sm (SG, 1x5.00); Sb (15,10.00 ); Cm (40:178) TOF MS LD+ 5962741.9880
2740.9841
2739.9951
2728.0361
2739.24342730.0461 2736.12672732.0479 2734.59232738.1384
2742.9741
2743.9663
2747.0002
2744.9749
2745.9973
2748.9907
2749.9895 2762.9912
2761.99342751.02642752.0039
2757.99562753.9761 2756.0515 2758.9961
2763.9468
2767.96852766.9883
2768.6421
20090326_Relative quantitation extract 5_dt_01 78 (9.876) Sm (SG, 1x5.00); Sb (15,10.00 ); Cm (40:178) TOF MS LD+ 44.62740.9641
2739.9973
2728.9844 2733.03912730.0654 2739.20432733.9277
2738.0825
2741.9509
2742.9568
2743.9246
2746.98322744.9504
2745.9958
2747.9514 2748.9783
2750.0051
2763.02122751.0125
2761.91432752.9509 2756.98462756.0339 2758.0320 2760.9241
2763.9534
2766.9841 2767.9563
Sample 5 mass peak area Tb 2740.9841 5.597e2 Ho 2747.0002 2.415e2
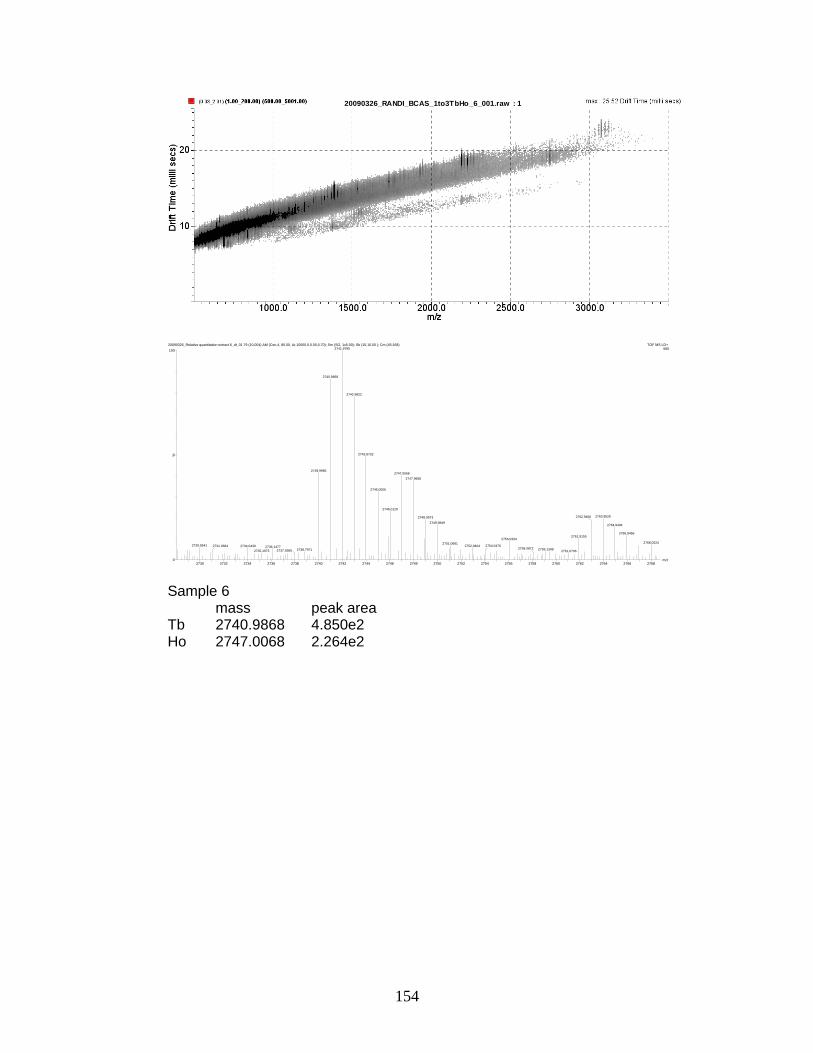
154
20090326_RANDI_BCAS_1to3TbHo_6_001.raw : 1
m/z2730 2732 2734 2736 2738 2740 2742 2744 2746 2748 2750 2752 2754 2756 2758 2760 2762 2764 2766 2768
%
0
100
20090326_Relative quantitation extract 6_dt_01 79 (10.004) AM (Cen,4, 80.00, Ar,10000.0,0.00,0.70); Sm (SG, 1x5.00); Sb (15,10.00 ); Cm (45:168) TOF MS LD+ 5602741.9795
2740.9868
2739.9966
2729.9541 2734.04392731.0684 2736.1477
2735.1975 2738.79712737.9365
2742.9822
2743.9702
2747.0068
2745.0056
2746.0129
2747.9658
2763.95292748.9973 2762.9460
2749.9849
2761.91552756.0334
2751.06812752.9404 2754.0476
2759.13482758.08722761.0706
2764.9404
2765.9456
2768.0024
Sample 6 mass peak area Tb 2740.9868 4.850e2 Ho 2747.0068 2.264e2
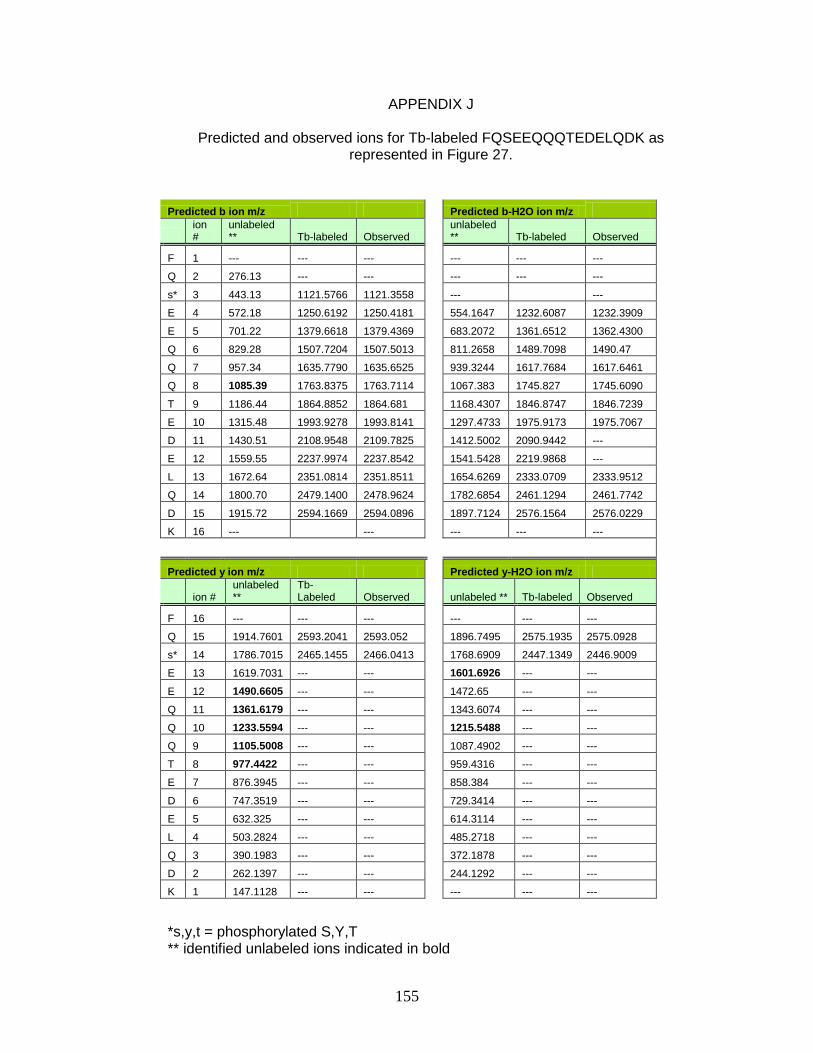
155
APPENDIX J
Predicted and observed ions for Tb-labeled FQSEEQQQTEDELQDK as represented in Figure 27.
Predicted b ion m/z Predicted b-H2O ion m/z
ion #
unlabeled ** Tb-labeled Observed
unlabeled ** Tb-labeled Observed
F 1 --- --- --- --- --- ---
Q 2 276.13 --- --- --- --- ---
s* 3 443.13 1121.5766 1121.3558 --- ---
E 4 572.18 1250.6192 1250.4181 554.1647 1232.6087 1232.3909
E 5 701.22 1379.6618 1379.4369 683.2072 1361.6512 1362.4300
Q 6 829.28 1507.7204 1507.5013 811.2658 1489.7098 1490.47
Q 7 957.34 1635.7790 1635.6525 939.3244 1617.7684 1617.6461
Q 8 1085.39 1763.8375 1763.7114 1067.383 1745.827 1745.6090
T 9 1186.44 1864.8852 1864.681 1168.4307 1846.8747 1846.7239
E 10 1315.48 1993.9278 1993.8141 1297.4733 1975.9173 1975.7067
D 11 1430.51 2108.9548 2109.7825 1412.5002 2090.9442 ---
E 12 1559.55 2237.9974 2237.8542 1541.5428 2219.9868 ---
L 13 1672.64 2351.0814 2351.8511 1654.6269 2333.0709 2333.9512
Q 14 1800.70 2479.1400 2478.9624 1782.6854 2461.1294 2461.7742
D 15 1915.72 2594.1669 2594.0896 1897.7124 2576.1564 2576.0229
K 16 --- --- --- --- ---
Predicted y ion m/z Predicted y-H2O ion m/z
ion # unlabeled **
Tb-Labeled Observed unlabeled ** Tb-labeled Observed
F 16 --- --- --- --- --- ---
Q 15 1914.7601 2593.2041 2593.052 1896.7495 2575.1935 2575.0928
s* 14 1786.7015 2465.1455 2466.0413 1768.6909 2447.1349 2446.9009
E 13 1619.7031 --- --- 1601.6926 --- ---
E 12 1490.6605 --- --- 1472.65 --- ---
Q 11 1361.6179 --- --- 1343.6074 --- ---
Q 10 1233.5594 --- --- 1215.5488 --- ---
Q 9 1105.5008 --- --- 1087.4902 --- ---
T 8 977.4422 --- --- 959.4316 --- ---
E 7 876.3945 --- --- 858.384 --- ---
D 6 747.3519 --- --- 729.3414 --- ---
E 5 632.325 --- --- 614.3114 --- ---
L 4 503.2824 --- --- 485.2718 --- ---
Q 3 390.1983 --- --- 372.1878 --- ---
D 2 262.1397 --- --- 244.1292 --- ---
K 1 147.1128 --- --- --- --- ---
*s,y,t = phosphorylated S,Y,T ** identified unlabeled ions indicated in bold
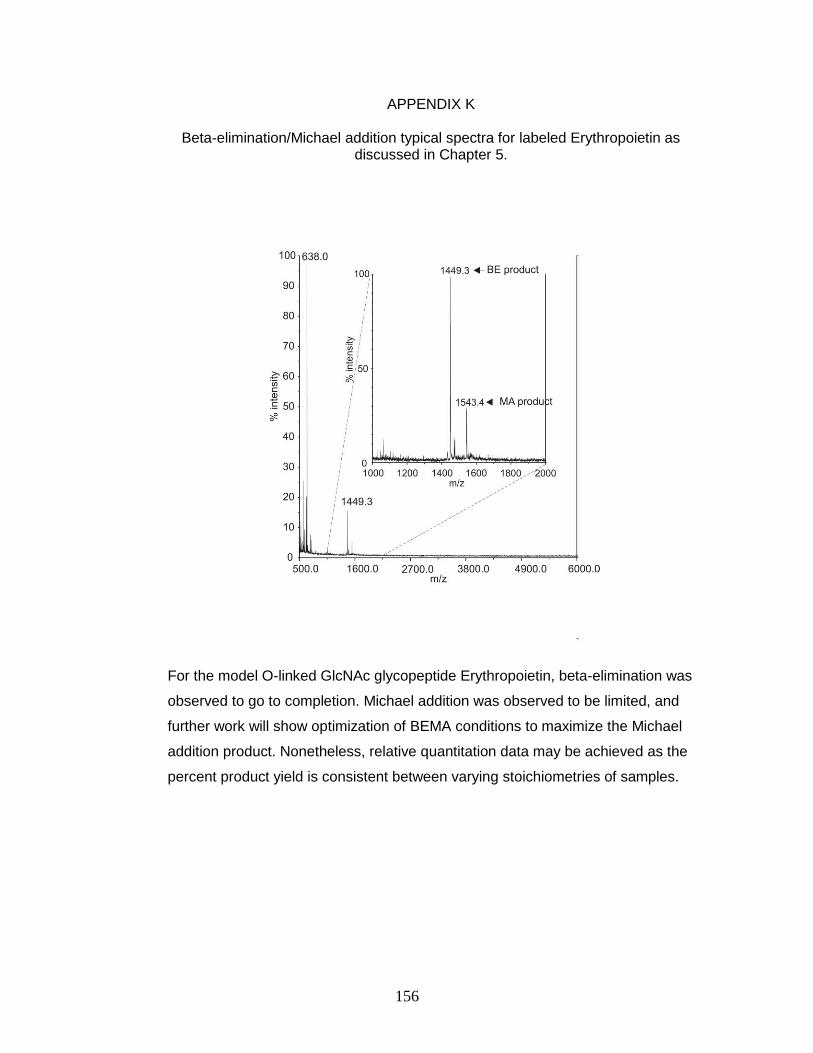
156
APPENDIX K
Beta-elimination/Michael addition typical spectra for labeled Erythropoietin as discussed in Chapter 5.
For the model O-linked GlcNAc glycopeptide Erythropoietin, beta-elimination was
observed to go to completion. Michael addition was observed to be limited, and
further work will show optimization of BEMA conditions to maximize the Michael
addition product. Nonetheless, relative quantitation data may be achieved as the
percent product yield is consistent between varying stoichiometries of samples.
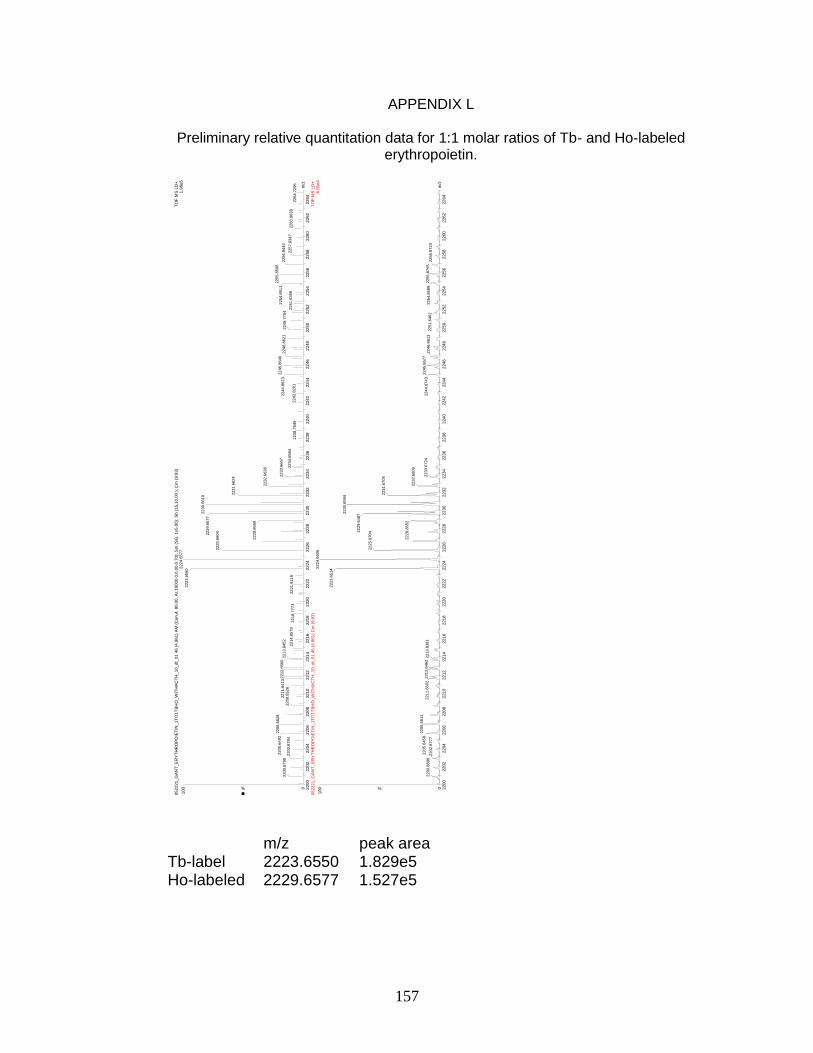
157
APPENDIX L
Preliminary relative quantitation data for 1:1 molar ratios of Tb- and Ho-labeled erythropoietin.
m/z peak area Tb-label 2223.6550 1.829e5 Ho-labeled 2229.6577 1.527e5
m/z
2200
2202
2204
2206
2208
2210
2212
2214
2216
2218
2220
2222
2224
2226
2228
2230
2232
2234
2236
2238
2240
2242
2244
2246
2248
2250
2252
2254
2256
2258
2260
2262
2264
%
0
100
m/z
2200
2202
2204
2206
2208
2210
2212
2214
2216
2218
2220
2222
2224
2226
2228
2230
2232
2234
2236
2238
2240
2242
2244
2246
2248
2250
2252
2254
2256
2258
2260
2262
2264
%
0
100
052221_G
AN
T_E
RY
TH
RO
PO
IET
IN_1T
O1T
BH
O_W
ITH
AC
TH
_10_dt_
01 4
6 (
4.9
61)
AM
(C
en,4
, 80.0
0, A
r,10000.0
,0.0
0,0
.70);
Sm
(S
G, 1x5.0
0);
Sb (
15,1
0.0
0 )
; C
m (
9:9
3)
TO
F M
S L
D+
1.9
6e5
2224.6
577
2223.6
550
2206.6
528
2205.6
492
2200.8
799
2202.8
784
2212.6
560
2211.8
413
2208.6
526
2213.8
452
2214.8
579
2221.9
119
2218.7
773
2230.6
619
2229.6
577
2225.6
604
2228.8
669
2231.6
624
2232.6
638
2255.8
506
2245.8
640
2244.8
623
2233.6
667
2234.6
584
2242.8
201
2238.7
849
2254.8
511
2246.8
621
2249.7
754
2251.6
399
2256.8
442
2257.8
347
2260.8
638
2264.7
295
052221_G
AN
T_E
RY
TH
RO
PO
IET
IN_1T
O1T
BH
O_W
ITH
AC
TH
_10_dt_
01 4
6 (
4.9
61)
Cm
(9:9
3)
TO
F M
S L
D+
6.5
1e4
2224.6
606
2223.6
514
2206.6
511
2205.6
458
2200.8
896
2202.8
777
2212.6
462
2211.6
602
2213.8
381
2230.6
594
2229.6
487
2225.6
704
2228.8
652
2231.6
704
2232.6
609
2245.8
677
2244.8
743
2233.6
724
2255.8
765
2246.8
613
2254.8
599
2251.6
462
2256.8
723
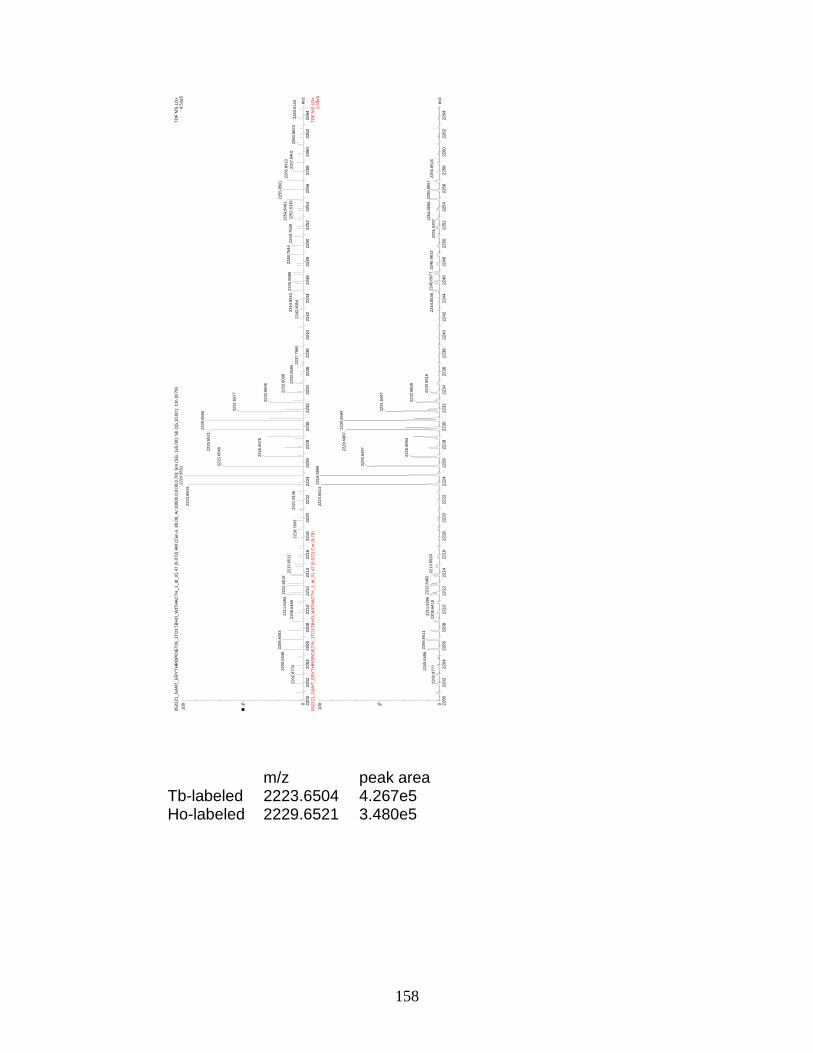
158
m/z peak area
Tb-labeled 2223.6504 4.267e5 Ho-labeled 2229.6521 3.480e5
m/z
2200
2202
2204
2206
2208
2210
2212
2214
2216
2218
2220
2222
2224
2226
2228
2230
2232
2234
2236
2238
2240
2242
2244
2246
2248
2250
2252
2254
2256
2258
2260
2262
2264
%
0
100
m/z
2200
2202
2204
2206
2208
2210
2212
2214
2216
2218
2220
2222
2224
2226
2228
2230
2232
2234
2236
2238
2240
2242
2244
2246
2248
2250
2252
2254
2256
2258
2260
2262
2264
%
0
100
052221_G
AN
T_E
RY
TH
RO
PO
IET
IN_1T
O1T
BH
O_W
ITH
AC
TH
_1_dt_
01 4
7 (
5.0
72)
AM
(C
en,4
, 80.0
0, A
r,10000.0
,0.0
0,0
.70);
Sm
(S
G, 1x5.0
0);
Sb (
15,1
0.0
0 )
; C
m (
9:7
9)
TO
F M
S L
D+
4.5
1e5
2224.6
531
2223.6
504
2206.6
453
2205.6
440
2202.8
770
2212.6
516
2211.6
494
2208.6
489
2213.6
511
2221.9
136
2218.7
603
2230.6
555
2229.6
521
2225.6
548
2226.6
575
2231.6
577
2232.6
606
2255.8
501
2254.8
481
2233.6
599
2248.7
644
2245.8
586
2244.8
542
2234.6
594
2237.7
900
2242.8
054
2249.7
549
2252.6
335
2256.8
413
2257.8
401
2260.8
623
2263.6
143
052221_G
AN
T_E
RY
TH
RO
PO
IET
IN_1T
O1T
BH
O_W
ITH
AC
TH
_1_dt_
01 4
7 (
5.0
72)
Cm
(9:7
9)
TO
F M
S L
D+
1.5
3e5
2224.6
606
2223.6
514
2206.6
511
2205.6
458
2202.8
777
2212.6
462
2211.6
396
2208.6
418
2213.6
528
2230.6
594
2229.6
487
2225.6
497
2226.6
594
2231.6
497
2232.6
609
2255.8
557
2254.8
599
2233.6
516
2245.8
677
2244.8
538
2246.8
613
2251.6
257
2256.8
516
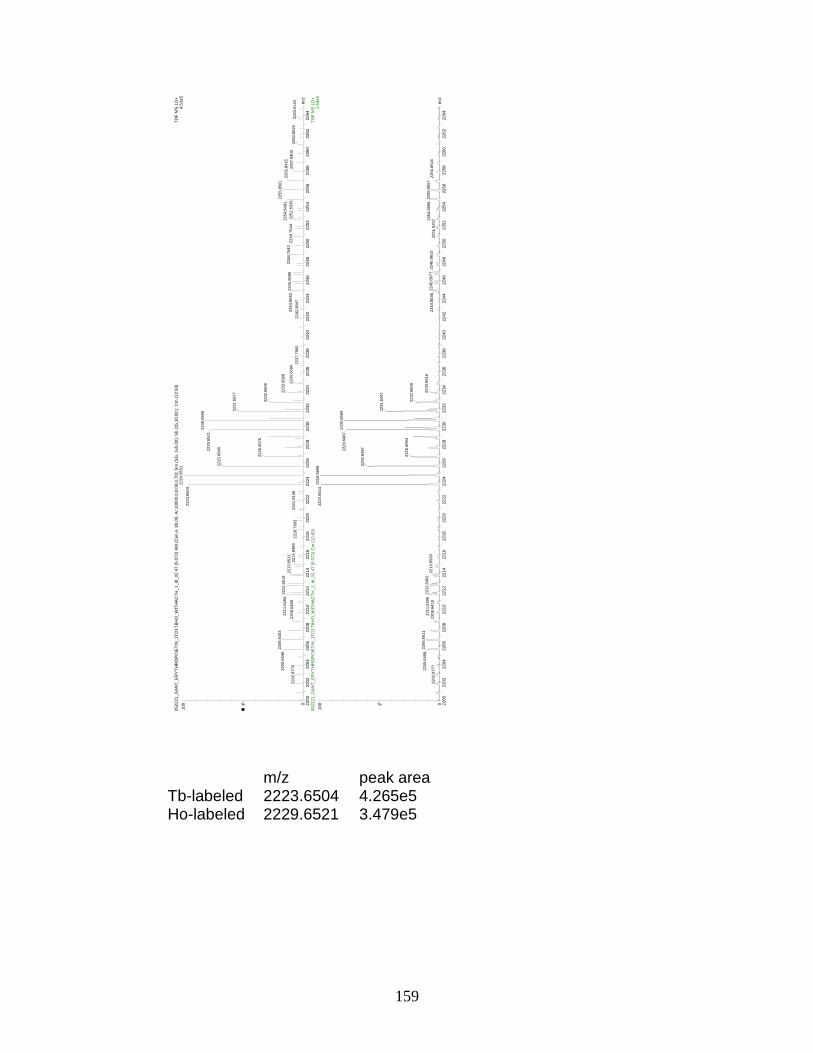
159
m/z peak area Tb-labeled 2223.6504 4.265e5 Ho-labeled 2229.6521 3.479e5
m/z
2200
2202
2204
2206
2208
2210
2212
2214
2216
2218
2220
2222
2224
2226
2228
2230
2232
2234
2236
2238
2240
2242
2244
2246
2248
2250
2252
2254
2256
2258
2260
2262
2264
%
0
100
m/z
2200
2202
2204
2206
2208
2210
2212
2214
2216
2218
2220
2222
2224
2226
2228
2230
2232
2234
2236
2238
2240
2242
2244
2246
2248
2250
2252
2254
2256
2258
2260
2262
2264
%
0
100
052221_G
AN
T_E
RY
TH
RO
PO
IET
IN_1T
O1T
BH
O_W
ITH
AC
TH
_1_dt_
02 4
7 (
5.0
72)
AM
(C
en,4
, 80.0
0, A
r,10000.0
,0.0
0,0
.70);
Sm
(S
G, 1x5.0
0);
Sb (
15,1
0.0
0 )
; C
m (
12:9
3)
TO
F M
S L
D+
4.5
1e5
2224.6
531
2223.6
504
2206.6
453
2205.6
440
2202.8
770
2212.6
516
2211.6
494
2208.6
489
2213.6
511
2214.8
489
2221.9
136
2218.7
603
2230.6
555
2229.6
521
2225.6
548
2226.6
575
2231.6
577
2232.6
606
2255.8
501
2254.8
481
2233.6
599
2248.7
642
2245.8
586
2244.8
540
2234.6
594
2237.7
900
2242.8
047
2249.7
544
2252.6
335
2256.8
416
2257.8
403
2260.8
625
2263.6
143
052221_G
AN
T_E
RY
TH
RO
PO
IET
IN_1T
O1T
BH
O_W
ITH
AC
TH
_1_dt_
02 4
7 (
5.0
72)
Cm
(12:9
3)
TO
F M
S L
D+
1.5
3e5
2224.6
606
2223.6
514
2206.6
511
2205.6
458
2202.8
777
2212.6
462
2211.6
396
2208.6
418
2213.6
528
2230.6
594
2229.6
487
2225.6
497
2226.6
594
2231.6
497
2232.6
609
2255.8
557
2254.8
599
2233.6
516
2245.8
677
2244.8
538
2246.8
613
2251.6
257
2256.8
516
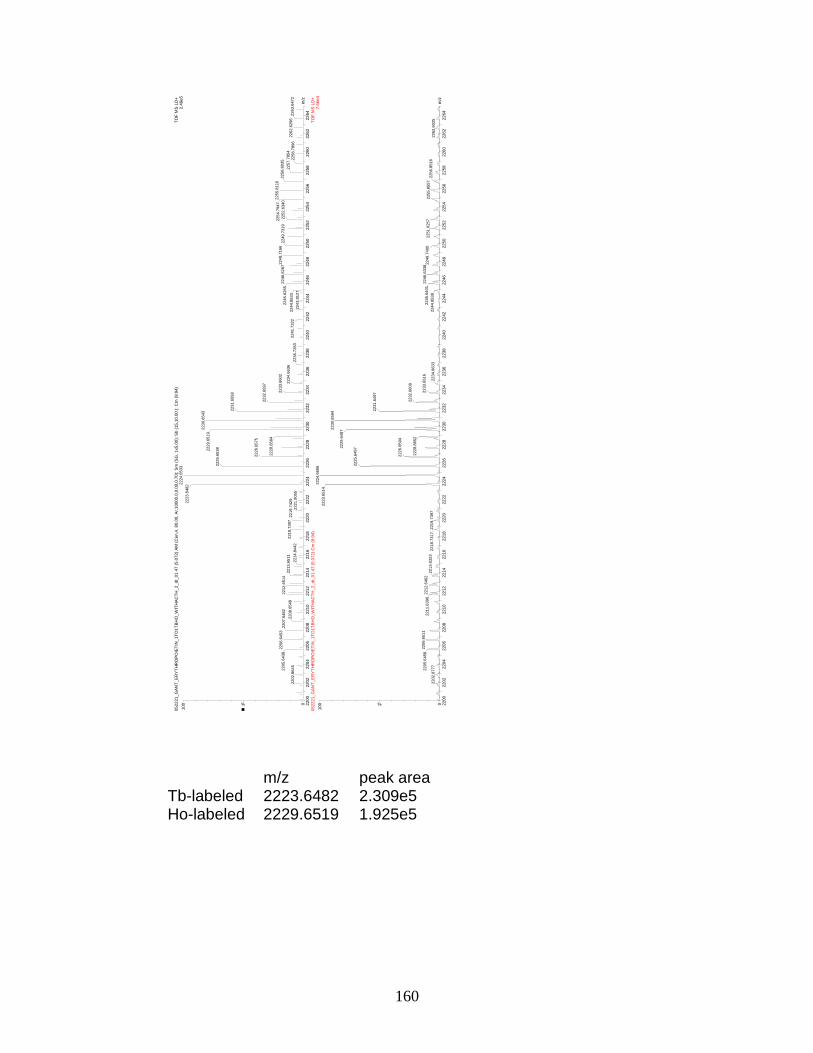
160
m/z peak area
Tb-labeled 2223.6482 2.309e5 Ho-labeled 2229.6519 1.925e5
m/z
2200
2202
2204
2206
2208
2210
2212
2214
2216
2218
2220
2222
2224
2226
2228
2230
2232
2234
2236
2238
2240
2242
2244
2246
2248
2250
2252
2254
2256
2258
2260
2262
2264
%
0
100
m/z
2200
2202
2204
2206
2208
2210
2212
2214
2216
2218
2220
2222
2224
2226
2228
2230
2232
2234
2236
2238
2240
2242
2244
2246
2248
2250
2252
2254
2256
2258
2260
2262
2264
%
0
100
052221_G
AN
T_E
RY
TH
RO
PO
IET
IN_1T
O1T
BH
O_W
ITH
AC
TH
_2_dt_
01 4
7 (
5.0
72)
AM
(C
en,4
, 80.0
0, A
r,10000.0
,0.0
0,0
.70);
Sm
(S
G, 1x5.0
0);
Sb (
15,1
0.0
0 )
; C
m (
9:9
4)
TO
F M
S L
D+
2.4
9e5
2224.6
533
2223.6
482
2206.6
453
2205.6
438
2202.8
645
2207.6
482
2212.6
514
2208.6
548
2213.6
511
2218.7
397
2214.8
442
2219.7
429
2221.9
055
2230.6
543
2229.6
519
2225.6
538
2226.6
575
2228.8
584
2231.6
558
2232.6
597
2255.8
110
2254.7
947
2248.7
166
2246.6
287
2233.6
602
2245.6
265
2234.6
636
2244.8
533
2236.7
283
2241.7
322
2243.8
127
2249.7
319
2252.6
340
2256.8
035
2257.7
854
2262.6
296
2258.7
896
2263.6
472
052221_G
AN
T_E
RY
TH
RO
PO
IET
IN_1T
O1T
BH
O_W
ITH
AC
TH
_2_dt_
01 4
7 (
5.0
72)
Cm
(9:9
4)
TO
F M
S L
D+
7.6
6e4
2224.6
606
2223.6
514
2206.6
511
2205.6
458
2202.8
777
2212.6
462
2211.6
396
2213.6
323
2219.7
397
2218.7
317
2230.6
594
2229.6
487
2225.6
497
2226.6
594
2228.8
652
2231.6
497
2232.6
609
2246.6
338
2245.6
401
2233.6
516
2244.8
538
2234.6
633
2251.6
257
2249.7
400
2255.8
557
2256.8
516
2262.6
025
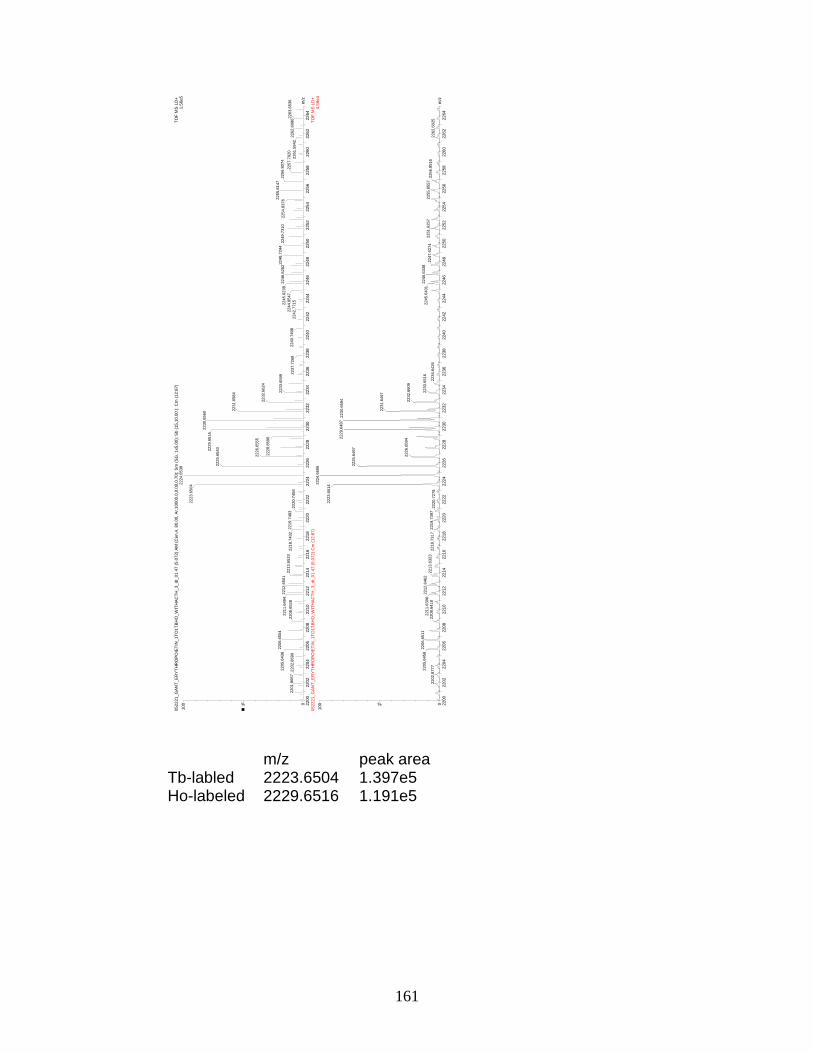
161
m/z peak area
Tb-labled 2223.6504 1.397e5 Ho-labeled 2229.6516 1.191e5
m/z
2200
2202
2204
2206
2208
2210
2212
2214
2216
2218
2220
2222
2224
2226
2228
2230
2232
2234
2236
2238
2240
2242
2244
2246
2248
2250
2252
2254
2256
2258
2260
2262
2264
%
0
100
m/z
2200
2202
2204
2206
2208
2210
2212
2214
2216
2218
2220
2222
2224
2226
2228
2230
2232
2234
2236
2238
2240
2242
2244
2246
2248
2250
2252
2254
2256
2258
2260
2262
2264
%
0
100
052221_G
AN
T_E
RY
TH
RO
PO
IET
IN_1T
O1T
BH
O_W
ITH
AC
TH
_3_dt_
01 4
7 (
5.0
72)
AM
(C
en,4
, 80.0
0, A
r,10000.0
,0.0
0,0
.70);
Sm
(S
G, 1x5.0
0);
Sb (
15,1
0.0
0 )
; C
m (
12:8
7)
TO
F M
S L
D+
1.5
6e5
2224.6
538
2223.6
504
2206.6
504
2205.6
438
2201.8
667
2202.8
699
2212.6
501
2211.6
494
2208.6
528
2213.6
533
2219.7
483
2218.7
432
2220.7
458
2230.6
560
2229.6
516
2225.6
543
2226.6
555
2228.8
596
2231.6
584
2232.6
624
2255.8
147
2248.7
244
2246.6
282
2233.6
599
2245.6
238
2244.8
547
2242.7
715
2240.7
498
2237.7
268
2249.7
310
2254.8
376
2256.8
074
2257.7
920
2262.6
086
2261.5
942
2263.6
536
052221_G
AN
T_E
RY
TH
RO
PO
IET
IN_1T
O1T
BH
O_W
ITH
AC
TH
_3_dt_
01 4
7 (
5.0
72)
Cm
(12:8
7)
TO
F M
S L
D+
4.5
9e4
2224.6
606
2223.6
514
2206.6
511
2205.6
458
2202.8
777
2212.6
462
2211.6
396
2208.6
418
2213.6
323
2219.7
397
2218.7
317
2220.7
278
2229.6
487
2225.6
497
2226.6
594
2230.6
594
2231.6
497
2232.6
609
2246.6
338
2245.6
401
2233.6
516
2234.6
426
2255.8
557
2251.6
257
2247.6
274
2256.8
516
2262.6
025
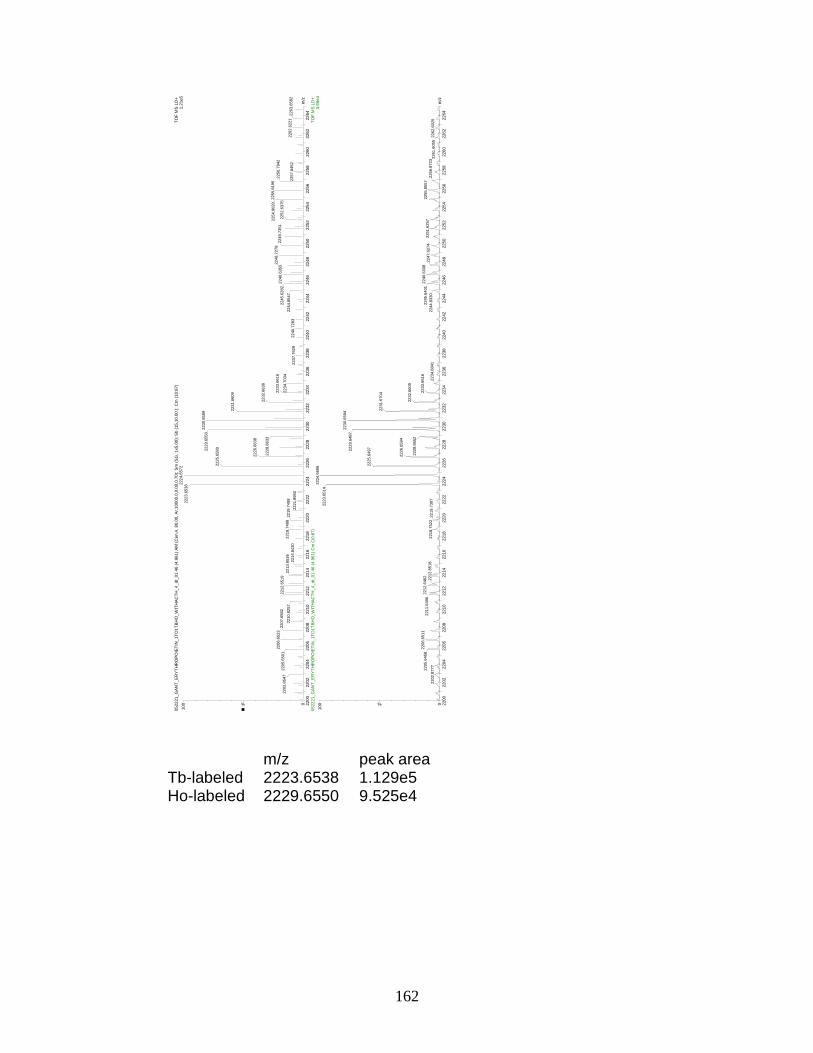
162
m/z peak area
Tb-labeled 2223.6538 1.129e5 Ho-labeled 2229.6550 9.525e4
m/z
2200
2202
2204
2206
2208
2210
2212
2214
2216
2218
2220
2222
2224
2226
2228
2230
2232
2234
2236
2238
2240
2242
2244
2246
2248
2250
2252
2254
2256
2258
2260
2262
2264
%
0
100
m/z
2200
2202
2204
2206
2208
2210
2212
2214
2216
2218
2220
2222
2224
2226
2228
2230
2232
2234
2236
2238
2240
2242
2244
2246
2248
2250
2252
2254
2256
2258
2260
2262
2264
%
0
100
052221_G
AN
T_E
RY
TH
RO
PO
IET
IN_1T
O1T
BH
O_W
ITH
AC
TH
_4_dt_
01 4
6 (
4.9
61)
AM
(C
en,4
, 80.0
0, A
r,10000.0
,0.0
0,0
.70);
Sm
(S
G, 1x5.0
0);
Sb (
15,1
0.0
0 )
; C
m (
10:8
7)
TO
F M
S L
D+
1.2
1e5
2224.6
572
2223.6
538
2206.6
523
2205.6
501
2202.8
547
2207.6
582
2212.6
519
2210.8
257
2218.7
498
2213.6
536
2214.8
430
2219.7
498
2221.8
950
2230.6
589
2229.6
550
2225.6
589
2226.6
638
2228.8
633
2231.6
609
2232.6
638
2255.8
196
2254.8
020
2248.7
278
2233.6
616
2246.6
355
2245.6
282
2234.7
034
2244.8
547
2240.7
283
2237.7
629
2249.7
351
2252.6
375
2256.7
942
2262.6
221
2257.8
452
2263.6
582
052221_G
AN
T_E
RY
TH
RO
PO
IET
IN_1T
O1T
BH
O_W
ITH
AC
TH
_4_dt_
01 4
6 (
4.9
61)
Cm
(10:8
7)
TO
F M
S L
D+
3.6
9e4
2224.6
606
2223.6
514
2206.6
511
2205.6
458
2202.8
777
2212.6
462
2211.6
396
2212.8
518
2218.7
522
2219.7
397
2230.6
594
2229.6
487
2225.6
497
2226.6
594
2228.8
652
2231.6
704
2232.6
609
2246.6
338
2233.6
516
2245.6
401
2244.8
330
2234.6
841
2255.8
557
2251.6
257
2247.6
274
2256.8
723
2262.6
025
2261.6
055
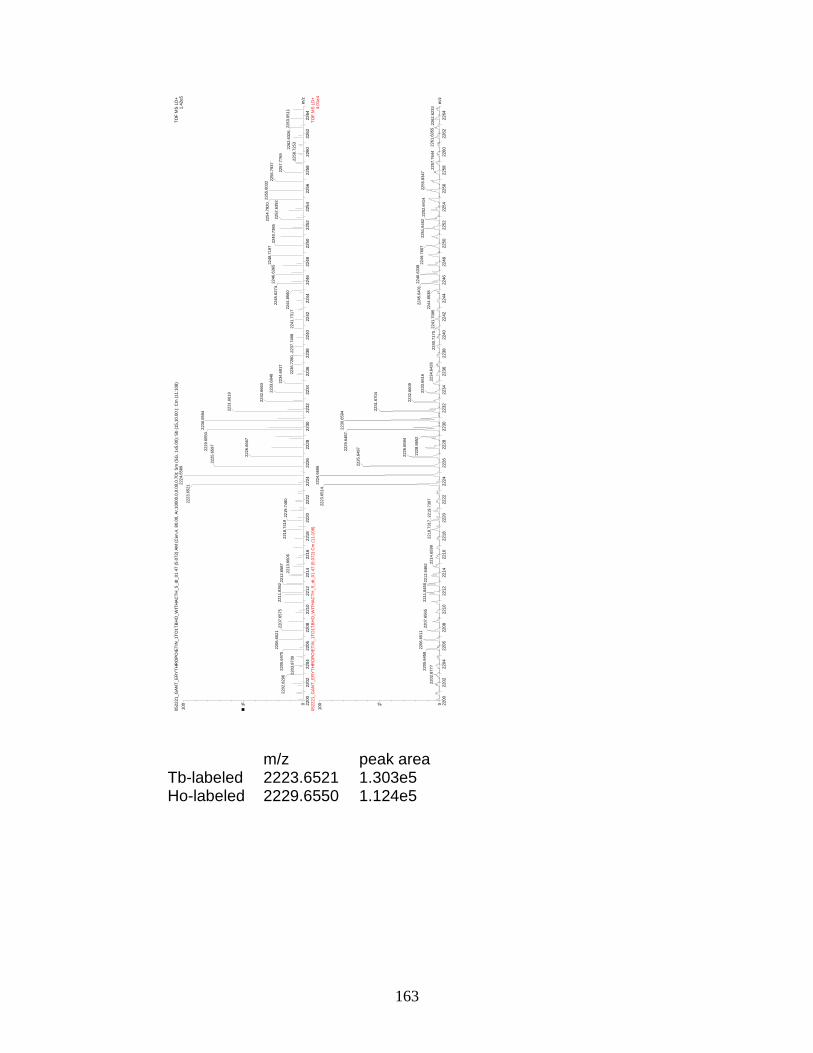
163
m/z peak area
Tb-labeled 2223.6521 1.303e5 Ho-labeled 2229.6550 1.124e5
m/z
2200
2202
2204
2206
2208
2210
2212
2214
2216
2218
2220
2222
2224
2226
2228
2230
2232
2234
2236
2238
2240
2242
2244
2246
2248
2250
2252
2254
2256
2258
2260
2262
2264
%
0
100
m/z
2200
2202
2204
2206
2208
2210
2212
2214
2216
2218
2220
2222
2224
2226
2228
2230
2232
2234
2236
2238
2240
2242
2244
2246
2248
2250
2252
2254
2256
2258
2260
2262
2264
%
0
100
052221_G
AN
T_E
RY
TH
RO
PO
IET
IN_1T
O1T
BH
O_W
ITH
AC
TH
_5_dt_
01 4
7 (
5.0
72)
AM
(C
en,4
, 80.0
0, A
r,10000.0
,0.0
0,0
.70);
Sm
(S
G, 1x5.0
0);
Sb (
15,1
0.0
0 )
; C
m (
11:1
08)
TO
F M
S L
D+
1.4
2e5
2224.6
589
2223.6
521
2206.6
521
2205.6
475
2202.8
296
2203.8
730
2211.8
362
2207.6
575
2212.6
587
2218.7
419
2213.6
606
2219.7
480
2230.6
594
2229.6
550
2225.6
597
2226.6
667
2231.6
619
2232.6
663
2255.8
032
2254.7
820
2248.7
197
2246.6
365
2233.6
848
2245.6
274
2234.6
917
2244.8
560
2236.7
280
2237.7
498
2241.7
317
2249.7
385
2252.6
392
2256.7
937
2257.7
769
2263.6
511
2262.6
326
2258.7
253
052221_G
AN
T_E
RY
TH
RO
PO
IET
IN_1T
O1T
BH
O_W
ITH
AC
TH
_5_dt_
01 4
7 (
5.0
72)
Cm
(11:1
08)
TO
F M
S L
D+
4.0
1e4
2224.6
606
2223.6
514
2206.6
511
2205.6
458
2202.8
777
2211.8
450
2207.6
565
2212.6
462
2218.7
317
2214.6
599
2219.7
397
2230.6
594
2229.6
487
2225.6
497
2226.6
594
2228.8
652
2231.6
704
2232.6
609
2246.6
338
2245.6
401
2233.6
516
2234.6
426
2244.8
538
2241.7
095
2240.7
170
2251.6
462
2249.7
607
2252.6
414
2255.8
347
2261.6
055
2257.7
644
2262.6
233
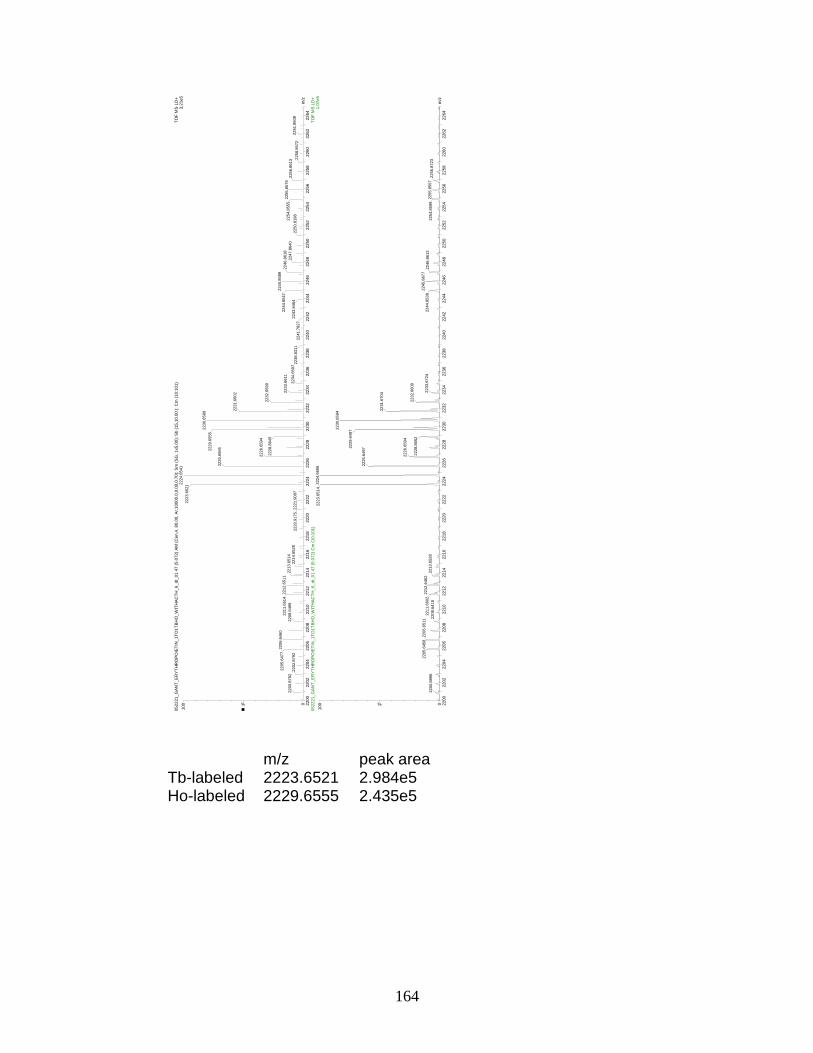
164
m/z peak area
Tb-labeled 2223.6521 2.984e5 Ho-labeled 2229.6555 2.435e5
m/z
2200
2202
2204
2206
2208
2210
2212
2214
2216
2218
2220
2222
2224
2226
2228
2230
2232
2234
2236
2238
2240
2242
2244
2246
2248
2250
2252
2254
2256
2258
2260
2262
2264
%
0
100
m/z
2200
2202
2204
2206
2208
2210
2212
2214
2216
2218
2220
2222
2224
2226
2228
2230
2232
2234
2236
2238
2240
2242
2244
2246
2248
2250
2252
2254
2256
2258
2260
2262
2264
%
0
100
052221_G
AN
T_E
RY
TH
RO
PO
IET
IN_1T
O1T
BH
O_W
ITH
AC
TH
_6_dt_
01 4
7 (
5.0
72)
AM
(C
en,4
, 80.0
0, A
r,10000.0
,0.0
0,0
.70);
Sm
(S
G, 1x5.0
0);
Sb (
15,1
0.0
0 )
; C
m (
10:1
01)
TO
F M
S L
D+
3.2
1e5
2224.6
541
2223.6
521
2206.6
460
2205.6
477
2200.8
782
2202.8
792
2212.6
511
2211.6
514
2208.6
499
2213.6
514
2214.6
528
2221.9
097
2220.9
175
2230.6
589
2229.6
555
2225.6
565
2226.6
594
2228.8
645
2231.6
602
2232.6
599
2245.8
589
2244.8
547
2233.6
611
2234.6
597
2243.8
464
2241.7
827
2238.8
311
2246.8
618
2255.8
579
2254.8
555
2247.8
640
2250.8
198
2256.8
613 2
258.8
572
2261.8
608
052221_G
AN
T_E
RY
TH
RO
PO
IET
IN_1T
O1T
BH
O_W
ITH
AC
TH
_6_dt_
01 4
7 (
5.0
72)
Cm
(10:1
01)
TO
F M
S L
D+
1.0
7e5
2224.6
606
2223.6
514
2205.6
458
2200.8
896
2206.6
511
2212.6
462
2211.6
602
2208.6
418
2213.6
528
2230.6
594
2229.6
487
2225.6
497
2226.6
594
2228.8
652
2231.6
704
2232.6
609
2245.8
677
2244.8
538
2233.6
724
2246.8
613
2255.8
557
2254.8
599
2256.8
723
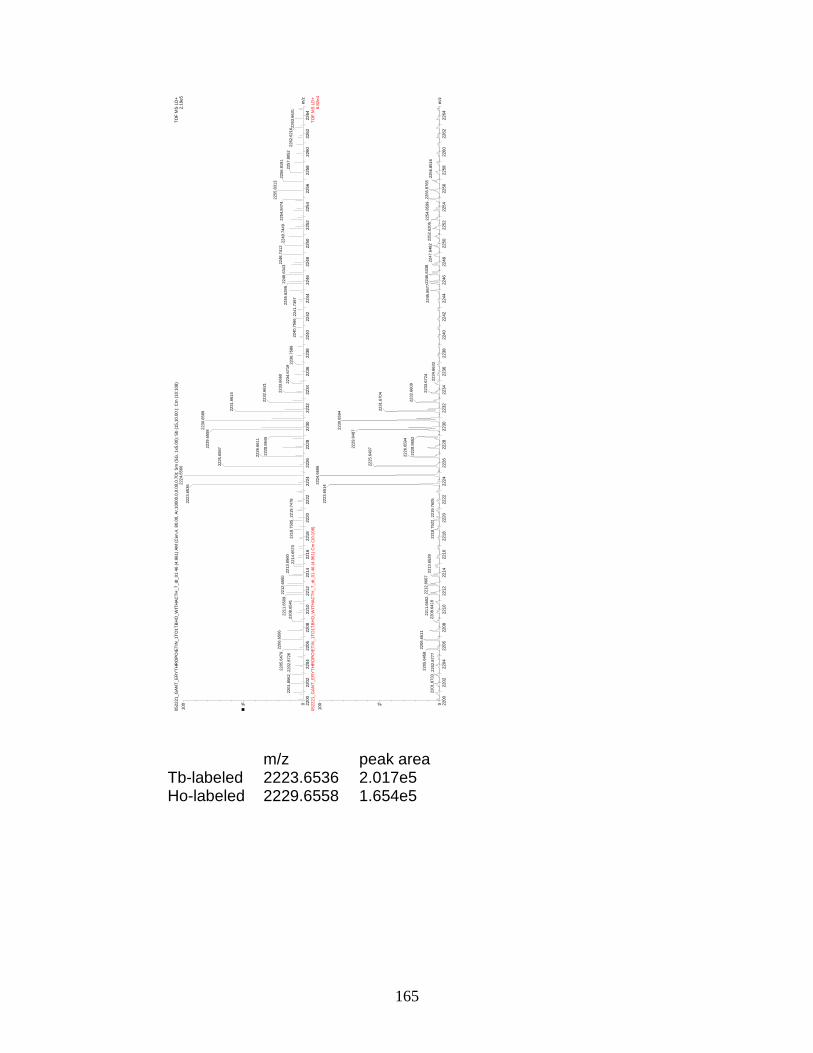
165
m/z peak area Tb-labeled 2223.6536 2.017e5 Ho-labeled 2229.6558 1.654e5
m/z
2200
2202
2204
2206
2208
2210
2212
2214
2216
2218
2220
2222
2224
2226
2228
2230
2232
2234
2236
2238
2240
2242
2244
2246
2248
2250
2252
2254
2256
2258
2260
2262
2264
%
0
100
m/z
2200
2202
2204
2206
2208
2210
2212
2214
2216
2218
2220
2222
2224
2226
2228
2230
2232
2234
2236
2238
2240
2242
2244
2246
2248
2250
2252
2254
2256
2258
2260
2262
2264
%
0
100
052221_G
AN
T_E
RY
TH
RO
PO
IET
IN_1T
O1T
BH
O_W
ITH
AC
TH
_7_dt_
01 4
6 (
4.9
61)
AM
(C
en,4
, 80.0
0, A
r,10000.0
,0.0
0,0
.70);
Sm
(S
G, 1x5.0
0);
Sb (
15,1
0.0
0 )
; C
m (
10:1
08)
TO
F M
S L
D+
2.1
9e5
2224.6
560
2223.6
536
2206.6
506
2205.6
479
2201.8
562
2202.8
726
2212.6
550
2211.6
509
2208.6
541
2213.6
560
2218.7
505
2214.6
570
2219.7
478
2230.6
589
2229.6
558
2225.6
587
2226.6
611
2228.8
645
2231.6
614
2232.6
621
2255.8
313
2248.7
412
2233.6
660
2246.6
343
2245.6
289
2234.6
719
2236.7
588
2240.7
566
2241.7
397
2254.8
474
2249.7
449
2256.8
191
2257.8
052
2263.6
631
2262.6
216
052221_G
AN
T_E
RY
TH
RO
PO
IET
IN_1T
O1T
BH
O_W
ITH
AC
TH
_7_dt_
01 4
6 (
4.9
61)
Cm
(10:1
08)
TO
F M
S L
D+
6.8
2e4
2224.6
606
2223.6
514
2206.6
511
2205.6
458
2201.8
733
2202.8
777
2212.6
667
2211.6
602
2208.6
418
2213.6
528
2218.7
522
2219.7
605
2230.6
594
2229.6
487
2225.6
497
2226.6
594
2228.8
652
2231.6
704
2232.6
609
2246.6
338
2245.8
677
2233.6
724
2234.6
633
2255.8
765
2254.8
599
2252.6
206
2247.6
482
2256.8
516
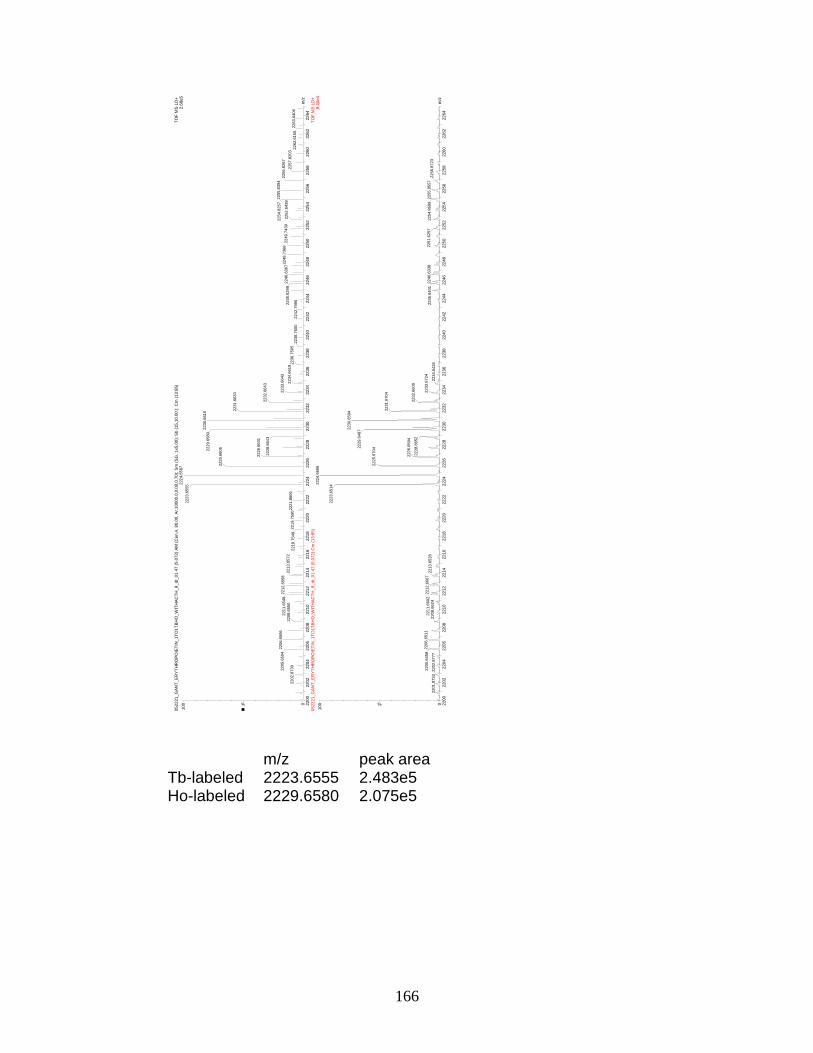
166
m/z peak area Tb-labeled 2223.6555 2.483e5 Ho-labeled 2229.6580 2.075e5
m/z
2200
2202
2204
2206
2208
2210
2212
2214
2216
2218
2220
2222
2224
2226
2228
2230
2232
2234
2236
2238
2240
2242
2244
2246
2248
2250
2252
2254
2256
2258
2260
2262
2264
%
0
100
m/z
2200
2202
2204
2206
2208
2210
2212
2214
2216
2218
2220
2222
2224
2226
2228
2230
2232
2234
2236
2238
2240
2242
2244
2246
2248
2250
2252
2254
2256
2258
2260
2262
2264
%
0
100
052221_G
AN
T_E
RY
TH
RO
PO
IET
IN_1T
O1T
BH
O_W
ITH
AC
TH
_8_dt_
01 4
7 (
5.0
72)
AM
(C
en,4
, 80.0
0, A
r,10000.0
,0.0
0,0
.70);
Sm
(S
G, 1x5.0
0);
Sb (
15,1
0.0
0 )
; C
m (
13:8
5)
TO
F M
S L
D+
2.6
8e5
2224.6
587
2223.6
555
2206.6
506
2205.6
504
2202.8
730
2212.6
558
2211.6
548
2208.6
550
2213.6
572
2221.8
606
2219.7
590
2218.7
549
2230.6
616
2229.6
580
2225.6
606
2226.6
631
2228.8
643
2231.6
633
2232.6
643
2255.8
394
2254.8
257
2248.7
368
2233.6
643
2246.6
367
2245.6
299
2234.6
619
2236.7
505
2238.7
600
2242.7
996
2249.7
439
2252.6
438
2256.8
267
2257.8
203
2263.6
406
2262.6
155
052221_G
AN
T_E
RY
TH
RO
PO
IET
IN_1T
O1T
BH
O_W
ITH
AC
TH
_8_dt_
01 4
7 (
5.0
72)
Cm
(13:8
5)
TO
F M
S L
D+
9.4
0e4
2224.6
606
2223.6
514
2206.6
511
2205.6
458
2201.8
733
2202.8
777
2212.6
667
2211.6
602
2208.6
624
2213.6
528
2230.6
594
2229.6
487
2225.6
704
2226.6
594
2228.8
652
2231.6
704
2232.6
609
2233.6
724
2246.6
338
2245.6
401
2234.6
426
2255.8
557
2254.8
599
2251.6
257
2256.8
723
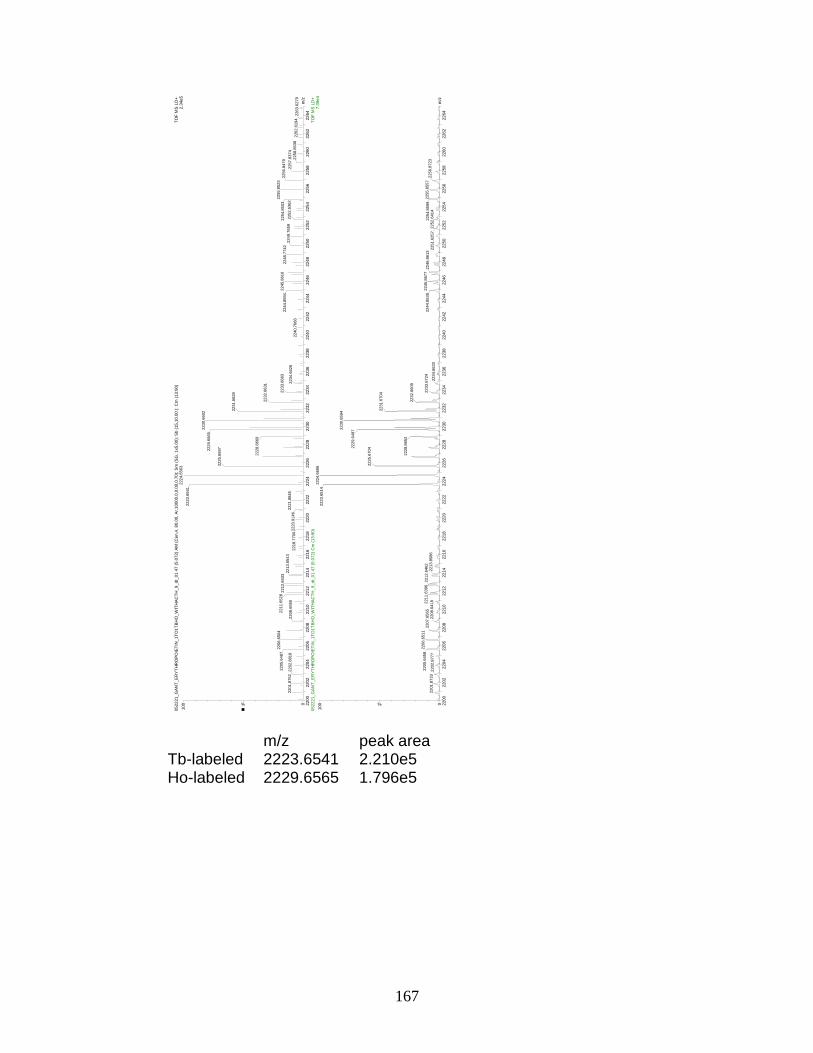
167
m/z peak area Tb-labeled 2223.6541 2.210e5 Ho-labeled 2229.6565 1.796e5
m/z
2200
2202
2204
2206
2208
2210
2212
2214
2216
2218
2220
2222
2224
2226
2228
2230
2232
2234
2236
2238
2240
2242
2244
2246
2248
2250
2252
2254
2256
2258
2260
2262
2264
%
0
100
m/z
2200
2202
2204
2206
2208
2210
2212
2214
2216
2218
2220
2222
2224
2226
2228
2230
2232
2234
2236
2238
2240
2242
2244
2246
2248
2250
2252
2254
2256
2258
2260
2262
2264
%
0
100
052221_G
AN
T_E
RY
TH
RO
PO
IET
IN_1T
O1T
BH
O_W
ITH
AC
TH
_9_dt_
01 4
7 (
5.0
72)
AM
(C
en,4
, 80.0
0, A
r,10000.0
,0.0
0,0
.70);
Sm
(S
G, 1x5.0
0);
Sb (
15,1
0.0
0 )
; C
m (
13:9
0)
TO
F M
S L
D+
2.3
4e5
2224.6
563
2223.6
541
2206.6
504
2205.6
487
2201.8
752
2202.8
818
2212.8
433
2211.6
528
2208.6
550
2213.6
543
2221.8
845
2220.9
146
2218.7
700
2230.6
602
2229.6
565
2225.6
597
2228.8
669
2231.6
628
2232.6
631
2255.8
523
2245.8
616
2244.8
594
2233.6
663
2234.6
626
2240.7
668
2254.8
503
2248.7
742
2249.7
659
2252.6
362
2256.8
479
2257.8
374
2258.8
538
2262.6
194
2263.6
279
052221_G
AN
T_E
RY
TH
RO
PO
IET
IN_1T
O1T
BH
O_W
ITH
AC
TH
_9_dt_
01 4
7 (
5.0
72)
Cm
(13:9
0)
TO
F M
S L
D+
7.3
9e4
2224.6
606
2223.6
514
2206.6
511
2205.6
458
2201.8
733
2202.8
777
2211.6
396
2207.6
565
2208.6
418
2212.6
462
2213.8
586
2230.6
594
2229.6
487
2225.6
704
2228.8
652
2231.6
704
2232.6
609
2245.8
677
2244.8
538
2233.6
724
2234.6
633
2255.8
557
2246.8
613
2254.8
599
2252.6
414
2251.6
257
2256.8
723
168
APPENDIX N
References for the adaptation of chapters
Chapter 1: Sections adapted from Randi L. Gant-Branum, Thomas J. Kerr, and John A. McLean, "Labeling Strategies in Mass Spectrometry-Based Protein Quantitation", Analyst, 2009, 134, 1525 – 1530. Chapter 2: Sections adapted from Randi L. Gant-Branum, Joshua A. Broussard, and John A. McLean, "Identification of Phosphorylation Sites within the Signaling Adaptor APPL1 by Mass Spectrometry." J. Proteome Res., 2010, 9 (3), 1541–1548. Chapter 3: Sections adapted from Relative Quantitation of Phosphorylated Peptides and Proteins using Phosphopeptide Element-Coded Affinity Tagging (PhECAT). In preparation for submission to Bioconjugate Chemistry. Chapter 4: Sections adapted from Relative Quantitation of Phosphorylated Peptides and Proteins using Phosphopeptide Element-Coded Affinity Tagging (PhECAT). In preparation for submission to Bioconjugate Chemistry.
169
REFERENCES
(1) Floyd, R. A. Exp. Biol. Med. 1999, 222, 236-245.
(2) Kovacech, B.; Zilka, N.; Novak, M. Cellular and Molecular Neurobiology
2009, 29, 799-805.
(3) Liu, F.; Iqbal, K.; Grundke-Iqbal, I.; Hart, G. W.; Gong, C.-X.
Proceedings of the National Academy of Sciences of the United States of America
2004, 101, 10804-10809.
(4) Shental-Bechor, D.; Levy, Y. Proceedings of the National Academy of
Sciences 2008, 105, 8256-8261.
(5) Hitosugi, T.; Kang, S.; Vander Heiden, M. G.; Chung, T.-W.; Elf, S.;
Lythgoe, K.; Dong, S.; Lonial, S.; Wang, X.; Chen, G. Z.; Xie, J.; Gu, T.-L.;
Polakiewicz, R. D.; Roesel, J. L.; Boggon, T. J.; Khuri, F. R.; Gilliland, D. G.;
Cantley, L. C.; Kaufman, J.; Chen, J. Sci. Signal. 2009, 2, ra73-.
(6) Savage, K.; Baur, P. J Cell Sci 1983, 64, 295-306.
(7) Mimura, Y.; Sondermann, P.; Ghirlando, R.; Lund, J.; Young, S. P.;
Goodall, M.; Jefferis, R. Journal of Biological Chemistry 2001, 276, 45539-
45547.
(8) Parekh, R. B.; Dwek, R. A.; Sutton, B. J.; Fernandes, D. L.; Leung, A.;
Stanworth, D.; Rademacher, T. W.; Mizuochi, T.; Taniguchi, T.; Matsuta, K.;
Takeuchi, F.; Nagano, Y.; Miyamoto, T.; Kobata, A. Nature 1985, 316, 452-457.
(9) Gant-Branum, R. L.; Kerr, T. J.; McLean, J. A. The Analyst 2009, 134,
1525-1530.
(10) Manning, G.; Whyte, D. B.; Martinez, R.; Hunter, T.; Sudarsanam, S.
Science 2002, 298, 1912-1934.
(11) Thingholm, T. E.; Jensen, O. N.; Larsen, M. R.; WILEY-VCH Verlag,
2009; Vol. 9, pp 1451-1468.
(12) Reinders, J.; Sickmann, A.; WILEY-VCH Verlag, 2005; Vol. 5, pp 4052-
4061.
(13) Chen, P.-L.; Scully, P.; Shew, J.-Y.; Wang, J. Y. J.; Lee, W.-H. Cell 1989,
58, 1193-1198.
(14) Webb, D. J.; Schroeder, M. J.; Brame, C. J.; Whitmore, L.; Shabanowitz,
J.; Hunt, D. F.; Horwitz, A. R. J Cell Sci 2005, 118, 4925-4929.
(15) Webb, D. J.; Donais, K.; Whitmore, L. A.; Thomas, S. M.; Turner, C. E.;
Parsons, J. T.; Horwitz, A. F. Nat Cell Biol 2004, 6, 154-161.
(16) Webb, D. J.; Kovalenko, M.; Whitmore, L.; Horwitz, A. F. Biochemical
and Biophysical Research Communications 2006, 346, 1284-1288.
(17) Webb, D. J.; Mayhew, M. W.; Kovalenko, M.; Schroeder, M. J.; Jeffery,
E. D.; Whitmore, L.; Shabanowitz, J.; Hunt, D. F.; Horwitz, A. F. J Cell Sci 2006,
119, 2847-2850.
(18) Gant-Branum, R. L.; Broussard, J. A.; Mahsut, A.; Webb, D. J.; McLean,
J. A. Journal of Proteome Research 2010, 9, 1541-1548.
(19) Matsuoka, S.; Ballif, B. A.; Smogorzewska, A.; McDonald, E. R.; Hurov,
K. E.; Luo, J.; Bakalarski, C. E.; Zhao, Z.; Solimini, N.; Lerenthal, Y.; Shiloh, Y.;
Gygi, S. P.; Elledge, S. J. Science 2007, 316, 1160-1166.
170
(20) Graves, J. D.; Krebs, E. G. Pharmacology & Therapeutics 1999
82, 111-121.
(21) López, E. M., R.; López, I.; Ashman, K.; Mendieta, J.; Wesselink, J.;
Gómez-Puertas, P.; Ferreir, A. Journal of Integrated OMICS 2010, accepted
October 2010.
(22) Hunter, T. Cell 2000, 100, 113-127.
(23) Mann, M.; Ong, S.-E.; Grønborg, M.; Steen, H.; Jensen, O. N.; Pandey, A.
Trends in Biotechnology 2002, 20, 261-268.
(24) Palumbo, A. M.; Reid, G. E. Analytical Chemistry 2008, 80, 9735-9747.
(25) Palumbo, A. M.; Tepe, J. J.; Reid, G. E. Journal of Proteome Research
2008, 7, 771-779.
(26) Apweiler, R.; Hermjakob, H.; Sharon, N. Biochimica et Biophysica Acta
(BBA) - General Subjects 1999, 1473, 4-8.
(27) Becker, K. L. Principles and practice of endocrinology and metabolism;
Lippincott Williams & Wilkins, 2001.
(28) Taoka, K.-i.; Ham, B.-K.; Xoconostle-Cazares, B.; Rojas, M. R.; Lucas,
W. J. Plant Cell 2007, 19, 1866-1884.
(29) Chen, D.; Juarez, S.; Hartweck, L.; Alamillo, J. M.; Simon-Mateo, C.;
Perez, J. J.; Fernandez-Fernandez, M. R.; Olszewski, N. E.; Garcia, J. A. J. Virol.
2005, 79, 9381-9387.
(30) Haines, N.; Irvine, K. D. Nat Rev Mol Cell Biol 2003, 4, 786-797.
(31) Varki, A. C., R.D.; Esko, J.D.; Freeze, H.H.; Stanley, P.; Bertozzi, C.R.;
Hart, G.W. and Etzler, M.E., Ed. Essentials of Glycobiology, 2nd ed.; Cold Spring
Harbor Laboratory Press: Cold Spring Harbor 2009.
(32) Huhn, C.; Selman, M. H. J.; Ruhaak, L. R.; Deelder, A. M.; Wuhrer, M.
PROTEOMICS 2009, 9, 882-913.
(33) Jacquemin, M.; Radcliffe, C. M.; Laven'homme, R.; Wormald, M. R.;
Vanderelst, L.; Wallays, G.; Dewaele, J.; Colllen, D.; Vermylen, J.; Dwek, R. A.;
Saint-Remy, J.-M.; Rudd, P. M.; Dewerchin, M. Journal of Thrombosis and
Haemostasis 2006, 4, 1047-1055.
(34) Kaneko, Y.; Nimmerjahn, F.; Ravetch, J. V. Science 2006, 313, 670-673.
(35) Mori, K.; Iida, S.; Yamane-Ohnuki, N.; Kanda, Y.; Kuni-Kamochi, R.;
Nakano, R.; Imai-Nishiya, H.; Okazaki, A.; Shinkawa, T.; Natsume, A.; Niwa, R.;
Shitara, K.; Satoh, M. Cytotechnology 2007, 55, 109-114.
(36) Hartweck, L. M.; Scott, C. L.; Olszewski, N. E. Genetics 2002, 161, 1279-
1291.
(37) Shafi, R.; Iyer, S. P. N.; Ellies, L. G.; O'Donnell, N.; Marek, K. W.; Chui,
D.; Hart, G. W.; Marth, J. D. Proceedings of the National Academy of Sciences of
the United States of America 2000, 97, 5735-5739.
(38) Vosseller, K.; Wells, L.; Lane, M. D.; Hart, G. W. Proceedings of the
National Academy of Sciences of the United States of America 2002, 99, 5313-
5318.
(39) Boyle, W. J.; van der Geer, P.; Hunter, T.; Tony, H.; Bartholomew, M. S.
In Methods in Enzymology; Academic Press, 1991; Vol. Volume 201, pp 110-149.
171
(40) Loo, R. R. O.; Mitchell, C.; Stevenson, T. I.; Martin, S. A.; Hines, W. M.;
Juhasz, P.; Patterson, D. H.; Peltier, J. M.; Loo, J. A.; Andrews, P. C.
ELECTROPHORESIS 1997, 18, 382-390.
(41) Neville, D. C. A.; Townsend, R. R.; Rozanas, C. R.; Verkman, A. S.;
Price, E. M.; Gruis, D. B. Protein Science 1997, 6, 2436-2445.
(42) Porath, J.; Carlsson, J. A. N.; Olsson, I.; Belfrage, G. Nature 1975, 258,
598-599.
(43) Zhong, J.; Molina, H.; Pandey, A. Phosphoproteomics; John Wiley &
Sons, Inc., 2001.
(44) Marcus, K.; Immler, D.; Sternberger, J.; Meyer, H. E.
ELECTROPHORESIS 2000, 21, 2622-2636.
(45) Sun, T.; Campbell, M.; Gordon, W.; Arlinghaus, R. B.; John Wiley &
Sons, Inc., 2001; Vol. 60, pp 61-75.
(46) Desiderio, D. M.; Kai, M. Biological Mass Spectrometry 1983, 10, 471-
479.
(47) Mirgorodskaya, O. A.; Kozmin, Y. P.; Titov, M. I.; Körner, R.; Sönksen,
C. P.; Roepstorff, P.; John Wiley & Sons, Ltd., 2000; Vol. 14, pp 1226-1232.
(48) Yao, X.; Freas, A.; Ramirez, J.; Demirev, P. A.; Fenselau, C. Analytical
Chemistry 2001, 73, 2836-2842.
(49) Ong, S.-E.; Blagoev, B.; Kratchmarova, I.; Kristensen, D. B.; Steen, H.;
Pandey, A.; Mann, M. Mol Cell Proteomics 2002, M200025-MCP200200.
(50) Ahrends, R.; Pieper, S.; Kuhn, A.; Weisshoff, H.; Hamester, M.;
Lindemann, T.; Scheler, C.; Lehmann, K.; Taubner, K.; Linscheid, M. W. Mol
Cell Proteomics 2007, 6, 1907-1916.
(51) Chen, M.; Su, X.; Yang, J.; Jenkins, C. M.; Cedars, A. M.; Gross, R. W.
Analytical Chemistry 2009, 82, 163-171.
(52) Goshe, M. B.; Conrads, T. P.; Panisko, E. A.; Angell, N. H.; Veenstra, T.
D.; Smith, R. D. Analytical Chemistry 2001, 73, 2578-2586.
(53) Gygi, S. P.; Rist, B.; Gerber, S. A.; Turecek, F.; Gelb, M. H.; Aebersold,
R. Nat Biotech 1999, 17, 994-999.
(54) Kerr, T. J.; McLean, J. A. Chemical Communications, 46, 5479-5481.
(55) Liu, H.; Zhang, Y.; Wang, J.; Wang, D.; Zhou, C.; Cai, Y.; Qian, X.
Analytical Chemistry 2006, 78, 6614-6621.
(56) Oda, Y.; Huang, K.; Cross, F. R.; Cowburn, D.; Chait, B. T. Proceedings
of the National Academy of Sciences of the United States of America 1999, 96,
6591-6596.
(57) Qian, W.-J.; Goshe, M. B.; Camp, D. G.; Yu, L.-R.; Tang, K.; Smith, R.
D. Analytical Chemistry 2003, 75, 5441-5450.
(58) Whetstone, P. A.; Butlin, N. G.; Corneillie, T. M.; Meares, C. F.
Bioconjugate Chemistry 2004, 15, 3-6.
(59) Ross, P. L.; Huang, Y. N.; Marchese, J. N.; Williamson, B.; Parker, K.;
Hattan, S.; Khainovski, N.; Pillai, S.; Dey, S.; Daniels, S.; Purkayastha, S.;
Juhasz, P.; Martin, S.; Bartlet-Jones, M.; He, F.; Jacobson, A.; Pappin, D. J.
Molecular & Cellular Proteomics 2004, 3, 1154-1169.
(60) Zieske, L. R. Journal of Experimental Botany 2006, 57, 1501-1508.
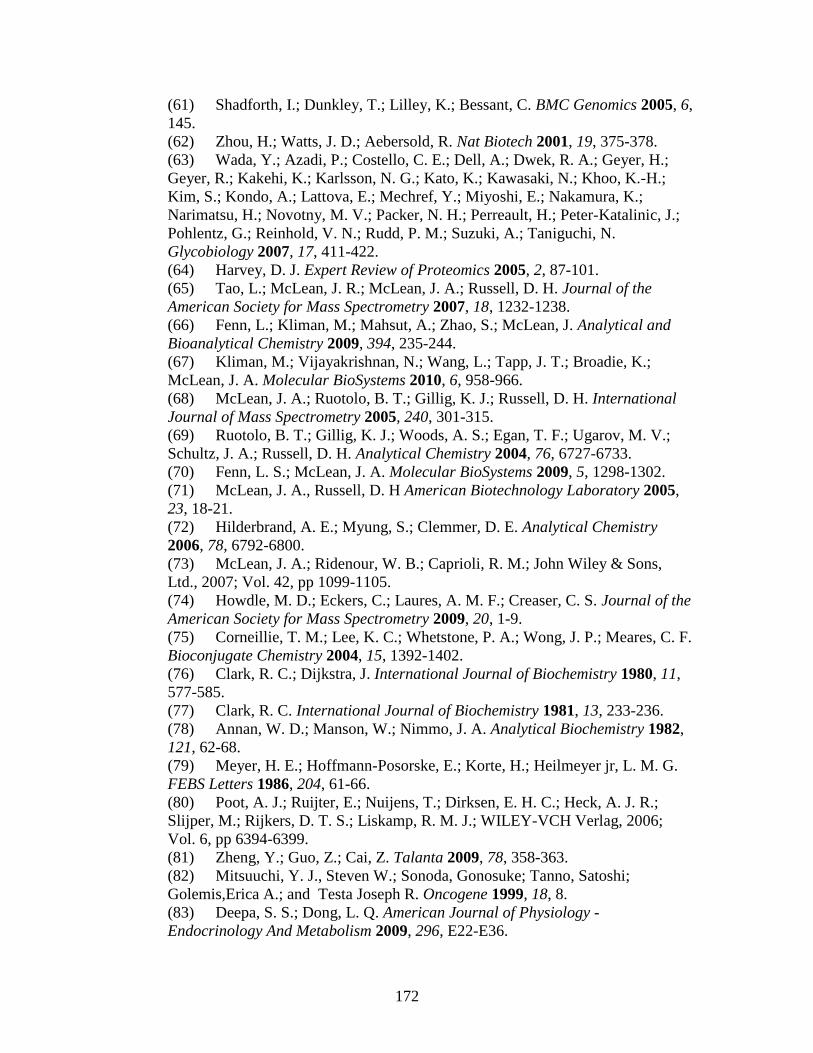
172
(61) Shadforth, I.; Dunkley, T.; Lilley, K.; Bessant, C. BMC Genomics 2005, 6,
145.
(62) Zhou, H.; Watts, J. D.; Aebersold, R. Nat Biotech 2001, 19, 375-378.
(63) Wada, Y.; Azadi, P.; Costello, C. E.; Dell, A.; Dwek, R. A.; Geyer, H.;
Geyer, R.; Kakehi, K.; Karlsson, N. G.; Kato, K.; Kawasaki, N.; Khoo, K.-H.;
Kim, S.; Kondo, A.; Lattova, E.; Mechref, Y.; Miyoshi, E.; Nakamura, K.;
Narimatsu, H.; Novotny, M. V.; Packer, N. H.; Perreault, H.; Peter-Katalinic, J.;
Pohlentz, G.; Reinhold, V. N.; Rudd, P. M.; Suzuki, A.; Taniguchi, N.
Glycobiology 2007, 17, 411-422.
(64) Harvey, D. J. Expert Review of Proteomics 2005, 2, 87-101.
(65) Tao, L.; McLean, J. R.; McLean, J. A.; Russell, D. H. Journal of the
American Society for Mass Spectrometry 2007, 18, 1232-1238.
(66) Fenn, L.; Kliman, M.; Mahsut, A.; Zhao, S.; McLean, J. Analytical and
Bioanalytical Chemistry 2009, 394, 235-244.
(67) Kliman, M.; Vijayakrishnan, N.; Wang, L.; Tapp, J. T.; Broadie, K.;
McLean, J. A. Molecular BioSystems 2010, 6, 958-966.
(68) McLean, J. A.; Ruotolo, B. T.; Gillig, K. J.; Russell, D. H. International
Journal of Mass Spectrometry 2005, 240, 301-315.
(69) Ruotolo, B. T.; Gillig, K. J.; Woods, A. S.; Egan, T. F.; Ugarov, M. V.;
Schultz, J. A.; Russell, D. H. Analytical Chemistry 2004, 76, 6727-6733.
(70) Fenn, L. S.; McLean, J. A. Molecular BioSystems 2009, 5, 1298-1302.
(71) McLean, J. A., Russell, D. H American Biotechnology Laboratory 2005,
23, 18-21.
(72) Hilderbrand, A. E.; Myung, S.; Clemmer, D. E. Analytical Chemistry
2006, 78, 6792-6800.
(73) McLean, J. A.; Ridenour, W. B.; Caprioli, R. M.; John Wiley & Sons,
Ltd., 2007; Vol. 42, pp 1099-1105.
(74) Howdle, M. D.; Eckers, C.; Laures, A. M. F.; Creaser, C. S. Journal of the
American Society for Mass Spectrometry 2009, 20, 1-9.
(75) Corneillie, T. M.; Lee, K. C.; Whetstone, P. A.; Wong, J. P.; Meares, C. F.
Bioconjugate Chemistry 2004, 15, 1392-1402.
(76) Clark, R. C.; Dijkstra, J. International Journal of Biochemistry 1980, 11,
577-585.
(77) Clark, R. C. International Journal of Biochemistry 1981, 13, 233-236.
(78) Annan, W. D.; Manson, W.; Nimmo, J. A. Analytical Biochemistry 1982,
121, 62-68.
(79) Meyer, H. E.; Hoffmann-Posorske, E.; Korte, H.; Heilmeyer jr, L. M. G.
FEBS Letters 1986, 204, 61-66.
(80) Poot, A. J.; Ruijter, E.; Nuijens, T.; Dirksen, E. H. C.; Heck, A. J. R.;
Slijper, M.; Rijkers, D. T. S.; Liskamp, R. M. J.; WILEY-VCH Verlag, 2006;
Vol. 6, pp 6394-6399.
(81) Zheng, Y.; Guo, Z.; Cai, Z. Talanta 2009, 78, 358-363.
(82) Mitsuuchi, Y. J., Steven W.; Sonoda, Gonosuke; Tanno, Satoshi;
Golemis,Erica A.; and Testa Joseph R. Oncogene 1999, 18, 8.
(83) Deepa, S. S.; Dong, L. Q. American Journal of Physiology -
Endocrinology And Metabolism 2009, 296, E22-E36.
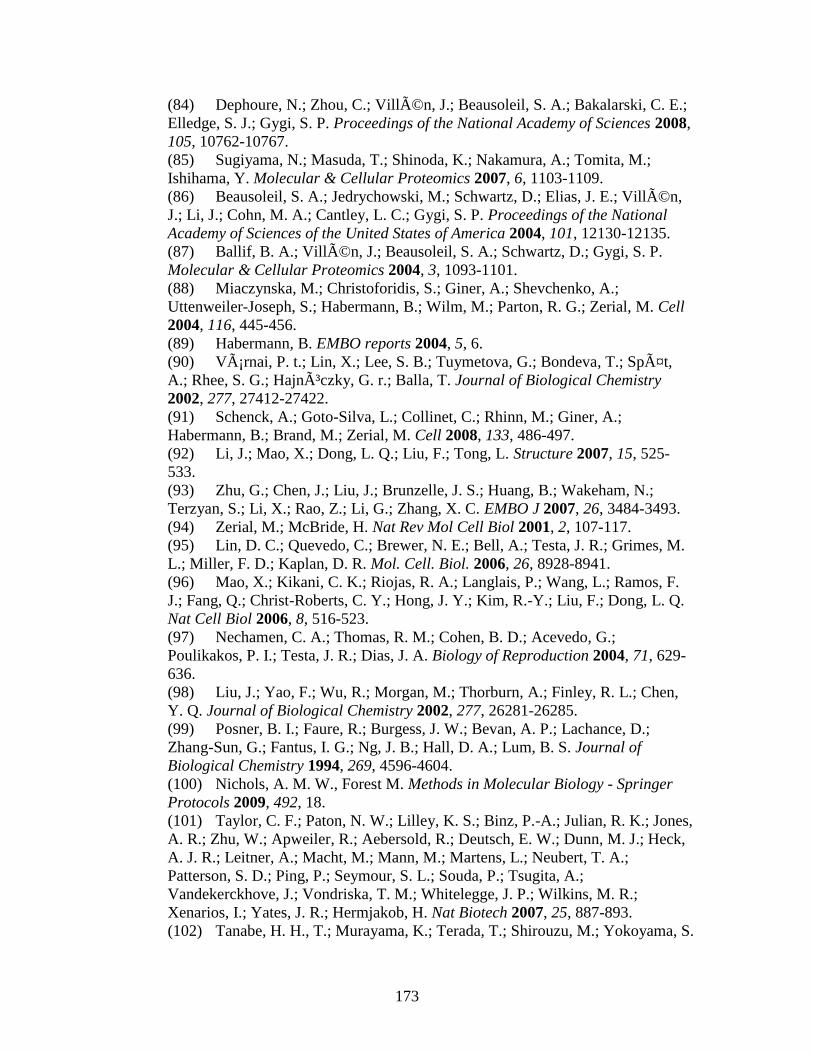
173
(84) Dephoure, N.; Zhou, C.; Villén, J.; Beausoleil, S. A.; Bakalarski, C. E.;
Elledge, S. J.; Gygi, S. P. Proceedings of the National Academy of Sciences 2008,
105, 10762-10767.
(85) Sugiyama, N.; Masuda, T.; Shinoda, K.; Nakamura, A.; Tomita, M.;
Ishihama, Y. Molecular & Cellular Proteomics 2007, 6, 1103-1109.
(86) Beausoleil, S. A.; Jedrychowski, M.; Schwartz, D.; Elias, J. E.; Villén,
J.; Li, J.; Cohn, M. A.; Cantley, L. C.; Gygi, S. P. Proceedings of the National
Academy of Sciences of the United States of America 2004, 101, 12130-12135.
(87) Ballif, B. A.; Villén, J.; Beausoleil, S. A.; Schwartz, D.; Gygi, S. P.
Molecular & Cellular Proteomics 2004, 3, 1093-1101.
(88) Miaczynska, M.; Christoforidis, S.; Giner, A.; Shevchenko, A.;
Uttenweiler-Joseph, S.; Habermann, B.; Wilm, M.; Parton, R. G.; Zerial, M. Cell
2004, 116, 445-456.
(89) Habermann, B. EMBO reports 2004, 5, 6.
(90) Várnai, P. t.; Lin, X.; Lee, S. B.; Tuymetova, G.; Bondeva, T.; Spät,
A.; Rhee, S. G.; Hajnóczky, G. r.; Balla, T. Journal of Biological Chemistry
2002, 277, 27412-27422.
(91) Schenck, A.; Goto-Silva, L.; Collinet, C.; Rhinn, M.; Giner, A.;
Habermann, B.; Brand, M.; Zerial, M. Cell 2008, 133, 486-497.
(92) Li, J.; Mao, X.; Dong, L. Q.; Liu, F.; Tong, L. Structure 2007, 15, 525-
533.
(93) Zhu, G.; Chen, J.; Liu, J.; Brunzelle, J. S.; Huang, B.; Wakeham, N.;
Terzyan, S.; Li, X.; Rao, Z.; Li, G.; Zhang, X. C. EMBO J 2007, 26, 3484-3493.
(94) Zerial, M.; McBride, H. Nat Rev Mol Cell Biol 2001, 2, 107-117.
(95) Lin, D. C.; Quevedo, C.; Brewer, N. E.; Bell, A.; Testa, J. R.; Grimes, M.
L.; Miller, F. D.; Kaplan, D. R. Mol. Cell. Biol. 2006, 26, 8928-8941.
(96) Mao, X.; Kikani, C. K.; Riojas, R. A.; Langlais, P.; Wang, L.; Ramos, F.
J.; Fang, Q.; Christ-Roberts, C. Y.; Hong, J. Y.; Kim, R.-Y.; Liu, F.; Dong, L. Q.
Nat Cell Biol 2006, 8, 516-523.
(97) Nechamen, C. A.; Thomas, R. M.; Cohen, B. D.; Acevedo, G.;
Poulikakos, P. I.; Testa, J. R.; Dias, J. A. Biology of Reproduction 2004, 71, 629-
636.
(98) Liu, J.; Yao, F.; Wu, R.; Morgan, M.; Thorburn, A.; Finley, R. L.; Chen,
Y. Q. Journal of Biological Chemistry 2002, 277, 26281-26285.
(99) Posner, B. I.; Faure, R.; Burgess, J. W.; Bevan, A. P.; Lachance, D.;
Zhang-Sun, G.; Fantus, I. G.; Ng, J. B.; Hall, D. A.; Lum, B. S. Journal of
Biological Chemistry 1994, 269, 4596-4604.
(100) Nichols, A. M. W., Forest M. Methods in Molecular Biology - Springer
Protocols 2009, 492, 18.
(101) Taylor, C. F.; Paton, N. W.; Lilley, K. S.; Binz, P.-A.; Julian, R. K.; Jones,
A. R.; Zhu, W.; Apweiler, R.; Aebersold, R.; Deutsch, E. W.; Dunn, M. J.; Heck,
A. J. R.; Leitner, A.; Macht, M.; Mann, M.; Martens, L.; Neubert, T. A.;
Patterson, S. D.; Ping, P.; Seymour, S. L.; Souda, P.; Tsugita, A.;
Vandekerckhove, J.; Vondriska, T. M.; Whitelegge, J. P.; Wilkins, M. R.;
Xenarios, I.; Yates, J. R.; Hermjakob, H. Nat Biotech 2007, 25, 887-893.
(102) Tanabe, H. H., T.; Murayama, K.; Terada, T.; Shirouzu, M.; Yokoyama, S.
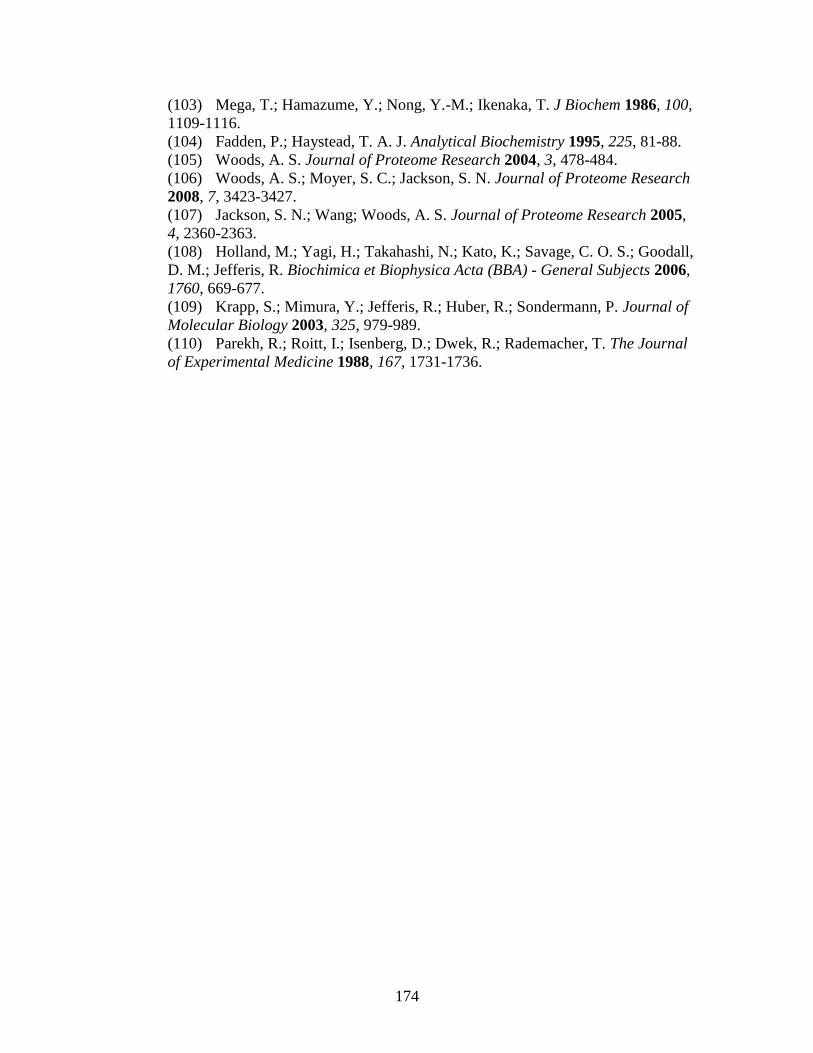
174
(103) Mega, T.; Hamazume, Y.; Nong, Y.-M.; Ikenaka, T. J Biochem 1986, 100,
1109-1116.
(104) Fadden, P.; Haystead, T. A. J. Analytical Biochemistry 1995, 225, 81-88.
(105) Woods, A. S. Journal of Proteome Research 2004, 3, 478-484.
(106) Woods, A. S.; Moyer, S. C.; Jackson, S. N. Journal of Proteome Research
2008, 7, 3423-3427.
(107) Jackson, S. N.; Wang; Woods, A. S. Journal of Proteome Research 2005,
4, 2360-2363.
(108) Holland, M.; Yagi, H.; Takahashi, N.; Kato, K.; Savage, C. O. S.; Goodall,
D. M.; Jefferis, R. Biochimica et Biophysica Acta (BBA) - General Subjects 2006,
1760, 669-677.
(109) Krapp, S.; Mimura, Y.; Jefferis, R.; Huber, R.; Sondermann, P. Journal of
Molecular Biology 2003, 325, 979-989.
(110) Parekh, R.; Roitt, I.; Isenberg, D.; Dwek, R.; Rademacher, T. The Journal
of Experimental Medicine 1988, 167, 1731-1736.
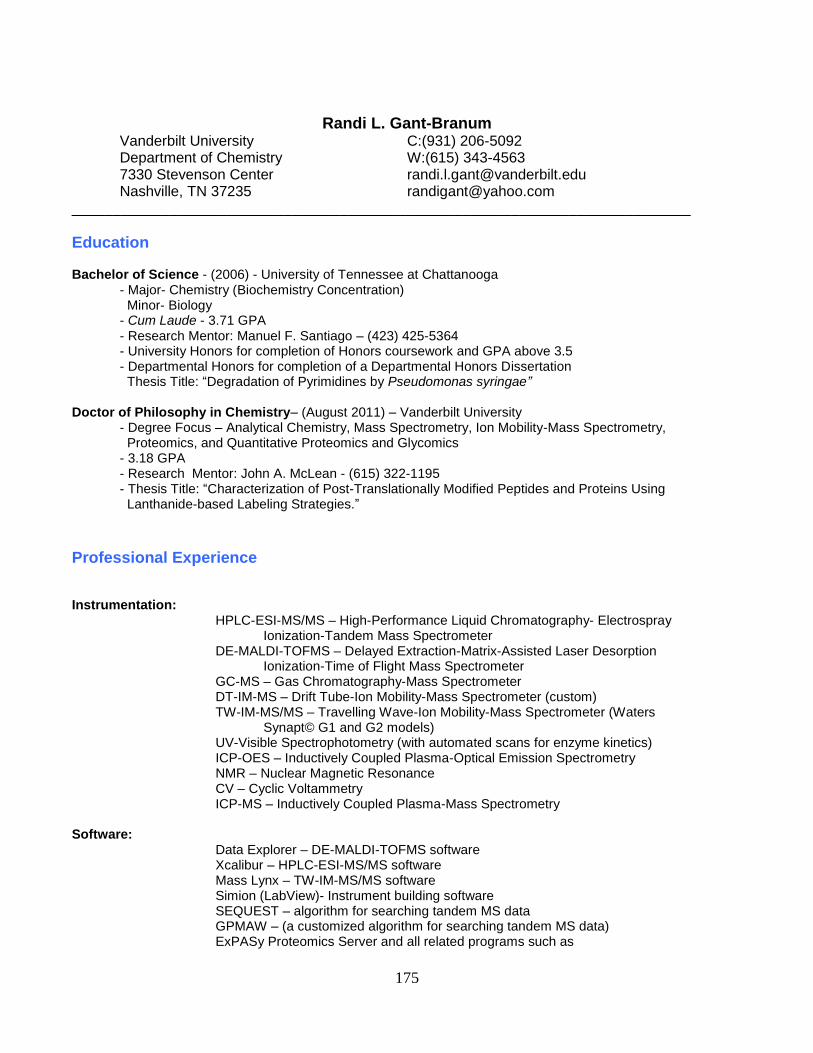
175
Randi L. Gant-Branum
Vanderbilt University C:(931) 206-5092 Department of Chemistry W:(615) 343-4563 7330 Stevenson Center [email protected] Nashville, TN 37235 [email protected]
____________________________________________________________________________
Education Bachelor of Science - (2006) - University of Tennessee at Chattanooga - Major- Chemistry (Biochemistry Concentration) Minor- Biology
- Cum Laude - 3.71 GPA - Research Mentor: Manuel F. Santiago – (423) 425-5364 - University Honors for completion of Honors coursework and GPA above 3.5 - Departmental Honors for completion of a Departmental Honors Dissertation
Thesis Title: “Degradation of Pyrimidines by Pseudomonas syringae” Doctor of Philosophy in Chemistry– (August 2011) – Vanderbilt University
- Degree Focus – Analytical Chemistry, Mass Spectrometry, Ion Mobility-Mass Spectrometry, Proteomics, and Quantitative Proteomics and Glycomics - 3.18 GPA - Research Mentor: John A. McLean - (615) 322-1195 - Thesis Title: “Characterization of Post-Translationally Modified Peptides and Proteins Using Lanthanide-based Labeling Strategies.”
Professional Experience
Instrumentation: HPLC-ESI-MS/MS – High-Performance Liquid Chromatography- Electrospray
Ionization-Tandem Mass Spectrometer DE-MALDI-TOFMS – Delayed Extraction-Matrix-Assisted Laser Desorption
Ionization-Time of Flight Mass Spectrometer GC-MS – Gas Chromatography-Mass Spectrometer DT-IM-MS – Drift Tube-Ion Mobility-Mass Spectrometer (custom) TW-IM-MS/MS – Travelling Wave-Ion Mobility-Mass Spectrometer (Waters
Synapt© G1 and G2 models) UV-Visible Spectrophotometry (with automated scans for enzyme kinetics) ICP-OES – Inductively Coupled Plasma-Optical Emission Spectrometry NMR – Nuclear Magnetic Resonance CV – Cyclic Voltammetry ICP-MS – Inductively Coupled Plasma-Mass Spectrometry
Software:
Data Explorer – DE-MALDI-TOFMS software Xcalibur – HPLC-ESI-MS/MS software Mass Lynx – TW-IM-MS/MS software Simion (LabView)- Instrument building software SEQUEST – algorithm for searching tandem MS data GPMAW – (a customized algorithm for searching tandem MS data) ExPASy Proteomics Server and all related programs such as
176
Peptide Mass, Protein Prospector, Mascot, BLAST, GlycoMod, and GlycanMass.
P-mod - (a customized algorithm for searching tandem MS data) ExPASy Proteomics Server Adobe Professional EndNote CorelDraw ChemDraw Microsoft Word, Outlook, Powerpoint, Excel
Grant Writing:
NIH-RO1 Grants NIH-R21 Grants Independent Research Proposal – Prepared and presented an original NIH
Research proposal unrelated to the graduate mentor’s field as required by the Vanderbilt Chemistry PhD program.
Training:
Lab Safety and Fire Safety Training Course (VU Chemistry) Responsible Conduct of Research though the Collaborative Institutional Training
Initiative and the NIH.
- Also possesses experience in critical peer review of scientific journals, undergraduate and graduate mentoring, and purchasing.
Publications
Vanderbilt (Chronological Order) R. L. Gant-Branum, T. J. Kerr, and J. A. McLean. Labeling Strategies in Mass Spectrometry-Based Protein Quantitation. Analyst. 2009, 134, 1525 – 1530. R. L. Gant-Branum, J. A. Broussard, D. J. Webb, and J. A. McLean. Identification of Phosphorylation Sites within the Signaling Adaptor APPL1 by Mass Spectrometry. Journal of Proteome Research, 2010, 9 (3), 1541–1548 R. L. Gant-Branum, T. J. Kerr, and J. A. McLean. Phosphoproteomic Selection, Relative Quantitation, and Localization using Phosphopeptide Element-Coded Affinity Tagging (PhECAT). Submitted to Analytical Chemistry. 2011. T. J. Kerr, R. L. Gant-Branum, and J. A. McLean. Multiplexed Relative Quantitation of Peptide Functionality Using Lanthanide-based Structural Shift Reagents. International Journal of Mass Spectrometry. in press. 2011. R. L. Gant-Branum and J. A. McLean. Targeted Selection of Glycoproteins and Phosphoproteins Using Mobility Shift Strategies and Ion Mobility-Mass Spectrometry. In preparation.
University of Tennessee at Chattanooga (Chronological Order) E. B. Burnette, R. L. Gant, G. M. Meyer, and M. F. Santiago. Regulation of Pyrimidine Catabolism in Pseudomonas lemonnieri ATCC 12983. Journal of Undergraduate Chemistry Research. 2006, 5, 9-13. R. L. Gant, M. L. Hacker, G. M. Meyer, and M. F. Santiago. Degradation of Pyrimidines by Pseudomonas syringae. Research Journal of Microbiology. 2007, 2(11), 851-855.
177
Presentations (Primary Presenter) Vanderbilt (Chronological Order) Phosphoproteomic Tagging Strategies for Ion Mobility-Mass Spectrometry. R. L. Gant, T. J. Kerr, and J. A. McLean. Presented at the annual meeting of the Tennessee Academy of Sciences (TAS), 2007 in Nashville, TN.
Structural Separation of Phosphorylated Peptides Using Chemical Derivatization and Ion-Mobility Mass Spectrometry. R. L. Gant, T. J. Kerr, and J. A. McLean. Presented at the annual Vanderbilt Institute for Chemical Biology (VICB) retreat, 2008 in Florence, AL. Phosphoproteomics using selective derivatization and structural separations by ion mobility-mass spectrometry. R. L. Gant, T. J. Kerr, and J. A. McLean. Presented at the annual meeting of the American Society for Mass Spectrometry (ASMS), 2008 in Denver, CO. Phosphoproteomic Mapping with Two-dimensional Structural Separations by Ion Mobility-Mass Spectrometry. R. L. Gant and J. A. McLean. Presented at the annual meeting of the Federation of Analytical Chemistry and Spectroscopy Societies (FACSS) meeting, 2008 in Reno, NV. Multiplexed Quantitiative Phosphoproteomics using a Lanthanide Based Tagging Strategy with MALDI-TOFMS. R. L. Gant and J. A. McLean. Presented at the South Eastern Regional Meeting of the American Chemical Society (SERMACS), 2009 in Nashville, TN. Identification of protein phosphorylation sites of human APPL1 using MS, MS/MS, and IM-MS. R. L. Gant-Branum and J. A. McLean. Presented at the annual meeting of the American Society for Mass Spectrometry (ASMS), 2009 in Philadelphia, PA.
Quantitative Proteomic Strategies using Ion Mobility Shift Labels. R. L. Gant-Branum, T. J. Kerr, J. A. McLean. Invited talk at the annual meeting of the Federation of Analytical Chemistry and Spectroscopy Societies (FACSS) meeting, 2009 in Louisville, KY. University of Tennessee at Chattanooga (Chronological Order) Degradation of Pyrimidines by Pseudomonas syringae. R. L. Gant, G. M. Meyer, and M. F. Santiago. Presented at the 56th Southeast Regional Meeting of the American Chemical Society, 2004 in Research Triangle Park, NC. Pyridine Nucleotide Transhydrogenase Activity in Pseudomonas syringe. R. L. Gant, M. F. Santiago. Abstracts of Papers, 61
st Southwest and the 57
th Southeast Joint Regional Meeting of the ACS, 2005 in
Memphis, TN. Reducing Agent of Dihydropyrimidine Dehydrogenase. R. L. Gant, G. M. Meyer, and M. F. Santiago. Presented at the 229th American Chemical Society National Meeting, 2005 in San Diego, CA. Reductive pathway of penicillin-resistant Pseudomonas syringae. R. L. Gant, S. Prince, M. F. Santiago, G. M. Meyer. 229th American Chemical Society National Meeting, 2005. in San Diego, CA.
Professional Organizations and Societies American Chemical Society Student Affiliates, UTC Chapter (2003-2006) – Vice President American Chemical Society American Society for Mass Spectrometry Federation of Analytical Chemistry and Spectroscopy Societies

178
Tennessee Academy of Sciences