Embed Size (px)
Citation preview
Characterization of PM2.5 Episodes in the Wintertime San Joaquin Valley using Surface and Aircraft Observations
Chris Cappa UC Davis
Dept. of Civil & Environmental Engineering
California Air Resources Board 27 November 2018
UCDAVIS CIVIL AND ENVIRONMENTAL ENGINEERING & AQRC
1
UCDAVIS
CALIFORNIA AIR RESOURCES BOARD
Acknowledgements Qi Zhang Prof. Qi Zhang (co-PI)
Dr. Gouri Prabhakar Dr. Dominique (Nicky) Young Dr. Caroline Parworth, Dr. Xiaolu Zhang, Dr. Hwajin Kim, Dr. Sonya Collier Gouri Prabhakar Caroline Parworth Hwajin Kim Dr. Sally Pusede (Univ. Virginia) The entire DISCOVER-AQ Team (NASA)
This work supported by ARB
Nicky Young Xiaolu Zhang Sonya Collier Project #14-307
Disclaimer: The statements and conclusions in this report are those of the contractor and not necessarily those of the California Air Resources Board. The mention of commercial products, their source, or their use in connection with material reported herein is not to be construed as actual or implied endorsement of such products. 2
Publications Resulting from this Work
*Prabhakar, G., Parworth, C., Zhang, X., Kim, H., Young, D. E., Beyersdorf, A. J., Ziemba, L. D., Nowak, J. B., Bertram, T. H., Faloona, I. C., Zhang, Q., and Cappa, C. D.: Observational assessment of the role of nocturnal residual-layer chemistry in determining daytime surface particulate nitrate concentrations, Atmos. Chem. Phys., 17, 14,747-714,770, 10.5194/acp-17-14747-2017, 2017.
Pusede, S. E., Duffey, K. C., Shusterman, A. A., Saleh, A., Laughner, J. L., Wooldridge, P. J., Zhang, Q., Parworth, C. L., Kim, H., Capps, S. L., Valin, L. C., Cappa, C. D., Fried, A., Walega, J., Nowak, J. B., Weinheimer, A. J., Hoff, R. M., Berkoff, T. A., Beyersdorf, A. J., Olson, J., Crawford, J. H., and Cohen, R. C.: On the effectiveness of nitrogen oxide reductions as a control over ammonium nitrate aerosol, Atmos. Chem. Phys., 16, 2575-2596, 10.5194/acp-16-2575-2016, 2016.
*Young, D. E., Kim, H., Parworth, C., Zhou, S., Zhang, X., Cappa, C. D., Seco, R., Kim, S., and Zhang, Q.: Influences of emission sources and meteorology on aerosol chemistry in a polluted urban environment: results from DISCOVER-AQ California, Atmos. Chem. Phys., 16, 5427-5451, 10.5194/acp-16-5427-2016, 2016.
UCDAYIS CIVIL AND ENVIRONMENTAL ENGINEERING & AQRC
3
80
-('( 60 E C) :::L --LO
c--J
~ 40 a_
20
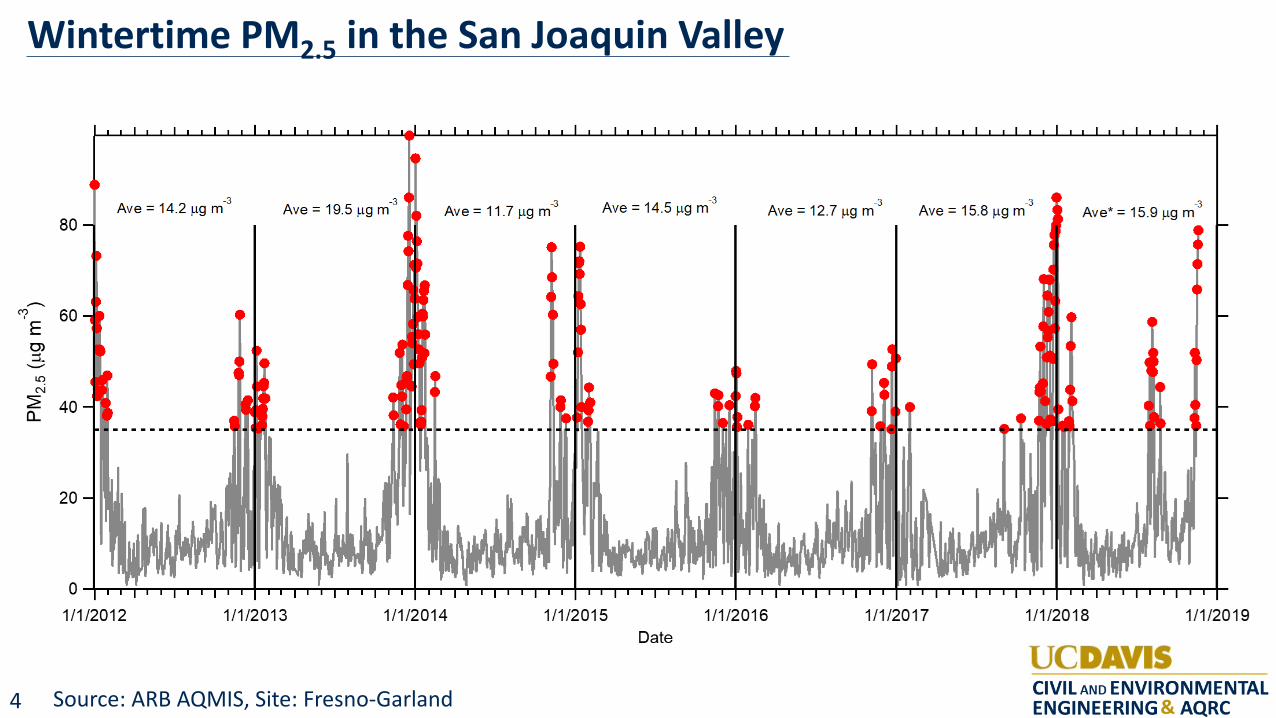
-3 Ave= 14.2 µgm
-3 Ave= 19.5 µgm -3
Ave= 11 .7 µgm -3
Ave= 14.5 µgm -3 Ave= 12.7 µg m
-3 Ave= 15.8 µgm
-3 Ave* = 15.9 µgm
0 - ........................................................ ....-........................................................ ......-+.........-................... --............................................... ........, ................... ........, ......... --.........., ................... ........, ................... - ........................................................ ....-....................................................... .....-
1/1/2012 1/1/2013 1/1/2014 1/1/2015 1/1/2016 Date
1/1/20 17 1/1/201 8 1/1/201 9
UCDAYIS CIVIL AND ENVIRONMENTAL ENGINEERING & AQRC
Wintertime PM2.5 in the San Joaquin Valley
Source: ARB AQMIS, Site: Fresno-Garland 4
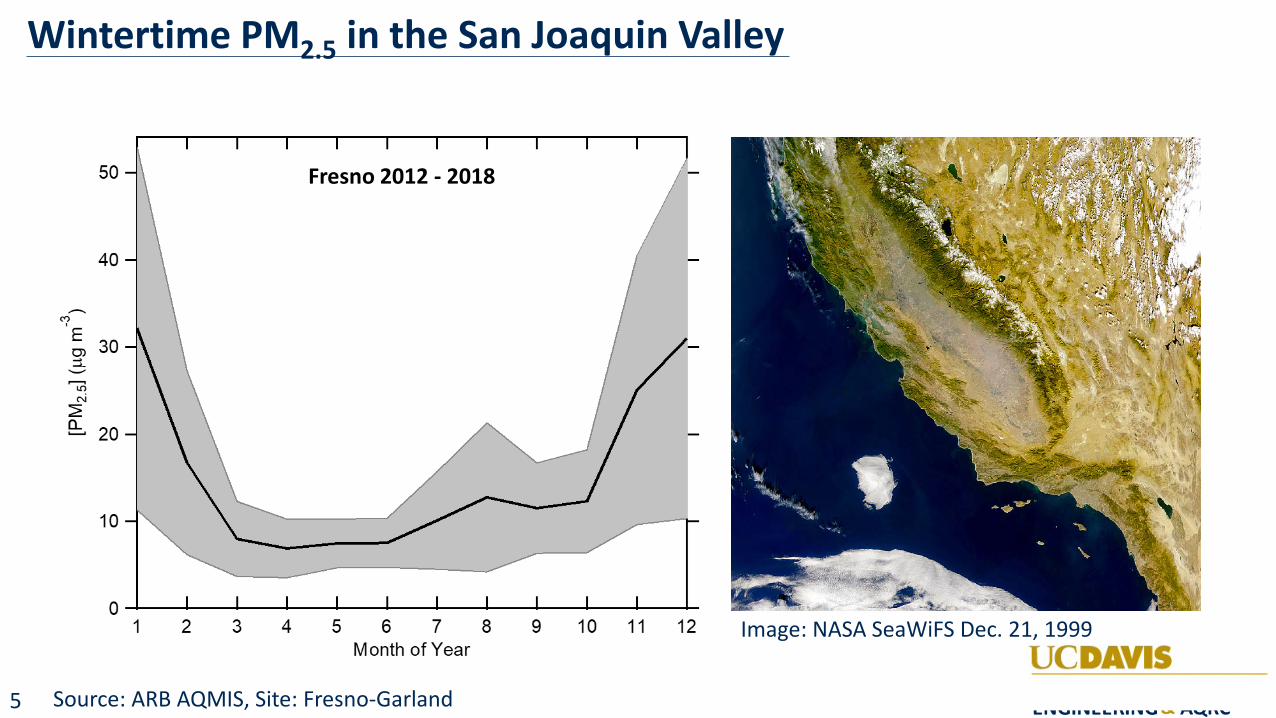
Wintertime PM2.5 in the San Joaquin Valley
Fresno 2012 - 2018
Image: NASA SeaWiFS Dec. 21, 1999
Source: ARB AQMIS, Site: Fresno-Garland
...-... <?
E 30 C) .....
...I.. ..__.,
~ N ~ a.. 20
1 2 3 4 5 6 7 Month of Year
8 9 10 11 12
UCDAYIS CIVIL AND ENVIRONMENTAL ENGINEERING & AQRC 5
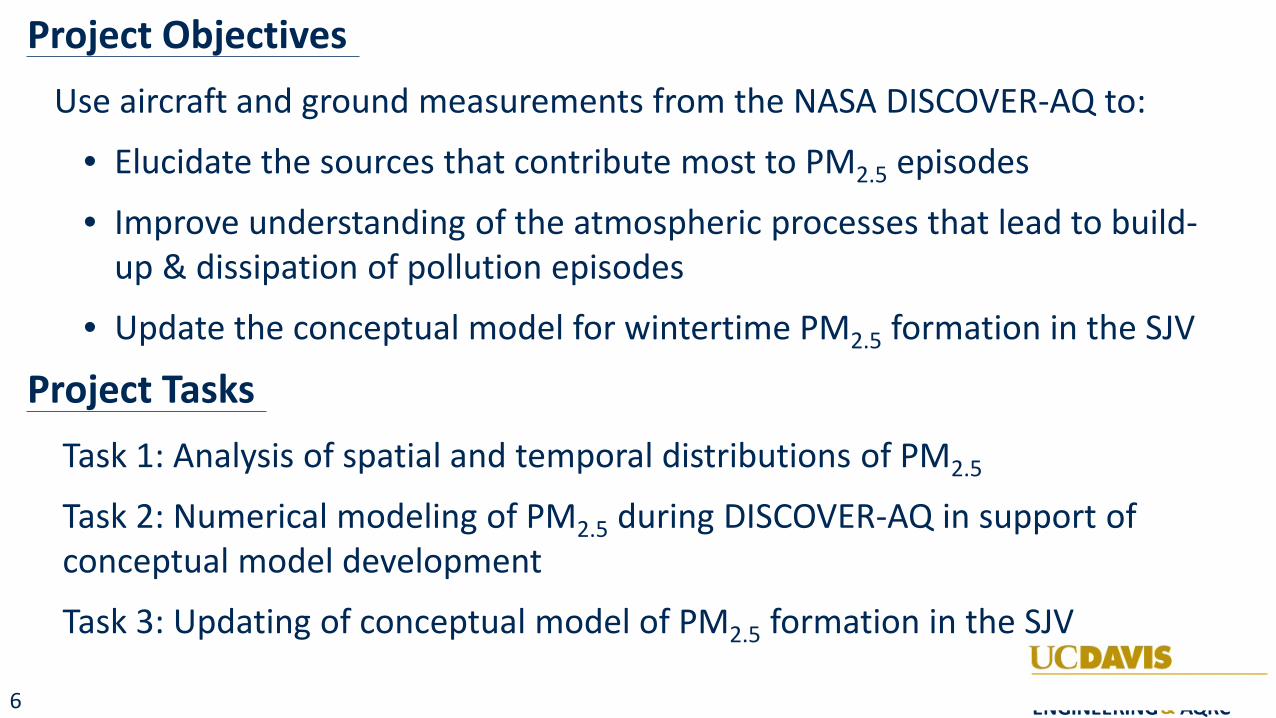
Project Objectives Use aircraft and ground measurements from the NASA DISCOVER-AQ to:
• Elucidate the sources that contribute most to PM2.5 episodes
• Improve understanding of the atmospheric processes that lead to build-up & dissipation of pollution episodes
• Update the conceptual model for wintertime PM2.5 formation in the SJV
Project Tasks Task 1: Analysis of spatial and temporal distributions of PM2.5
Task 2: Numerical modeling of PM2.5 during DISCOVER-AQ in support of conceptual model development
Task 3: Updating of conceptual model of PM2.5 formation in the SJV UCDAYIS CIVIL AND ENVIRONMENTAL ENGINEERING & AQRC
6
42
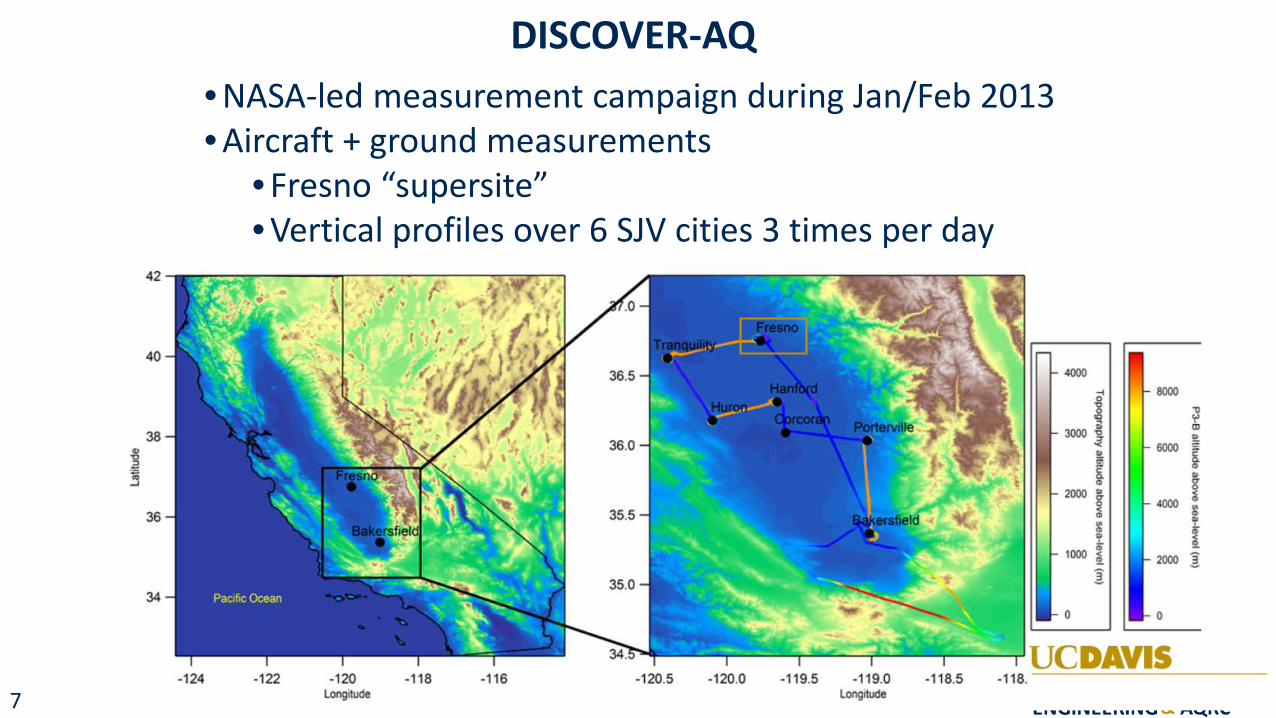
DISCOVER-AQ • NASA-led measurement campaign during Jan/Feb 2013 • Aircraft + ground measurements
• Fresno “supersite” • Vertical profiles over 6 SJV cities 3 times per day
40
38 a,
] ii ...J
36
34
-124 -122 -120 long11:u<1e
-118 -116 -120.5 -120.0 -119.5 -119.0 Longitude
4000
8000 ,, ~ co ~
6000 t 0
8' 4000 II'
!
' !!.
- 2000 3 1
0 0
-1 18.5 -118.0 \ITAL
7
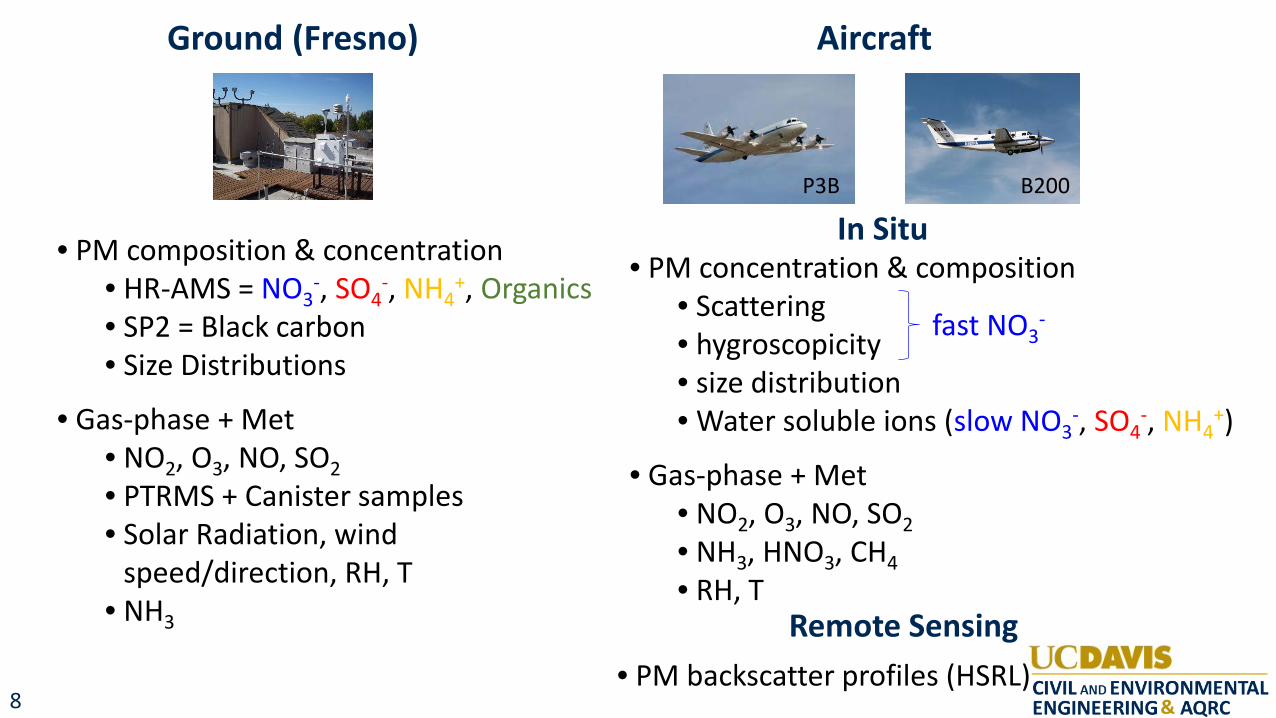
Ground (Fresno) Aircraft
P3B B200
In Situ • PM composition & concentration • PM concentration & composition • HR-AMS = NO3-, SO4
-, NH4+, Organics • Scattering • SP2 = Black carbon fast NO3• hygroscopicity
-
• Size Distributions • size distribution • Gas-phase + Met • Water soluble ions (slow NO3 , SO4 , NH4
+) • NO2, O3, NO, SO2 • Gas-phase + Met • PTRMS + Canister samples • NO2, O3, NO, SO2• Solar Radiation, wind • NH3, HNO3, CH4speed/direction, RH, T • RH, T • NH3 Remote Sensing
• PM backscatter profiles (HSRL)
}
UCDAYIS CIVIL AND ENVIRONMENTAL ENGINEERING & AQRC
- -
8
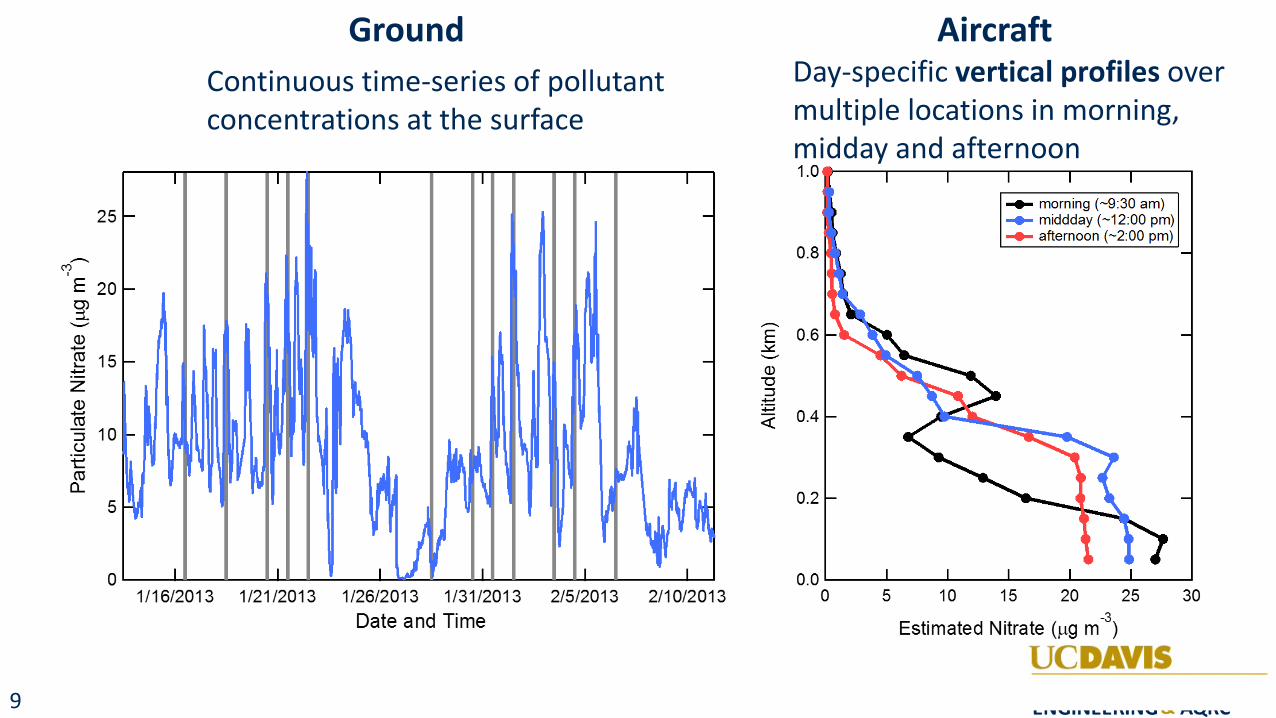
Ground Aircraft Day-specific vertical profiles over Continuous time-series of pollutant multiple locations in morning, concentrations at the surface midday and afternoon
I I I I I I
25 - -
---(") I
E 20 - -~ ---Q) ..... co 15 I.... - -..... z Q) ~ ..... co ::J 10 (.)
t:: co a..
5
0
- ~ ~DI ~ -
' ~ ,
- ' 1111
ii~~ - ~
j I I I I I I I
1/16/2013 1/21/2013 1/26/2013 1/31/2013 2/5/2013 2/10/2013
Date and Ti me
-.. E ~ -Q) "'C ::J
:'!:: ..... <(
1. 0 ---------..-------------------,
- morning ( ~9:30 am) - middday ( ~12:00 pm) - afternoon (~2:00 pm)
0.8
0.6
0.4
0.2
0.0 ---------------0 5 10 15 20 25 30
Estimated Nitrate (µg m-3)
UCDAYIS CIVIL AND ENVIRONMENTAL ENGINEERING & AQRC
9
Part I: Composition and variability of surface particulate matter
UCDAYIS CIVIL AND ENVIRONMENTAL ENGINEERING & AQRC
10
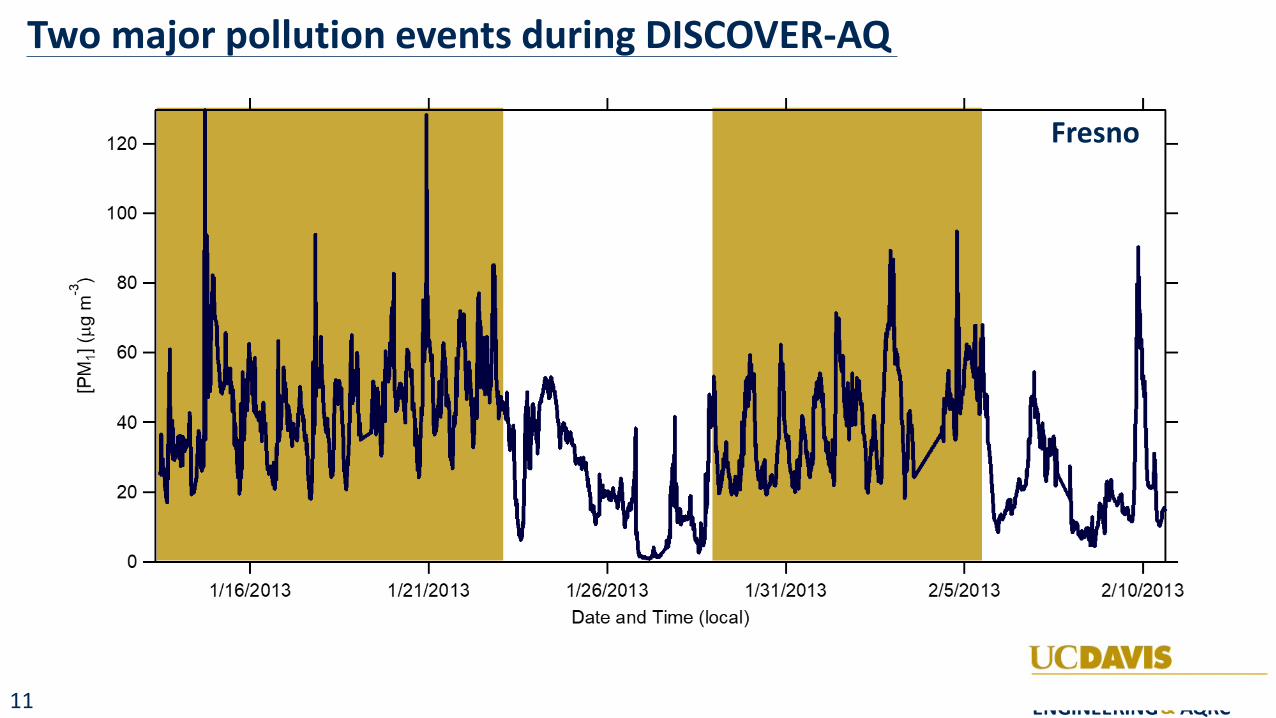
Two major pollution events during DISCOVER-AQ
Fresno 120
100
- 80 C") I
E 0) :::l ---,--, 60 ..---
~ a.. ..........
40
20
1/1 6/2013 1/21/2013 1/26/2013 1/31/2013
Date and Time (local)
2/5/2013 2/1 0/2013
UCDAYIS CIVIL AND ENVIRONMENTAL ENGINEERING & AQRC
11
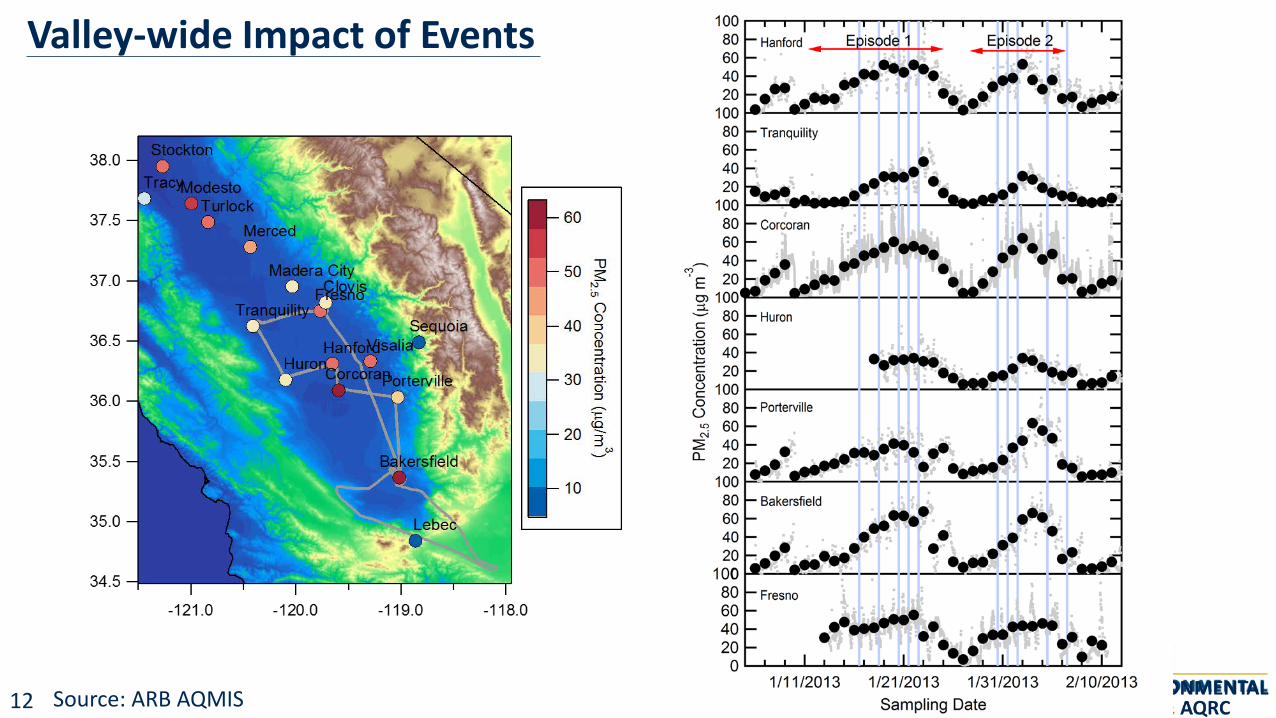
Valley-wide Impact of Events
37.5 60
50 -0 ~ 37.0 N
(J1
()
40 0 ::, (")
36.5 ro ::, ,-+, -,
30 ll) ,-+,
6" 36.0 ::,
..--.. 1= (0
20 -3 "" 35.5
........
10
35.0
-121.0 -120.0 -119.0 -118.0
100........,,..........---,----r---r---r--.--.--.----.--.-r--,r"T-r--r-r-r7 80 60 40 20
Hanford ,. Episode 1 ., ,. Episode 2., ... ,-.... -• •
100-------- •••• ·---•---80 Tranqui lity •
60 e\ 40 .... .. ·
1 ~~ ~=-2.4 ... _C.. e lft:~ 80 Corcoran 60 = .. · _ ...... ·• •
,_ 40 e 7 ~ '
E 20 •-• __ _ 0) 1009Z----c---_ 2: 80 § 60 ;; ~ 40
+-'
C 20 Q)
Huron
g 100 1--------0 80 u
Lr) 60 N ~ 40 a.. 20
100 80 60 40 20
100
Porterville
Bakersfield
80 • Fresno i
~~ .. _...._. ...... ~ 20 • ••••
0 L...JL......J---1----1.....J...-L.-L.....L.-..&...-..L......:~L......1'---I. _________ _
1/11 /2013 1/21/2013 1/31/2013 2/10/2013
Sampling Date >NMENTAL .AQRC
Source: ARB AQMIS 12
37° N (a) Fresno
\ 36° N
Bakersfield 35 ° N .___ _ ____.__ __ .....___ _ ____.______.
120° w 119° w
10 12 14 16 18 N03(g+p) (µ g m- 3)
37° N (b)
\ 36° N
35° N .___ _ ____._ __ ___.___ __ ..________. 120° w 119° w
5 10 15 NOX (ppb)
37° N (c)
36° N
35° N .___ _ _____.__ __ __.___ _ ____.____, 120° w 11 9° w
20 40 60 80 100 NH 3 (ppb)
UCDAYIS CIVIL AND ENVIRONMENTAL ENGINEERING & AQRC
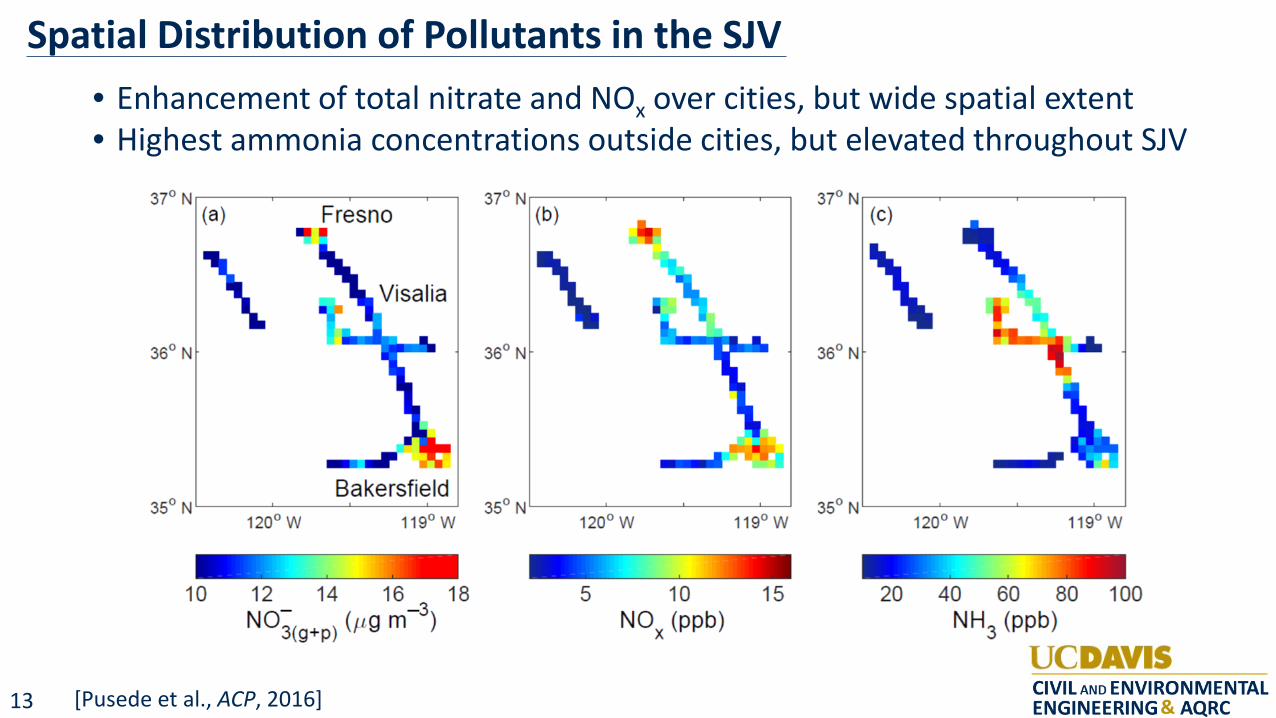
Spatial Distribution of Pollutants in the SJV • Enhancement of total nitrate and NOx over cities, but wide spatial extent • Highest ammonia concentrations outside cities, but elevated throughout SJV
[Pusede et al., ACP, 2016] 13
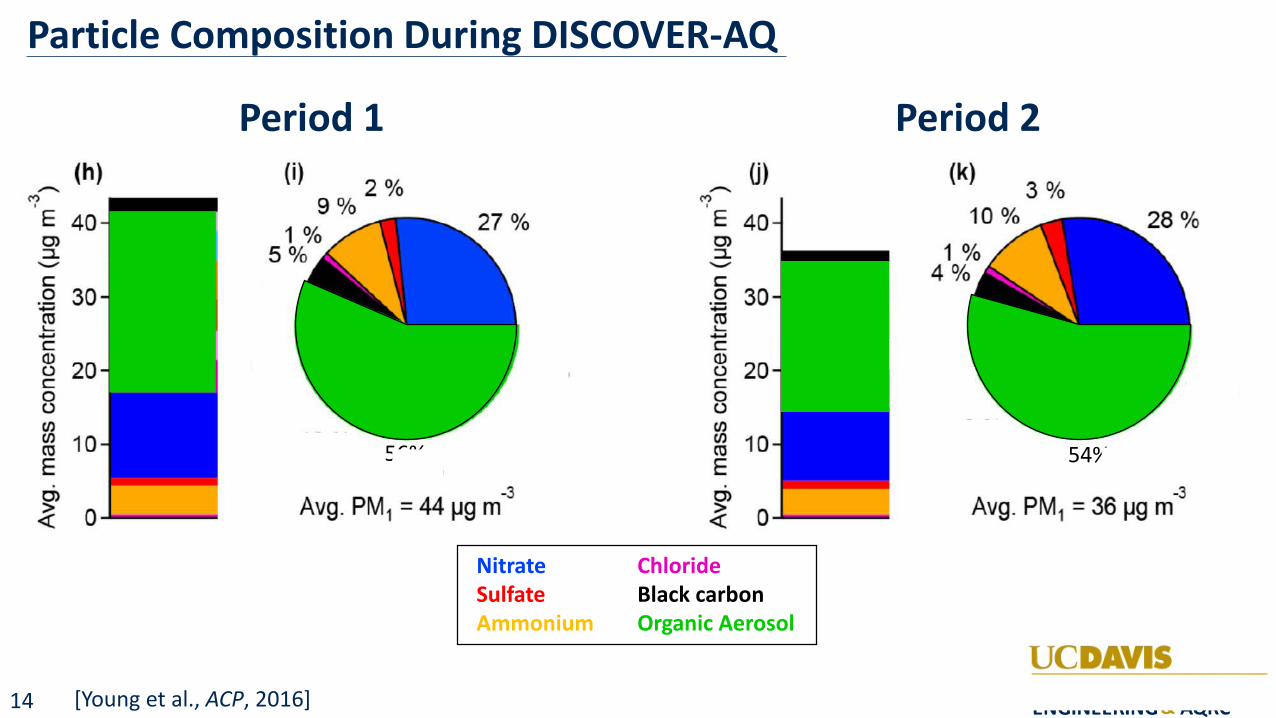
Particle Composition During DISCOVER-AQ
Period 1 Period 2
56% 54%
Nitrate Chloride Sulfate Black carbon Ammonium Organic Aerosol
[Young et al., ACP, 2016]
(h) (i) 2% -C"')
9% I
E 40 O> 1% :i 5% -C: 0 30 :.::; ro I,....
.6,,,,1
C: Q)
20 0 C: 0 0 (/) (/) 10 ctJ E 0)
Avg. PM 1 = 44 µg m > 0 <(
U) -C"') I
E 40 O> :i -C: 0 30 ~ ro I,....
.6,,,,1
C: Q)
20 0 C 0 0 (/) (/) 10 ro E
-3 C) > 0 <(
(k) 3%
10 %
Avg. PM1 = 36 µg m -3
UCDAYIS CIVIL AND ENVIRONMENTAL ENGINEERING & AQRC
14
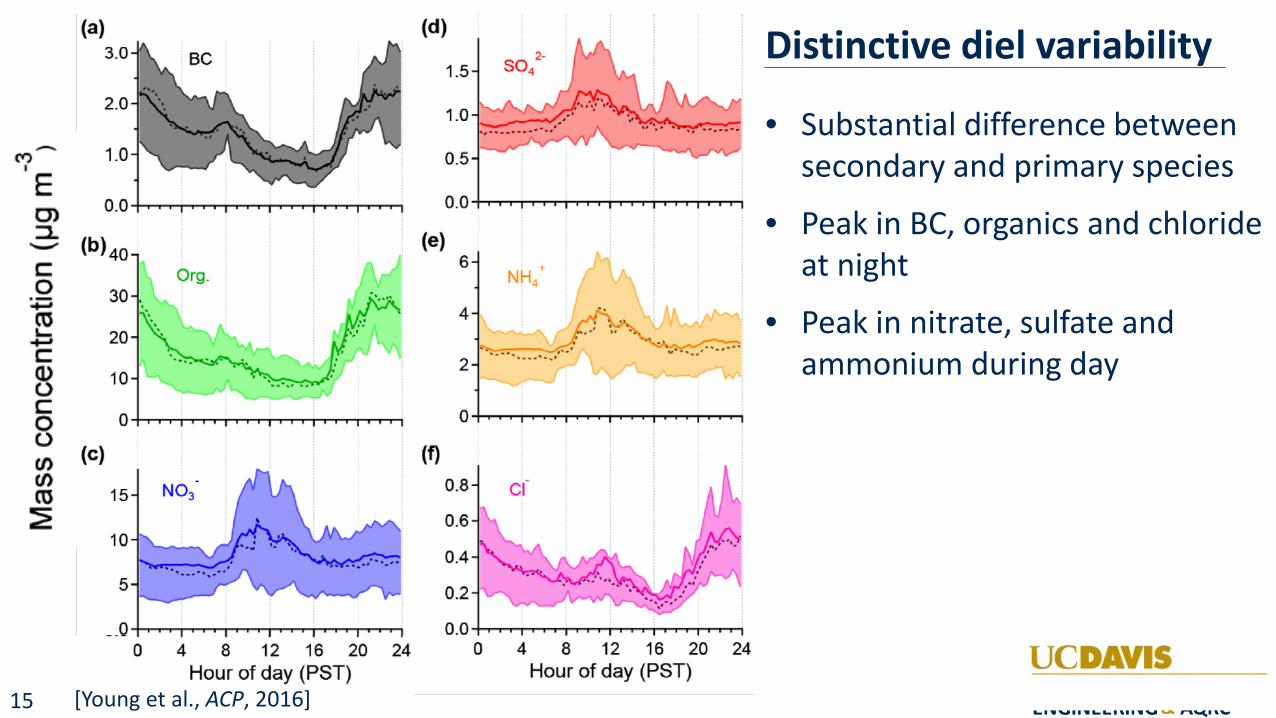
Distinctive diel variability
• Substantial difference between secondary and primary species
• Peak in BC, organics and chloride at night
• Peak in nitrate, sulfate and ammonium during day
[Young et al., ACP, 2016]
(a) 3.0
2.0
- 1.0 ('I)
E C) 0.0
::l.. (b}40
.._..
C: 0 30 ·-+-' cu L.. 20 +-' C: Q) 10 0 C
0 0 0
(c} (/) (/)
m 15
~ 10
5
__ o 0
BC
Org.
(d}
(e}
(f}
1.5
1.0
0.5
0.0
6
4
2 ,. -
..................... ...,iP
. , .., ........... .. .. .... ,. . ,. ...
0 ~'l"""'O""'--"l"""T""'__,..T""""'P"""'P""T..,._~_....,
0.8
0.6
0.4
0.2
0 .0+-,-m--r-r"T'""T"""r--r-T""'T"T""'r"'T,"'T""T""T"'T"T--r-T"l
4 8 12 16 20 24 0 4 8 12 16 20 24 Hour of day (PST) Hour of day (PST)
UCDAYIS CIVIL AND ENVIRONMENTAL ENGINEERING & AQRC
15
(g) 0 10 20 30 4
6
1008 ' .. .. .. 2
\
4 ;
6 ,
10008
(h) 0 10 20 4 ' 6 ' • 8 i,
100 J, I \
2 l ' ! \
i ' ... .. 4 .. .. 6
, 8 ,
1000
- so 2-+ (i) 0 1 2 3 - Org. - N03 - ■■ NH4 Org44 4
-- 16 <? (")
2.0 I
1.2 5 E E 20 14 O> O> 1.0 ::i. ::i.. 1.5 12 4 --co 0.8 15 10 ~ ::,. a a
8 3 0 0 0.6 1.0 .-.- 10 O> O> 6 2 0 0 0.4 0) 0 2 4 6 8 -0 0.5 4
-0 5 -- 1 e, 2> 0.2 2 0
0 c::: -0 0.0 0 0 0 0 --0
4 4 5 6 7 8 9 1000 •
' .. o va (nm)
... '
10008
0 2 4 6 8 10 12 14 16 18 20 22 24
Hour of day (PST) NTAL .
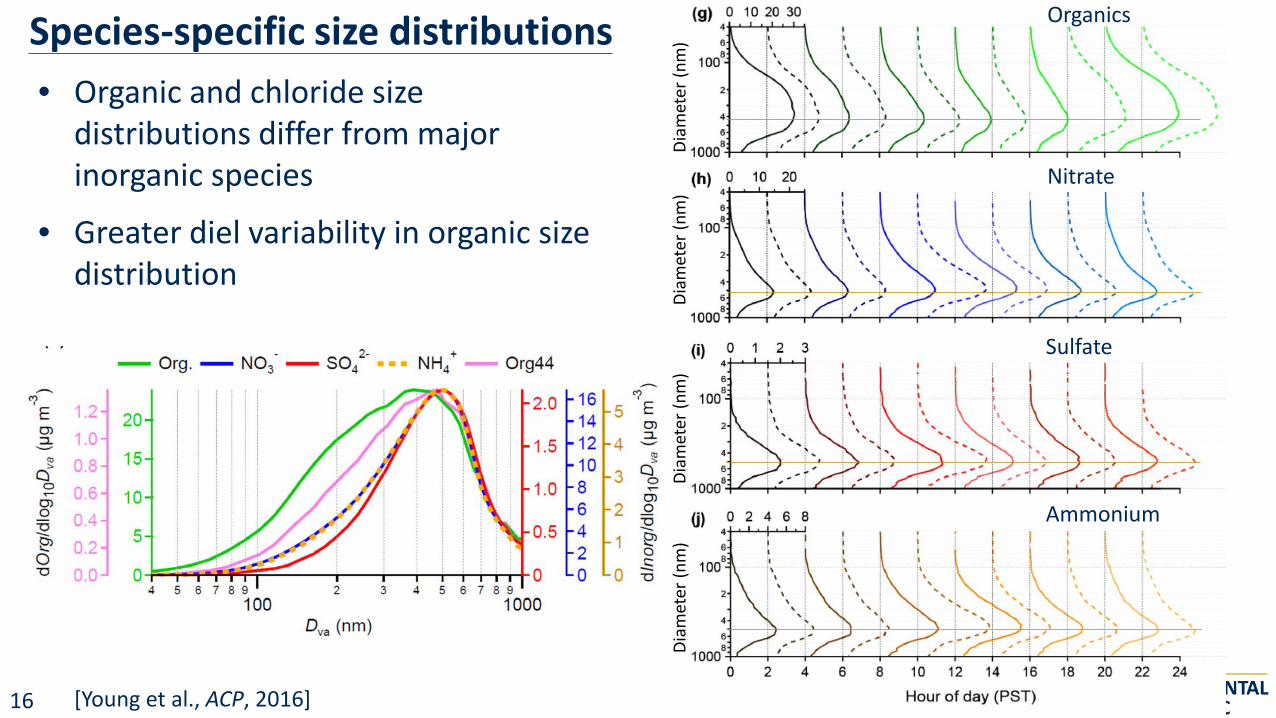
Species-specific size distributions • Organic and chloride size
distributions differ from major inorganic species
• Greater diel variability in organic size distribution
Organics
Nitrate
Sulfate
Ammonium
16 [Young et al., ACP, 2016] Di
amet
er (n
m)
Diam
eter
(nm
) Di
amet
er (n
m)
Diam
eter
(nm
)
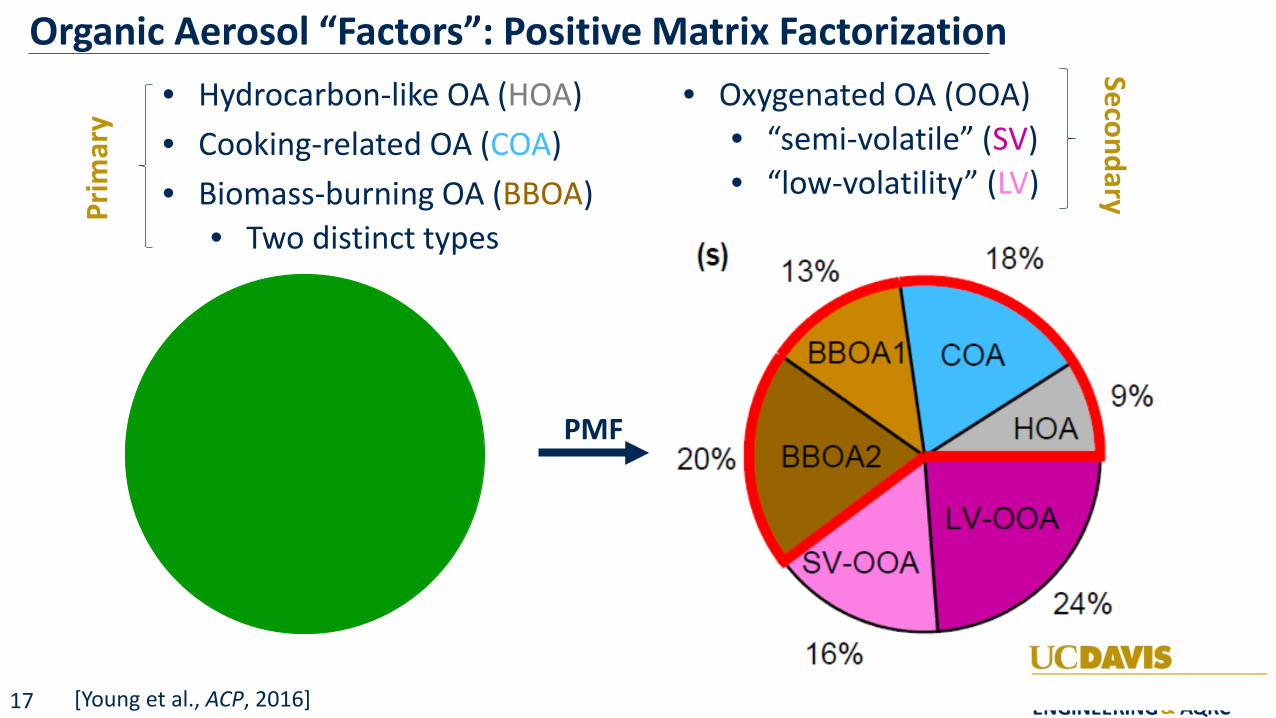
Organic Aerosol “Factors”: Positive Matrix Factorization • Hydrocarbon-like OA (HOA) • Oxygenated OA (OOA) • Cooking-related OA (COA) • “semi-volatile” (SV)
• “low-volatility” (LV)• Biomass-burning OA (BBOA) • Two distinct types
PMF
Prim
ary
(s)
------· 20°/o
13%~~---....... 18%
COA
16% UCDAYIS CIVIL AND ENVIRONMENTAL ENGINEERING & AQRC
[Young et al., ACP, 2016]
Secondary
17
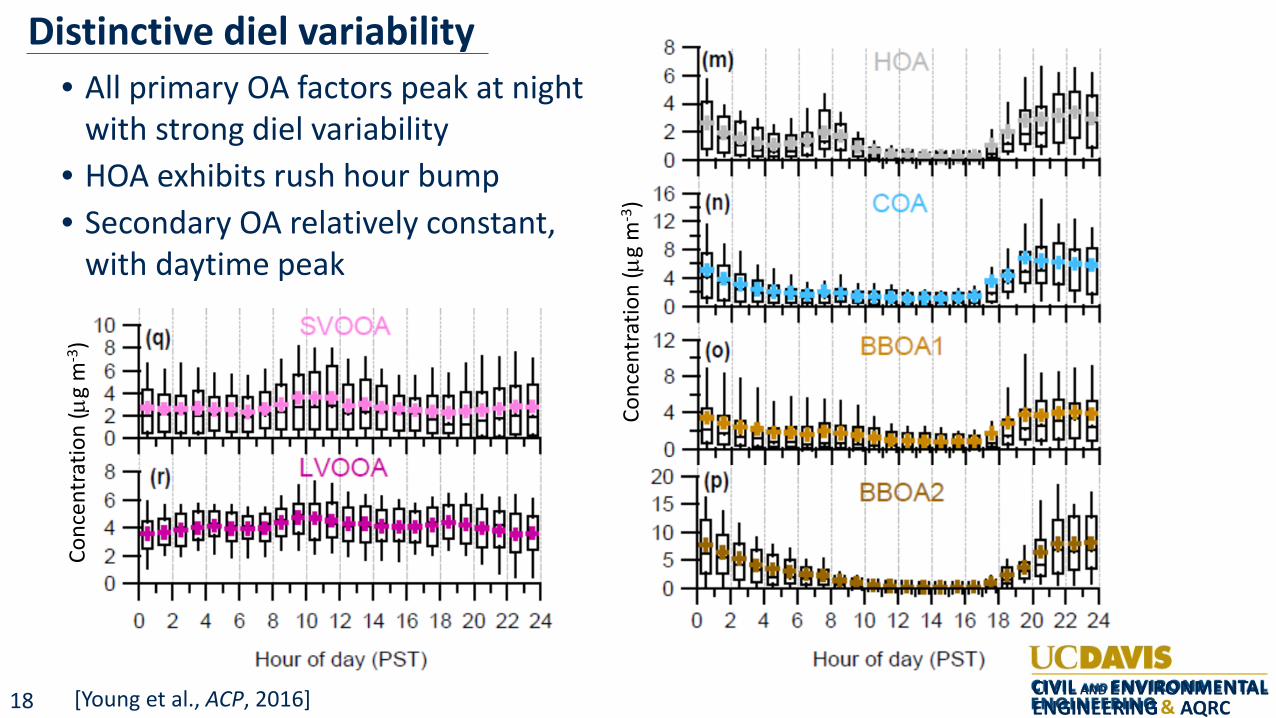
Distinctive diel variability • All primary OA factors peak at night
with strong diel variability • HOA exhibits rush hour bump • Secondary OA relatively constant,
with daytime peak
Conc
entr
atio
n (µ
g m
-3)
0 2 4 6 8 0 12 4 6 18 20 22 24
Hour of day PST
8
0 ....,:...,;..;c.=z=.:z:.=.m.z.:c.::a:.w~ltl-t,l,,ll.w,11:!i.=t--_....;...,;....;.....=-t
2
I
BBOAQ i I I I I
I I
Hour of day (PST UCDAYIS CIVIL AND ENVIRONMENTAL ENGINEERING & AQRC
Conc
entr
atio
n (µ
g m
-3)
[Young et al., ACP, 2016] 18
,__5 ,-.. (") C")
I I
E .5 E4 C) C)
::::i.. ...__... ...__...
~3 "O
0 T"""
C) g>2 0 -"'O
"'O O .5 ..._,
~ 0 0 l: "'O 0 "'O 0.0
50 ..._,
D va (nm)
Cl. 20
0 0
Cl.
8c8
...--.. "'C co
2 3 I
v,)
0 ...__...
UCDAYIS CIVIL AND ENVIRONMENTAL ENGINEERING & AQRC
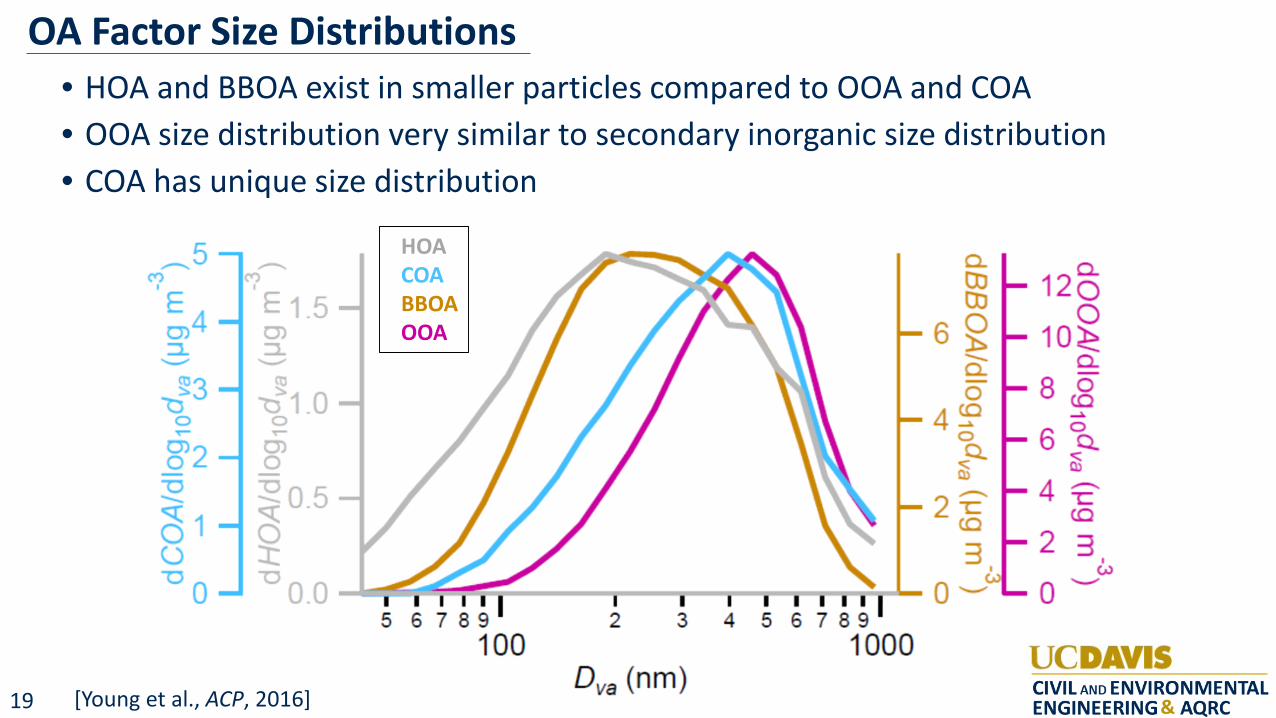
OA Factor Size Distributions • HOA and BBOA exist in smaller particles compared to OOA and COA • OOA size distribution very similar to secondary inorganic size distribution • COA has unique size distribution
HOA COA BBOA OOA
[Young et al., ACP, 2016] 19
C: 0
~ ... -C
~ C 0 0 1/) V'J ro ::
w 2.5 Q) ·0 2.0 ~ 1.5 w 1.0 ... :;: 0.5 BC a. 0.0-+-r-..........................
.... .9 0 ffl -<( 0
0 8 16 24
4 HOA 3
2
1 Q-+-o-..........................
0 8 16 24
~ ifl 1.2 .c -- E o.8 a. irl a. V 1/) a. .S 0 4 ro (/) .
C)
ro . !.2 0)
0 ffl o... rn O"O Q)
Q) ~
co 0.0 .+9-.......... ......,..,........,.... 0 8 16 24
1.0 0.8 0.6 0.4 0.2 0.0-+i-~""'"-.....
100 80
l 60 :c 40 a:: 20
0 8 16 24
0 -+-,-,..,........,... ............ 0 8 16 24
- Weekday average -- Weekend average
30
20
10 O Org.
0 8 16 24
8 COA 6
4
2 Q-+-,-,..,.........,......,.. ....
0 8 16 24
00 V 80 60 40 20 NOx 0 +.-, ........ ......,.......,. ....
0 8 16 24
1.5
1.0
0.5
0.0-+ri~..,..,.......,. .... 0 8 16 24
6 0 ,~
~12 \ ~ J -e 8 \
,w - ' ' 8- 4 ~ 0 ............ ., ........................ ~
0 8 16 24
12
8
4
0 -+-.--............................
4 3 2 1
0 8 16 24
0-+-.--............................
40 30 20 10
0 8 16 24
Ox 0 +,-........ ......,.......,. .....
0 8 16 24
~:::V\ / 0.2- \J 0.0 lsoorene
0 8 16 24
1.2 ~
0.8
0.4
0.0 ...................................
12
8
4
1.0
0 8 16 24
8 16 24
0.8 ~ 0.6 , . 0.4
8 16 24
Acetonitrile
8 16 24
8 16 24 Hour or Day (PST)
4 3 2 1 NH.i +
0 -+-.--.......................... 0 8 16 24
4
3 ._~
2 "'V' I ~ SV-OOA
80 ~60 140
20
0 8 16 24
O+t-........ ......,._ .....
25 20 15 10 5
0 8 16 24
0 Methanol
~ 0 ,_, 8 300 = 0 200 ~ '5 100 -0 C:
0 8 16 24
~ 0 ................................... 0 8 16 24
0.6
0.4
0.2
0.0 .................................
5 4 3 2
0 8 16 24
1 LV-OOA 0 ..................................
30
{ 20 ~10
0 8 16 24
NOi O+.-........ ,.............,..,...
4 3 2 1
0 8 16 24
0 Acetaldehyde
'7 Ill 2.0
.S 1.5
] 1.0
liro.5 "8 ~ 0.0
0 8 16 24
0
""'I ,., JI \
JI ,-.,. \ ' ,.
8 16 24
CIVIL AND ENVIRONMENTAL ENGINEERING & AQRC
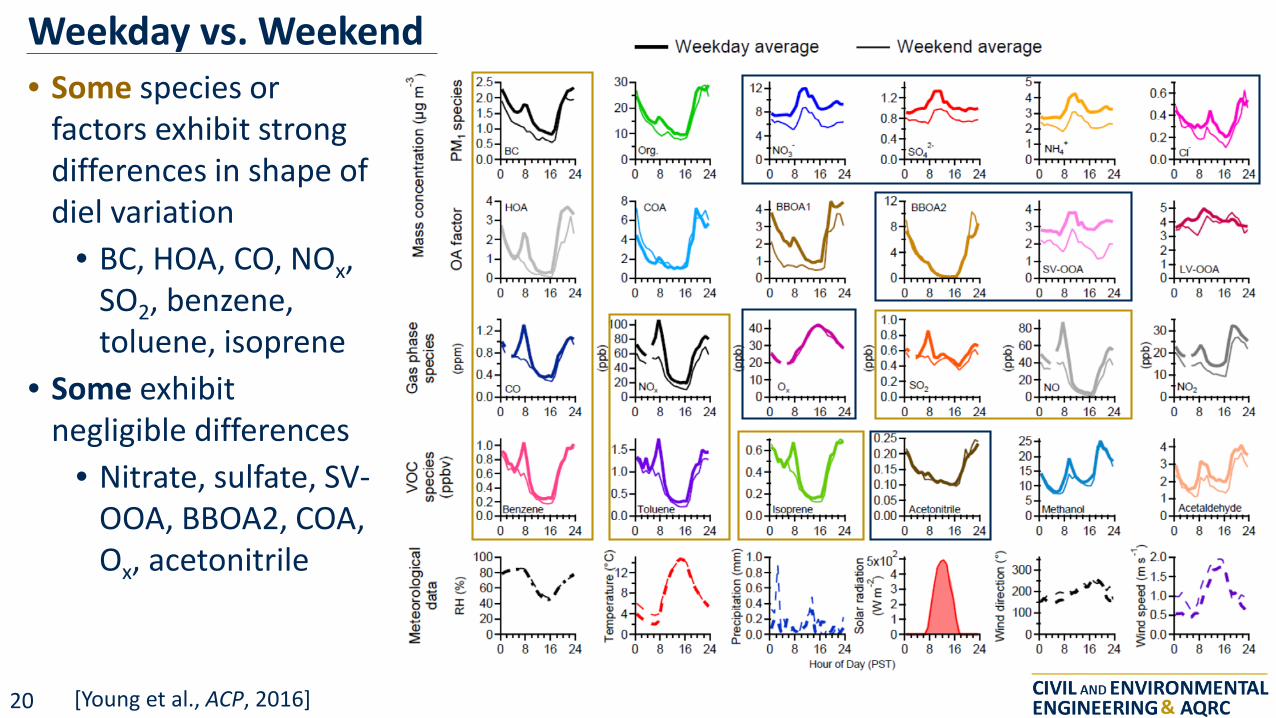
Weekday vs. Weekend • Some species or
factors exhibit strong differences in shape of diel variation
• BC, HOA, CO, NOx, SO2, benzene, toluene, isoprene
• Some exhibit negligible differences
• Nitrate, sulfate, SV-OOA, BBOA2, COA, Ox, acetonitrile
[Young et al., ACP, 2016] 20
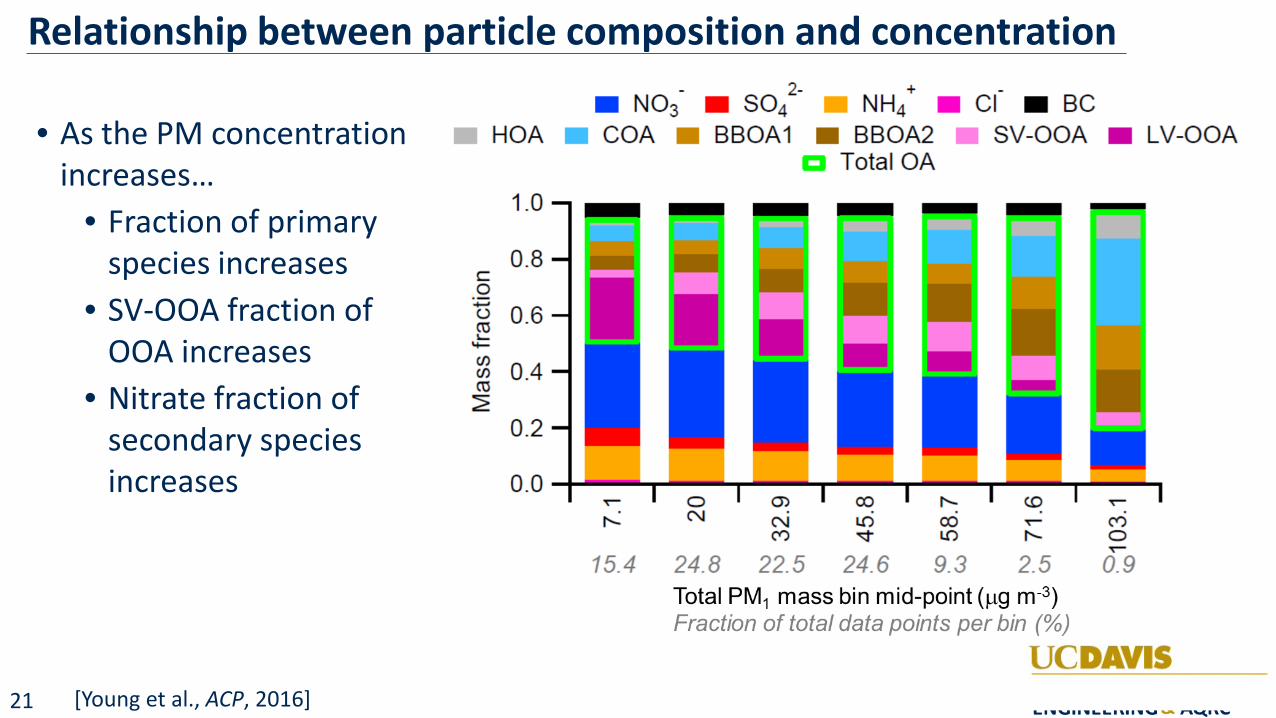
Relationship between particle composition and concentration
• As the PM concentration increases…
• Fraction of primary species increases
• SV-OOA fraction of OOA increases
• Nitrate fraction of secondary species increases
2- + • N03 • S04 NH4 • Cl • BC
• HOA • COA • BBOA 1 • BBOA2 Total OA
SV-OOA • LV-OOA
1.0
0.8 C: 0 .....
0.6 (.)
cu I....
'+-C/)
0.4 C/)
cu ~
0.2
0.0 T"""
f'-
15.4
0 CJ) 00 f'- c..o T"""
N N L{) 00 T""" C'0 C'0 ~ L{) f'- 0
T"""
24.8 22.5 24.6 9.3 2.5 0.9 Total PM1 mass bin mid-point (µg m-3)
Fraction of total data points per bin (%)
UCDAYIS CIVIL AND ENVIRONMENTAL ENGINEERING & AQRC
[Young et al., ACP, 2016] 21
Summary: Part I • Wintertime pollution events are spatially wide-spread in the SJV
• Particle composition dominated by organic aerosol and ammonium nitrate
• OA is contributed from primary emissions and secondary formation
• Primary OA contributed by biomass combustion, vehicles, cooking
• Primary and secondary species exhibit distinct diel behavior allows for separation and some identification of sources
• Vehicle-associated species tend to show greater weekend-weekday differences in diel behavior
• Organic aerosol contribution generally larger when total PM1 is larger
UCDAYIS CIVIL AND ENVIRONMENTAL ENGINEERING & AQRC
22
Part II: Processes Driving Variability in Ammonium Nitrate
UCDAYIS CIVIL AND ENVIRONMENTAL ENGINEERING & AQRC
23
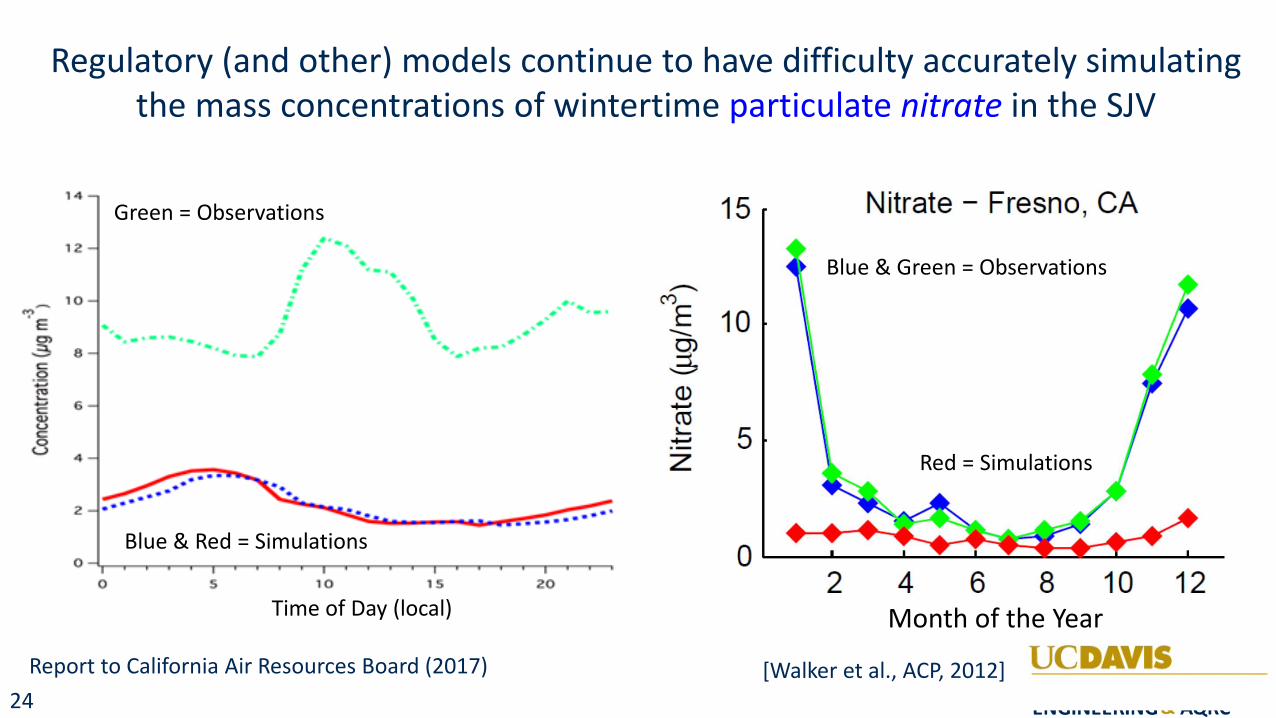
Regulatory (and other) models continue to have difficulty accurately simulating the mass concentrations of wintertime particulate nitrate in the SJV
Green = Observations
Blue & Red = Simulations
Time of Day (local) Month of the Year
Blue & Green = Observations
Red = Simulations
Report to California Air Resources Board (2017) [Walker et al., ACP, 2012]
-C 0 ·-~
'ff '
'ffO
t= 6 '<l) 0
g V
0. ~-----..,,.........,,............----,,---.--.,.........,,.............---,---.--~r---r----r----.---.-T"'"""""'T----.----.-"""T"'""""'"'>
110 1 0
Q) +-' cu s.,_
+-'
z
15
10
5
2
Nitrate - Fresno, CA
4 6 8 10 12
UCDAYIS CIVIL AND ENVIRONMENTAL ENGINEERING & AQRC
24

The story of a diurnal profile in particulate nitrate
20
15
10
5
o-L-~----,---r---;-----0 10 20 UCDAYIS
CIVIL AND ENVIRONMENTAL ENGINEERING & AQRC
Particulate Nitrate
Conc
entr
atio
n (µ
g m
-3 )
Hour of Day [Prabhakar et al., ACP, 2017] 25
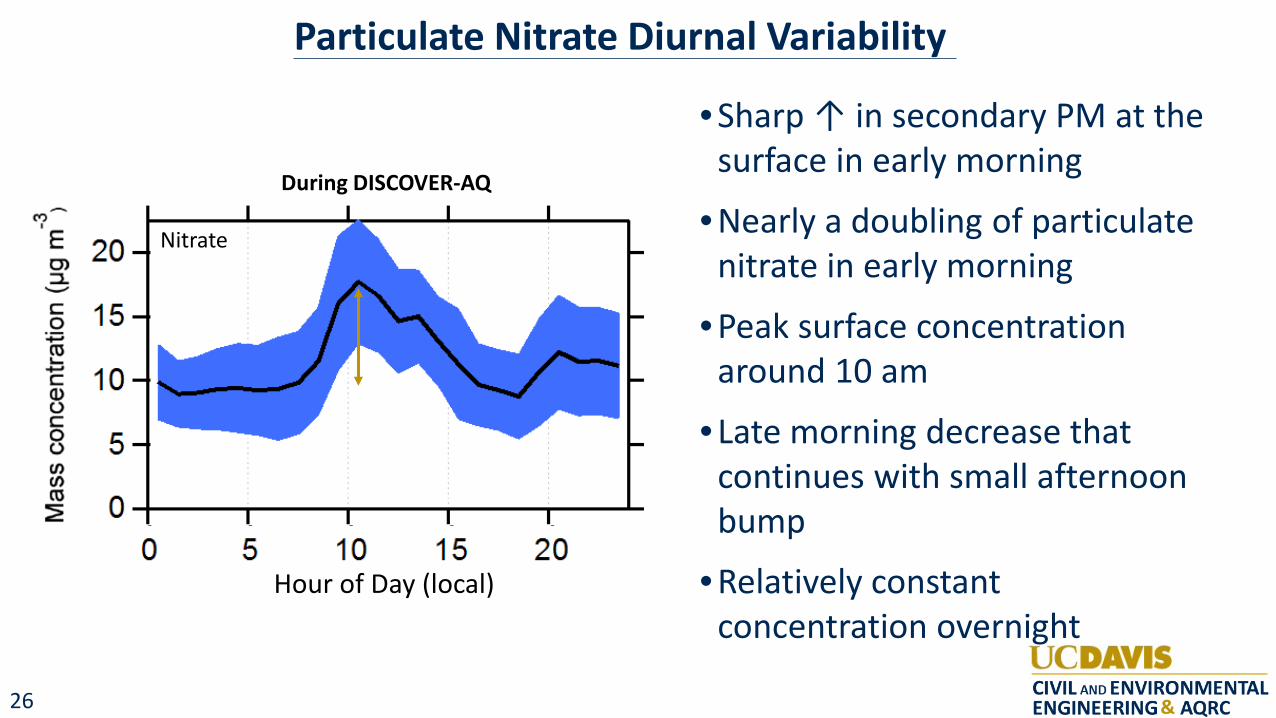
Particulate Nitrate Diurnal Variability
During DISCOVER-AQ
Nitrate
Hour of Day (local)
• Sharp ↑ in secondary PM at the surface in early morning
• Nearly a doubling of particulate nitrate in early morning
• Peak surface concentration around 10 am
• Late morning decrease that continues with small afternoon bump
• Relatively constant concentration overnight
-M I
E 20 0) ::J.. ...._.....
C: 15 0 ...., co "-....,
10 C: a.> (.} C: 0 5 (.)
CJ) CJ) co 0 :E
0 5 10 15 20
UCDAYIS CIVIL AND ENVIRONMENTAL ENGINEERING & AQRC
26
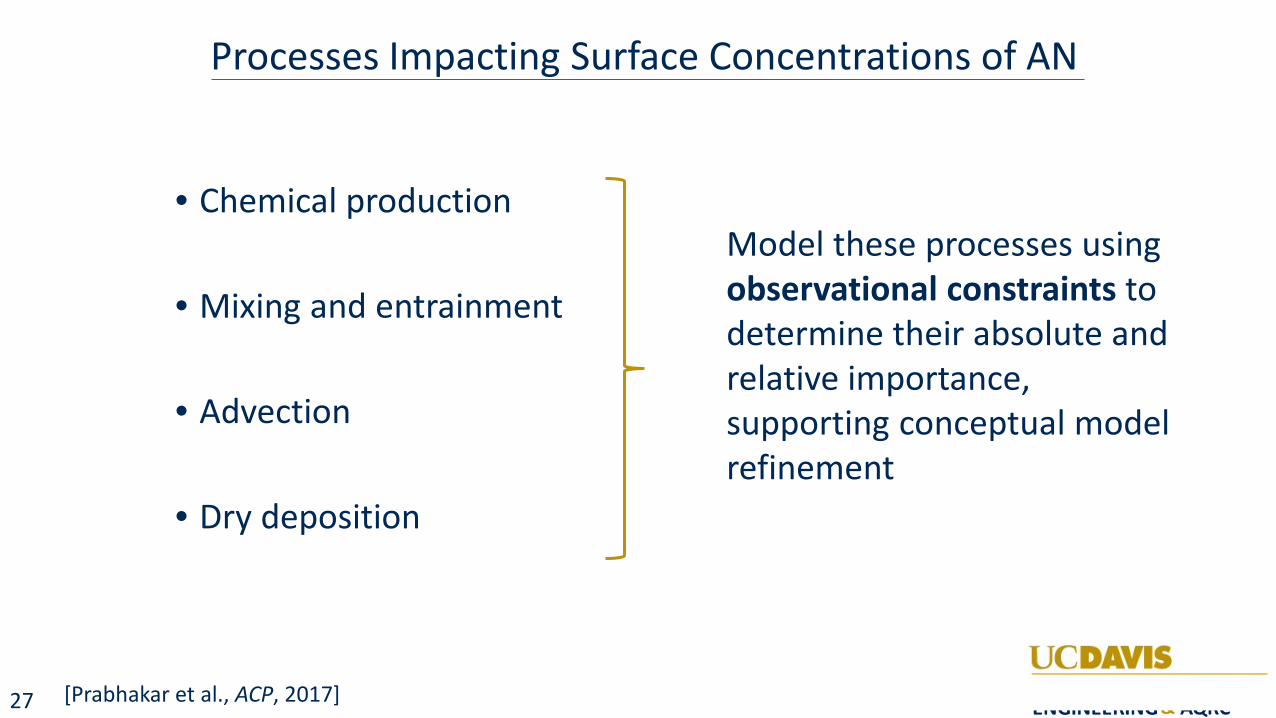
Processes Impacting Surface Concentrations of AN
• Chemical production
• Mixing and entrainment
• Advection
• Dry deposition
Model these processes using observational constraints to determine their absolute and relative importance, supporting conceptual model refinement
[Prabhakar et al., ACP, 2017] UCDAYIS CIVIL AND ENVIRONMENTAL ENGINEERING & AQRC
27
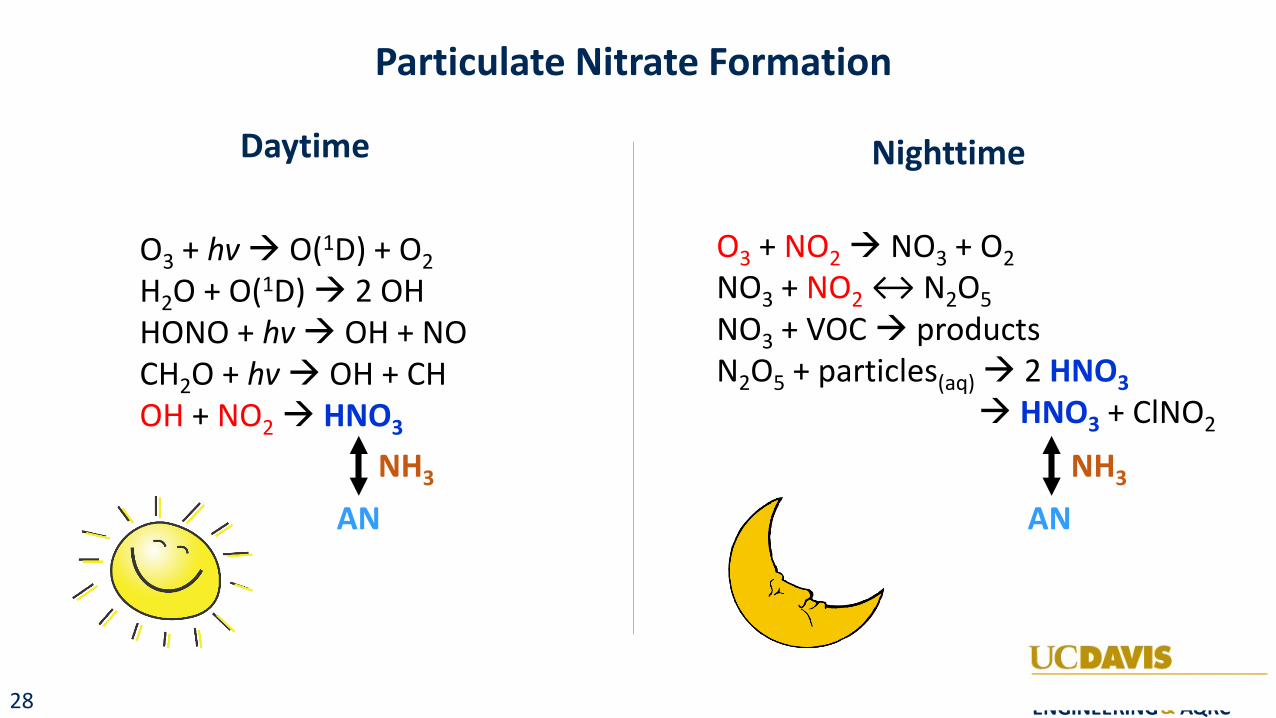
Particulate Nitrate Formation
Daytime
O3 + hv O(1D) + O2 H2O + O(1D) 2 OH HONO + hv OH + NO CH2O + hv OH + CH OH + NO2 HNO3
NH3
AN
Nighttime
O3 + NO2 NO3 + O2 NO3 + NO2 ↔ N2O5 NO3 + VOC products N2O5 + particles(aq) 2 HNO3
HNO3 + ClNO2
NH3
AN II / --I I \
UCDAYIS ~~R~O~N:;;M~E~NITT.:AAIL
CIVIL AND ERNli~ & AQRC ENGINEE
28
O3 + NO2 NO3 + O2 NO3 + NO2 ↔ N2O5 NO3 + VOC products N2O5 + particles(aq) 2 HNO3
HNO3 + ClNO2
O3 + hv O(1D) + O2 H2O + O(1D) 2 OH HONO + hv OH + NO CH2O + hv OH + CH OH + NO2 HNO3
Nighttime Daytime
AN NH3
AN NH3
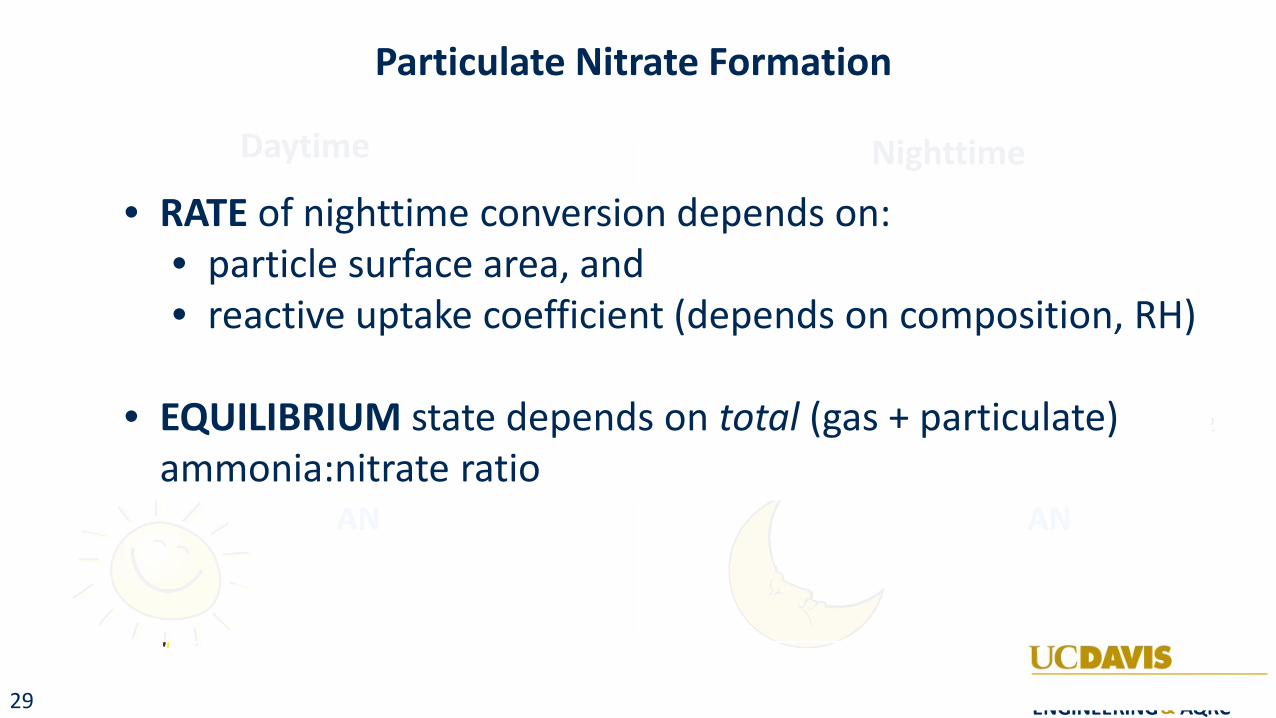
Particulate Nitrate Formation
• RATE of nighttime conversion depends on: • particle surface area, and • reactive uptake coefficient (depends on composition, RH)
• EQUILIBRIUM state depends on total (gas + particulate) ammonia:nitrate ratio
' I UCDAYIS CIVIL AND ENVIRONMENTAL ENGINEERING & AQRC
29
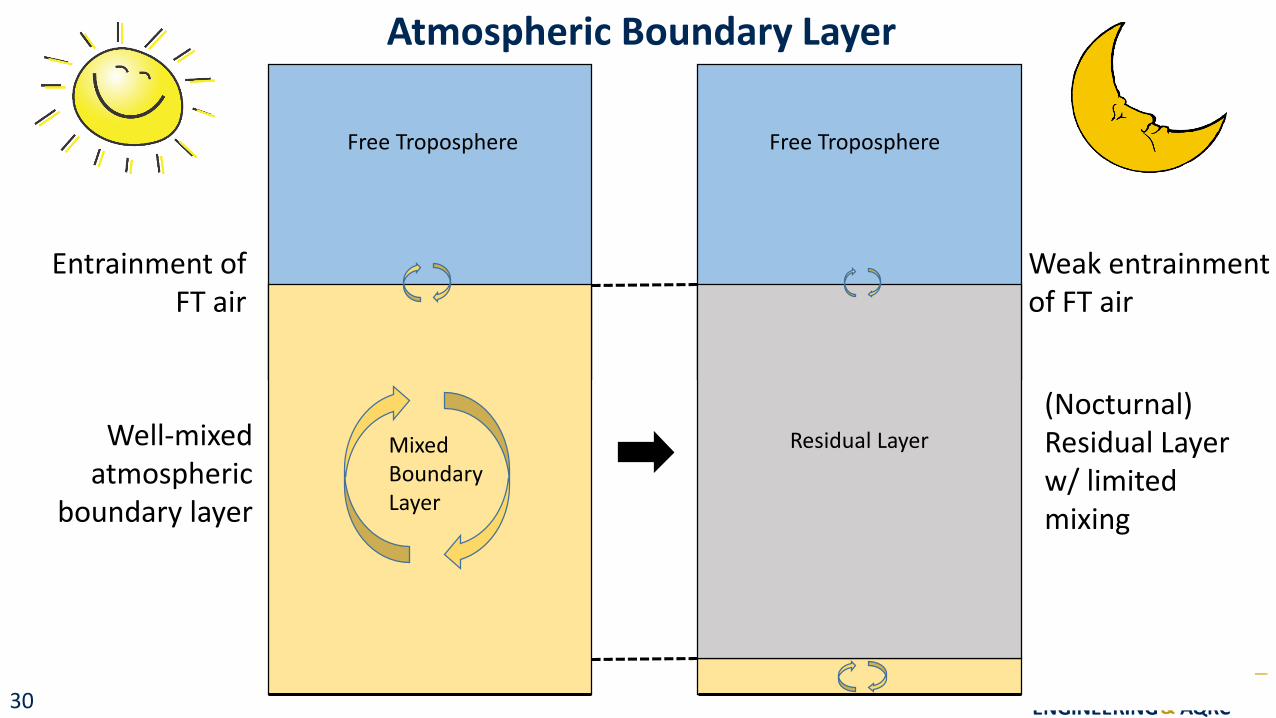
Atmospheric Boundary Layer
Entrainment of FT air
Well-mixed atmospheric
boundary layer
Free Troposphere
Mixed Boundary Layer
Free Troposphere
Residual Layer
Weak entrainment of FT air
(Nocturnal) Residual Layer w/ limited mixing
Shallow surface layer ----------~-, -----------1 t:N\:IINt:t:KIN\:I & A'-{Kl.
30
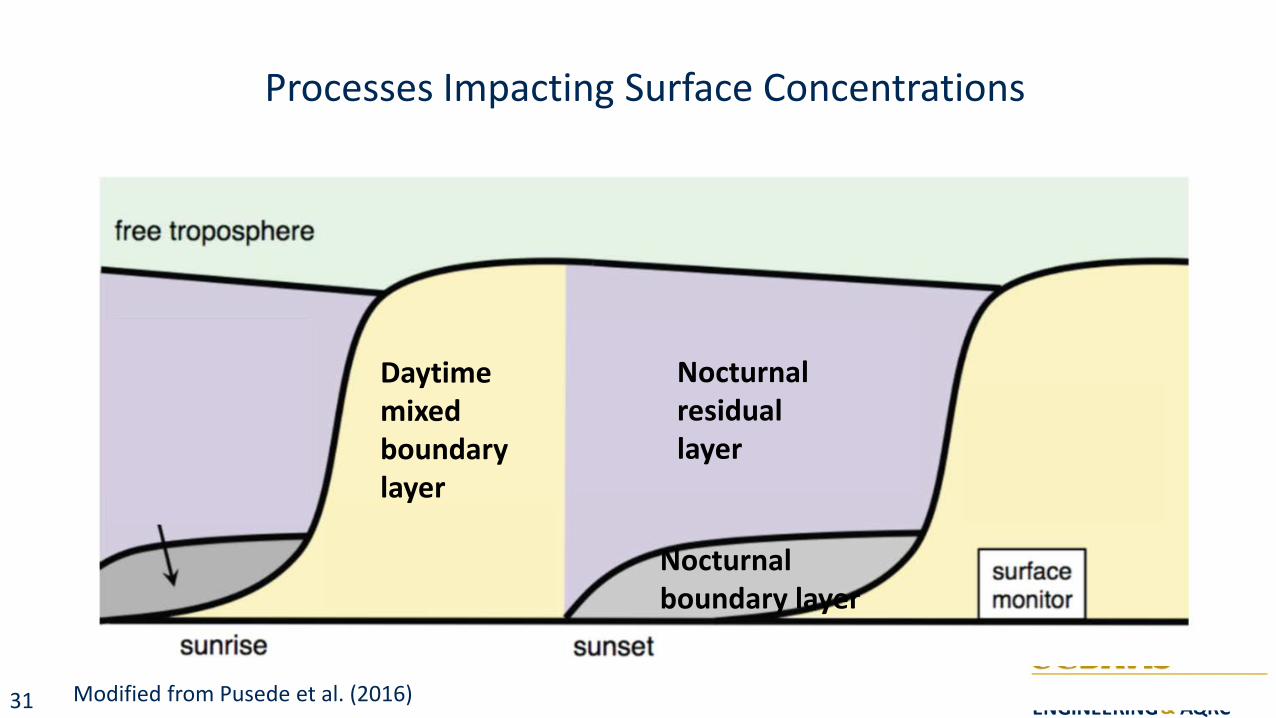
Processes Impacting Surface Concentrations
f'ree ,·roposphere
• s.unrse sunset
surlac m:onitor
CIVIL AND ENVIRONMENTAL ENGINEERING & AQRC
Daytime mixed boundary layer
Nocturnal residual layer
Nocturnal boundary layer
Modified from Pusede et al. (2016) 31
f'ree ,·roposphere
• s.unrse sunset
surlac m:onitor
CIVIL AND ENVIRONMENTAL ENGINEERING & AQRC
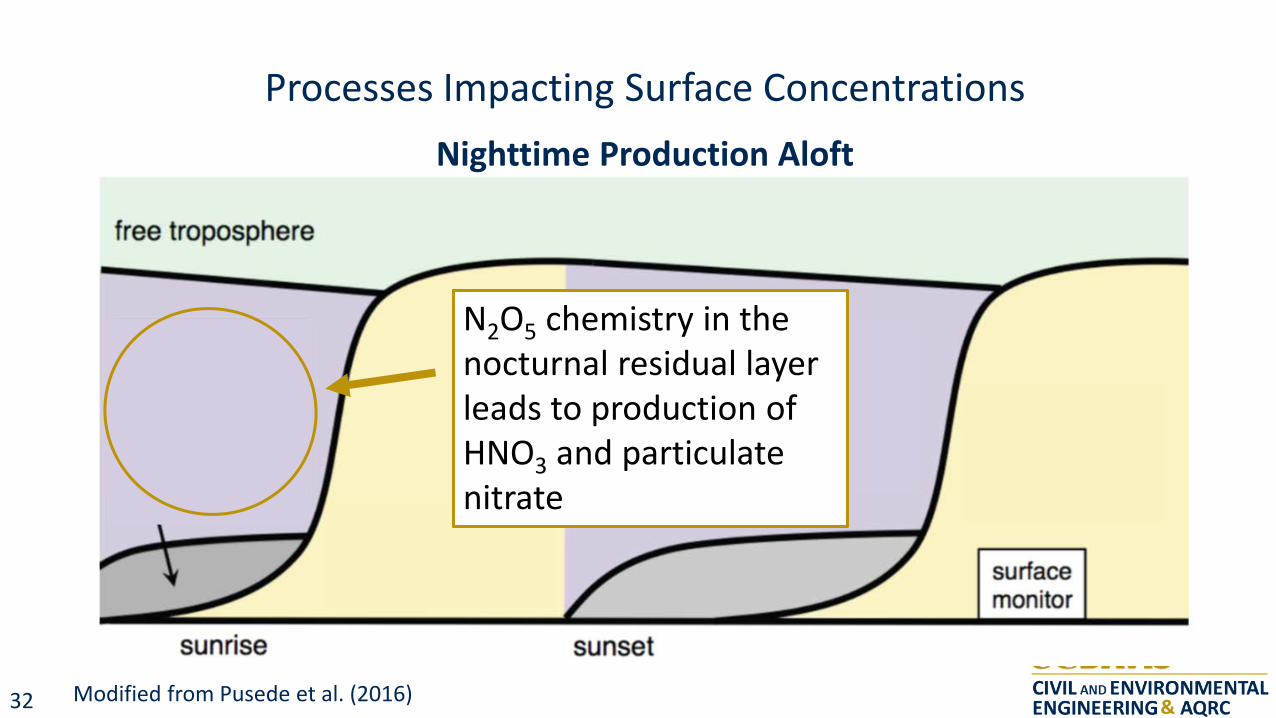
Processes Impacting Surface Concentrations Nighttime Production Aloft
N2O5 chemistry in the nocturnal residual layer leads to production of HNO3 and particulate nitrate
Modified from Pusede et al. (2016) 32
f'ree ,·roposphere
• s.unrse sunset
surlac m:onitor
CIVIL AND ENVIRONMENTAL ENGINEERING & AQRC
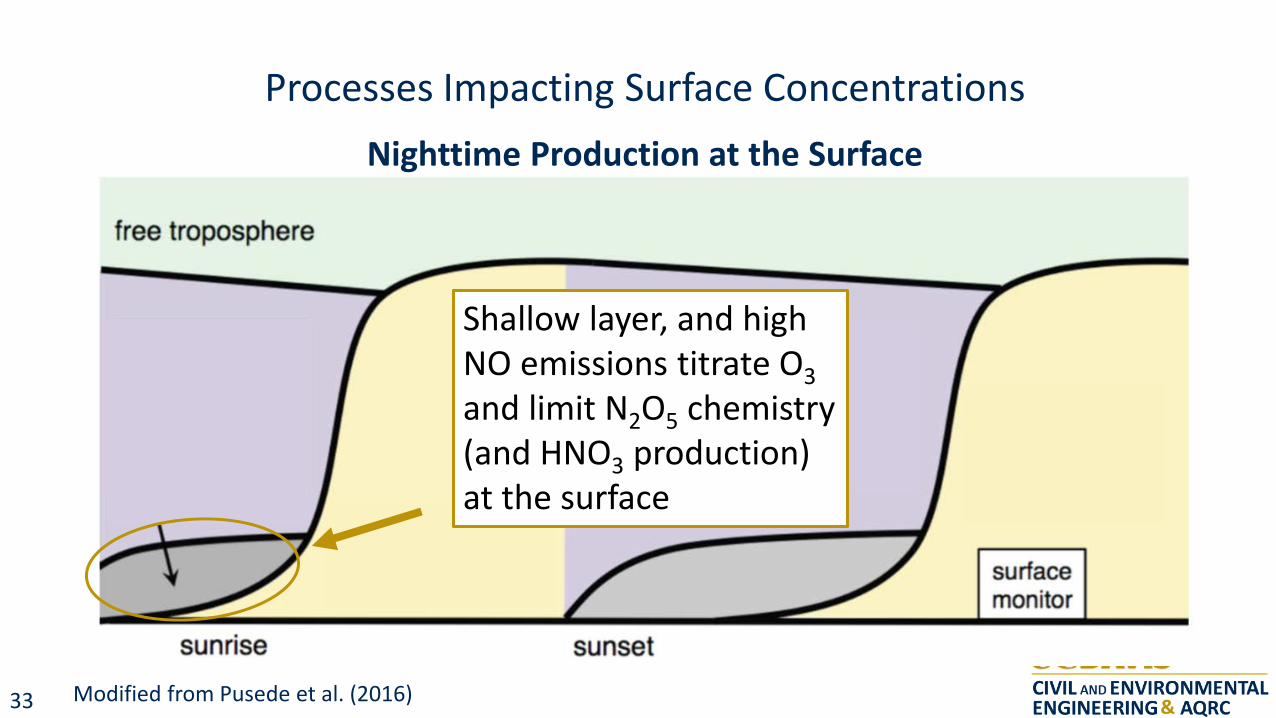
Processes Impacting Surface Concentrations Nighttime Production at the Surface
Shallow layer, and high NO emissions titrate O3 and limit N2O5 chemistry (and HNO3 production) at the surface
Modified from Pusede et al. (2016) 33
f'ree ,·roposphere
• s.unrse sunset
surlac m:onitor
CIVIL AND ENVIRONMENTAL ENGINEERING & AQRC
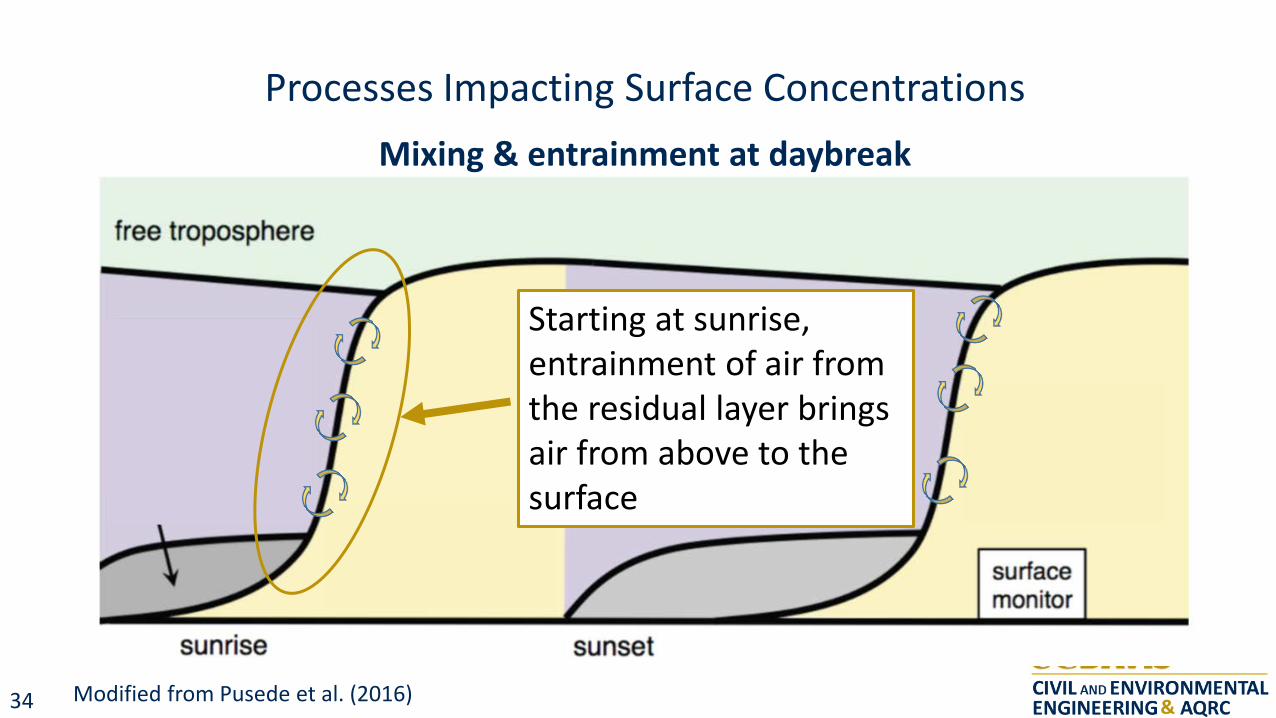
Processes Impacting Surface Concentrations Mixing & entrainment at daybreak
Starting at sunrise, entrainment of air from the residual layer brings air from above to the surface
Modified from Pusede et al. (2016) 34
f'ree ,·roposphere
• s.unrse sunset
surlac m:onitor
CIVIL AND ENVIRONMENTAL ENGINEERING & AQRC
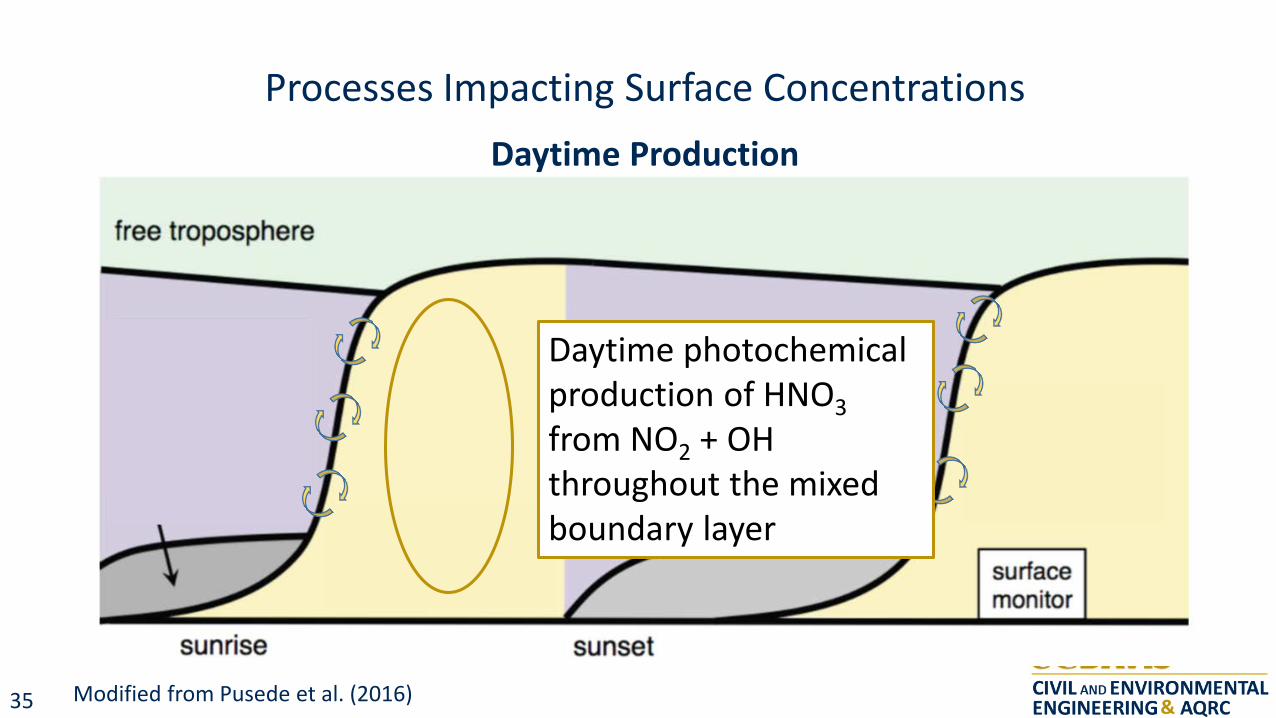
Processes Impacting Surface Concentrations Daytime Production
Daytime photochemical production of HNO3 from NO2 + OH throughout the mixed boundary layer
Modified from Pusede et al. (2016) 35
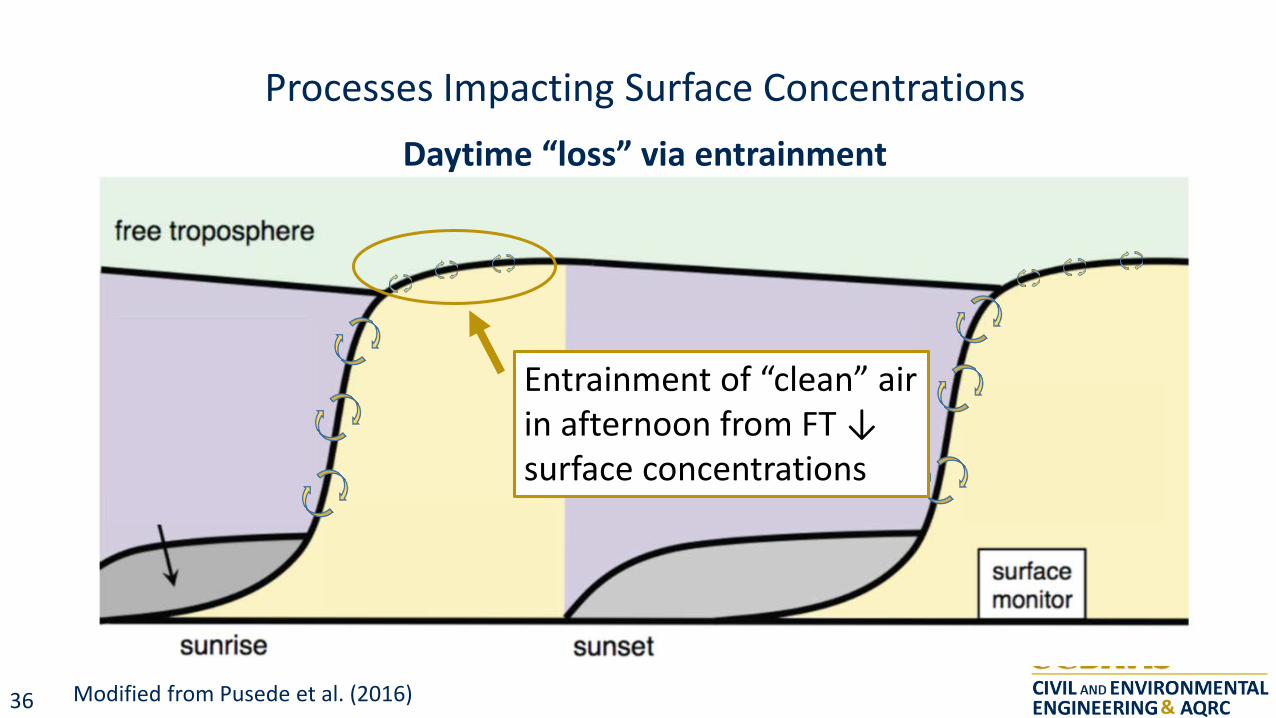
Entrainment of “clean” air in afternoon from FT ↓ surface concentrations
Daytime “loss” via entrainment
Processes Impacting Surface Concentrations
Modified from Pusede et al. (2016)
f'ree ,·roposphere
• s.unrse sunset
surlac m:onitor
CIVIL AND ENVIRONMENTAL ENGINEERING & AQRC
36

Deposition of HNO3 to the surface ↓ ambient concentrations
Daytime loss via dry deposition
Processes Impacting Surface Concentrations
Modified from Pusede et al. (2016)
f'ree ,·roposphere
I l l l
• s.unrse sunset
surlac m:onitor
CIVIL AND ENVIRONMENTAL ENGINEERING & AQRC
37
f'ree ,·roposphere
• s.unrse sunset
-
surlac m:onitor
CIVIL AND ENVIRONMENTAL ENGINEERING & AQRC
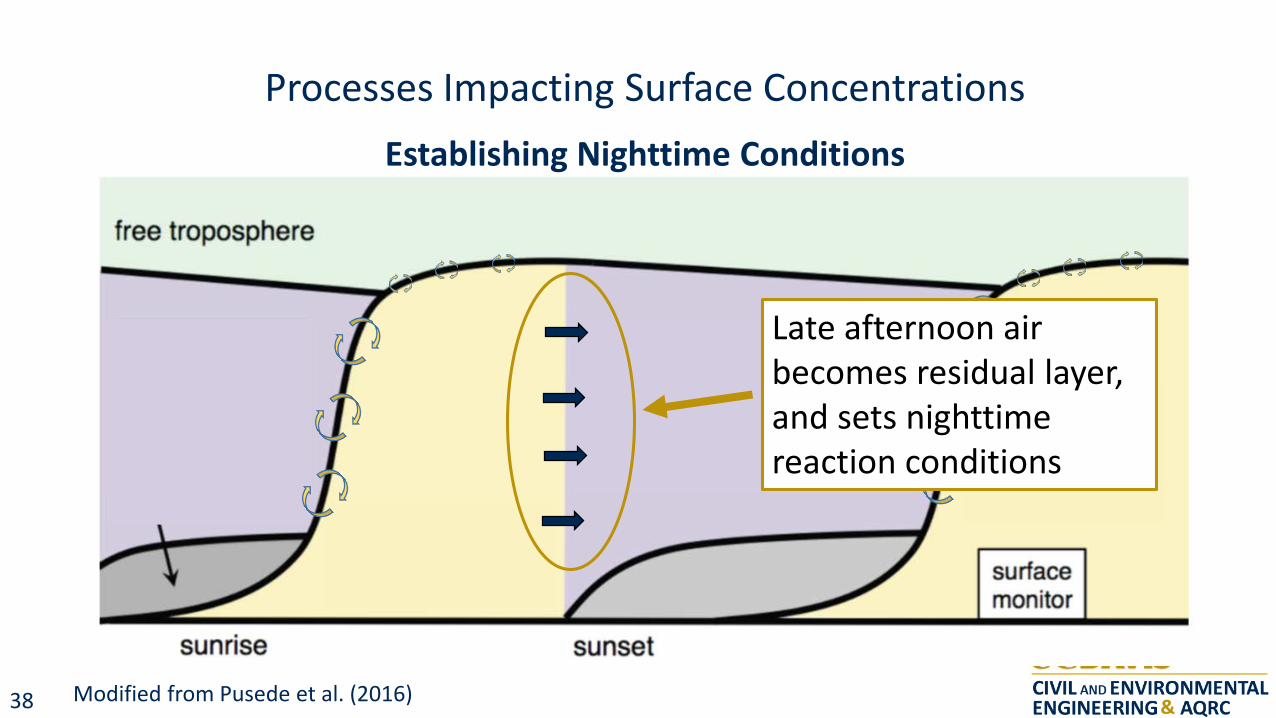
Processes Impacting Surface Concentrations Establishing Nighttime Conditions
Late afternoon air becomes residual layer, and sets nighttime reaction conditions
Modified from Pusede et al. (2016) 38
f'ree ,·roposphere
• s.unrse sunset
-
surlac m:onitor
CIVIL AND ENVIRONMENTAL ENGINEERING & AQRC
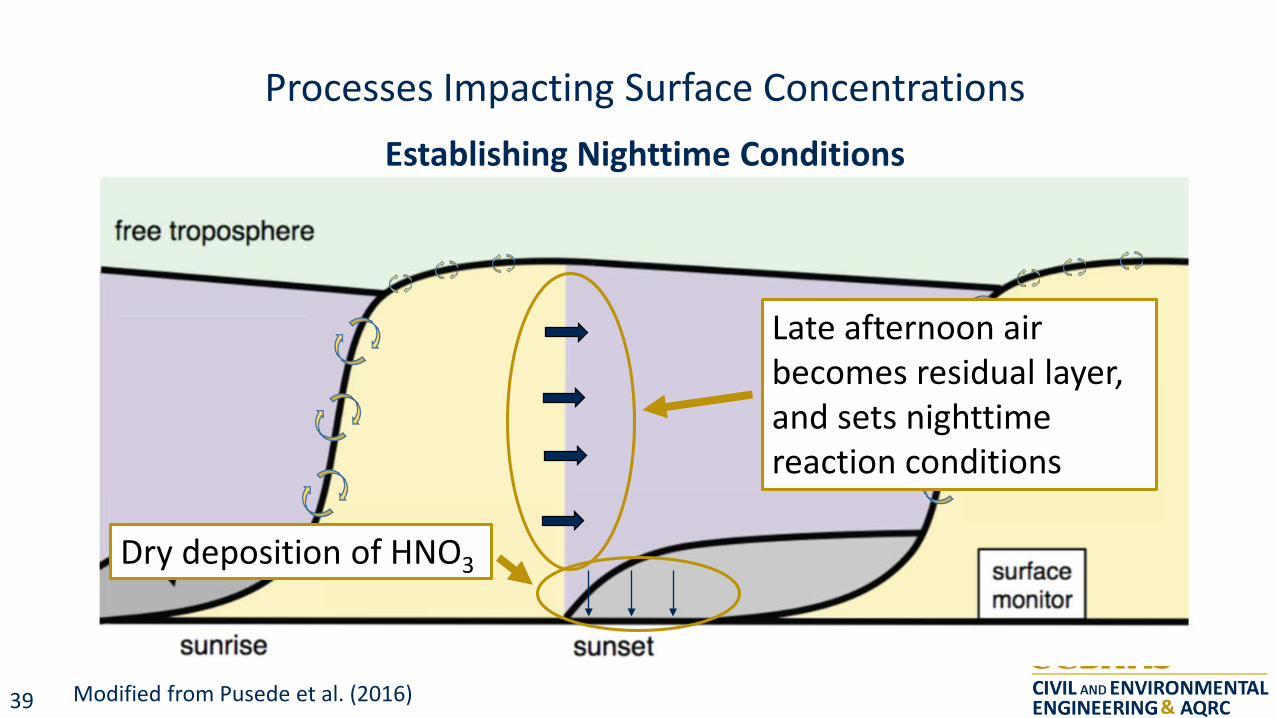
Processes Impacting Surface Concentrations Establishing Nighttime Conditions
Late afternoon air becomes residual layer, and sets nighttime reaction conditions
Dry deposition of HNO3
Modified from Pusede et al. (2016) 39
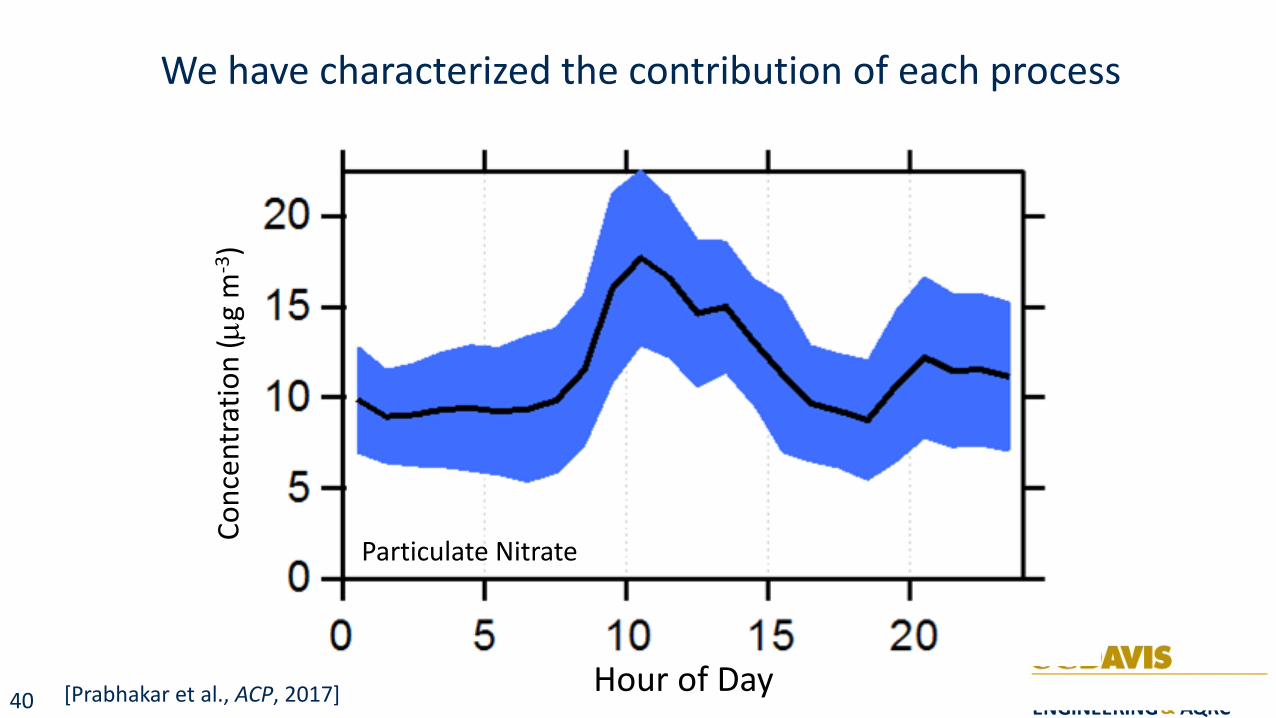
We have characterized the contribution of each process
20
15
10
5
0 --1------r------r-----;-----.l ---
0 5 201 __ _ AVIS CIVIL AND ENVIRONMENTAL ENGINEERING & AQRC
Particulate Nitrate
Conc
entr
atio
n (µ
g m
-3 )
Hour of Day [Prabhakar et al., ACP, 2017] 40
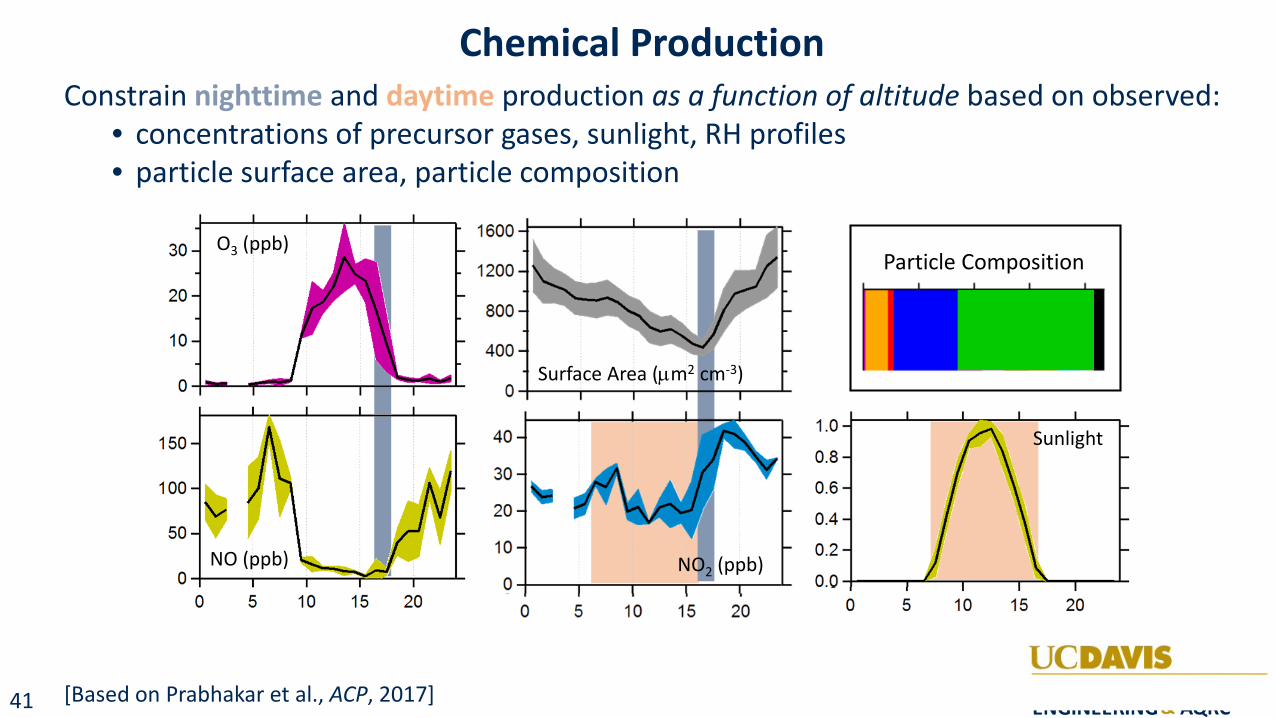
Chemical Production Constrain nighttime and daytime production as a function of altitude based on observed:
• concentrations of precursor gases, sunlight, RH profiles • particle surface area, particle composition
NO2 (ppb)
O3 (ppb)
NO (ppb)
Surface Area (µm2 cm-3)
Sunlight
Particle Composition
[Based on Prabhakar et al., ACP, 2017]
30
20
10
150
100
50
0 5 10 15 20
1600
1200
800
400
0
40
30
20
10
0 -
0 5 10 15 20
1.0
0.8
0.6
0.4
0.2
0.0 -+---"----.-------------..... 0 5 10 15 20
UCDAYIS CIVIL AND ENVIRONMENTAL ENGINEERING & AQRC
41
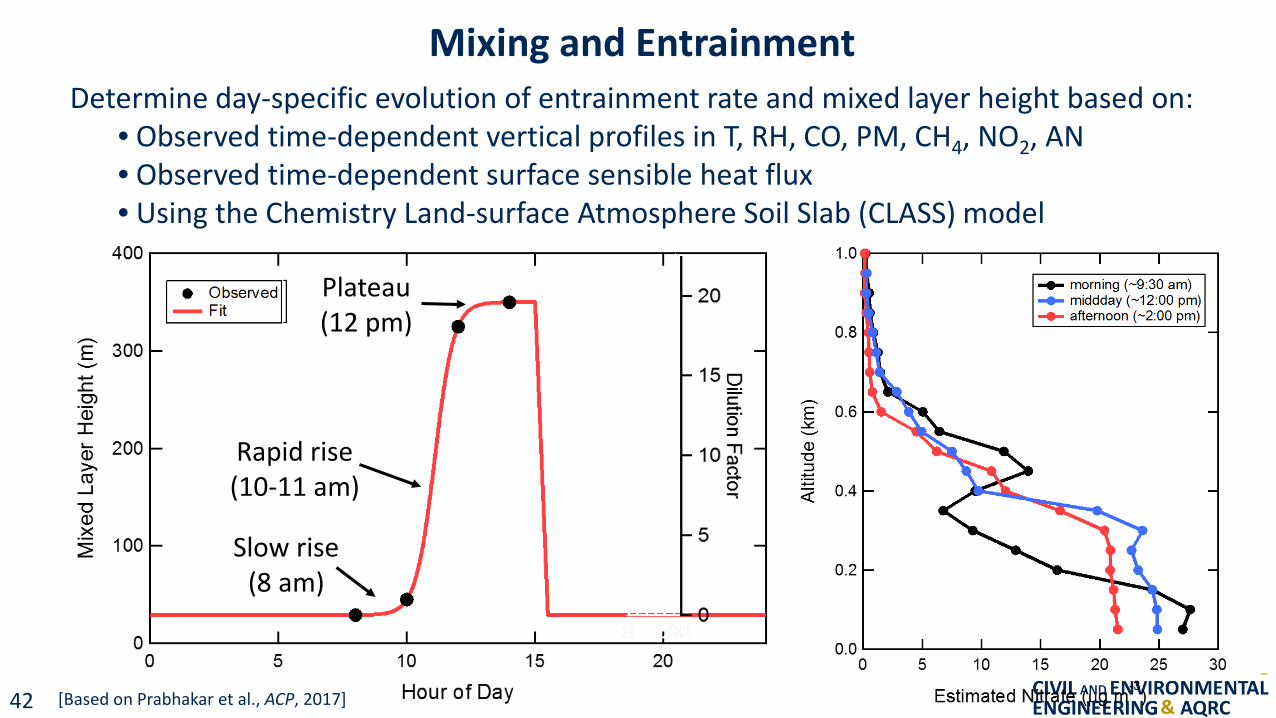
Mixing and Entrainment Determine day-specific evolution of entrainment rate and mixed layer height based on:
• Observed time-dependent vertical profiles in T, RH, CO, PM, CH4, NO2, AN • Observed time-dependent surface sensible heat flux • Using the Chemistry Land-surface Atmosphere Soil Slab (CLASS) model
Plateau (12 pm)
Rapid rise (10-11 am)
Slow rise (8 am)
400 1.0
- morning ( ~9:30 am) • Observed] 20 - middday ( ~1 2:00 pm)
- Fit - afternoon (~2:00 pm) 0.8 ..-
E 300 .._ 150 -.c.
C) C: ...-... - E 0.6 CD o · ~ I ::::, ---I,,.. 200 10~ a,
CD i:::::, >- Q. :::J ct! :t:
0 ..... 0.4 ....J -, <l::
"'C CD
5 _x 100 ~
0.2
-----
0 0.0 0 5 10 15 20 0 5 10 15 20 25 30
Hour of Day -3 Estimated Nitrate (µg m ) L
Cl"\:Jll"CCl'Ul"\:J CX 1-\'-(n\..
[Based on Prabhakar et al., ACP, 2017] 42
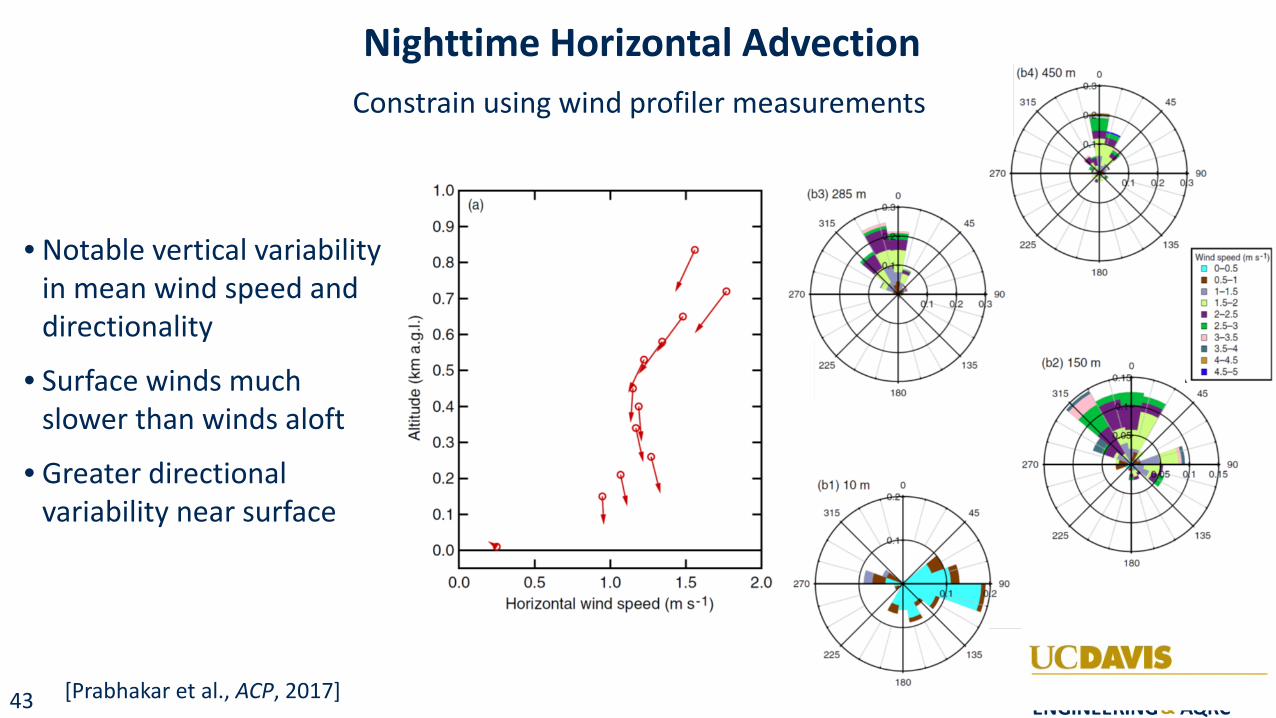
Nighttime Horizontal Advection Constrain using wind profiler measurements
• Notable vertical variability in mean wind speed and directionality
• Surface winds much slower than winds aloft
• Greater directional variability near surface
[Prabhakar et al., ACP, 2017]
1 . 0 ,-----.-------,...--------.------.
0.9
0.8
0.7
0) 0.6 ctl
~ 0.5 -Q)
-g 0.4 -:.;::; <(
0.3
0.2
0.1
(a)
o.o------- --------------0.0 0.5 1.0 1.5
Horizontal wind speed (m s-1)
(b3) 285 m 0
180
(b1) 10m o
180
(b4) 450 m o
180
(b2) 150 m o
180
UCDAYIS
Wind speed (m s·1) ■ 0-0.5 ■ 0.5-1 ■ 1-1.5
1.5-2 ■ 2-2.5 ■ 2.5-3
3-3.5 • 3.5-4 ■ 4-4.5 • 4.5-5
CIVIL AND ENVIRONMENTAL ENGINEERING & AQRC
43
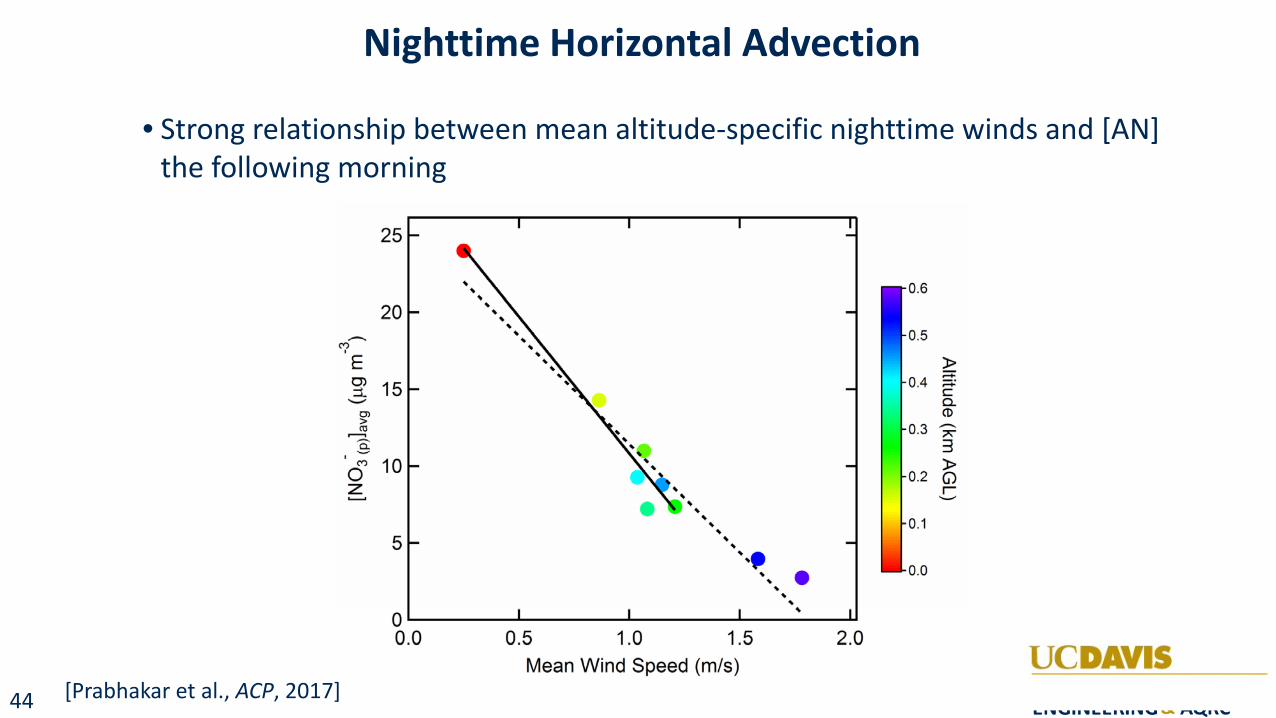
Nighttime Horizontal Advection
• Strong relationship between mean altitude-specific nighttime winds and [AN] the following morning
[Prabhakar et al., ACP, 2017]
-C"') I
E
25
20
~ 15 C) > (ti ,........, a: -
' C"') 10 0 z
5
\ \
\ \
\ \
\ \
\
\\~
\\ . ' ' ' \
il.o ___ o.L.5 ___ ..J1 .-=--0------=-1~.5~-----:2;--;.o
Mean Wind Speed (mis)
0.6
0.5
)> ;::::;:
0.4 ~ C C. CD
0.3 ~ 3 )>
0.2 G) r ---
0.1
0.0
UCDAYIS CIVIL AND ENVIRONMENTAL ENGINEERING & AQRC
44
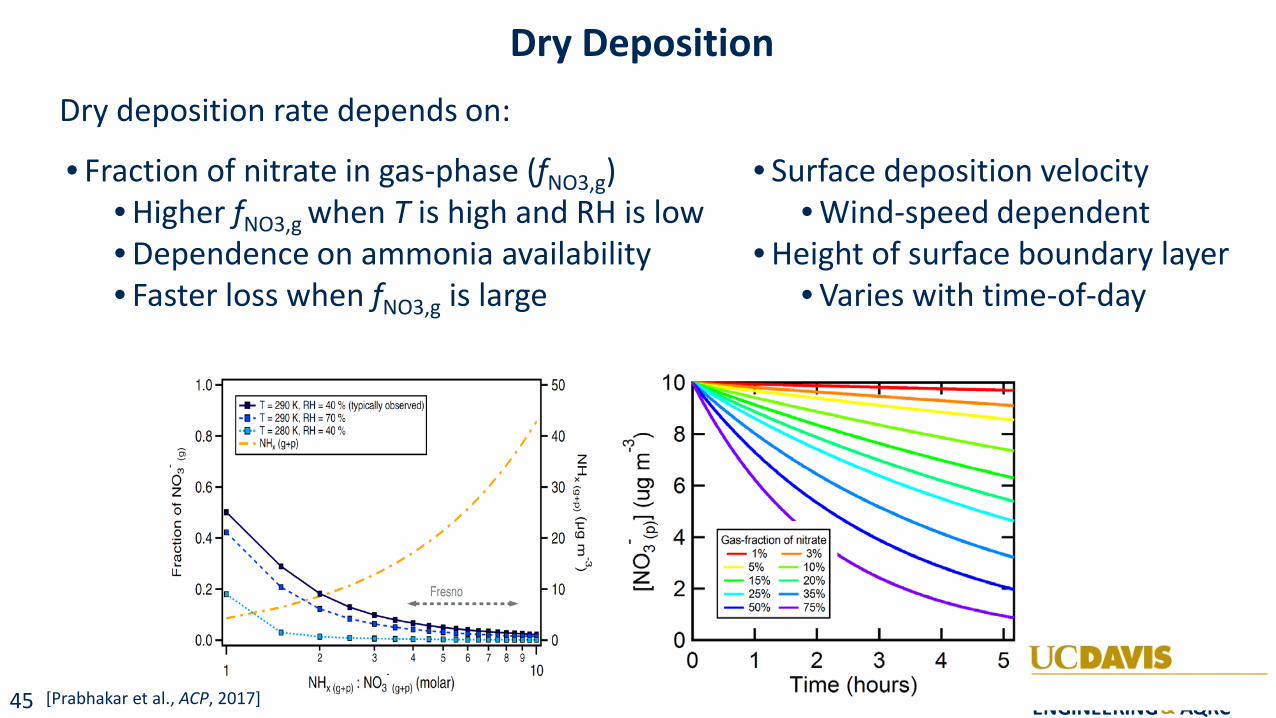
Dry Deposition Dry deposition rate depends on:
• Fraction of nitrate in gas-phase (fNO3,g) • Surface deposition velocity • Higher fNO3,g when T is high and RH is low • Wind-speed dependent • Dependence on ammonia availability • Height of surface boundary layer • Faster loss when fNO3,g is large • Varies with time-of-day
[Prabhakar et al., ACP, 2017]
1.0 50 10 ... T = 290 K, RH = 40 % (typically observed) - ■ · T = 290 K, RH= 70 %
0.8 • T = 280 K, RH = 40 % • 40 - • NH, (g+p) I §
I z C') I
0 0.6 / 30 ; z / + - ~ 0
/ -C • 'C 0 / 20 (Q - . (.) ,,,
3 ct! ,,, w ... LL ..,. -..,.
10 0.2 Fresno
-- 8 (") I
E 0) 6 :::::s .._
,.........., -a. 4 -......, Gas-fraction of nitrate
(") - 1% - 3% 0 5% 10% z 2 - 15% - 20% .__,
- 25% - 35% •· .............. - 50% - 75%
0.0 0 0 0 1 2 3 4 s UCDAYIS
NHx(g+pl: N03. (g+p) (molar) CIVIL AND ENVIRONMENTAL Time (hours) ENGINEERING & AQRC
45
--- [N 0 3- + H N03] (b) Alli data
D H NO3 (day) D HNI0 3 (night)
• N 0 3- (day) D I N 0 3- (night)
1 J)1
ro ....... 0 .._ ~
0 C: 0 ~ (.)
02 m i,.;,
LL 0.0
11/20/13 11.22113 1/24/ 3 1/26/13 1/28/13 Date
(c) Day
91%
1/30/13 2/1/13 2/3/13 215/13,
I z SJ
CIVIL AND ENVIRONMENTAL ENGINEERING & AQRC
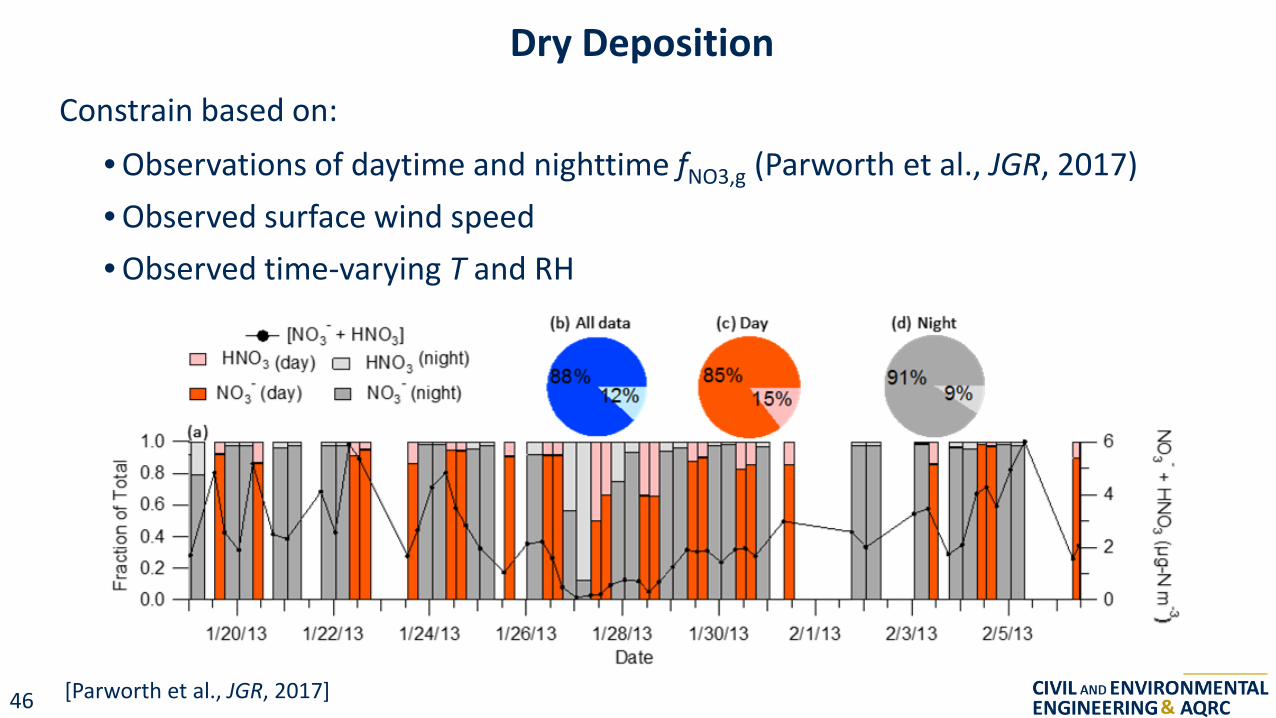
Dry Deposition Constrain based on:
• Observations of daytime and nighttime fNO3,g (Parworth et al., JGR, 2017) • Observed surface wind speed • Observed time-varying T and RH
[Parworth et al., JGR, 2017] 46
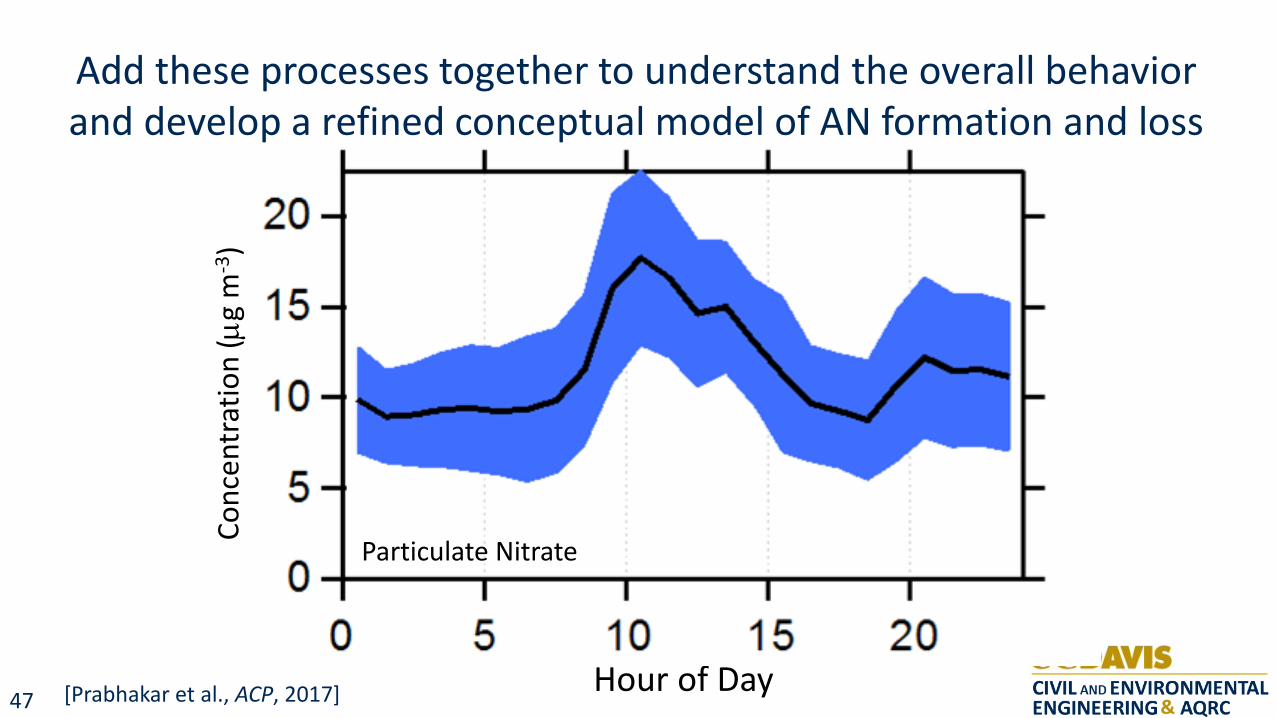
Add these processes together to understand the overall behavior
Hour of Day
and develop a refined conceptual model of AN formation and loss
Particulate Nitrate
Conc
entr
atio
n (µ
g m
-3 )
[Prabhakar et al., ACP, 2017]
20
15
10
5
0 --1------r------r-----;-----.l ---
0 5 201 __ _ AVIS CIVIL AND ENVIRONMENTAL ENGINEERING & AQRC
47
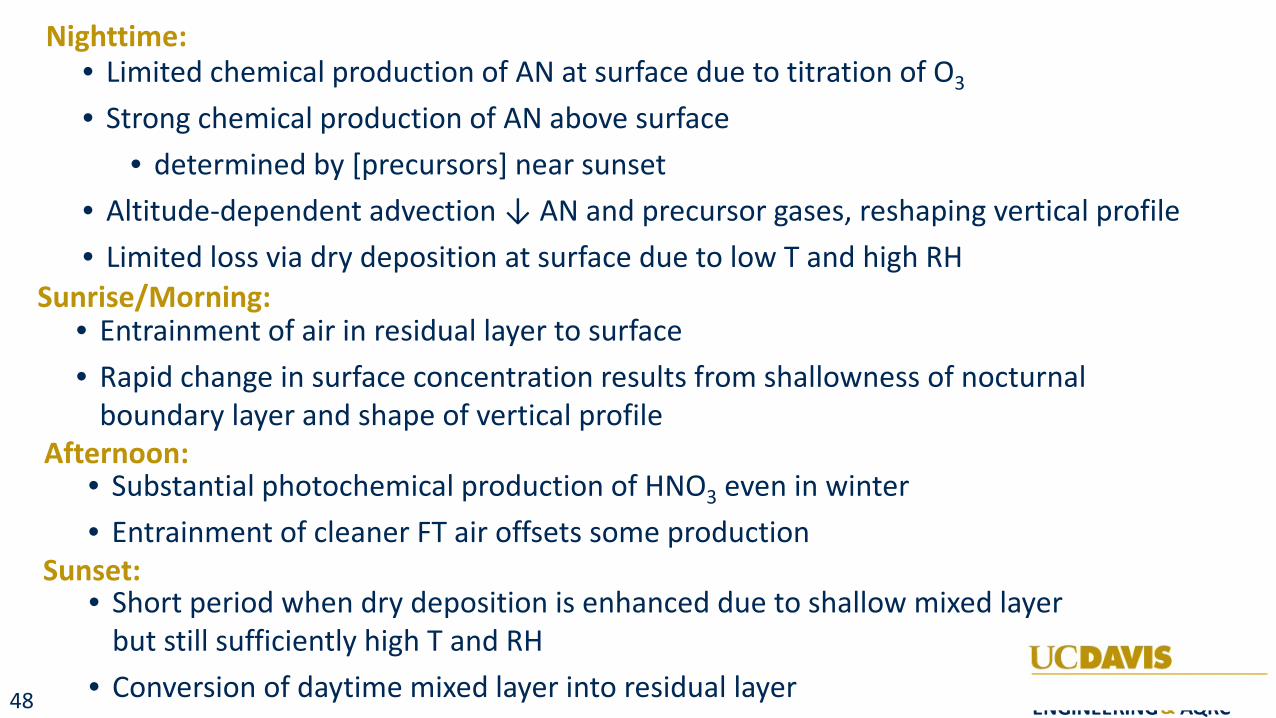
Nighttime:• Limited chemical production of AN at surface due to titration of O3
• Strong chemical production of AN above surface • determined by [precursors] near sunset
• Altitude-dependent advection ↓ AN and precursor gases, reshaping vertical profile
• Limited loss via dry deposition at surface due to low T and high RH Sunrise/Morning:
• Entrainment of air in residual layer to surface • Rapid change in surface concentration results from shallowness of nocturnal
boundary layer and shape of vertical profile Afternoon:
• Substantial photochemical production of HNO3 even in winter • Entrainment of cleaner FT air offsets some production
Sunset: • Short period when dry deposition is enhanced due to shallow mixed layer
but still sufficiently high T and RH • Conversion of daytime mixed layer into residual layer
UCDAYIS CIVIL AND ENVIRONMENTAL ENGINEERING & AQRC
48
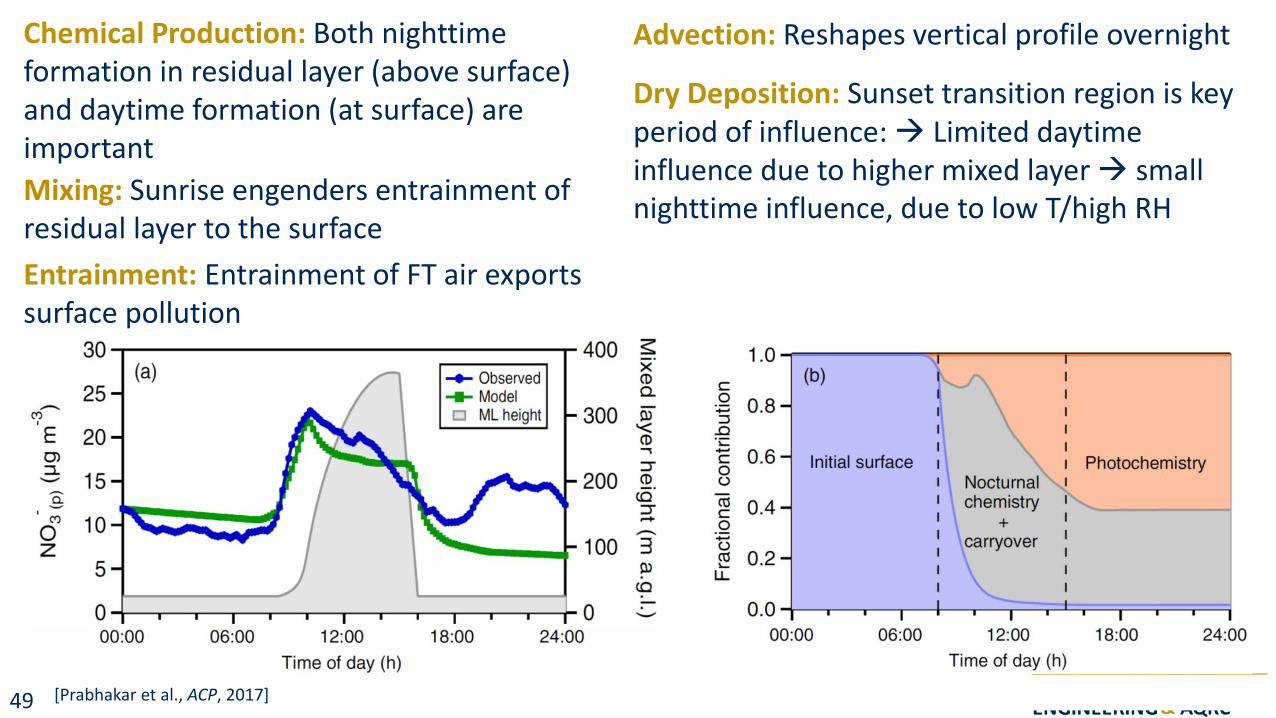
Chemical Production: Both nighttime formation in residual layer (above surface) and daytime formation (at surface) are important Mixing: Sunrise engenders entrainment of residual layer to the surface Entrainment: Entrainment of FT air exports surface pollution
Advection: Reshapes vertical profile overnight
Dry Deposition: Sunset transition region is key period of influence: Limited daytime influence due to higher mixed layer small nighttime influence, due to low T/high RH
30 400 s: 1.0 (a) -+- Observed
>< (b) (1)
25 --- Model Q. C 0 0.8 - D ML height 300 .....
C".) ll> I :J
E 20 '< .0 (1) .i::
0) "'"' ..... 0.6 C Initial surface Photochemistry ::i -=r- 0 __. 15 200 (1) (.) Nocturnal - co a. co 0.4 chemistry - -=r- C C".) 10 ,-+ 0 + 0 -100 3 ..... carryover z (.) co 0.2 5 ll> '--LL
co 0 0 - 0.0 __.
00:00 06:00 12:00 18:00 24:00 00:00 06:00 12:00 18:00 24:00
Time of day (h) Time of day (h)
CIVIL AND ENVIRONMENTAL ENGINEERING & AQRC
[Prabhakar et al., ACP, 2017] 49
25 (a)
.--.. 20 er)
I
E C) 15 --::::i.. ._...
---Cl. -(Y) 10
0 z
5
0 -----------------------------00:00 05:00 10:00 15:00 20:00
Hour of day (local)
30 (b) •
25
20
• • 15
10
5
o~----------------------' 1/15/2013 1/17/2013 1/19/2013 1/21 /2013
Time and date (local)
CIVIL AND ENVIRONMENTAL ENGINEERING & AQRC
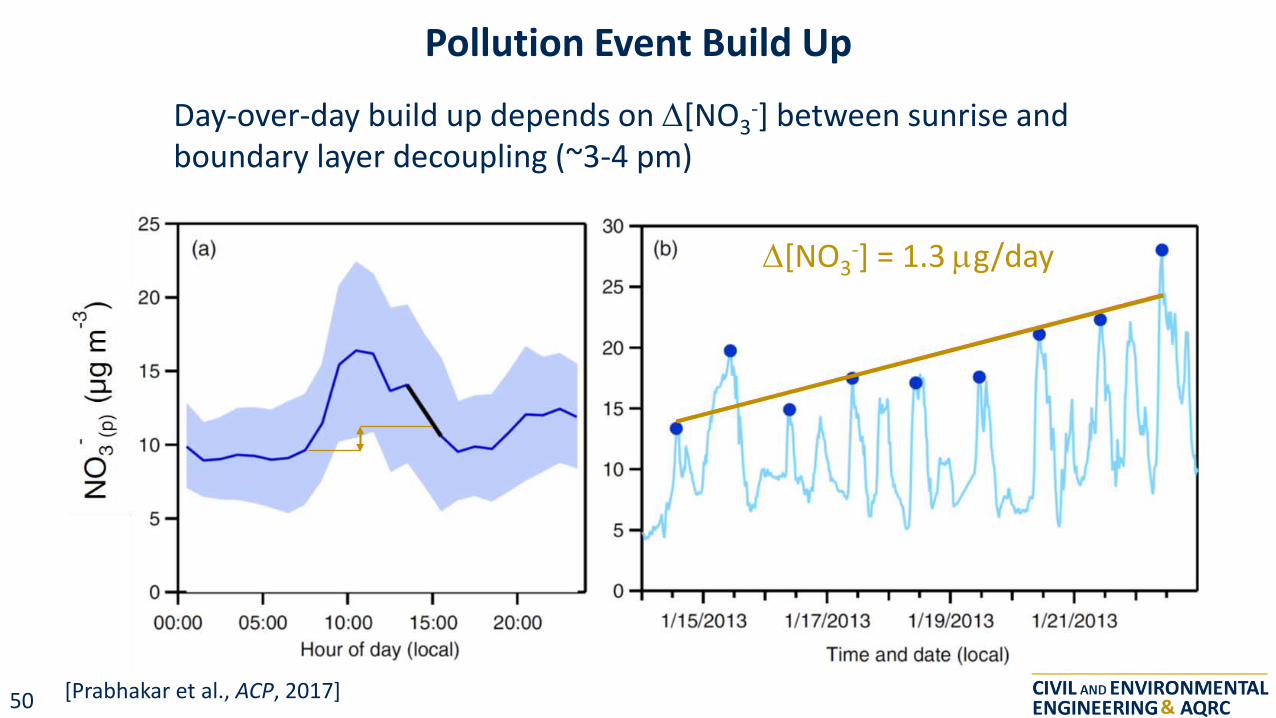
Pollution Event Build Up
Day-over-day build up depends on ∆[NO3-] between sunrise and
boundary layer decoupling (~3-4 pm)
∆[NO3-] = 1.3 µg/day
[Prabhakar et al., ACP, 2017] 50
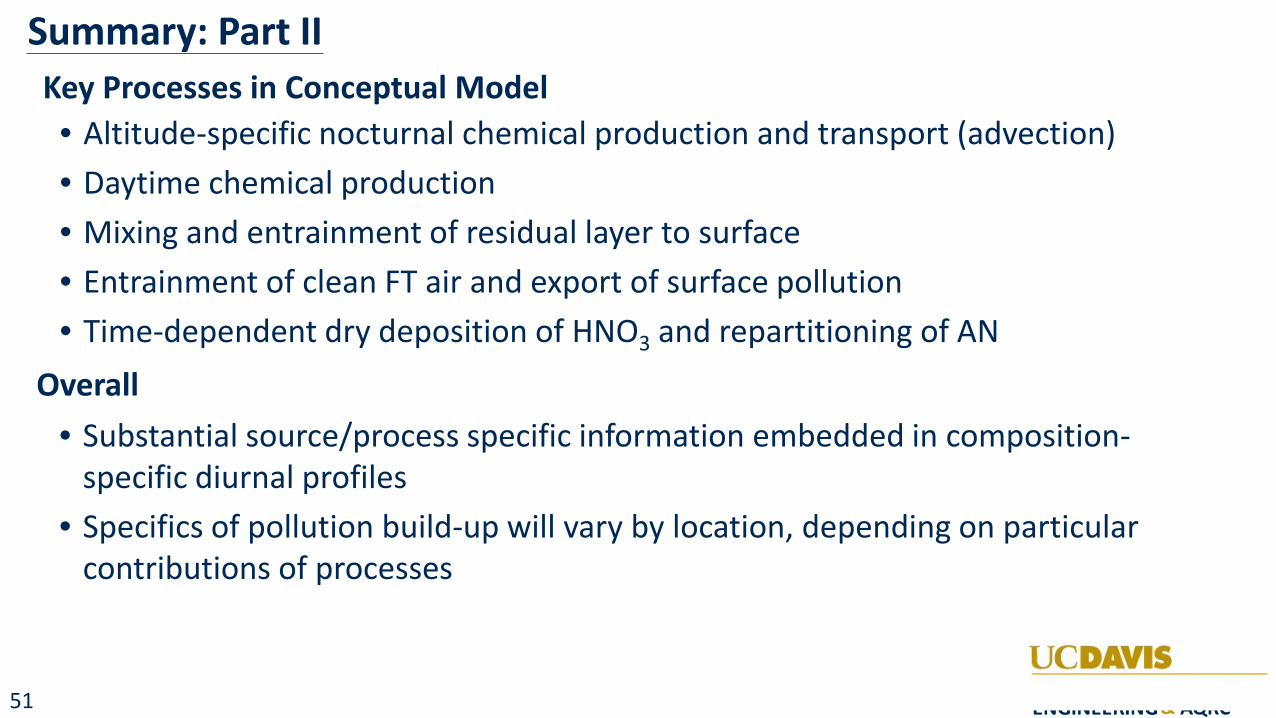
Summary: Part II Key Processes in Conceptual Model • Altitude-specific nocturnal chemical production and transport (advection) • Daytime chemical production • Mixing and entrainment of residual layer to surface • Entrainment of clean FT air and export of surface pollution • Time-dependent dry deposition of HNO3 and repartitioning of AN
Overall • Substantial source/process specific information embedded in composition-
specific diurnal profiles • Specifics of pollution build-up will vary by location, depending on particular
contributions of processes
UCDAYIS CIVIL AND ENVIRONMENTAL ENGINEERING & AQRC
51

Extra Slides
UCDAYIS CIVIL AND ENVIRONMENTAL ENGINEERING & AQRC 52
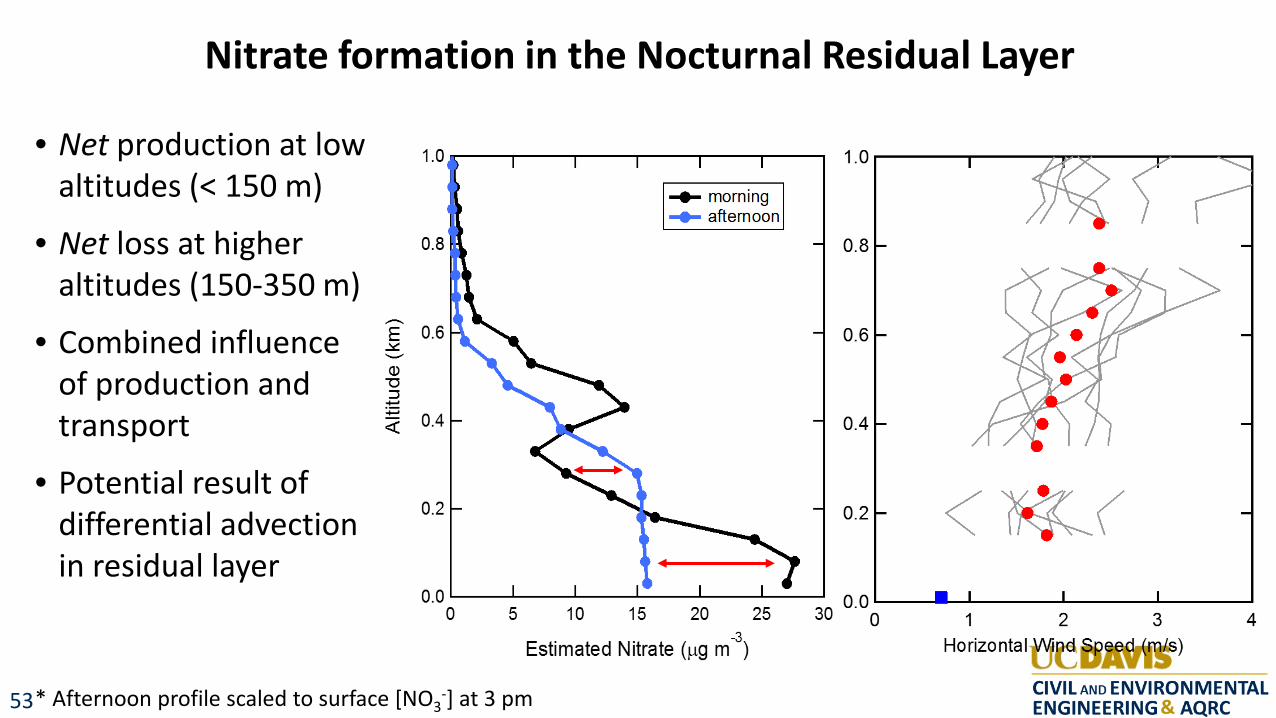
Nitrate formation in the Nocturnal Residual Layer
• Net production at low altitudes (< 150 m)
• Net loss at higher altitudes (150-350 m)
• Combined influence of production and transport
• Potential result of differential advection in residual layer
* Afternoon profile scaled to surface [NO3-] at 3 pm
-E ~ ---(]) ,::::, ::J
:!:: +-'
<{
1.0 - ----r---r------r---..-------
- morn ing - afternoon
0.8 0.8
0.6 0.6
0.4 0.4
0.2 0.2 < < 0.0 ----------------'-------J 0 0 o 5 1 o 15 20 25 30 · 0....._ _ ___ ---'-1 ---..L.2---....L3---...J4
Estimated Nitrate (µg m-3)
CIVIL AND ENVIRONMENTAL ENGINEERING & AQRC
53
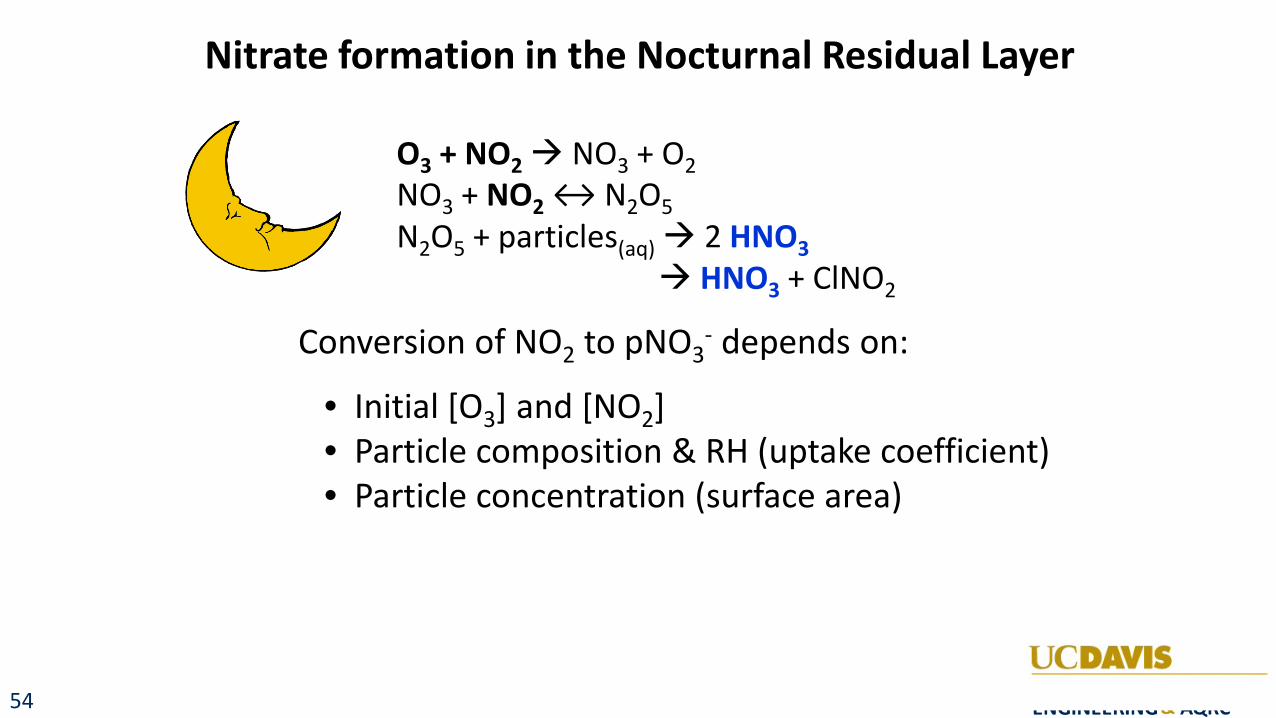
Nitrate formation in the Nocturnal Residual Layer
O3 + NO2 NO3 + O2 NO3 + NO2 ↔ N2O5 N2O5 + particles(aq) 2 HNO3
HNO3 + ClNO2
-Conversion of NO2 to pNO3 depends on:
• Initial [O3] and [NO2] • Particle composition & RH (uptake coefficient) • Particle concentration (surface area)
UCDAYIS CIVIL AND ENVIRONMENTAL ENGINEERING & AQRC
54
55
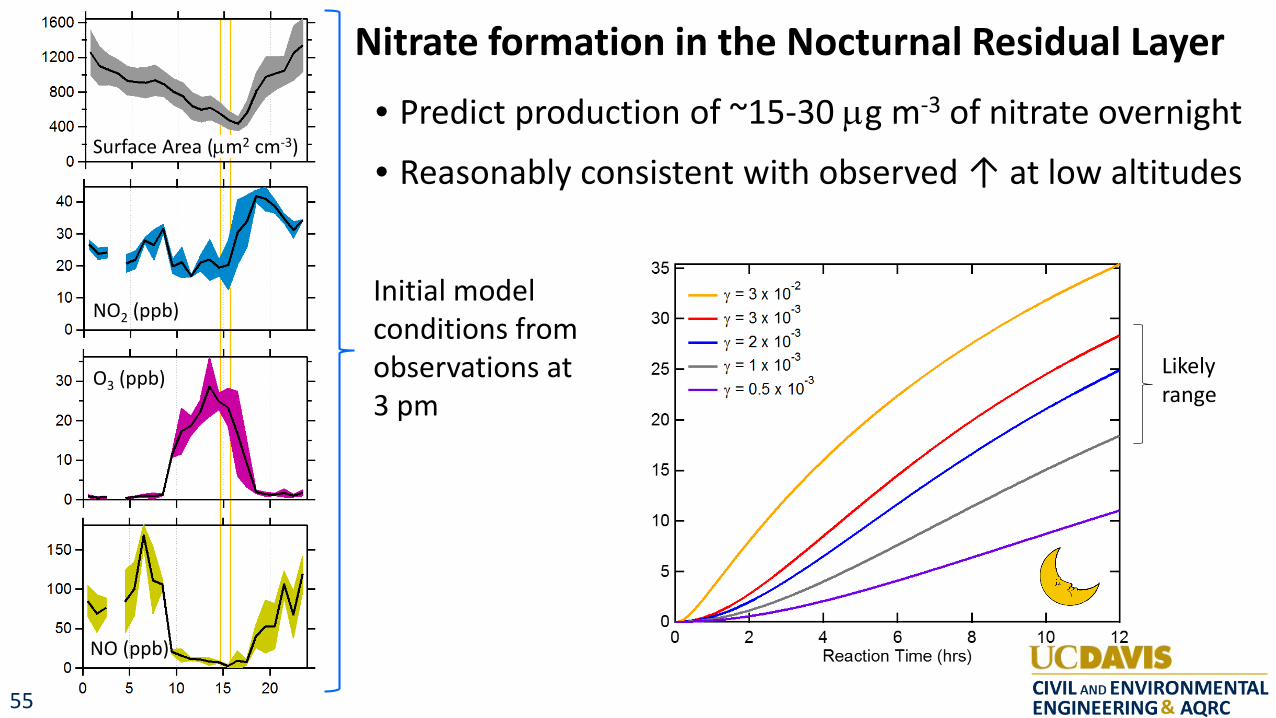
Nitrate formation in the Nocturnal Residual Layer
• Predict production of ~15-30 µg m-3 of nitrate overnight Surface Area (µm2 cm-3)
• Reasonably consistent with observed ↑ at low altitudes
Initial model NO2 (ppb)
conditions from Likely observations at O3 (ppb) range 3 pm
NO (ppb) O
vern
ight
Nitr
ate
Prod
uctio
n (µ
g m
-3 )
1600
1200
800
400
0
40
30
20
10
0
30
20
10
0
150
100
50
0 0 5 10 15 20
35
- y =3x 10 -2
30 - y =3x 10 -3
- y =2x 10 -3
-3 25 - y = 1 x 10
- y = 0.5 X 10
20
15
10
5
0 0 2
-3
4 6 8 Reaction Time (hrs)
10 12
UCDAYIS CIVIL AND ENVIRONMENTAL ENGINEERING & AQRC
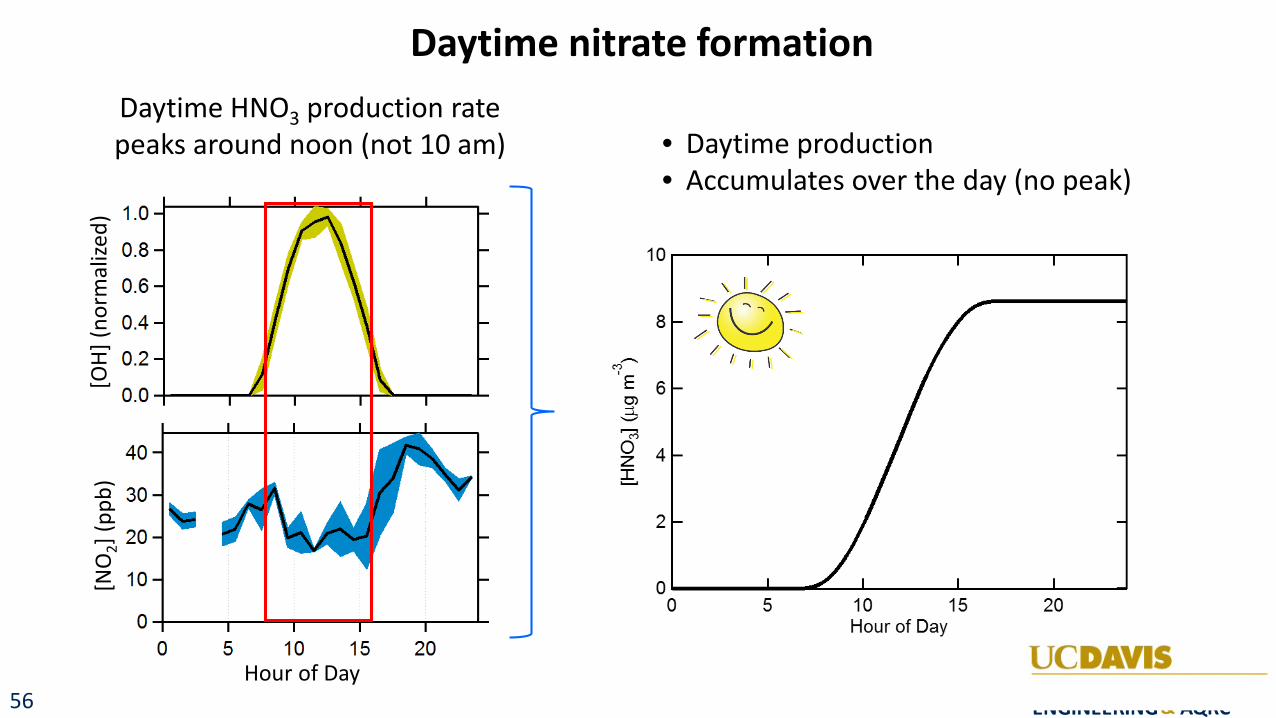
Daytime nitrate formation Daytime HNO3 production rate peaks around noon (not 10 am) • Daytime production
Hour of Day
[NO
2 ] (p
pb)
[OH]
(nor
mal
ized)
• Accumulates over the day (no peak) 1.0
0.8
0.6
0.4
0.2
0.0---'-----~ 1--~-~ r-=a----,r--_.._
40
30
20
10
0 -+------r--..---""T"'6------r----
0 5 10 15 20
10-------..--------r------,r-----,
C)
::i. ..._ ,.......
C")
0 4 z I ........
2
0 ____ ......__IIIE...._L.....-__ ___.__ __ ____,ji..,.._ __
0 5 10 15 Hour of Day
20
UCDAYIS CIVIL AND ENVIRONMENTAL ENGINEERING & AQRC
56
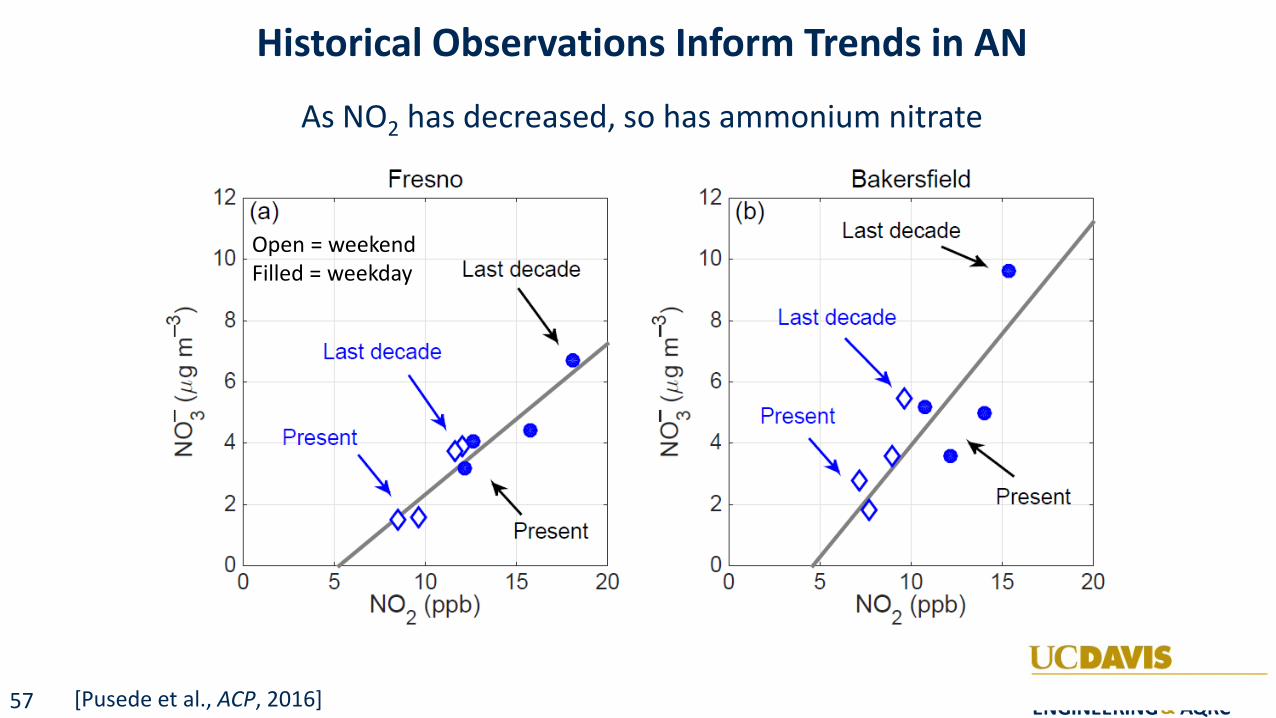
Historical Observations Inform Trends in AN
As NO2 has decreased, so has ammonium nitrate
Open = weekend Filled = weekday
[Pusede et al., ACP, 2016]
Fresno 12
(a)
10 Last decade
,,..__ 8 \ 7
E Last decade 0)
6 \ :j__ ---I (") 0 Present z 4
\ 2
., Present
0 0 5 10 15
N0,2 (ppb)
,,..__
7 E 0) :j__ ---I (") 0 z
20
12 (b)
10
8
Bakersfield
Last decade ~. Last decade
~ 6
4
2
◊ Present • •
\a,◊
a~-______._--~--~-~ 0 20
UCDAYIS CIVIL AND ENVIRONMENTAL ENGINEERING & AQRC
57
Bakersfield - 36 ~
a) '>-ro ,:,
('t') 30
I E 0) 24
..__ C
18 0 t,
Present :, ,:,
12 0 L
a. ('t')
◊ Next decade ·O 6 z
V I
00 z 5 10 15 20
N02 (ppb)
1- 36 (b) >-ro
""O 30 ('I')
I E rn 24 -C
18 0
u :J
""O 12 0 L
a. ('I')
0 6 z
'-.:t I
00 z
Bakersfield
I \
Next decade
5 10 N02 (ppb)
15 20
JCDAYIS CIVIL AND ENVIRONMENTAL ENGINEERING & AQRC
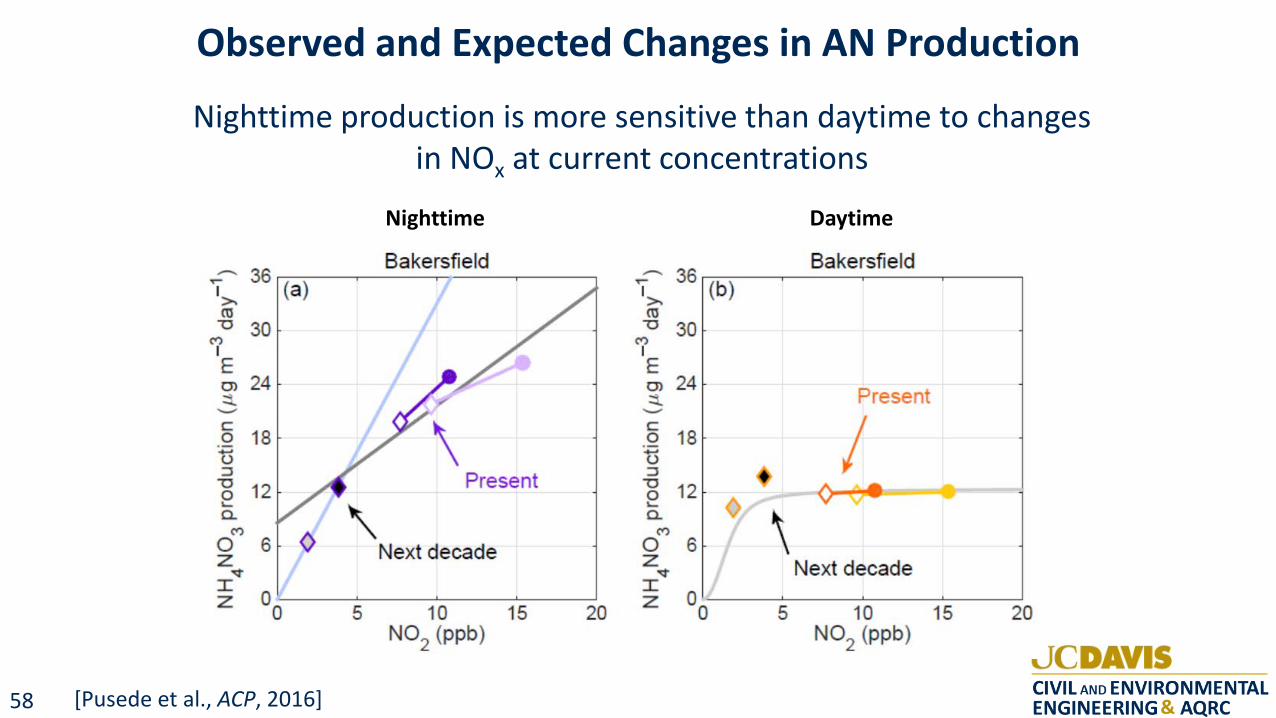
Observed and Expected Changes in AN Production
Nighttime production is more sensitive than daytime to changes in NOx at current concentrations
Nighttime Daytime
[Pusede et al., ACP, 2016] 58
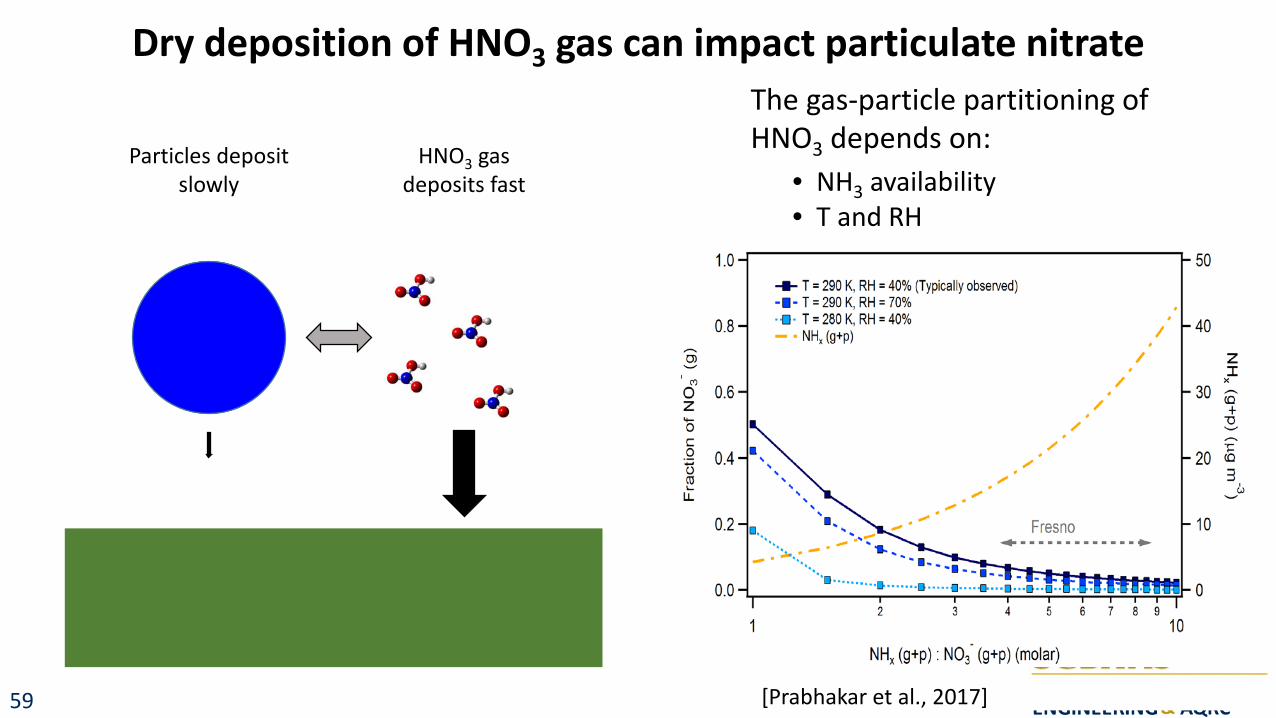
Dry deposition of HNO3 gas can impact particulate nitrate The gas-particle partitioning of HNO3 depends on:
Particles deposit HNO3 gas slowly deposits fast • NH3 availability
• T and RH 1.0
~ ~ 0.8 <==> ,-...
~ 0) '-"
<')
0 0.6 z ~
0
I C 0 0.4 ..., 0 ro I...
LL
0.2
0.0
50 -+- T = 290 K, RH = 40% (Typically observed) -■ - T = 290 K, RH = 70% • .. • T = 280 K, RH = 40% • 40 - ■ NHX (g+p) I
• I z
• I / X
• 30 -/ (0
+ • "O / -.....,
/ ,-...
1= • 20 (0 ' ,, .. .. • 3 ' ,;
' • l, .. ,,,. ....., ' ..
.. .,,,,.. .. _,,,,,,. ... .. Fresno 10 ·•. .. ,,, II._,- •-------------► -. :a. .. --... . . ...
1
0
10 NHx (g+p): N03. (g+p) (molar) - - ---- ---
CIVIL AND ENVIRONMENTAL ENGINEERING & AQRC
[Prabhakar et al., 2017] 59
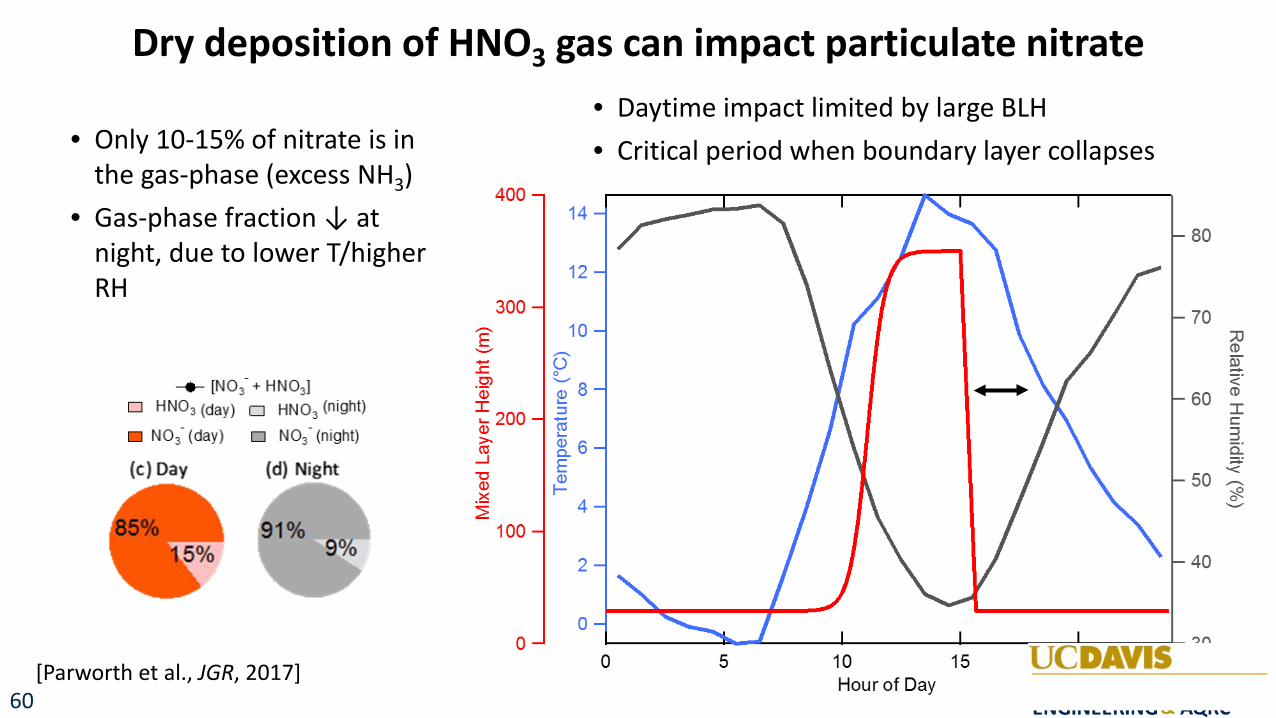
Dry deposition of HNO3 gas can impact particulate nitrate • Daytime impact limited by large BLH
• Only 10-15% of nitrate is in • Critical period when boundary layer collapses the gas-phase (excess NH3)
• Gas-phase fraction ↓ at night, due to lower T/higher RH
[Parworth et al., JGR, 2017]
300 -E ._, ..... ~
----- [N 0 3- + H N 0 3] .!2> Q)
HNO3 (day) HN 0 3 (night) =: 200 □ D
NO3- (night) Q) • NO3- (day) □ >-m
{d), I I ight ....J
(c) Day ""C Q)
-~ ~
91% 100 9%
0
14
12
10 -u 0 ._, Q) 8 I...
::J ..... m I...
~6 E Q)
I-4
2
0
0 5 10 Hour of Day
• -
15
80
70 ::0 CD D) -<" CD 60 I C:
3 a. ;::;:
50 -< -~ 0 ._,
40
CIVIL AND ENVIRONMENTAL ENGINEERING & AQRC
60
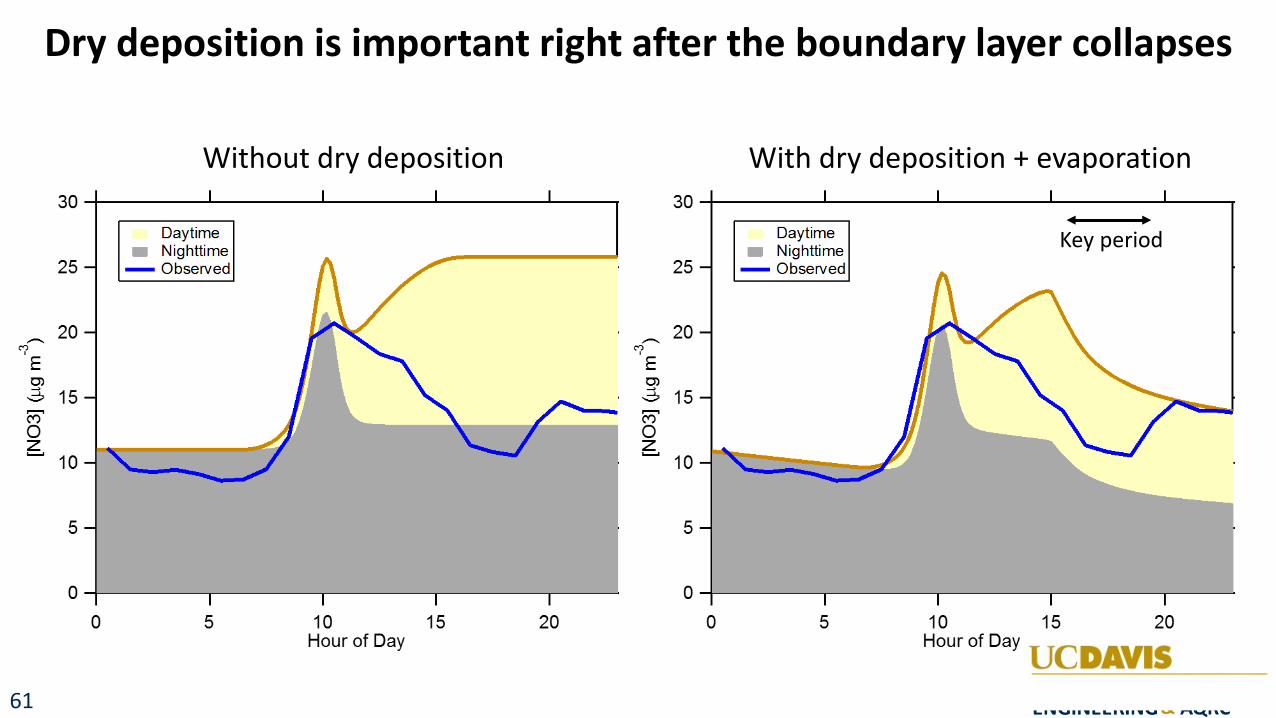
Dry deposition is important right after the boundary layer collapses
Without dry deposition With dry deposition + evaporation
-C') I
E C)
2, ,......., C'0 0 z ........
30------------------------
25
20
15
10
5
Daytime • Nighttime
- Observed
o-----~---~----~---~--__:.
0 5 10 15 20 Hour of Day
-C') I
E C)
2, ,......., C'0 0 z ........
30------------------------
25
20
15
10
5
Daytime • Nighttime
- Observed
o-----~---~----~---~----0 5 10 15 20
Hour of Day UCDAYIS CIVIL AND ENVIRONMENTAL ENGINEERING & AQRC
Key period
61
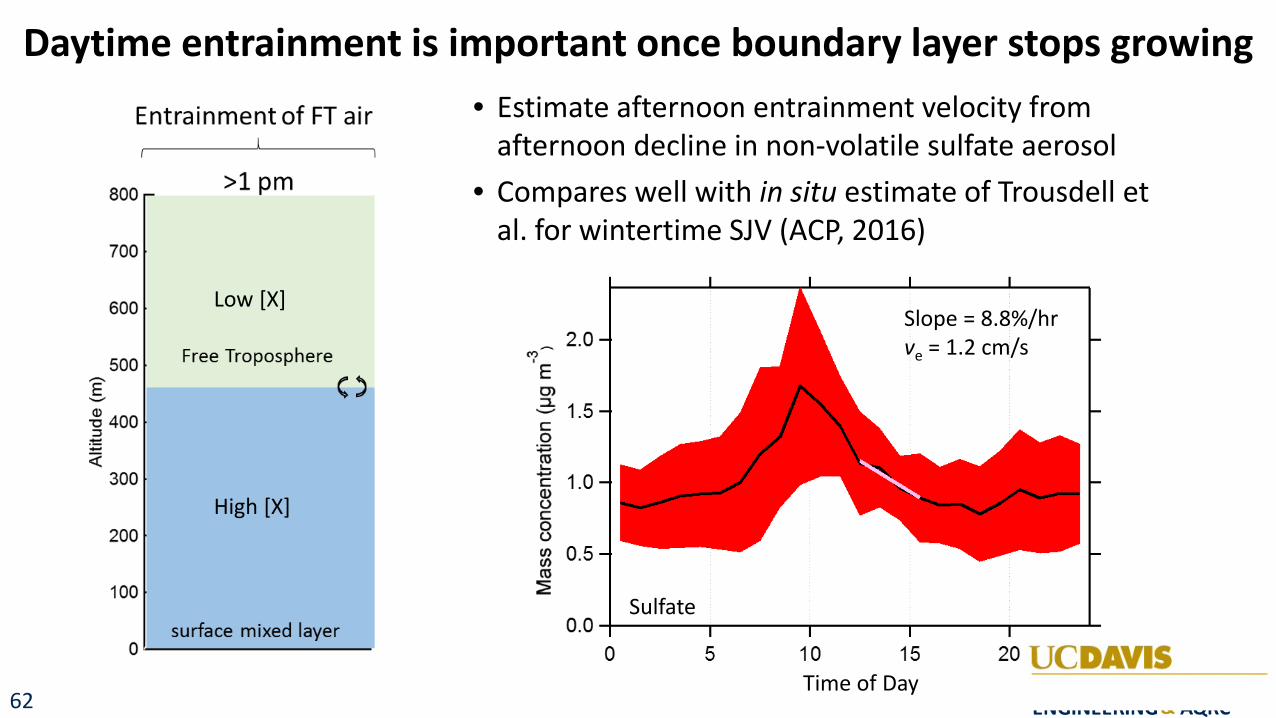
Daytime entrainment is important once boundary layer stops growing • Estimate afternoon entrainment velocity from
afternoon decline in non-volatile sulfate aerosol • Compares well with in situ estimate of Trousdell et
al. for wintertime SJV (ACP, 2016)
Low [X] Slope = 8.8%/hr ve = 1.2 cm/s
High [X]
Sulfate
Time of Day
Entrainment of FT air
800 >1 pm
700
600
2.0 -Free Troposphere M I 500 E - c, C) E 2: 1.5 --(1)
C: -c 400 0 :::,
:,.::::; :t::: - m <( '-- 1.0 300 C: Q) t) C: 0 200 t)
CJ) 0.5 CJ)
m 100 ~
surface mixed layer 0.0 0 0 5 10 15 2o ucDAYIS
CIVIL AND ENVIRONMENTAL ENGINEERING & AQRC
62
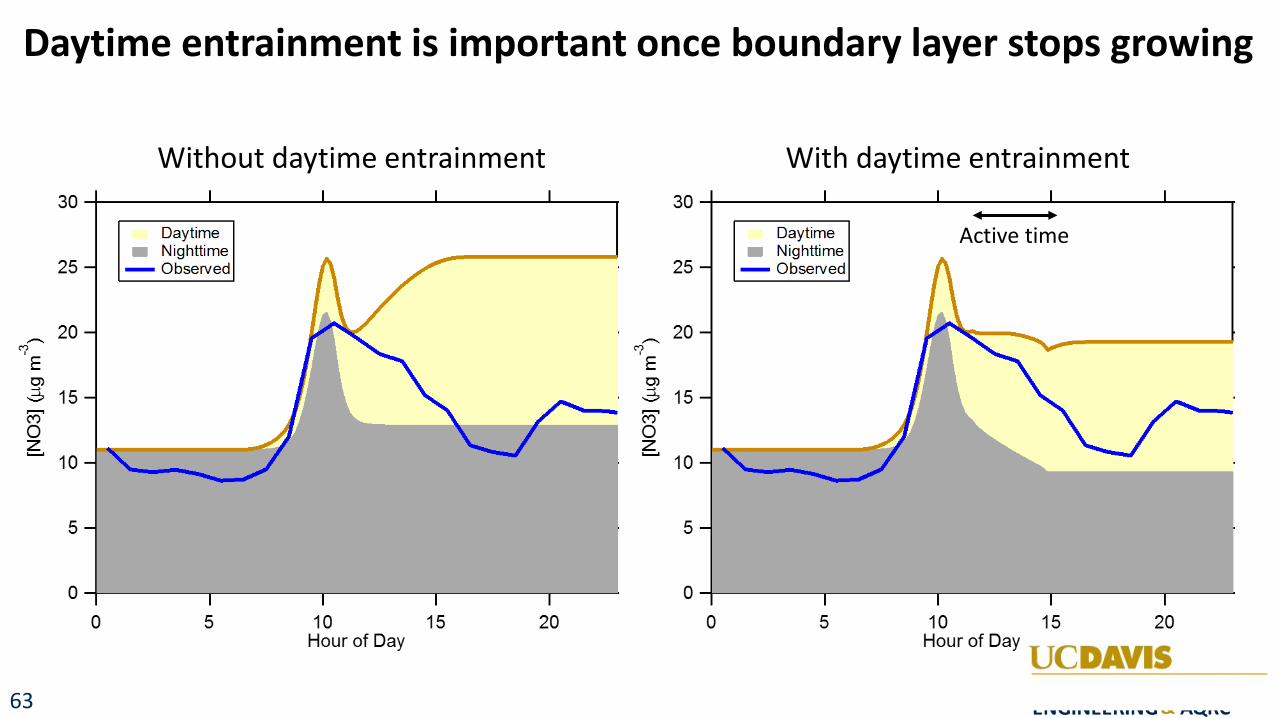
Daytime entrainment is important once boundary layer stops growing
Without daytime entrainment With daytime entrainment
-C') I
E C)
2, ,......., C'0 0 z ........
30------------------------
25
20
15
10
5
Daytime • Nighttime
- Observed
o-----~---~----~---~--__:.
0 5 10 15 20 Hour of Day
-C') I
E C)
2, ,......., C'0 0 z ........
30------------------------
25
20
15
10
5
Daytime • Nighttime
- Observed
o-----~---~----~---~----0 5 10 15 20
Hour of Day UCDAYIS CIVIL AND ENVIRONMENTAL ENGINEERING & AQRC
Active time
63
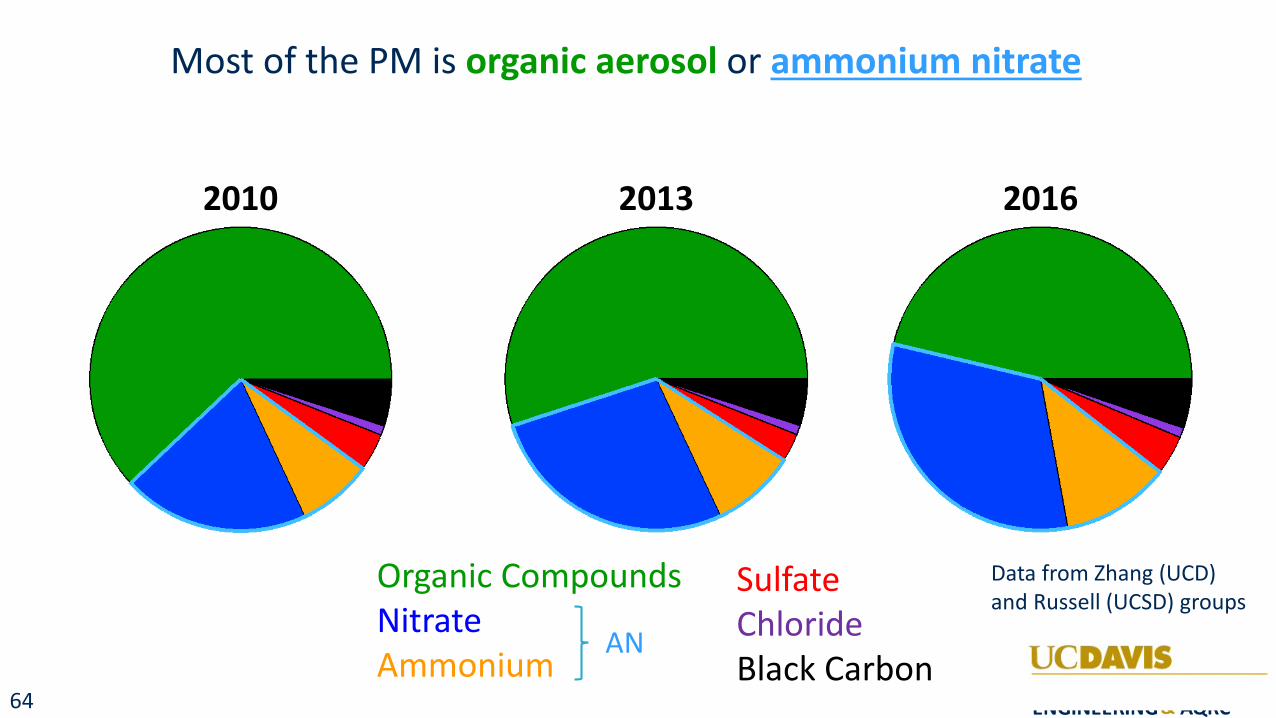
Most of the PM is organic aerosol or ammonium nitrate
2010 2013 2016
Organic Compounds Data from Zhang (UCD) Sulfate and Russell (UCSD) groups Nitrate Chloride AN
Ammonium Black Carbon } UCDAYIS CIVIL AND ENVIRONMENTAL ENGINEERING & AQRC
64