Embed Size (px)
Citation preview

Characterization of optically driven fluid stress fields with optical tweezers
Gregor Knöner, Simon Parkin, Norman R. Heckenberg, and Halina Rubinsztein-DunlopCentre for Biophotonics and Laser Science, School of Physical Sciences, The University of Queensland, St. Lucia QLD 4072, Australia
�Received 14 December 2004; revised manuscript received 29 July 2005; published 26 September 2005�
We present a controlled stress microviscometer with applications to complex fluids. It generates and mea-sures microscopic fluid velocity fields, based on dual beam optical tweezers. This allows an investigation ofbulk viscous properties and local inhomogeneities at the probe particle surface. The accuracy of the method isdemonstrated in water. In a complex fluid model �hyaluronic acid�, we observe a strong deviation of the flowfield from classical behavior. Knowledge of the deviation together with an optical torque measurement is usedto determine the bulk viscosity. Furthermore, we model the observed deviation and derive microscopicparameters.
DOI: 10.1103/PhysRevE.72.031507 PACS number�s�: 83.10.�y, 83.50.Lh, 83.80.Lz, 87.19.Tt
I. INTRODUCTION
The viscoelastic properties of liquids in biological sys-tems, e.g., blood, largely contribute to their biological func-tionality. Applied shear stress can trigger functional pro-cesses in cells such as signaling or adhesion �1�. The abilityto characterize these viscoelastic properties and to controlla-bly apply stress on a microscopic scale is of great interest asit can be used for diagnostics in medicine and will lead to abetter understanding of the functionality of biological sys-tems.
Microrheology, the measurement of the viscous and elas-tic modulus in microscopic volumes of fluid, has received alot of attention during the past decade. Most techniques arepassive and based on monitoring the Brownian motion ofprobe particles in the complex fluid. Dynamic light scattering�2�, laser deflection �3,4�, and video particle tracking �5�have been used to measure the mean square displacement��r2�t��, of probe particles and to calculate the complexshear modulus G*��� �6�. Complex fluids can exhibit localinhomogeneities of the size of the polymer correlation length�of order of 10−7 m�, e.g., depletion layers, causing singleparticle experiments to no longer reflect the bulk viscoelasticproperties. By measuring the correlated motion of a pair oftracer particles, the viscoelastic properties of the fluid can bederived without knowledge of the coupling between the trac-ers and the medium �7,8�.
Measurements of the Brownian motion of one �9� and thecorrelated motion of two particles �10� have also been per-formed in optical tweezers giving enhanced bandwidth. Al-though these techniques are very effective in accessingG*���, they are passive in the sense that they cannot applycontrolled stress to the polymer networks of complex fluidsor induce stress controlled functional processes in cellularstructures.
This limitation was overcome by using laser tweezers toactively rotate microscopic particles. Rotation has beenachieved by a transfer of angular momentum to birefringentcrystals �11,12�, to asymmetric shapes like rods and chromo-somes �13�, and by simultaneously transferring spin and or-bital angular momentum �14�. The use of spherical birefrin-gent crystals �vaterite� allows fast controlled rotation and a
simultaneous measurement of the stress strain relationship�15�. Strain rates of 2500 s−1 can be produced in the equato-rial plane on the surface of a vaterite rotating at 200 Hz.Measurement of the optical torque and the rotation frequencyyields the fluid viscosity. Although this works very well forNewtonian fluids, the technique will be affected by the localinhomogeneities in complex fluids and the coupling betweenrotating particle and fluid.
In this paper, we present first quantitative measurementsof the fluid velocity fields generated by optically driven mi-croscopic particles. In the same way the extension from oneparticle to two particle passive microrheology proved thatsingle particle measurements do not provide the bulk vis-coelastic moduli of complex fluids �7�, we show that themeasurement of the fluid velocity field is essential to applythe above described technique �15� to complex fluids. Theflow field measurement allows the characterization of thecoupling between rotating particle and fluid. In combinationwith torque measurements, our system performs as a con-trolled stress microviscometer which can be used in complexfluids. We can create and probe microscopic flows at highshear rates without the need for large support systems �e.g.,pumps�, microchannels or high concentrations of tracer par-ticles. We employ dual beam optical tweezers as a micro-scopic flow sensor to carry out microvelocimetry. We showthe validity of the method by measuring velocity profiles inwater using two experimental techniques. We show that atshear rates of 300 s−1, water exhibits the expected Newton-ian behavior without any slip on the particle surface. In con-trast, measurements on aqueous solutions of hyaluronic acid�HA� show a strong deviation from classical behavior, mostlikely due to the formation of a depletion layer. Subsequentoptical torque measurements allow the determination of thebulk viscosity and the estimation of the depletion layerwidth.
II. MICRORHEOLOGICAL TECHNIQUE
A. Flow field generation
The flow field is created by using optical tweezers to levi-tate and rotate a micron sized particle. We use spherical va-terite crystals, which are produced by precipitation in a pro-
PHYSICAL REVIEW E 72, 031507 �2005�
1539-3755/2005/72�3�/031507�7�/$23.00 ©2005 The American Physical Society031507-1

cedure described in Ref. �15�. The birefringence of vateriteallows the transfer of spin angular momentum from a circu-larly polarized laser beam to the particle which causes it torotate. The rotation speed can be controlled by changing ei-ther the ellipticity of the beam polarization or the incidentlaser power. The torque exerted on the particle by the fo-cussed laser beam is opposed by the drag torque of the sur-rounding fluid which depends on the fluid viscosity. Rotationrates of 400 Hz are achieved with 2 �m vaterite crystals andfew hundred mW of laser power.
B. Theory
A signal advantage of this method is that for a free rotat-ing sphere, classical hydrodynamic theory yields analytic so-lutions. Starting with the Navier-Stokes equation, simplifica-tions can be made assuming steady incompressible flow, azero body force and low Reynolds number ��10−3 in oursystem�. The flow velocity v is then described by the homog-enous Stokes equation
��2v = �p , �1�
where p is the pressure and � the dynamic viscosity. A ho-mogeneous particular solution of this problem in sphericalcoordinates is Lamb’s general solution �16�. Matching of theboundary conditions and assuming no slip at the particle sur-face leads to the solution
v = �ez � xa3
�x�3�2�
for a sphere of radius a rotating at angular frequency �. Thedirection of flow is always perpendicular to the plane con-taining the z axis �unit vector ez� and the coordinate vector x.The fluid velocity in the equatorial plane is proportional tothe reciprocal square of the distance from the sphere center.The drag torque is given by �z=−8�a3� and does, in con-trast to the velocity field in a homogeneous fluid, depend onthe fluid viscosity. We measure this velocity profile by opti-cal means and use it to identify any non-Newtonian behavior.
In inhomogeneous systems such as a high molecularweight polymer solution, hard wall interactions between col-loidal particles and polymer molecules cause a drop in poly-mer concentration close to the particle surface �17,18�. As aconsequence, the local viscosity near the surface is reduced.The width of this depletion layer is usually in the range ofthe polymer/macromolecular correlation length �8�.
In order to understand how this layer of reduced viscosityinfluences the rotation of a spherical particle when constanttorque is applied, we use a simple shell model. In this model,the viscosity drops from its bulk value �bulk to the local value�loc at a boundary layer which is located at a distance d fromthe particle surface. The velocity profile outside this bound-ary layer is described by Eq. �2�. If the particle is rotating atangular velocity �1 and the boundary layer at �2, then thevelocity profile in between is given by
vin�r� =R1
3R23
R23 − R1
3 � � 1
�r�3−
1
R23�1 � r
− 1
�r�3−
1
R13�2 � r� , �3�
where R1 is the particle radius and R2 the boundary layerradius �19�. From the velocity profile, we can calculate theviscous stress tensor �ik� =�loc��v /�r−v /r� at the sphere sur-face �r=R1�, which corresponds to the frictional force perunit area. The total torque �drag due to friction acting on therotating particle can be found by integration of �ik� in spheri-cal coordinates
�drag = 8�loc��2 − �1�R1
3R23
R23 − R1
3 . �4�
This drag torque equals the applied optical torque �o inthe case of a optically driven rotating particle and can bedirectly measured �15�. The above equation allows an esti-mation of the depletion layer width d=R2−R1 as will beshown later.
C. Measurement of flow field
We probe the flow by two methods, both employing 1 �mpolystyrene probe particles �Polysciences, Inc.� and fullysteerable dual beam optical tweezers �Fig. 1�. Trap one holdsand rotates the vaterite particle whereas trap two holds theprobe particle. The rotation frequency of the vaterite particleis measured in all experiments by detecting the linear polar-ized component of the forward scattered trapping beamwhich is modulated at twice the rotation frequency.
Method 1 measures the fluid velocity by monitoring theprobe particle displacement in the trap due to viscous drag.
FIG. 1. The dual optical tweezers are based on a fibre coupledNd:YAG laser. Its output is expanded and split into two beams �C1�,each individually steerable with a gimbal mounted mirror �M1 andM2�. A half wave plate in one arm and recombination by a 70/30non polarizing beamsplitter �C2� allows independent polarizationcontrol. A detection laser �HeNe� and quadrant photodetector�QPD� are used to monitor probe particle deflection. The vateriterotation frequency is measured by a linear polarizer �pol.� and pho-todetector �PD�.
KNÖNER et al. PHYSICAL REVIEW E 72, 031507 �2005�
031507-2

Motion of the probe particle deflects the beam of a separatedetection laser �HeNe� which is registered with a quadrantphotodetector �QPD�. The signal is directly calibrated againstmovement with known velocity of the piezo actuated micro-scope stage. This method is especially useful as it does notrequire knowledge of the fluid viscosity and trap stiffnessand can therefore be used with unknown liquids. The cali-bration curve of the detector signal to the fluid velocity doesdepend on the coupling between the probe particle and thefluid. Calibration is carried out directly before each experi-ment in the fluid that is to be probed, so the coupling isidentical in an actual experiment. Therefore, the calibrationtakes the coupling already into account, and our measure-ments are not affected by any inhomogeneous effects close tothe surface of the probe particle.
The sensitivity of the system can be increased by decreas-ing the trap stiffness and measurement of fluid speeds below50 �m/s �corresponding to 450 fN for 1 �m probe in water�is possible. For enhanced precision and elimination of signaldrift, the difference in probe displacement between rotatingvaterite �flow� and stationary vaterite �no flow� is measured.The probe particle deflection is sampled at 2 kHz for 5 s atdistances in the range of 1 to 18 �m.
Method 2 uses the dual trap to bring a probe particle tothe desired distance from the rotating vaterite. The probe trapis switched off and due to the low Reynolds number, theprobe particle instantly moves with the fluid flow. The probeparticle can encircle the vaterite on a more or less stable orbit�depending on distance� for up to 6 times without a notice-able change in its vertical �z� position. Radial diffusion cancause a probe particle to explore the flow at various distancesfrom the vaterite. The motion of the probe in the flow field istracked by video microscopy and the flow velocities evalu-ated �Fig. 2�.
III. RESULTS AND DISCUSSION
A. Flow field in water
The validity of both methods was established by makingmeasurements in pure water. Figure 2�b� shows data col-lected for a vaterite particle with a radius of 2.6 �m rotatingat 25.2 Hz using method 1. To correct for slight changes inrotation frequency �Fig. 2�a�� due to the manual adjustmentof the polarization of the vaterite trapping beam, frequencynormalized velocities are plotted. The least squares fit of Eq.�2� to the data agrees very well with the theoretical curveexpected from particle rotation rate and size specified above.
Using video microscopy and particle tracking �method 2�,the velocity profile in Fig. 2�c� was obtained for a vateriteparticle with a radius of 1.8 �m rotating at 13.4 Hz. Theagreement between curve fit and theoretical curve is againvery good. Measurements using both methods were carriedout a number of times using different sized particles andalways yielded very good agreement.
Influence of the probe particle and boundaries. Bothmethods for measuring the fluid velocity field employ aprobe particle which disturbs the flow field. In method 1, theprobe is stationary and expected to cause larger disturbancecompared to method 2, where the probe moves freely with
the flow. Quantification of the flow disturbance was the mainreason for using these two methods with different degree offlow disturbance.
In method 2, the probe moves freely with the flow. Dis-turbance arises from the existing fluid velocity gradient,causing streamlines on the side of the probe facing the rotat-ing vaterite to move faster than the streamlines on the oppo-site side. This shear will cause the probe particle to rotatethereby minimizing the disturbance. For a linear gradient, the
FIG. 2. �a� The vaterite rotation frequency does not depend onits distance to the probe particle. Fluctuations are due to the manualadjustment of the wave plate to obtain circular polarized light. �b�Velocity profile of a r=2.6 �m vaterite rotating at 25.2 Hz �see �a��measured with method 1 �circles�. Model �solid curve� and fit of thedata �dotted� agree very well. The inset shows the position signal ofthe probe particle with rotation turned on/off. �c� Velocity profile ofa r=1.8 �m vaterite rotating at 13.4 Hz measured with method 2�video tracking�. Again, very good agreement between model andcurve fit are obtained. The inset shows a frame from a video track-ing experiment �contrast enhanced for demonstration�.
CHARACTERIZATION OF OPTICALLY DRIVEN FLUID… PHYSICAL REVIEW E 72, 031507 �2005�
031507-3

probe will move with the velocity of the streamline throughits center. This approximation is certainly valid for probepositions further away from the rotating vaterite. Closer tothe vaterite, the nonlinear gradient will cause the probe tomove at the speed of a streamline off its center. Nevertheless,this deviation is negligible compared to the error in the de-termination of the probe particle position of ±0.11 �m. Toshow the validity of these assumptions, we have fitted ourmodel to the datapoints in Fig. 2�c� with a distance d�5 �m and d 7 �m. The fit for the distant datapoints de-viates by −1.0% from the expected curve whereas the fit forthe close points deviates by −6.0%. Both fits are within thecombined error of 3% of the expected curve and of 3% of thedatapoints. The deviation at closer distances may result fromhigher scattering of the data and the reduced statistics of bothfits. A noticeable increase in the drag experienced by therotating vaterite is not expected in this method and has notbeen observed, as the flow is not restricted.
This is different in method 1, where the probe is heldstationary and presents a resistance to the fluid flow. Therotating vaterite experiences this resistance as an increasedviscosity. Since we are applying constant torque, this resultsin a decrease in rotation frequency. By looking at the rotationfrequencies in Fig. 2�a�, we find a decrease of only 5.1% forthe closest particles. From these measurements, we estimatea maximum increase in viscosity of 5.4% experienced by therotating vaterite due to the resistance of the probe at theclosest position. A theoretical estimation of this effect is anontrivial problem and exceeds the scope of the paper. Sincethe increase in resistance becomes negligible at large dis-tances of the probe to the vaterite, we again looked at curvefits to datapoints with a vaterite-probe distance d�5 �m andd 7 �m. We find deviations from the model of −8.6 and−1.0 %, respectively. The slightly larger deviation of closepoints may result from the effectively increased viscosity.
Comparing both methods, we note that although distur-bance of the fluid flow is much higher in method 1, the effecton our measurements is smaller than 9% for measurementstaken very close to the crystal and negligible at greater dis-tances. Both methods yield good results for the measurementof velocity fields, and very good results if measurements aretaken at larger distances �e.g., 6 �m�. It is therefore con-cluded that both techniques are valid for determining veloc-ity profiles on a microscopic scale.
Changing the polarization in trap 1, which is used to turnvaterite rotation on and off, does not influence the probeparticle position. This was confirmed for various distanceswithout a vaterite in the trap. Furthermore, we found that thecoupling between the rotating vaterite and the medium �wa-ter� does fulfil the no slip boundary condition. The maximumobserved shear rate of 300 s−1 did not induce slip.
Further flow disturbance may result from wall effects. Wehave quantified wall effects for rotating crystals by applyingconstant torque and measuring the change of rotation ratewith wall-surface distance. Vertical walls show an effect at adistance of 1 particle diameter, whereas horizontal walls�e.g., coverslip or slide� show an effect only when the crystalis almost touching the wall. This is due to the fluid velocities,which are very small above and below the poles of the par-ticle, and higher near the equator. Theoretical calculations
show that the drag correction factor for a vertical wall dropsto 1.01 at a distance of 1.1 particle diameters �20�, and it willbe much smaller for a horizontal wall. We conduct our ex-periments deep inside the sample, at least 6 particle diam-eters �i.e., 30 �m� away from horizontal walls �microscopeslide and cover glass�, and millimeters away from any verti-cal walls, hereby making any wall effects negligible.
B. Flow field in HA solution
An interesting application of flow field measurements isto test if the use of a vaterite particle as a viscosity probe isaffected by a non-Newtonian environment. We measured ve-locity profiles in hyaluronic acid �HA�. HA is a linear anionicpolysaccharide. The viscoelastic properties of solutions inwater strongly depend on the molecular HA concentration�21�. For our measurements, we added vaterite and probeparticles to a solution of 1.5 g/ l HA �rooster comb, 1.5�106 Da average molecular weight� in phosphate bufferedsaline �PBS�.
The velocity profiles obtained from this solution showclearly a deviation from the behavior of Newtonian fluids.Vaterite particles in the size range of 3–4 �m were rotatingat 3–5 Hz, considerably slower than in water �approx.30 Hz�. The generated fluid flow around the particle was onaverage 24% lower than expected from the model parameters�Fig. 3�. This deviation is significant and much larger thanthe error in the expected profile �3%�. A fit to the pointswhich are more than 7 �m away from the rotating vateriteshows a similar deviation of 25%. At those larger distances,the probe does not disturb the flow, which shows that thedeviation is indeed a physical effect and not caused by anyhydrodynamic interaction between probe and rotating vater-ite.
To interpret these results, we have to consider variouseffects which could create such a deviation of the measuredvelocity profiles in a polymer solution. The effects we haveto consider are the interaction of the rotating particle with the
FIG. 3. The fluid velocity profile of a vaterite particle doesdeviate by more than 24% from the expected profile, which is cal-culated from the particle size r=1.77 �m and the rotation fre-quency f =3.3 Hz. The y axis is normalized by the frequency. Thisdeviation was observed in a number of experiments.
KNÖNER et al. PHYSICAL REVIEW E 72, 031507 �2005�
031507-4
solvent, the interaction with the polymer molecules, and achange in the local rheology of the solution. The couplingbetween the particle and the solvent, i.e., water, has beeninvestigated in the previous section and did not show anyslip. Shear induced slip can therefore not be responsible forthe observed effect. In contrast to passive microrheologicaltechniques, we induce stress, which could alter the rheologi-cal properties of the polymer solution locally by shear thin-ning. Shear thinning is caused by shear stress leading to mo-lecular alignment and deformation of the polymer. Thereduction in viscosity by shear thinning is highest at highshear rates and high polymer concentrations. The dilute con-centration of HA employed in our experiments does not ex-hibit shear thinning below shear rates of 100 s−1 �21,22�. Inour experiment, high shear rates only occur in the equatorialregion on the surface of the rotating particle and are stillbelow the limit for shear thinning �Fig. 4�. This stronglysuggests that shear thinning does not occur in our experi-
ments and is not responsible for the observed deviation ofthe velocity profile.
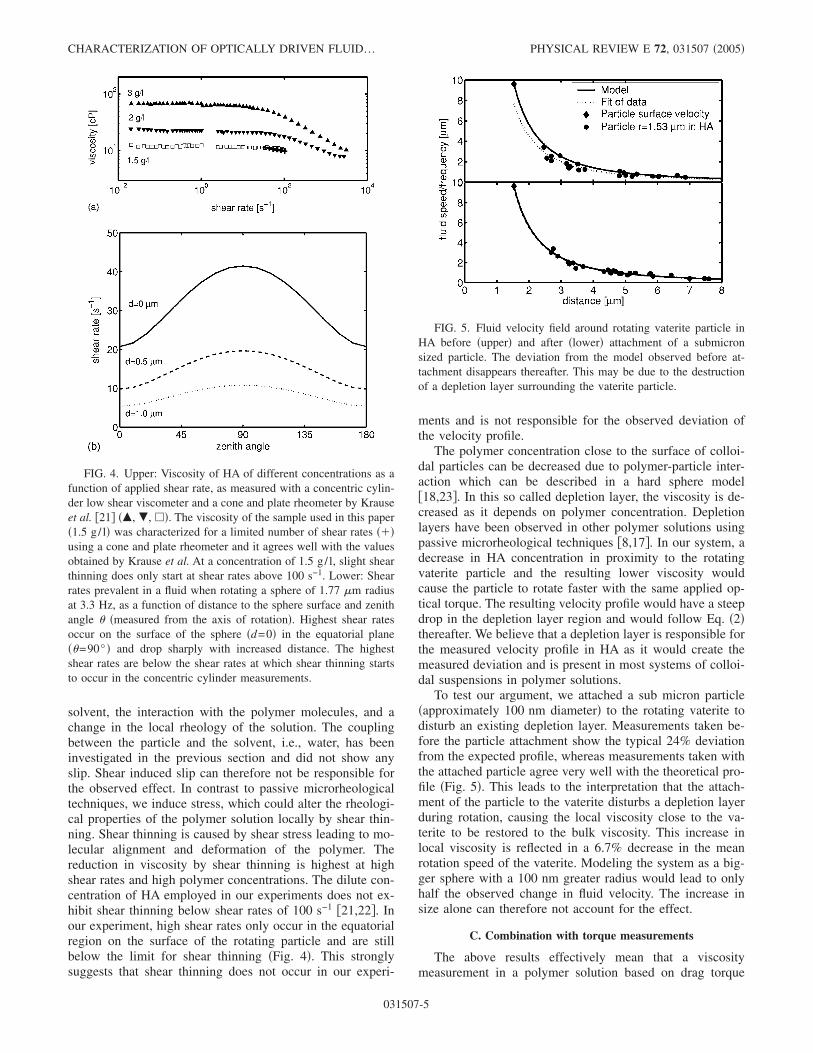
The polymer concentration close to the surface of colloi-dal particles can be decreased due to polymer-particle inter-action which can be described in a hard sphere model�18,23�. In this so called depletion layer, the viscosity is de-creased as it depends on polymer concentration. Depletionlayers have been observed in other polymer solutions usingpassive microrheological techniques �8,17�. In our system, adecrease in HA concentration in proximity to the rotatingvaterite particle and the resulting lower viscosity wouldcause the particle to rotate faster with the same applied op-tical torque. The resulting velocity profile would have a steepdrop in the depletion layer region and would follow Eq. �2�thereafter. We believe that a depletion layer is responsible forthe measured velocity profile in HA as it would create themeasured deviation and is present in most systems of colloi-dal suspensions in polymer solutions.
To test our argument, we attached a sub micron particle�approximately 100 nm diameter� to the rotating vaterite todisturb an existing depletion layer. Measurements taken be-fore the particle attachment show the typical 24% deviationfrom the expected profile, whereas measurements taken withthe attached particle agree very well with the theoretical pro-file �Fig. 5�. This leads to the interpretation that the attach-ment of the particle to the vaterite disturbs a depletion layerduring rotation, causing the local viscosity close to the va-terite to be restored to the bulk viscosity. This increase inlocal viscosity is reflected in a 6.7% decrease in the meanrotation speed of the vaterite. Modeling the system as a big-ger sphere with a 100 nm greater radius would lead to onlyhalf the observed change in fluid velocity. The increase insize alone can therefore not account for the effect.
C. Combination with torque measurements
The above results effectively mean that a viscositymeasurement in a polymer solution based on drag torque
FIG. 4. Upper: Viscosity of HA of different concentrations as afunction of applied shear rate, as measured with a concentric cylin-der low shear viscometer and a cone and plate rheometer by Krauseet al. �21� ��, �, ��. The viscosity of the sample used in this paper�1.5 g/ l� was characterized for a limited number of shear rates ���using a cone and plate rheometer and it agrees well with the valuesobtained by Krause et al. At a concentration of 1.5 g/ l, slight shearthinning does only start at shear rates above 100 s−1. Lower: Shearrates prevalent in a fluid when rotating a sphere of 1.77 �m radiusat 3.3 Hz, as a function of distance to the sphere surface and zenithangle � �measured from the axis of rotation�. Highest shear ratesoccur on the surface of the sphere �d=0� in the equatorial plane��=90° � and drop sharply with increased distance. The highestshear rates are below the shear rates at which shear thinning startsto occur in the concentric cylinder measurements.
FIG. 5. Fluid velocity field around rotating vaterite particle inHA before �upper� and after �lower� attachment of a submicronsized particle. The deviation from the model observed before at-tachment disappears thereafter. This may be due to the destructionof a depletion layer surrounding the vaterite particle.
CHARACTERIZATION OF OPTICALLY DRIVEN FLUID… PHYSICAL REVIEW E 72, 031507 �2005�
031507-5

would underestimate the fluid viscosity by a factor F deter-mined by the discrepancy between model and measured ve-locity profile. Using a particle of the same size rotating at thesame frequency as in Fig. 3, we measured the optically ap-plied torque in a similar HA solution �method in Ref. �15��.By equating optical torque and drag torque, we found a vis-cosity of �7.9±0.5� cP. From Fig. 3, we extract a correctionfactor F=0.72±0.02, yielding a corrected viscosity of�11.0±0.9� cP, which agrees well with �=12 cP found in theliterature �21�.
The above torque measurement can be used to derive mi-croscopic parameters of the depletion layer according to Eq.�4�. Rearrangement of the equation yields
R23 =
R13
1 − 8��2 − �1��locR13�o
−1 �5�
for the boundary layer width R2. Taking the particle fromFig. 3, a rotation frequency of �1=2�3.3 Hz and an opti-cally applied torque of 2.34�10−17 Nm is measured. By ex-trapolation of the measured velocity field using the fittedcurve �Fig. 3�, we can estimate the rotation frequency of theboundary layer �2=2�2.1 Hz. Assuming a viscosity in thedepletion layer between that of the solvent ��loc=1 cP� and athird of the bulk ��loc=4 cP�, a depletion layer width d=R2
−R1 of 26 to 95 nm is found, respectively. It has been shownthat the depletion layer width is often in the order of thepolymer correlation length �8,18�. In a 1.5 mg/ml solutionof HA, the correlation length is =100 nm �24� and is com-parable to our depletion layer width if we use the upper valueof �loc. Physically, we expect the local viscosity to decreasecontinuously toward the particle surface. The depletion layerwidth is then defined at the half value of the bulk viscosity.
Although we can not yet exactly determine the depletionlayer width, the above considerations clearly show that adepletion layer model can reproduce the measured velocityprofiles with model parameters lying in the expected range.
IV. CONCLUSIONS
We have used two methods to precisely measure fluidvelocity fields in microscopic volumes. We showed that arotating micron sized particle in water creates a flow fieldthat is expected from classical hydrodynamic theory. Othermethods have been used to create microscopic flow fields�25,26�, and our technique could be used to characterizethese. In a polymer solution, we find that the flow field lieson average 24% under the profile expected from theory. Weattribute that to a layer around the rotating particle in whichthe polymer concentration is depleted. A simple shell modelis used to explain the observed velocity profile yielding adepletion layer width of the expected magnitude.
The combination of the technique with optical torquemeasurements allows us to measure steady state viscositiesin polymer solutions at controlled shear rates. This corre-sponds to the passive technique of two-point microrheology.Theoretical calculations show that one-point microrheologyof a semidilute polymer solution measures a viscosity of73% of the actual bulk value �18�. We find that measuringonly the optical torque gives a similar underestimation of thebulk viscosity �76% of the bulk on average�, whereas thecombined measurement �fluid velocity and torque� yieldscorrect values. These experiments were carried out at lowshear rates to avoid shear thinning of the polymer solution.In future experiments, we will increase the shear rate and usethe measurement of the fluid velocity field to investigate theshear rate dependence of the viscosity.
�1� O. Dwir, A. Solomon, S. Mangan, G. S. Kansas, U. S.Schwarz, and R. Alon, J. Cell Biol. 163, 649 �2003�.
�2� T. G. Mason and D. A. Weitz, Phys. Rev. Lett. 74, 1250�1995�.
�3� T. G. Mason, K. Ganesan, J. H. van Zanten, D. Wirtz, and S.C. Kuo, Phys. Rev. Lett. 79, 3282 �1997�.
�4� F. Gittes, B. Schnurr, P. D. Olmsted, F. C. MacKintosh, and C.F. Schmidt, Phys. Rev. Lett. 79, 3286 �1997�.
�5� J. C. Crocker and D. G. Grier, J. Colloid Interface Sci. 179,298 �1996�.
�6� T. G. Mason, Rheol. Acta 39, 371 �2000�.�7� J. C. Crocker, M. T. Valentine, E. R. Weeks, T. Gisler, P. D.
Kaplan, A. G. Yodh, and D. A. Weitz, Phys. Rev. Lett. 85, 888�2000�.
�8� D. T. Chen, E. R. Weeks, J. C. Crocker, M. F. Islam, R. Verma,J. Gruber, A. J. Levine, T. C. Lubensky, and A. G. Yodh, Phys.Rev. Lett. 90, 108301 �2003�.
�9� K. M. Addas, C. F. Schmidt, and J. X. Tang, Phys. Rev. E 70,021503 �2004�.
�10� L. Starrs and P. Bartlett, Faraday Discuss. 123, 323 �2003�.�11� M. E. J. Friese, T. A. Nieminen, N. R. Heckenberg, and H.
Rubinsztein-Dunlop, Nature �London� 394, 348 �1998�.
�12� A. La Porta and M. D. Wang, Phys. Rev. Lett. 92, 190801�2004�.
�13� L. Paterson, M. MacDonald, J. Arlt, W. Sibbett, P. Bryant, andK. Dholakia, Science 292, 912 �2001�.
�14� V. Garces-Chavez, D. McGloin, M. J. Padgett, W. Dultz, H.Schmitzer, and K. Dholakia, Phys. Rev. Lett. 91, 093602�2003�.
�15� A. I. Bishop, T. A. Nieminen, N. R. Heckenberg, and H.Rubinsztein-Dunlop, Phys. Rev. Lett. 92, 198104 �2004�.
�16� S. Kim and S. J. Karrila, Microhydrodynamics �Butterworth-Heinemann, Stoneham, MA, 1991�.
�17� R. Verma, J. C. Crocker, T. C. Lubensky, and A. G. Yodh,Phys. Rev. Lett. 81, 4004 �1998�.
�18� A. J. Levine and T. C. Lubensky, Phys. Rev. E 65, 011501�2001�.
�19� L. Landau and E. Lifshitz, Fluid Mechanics �Pergamon Press,Oxford, England, 1987�.
�20� M. Chaoui and F. Feuillebois, Q. J. Mech. Appl. Math. 56, 381�2003�.
�21� W. E. Krause, E. G. Bellomo, and R. H. Colby, Biomacromol-ecules 2, 65 �2001�.
�22� E. Fouissac, M. Milas, and M. Rinaudo, Macromolecules 26,
KNÖNER et al. PHYSICAL REVIEW E 72, 031507 �2005�
031507-6

6945 �1993�.�23� E. Eisenriegler, A. Hanke, and S. Dietrich, Phys. Rev. E 54,
1134 �1996�.�24� P. Gribbon, B. C. Heng, and T. E. Hardingham, Biophys. J. 77,
2210 �1999�.�25� K. Ladavac and D. G. Grier, Opt. Express 12, 1144 �2004�.�26� L. Paterson, M. P. MacDonald, J. Arlt, W. Dultz, H. Schmitzer,
W. Sibbett, and K. Dholakia, J. Mod. Opt. 50, 1591 �2003�.
CHARACTERIZATION OF OPTICALLY DRIVEN FLUID… PHYSICAL REVIEW E 72, 031507 �2005�
031507-7


![Motion analysis of optically trapped particles and cells ... · As optical tweezers and counterpropagating optical traps are gradually becoming standard techniques [1, 2], reliable](https://img.pdfslide.us/doc/110x75/5facac574ee7c7326c17e31a/motion-analysis-of-optically-trapped-particles-and-cells-as-optical-tweezers.jpg)