Embed Size (px)
Citation preview
Characterization of nutrient profiles from legume seeds
by
Han Yang
A thesis submitted in partial fulfillment of the requirements for the degree of
Master of Science
in
Plant Science
Department of Agricultural, Food and Nutritional Science
University of Alberta
© Han Yang, 2014

ii
Abstract
The overall goal of this research was to characterize components of legume
seeds, and determine if specific seed components have potential functional
properties for practical end-uses. The polymeric flavonoids proanthocyanidins
(PA), also known as condensed tannins, accumulate in the seed coats of specific
grain legume cultivars. In this study, the PA type found in pea seed coats (Pisum
sativum L.) of ‘Solido’ was confirmed, and PA-enriched seed coat fractions and
their flavan-3-ol subunits were investigated for antibacterial activity against food
pathogens. Antimicrobial activity was influenced by the number of hydroxyl
substitutions on the flavonoid aromatic B-ring. Our data suggest that at least part
of the antimicrobial activity of flavan-3-ols and PAs involves their capacity to
bind iron. Additionally, the fibre, protein and starch content of seeds from specific
cultivars of the grain legumes pea (Pisum sativum L.), faba bean (Vicia faba L.),
and lentil (Lens culinaris L.), were determined to further understand the health-
beneficial effects of legume seed consumption in the diet. The amount and type of
fibre in the legume seed coats is discussed with specific relevance to the potential
to ameliorate symptoms of type 2 diabetes.

iii
Preface
In chapter 2 of this thesis, the extraction and processing procedures to obtain
the crude proanthocyanidins extract were performed by Dr. Lihua Jin, University
of Alberta. In Chapter 3 of this thesis, the pea seed coats fractions were prepared
with the assistance of Dr. Lihua Jin. These fractions were provided to our
collaborator Dr. Catherine Chan (human nutrition lab at Department of
Agricultural, Food and Nutritional Science, University of Alberta) to test for their
effects on amelioration of type 2 diabetes in a diabetic rat model. The
performance of all other experiments and the data analysis in chapter 2 and
chapter 3 are my original work, as well as the literature review in chapter 1.

iv
Acknowledgement
I would like to thank Dr. Jocelyn Ozga for giving me the opportunity of being
her graduate student. I could not finish this thesis without her supervision and
support. She is not only my academic mentor but also a warm friend in my life. I
also would like to thank Dr. Michael Gaenzle and Dr. Stephen Strelkov for
serving as my committee members, and giving me valuable comments and
directions on my research projects. I want to thank Dr. Lihua Jin for her
suggestions with the flavonoids research; and Dr. Kelvin Lien for his advice on
gas chromatography analysis. I also want to thank current and past lab members,
the friendship will always be here. Moreover, I would like to thank the graduate
students in AFNS who have helped me doing my experiments.
Last but not least, I would like to thank my family. My parents’ love is the
most important support during my study. Although they may not understand even
one paragraph of my thesis, I cannot even write one word without them. I thank
them for travelling thousand miles to help me taking care of my daughter, I
cannot finish my work without their dedication. I want to thank my husband
Zeyuan Li for his sacrifice and support for my graduate study. My daughter’s
birth on 2012 was the biggest change in my life. Every time when I was upset, her
sweet smile was the best encouragement and made me optimistic.

v
Table of Contents
List of figures......................................................................................................viii
List of tables..........................................................................................................ix
List of Abbreviations.............................................................................................x
Chapter 1 Literature review ............................................................................. 1
Flavonoid classification............................................................................ 1
Proanthocyanidins ........................................................................ 2
Flavonoid biosynthetic pathway ............................................................... 4
Biosynthesis of proanthocyanidins ................................................ 6
Proanthocyanidins chemical analysis........................................................ 8
Antimicrobial activity of flavonoids compounds .................................... 10
Antimicrobial activity of gallotannins, proanthocyanidins and
flavan-3-ols ................................................................................ 12
Carbohydrates classification ................................................................... 15
Polysaccharides ......................................................................... 16
Polysaccharides in human nutrition ........................................................ 25
Starches ...................................................................................... 25
Non-starch polysaccharides (NSP) ............................................. 25
Determination of non-starch polysaccharides (NSPs) content ................. 26
Determination of starch content .............................................................. 27
Determination of protein content ............................................................ 28
Legume seeds ........................................................................................ 29
Thesis goal ............................................................................................. 29

vi
Chapter 2 Characterization and antimicrobial activity of proanthocyanidins
from ‘Solido’ pea seed coats ............................................................................ 31
Introduction ........................................................................................... 31
Materials and methods ........................................................................... 32
Plant material ............................................................................. 32
Chemicals ................................................................................... 32
Extraction and purification of proanthocyanidins ........................ 32
Phloroglucinolysis and HPLC quantification of proanthocyanidin
subunits ...................................................................................... 35
Strains and culture conditions ..................................................... 36
MIC assays of proanthocyanidin fractions and flavan-3-ols ........ 36
Results and Discussion ........................................................................... 37
Phloroglucinolysis and HPLC quantification of proanthocyanidin
subunits from ‘Solido’ seed coats ............................................... 37
Antibacterial activity of pea PA-extracts and flavan-3-ols
monomers ................................................................................... 40
Chapter 3 Protein, starch and fibre components of pea (Pisum sativum L),
faba bean (Vicia faba L) and lentil (Lens culinaris L) seeds grown in western
Canada ............................................................................................................. 45
Introduction ........................................................................................... 45
Materials and Methods ........................................................................... 45
Plant Materials ........................................................................... 45
Chemicals ................................................................................... 46
Cooked and hydrolyzed seed coats preparation ........................... 46
Determination of protein content ................................................ 46
vii
Determination of total and resistant starch content ...................... 47
Determination of non starch polysaccharides content .................. 49
Results and discussion............................................................................ 53
Protein, starch and fibre components in seeds of different cultivars
of ................................................................................................ 53
lentil, faba bean and pea. ............................................................ 53
Fibre components of embryos and seed coats of different cultivars
of pea, faba bean and lentil. ........................................................ 59
Chapter 4 Summary and conclusion ............................................................... 80
References ........................................................................................................ 84
viii
List of figures
Figure 1.1 Basic flavonoid structure and several flavonoid subclasses as
designated by ring C .. ......................................................................................... 1
Figure 1.2 Chemical structures of common flavan-3-ols ...................................... 3
Figure 1.3 Structure of B-type and A-type proanthocyanidins. ............................. 4
Figure 1.4 Formation of flavanone from phenylalanine ........................................ 5
Figure 1.5 Formation of proanthocyanidins from flavanone ................................. 7
Figure 1.6 Phloroglucinolysis reaction leading to free terminal unit flavan-3-ol
and extension unit phloroglucinol adduct. .......................................................... 10
Figure 1.7 A simple comparison of Gram-positive and Gram-negative bacteria
cell wall structure. ............................................................................................. 11
Figure 1.8 Gallotannin and proanthocyanidin structures ..................................... 13
Figure 1.9 Examples of the structures of monosaccharides, disaccharides and
trisaccharide ...................................................................................................... 16
Figure 1.10 Starch structures showing-1,4 (amylose) and1,6 (amylopectin)
glycosidic linkages ........................................................................................... 18
Figure 1.11 Non-starch polysaccharides (NSP) -linkage .................................. 19
Figure 1.12 Cellulose structure showing1,4 glycosidic linkages .................... 20
Figure 1.13 Classification of NSP . .................................................................... 20
Figure 1.14 Structure of a fucogalacto-xyloglucan. ............................................ 22
Figure 1.15 Structure of a glucuronoarabinoxylans. ........................................... 23
Figure 1.16 Structure of a pectin polymer from lupins ....................................... 24
Figure 1.17 Total starch analysis principle. ........................................................ 28
Figure 2.1 Extraction and purification of PAs from ‘Solido’ seed coats.............. 34
Figure 3.1 Analysis procedure for non-starch polysaccharides (NSP) ................. 52

ix
List of tables
Table 2.1 Summary of pea (‘Solido’) seed coat PA subunit composition following
phloroglucinolysis and RP-HPLC-DAD analysis. .............................................. 39
Table 2.2 MICs of flavan-3-ols monomers and PAs enriched extract ................. 42
Table 3.1 Protein, total starch and resistant starch profiles in seeds of different
cultivars of lentil, faba bean and pea. ................................................................. 55
Table 3.2 Total fibre, insoluble fibre and soluble fibre content of seed coats and
embryos from the seeds of various cultivars of lentil, faba bean and pea. ........... 57
Table 3.3 Total fibre, insoluble fibre and soluble fibre content of whole seeds of
various cultivars of lentil, faba bean and pea ...................................................... 58
Table 3.4 Fibre components of pea embryos by GC analysis .............................. 60
Table 3.5 Fibre components of pea seed coats by GC analysis ........................... 64
Table 3.6 Comparison of data for the composition sugar components ................ 65
Table 3.7 Fibre components of faba bean seed embryos by GC analysis. ........... 66
Table 3.8 Fibre components of faba bean seed coats by GC analysis. ................. 69
Table 3.9 Fibre components of lentil seed embryos by GC analysis. .................. 71
Table 3.10 Fibre components of lentil seed coats by GC analysis. ...................... 74
Table 3.11 Protein and total starch components of raw, cooked and hydrolyzed
pea seed coats of ‘Solido’ and ‘Canstar’ ............................................................ 75
Table 3.12 Sugar components of raw, cooked and hydrolyzed seed coats of
‘Canstar’ by GC analysis ................................................................................... 77
Table 3.13 Sugar components of raw, cooked and hydrolyzed seed coats of
‘Solido’ by GC analysis ..................................................................................... 78
x
List of abbreviations
4CL 4-coumarate-CoA ligase
ANR Anthocyanidin reductase
ANS Anthocyanidin synthase
Ara Arabinose
C Catechin
C4H Cinnamate 4-hydroxylase
CHI Chalcone isomerase
CHS Chalcone synthase
CoA Coenzyme A
C-P Catechin-(4α→2)-phloroglucinol
DAD Photodiode array detector
DFR Dihydroflavonol 4-reductase
DW Dry weight
EC Epicatechin
EC-P Epicatechin-(4β→2)-phloroglucinol
EDTA Ethylenediaminetetraacetic acid
EGC-P Epigallocatechin-(4β→2)-phloroglucinol
EGC Epigallocatechin
F3H (or FHT) Flavanone 3-hydroxylase
F3'H Flavonoid 3' hydroxylase
F3'5'H Flavonoid 3'5' hydroxylase
FLS Flavanone synthase
FNS Flavone Synthase
Fuc Fucose
Gal Galactose
GC Gallocatechin
GC-P Gallocatechin-(4α→2)-phloroglucinol
Glc Glucose

xi
GlcA Glucuronic acid
HPLC High performance liquid chromatography
LAR Leucoanthocyanidin reductase
LLE Liquid-liquid extraction
mDP Mean degree of polymerization
MIC Minimal inhibition concentration
nm Nano meter
PA Proanthocyanidin
PAL Phenylalanine ammonia-lyase
PPO Polyphenol oxidase
Rha Rhamnose
RP-HPLC Reversed phase HPLC
SPE Solid phase extraction
TFA Trifluoroacetic acid
λ wavelength
Xyl Xylose

1
Chapter 1 Literature review
Flavonoid classification
Flavonoids are plant secondary metabolites that serve a variety of functions.
The flavonoid biosynthesis pathway produces various distinct groups of
flavonoids that can accumulate in plant cells such as anthocyanins,
proanthocyanidins (PAs), and flavonols. The basic flavonoid skeleton consists of
three rings: two benzene rings (ring A and B) and one pyran ring (ring C). The
structural differences of the flavonoid family of compounds are based on the
saturation of the heteroatomic ring C; the attachment of the ring B at the carbon-2
or carbon-3 position in the ring C; the overall hydroxylation pattern, and the
multiple substituents conjugated to the aromatic ring (monomers, oligomers or
polymers) (Figure 1.1) (Grotewold, 1995).
O
O
A C
2
3
456
78 B
Flavonoid skeleton
O
OH
O
Flavonol
O
O
Flavanones
O
OH
Anthocyanidins
O
O
Isoflavanones
+
C C C C
Figure 1.1 Basic flavonoid structure and several flavonoid subclasses as
designated by ring C (Grotewold, 1995).

2
Flavonoids are involved in specific plant-pathogenic microbe interactions
(phytoalexins, such as isoflavonoids in plants belonging to the Leguminosae
family) (Koes 1994). Flavonoids also function as plant defense compounds to
protect the plant against herbivore and microbial attack (Dixon et al., 2005; Ayres
et al., 1997). Green tea flavanols (catechins) are well-known for their
antimicrobial activity (Taylor et al., 2005). It has also been reported that
anthocyanins from red wine are related to a lower risk of cardiovascular disease
and cancer chemoprevention due to the anthocyanins’ antioxidation and
anticarcinogenesis activities (Hou, 2004). These potential properties make
flavonoids a target for application in plant protection and for health-beneficial
food ingredients.
Proanthocyanidins
The oligomeric or polymeric flavonoids proanthocyanidins (PAs), also
known as condensed tannins, accumulate in the seed coats of specific cultivars of
grain legumes including pea (Pisum sativum L.), lentil (Lens culinaris L.), and
faba bean (Vicia faba L.) (Duenas et al., 2003; Duenas et al., 2004; Jin et al.,
2012). PAs in legume seed coats can also be visually confirmed by the brown
color which is a result of enzymatic browning of PAs caused by polyphenol
oxidase (PPO). In the presence of oxygen, PPO catalyses the oxidation of
diphenols (B ring of PAs) to semiquinones and quinones. Semiquinones and
quinones are highly active and can react with phenols, amino acid and proteins
from plant tissues to produce complex brown polymeric compounds (Grotewold E,
2005; Pourcel et al., 2007). PAs can function to protect plants against microbial
pathogens. The proposed mechanisms of action for PAs antimicrobial activity
include the effects of iron depletion, inhibition of cell-associated proteolysis and
cell wall synthesis (Buzzini et al., 2007). PAs are hypothesized to act as digestion
inhibitors or toxins to deter large herbivores (Ayres et al., 1997). PAs can also
interact with the proteins in the mouth giving an astringent flavor; this could be
the reason why PAs are unpopular for human consumption (Ariga et al., 1981).
3
Moreover, PAs also have been reported to have human-health beneficial effects,
such as antioxidant (Amarowicz et al., 2000) and radical scavenging activities
(Gaulejac et al., 1999; Santos-Buelga
et al., 2000). Since PAs have shown some
interesting bioactivities, and some legume seed coats contain high PA levels,
understanding the PA profile in legume seeds will aid in our understanding of
health benefits of human consumption of these legume seeds.
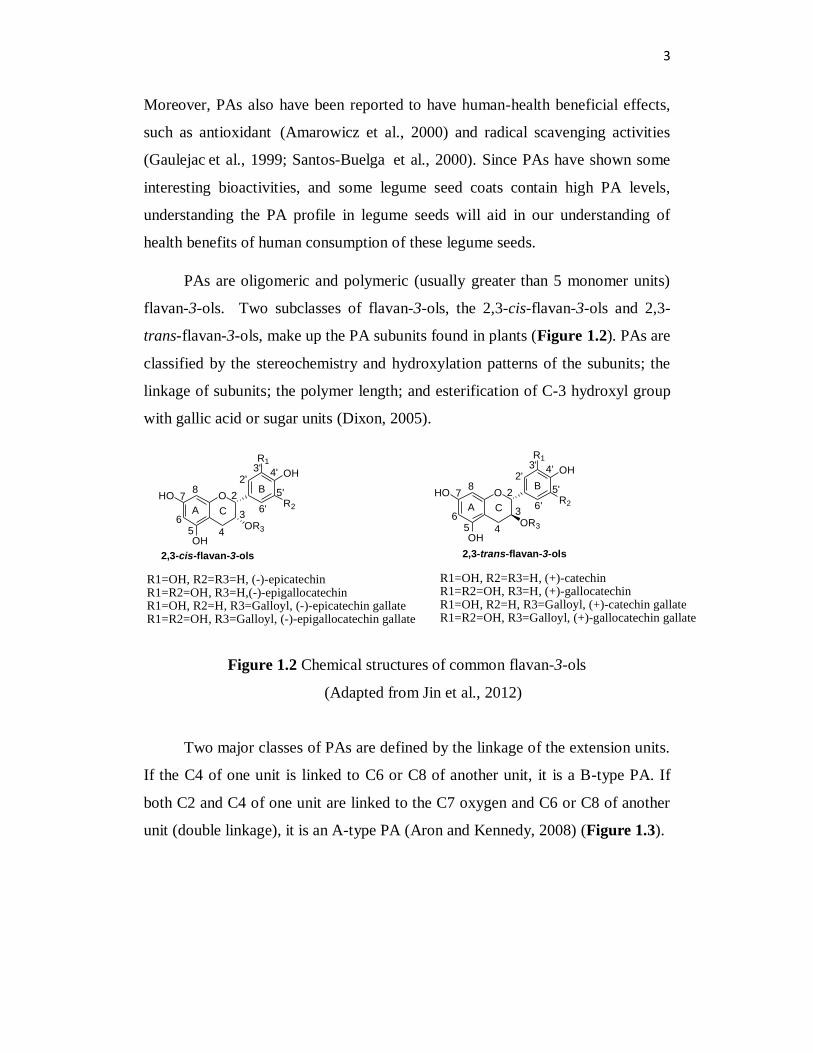
PAs are oligomeric and polymeric (usually greater than 5 monomer units)
flavan-3-ols. Two subclasses of flavan-3-ols, the 2,3-cis-flavan-3-ols and 2,3-
trans-flavan-3-ols, make up the PA subunits found in plants (Figure 1.2). PAs are
classified by the stereochemistry and hydroxylation patterns of the subunits; the
linkage of subunits; the polymer length; and esterification of C-3 hydroxyl group
with gallic acid or sugar units (Dixon, 2005).
O
OH
HO
OR3
R2
OH
R1
A C
B7
8
65 4
3
2
6'
5'
4'3'2'
R1=OH, R2=R3=H, (-)-epicatechin R1=R2=OH, R3=H,(-)-epigallocatechin R1=OH, R2=H, R3=Galloyl, (-)-epicatechin gallate R1=R2=OH, R3=Galloyl, (-)-epigallocatechin gallate
O
OH
HO
OR3
R2
OH
R1
A C
B7
8
65 4
3
2
6'
5'
4'3'2'
R1=OH, R2=R3=H, (+)-catechin R1=R2=OH, R3=H, (+)-gallocatechin R1=OH, R2=H, R3=Galloyl, (+)-catechin gallate R1=R2=OH, R3=Galloyl, (+)-gallocatechin gallate
2,3-cis-flavan-3-ols 2,3-trans-flavan-3-ols
Figure 1.2 Chemical structures of common flavan-3-ols
(Adapted from Jin et al., 2012)
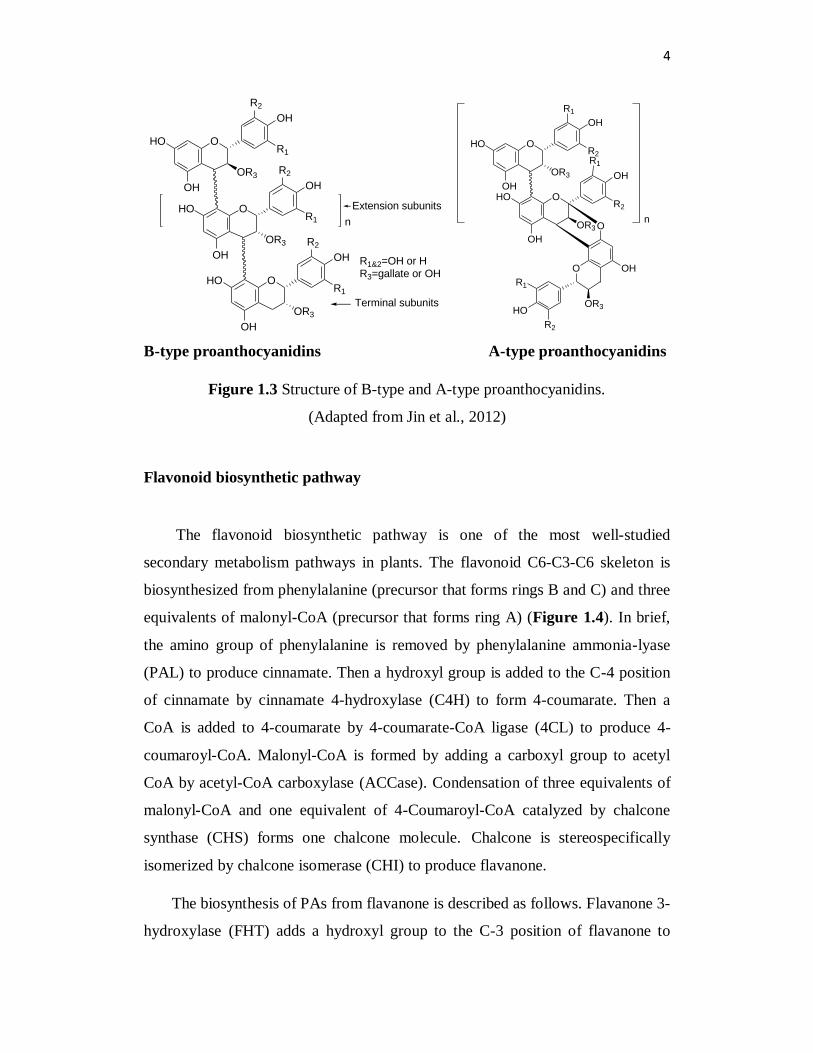
Two major classes of PAs are defined by the linkage of the extension units.
If the C4 of one unit is linked to C6 or C8 of another unit, it is a B-type PA. If
both C2 and C4 of one unit are linked to the C7 oxygen and C6 or C8 of another
unit (double linkage), it is an A-type PA (Aron and Kennedy, 2008) (Figure 1.3).
4
O
OR3
OH
R1
OH
HO
R2
O
OR3
OH
R1
OH
HO
R2
O
OR3
OH
R1
OH
HO
R2
n
Extension subunits
R1&2=OH or HR3=gallate or OH
Terminal subunits
O
OR3
OH
OH
HO
R1
O
OH
OH
HO
R1
OR3
O
HO
OH
O
R1
OR3
n
R2
R2
R2
B-type proanthocyanidins A-type proanthocyanidins
Figure 1.3 Structure of B-type and A-type proanthocyanidins.
(Adapted from Jin et al., 2012)
Flavonoid biosynthetic pathway
The flavonoid biosynthetic pathway is one of the most well-studied
secondary metabolism pathways in plants. The flavonoid C6-C3-C6 skeleton is
biosynthesized from phenylalanine (precursor that forms rings B and C) and three
equivalents of malonyl-CoA (precursor that forms ring A) (Figure 1.4). In brief,
the amino group of phenylalanine is removed by phenylalanine ammonia-lyase
(PAL) to produce cinnamate. Then a hydroxyl group is added to the C-4 position
of cinnamate by cinnamate 4-hydroxylase (C4H) to form 4-coumarate. Then a
CoA is added to 4-coumarate by 4-coumarate-CoA ligase (4CL) to produce 4-
coumaroyl-CoA. Malonyl-CoA is formed by adding a carboxyl group to acetyl
CoA by acetyl-CoA carboxylase (ACCase). Condensation of three equivalents of
malonyl-CoA and one equivalent of 4-Coumaroyl-CoA catalyzed by chalcone
synthase (CHS) forms one chalcone molecule. Chalcone is stereospecifically
isomerized by chalcone isomerase (CHI) to produce flavanone.
The biosynthesis of PAs from flavanone is described as follows. Flavanone 3-
hydroxylase (FHT) adds a hydroxyl group to the C-3 position of flavanone to

5
form dihydroflavonol. Flavonoid 3’ hydroxylase (F3’H) and flavonoid 3’5’
hydroxylase (F3’5’H) catalyze the hydroxylation of B ring and result in the
attachment of two hydroxyl groups, or three hydroxyl groups, respectively,
forming flavan-3,4-diols. Flavan-3,4-diols are reduced to leucoanthocyanidins by
dihydroflavonol 4-reductase (DFR).
O-
NH3+
O
Phenylalanine
PAL OH
O
Cinnamate
OH
O
HO
4-Coumarate
4CL SCoA
O
HO
C4H
4-Coumaroyl-CoA
SCoA
O
HO
4-Coumaryl-CoA
+ 3 malonyl-CoA
OH
HO OH
OH
CHS
O
4,2',4',6'-Tetrahydroxychalcone(a chalcone)
CHSCHR
HO OH
OH
O
Isoliquiritigenin(a chalcone)
OH
HO
O
O
OH
HO
O
O
OH
Hispidol(an aurone)
4,4',6'-Trihydroxyaurone(an aurone)
CHI CHI
HO O
OH
O
A C
B2
345
6
78
2'
3'
4'5'
6'
1'HO O
OH
O
A C
B2
345
6
78
2'
3'
4'5'
6'
1'
OH
Liquiritigenin(a flavanone)
Naringenin(a flavanone)
HO SCoA
O O
Malonyl-CoAAcetyl CoA
ACCase
SCoA
O
ATP+HCO3-
ADP+Pi
Figure 1.4 Formation of flavanone from phenylalanine
(Adapted from Grotewold, 1995).

6
PAL, phenylalanine ammonia-lyase. C4H, cinnamate-4-hydroxylase. 4CL, 4-
coumaroyl-CoA-ligase. ACCase, acetyl-CoA carboxylase. CHS, chalcone
synthase. CHR, chalcone reductase. CHI, chalcone isomerase.
Biosynthesis of proanthocyanidins
An important flavonoid biosynthesis branch pathway is the one leading to
the PAs. This pathway is of significant interest because it can be a potential target
for increasing the nutritional properties of food crops, including the legume seed
crops.
Leucoanthocyanidin is converted to anthocyanidin by anthocyanidin
synthase (ANS). There are two key enzymes, anthocyanidin reductase (ANR) and
leucoanthocyanidin reductase (LAR), that regulate the chemical make up of PAs
(Grotewold 2005). ANR converts anthocyanidin to 2,3-cis-flavan-3-ol, LAR
generates 2,3-trans-flavan-3-ol from leucoanthocyanidin. Condensation of
different flavan-3-ols forms the PAs oligomers and polymers (Figure 1.5).

7
HO O
OH
O
A C
B2
3
45
6
78
2'
3'
4'
5'
6'
1'
OH
Naringenin(a flavanone)
FNS FHT
HO O
OH
OOH
Apigenin(a flavone)
HO O
OH
OOH
OH
Dihydrokaempferol(dihydroflavonol)
Ring B hydroxylation
HO O
OH
OOH
OH
OH
F3'H
Dihydroquercertin(dihydroflavonol)
HO O
OH
OHOHOH
(Leucoanthocyanidins)
DFR
ANS
HO O
OH
OHOH
+
(anthocyanidin)
HO O
OH
OHOH
Flavan-3-ol
LAR
ANR
HO O
OH
OHOH
(-)-Epi-flavan-3-ol
Condensation
Oligomers and polymer(Proanthocyanidins)
DFR
F3'5'HRing B hydroxylatio
n
HO O
OH
OOH
OH
OH
OH
DFR
R
R
R
R
R
R
R
R
R=H or OH
Figure 1.5 Formation of proanthocyanidins from flavanone
(Adapted from Grotewold, 1995).
FHT, flavanone 3-hydroxylase. FNS, flavone synthase. DFR, dihydroflavonol 4-
reductase. ANS, anthocyanidin synthase. LAR, leucoanthocyanidin reductase.
ANR, anthocyanidin reductase. F3’H, flavonoid 3’ hydroxylase. F3’5’H,
flavonoid 3’5’hydroxylase.

8
Proanthocyanidins chemical analysis
PAs are relatively unstable under sunlight, moisture and elevated
temperature; moreover, they can be oxidized by polyphenol oxidase (PPO)
(Pourcel et al., 2007). Therefore, methods for extraction, isolation, purification,
identification and quantification of PAs from plant tissues need be carefully
chosen.
Plant samples for PAs analysis need to be immediately frozen and then are
usually lyophilized in order to prevent/reduce PA degradation caused by enzymes.
Liquid nitrogen is usually required during the sample grinding step to minimize
the release of PPO to reduce PA degradation.
PAs are flavan-3-ol oligomers and polymers, therefore, polar solvent
systems are applied in the extraction procedure of PAs from plant tissues. The
most commonly used solvent systems include water, acetone and methanol, and
aqueous acetone (66%) is widely used for PA extraction (Jin et al., 2012;
Kennedy and Jones, 2001). The PA extraction efficiency can be enhanced by
ultrasonication and vortexing (Grotewold, 2005). Liquid–liquid extractions (LLE)
or solid phase extraction (SPE) are most commonly used techniques for initial
purification of the crude PA extracts to remove chlorophylls, organic acids and
sugars (Grotewold E 2005). LLE uses two immiscible solvents (e.g. water and
ethyl acetate for PA purification) to separate compounds based on their
solubilities. SPE, which usually follows LLE, uses a liquid mobile phase and a
solid stationary phase to separate and purify the extracts based on the affinity of
the substrate. In the case of PA purification, Toyopearl HW-40 resins, which are
hydroxylated methacrylic polymers, are used as the size exclusion medium for the
adsorption chromatography. Aqueous methanol (50%) containing 0.1%
trifluoroacetic acid (TFA) is used to elute the impurities, including organic acids,
flavan-3-ols, hydroxycinnamic acids and flavonols, from the size exclusion
column. Then the PAs adsorbed to the size exclusion matrix are eluted by aqueous
methanol (80%) containing 0.1% TFA (Kennedy 2003).

9
The characterization of PA composition can be achieved using the
phloroglucinolysis method (Kennedy and Jones, 2001). In brief, the PA polymers
are acid hydrolyzed and cleaved with nucleophile phloroglucinol, leading to the
extension units phloroglucinol adducts and terminal flavan-3-ol units (Figure 1.6).
High-performance-liquid chromatography (HPLC) (exclusively using a reversed-
phase column), coupled with a diode-array detector (DAD) are commonly used
for the identification of the PA phloroglucinolysis products (Merken and Beecher,
2000). The mean degree of polymerization (mDP) of the PAs can be calculated
according to the method of Kennedy and Jones (2001). To calculate mDP, the sum
of all subunits (in mole equivalents) is divided by the sum of only terminal units
(in mole equivalents). Conversion yield is calculated as the sum of all subunits in
mass (excluding the phloroglucinol moiety of the phloroglucinol adducts) divided
by the weight mass of the starting PAs sample.

10
O
OR3
OH
R2
OH
HO
R1
O
OR3
OH
R2
OH
HO
R1
O
OR3
OH
R2
OH
HO
R1
n
Extension subunits
R1&2=OH or HR3=gallate or OH
Terminal subunits
B-type proanthocyanidins
OH
HO OH+
Phloroglucinol
O
OR3
OH
R2
OH
HO
R1
Terminal unit flavan-3-ol
O
OR3
OH
R2
OH
HO
R1
OH
OH
HO
Extension unit phloroglucinol adduct
Figure 1.6 Phloroglucinolysis reaction leading to free terminal unit flavan-3-ol
and extension unit phloroglucinol adduct (Jin et al., 2012).
Antimicrobial activity of flavonoids compounds
Antimicrobial agents are compounds that can inhibit the growth of
microorganisms. Antimicrobial agents can be categorized according to the
different microorganisms they can inhibit. For example, antibacterial agents can
inhibit the growth of bacteria or kill the bacteria; antifungal agents are used to
inhibit fungal growth; antiviral agents can inhibit virus growth, etc. There are
many synthetic chemical compounds utilized as antimicrobial agents; however,

11
natural products are another important source of antimicrobial agents (Silver and
Bostian, 1990).
Antibacterial agents are classified in three ways. Firstly, antibacterial agents
can be bactericidal or bacteriostatic. Bactericidal antibacterial agents kill the
bacteria; however bacteriostatic antibacterial agents only inhibit the bacteria
growth. Secondly, antibacterial agents can be classified according to the target site
of action. The five mains target sites are cell wall synthesis, protein synthesis,
nucleic acid synthesis, metabolic pathways, and cell membrane function. Thirdly,
antibacterial agents have diverse chemical structures originating from synthetic
compounds or natural sources (Goering et al., 2012).
Bacteria are a large group of prokaryotic microorganisms. There are two
different cell wall types in bacteria that differ in their ability to retain the crystal
violet Gram stain, they are classified as Gram positive (stain-retaining) and Gram
negative (non stain-retaining). A Gram-positive bacterium has a very thick layer
of peptidoglycan in the cell wall, and it usually lacks the outer membrane;
however, a Gram-negative bacterium cell wall typically has a thin peptidoglycan
layer and an outer membrane that contains lipopolysaccharide (Figure 1.7)
(Murray et al 2013).
gram-positive
gram-negative
peptidoglycan
peptidoglycan
outer membrane
Figure 1.7 A simple comparison of Gram-positive and Gram-negative bacteria
cell wall structure.
12
Flavonoids are a large group of compounds of secondary metabolites found
in plant tissues including fruits, seeds and bark (Andersen and Markham, 2006).
Many research groups have found that different subgroups of flavonoids have
antibacterial, antifungal and antiviral activity (Cushnie and Lamb, 2005). For
example, A-type PAs in cranberry fruit inhibit the urinary tract infection caused
by Escherichia coli (Foo et al., 2000). Zang et al. (2013) also found A-type PAs
from the herbaceous stems of Ephedra sinica (Ephedrae Herba in Traditional
Chinese Medicine) have antimicrobial activity against the Gram-negative
bacterial species Pseudomonas aeruginosa, and Gram-positive bacterial species
methicillin-resistant Staphylococcus aureus and fungi Canidia albicans.
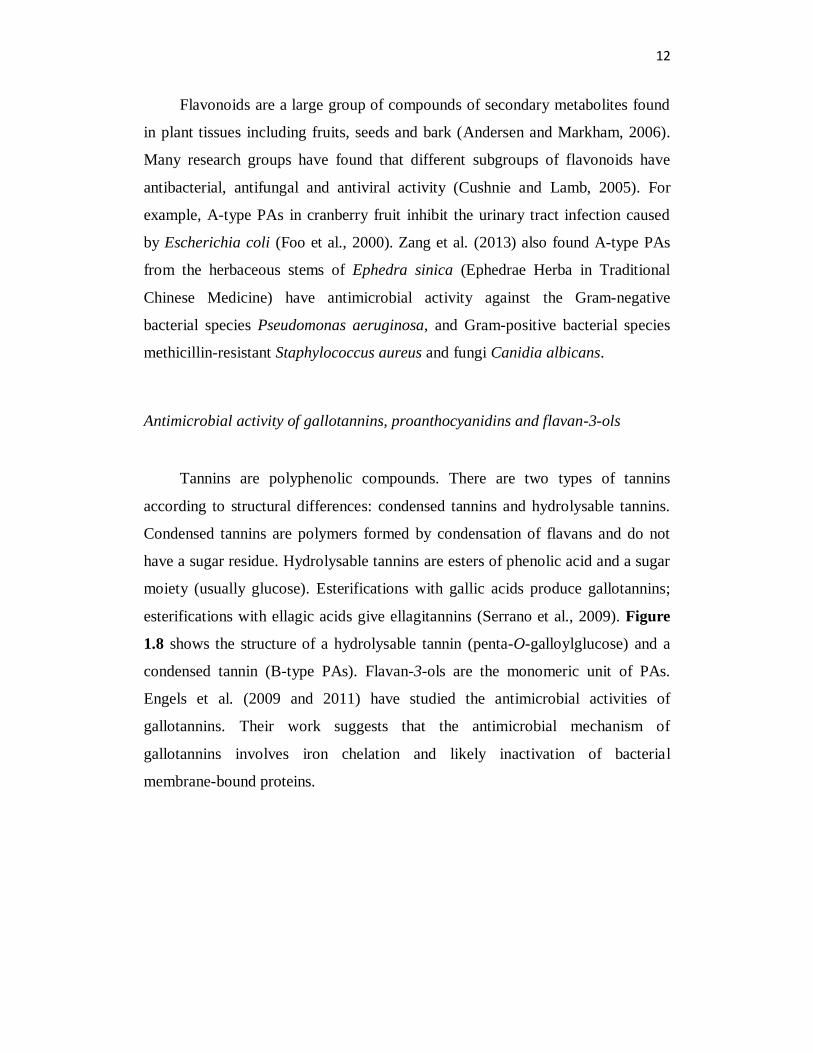
Antimicrobial activity of gallotannins, proanthocyanidins and flavan-3-ols
Tannins are polyphenolic compounds. There are two types of tannins
according to structural differences: condensed tannins and hydrolysable tannins.
Condensed tannins are polymers formed by condensation of flavans and do not
have a sugar residue. Hydrolysable tannins are esters of phenolic acid and a sugar
moiety (usually glucose). Esterifications with gallic acids produce gallotannins;
esterifications with ellagic acids give ellagitannins (Serrano et al., 2009). Figure
1.8 shows the structure of a hydrolysable tannin (penta-O-galloylglucose) and a
condensed tannin (B-type PAs). Flavan-3-ols are the monomeric unit of PAs.
Engels et al. (2009 and 2011) have studied the antimicrobial activities of
gallotannins. Their work suggests that the antimicrobial mechanism of
gallotannins involves iron chelation and likely inactivation of bacterial
membrane-bound proteins.

13
OO
HOOH
OH
O O
HOOH
OH
O O
OH
OH
OH
O
OH
OHHO
OO
OHHO
HO
OO
Gallotannin (penta-O-galloyl-beta-D-glucose)
O
OR3
OH
R2
OH
HO
R1
O
OR3
OH
R2
OH
HO
R1
O
OR3
OH
R2
OH
HO
R1
n
Extension subunits
R1&2=OH or HR3=gallate or OH
Terminal subunits
B-type proanthocyanidins
Figure 1.8 Gallotannin and proanthocyanidins structures. Gallotannins are esters
formed by gallic acids with hydroxyl groups of a glucose core (Engels et al.,
2009). Proanthocyanidins are polymeric flavan-3-ols (Jin et al., 2012).
The minimum inhibitory concentration (MIC) is generally used for the
measurement of the activity of antimicrobial agents. MICs are defined as the

14
lowest concentration of the stock that will inhibit microorganism’s growth after
overnight incubation and are expressed in grams of dry matter of inhibitory
substance per liter. The MIC is determined by using a critical dilution assay
(Andrews, 2001). Engels et al. (2011) found epigallocatechin gallate had
antimicrobial activity against Staphylococcus aureus (Gram positive) with a MIC
of 0.2 g/L, Bacillus cereus (Gram positive) with a MIC of 0.1 g/L, and Listeria
monocytogenes (Gram positive) with a MIC of 0.5 g/L. (-)-Epigallocatechin
gallate from green tea (Camellia sinensis) extract possessed strong antibacterial
activity against Staphylococcus aureus with a MIC of 0.073 g/L, and (-)-
epicatechin had weaker bactericidal activity with a MIC of 0.183 g/L (Ikigai et al.,
1993). Shinmamura et al. (2007) also reported that epigallocatechin gallate from
tea (Camellia sinensis) had antibacterial activity against Staphylococcus aureus
with a MIC of 0.05-0.1 g/L.
The presence of galloyl and gallic moieties on the position 3 of the catechin
C-ring was found to enhance antibacterial activity. The mode of action involves
the damage of membrane lipid bilayers (Ikigai et al 1993), disruption of the
interaction of the cell membrane and membrane proteins (Engel et al 2011).
Among the catechin-type compounds from green tea extracts, epigallocatechin
gallate and epicatechin gallate exhibited the most antibacterial activity (Taylor et
al., 2005). In green tea, (-)-gallocatechin-3-gallate had higher antimicrobial
activity against Bacillus cereus (Gram positive) than (-)-gallocatechin (Friedman
et al., 2006).
PAs isolated from fruit peels of Zanthoxylum piperitum are reported to
suppress the antibiotic resistance of methicillin-resistant Staphylococcus aureus
(Hatano et al., 2005). Epicatechin, epicatechin gallate and epigallocatechin gallate
can inhibit the plasma coagulation caused by Staphylococcus aureus (Akiyama et
al., 2001). Daglia (2012) have reviewed that flavan-3-ols from oolong tea and
green tea inhibited Vibrio cholera (Gram negative), Streptococcus mutans (Gram
positive), Campilobacter jejuni (Gram negative), Clostridium perfringes (Gram
positive), and Escherichia coli (Gram negative). Flavan-3-ols are also reported to
have iron chelating ability and inhibit the growth of invasive microorganisms by

15
iron-depletion (Aron and Kenndy, 2008). Structurally, the hydroxyl pattern of the
B-ring of the flavan-3-ols affects the inhibition of microbial growth. In general,
the gallocatechins, which have three hydroxyl groups on the B ring, are more
inhibitory than the catechins which only have two hydroxyl groups (Scalbert,
1991). Cos et al. (2003) have summarized the mode of action for
proanthocyanidins’ antimicrobial activities. PAs not only induce the complexation
of enzymes due to tannin-protein interaction, but they also inhibit microbial
metabolism through inhibition of oxidative phosphorylation. Moreover, the
tannin-metal ion binding ability contributes to the PAs antimicrobial activity
because metal ions are required for the growth of most microorganisms.
Carbohydrates classification
Carbohydrates are aldehydes or ketones with various hydroxyl groups; they
are the building blocks and the principle components of the plant cell wall
(Buchanan et al., 2002). Carbohydrates are divided into four groups:
monosaccharides, disaccharides, oligosaccharides, and polysaccharides.
Monosaccharides are the simplest carbohydrates consisting of small molecules
with three to nine carbon atoms. Disaccharides are formed by condensation of two
monosaccharide molecules. Oligosaccharides are formed by the linkage of two of
more monosaccharides by O-glycosidic bonds (Figure 1.9). Polysaccharides are
long chain of multiple monosaccharides linked by glycosidic bonds (Berg et al.,
2002).

16
O
OH
OH
HOH2C
HO
HO
Glucose Fructose
Monosaccharide
OHOH2C
HO
HO
HO
O
O
CH2OH
OH
CH2OHHO
Sucrose (consisting of glucose and fructose)
O
OH
HO
OH
HOH2C
OO
HOH2C
HOOH
OH
Lactose (consisting of galactose and glucose)
Disaccharide
Maltotriose (consisting of three glucose molecules)
Trisaccharide
O
O
HO
HOOH
HOH2C
HO
HOH2C
OH
HO
HOH2C
OHOH
O
CH2OH
OH
CH2OHHO
HO
Figure 1.9 Examples of the structures of monosaccharides, disaccharides and
trisaccharide
(Berg et al., 2002).
Polysaccharides
Polysaccharides are large polymeric sugars that are classified into two types
in plants based on chemical structure and function: starches and non-starch
polysaccharides (NSP).

17
Starch
The storage polysaccharide starch is a polymer of glucose formed by -1,4
and -1,6 glycosidic linkages. There are two types of starch based on the glucose
chain structure, amylose and amylopectin. Amylose consists of glucose residues
connected by -1,4 linkages with few or no -1,6-glycosidic linkages. Amylose
is referred to an unbranched starch molecule. Amylopectin, a highly branched
starch molecule, consists of glucose units connected by -1,4 linkages with
additional -1,6 linkages approximately every 30 glucose units (Berg et al., 2002)
(Figure 1.10). Amylose is insoluble in water, and more resistant to enzymatic
degradation as the amylose chains can pack tightly together, since it has few end-
points for the enzymes to attach to. Amylopectin is soluble in water at
temperature higher than 40 0C and is able to form an aqueous colloidal solution.
The branched structure of amylopectin can be rapidly degraded by starch cleaving
enzymes as the branched structure provides many end-points for the enzymes to
attach (Green et al., 1975).

18
O
O
HO OH
HOH2C
O
O
HO OH
HOH2C
O
O
HO OH
HOH2C
O
-1,4 glycosidic linkage
Amylose
O
O
HO OH
O
O
HO OH
HOH2C
O
O
HO OH
HOH2C
O
-1,4 glycosidic linkage
Amylopectin
-1,6 glycosidic linkage
O
O
O
HO OH
HOH2C
Figure 1.10 Starch structures showing-1,4 (amylose) and1,6 (amylopectin)
glycosidic linkages (Berg et al., 2002).
Starches can also be classified into digestible starch and resistant starch (RS)
based on their digestibility. Digestible starch is the starch absorbed in the small
intestine of healthy individuals, and is hydrolysable by pancreatic amylase at 37
0C. RS is the sum of starch and its degradation products which are not absorbed
in small intestine of healthy individuals (Leszczyński et al., 2004). RS is resistant
to hydrolysis by pancreatic amylase in boiling water, but can be hydrolyzed by
amyloglucosidase and pancreatic amylase in potassium hydroxide or dimethyl
sulfoxide (Englyst, 1989). Amylose is an important type of resistant starch in the
human diet.

19
Non-starch polysaccharides
The non-starch polysaccharides (NSP) make up the second class of plant
polysaccharides. The NSP include cellulose, non-cellulosic polymers and pectin
polysaccharides. These plant polysaccharides are made up of various
monosaccharides linked by -glycosidic linkages. NSP are the main components
of plant cell walls (Englyst et al., 1994) (Figure 1.11).
O
OO
HO
OH
O
OH
OH
HO
HO
OH
-1,4 glycosidic linkage
Figure 1.11 Non-starch polysaccharides (NSP) -linkage (Berg et al., 2002).
There are several criteria for the classification of NSP. Based on reactions
with water, NSP can be either soluble or insoluble (Englyst, 1989). Soluble NSP
can form dispersions with water; whereas insoluble NSP do not. Based on
extraction and isolation methodology, NSP consist of cellulose and
hemicelluloses. Structurally, cellulose is an unbranched polymer of glucose joined
by entirely -1,4 linkages with an equatorial configuration, which allows very
long straight chains (Kumar et al., 2012). Hemicellulose is a term for branched
heteropolymers containing many different sugar monomers such as glucose,
xylose, mannose, galactose, rhamnose and arabinose with a1,4 monomer
linkage backbone (Scheller and Ulvskov, 2010) (Figure 1.12). Cellulose remains
after a series of alkaline extractions of cell wall material; and hemicelluloses are
solubilized by alkali (Neukom, 1976).
Based on the differences in solubility, NSPs that make up dietary fibre are
classified into crude fibre (CF), neutral detergent fibre (NDF) and acid detergent
fibre (ADF) (Degen et al., 2007; Englyst and Hudson, 1987; Englyst, 1989). CF is
the residue that remains after acid and alkali extraction of plant material, and
20
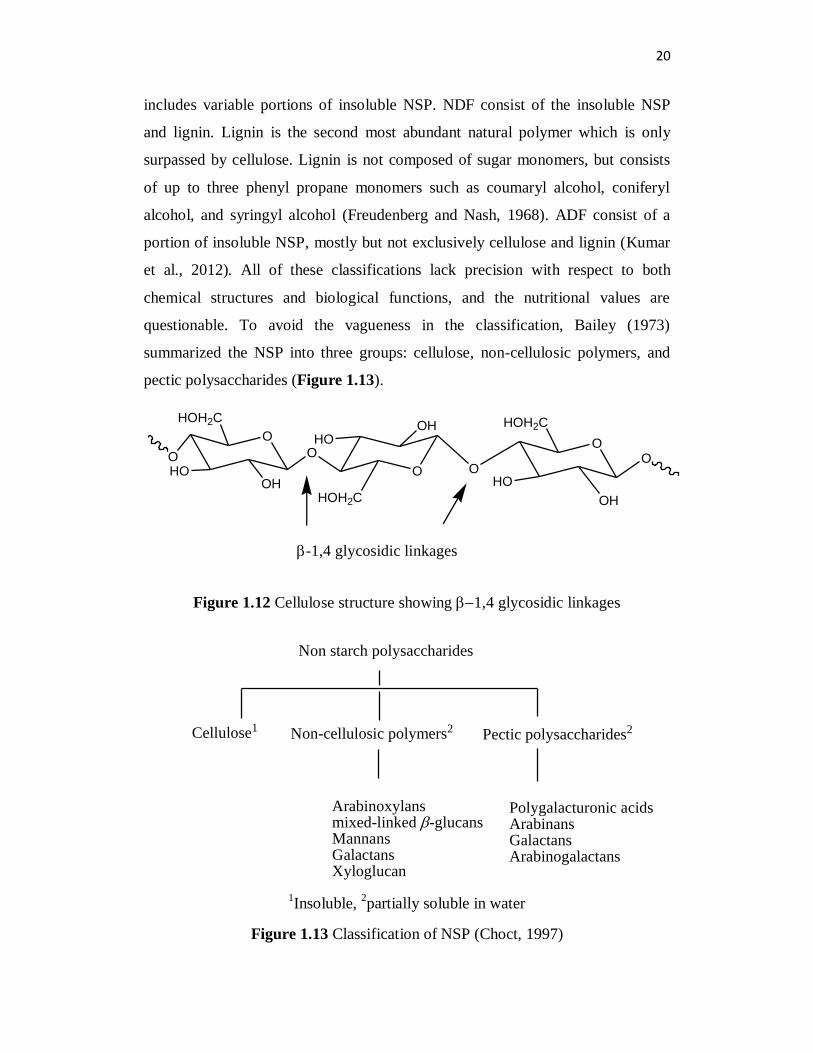
includes variable portions of insoluble NSP. NDF consist of the insoluble NSP
and lignin. Lignin is the second most abundant natural polymer which is only
surpassed by cellulose. Lignin is not composed of sugar monomers, but consists
of up to three phenyl propane monomers such as coumaryl alcohol, coniferyl
alcohol, and syringyl alcohol (Freudenberg and Nash, 1968). ADF consist of a
portion of insoluble NSP, mostly but not exclusively cellulose and lignin (Kumar
et al., 2012). All of these classifications lack precision with respect to both
chemical structures and biological functions, and the nutritional values are
questionable. To avoid the vagueness in the classification, Bailey (1973)
summarized the NSP into three groups: cellulose, non-cellulosic polymers, and
pectic polysaccharides (Figure 1.13).
OO
OO
HOH2C
HOOH
O
OHHO
HOH2C
O
HOH2C
OH
HO
O
-1,4 glycosidic linkages
Figure 1.12 Cellulose structure showing1,4 glycosidic linkages
Non starch polysaccharides
Cellulose1 Non-cellulosic polymers2 Pectic polysaccharides2
Arabinoxylansmixed-linked -glucansMannansGalactansXyloglucan
Polygalacturonic acidsArabinansGalactansArabinogalactans
1Insoluble,
2partially soluble in water
Figure 1.13 Classification of NSP (Choct, 1997)

21
Cellulose is the most abundant structural component of plant cell walls.
Cellulose exists in the form of microfibrils in plant cell walls. Microfibrils are
paracrystalline arrays of dozens of cellulose chains that are tightly hydrogen-
bonded (Lavoine et al., 2012). Glycans are a class of polysaccharides that can
hydrogen-bond to cellulose microfibrils and link them together to form a network;
most cross-linking glycans are called by the common term ‘hemicelluloses’,
which are defined as all materials extracted from the cell wall with molar
concentrations of alkali, independent of structure ((Scheller and Ulvskov, 2010;
Buchanan et al., 2002). Two major classes of cross-linking glycans in flowering
plants are xyloglucans and glucuronoarabinoxylans. In the cell walls of dicots, the
major cross-linking glycans are xyloglucans (Buchanan et al., 2002). Xyloglucans
are linear chains of (1→4Dglucan with 1,6 linked xylose side chains; some
of the xylosyl sites are substituted further with galactose, sometimes galactose is
further substituted with fucose (Buchanan et al., 2002). Plants from the legume
family (Fabaceae), which includes Pisum sativum (pea), contain the xyloglycan
class known as fucogalacto-xyloglucans (Brennan and Harris, 2011).
In fucogalacto-xyloglucans, the -D-xylosyl units are added to three
contiguous glucosyl units of the backbone to form a heptasaccharide unit. On
about one-half of these units, an -L-Fuc-(1→2) - D-Gal is added to the O-2
position of the xyl side group nearest the reducing end to form a monosaccharide
unit (Figure 1.14) (Buchanan et al., 2002).
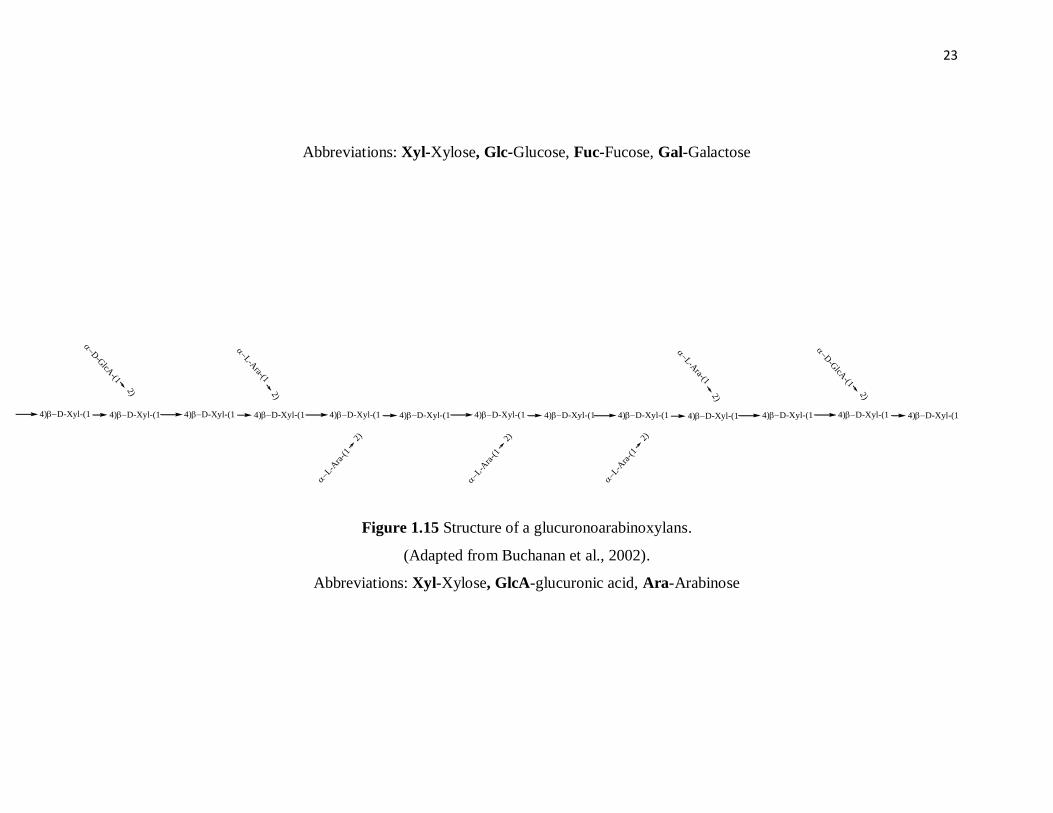
Dicots also contain glucuronoarabinoxylans in addition to the more abundant
xyloglucans. Glucuronoarabinoxylans consist of the linear β-1,4-linked D-
xylopyranosyl backbone, branched with arabinose and glucuronic acid (Figure
1.15) (Buchanan et al., 2002).

22
O
O
O
O
O
OO
OO O
OOH
H2C
HO
O
H2C
O
O
OHHOHO
OHHO
OH
H2CO
O
OH
HO
HO
O
O
OHHOHO
HOH2C
H2C
HOOH
O
HOH2C
HO
OH
O
HO
HOH2C
OH
HOOH
H2C
O
O
OHHOHO
O
O
OO
OH
H2C
HO
O
CH2
OHHO
HOOH
HOH2COH
O
OH
HO
HO
O
O
O
OHOHO
O
O
HOH2C
OO C
O
CH3C
O
CH3
O
O
OHOH
CH3
HO
4)D-Glc-(1 4)D-Glc-(1 4)D-Glc-(1 4)D-Glc-(1 4)D-Glc-(1 4)D-Glc-(1 4)D-Glc-(1 4)D-Glc-(1 4)D-Glc-(1
D
-Xyl
-(1
6)
-D-X
yl-(1
6)
-D-X
yl-(1
6)
-D-X
yl-(1
6)
D
-Xyl
-(1
6)
-L-Fuc-(1
2) D-G
al-(1
2) D-X
yl-(1
6)
(3-O-A
c)
(4-O-A
c)
Figure 1.14 Structure of a fucogalacto-xyloglucan (Adapted from Buchanan et al., 2002).
23
Abbreviations: Xyl-Xylose, Glc-Glucose, Fuc-Fucose, Gal-Galactose
Figure 1.15 Structure of a glucuronoarabinoxylans.
(Adapted from Buchanan et al., 2002).
Abbreviations: Xyl-Xylose, GlcA-glucuronic acid, Ara-Arabinose
4)D-Xyl-(1 4)D-Xyl-(1 4)D-Xyl-(1 4)D-Xyl-(1 4)D-Xyl-(1 4)D-Xyl-(1 4)D-Xyl-(1 4)D-Xyl-(1 4)D-Xyl-(1
L
-Ara
-(1
2)
L
-Ara
-(1
2)
L
-Ara
-(1
2)
L-A
ra-(12)
L-A
ra-(12)
4)D-Xyl-(1 4)D-Xyl-(1 4)D-Xyl-(1 4)D-Xyl-(1
D
-GlcA
-(1
2)
D
-GlcA
-(1
2)

24
Pectins are a mix of polysaccharides rich in D-galacturonic acids. The most
abundant pectic polysaccharide is homogalacturonan, which is a linear
homopolymer of -1,4-linked galacturonic acids (Mohnen, 2008). However, in
grain legumes, the most common pectin is arabinogalactans type 1, which consist
of a characteristic rhamnogalacturonan (in a 1:1 ratio) backbone. The side chains
are substituted at the C-4 position of the rhamnose, and are mainly linear (1~4)-
linked galactans and highly branched (l~5)-linked arabinans (Sinha et al., 2011;
Cheetham et al., 1993) (Figure 1.16).
D-Galp A-(1 2 )-4- L-Rhap-(1 4 ) - D-Galp A-(1 2 )- L-Rhap-(1 4 ) - D-Galp A-(1 2 )- L-Rhap-(14
- L-Araf5
- L-Araf5
1
- L-Araf - L-Araf- (2 1) - - ( 5 1 ) -
- L-Araf5
1
1
1
D-Xylp
4
- D-Gal pn
Figure 1.16 Structure of a pectin polymer from lupins
(Adapted from Cheetham et al., 1993).
Abbreviations: Gal-Galactose, Ara-Arabinose, Rha-Rhamnose
Gal A-galacturonic acids

25
Polysaccharides in human nutrition
Starches
Starch is an important energy source for humans. In the human diet, starch
can be obtained from processed or unprocessed food such as bread, cereals, pulses,
fruits and vegetables. Starch will be broken down to glucose after digestion in the
human gastrointestinal tract, and glucose will be transported to tissues for energy
use or storage. Starch found in storage organ plant tissues is produced and stored
in organelles called amyloplasts. Amyloplasts are responsible for synthesis and
storage of starch granules through polymerization of glucose in plants cells
(BeMiller and Whistler, 2009). As mentioned previously, plants make both
amylase and amylopectin starch molecules. Amylopectin, the branched starch
chain, is the major component of most starch granules in crop plants. Starch
granules grow by deposition of starch in layers. A starch granule is water
insoluble and densely packed. The surface of starch granules is the first barrier for
granule hydration, enzyme attack or chemical reaction (BeMiller and Whistler,
2009; Zobel, 1988). The amount of amylase to amylopectin, and the type of starch
granule, will determine how quickly the starch can be enzymatically degraded.
Digestible starch can be easily broken down to glucose in the human small
intestine, and resistant starch is not. It is reported that resistant starch is involved
in decreasing glucose level in blood (Bornet et al., 1989; Shen et al., 2011).
Resistant starch, compared to digestible starch, is not digested in the small
intestine, but fermented by gut-colonising bacteria in the large intestine to
produce short-chain fatty acids, acetic, propionic and butyric acids, which are
responsible for reducing the levels of cholesterol, triglycerides, and urea in blood,
as well as preventing the formation of gut cancer (Leszczyński, 2004).
Non-starch polysaccharides (NSP)
NSP have important benefits for human health, and a total NSP intake of 13
to 18 gram per day (approximately 50% from cereals, 40% from vegetables and
10% from fruit) is recommended for healthy people (Green, 2001). The beneficial
effects of dietary NSP include the following: 1) Maintenance of colonic

26
absorption. For example, pectin and soy polysaccharides can increase colonic
water absorption which is mediated by short chain fatty acids (SCFAs), as SCFAs
stimulate the transportation of colonic fluid and electrolytes. Reduction in SCFAs
in antibiotic-associated colitis may cause diarrhea; 2) Maintenance of
gastrointestinal structure and health. For example, SCFAs produced from
fermentable NSP can increase cell proliferation of colon epithelial cells, therefore
increasing their absorptive capacity; 3) Fermented products of NSP can promote
beneficial colonic bacterial growth and function; this is termed a prebiotic effect
(Kumar et al., 2012). Another interesting health implication of NSP is their ability
to lower the risk of developing diabetes mellitus. Soluble NSPs, especially mixed-
link β-glucans can help to normalize blood glucose and insulin levels. This effect
is proposed to be related to small intestinal viscosity and nutrient absorption, and
systemic effects from colonic-derived SCFAs. NSP may also retard α-amylase
action by capsuling starch and α-amylase, thus directly inhibiting the breakdown
of starch to glucose (Kumar et al., 2012; Ou et al., 2001).
Determination of non-starch polysaccharides (NSPs) content
Since polysaccharides are classified by various methods, the determination
of NSP from plant material is complex and diverse. In general, there are two types
of measurements to determine the NSP from plant samples: the gravimetric
method and chemical method (Englyst, 1989). The gravimetric method measures
the dietary components gravimetrically which resist breakdown by starch and
protein degrading enzymes. The Association of Official Analytical Chemists
(AOAC) procedure is based on this method (Englyst, 1989). Crude fibre
estimation is an example of the gravimetric method; however, it underestimates
the total NSP because of the low recovery of cellulose, hemicelluloses and lignin.
The chemical method, also called monomeric component analysis, quantifies the
constituent individual sugars of the NSP by gas chromatography (GC), high-
performance liquid chromatography (HPLC), or spectrophotometry; and
determines the total NSP by summation (Sinha et al., 2011). Notably, monomeric
component analysis yields lower values compared to gravimetric analysis because

27
of the exclusion of lignin and resistant starch during the chromatographic assay.
Rapid technologies such as near infra-red reflectance (NIR) or transmission (NIT)
spectroscopy are also applied to give fast, safe, and inexpensive analysis for
dietary fibre (Blakeney and Flinn, 2005).
In the monomeric component technique using GC analysis, the NSP sugars
are reduced to their alditols by alkaline sodium borohydride and then acetylated
by acetic anhydride in the presence of methylimidazole as the catalyst (Sinha et
al., 2011). In general, the procedure includes three steps. The first step is the
hydrolysis and removal of starch (including resistant starch) by dispersing the
sample in dimethyl sulphoxide (DMSO). The starch is then hydrolyzed by
incubation with enzymes such as pancreatin and pullulanase. Pancreatin is an -
amylase enzyme which can hydrolyze the α-1,4 glycosidic bonds between glucose
units in starch. Pullulanase (pullulan-6-glucanohydrolase) is an enzyme that can
hydrolyze both α-1,6 and α-1,4 glycosidic starch bonds. The second step is the
hydrolysis of the starch-free residue by 12 M sulphuric acid producing neutral
sugar monomers. The third step is the derivatization of the monosaccharides to
alditol acetates for GC analysis (Englyst, 1987; Englyst and Hudson, 1989).
Determination of starch content
Both total starch and resistant starch content can be measured based on
enzymatic/spectrophotometric procedures. The total starch analysis procedure
includes two steps for starch hydrolysis (Megazyme K-TSTA 07/11). Firstly,
starch is partially hydrolyzed to maltodextrins by α-amylase which can catalyze
the hydrolysis of α-1, 4-glycosidic linkages. Secondly, the starch dextrins are
quantitatively hydrolyzed to D-glucose by amyloglucosidase which can cleave the
terminal α-1, 4-glycosidic linkage and α-1, 6-glycosidic linkages. Then, D-
glucose is oxidized to D-gluconate and hydrogen peroxide (H2O2) by glucose
oxidase. H2O2 is quantitatively measured in a colourimetric reaction with p-
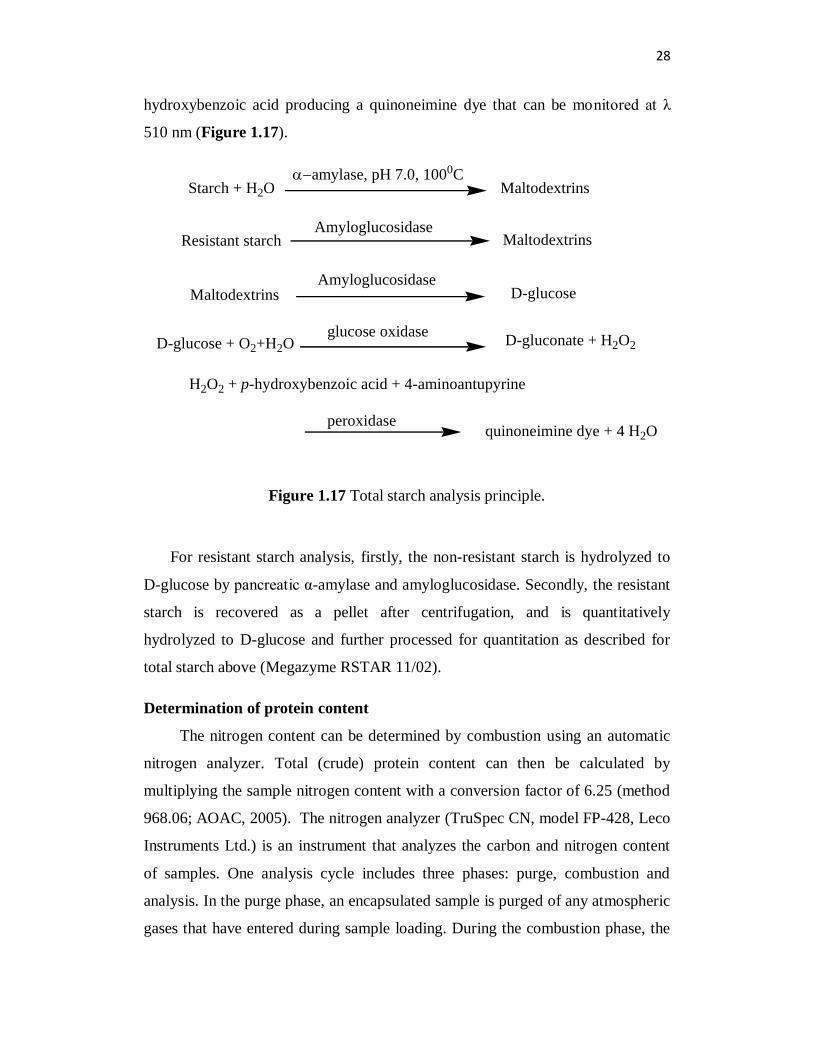
28
hydroxybenzoic acid producing a quinoneimine dye that can be monitored at λ
510 nm (Figure 1.17).
Starch + H2Oamylase, pH 7.0, 1000C
Maltodextrins
Resistant starchAmyloglucosidase
Maltodextrins
MaltodextrinsAmyloglucosidase
D-glucose
D-glucose + O2+H2Oglucose oxidase
D-gluconate + H2O2
H2O2 + p-hydroxybenzoic acid + 4-aminoantupyrine
peroxidasequinoneimine dye + 4 H2O
Figure 1.17 Total starch analysis principle.
For resistant starch analysis, firstly, the non-resistant starch is hydrolyzed to
D-glucose by pancreatic α-amylase and amyloglucosidase. Secondly, the resistant
starch is recovered as a pellet after centrifugation, and is quantitatively
hydrolyzed to D-glucose and further processed for quantitation as described for
total starch above (Megazyme RSTAR 11/02).
Determination of protein content
The nitrogen content can be determined by combustion using an automatic
nitrogen analyzer. Total (crude) protein content can then be calculated by
multiplying the sample nitrogen content with a conversion factor of 6.25 (method
968.06; AOAC, 2005). The nitrogen analyzer (TruSpec CN, model FP-428, Leco
Instruments Ltd.) is an instrument that analyzes the carbon and nitrogen content
of samples. One analysis cycle includes three phases: purge, combustion and
analysis. In the purge phase, an encapsulated sample is purged of any atmospheric
gases that have entered during sample loading. During the combustion phase, the

29
sample is dropped onto a hot surface (950 0C) and flushed with pure oxygen for
very rapid combustion. The sample then undergoes oxidation. In the analysis
phase, the gases from combustion are mixed with oxygen, and then carbon
content is detected as carbon dioxide by a CO2 infrared detector. By sweeping
through hot copper, oxygen is removed, and NOx is changed to N2. The nitrogen
content is detected by a thermal conductivity cell (Theory of operation, TruSpec
CN, model FP-428, Leco Instruments Ltd., Mississauga, ON, Canada).
Legume seeds
Crop legumes belong to the Fabaceae (formerly Leguminosae) plant family.
Crop legumes include some important and common food grains such as pea
(Pisum sativum L.), lentils (Lens culinaris L.), and faba beans (Vicia faba L.).
These crop legumes are important crops grown in western Canada with
substantial economic significance. For human consumption, green peas are eaten
as a vegetable (as fresh, canned, or frozen) and dried peas (also called field pea)
can be made into flour or used in soups. These legume seeds are a rich source of
protein, dietary fibre, and starch. For example, lentils are good source of dietary
fiber, of which 93%-99.7% is insoluble fibre (Faris et al., 2013). More than that,
legume seeds are also a good source of vitamins such as folate, thiamin (B1) and
riboflavin (B2), and minerals such as iron (Crépon et al., 2010). In some cultivars,
legume seed coats are rich sources of anthocyanidins (dry beans) and PAs (peas,
faba beans, lentils) (Jin et al., 2012; Duenas et al., 2003). The high content of
digestible protein and starch, as well as the presence of vitamins, minerals and
flavonoids, makes legume seeds an excellent food source for humans and animals.
Thesis goal
The overall goal of this research was to characterize the components of
legume seeds, and determine if specific seed components have potential
functional properties for practical end-uses. To this end, one study (Chapter 2)
investigated the antimicrobial activity of PA-enriched fractions derived from pea
seed coats. A second study (chapter 3) was intended to specifically characterize

30
the fibre, protein and starch components of western Canadian grown grain legume
seeds including pea, faba bean and lentils. Characterization of these seed
components will aid in understanding their role in nutrition and potential
amelioration of type 2 diabetes.
31
Chapter 2 Characterization and antimicrobial activity of
proanthocyanidins from ‘Solido’ pea seed coats
Introduction
The seed coats of pea (Pisum sativum L.), are rich sources of
proanthocyanidins (PAs) (Jin et al., 2012; Duenas et al., 2003). The PA-
containing pea cultivars Acer, Rocket, and Solido contain PA subunits that mainly
consist of the flavan-3-ols gallocatechin (GC) and epigallocatechin (EGC) that
have tri-hydroxylated B-rings (Figure 1.2) (Jin, 2011; Jin et al., 2012). PAs
(Scalbert, 1991) and their flavan-3-ol subunits (Ikigai et al., 1993; Taylor et al.,
2005; Daglia, 2012) have antimicrobial properties. Since tri-hydroxylated flavan-
3-ols (e.g. GC and EGC) have a higher antimicrobial potential compared to the di-
hydroxylated forms (e.g. catechins, C and epicatechins, EC) (Scalbert 1991), we
were interested in determining the antimicrobial activity of PAs made up of
mainly GC and EGC derived from pea seed coats.
Staphylococcus is a genus of gram-positive bacteria; they are characterized
by round shape (cocci) and can form grape-like clusters (Kloos and Bannerman,
1994). Staphylococcus aureus is an aerobic bacterium, and it is responsible for
many infections (for example, boils as skin infection) and food poisoning (caused
by toxins produced by S. aureus in contaminated foods) (Harris et al., 2002).
Staphylococcus pasteuri is an aerobic bacterium and is recognized as the agent
causing nosocomial infections and also considered as a blood derivatives
contaminant (Savini et al., 2009). Pediococcus is a genus of gram-positive lactic
acid bacteria that can grow in the absence of iron (Bryneel et al., 1989).
Pediococcus acidilactici is an anaerobic bacterium usually found in fermented
vegetables, dairy products and meat; it is a potential probiotic, having human and
animal health beneficial effects (Klaenhammer, 1993).
In order to investigate the structure/function relationship of PAs and flavan-
3-ols with antimicrobial activity, the flavan-3-ols C, EC, GC, EGC,
32
epigallocatechin gallate (EGCG), and PA extracts from ‘Solido’ pea seed coats
were tested for antimicrobial activity against S. aureus, S. pasteuri and P.
acidilactici. The two strains were selected to obtain strains that are sensitive
(staphylococci) and resistant (pediococci) to epigallocatechin gallate and produce
acid (Engels et al., 2011). Acid production was relevant because the turbidity of
the stock solutions obscured the turbidity caused by bacterial growth, requiring
the use of pH as an indicator of bacterial growth.
Materials and methods
Plant material
Pea seed coats (from Pisum sativum L. cv. Solido) were obtained from
Mountain Meadows Food Processing Ltd. (Site 13, Box 45, RR 1, Legal, Alberta,
Canada T0G 1L0). The seed coats were from pea seeds grown in 2009.
Chemicals
Organic solvents used for extraction, purification, and HPLC mobile phases
(acetone, chloroform, methanol, acetonitrile) were purchased from Fisher
Scientific (Ottawa, ON) and of HPLC grade. Ferric chloride hexahydrate was
purchased from BDH chemicals (Toronto, ON). (+)-Catechin hydrate, (−)-
epicatechin, (−)-gallocatechin, (−)-epigallocatechin, (−)-epigallocatechin gallate,
phloroglucinol, trifluoroacetic acid (TFA), L-ascorbic acid, hydrochloric acid
(36.5–38%), and Toyopearl resin (HW-40F) were purchased from Sigma
(Oakville, ON). Grape skin and black currant leave PA phloroglucinolysis adducts
were kindly provided by Dr. Lihua Jin, University of Alberta.
Extraction and purification of proanthocyanidins
The proanthocyanidins extraction procedure was adapted from Jin et al.,
(2012), and performed by Dr. Jin (University of Alberta) to obtain the “crude PA
extract”. The procedure was as follows. The seed coats were ground to a fine

33
powder in liquid nitrogen with a mortar and pestle. The ground powder was
soaked in 80 mL of 66% aqueous acetone in a 250 mL Erlenmeyer flask. The
flasks were immediately sparged with nitrogen to minimize oxygen content in the
flask and capped with glass stoppers. Subsequently, the flasks were placed on a
shaker at 100 rpm for 24 hours at 4 ºC in the dark. Extracts were then filtered
through 5.5 cm Whatman #1 filter paper using a Buchner funnel under moderate
vacuum. The residue was washed with 66 % aqueous acetone, the rinse liquid was
pooled, and the acetone was removed under vacuum using a Speed-Vac
concentrator (AES 2000, Savant, NY, USA). The remaining aqueous extract was
partitioned 4 times with chloroform (3:1,v/v) to remove lipophilic compounds and
flavan-3-ol monomers using a separatory funnel. The remaining aqueous extract
was dried to a powder using a freeze-drier. The final powder was defined as the
“crude PA extract”.
The “crude PA extracts” were further purified by adsorption
chromatography using Toyopearl resin (HW 40-F, Supelco, 1.5 ×12 cm
polypropylene column, ~10-14 ml bed volume) preconditioned with 50% (v/v)
aqueous methanol containing 0.1 % (v/v) trifluoroacetic acid (TFA). The extract
powder was dissolved in a minimum amount of 50% v/v aqueous methanol with
0.1% v/v TFA, and then loaded onto the Toyopearl column (1g extract powder
per 100 mL resin). The column was washed with 5 bed volumes of 50% v/v
aqueous methanol with 0.1% v/v TFA. The column was then eluted with 4 bed
volumes of 80% aqueous methanol with 0.1% v/v TFA. The methanol was
removed from the aqueous methanol extracts with a Speed-Vac concentrator, and
the remaining extract was dried down to a powder using a freeze-drier. The final
powder was defined as the “PA-enriched extract” (Figure 2.1).

34
Pea seed coats 5-10g
filtered using Buchner funnel under reduced pressure, rinsed the solid with small amount of cold 80% methanol
"PAs enriched extract"
lyophylization
aqueous extract
purified by 10 to 14 mL bed volume of Toyopearl resin column preconditioned with 50% (v/v) aqueous methanol containing 0.1% (v/v) TFA
ground in liquid nitrogen
partitioned 4 times with ethyl acetate (1:3 v/v ethyl acetate:extract) and 1 time with chloroform (1:3 v/v chloroform:extract) using separatory funnel
removed methanol with a Speed-Vac concentrator
remaining aqueous extract
80% methanol(10mL/g) on ice, sparged with nitrogen
to remove lipophilic compounds and flavan-3-ol monomers
aqueous fractionethyl acetate/chloroform fraction (discarded)
80% methanol fraction
removed methanol with a Speed-Vac concentrator
fine powderstirred on rotary shaker at 100 rpm
at 4oC in dark for 24 hours
washed with 5 bed volume of 50% (v/v) aqueous methanol with 0.1% (v/v)TFA
eluted with 4 bed volume of 80% (v/v) aqueous methanol with 0.1% (v/v)TFA
MIC
lyophylization "crude PA extract" MIC
Figure 2.1 Extraction and purification of PAs from ‘Solido’ seed coats
(Jin et al., 2012)

35
Phloroglucinolysis and HPLC quantification of proanthocyanidin subunits
The phloroglucinolysis reaction of PA-enriched extract powder was
performed in acidic conditions to cleave the PAs into their constitutive subunits,
followed by derivatization with excess phloroglucinol (phloroglucinolysis)
according to Jin et al. (2012). Approximately 5 mg of the lyophilized PA-enriched
extract was dissolved in a 1 mL 0.1 N methanolic hydrochloric acid solution
containing 100 g L-1
phloroglucinol and 10 g L-1
ascorbic acid. This reaction
solution was incubated in a 50 °C water bath for 20 minutes, then a 200 μL
aliquot of the solution was added to 1 mL of 40 mM sodium acetate solution to
quench the reaction. A 20 μL aliquot of the diluted reaction solution was
subjected to HPLC-DAD analysis to monitor free-flavan-3-ols (released from PA
terminal subunits) and flavan-3-ol phloroglucinol adduct (from extension PA subunits)
production.
A 20 μL aliquot of the diluted reaction mixture was injected onto two
Chromolith RP-18e columns (4.6×100 mm) connected in series, protected by a
guard column (Chromolith RP-18e, 4.6×10 mm), stabilized at 30 °C, using an
SHIMAZU Prominence HPLC system equipped with a SHIMAZU SPD M20A
diode array detector (DAD). The samples were eluted at 3 mL/min using a linear
gradient with 1% (v/v) aqueous acetic acid (solvent A) and acetonitrile with 1%
acetic acid (v/v; solvent B) as follows: isocratic at 3% B from 0 to 4 min, 3% to
18% B by 14 min, and 80% B from 14 to 18 min. Free PA (terminal) and
phloroglucinol-conjugated PA (extension) subunits were monitored at 280 nm.
Solido seed coat PA terminal subunits were identified by comparison of RP-
HPLC-DAD retention times and absorbance spectra with commercially available
flavan-3-ol standards. Solido seed coats phloroglucinol-PA adducts were
identified by comparison of RP-HPLC retention times to PA-phloroglucinol
derivatization products from grape skin (epigallocatechin-(4β→2)-phloroglucinol,
EGC-P) and black currant leaf (gallocatechin-(4α→2)-phloroglucinol, GC-P) PA
reaction products that have been previously characterized (Kennedy and Jones,
2001; Tits et al., 1992). The mean degree of polymerization and conversion yield
were calculated according to the method of Kennedy and Jones (2001).

36
Strains and culture conditions
S. aureus FUA 2082, S. pasteuri FUA 2077 and P. acidilactici FUA 3072
were kindly provided by Dr. Michael Gänzle (University of Alberta). S. aureus
and S. pasteuri were incubated overnight in Luria-Bertani broth (LB) (Difco,
Becton, Dickinson & Co., Sparks, MD) at 37oC, P. acidilactici was incubated
overnight in de Man, Rogosa, Sharpe (MRS) broth (Difco, Becton, Dickinson &
Co., Sparks, MD) under anaerobic condition (BBL GasPak System, Becton,
Dickinson & Co) at 37oC. Stock cultures were stored at -80
oC in 50% glycerol.
MIC assays of proanthocyanidin fractions and flavan-3-ols
The antimicrobial activity as minimum inhibitory concentration (MIC) of
extracts was investigated following Engels et al. (2009). MICs are defined as the
lowest concentration of the extract that will inhibit the growth of a microorganism
after overnight incubation and were expressed in grams of dry matter (dm) of the
test substance per liter of bacterial solution. The MIC is determined by using a
critical dilution assay. The stock solutions of each sample were prepared by
dissolving the compounds or samples of interest into 100% methanol. Serial 2-
fold dilutions of the crude PA extract, PA-enriched extract or flavan-3-ol
standards stock solution were prepared in 96 well microtiter plates with LB broth
or MRS broth. In brief, using a multi-channel pipette, 100 µL of sterile medium
was added to each well of the microtiter plate. Sterile medium (50 µL) was added
into wells as the negative control. The stock solution (100 µL) was added into
wells as the highest inhibitory concentration. Two-fold serial dilutions were made
by serially pipetting 100 µL of a higher concentration into 100 µL of sterile media.
Methanol was evaporated from the microtiter plate solutions by placing the
microtiter plates under a laminar flow hood for 2 hours. After methanol removal,
the overnight bacterial culture was diluted by taking 1 mL overnight bacterial
culture to 10 mL of medium, then 50 µL of diluted overnight bacterial culture was
added to the microtiter wells. Subsequently, the microtiter plate was incubated
overnight at 37oC. After overnight incubation, 20 µL of bromocresol green
aqueous solution (0.04% w/v, 0.04 g bromocresol green dissolved in 100 mL
distilled water) was added to wells to measure pH changes in the bacterial

37
solution. The change in pH was measured by the addition of bromocresol green
solution because bacterial growth as measured by turbidity was obscured with the
precipitation of medium with the PA stock solutions. The MIC was determined as
the lowest concentration of the compound or extract of interest that can inhibit the
acidification of the bacterial medium. All serial dilution experiments were
performed in triplicate.
Results and Discussion
Phloroglucinolysis and HPLC quantification of proanthocyanidin subunits
from ‘Solido’ seed coats
Phloroglucinolysis is an acid-catalyzed cleavage reaction followed by
phloroglucinol derivatization. In brief, the PAs polymers are cleaved under acidic
condition in the presence of the nucleophile phloroglucinol. Under these reaction
conditions, the flavan-3-ol extension units form phloroglucinol adducts, and the
terminal flavan-3-ol units do not. The subunits can then be characterized by
HPLC-DAD, and the PAs composition and polymer mean degree of
polymerization (mDP) can be calculated according to Kennedy and John (2001).
Grape skin and black currant leaf PA standards (kindly provided by Dr.
Lihua Jin, Jin et al., 2012) were subjected to phloroglucinolysis followed by RP-
HPLC-DAD analysis, epigallocatechin-(4β→2)-phloroglucinol (EGC-P) from
grape skin and gallocatechin-(4β→2)-phloroglucinol (GC-P) from black currant
leaves were used as the reference compounds. A HPLC retention time comparison
of references compounds and ‘Solido’ seed coat phloroglucinolysis reaction
products confirmed the identity of the following compounds: GC-P:
gallocatechin- (4α→2)-phloroglucinol; EGC-P: epigallocatechin- (4β→2)-
phloroglucinol; GC: gallocatechin; EGC: epigallocatechin; EC: epicatechin
(Table 2.1). The PA flavan-3-ols extension subunits were gallocatechin and
epigallocatechin. The PA flavan-3-ols terminal subunits consisted mainly of
gallocatechin, epigallocatechin, and with minor amounts of epicatechin. The PA

38
extension units and terminal units are assumed to be linked in a B-type
configuration (Figure 1.3) because the interflavonoid bonds were easily cleaved
within 20 minutes of acid-hydrolysis. The cleavage of the double linkage in the
A-type PAs requires more reaction time and/or stronger acid condition. The mDP
of the PA polymers was calculated at 2 subunits in length (Table 2.1).
39
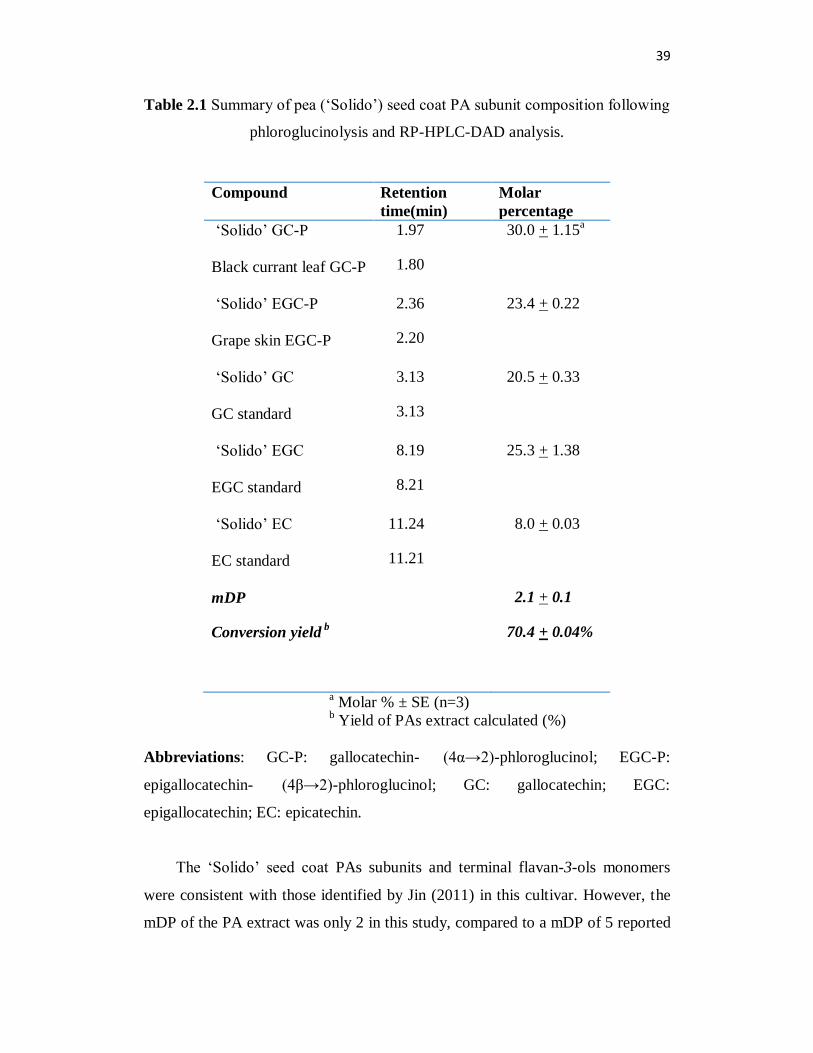
Table 2.1 Summary of pea (‘Solido’) seed coat PA subunit composition following
phloroglucinolysis and RP-HPLC-DAD analysis.
Compound Retention
time(min)
Molar
percentage
‘Solido’ GC-P
Black currant leaf GC-P
1.97
1.80
30.0 + 1.15a
‘Solido’ EGC-P
Grape skin EGC-P
2.36
2.20
23.4 + 0.22
‘Solido’ GC
GC standard
3.13
3.13
20.5 + 0.33
‘Solido’ EGC
EGC standard
8.19
8.21
25.3 + 1.38
‘Solido’ EC
EC standard
11.24
11.21
8.0 + 0.03
mDP 2.1 + 0.1
Conversion yield b
70.4 + 0.04%
a Molar % ± SE (n=3)
b Yield of PAs extract calculated (%)
Abbreviations: GC-P: gallocatechin- (4α→2)-phloroglucinol; EGC-P:
epigallocatechin- (4β→2)-phloroglucinol; GC: gallocatechin; EGC:
epigallocatechin; EC: epicatechin.
The ‘Solido’ seed coat PAs subunits and terminal flavan-3-ols monomers
were consistent with those identified by Jin (2011) in this cultivar. However, the
mDP of the PA extract was only 2 in this study, compared to a mDP of 5 reported
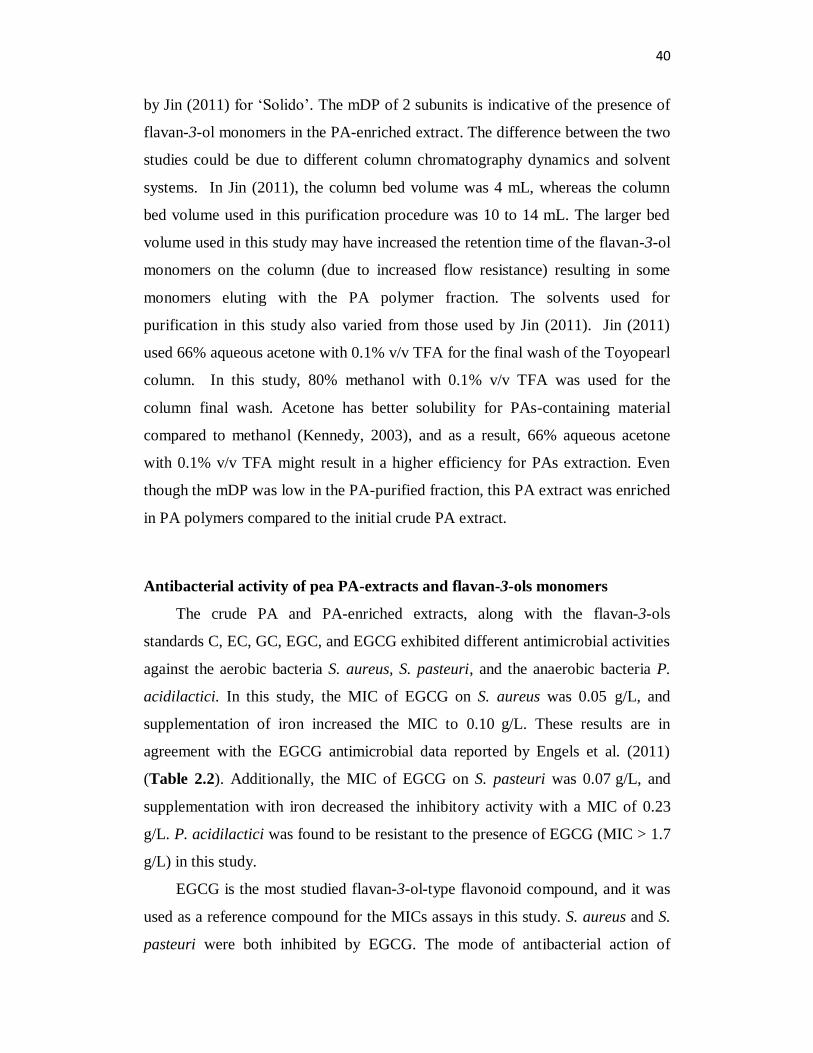
40
by Jin (2011) for ‘Solido’. The mDP of 2 subunits is indicative of the presence of
flavan-3-ol monomers in the PA-enriched extract. The difference between the two
studies could be due to different column chromatography dynamics and solvent
systems. In Jin (2011), the column bed volume was 4 mL, whereas the column
bed volume used in this purification procedure was 10 to 14 mL. The larger bed
volume used in this study may have increased the retention time of the flavan-3-ol
monomers on the column (due to increased flow resistance) resulting in some
monomers eluting with the PA polymer fraction. The solvents used for
purification in this study also varied from those used by Jin (2011). Jin (2011)
used 66% aqueous acetone with 0.1% v/v TFA for the final wash of the Toyopearl
column. In this study, 80% methanol with 0.1% v/v TFA was used for the
column final wash. Acetone has better solubility for PAs-containing material
compared to methanol (Kennedy, 2003), and as a result, 66% aqueous acetone
with 0.1% v/v TFA might result in a higher efficiency for PAs extraction. Even
though the mDP was low in the PA-purified fraction, this PA extract was enriched
in PA polymers compared to the initial crude PA extract.
Antibacterial activity of pea PA-extracts and flavan-3-ols monomers
The crude PA and PA-enriched extracts, along with the flavan-3-ols
standards C, EC, GC, EGC, and EGCG exhibited different antimicrobial activities
against the aerobic bacteria S. aureus, S. pasteuri, and the anaerobic bacteria P.
acidilactici. In this study, the MIC of EGCG on S. aureus was 0.05 g/L, and
supplementation of iron increased the MIC to 0.10 g/L. These results are in
agreement with the EGCG antimicrobial data reported by Engels et al. (2011)
(Table 2.2). Additionally, the MIC of EGCG on S. pasteuri was 0.07 g/L, and
supplementation with iron decreased the inhibitory activity with a MIC of 0.23
g/L. P. acidilactici was found to be resistant to the presence of EGCG (MIC > 1.7
g/L) in this study.
EGCG is the most studied flavan-3-ol-type flavonoid compound, and it was
used as a reference compound for the MICs assays in this study. S. aureus and S.
pasteuri were both inhibited by EGCG. The mode of antibacterial action of
41
EGCG involves membrane damaging activity as shown by 5,6-carboxyfluorescein
released from the intra liposomal space in S. aureus (Ikigai et al., 1993); and
membrane protein binding ability as shown by EGCG covalently binding to
sulfhydryl groups of membrane proteins at the C2 and C6 position of the B-ring,
and inducing membrane protein intermolecular cross-linking (Chen et al., 2011).
Furthermore, EGCG is more inhibitory in the absence of iron than in the presence
of iron. This is due to the iron binding ability of EGCG (Khokhar et al., 2003).
Hydroxyl groups from the B-ring and the galloyl groups of EGCG can bind with
iron (Khokhar et al., 2003). P. acidilactici does not require iron for growth.
Consistently, P. acidilactici was resistant to the presence of EGCG in MIC assays
(Engels et al., 2011). These data support that at least one antibacterial mode of
action of ECGC involves iron binding.

42
Table 2.2 MICs of flavan-3-ols monomers and PAs enriched extract
S. aureus
MIC(g/L)
S. pasteuri
MIC(g/L)
P. acidilactici
MIC(g/L)
Epigallocatechin gallate W/Fe3+ 0.10+0a 0.23+0.03 >1.7
W/O Fe3+ 0.05+0 0.07+0.03 >1.7
S. aureus
MIC(g/L)
S. pasteuri
MIC(g/L)
P. acidilactici
MIC(g/L)
Catechin W/ Fe3+ 3.37+0 4.49+1.94 3.37+0
W/O Fe3+ 2.81+0.97 3.37+0 6.73+0
Epicatechin W/ Fe3+ 3.42+0 6.83+0 3.42+0
W/O Fe3+ 5.53+1.91 6.83+0 >6.63
Gallocatechin W/ Fe3+ >0.17 >0.17 >0.17
W/O Fe3+ >0.17 0.08+0 >1.0
epigallocatechin W/ Fe3+ >0.56 0.56+0 >0.28
W/O Fe3+ 0.23+0.08 0.07+0 >1.1
S. aureus
MIC(g/L) S. pasteuri
MIC(g/L) P. acidilactici
MIC(g/L)
Crude PA W/Fe3+ 0.16+0.07 0.38+0 1.91+0
W/O Fe3+ 0.10+0.03 0.10+0 1.91+0
PA enriched W/Fe3+ 0.42+0 0.56+0.24 >0.83
W/O Fe3+ 0.28+0.12 0.21+0 >0.83
a g/L+SD (n=3).
b W=with.
c W/O=without
The flavan-3-ols C and EC have two hydroxyl groups on the B ring (4’, 5’-
hydroxylated), and they differ in their stereochemistry by the configuration of two
chiral centers on carbons 2 and 3 of C-ring (2, 3-cis and 2, 3-trans flavan-3-ols,
respectively) (Figure 1.2). GC and EGC have three hydroxyl groups on the B ring
(3’, 4’, 5’-hydroxylated), and also differ in their stereochemistry by the
configuration of carbon 2 and 3 of C-ring (2, 3-cis and 2, 3-trans flavan-3-ols,
respectively).

43
The MIC data of the flavan-3-ols showed that in general GC and EGC were
much more inhibitory to S. aureus and S. pasteuri growth than C and EC (Table
2.2). The MIC of C on S. aureus was 2.81 g/L, and supplementation with iron did
not markedly change the inhibitory activity (MIC of 3.37 g/L, similar to that
obtained for S. pasteuri). The MIC of EC on S. aureus was 5.53 g/L, and
supplementation with iron also did not markedly change the inhibition activity
(MIC of 3.42 g/L). S. pasteuri was resistant to the presence of EC (MIC of 6.83
g/L). However, S. aureus and S. pasteuri growth was markedly inhibited by the
presence of GC and EGC (MICs ranged from 0.07 to 0.23 g/L), and
supplementation with iron decreased the inhibition activity of GC and EGC on
both these bacterial species. P. acidilactici growth was resistant to the presence of
all the flavan-3-ols at the concentrations used in this study (Table 2.2). In
conclusion, the increase of one hydroxyl group in the flavan-3-ol B-ring resulted
in increased antimicrobial activity, likely due to enhanced iron binding abilities
(Scalbert, 1991). The stereochemistry configuration on carbons 2 and 3 of the
flavan-3-ol C-ring did not appear to affect the antimicrobial activity tested in
these assays.
The crude PA and PA-enriched extracts both showed antimicrobial activity
against S. aureus and S. pasteuri (Table 2.2). However, P. acidilactici was
resistant to the presence of the PA extracts. The crude PA extract contained PA
polymers, flavan-3-ols, and other small phenolic compounds. The PA-enriched
extract was mainly PA polymers along with a small amount of flavan-3-ols
monomers. The PA-enriched extract was less inhibitory than the crude PA extract
in the MIC assays for S. aureus and S. pasteuri, possibly due to the presence of
phenolic acids in this extract. All the MICs values are higher in the presence of
iron than
in the absence of iron, this would suggest that the antimicrobial mode of
action is related to PA-iron binding capability. PAs are reported to have ability to
complex metals through their ortho-diphenol groups (Buzzuni et al., 2007), and
bacterial growth can be severely inhibited by iron depletion. These results
generally agree with the literature that specific PAs and flavan-3-ols possess

44
antimicrobial activity (Buzzuni et al., 2007; Aron and Kenndy, 2008; Serrano et
al., 2009).
In conclusion, this study confirmed ‘Solido’ seed coat PA composition and
investigated the antimicrobial activity of PA-containing seed coat extracts against
the gram-positive bacteria S. aureus, S. pasteuri and P. acidilactici. ‘Solido’ seed
coats contain B-type proanthocyanidins and the composition units are mainly
gallocatechin and epigallocatechin. An increasing number of hydroxyl groups on
the aromatic B-ring could enhance the antimicrobial activity of the flavan-3-ols.
The antimicrobial mechanism of flavan-3-ols and PAs appears to involve their
iron binding capacity.

45
Chapter 3 Protein, starch and fibre components of pea (Pisum
sativum L), faba bean (Vicia faba L) and lentil (Lens culinaris L)
seeds grown in western Canada
Introduction
The embryos of pea, faba bean, and lentil seeds are rich sources of protein
and starch (Dahl et al., 2012; Faris et al., 2013; Crépon et al., 2010). Their seed
coats are also a rich source of fibre which is mainly made up of complex
carbohydrates of the cell walls (Reyes-Moreno and Paredes-López, 1993). Data
obtained using a rat model suggested that the carbohydrate components (fibre) of
pea seed coats can ameliorate the symptoms of type 2 diabetes (Whitlock et al.,
2012). Therefore, we were interested in analyzing the polysaccharide (fibre)
components of legume seed coats as well as obtaining a base level of the other
main seed nutrients. In this study, the protein, starch and fibre components (total
NSP and soluble NPS) of faba bean (‘Fatima’ and ‘Snowbird’), lentil (‘CDC
LeMay’, ‘CDC Plato’, and ‘CDC Redberry’) and pea (‘Courier’, ‘Solido’, and
‘Canstar’) seeds grown in western Canada have been investigated to determine
their specific nutritional values. The specific fibre components of pea seed coat
fractions used to further understand the effects of pea seed coat fibre on the
amelioration of type 2 diabetes symptoms in the rat model system were also
characterized. The data from this study can be used to further understand the
health/nutritionally- beneficial components of pea, faba bean and lentil seeds for
human or animal consumption and for amelioration of chronic diseases such as
type 2 diabetes.
Materials and Methods
Plant Materials
Seeds of lentil (Lens culinaris L., cvs. CDC LeMay, CDC Plato, and CDC
Redberry), faba bean (Vicia faba L., cvs. Fatima and Snowbird), and pea (Pisum

46
Sativum L., cvs. Solido, Courier, Canstar) were produced in Alberta, Canada in
2008, except for Canstar, which was grown in Alberta, Canada in 2011.
Chemicals
Megazyme total starch kit (K-TSTA) and Megazyme resistant starch kit (K-
RSTAR) were purchased from Megazyme Cedarlane (Burlington, ON, Canada).
Organic solvents (ethanol, glacial acetic acid, dichloromethane, acetic anhydride,
and acetone) were of HPLC grade and purchased from Fisher Scientific (Ottawa,
ON). Sulfuric acid (95-98%), food grade hydrogen chloride (36.5-38%), ammonia,
sodium acetate, monobasic sodium phosphate monohydrate, sodium borohydride
were purchased from Fisher Scientific (Ottawa, ON). 2-deoxy-D-glucose, 1-
methylimidazole, pancreatin (P-7545) and pullulanase (P-5420) were purchased
from Sigma-Aldrich (Oakville, Ontario).
Cooked and hydrolyzed seed coats preparation
For cooked seed coat samples, ‘Canstar’ seed coats (146 g) and ‘Solido’
seed coats (193 g) were heated in boiling water (1 L) for 30 minutes. The seed
coats and the water fraction remaining after the heating were lyophilized using a
freeze dryer (Virtis Ultra 35L Freeze Dryer, Stone Ridge, New York, United
States) for 7 days. For hydrolyzed seed coats sample, ‘Canstar’ seed coats (146 g)
and ‘Solido’ seed coats (193 g) were incubated in a acidic solution (1 L, 2N made
by 660 mL ethanol, 330 mL food grade HCl, and water in a 2 L volumetric flask)
at 100 0C for 1.5 hour, then NaOH (54 g) was added to partially neutralize the
acidic solution. The seed coats and solution remaining were then lyophilized
using Virtis Ultra 35L Freeze Dryer for 7 days. The seed coat samples were stored
in a freezer (-80 0C) before use.
Determination of protein content
Whole seeds were dehulled manually to seed coats and embryos. Mature
embryos (20 g) and seed coats (10 g) per cultivar were ground using a Retsch, ZM
200 (PA, USA) mill equipped with a 0.5 mm screen to produce finely ground
samples. The ground samples were then lyophilized using a freeze dryer (Virtis
Ultra 35L Freeze Dryer, Stone Ridge, New York, United States) for 7 days. The

47
total (crude) protein content of the legume seed coats and embryos was calculated
by multiplying the nitrogen content with a conversion factor of 6.25 (method
968.06; AOAC, 2005). The nitrogen content of each sample (100mg) was
determined with a nitrogen analyzer (model FP-428, Leco Instruments Ltd.,
Mississauga, ON, Canada). Caffeine (150 mg) and EDTA
(Ethylenediaminetetraacetic acid) (100 mg) were analyzed as the standards for
calibration.
Determination of total and resistant starch content
Whole seeds of lentil (‘CDC LeMay’, ‘CDC Plato’, and ‘CDC Redberry’),
faba bean (‘Fatima’ and ‘Snowbird’), and pea (‘Solido’, ‘Courier’, and ‘Canstar’)
were ground using a Retsch, ZM 200 (PA, USA) mill equipped with a 0.5 mm
screen to produce finely ground samples. The unprocessed ground samples were
lyophilized using a freeze dryer (Virtis Ultra 35L Freeze Dryer, Stone Ridge, New
York, United States) for 7 days. For the cooked treatment, the ground powder was
boiled in water for 30 minutes, then lyophilisation was performed as described
above.
The total starch assay was based on the Megazyme total starch assay
procedure AA/AMG 11/01. In brief, a ground and lyophilized sample (50 mg)
was placed into a Corning culture test tube (20 mL) (Sigma-Aldrich, Oakville,
Ontario). Aqueous ethanol (0.2 mL 80 % v/v), then DMSO (2 mL) were added
immediately to the tube, followed by vortexing and incubation in a boiling water
bath for 5 minutes. Thermostable -amylase (3 mL; 300 units) was added
immediately to the tube after removal from the water bath. The reaction solution
was vortexed then incubated in the boiling water bath for another 6 minutes, with
vortexing at every other 2 minutes. The reaction solution was cooled to about 50
oC, then sodium acetate buffer (4 mL; 200 mM, pH 4.5) and amyloglucosidase
(0.5 mL) were added. The solution was vortexed and incubated at 50 oC for 30
minutes, with vortexing at every 15 minutes. Subsequently, a 1 mL aliquot of the
reaction solution was transferred to a 2 mL microfuge tube. For whole seeds

48
samples, the whole content was diluted to 34.7 mL by adding 25 mL double
distilled water, then a 1 mL aliquot from the diluted solution was transferred to a
2 mL microfuge tube. This was repeated to give a technical replicates. The
microfuge tubes were centrifuged at 3511 g for 10 minutes. A 50 µL aliquot from
each tube was transferred into a 2 mL glass test tube, and GOPOD (glucose
oxidase/peroxidise) (1.5 mL) solution was added. The solution was mixed well by
inverting, then incubated in a 50 o
C water bath for 20 minutes. After incubation, a
350 µL aliquot from each tube was loaded into a 96-well UV plate and the
absorbance was read at 510 nm with a spectrophotometer (SpectraMax Multi-
Mode Microplate Reader, Sunnyvale, California, United States).
The resistant starch assay was based on the Megazyme resistant starch assay
procedure (Megazyme RSTAR 11/02). This procedure includes two major steps.
The first step is the hydrolysis and solubilisation of non-resistant starch. A ground
and lyophilized sample (80~100 mg) was placed into a Corning culture test tube
(20 mL). Pancreatic -amylase (4.0 mL; 10 mg/mL) containing amyloglucosidase
(3 U/mL) was added to the tube. The solution was vortexed and incubated at 37oC
with continuous shaking at 200 strokes/min (setting of 100 on the water bath is
equivalent to 200 strokes/min, which means 100 forward and 100 reverse) for
exactly 16 hours. The sample was removed from the water bath and 99% ethanol
(4.0 mL) was added with vigorous stirring on a vortex mixer, then the solution
was centrifuged at 1,500 g for 10 minutes using an ultracentrifuge (Beckman L8-
70M, Mississauga, Ontario, Canada). After centrifugation, the supernatant was
carefully decanted and the pellet was re-suspended in 50% aqueous ethanol (2 mL)
with vigorous stirring using a vortex mixer. An additional 50% aqueous ethanol
(6 mL) was then added to the solution and mixed by vortexing. The solution was
centrifuged at 1,500 g for 10 minutes. The supernatant was then discarded, and
this suspension and centrifugation step was repeated. Finally the supernatant was
carefully decanted and the tube was inverted onto an absorbent paper to drain the
excess liquid. The second step of the procedure is the measurement of resistant
starch. A magnetic stirrer bar (5 x 15 mm) and aqueous KOH (2 mL; 2 M) were
added to the tube containing the starch pellet, and the tubes contents were stirred
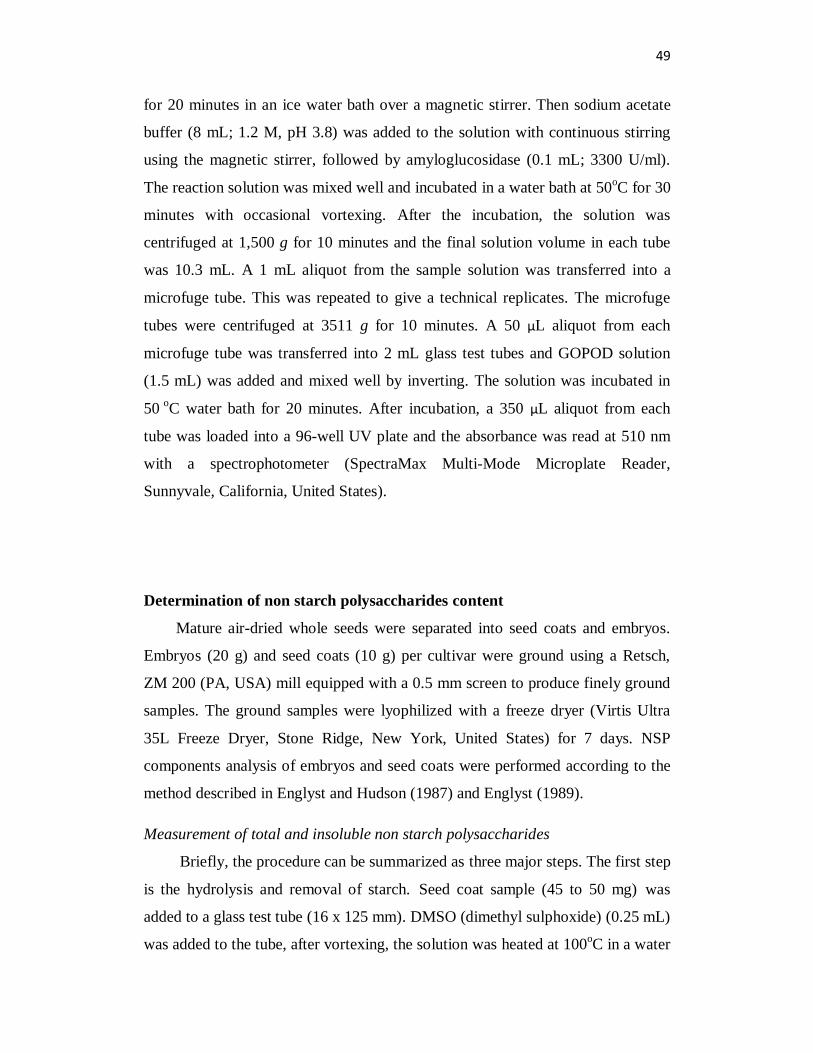
49
for 20 minutes in an ice water bath over a magnetic stirrer. Then sodium acetate
buffer (8 mL; 1.2 M, pH 3.8) was added to the solution with continuous stirring
using the magnetic stirrer, followed by amyloglucosidase (0.1 mL; 3300 U/ml).
The reaction solution was mixed well and incubated in a water bath at 50oC for 30
minutes with occasional vortexing. After the incubation, the solution was
centrifuged at 1,500 g for 10 minutes and the final solution volume in each tube
was 10.3 mL. A 1 mL aliquot from the sample solution was transferred into a
microfuge tube. This was repeated to give a technical replicates. The microfuge
tubes were centrifuged at 3511 g for 10 minutes. A 50 µL aliquot from each
microfuge tube was transferred into 2 mL glass test tubes and GOPOD solution
(1.5 mL) was added and mixed well by inverting. The solution was incubated in
50 o
C water bath for 20 minutes. After incubation, a 350 µL aliquot from each
tube was loaded into a 96-well UV plate and the absorbance was read at 510 nm
with a spectrophotometer (SpectraMax Multi-Mode Microplate Reader,
Sunnyvale, California, United States).
Determination of non starch polysaccharides content
Mature air-dried whole seeds were separated into seed coats and embryos.
Embryos (20 g) and seed coats (10 g) per cultivar were ground using a Retsch,
ZM 200 (PA, USA) mill equipped with a 0.5 mm screen to produce finely ground
samples. The ground samples were lyophilized with a freeze dryer (Virtis Ultra
35L Freeze Dryer, Stone Ridge, New York, United States) for 7 days. NSP
components analysis of embryos and seed coats were performed according to the
method described in Englyst and Hudson (1987) and Englyst (1989).
Measurement of total and insoluble non starch polysaccharides
Briefly, the procedure can be summarized as three major steps. The first step
is the hydrolysis and removal of starch. Seed coat sample (45 to 50 mg) was
added to a glass test tube (16 x 125 mm). DMSO (dimethyl sulphoxide) (0.25 mL)
was added to the tube, after vortexing, the solution was heated at 100oC in a water

50
bath for 1 hour. The tubes were immediately transferred to another water bath
heated to 42 oC, then sodium acetate buffer (1 mL; 0.1M, pH 5.2), aqueous
pancreatin solution (100 µL; 25 mg/mL) and aqueous pullulanase solution (50 µL;
made by 30 µL enzyme and 2.97 mL distilled water) were added to the tube,
vortexed and incubated for 16 hours at 42 oC. The second step is the acid
hydrolysis of the starch-free residue with sulphuric acid. Total NSP and insoluble
NSP were measured in independent samples. For total NSP samples (two
technical replicates), 95 % ethanol (6 mL) was added to the tube, vortexed and
incubated 1 hour at room temperature. For insoluble NSP samples (two technical
replicates), phosphate buffer (6 mL; 0.2 M, pH 7.0) was added to the tube,
vortexed and heated for 1 hour in 100oC water bath. Then the solution was
centrifuged at 1914 g for 20 minutes using an ultracentrifuge (Beckman L8-70M,
Mississauga, Ontario, Canada), and the supernatant was aspirated off.
Subsequently, 85 % ethanol (5 mL) was added to the solution for total NSP
measurement, and phosphate buffer (5 mL; 0.2 M, pH 7.0) was added to the
solution for insoluble NSP measurement. After vortexing, the tube was
centrifuged at 1914 g for 20 minutes and the supernatant was aspirated off. The
tube was washed one more time use 85% ethanol (5 ml) and the residue was dried
in a 65oC water bath. The dried starch-free residue was dispersed in H2SO4 (0.5
mL; 12 M) and incubated in a 35oC water bath for 1 hour. Then distilled water
(5.5 mL) was added into the solution, vortexed and heated in 100oC water bath for
2 hours. The solution was then cooled to room temperature, and aqueous myo-
inositol (0.1 mL; 20 mg/mL) was added to the tube as the internal standard. The
solution was vortexed and centrifuged at 2000 g for 5 minutes. A 1 mL aliquot of
the hydrolysate was transferred to another 15 mL glass tube. The third step is the
preparation of alditol acetates as constituent sugars for GC analysis. Ammonia
solution (0.2 mL; 12 M) was added to the hydrolysate and the mixture was
vortexed, then freshly prepared sodium borohydride solution (0.1 mL; 100 mg
sodium borohydride per mL of 3 M ammonia solution) was added and the
solution was incubated for 1 hour in a 40oC water bath. Then glacial acetic acid
(0.1 mL) was added to the solution. After vortexing, the acidified solution (0.2

51
mL) was transferred to another 15 mL glass tube, and 1-methylimidazole (0.3 mL)
was added to the solution and mixed. Subsequently, acetic anhydride (2 mL) was
added to the solution and vortexed continuously for 10 minutes, then distilled
water (5 mL) was added to the solution to decompose excess acetic anhydride and
aid in phase separation. When the solution was cooled to room temperature,
dichloromethane (4 ml) was added and mixed for 15 seconds. After centrifugation
at 700 g for 5 min, the top layer was aspirated off and distilled water (5 mL) was
added. The solution was centrifuged at 700 g for 5 minutes, the top layer was
aspirated off, and the bottom layer was dried with a 50 oC evaporator to obtain the
residue. Dichloromethane (1mL) was added to dissolve the residue and the
solution was transferred into screw cap GC vials for GC analysis (Figure 3.1).
A 0.5 μL aliquot of the derivatized sample was injected onto a DB-17 fused
silica capillary column (0.25 mm i.d. x 30m; J&W Scientific, Folsom, CA) in
Varian 3400 GC with cool-on-column injector. Helium was used as the carrier gas
at the rate of 1.5 mL/min. The injector temperature was increased from 60 oC to
270 oC at the rate of 150
oC/min and maintained for 20 minutes. Oven
temperature was raised from 50 oC to 190
oC at the rate of 30
oC/min, and
maintained for 3 minutes; then increased to 270 oC at the rate of 5
oC/min, and
maintained for 5 minutes. The flame ionization detector (FID) temperature was
set at 270 oC. Peak area integration for carbohydrate analyses were according to a
Shimadzu Ezchrom Data System (Shimadzu Scientific Instruments Inc.,
Columbia, MD). The difference of total NSP and insoluble NSP values was the
soluble NSP value.
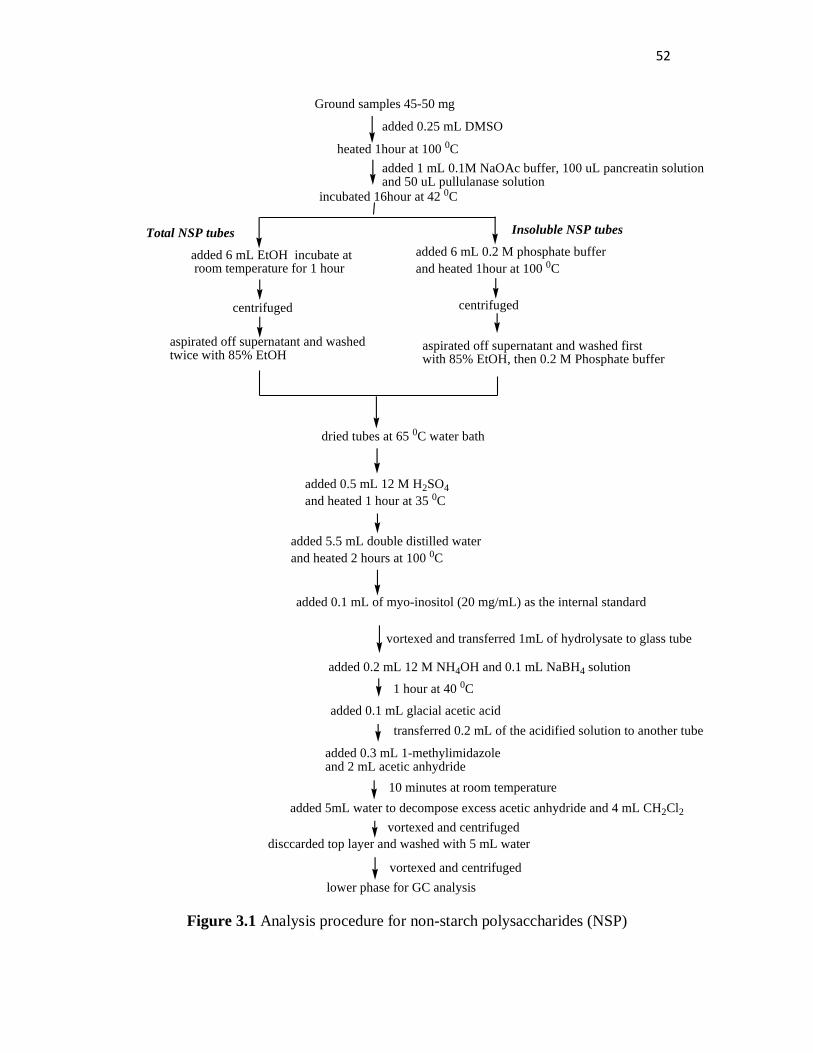
52
Ground samples 45-50 mg
added 0.25 mL DMSO
heated 1hour at 100 0C
added 1 mL 0.1M NaOAc buffer, 100 uL pancreatin solution and 50 uL pullulanase solution
incubated 16hour at 42 0C
Insoluble NSP tubesTotal NSP tubes
added 6 mL EtOH incubate at room temperature for 1 hour
added 6 mL 0.2 M phosphate buffer
and heated 1hour at 100 0C
centrifuged centrifuged
aspirated off supernatant and washed twice with 85% EtOH
aspirated off supernatant and washed first with 85% EtOH, then 0.2 M Phosphate buffer
added 5.5 mL double distilled water
and heated 2 hours at 100 0C
added 0.1 mL of myo-inositol (20 mg/mL) as the internal standard
added 0.2 mL 12 M NH4OH and 0.1 mL NaBH4 solution
1 hour at 40 0C
added 0.1 mL glacial acetic acid
added 0.3 mL 1-methylimidazole and 2 mL acetic anhydride
10 minutes at room temperature
added 5mL water to decompose excess acetic anhydride and 4 mL CH2Cl2
lower phase for GC analysis
dried tubes at 65 0C water bath
added 0.5 mL 12 M H2SO4
and heated 1 hour at 35 0C
vortexed and transferred 1mL of hydrolysate to glass tube
transferred 0.2 mL of the acidified solution to another tube
vortexed and centrifuged
disccarded top layer and washed with 5 mL water
vortexed and centrifuged
Figure 3.1 Analysis procedure for non-starch polysaccharides (NSP)

53
Results and discussion
Protein, starch and fibre components in seeds of different cultivars of
lentil, faba bean and pea.
Protein
The embryos of crop legume seeds contain the majority of the seed protein
compared to the seed coat. In our study, the protein content of embryos ranged
from 28 to 29% in lentil, 34 to 35% in faba bean, and 25 to 26% in pea (Table
3.1). Protein content in the seed coats ranged from 11% to 12% in lentil, 7 to 10%
in pea, and 7 to 8% in faba bean (Table 3.1). The western Canadian grown grain
legume embryo protein content was consistent in general with reported values for
the whole seed, as the seed is approximately 90% embryo (26% for whole lentil
seeds, Faris et al., 2013; 25 to 37% for whole faba bean seeds, Crépon et al., 2010;
21 to 33 % for whole pea seeds, Dahl et al., 2012).
Starch
Among these grain legume raw whole seeds, total starch content ranged from
34 to 42% and resistant starch ranged from 7 to 13%. Specifically, the total starch
content was 36 to 38% for lentil, 34 to 35% for faba bean, and 36 to 42% for pea
(Table 3.1). Resistant starch values were 10 to 13% for lentil, 9 to 10% for faba
bean, and 7 to 12% for pea (Table 3.1). The legume grain seed total and resistant
starch values in this study are consistent to those found by Chung et al. (2008),
who reported a total starch content for raw pea seed of 44.6 to 49.4%, and 46.0 to
47.1% for raw lentil seed; resistant starch content for raw pea seed as 10.1 to
14.7%, and 14.4 to 14.9% for raw lentil seeds; and by Crépon et al. (2010), who
reported 41.2 to 42.7% of total starch content for raw faba bean seeds.
The cooking treatment (boiling in water for 30 minutes) increased the total
seed starch content by 1 to 6%, and decreased the resistant starch content by 4 to
9% (on a dry weight basis) in pea, lentil and faba bean (Table 3.1). Lentil cooked
whole seeds had the highest total starch, and faba bean cooked whole seed had the

54
lowest total starch. Lentil raw whole seed contained the highest resistant starch,
and there was no significant change in resistant starch level among lentil, faba
bean and pea cooked whole seed (Table 3.1). According to the literature, raw
lentil seed flour contains a mean value of 16.1% resistant starch; cooked lentil
seeds flour contains a mean value of 7.6% resistant starch (Garc a-Alonso et
al., 1998). Costa et al (2006) reported that cooking treatment decreased the
resistant starch value in lentil and pea seeds. Pea and lentil seeds were first soaked
in water for 16 hours and then freeze-dried in Costa’s sample preparation method.
Raw pea seed flour contains 2.5% resistant starch, cooked pea seed flour contains
1.9% resistant starch; raw lentil seed flour contains 3.3% resistant starch, cooked
lentil seed flour contains 2.5% resistant starch (Costa et al., 2006). The lentil
resistant starch values were lower than that reported by García-Alonso et al.
( 1998), and this is likely because soaking allows seeds to imbibe water into their
cells, and the seeds swell as they hydrate, which makes starch become more
digestible (Carmona-Garcia R et al., 2007)
Our data also indicated that the cooking treatment decreased the resistant
starch content for all cultivars. This is likely because in the presence of water and
high temperature, gelatinization occurs when the starches absorb water and begin
to swell, and the starch granules unwind, making the starch molecules more
accessible for enzymatic degradation and more digestible (Garc a-Alonso et
al., 1998). In our data, the resistant starch content in the lentil cultivars were lower
than what was found by García-Alonso et al. ( 1998) and higher than that found by
Costa et al. (2006); resistant starch content in pea cultivars were higher than that
found by Costa et al. (2006). The cultivars, processing methods and analysis
methods can affect starch content results. In conclusion, our data matched the
previous reports, which showed that the cooking treatment decreased resistant
starch amount.

55
Table 3.1 Protein, total starch and resistant starch profiles in seeds of different
cultivars of lentil, faba bean and pea.
Cultivar Proteina (%) Total starch
b (%) Resistant starch
b (%)
Lentil Seed coat/embryo Raw/cooked Raw/cooked
CDC LeMay 11.44+0.06c/29.26+0.03 36.84+1.44/41.14+0.85 13.35+0.11/3.98+0.02
CDC Plato 12.38+0.20/28.34+0.05 37.93+0.97/44.49+0.22 12.89+0.27/3.63+0.04
CDC Redberry 11.48+0.06/29.28+0.07 36.31+1.15/42.35+0.3 9.89+0.31/3.79+0.00
Faba bean Seed coat/embryo Raw/cooked Raw/cooked
Fatima 7.03+0.04/35.3+0.14 33.79+0.17/35.67+0.63 9.02+0.47/2.74+0.13
Snowbird 8.38+0.53/34.01+0.07 35.55+0.05/37.27+0.72 10.03+0.44/3.44+0.06
Pea Seed coat/embryo Raw/cooked Raw/cooked
Solido 7.96+0.21/25.76+0.09 37.75+0.35/38.90+1.19 7.26+0.42/3.30+0.16
Courier 9.93+0.10/25.64+0.18 36.41+0.65/38.80+0.60 9.95+0.09/4.14+0.15
Canstar 6.65+0.05/24.62+0.25 42.36+0.43/44.48+0.29 11.58+0.38/3.77+0.01 a Protein content was determined in the seed coats and embryos of samples directly after
grinding (raw).
b The total starch and resistant starch content was determined in raw or cooked whole
seed samples.
C Data are means ± SE, n=3.
Fibre
The seed coats of crop legume seeds contain the majority of the fibre content
of the seed. In lentil embryos, the total, insoluble and soluble fibre content ranged
from 6 to 8%, 5 to 7%, and 1 to 3%, respectively, with ‘LeMay’ having the
highest embryo soluble NPS content (Table 3.2). In lentil seed coats, the total,
insoluble and soluble fibre content ranged from 39 to 54%, 40 to 47%, and 0 to
7%, respectively, with ‘Plato’ having the highest seed coat soluble NSP content
(Table 3.2). For lentil whole seeds, the total, insoluble and soluble fibre ranged
from 9 to 12%, 8 to 10% and 1 to 3% (Table 3.3). Tosh et al. (2010) reported that
lentil whole seeds contained 18 to 20% total fibre, 11 to 17% insoluble fibre, and

56
2 to 7% soluble fibre using a gravimetric method. Kubicka et al. (2003)
characterized the seed coat components of lentil (grown in Poland) with a total
fibre of 83.4%, insoluble fibre of 72.0%, and soluble fibre of 11.5% as measured
with a gravimetric method (Asp et al., 1983). In our study, the lentil seed coat
fibre content in the cultivars studied were lower than that reported by Kubicka
(2003) which included lignin (not included as a fibre component in our analysis),
but the ratios of total, insoluble and soluble fibre content were general consistent
with the above reported values.
In faba bean embryos, the total, insoluble and soluble fibre content ranged
from 6 to 7%, 5%, and 1 to 2%, respectively; in faba bean seed coats, these values
were 61 to 72%, 59 to 67%, and 2 to 5%, respectively (Table 3.2). For faba bean
whole seeds, the total, insoluble and soluble fibre ranged from 14%, 12% and 1 to
2%, respectively (Table 3.3). The fibre values in this study were lower those
reported by Giczewska et al. (2003), who reported that faba bean whole seeds
grown in Poland contained 20 to 26.8% total fibre and 3 to 4% soluble fibre,
using a fibre analysis method similar to that used in this study.
In pea embryos, the total, insoluble and soluble fibre content ranged from
7 to 8%, 4 to 5%, and 2 to 3%, respectively; in pea seed coats, these values were
50 to 68%, 43 to 65%, and 3 to 8% respectively (Table 3.2). For pea whole seeds,
the total, insoluble and soluble fibre ranged from 11 to 13 %, 9 to 10% and 2 to 4%
(Table 3.3). Dahl et al. (2012) summarized whole pea seed fibre data from seven
published studies and reported pea seeds consist of 14 to 26% total dietary fibre,
10 to 15% insoluble fibre, and 2 to 9% soluble fibre. Daveby et al. (1993)
reported fibre content values for pea embryos where the total dietary fibre
includes lignin and uronic acid (which was not included as fibre components in
our analysis). Their value for insoluble fibre content was 1.9 to 2.3%, the soluble
fibre content was 1.2 to 1.3%, and the total fibre content was 5.5 to 6.8%. In pea
seed coats, the total fibre content was 57.1 to 71.3%. In general, the data from our
study on pea embryo and seed coat fibre contents were similar to those reported
by Daveby et al. (1993).

57
Among the different legume species studied, pea embryos in general
contained the highest soluble fibre (2 to 3%) (Table 3.2). The soluble fibre
content of seed coats varied within cultivar among the legume grain seeds studied,
with the lentil cultivar CDC Plato and the pea cultivar Courier having the highest
values (Table 3.2). For whole seeds, pea seeds contained the highest soluble fibre
(Table 3.3)
Table 3.2 Total fibre, insoluble fibre and soluble fibre content of seed coats and
embryos from the seeds of various cultivars of lentil, faba bean and pea.
Species Cultivar Tissue
Total fibre
(%)a
Insoluble fibre
(%)a
Soluble fibre
(%)a
Lentil
CDC LeMay Seed coat 44.9±1.4
b 39.8±0.6 5.0±1.0
Embryo 8.2±0.4 5.8±0.9 2.4±0.6
CDC Plato Seed coat 53.7±2.2 46.6±2.3 7.1±1.7
Embryo 7.6±0.2 6.4±0.5 1.2±0.6
CDC Redberry Seed coat 38.5±2.1 39.4±5.4 ND
c
Embryo 6.4±0.5 4.9±0.0 1.5±0.5
Faba bean
Fatima Seed coat 60.6±0.2 59.1±1.9 1.5±1.9
Embryo 6.6±0.1 4.8±0.4 1.8±0.4
Snowbird Seed coat 71.6±2.5 67.4±1.4 4.3±1.8
Embryo 6.2±0.1 5.1±0.2 1.1±0.4
Pea
Solido Seed coat 60.1±1.0 55.5±1.6 4.6±1.3
Embryo 7.6±0.5 4.7±0.9 2.9±0.7
Canstar Seed coat 68.1±2.0 65.3±0.2 2.9±2.1
Embryo 7.3±0.9 5.3±0.5 2.1±0.4
Courier Seed coat 50.3±0.5 42.8±1.7 7.6±1.3
Embryo 7.9±0 5.3±0.4 2.6±0.4
a % = mg/100 mg dry weight of sample
b Data are means ± SE, n=3.
c ND=not detected
d Experimental error. Soluble fibre value is calculated as total fibre value subtracts
insoluble fibre value.

58
Table 3.3 Total fibre, insoluble fibre and soluble fibre content of whole seeds of
various cultivars of lentil, faba bean and pea.
Species Cultivar Tissue
Total fibre
(%) a
Insoluble fibre
(%)
Soluble fibre
(%)
Lentil
CDC LeMay Whole seed 11.7±0.5
b 9.0±0.9 2.7±0.6
CDC Plato Whole seed 11.6±0.3 9.9±0.3 1.7±0.6
CDC Redberry Whole seed 9.1±0.4 7.9±0.5 1.2±0.8
Faba
bean
Fatima Whole seed 13.7±0.1 11.9±0.5 1.7±0.6
Snowbird Whole seed 14.0±0.3 12.5±0.1 1.5±0.3
Pea
Solido Whole seed 13.0±0.5 9.9±0.7 3.1±0.5
Canstar Whole seed 11.3±0.8 8.6±0.4 2.7±0.7
Courier Whole seed 12.7±0.1 9.6±0.6 3.2±0.5
a mg/100 mg dry weight of sample
b Data are means ± SE, n=3.

59
Fibre components of embryos and seed coats of different cultivars of pea,
faba bean and lentil.
Pea
In the embryos of the pea cultivars studied, the main components of the total
fibre fraction were arabinose (46 to 51%) and glucose (33 to 38%) (calculated as
the percent of a specific monosaccharide within the total monosaccharide detected
by GC analysis of the alditol acetates derivatized from polysaccharide
hydrolysates) (Table 3.4). The less abundant components of the total fibre
fraction were galactose (5.9 to 7.2%), xylose (3.7 to 4.3%), rhamnose (2.0 to
2.2%), ribose (0.9 to 1.2%), fucose (0.5 to 0.6%) and mannose (0.5 to 0.6%).
The main components of the soluble fibre fraction of the pea embryos also
consisted of arabinose (52 to 65%) and glucose (12 to 25%). The less abundant
components of the soluble fibre fraction were galactose (9.2 to 13.2%), xylose
(2.9 to 6.1%), ribose (2.5 to 3.5%), rhamnose (1.9 to 2.5%), mannose (0.2% to
0.7%) and fucose (0.1 to 0.6%) (Table 3.4).

60
Table 3.4 Fibre components of pea embryos by GC analysis
Embryo
NSP
Rhamnose Ribose Fucose Arabinose Xylose Mannose Glucose Galactose total
cultivars (%)a (%) (%) (%) (%) (%) (%) (%) (%)
Courier Total % (mg/100mg dwt) 0.17±0.03b 0.08±0.00 0.04±0.00 3.92±0.03 0.30±0.01 0.04±0.00 3.00±0.05 0.47±0.01 8.01±0.05
% (sugar/total sugar) 2.1±0.4 0.9±0 0.5±0 48.9±0.5 3.7±0.1 0.5±0 37.4±0.6 5.9±0.1
Insoluble % (mg/100mg dwt) 0.11±0.02 0.01±0.00 0.04±0.00 2.45±0.20 0.21±0.01 0.03±0.01 2.30±0.31 0.24±0.01 5.40±0.42
% (sugar/total sugar) 2.1±0.3 0.3±0.1 0.7±0.1 45.6±3.1 4.0±0.1 0.6±0.1 42.5±3.0 4.4±0.1
Soluble % (mg/100mg dwt) 0.06±0.01 0.06±0.00 0.00±0.01 1.47±0.23 0.09±0.02 0.01±0.01 0.69±0.30 0.23±0.01 2.62±0.38
% (sugar/total sugar) 2.4±0.9 2.5±0.4 0.1±0.3 57.3±9.1 3.2±0.2 0.4±0.2 25.0±10.4 9.2±0.9
Canstar Total % (mg/100mg dwt) 0.17±0.04 0.09±0.01 0.04±0.01 3.84±0.47 0.29±0.02 0.04±0.00 2.48±0.31 0.53±0.04 7.48±0.87
% (sugar/total sugar) 2.2±0.3 1.2±0.1 0.6±0.0 51.2±1.2 4.0±0.3 0.6±0.0 33.1±1.2 7.2±0.3
insoluble % (mg/100mg dwt) 0.12±0.01 0.02±0.00 0.03±0.01 2.79±0.41 0.24±0.03 0.04±0.00 1.86±0.03 0.26±0.02 5.37±0.50
% (sugar/total sugar) 2.3±0.2 0.4±0.1 0.6±0.1 51.4±3.1 4.4±0.2 0.7±0.1 35.2±3.1 4.9±0.1
Soluble % (mg/100mg dwt) 0.05±0.04 0.07±0.01 0.01±0.00 1.04±0.06 0.05±0.01 0.00±0.01 0.62±0.30 0.27±0.02 2.11±0.41
% (sugar/total sugar) 1.9±1.4 3.5±0.6 0.4±0.3 51.8±6.2 2.9±1.1 0.2±0.3 26.1±7.9 13.2±1.4
Solido Total % (mg/100mg dwt) 0.16±0.02 0.08±0.01 0.05±0.00 3.61±0.52 0.34±0.05 0.05±0.01 2.96±0.48 0.51±0.03 7.75±0.46
% (sugar/total sugar) 2.0±0.2 1.0±0.1 0.6±0.0 46.4±5.0 4.3±0.4 0.6±0.1 38.4±6.0 6.6±0.3
Insoluble % (mg/100mg dwt) 0.17±0.05 0.02±0.00 0.03±0.01 2.05±0.28 0.19±0.02 0.04±0.01 2.13±0.59 0.20±0.02 4.83±0.90
% (sugar/total sugar) 3.8±1.5 0.3±0 0.6±0.1 43.2±2.1 4.1±0.3 0.7±0.2 42.9±4.1 4.3±0.3
Soluble % (mg/100mg dwt) 0c 0.06±0.01 0.01±0.00 1.56±0.24 0.14±0.02 0.01±0.01 1.76±1.01 0.31±0.02 2.92±0.67
% (sugar/total sugar) 0c 2.6±0.9 0.6±0.2 65.4±27.4 6.1±2.6 0.4±0.3 12.1±36.8 12.4±3.9 a % = mg/100 mg dry weight of sample b Data are means ± SE, n=3 c Experimental error. Soluble fibre value is calculated as total fibre value subtracts insoluble fibre value

61
Among the seed coats of the pea cultivars studied, the main components of
the total fibre fraction were glucose (71 to 74%) and xylose (15 to 20%). The less
abundant components of the total fibre fraction were arabinose (5.9 to 6.6%),
galactose (1.6 to 2.1%), rhamnose (0.6 to 1.2%), mannose (0.3 to 0.4%), fucose
(0.4%) and ribose (0.1%) (Table 3.5).
The main components of the soluble fibre fraction of the pea seed coats also
consisted of glucose (30 to 45%), arabinose (20 to 33%), xylose (19 to 20%),
galactose (8 to 13%), rhamnose (3.2 to 4.8%), fucose (1 to 2%), mannose (0.5 to
1.9%), and ribose (0.1 to 0.7%) (Table 3.5).
The composition of the dietary fiber varies in the seed coat (termed outer
fiber of the seed by food scientists) and in the embryo (termed inner fiber of the
seed by food scientists) (Brooks et al., 2008). The greatest difference between
seed coat fibre and embryo fibre is the amount of cellulosic and non-cellulosic
polysaccharide present. For example, the fibre from seed coats of various lupin
species (belongs to legume family) contains large quantities of cellulose ranging
from 35 to 56% (Brillouet and Riochet, 1983), and lower amounts of
hemicelluloses and pectins (Weightman et al. 1994). The fibre components of pea
and faba bean embryos contain about 55% pectic substances, about 9% cellulose,
and 6% to 12% non-starchy non-cellulosic glucans (a polymer of glucose)
(Brillouet and Carre, 1983).
As discussed in the literature review, the major cross-linking glycans in dicot
cell walls are xyloglucans (Buchanan et al., 2002). Xyloglucans are linear chains
of glucose with xylose side chains, and sometimes the xylosyl sites are substituted
further with galactose, then some galactose is further substituted with fucose
(Buchanan et al., 2002). The legume family contains the xyloglycan class known
as fucogalacto-xyloglucans which are made up of mainly linear chains of glucose,
some xylose and very minor amounts of galactose from the side chains (Brennan
and Harris 2011) (Figure 1.14). Dicots also contain glucuronoarabinoxylans in
addition to the more abundant xyloglucans (Buchanan et al., 2002).
Glucuronoarabinoxylans are composed of linear chains of xylose with arabinose
and glucuronic acids as the branching side chains (Figure 1.15).

62
In our study, the main components of total fibre in the pea embryo (arabinose
46 to 51% and glucose 33 to 38%) varied from that in the pea seed coat (glucose
71 to 74% and xylose 15 to 20%) (Table 3.4 and 3.5). These data indicate that
the most abundant component of the pea seed coat total fibre was cellulose (made
up of linear chains of glucose). Since cellulose is a water-insoluble polysaccharide,
the insoluble fibre component is also mainly made up of cellulose (35 to 43%
glucose in pea embryos, 71 to 80% in pea seed coats) (Table 3.4 and 3.5). The
occurrence of fucose, galactose, and xylose is indicative of the presence of the
microfibril cross-linking polysaccharide fucogalacto-xyloglucan. The presence of
arabinose (5.9 to 6.6%) in total fibre of pea seed coats suggests the presence of
glucuronoarabinoxylans and/or pectins (Buchanan et al., 2002). Rhamnose is also
a constituent of pectins. Mannose was also present at very low levels, indicating
the presence of glucomannans, galactoglucomannans, or galactomannans in
interlocking microfibrils in the cell wall (Buchanan et al., 2002).
The pea embryo consists of polysaccharides having various degrees of
solubility, including hemicelluloses, pectins and celluloses (Dahl et al., 2012). In
our study, the high amount of arabinose in total fibre indicates the presence of
pectins as a main component in embryo fraction. The glucose was likely from the
backbone of xyloglucans. Very small amount of rhamnose, ribose, and mannose
were present (Table 3.4).
The main component of the soluble fibre of the pea seed coats is arabinose
(20 to 33%) (Table 3.5), likely from glucuronoarabinoxylans or a small amount
of pectin. Soluble fibre glucose (30 to 45%) (Table 3.5) is likely from
xyloglucans and a small amount of cellulose. Galactose, xylose and the small
amount of fucose indicated the presence of fucogalacto-xyloglucans in this
fraction. Rhamnose, ribose and mannose were in very small amounts in the seed
coat soluble fibre fraction.
In pea embryos, the soluble fibre component arabinose was the main
component likely from pectins and/or glucuronoarabinoxylans. Rhamnose also
was likely from pectins. Galactose, xylose and small amount of fucose indicated

63
the presence of fucogalacto-xyloglucans. Ribose and mannose were in very small
amounts in the seed embryo soluble fibre fraction (Table 3.4).

64
Table 3.5 Fibre components of pea seed coats by GC analysis
Seed
coat
NSP
Rhamnose Ribose Fucose Arabinose Xylose Mannose Glucose Galactose total
cultivars (%)a (%) (%) (%) (%) (%) (%) (%) (%)
Courier Total % (mg/100mg dwt) 0.63±0.03b 0.06±0.01 0.20±0.01 3.41±0.17 7.49±0.42 0.21±0.01 38.26±0.89 1.08±0.03 51.34±0.56
% (sugar/total sugar) 1.2±0.1 0.1±0.0 0.4±0.0 6.6±0.04 14.6±0.9 0.4±0.0 74.5±1.1 2.1±0.1
Insoluble % (mg/100mg dwt) 0.37±0.03 0.02±0.00 0.11±0.01 1.81±0.10 5.89±0.19 0.16±0.01 34.77±1.40 0.50±0.03 43.61±1.69
% (sugar/total sugar) 0.8±0.1 0.0±0.0 0.2±0.0 4.1±0.1 13.5±0.3 0.4±0.0 79.7±0.1 1.1±0.0
Soluble % (mg/100mg dwt) 0.26±0.02 0.05±0.01 0.10±0.01 1.60±0.27 1.61±0.55 0.05±0.01 3.49±0.58 0.58±0.00 7.73±1.37
% (sugar/total sugar) 3.7±0.7 0.7±0.2 1.3±0.3 20.8±0.3 19.7±3.2 0.7±0.1 45.3±0.9 7.9±1.3
Canstar Total % (mg/100mg dwt) 0.33±0.01 0.02±0.00 0.22±0.00 3.53±0.09 11.98±0.33 0.15±0.01 41.55±1.37 0.95±0.01 58.72±1.97
% (sugar/total sugar) 0.6±0.0 0.0±0.0 0.4±0.0 6.0±0.0 20.4±0.3 0.3±0.0 70.7±0.3 1.6±0.0
Insoluble % (mg/100mg dwt) 0.19±0.01 0.01±0.00 0.16±0.00 2.21±0.06 10.96±0.29 0.12±0.00 34.84±3.49 0.59±0.03 49.07±3.17
% (sugar/total sugar) 0.4±0.0 0.0±0.0 0.3±0.0 4.5±0.4 22.6±2.1 0.2±0.0 70.7±2.7 1.2±0.1
Soluble % (mg/100mg dwt) 0.14±0.02 0.01±0.00 0.06±0.00 1.32±0.11 1.02±0.45 0.03±0.01 6.71±4.69 0.36±0.02 9.65±6.75
% (sugar/total sugar) 3.2±2.0 0.1±0.0 1.6±1.1 33.3±21.9 19.7±9.2 0.5±0.2 31.6±40.8 10.1±7.1
Solido Total % (mg/100mg dwt) 0.57±0.03 0.04±0.01 0.24±0.01 3.58±0.20 10.00±0.39 0.28±0.01 44.11±0.55 1.31±0.04 60.14±0.97
% (sugar/total sugar) 0.9±0.0 0.1±0.0 0.4±0.0 5.9±0.2 16.7±0.5 0.4±0.0 73.4±0.8 2.1±0.0
Insoluble % (mg/100mg dwt) 0.38±0.01 0.01±0.01 0.17±0.00 2.44±0.17 9.07±0.43 0.21±0.01 42.47±1.45 0.79±0.05 55.55±1.62
% (sugar/total sugar) 0.7±0.0 0.0±0.0 0.3±0.0 4.4±0.4 16.3±0.4 0.4±0.0 76.4±0.8 1.4±0.1
Soluble % (mg/100mg dwt) 0.19±0.02 0.03±0.00 0.07±0.01 1.14±0.11 0.93±0.39 0.07±0.02 1.65±1.00 0.52±0.03 4.59±1.32
% (sugar/total sugar) 4.8±1.4 0.7±0.1 1.7±0.6 29.3±8.7 18.8±3.2 1.9±0.8 29.7±11.9 13.2±3.6 a % = mg/100 mg dry weight of sample b Data are means ± SE, n=3

65
In general, our data with respect of pea seed fibre composition were similar
to the data reported by Daveby et al. (1993) for pea embryos and seed coats (see
Table 3.6 for comparison). The only noted differences were that our pea embryo
fibre glucose content was about 10% higher and galactose content was 4% lower
than that reported by Daveby et al. (1993). Different pea cultivars and the place of
origin could affect the exact sugar components that make up the fibre of the
embryos.
Table 3.6 Comparison of data for the composition sugar components
of pea seed fibre
Pea Fucose Arabinose Xylose Glucose Galactose
Embryo
Daveby et al
1993a
43%-45%b 5.4%-7.9% 23%-25% 9.4%-11.6%
Current studyc
46%-49% 3.7%-4.3% 33%-38% 5.8%-7.1%
Seed coats
Daveby et al
1993 0.4%-0.5%
13.5%-16.8% 74.9%-75.8% 2.5%-2.7%
Current study 0.3%-0.4% 15%-20% 70%-75% 1.6%-2.2%
a Pea cultivars ‘Timo’ ‘Vreta’ ‘Capella’ grown in Ultuna, Sweden
b Calculated as the amount of constituent sugar divided by the sum of total sugars
c Pea cultivars ‘Solido’ ‘Canstar’ ‘Courier’ grown in Alberta, Canada
Faba bean
In the embryos of the faba bean cultivars studied, the main components of
the total fibre fraction were glucose (49 to 50%) and arabinose (35 to 38%). The
less abundant components of the total fibre fraction were galactose (5.1 to 5.4%),
xylose (4.3 to 4.6%), rhamnose (1.4 to 2.1%), ribose (1.1 to 1.3%), fucose (0.6 to
0.7%), and mannose (0.6%) (Table 3.7).
In the faba bean embryo soluble fibre fraction, the main components were
arabinose (63 to 70%) and glucose (4 to 33%) (Table 3.7). The less abundant
components of the soluble fibre fraction were galactose (13 to 17%), xylose (4.5
to 5.3%), ribose (4.2 to 2.7%), rhamnose (2.9 to 3.4%), mannose (1.2 to 1.8%),
and fucose (0 to 0.3%) (Table 3.7).

66
Table 3.7 Fibre components of faba bean seed embryos by GC analysis.
a % = mg/100 mg dry weight of sample
b Data are means ± SE, n=3
Embryo
cultivar NSP
Rhamnose
(%)a
Ribose
(%)
Fucose
(%)
Arabinose
(%)
Xylose
(%)
Mannose
(%)
Glucose
(%)
Galactose
(%)
total
(%)
Fatima Total % (mg/100mg dwt) 0.09±0.02b 0.08±0.01 0.04±0.00 2.49±0.20 0.28±0.02 0.04±0.00 3.22±0.31 0.33±0.00 6.59±0.07
% (sugar/total sugar) 1.4±0.3 1.1±0.1 0.6±0.0 37.9±3.4 4.3±0.4 0.6±0.0 48.9±4.1 5.1±0.1
Insoluble % (mg/100mg dwt) 0.06±0.01 0.01±0.00 0.04±0.00 1.45±0.17 0.20±0.01 0.02±0.00 2.89±0.26 0.14±0.01 4.82±0.38
% (sugar/total sugar) 1.2±0.1 0.2±0.0 0.8±0.0 30.0±2.3 4.2±0.2 0.4±0.0 60.1±2.7 3.0±0.1
Soluble % (mg/100mg dwt) 0.03±0.02 0.06±0.02 0.01±0.00 1.04±0.23 0.08±0.02 0.02±0.01 0.33±0.28 0.19±0.05 1.77±0.46
% (sugar/total sugar) 2.9±2.0 4.2±1.2 0.3±0.1 70.2±22.3 5.3±1.5 1.2±0.4 33.4±11.0 12.6±3.6
Snowbird Total % (mg/100mg dwt) 0.13±0.04 0.08±0.00 0.04±0.00 2.20±0.08 0.28±0.01 0.04±0.00 3.10±0.16 0.34±0.01 6.22±0.12
% (sugar/total sugar) 2.1±0.6 1.3±0.1 0.7±0.0 35.4±1.9 4.6±0.2 0.6±0.0 49.9±1.6 5.4±0.2
Insoluble % (mg/100mg dwt) 0.08±0.01 0.01±0.00 0.04±0.00 1.60±0.07 0.23±0.02 0.02±0.00 2.92±0.15 0.17±0.00 5.09±0.23
% (sugar/total sugar) 1.5±0.1 0.3±0.0 0.9±0.0 31.6±0.7 4.6±0.3 0.4±0.0 57.4±0.8 3.4±0.2
Soluble % (mg/100mg dwt) 0.06±0.06 0.06±0.03 0.00±0.01 0.59±0.77 0.05±0.11 0.02±0.01 0.19±1.16 0.17±0.12 1.13±2.26
% (sugar/total sugar) 3.4±2.4 6.7±1.9 0 62.8±17.0 4.5±0.7 1.8±0.3 3.8±20.6 17.3±4.2
67
Among the seed coats of the faba bean cultivars, the main components of the
total fibre fraction were glucose (77 to 81%) and xylose (15 to 18%). The less
abundant components of the total fibre fraction were galactose (1.5 to 1.6%),
arabinose (1.7 to 2.1%), fucose (0.2%), rhamnose (0.6%), mannose (0.2%), and
ribose (0.01%) (Table 3.8).
In the faba bean seed coat soluble fibre fraction, the main components were
glucose (58 to 86%) and xylose (14 to 16%). The less abundant components of
the total fibre fraction were galactose (10 to 19%), arabinose (11 to 13%),
rhamnose (3.6 to 7.4%), fucose (0.8 to 1.5%), ribose (0 to 0.7%), and mannose
(0.5 to 1.0%) (Table 3.8).
The main components of total fibre in the faba bean embryo glucose (49 to
50%) and arabinose (35 to 38%) varied from that in the faba bean seed coat
glucose (77 to 81%) and xylose (15 to 18%) (Table 3.7 and 3.8). These data
indicate that the most abundant component of the faba bean seed coat total fibre
was cellulose. The insoluble fibre component is also mainly made up of cellulose
(57 to 60% glucose in faba bean embryos, 79 to 82% in faba bean seed coats)
(Table 3.7 and 3.8). The occurrence of fucose, galactose, and xylose is indicative
of the presence of the microfibril cross-linking polysaccharide fucogalacto-
xyloglucan. The presence of arabinose (1.7 to 2.1%) in the total fibre of faba
bean seed coats suggests the presence of small amount of glucuronoarabinoxylans
and/or pectins (Buchanan et al., 2002). Very small amounts of rhamnose, ribose,
and mannose were present (Table 3.8).
The faba bean embryo consists of high amount of arabinose (35 to 38%) in
total fibre, which indicates the presence of pectins as a main component in
embryo fraction. The glucose was likely from the backbone of xyloglucans.
Fucogalacto-xyloglucan was likely present, and small amounts of rhamnose,
ribose, and mannose also were present (Table 3.7).
The main components of the soluble fibre of the faba bean seed coats were
glucose (58 to 86%) and xylose (14 to 16%) (Table 3.8), likely from xyloglucans
and a small amount of cellulose. Arabinose (11 to 13%) was likely from pectins
and glucuronoarabinoxylans. Galactose, xylose and small amount of fucose
68
indicated the presence of fucogalacto-xyloglucans in this fraction. Rhamnose was
likely indicative of the presence of small amount of pectins. Ribose and mannose
were in very small amounts in the seed coat soluble fibre fraction (Table 3.8).
In faba bean embryos, the soluble fibre component arabinose (63 to 70%)
was the main component likely from pectins and/or glucuronoarabinoxylans.
Glucose (4 to 33%) was likely from the backbone of xyloglucans and a small
amount of cellulose. Rhamnose is also a constituent of pectins. Galactose, xylose
and small amount of fucose indicate the presence of fucogalacto-xyloglucans.
Ribose and mannose were found in very small amounts in the seed embryo
soluble fibre fraction (Table 3.7).

69
Table 3.8 Fibre components of faba bean seed coats by GC analysis.
a % = mg/100 mg dry weight of sample
b Data are means ± SE, n=3
Seed coat cultivars
NSP Rhamnose
(%)a
Ribose
(%)
Fucose
(%)
Arabinose
(%)
Xylose
(%)
Mannose
(%)
Glucose
(%)
Galactose
(%)
total
(%)
Fatima Total % (mg/100mg dwt) 0.33±0.03b 0.02±0.01 0.11±0.02 0.97±0.08 8.53±0.36 0.10±0.01 45.35±3.81 0.89±0.07 56.30±4.36
% (sugar/total sugar) 0.6±0.0 0.0±0.0 0.2±0.0 1.7±0.1 15.2±0.6 0.2±0.0 80.5±0.6 1.6±0.0
Insoluble % (mg/100mg dwt) 0.17±0.03 0.01±0.00 0.07±0.01 0.62±0.05 8.31±0.73 0.08±0.01 45.20±5.11 0.50±0.03 54.96±5.95
% (sugar/total sugar) 0.3±0.0 0.0±0.0 0.1±0.0 1.1±0.0 15.2±0.4 0.1±0.0 82.1±0.5 0.9±0.1
Soluble % (mg/100mg dwt) 0.16±0.06 0.01±0.01 0.05±0.03 0.34±0.12 0.22±1.00 0.02±0.01 0.15±7.84 0.39±0.09 1.35±9.14
% (sugar/total sugar) 7.4±5.9 0.7±0.7 1.5±1.3 11.4±11.3 15.7±4.8 0.5±0.4 86.3±6.2 18.4±15.2
Snowbird Total % (mg/100mg dwt) 0.41±0.04 0.01±0.00 0.11±0.01 1.54±0.07 13.04±0.80 0.12±0.00 55.35±1.64 1.09±0.03 71.65±2.53
% (sugar/total sugar) 0.6±0.0 0.0±0.0 0.2±0.0 2.1±0.0 18.2±0.5 0.2±0.0 77.3±0.5 1.5±0.1
Insoluble % (mg/100mg dwt) 0.18±0.03 0.02±0.01 0.06±0.01 0.74±0.08 11.09±0.99 0.06±0.01 48.20±4.99 0.53±0.07 60.87±6.13
% (sugar/total sugar) 0.3±0.0 0.0±0.0 0.1±0.0 1.2±0.1 18.3±0.3 0.1±0.0 79.1±0.4 0.9±0.1
Soluble % (mg/100mg dwt) 0.22±0.05 0 0.05±0.02 0.77±0.13 1.95±1.52 0.06±0.01 7.15±5.30 0.57±0.05 10.77±6.93
% (sugar/total sugar) 3.6±1.3 0 0.8±0.3 12.6±4.4 14.0±13.0 1.0±0.3 58.0±15.2 10.0±3.8

70
Lentil
In the embryos of the lentil cultivars studied, the main components of the
total fibre fraction were glucose (53 to 57%) and arabinose (32 to 34%). The less
abundant components of the total fibre fraction were ribose (1.4 to 14%),
galactose (4 to 5%), xylose (3.5 to 4.0%), rhamnose (0.7 to 1.3%), mannose (0.6
to 0.8%), and fucose (0.4 to 0.5%) (Table 3.9).
The soluble lentil embryo fibre fraction had a similar component profile to
the total fibre fraction, where glucose (15 to 44%) and arabinose (32 to 36%)
were the main components. The less abundant components of the total fibre
fraction were galactose (6.5 to 26%), ribose (5 to 14%), xylose (4.6 to 6.3%),
mannose (1.8 to 6.9%), rhamnose (0 to 4.3%), and fucose (0.4 to 0.7%) (Table
3.9).
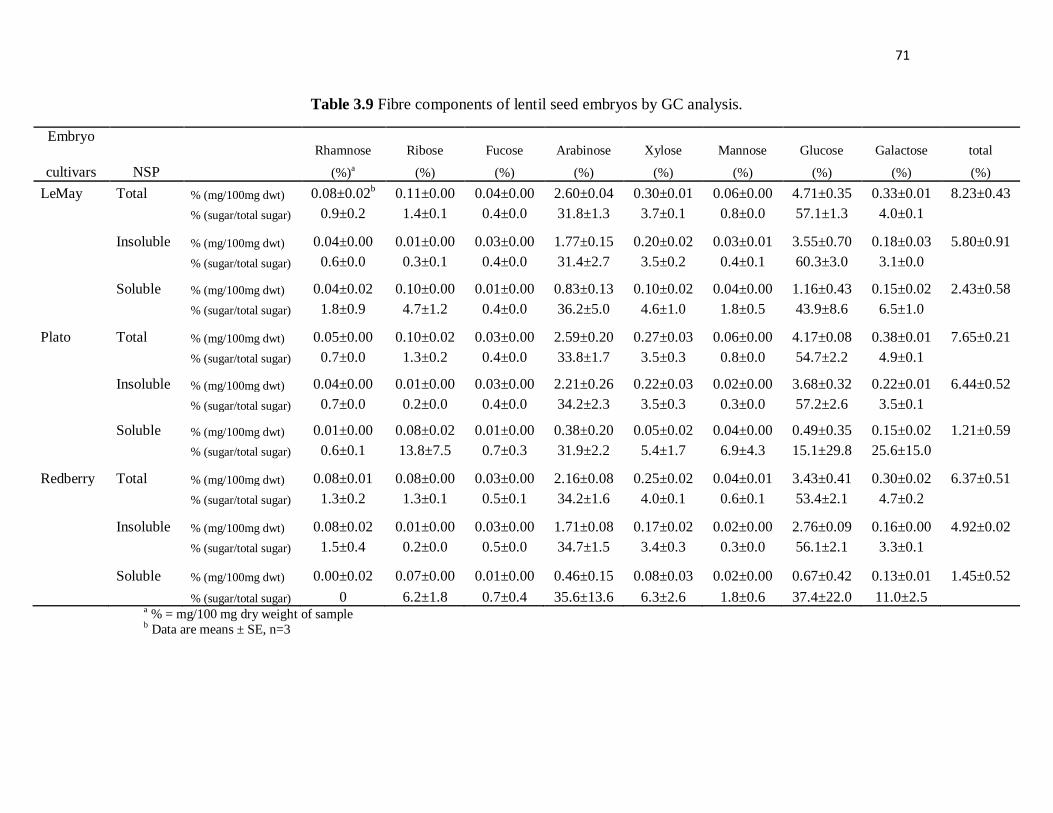
71
Table 3.9 Fibre components of lentil seed embryos by GC analysis.
Embryo
NSP
Rhamnose Ribose Fucose Arabinose Xylose Mannose Glucose Galactose total
cultivars (%)a (%) (%) (%) (%) (%) (%) (%) (%)
LeMay Total % (mg/100mg dwt) 0.08±0.02b 0.11±0.00 0.04±0.00 2.60±0.04 0.30±0.01 0.06±0.00 4.71±0.35 0.33±0.01 8.23±0.43
% (sugar/total sugar) 0.9±0.2 1.4±0.1 0.4±0.0 31.8±1.3 3.7±0.1 0.8±0.0 57.1±1.3 4.0±0.1
Insoluble % (mg/100mg dwt) 0.04±0.00 0.01±0.00 0.03±0.00 1.77±0.15 0.20±0.02 0.03±0.01 3.55±0.70 0.18±0.03 5.80±0.91
% (sugar/total sugar) 0.6±0.0 0.3±0.1 0.4±0.0 31.4±2.7 3.5±0.2 0.4±0.1 60.3±3.0 3.1±0.0
Soluble % (mg/100mg dwt) 0.04±0.02 0.10±0.00 0.01±0.00 0.83±0.13 0.10±0.02 0.04±0.00 1.16±0.43 0.15±0.02 2.43±0.58
% (sugar/total sugar) 1.8±0.9 4.7±1.2 0.4±0.0 36.2±5.0 4.6±1.0 1.8±0.5 43.9±8.6 6.5±1.0
Plato Total % (mg/100mg dwt) 0.05±0.00 0.10±0.02 0.03±0.00 2.59±0.20 0.27±0.03 0.06±0.00 4.17±0.08 0.38±0.01 7.65±0.21
% (sugar/total sugar) 0.7±0.0 1.3±0.2 0.4±0.0 33.8±1.7 3.5±0.3 0.8±0.0 54.7±2.2 4.9±0.1
Insoluble % (mg/100mg dwt) 0.04±0.00 0.01±0.00 0.03±0.00 2.21±0.26 0.22±0.03 0.02±0.00 3.68±0.32 0.22±0.01 6.44±0.52
% (sugar/total sugar) 0.7±0.0 0.2±0.0 0.4±0.0 34.2±2.3 3.5±0.3 0.3±0.0 57.2±2.6 3.5±0.1
Soluble % (mg/100mg dwt) 0.01±0.00 0.08±0.02 0.01±0.00 0.38±0.20 0.05±0.02 0.04±0.00 0.49±0.35 0.15±0.02 1.21±0.59
% (sugar/total sugar) 0.6±0.1 13.8±7.5 0.7±0.3 31.9±2.2 5.4±1.7 6.9±4.3 15.1±29.8 25.6±15.0
Redberry Total % (mg/100mg dwt) 0.08±0.01 0.08±0.00 0.03±0.00 2.16±0.08 0.25±0.02 0.04±0.01 3.43±0.41 0.30±0.02 6.37±0.51
% (sugar/total sugar) 1.3±0.2 1.3±0.1 0.5±0.1 34.2±1.6 4.0±0.1 0.6±0.1 53.4±2.1 4.7±0.2
Insoluble % (mg/100mg dwt) 0.08±0.02 0.01±0.00 0.03±0.00 1.71±0.08 0.17±0.02 0.02±0.00 2.76±0.09 0.16±0.00 4.92±0.02
% (sugar/total sugar) 1.5±0.4 0.2±0.0 0.5±0.0 34.7±1.5 3.4±0.3 0.3±0.0 56.1±2.1 3.3±0.1
Soluble % (mg/100mg dwt) 0.00±0.02 0.07±0.00 0.01±0.00 0.46±0.15 0.08±0.03 0.02±0.00 0.67±0.42 0.13±0.01 1.45±0.52
% (sugar/total sugar) 0 6.2±1.8 0.7±0.4 35.6±13.6 6.3±2.6 1.8±0.6 37.4±22.0 11.0±2.5 a % = mg/100 mg dry weight of sample b Data are means ± SE, n=3

72
Among the seed coats of the lentil cultivars, the main components of the total
fibre fraction were glucose (61 to 65%), and xylose (21 to 25%). The less
abundant components of the total fibre fraction were arabinose (8 to 10%),
galactose (2.2 to 2.8%), rhamnose (0.6 to 1.0%), ribose (0.1%), and mannose (0.3
to 0.4%) and fucose (0.2%) (Table 3.10).
In the lentil seed coat soluble fibre fraction, the main components were
arabinose (21 to 49%) and glucose (7.6 to 26%). The less abundant components
of the total fibre fraction were xylose (16 to 25%), galactose (7 to 13%),
rhamnose (1.6 to 3.3%), mannose (0.8 to 1.5%), ribose (0.3 to 0.8%) and fucose
(0.3 to 0.7%) (Table 3.10).
The main components of total fibre in the lentil embryo (glucose 53 to 57%
and arabinose 32 to 34%) varied from that in the lentil seed coat (glucose 61 to 65%
and xylose 21 to 25%) (Table 3.9 and 3.10). These data indicate that the most
abundant component of the lentil seed coat total fibre was cellulose (made up of
linear chains of glucose). The insoluble fibre component is also mainly made up
of cellulose (56 to 60% glucose in lentil embryos, 67 to 72% in lentil seed coats)
(Table 3.9 and 3.10). The occurrence of fucose, galactose, and xylose in lentil
seed coat total fibre is indicative of the presence of the microfibril cross-linking
polysaccharide fucogalacto-xyloglucan. The presence of arabinose (8 to 10%) in
the total fibre of lentil seed coats suggests the presence of glucuronoarabinoxylans
and/or pectins. Rhamnose was also a constituent of pectins. Mannose was also
present at very low levels indicating the presence of glucomannans,
galactoglucomannans, or galactomannans for interlocking microfibrils in the cell
wall (Buchanan et al., 2002) (Table 3.10).
The lentil embryo consists of a high amount of arabinose (32 to 36%) in total
fibre, this indicates the presence of pectins as a main component in embryo
fraction. The glucose (15 to 44%) was likely from backbone of xyloglucans. Very
small amounts of rhamnose, ribose, and mannose were present (Table 3.9).
The main component of the soluble fibre of the lentil seed coats is arabinose
(21 to 49%) (Table 3.10), likely from glucuronoarabinoxylans or a small amount
of pectin. Soluble fibre glucose (7.6 to 26%) (Table 3.10) is likely from

73
xyloglucans and a small amount of cellulose. Galactose, xylose and a small
amount of fucose indicate the presence of fucogalacto-xyloglucans in this fraction.
Rhamnose, ribose and mannose were found in very small amounts in the seed coat
soluble fibre fraction.
In lentil embryos soluble fibre components, arabinose (32 to 36%) was the
main component likely from pectins and/or glucuronoarabinoxylans. Rhamnose
was likely from pectins. Glucose (15 to 44%) was likely from the xyloglucans
backbone. Galactose, xylose and small amount of fucose indicate the presence of
fucogalacto-xyloglucans. Ribose and mannose were found in very small amounts
in the seed embryo soluble fibre fraction (Table 3.9).
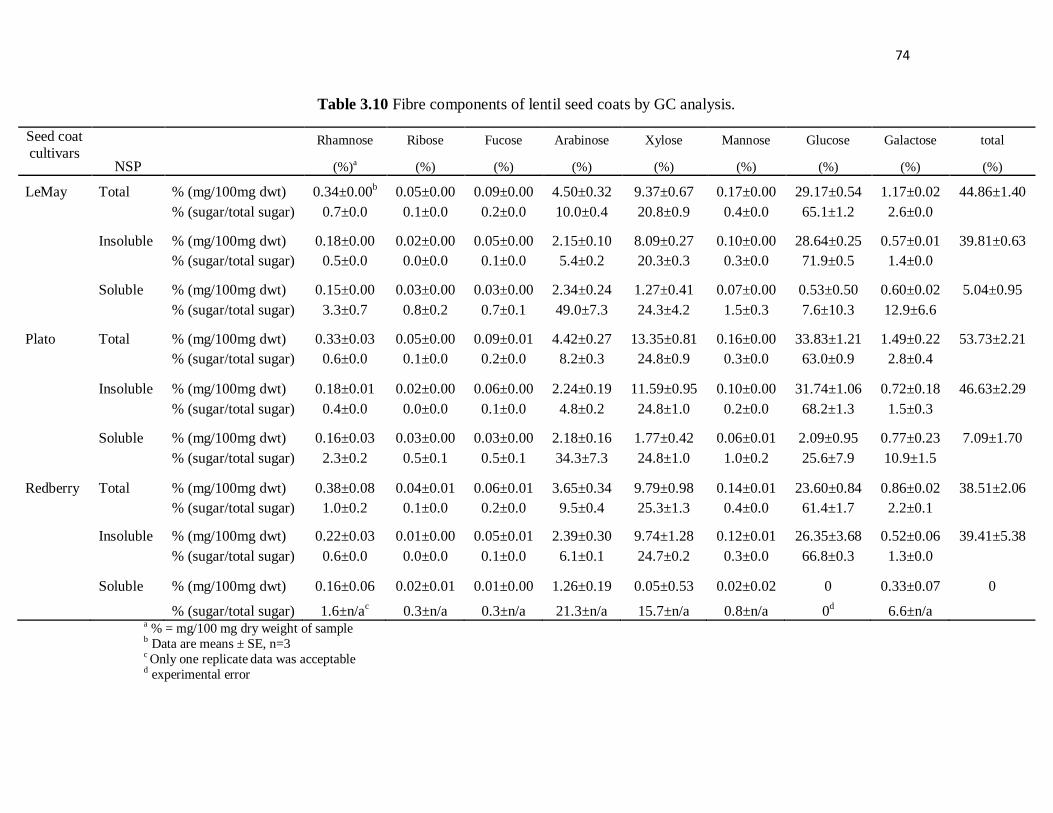
74
Table 3.10 Fibre components of lentil seed coats by GC analysis.
Seed coat
cultivars NSP
Rhamnose Ribose Fucose Arabinose Xylose Mannose Glucose Galactose total
(%)a (%) (%) (%) (%) (%) (%) (%) (%)
LeMay Total % (mg/100mg dwt) 0.34±0.00b 0.05±0.00 0.09±0.00 4.50±0.32 9.37±0.67 0.17±0.00 29.17±0.54 1.17±0.02 44.86±1.40
% (sugar/total sugar) 0.7±0.0 0.1±0.0 0.2±0.0 10.0±0.4 20.8±0.9 0.4±0.0 65.1±1.2 2.6±0.0
Insoluble % (mg/100mg dwt) 0.18±0.00 0.02±0.00 0.05±0.00 2.15±0.10 8.09±0.27 0.10±0.00 28.64±0.25 0.57±0.01 39.81±0.63
% (sugar/total sugar) 0.5±0.0 0.0±0.0 0.1±0.0 5.4±0.2 20.3±0.3 0.3±0.0 71.9±0.5 1.4±0.0
Soluble % (mg/100mg dwt) 0.15±0.00 0.03±0.00 0.03±0.00 2.34±0.24 1.27±0.41 0.07±0.00 0.53±0.50 0.60±0.02 5.04±0.95
% (sugar/total sugar) 3.3±0.7 0.8±0.2 0.7±0.1 49.0±7.3 24.3±4.2 1.5±0.3 7.6±10.3 12.9±6.6
Plato Total % (mg/100mg dwt) 0.33±0.03 0.05±0.00 0.09±0.01 4.42±0.27 13.35±0.81 0.16±0.00 33.83±1.21 1.49±0.22 53.73±2.21
% (sugar/total sugar) 0.6±0.0 0.1±0.0 0.2±0.0 8.2±0.3 24.8±0.9 0.3±0.0 63.0±0.9 2.8±0.4
Insoluble % (mg/100mg dwt) 0.18±0.01 0.02±0.00 0.06±0.00 2.24±0.19 11.59±0.95 0.10±0.00 31.74±1.06 0.72±0.18 46.63±2.29
% (sugar/total sugar) 0.4±0.0 0.0±0.0 0.1±0.0 4.8±0.2 24.8±1.0 0.2±0.0 68.2±1.3 1.5±0.3
Soluble % (mg/100mg dwt) 0.16±0.03 0.03±0.00 0.03±0.00 2.18±0.16 1.77±0.42 0.06±0.01 2.09±0.95 0.77±0.23 7.09±1.70
% (sugar/total sugar) 2.3±0.2 0.5±0.1 0.5±0.1 34.3±7.3 24.8±1.0 1.0±0.2 25.6±7.9 10.9±1.5
Redberry Total % (mg/100mg dwt) 0.38±0.08 0.04±0.01 0.06±0.01 3.65±0.34 9.79±0.98 0.14±0.01 23.60±0.84 0.86±0.02 38.51±2.06
% (sugar/total sugar) 1.0±0.2 0.1±0.0 0.2±0.0 9.5±0.4 25.3±1.3 0.4±0.0 61.4±1.7 2.2±0.1
Insoluble % (mg/100mg dwt) 0.22±0.03 0.01±0.00 0.05±0.01 2.39±0.30 9.74±1.28 0.12±0.01 26.35±3.68 0.52±0.06 39.41±5.38
% (sugar/total sugar) 0.6±0.0 0.0±0.0 0.1±0.0 6.1±0.1 24.7±0.2 0.3±0.0 66.8±0.3 1.3±0.0
Soluble % (mg/100mg dwt) 0.16±0.06 0.02±0.01 0.01±0.00 1.26±0.19 0.05±0.53 0.02±0.02 0 0.33±0.07 0
% (sugar/total sugar) 1.6±n/ac 0.3±n/a 0.3±n/a 21.3±n/a 15.7±n/a 0.8±n/a 0
d 6.6±n/a
a % = mg/100 mg dry weight of sample b Data are means ± SE, n=3 c Only one replicate data was acceptable d experimental error

75
Protein, starch and fibre components in the seed coat fractions of the pea
cultivars ‘Solido’ and ‘Canstar’.
The seed coats of the pea cultivars ‘Solido’ and ‘Canstar’ contained
approximately 6% to 8% protein and 0.2% to 0.6 % starch (Table 3.11). The
protein content in ‘Solido’ seed coats was slightly higher (1%) than that in
‘Canstar’ seed coats. The cooking treatment and the acid-hydrolysis treatment had
minimal effects on the seed coat protein and starch content in both cultivars
(Table 3.11).
Table 3.11 Protein and total starch components of raw, cooked and hydrolyzed
pea seed coats of ‘Solido’ and ‘Canstar’
Pea seed coat Protein (%)a Total starch (%)
’Solido’ raw 7.96±0.21b 0.46±0.04
‘Solido’ cookedc 8.36±0.09 0.36±0.04
‘Solido’ hydrolyzedd 8.22±0.17 0.16±0.03
‘Canstar’ raw 6.65±0.05 0.16±0.01
‘Canstar’ cooked 6.91±0.03 0.59±0.02
‘Canstar’ hydrolyzed 5.86±0.07 0.16±0.01
a % = mg/100 mg dry weight of sample
b Data are means ± SE, n=3
c placed in boiling water for 30 minutes
d incubated in 2N HCl solution at 100
0C for 1.5 hour, then partially
neutralized by NaOH solution.
There was no change in total fibre content with cooking treatment in
‘Canstar’ and ‘Solido’ (Tables 3.12, 3.13). Heating the seed coat fractions to
100oC for 30 min in water does not cleave the linkages between the fibre
components. However, hydration of the fibre components is possible. The acid-
hydrolysis treatment decreased the total fibre content of ‘Canstar’ by about 20%,

76
and hydrolyzed all the soluble fibre (Table 3.12). For ‘Solido’ seed coat fractions,
the hydrolysis treatment decreased total fibre by about 30%, and also hydrolyzed
all the soluble fibre (Table 3.13).
For ‘Canstar’ seed coat total fibre components, the acid-hydrolysis treatment
decreased glucose from 42 to 34 mg/100mg dry weight (dwt), xylose from 12 to
2.7 mg/100mg dwt, arabinose from 3.5 to 0.5 mg/100mg dwt, rhamnose from 0.3
to 0.2 mg/100mg dwt, fucose from 0.2 to 0.03 mg/100mg dwt, and galactose from
0.9 to 0.2 mg/100mg dwt. Mannose content did not change with the hydrolysis
treatment (Table 3.12).
For ‘Solido’ seed coats total fibre components, the acid-hydrolysis treatment
decreased glucose from 44 to 30 mg/100mg dwt, xylose from 10 to 2 mg/100mg
dwt, arabinose from 3.6 to 0.4 mg/100mg dwt, rhamnose from 0.6 to 0.1
mg/100mg dwt, fucose from 0.2 to 0.02 mg/100mg dwt, galactose from 1.3 to 0.2
mg/100mg dwt, and mannose from 0.3 to 0.1 mg/100mg dwt (Table 3.13).
The acid hydrolysis treatment can cleave the side-chain components of the
complex fibres, liberating xylose, arabinose, and fucose from fucogalacto-
xyloglucans and arabinoxyloglucans (leading to lower values of these sugars in
the fibre fraction after hydrolysis). The glucose component also decreased in both
cultivars with acid-hydrolysis. This is likely due to the cleavage of the glucose
backbone of the fucogalacto-xyloglucans and arabinoxyloglucans.

77
Table 3.12 Sugar components of raw, cooked and hydrolyzed seed coats of ‘Canstar’ by GC analysis
Canstar'
seed coat Treatment NSP
Rhamnose
(%)a
Ribose
(%)
Fucose
(%)
Arabinose
(%)
Xylose
(%)
Mannose
(%)
Glucose
(%)
Galactose
(%)
total
(%)
Raw Total % (mg/100mg dwt) 0.33±0.01b 0.02±0.00 0.22±0.00 3.53±0.09 11.98±0.33 0.15±0.01 41.55±1.37 0.95±0.01 58.72±1.97
% (sugar/total sugar) 0.6±0.0 0.0±0.0 0.4±0.0 6.0±0.0 20.4±0.3 0.3±0.0 70.7±0.3 1.6±0.0
Insoluble % (mg/100mg dwt) 0.19±0.01 0.01±0.00 0.16±0.00 2.21±0.06 10.96±0.29 0.12±0.00 34.84±3.49 0.59±0.03 49.07±3.17
% (sugar/total sugar) 0.4±0.0 0.0±0.0 0.3±0.0 4.5±0.4 22.6±2.1 0.2±0.0 70.7±2.7 1.2±0.1
Soluble % (mg/100mg dwt) 0.14±0.02 0.01±0.00 0.06±0.00 1.32±0.11 1.02±0.45 0.03±0.01 6.71±4.69 0.36±0.02 9.65±6.75
% (sugar/total sugar) 3.2±2.0 0.1±0.0 1.6±1.1 33.3±21.9 19.7±9.2 0.5±0.2 31.6±40.8 10.1±7.1
Cooked Total % (mg/100mg dwt) 0.55±0.04 0.12±0.02 0.16±0.08 3.37±0.12 13.35±0.32 0.22±0.03 48.73±1.06 1.13±0.04 67.13±1.13
% (sugar/total sugar) 0.8±0.1 0.2±0.0 0.2±0.1 5.0±0.2 19.8±0.6 0.3±0.0 72.0±0.7 1.7±0.1
Insoluble % (mg/100mg dwt) 0.29±0.03 0.05±0.00 0.14±0.01 1.66±0.09 11.61±0.52 0.18±0.01 43.60±1.59 0.54±0.02 58.07±2.27
% (sugar/total sugar) 0.5±0.0 0.1±0.0 0.2±0.0 2.9±0.1 20.0±0.1 0.3±0.0 75.1±0.2 0.9±0.0
Soluble % (mg/100mg dwt) 0.26±0.06 0.06±0.02 0.03±0.07 1.71±0.20 1.74±0.80 0.05±0.02 5.13±0.92 0.59±0.04 9.56±1.94
% (sugar/total sugar) 2.6±0.2 0.7±0.2 0.5±0.7 18.7±2.0 16.3±5.0 0.5±0.2 54.2±2.0 6.5±1.0
Hydrolyzed Total % (mg/100mg dwt) 0.15±0.01 0.10±0.00 0.03±0.00 0.54±0.03 2.66±0.17 0.13±0.01 33.68±0.31 0.24±0.01 37.54±0.49
% (sugar/total sugar) 0.4±0.0 0.3±0.0 0.1±0.0 1.4±0.1 7.1±0.4 0.4±0.0 89.7±0.5 0.6±0.0
Insoluble % (mg/100mg dwt) 0.05±0.00 0.06±0.01 0.02±0.01 0.45±0.01 2.36±0.04 0.11±0.00 36.76±0.46 0.16±0.01 39.95±0.50
% (sugar/total sugar) 0.1±0.0 0.1±0.0 0.1±0.0 1.1±0.0 5.9±0.1 0.3±0.0 92.0±0.1 0.4±0.0
Soluble % (mg/100mg dwt) 0 0 0 0 0 0 0 0 0
% (sugar/total sugar) 0 0 0 0 0 0 0 0 0
a % = mg/100 mg dry weight of sample
b Data are means ± SE, n=3
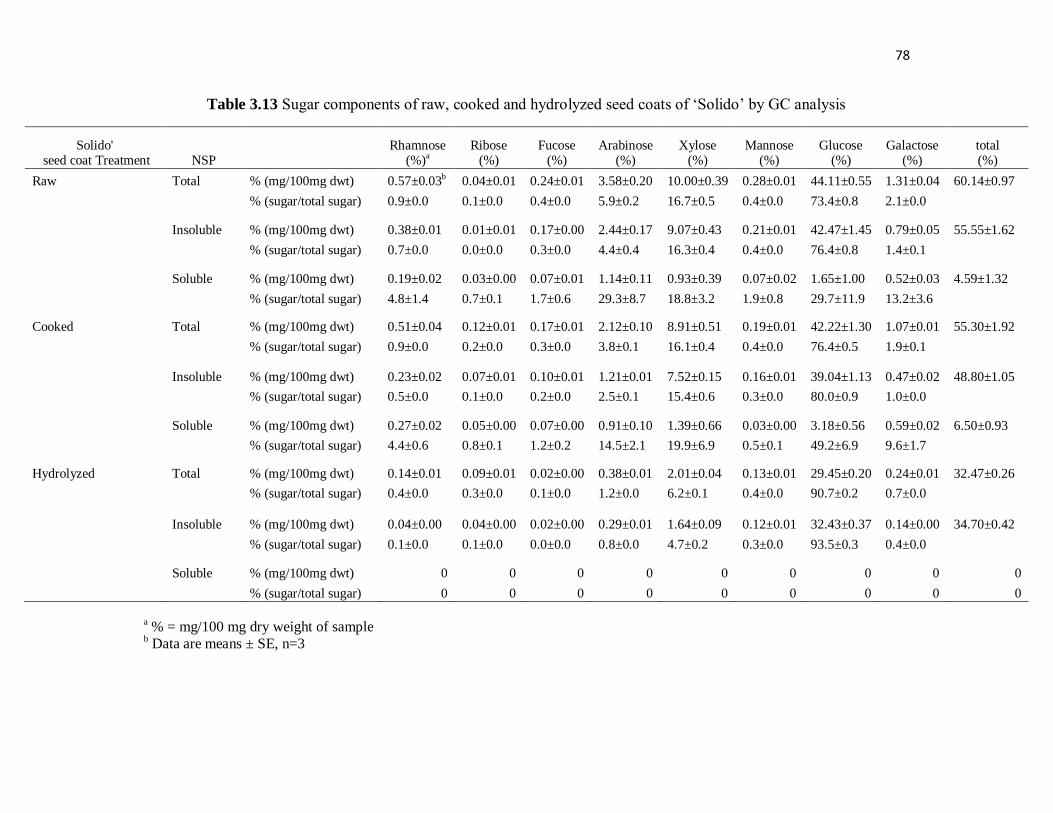
78
Table 3.13 Sugar components of raw, cooked and hydrolyzed seed coats of ‘Solido’ by GC analysis
Solido' seed coat Treatment NSP
Rhamnose (%)a
Ribose (%)
Fucose (%)
Arabinose (%)
Xylose (%)
Mannose (%)
Glucose (%)
Galactose (%)
total (%)
Raw Total % (mg/100mg dwt) 0.57±0.03b 0.04±0.01 0.24±0.01 3.58±0.20 10.00±0.39 0.28±0.01 44.11±0.55 1.31±0.04 60.14±0.97
% (sugar/total sugar) 0.9±0.0 0.1±0.0 0.4±0.0 5.9±0.2 16.7±0.5 0.4±0.0 73.4±0.8 2.1±0.0
Insoluble % (mg/100mg dwt) 0.38±0.01 0.01±0.01 0.17±0.00 2.44±0.17 9.07±0.43 0.21±0.01 42.47±1.45 0.79±0.05 55.55±1.62
% (sugar/total sugar) 0.7±0.0 0.0±0.0 0.3±0.0 4.4±0.4 16.3±0.4 0.4±0.0 76.4±0.8 1.4±0.1
Soluble % (mg/100mg dwt) 0.19±0.02 0.03±0.00 0.07±0.01 1.14±0.11 0.93±0.39 0.07±0.02 1.65±1.00 0.52±0.03 4.59±1.32
% (sugar/total sugar) 4.8±1.4 0.7±0.1 1.7±0.6 29.3±8.7 18.8±3.2 1.9±0.8 29.7±11.9 13.2±3.6
Cooked Total % (mg/100mg dwt) 0.51±0.04 0.12±0.01 0.17±0.01 2.12±0.10 8.91±0.51 0.19±0.01 42.22±1.30 1.07±0.01 55.30±1.92
% (sugar/total sugar) 0.9±0.0 0.2±0.0 0.3±0.0 3.8±0.1 16.1±0.4 0.4±0.0 76.4±0.5 1.9±0.1
Insoluble % (mg/100mg dwt) 0.23±0.02 0.07±0.01 0.10±0.01 1.21±0.01 7.52±0.15 0.16±0.01 39.04±1.13 0.47±0.02 48.80±1.05
% (sugar/total sugar) 0.5±0.0 0.1±0.0 0.2±0.0 2.5±0.1 15.4±0.6 0.3±0.0 80.0±0.9 1.0±0.0
Soluble % (mg/100mg dwt) 0.27±0.02 0.05±0.00 0.07±0.00 0.91±0.10 1.39±0.66 0.03±0.00 3.18±0.56 0.59±0.02 6.50±0.93
% (sugar/total sugar) 4.4±0.6 0.8±0.1 1.2±0.2 14.5±2.1 19.9±6.9 0.5±0.1 49.2±6.9 9.6±1.7
Hydrolyzed Total % (mg/100mg dwt) 0.14±0.01 0.09±0.01 0.02±0.00 0.38±0.01 2.01±0.04 0.13±0.01 29.45±0.20 0.24±0.01 32.47±0.26
% (sugar/total sugar) 0.4±0.0 0.3±0.0 0.1±0.0 1.2±0.0 6.2±0.1 0.4±0.0 90.7±0.2 0.7±0.0
Insoluble % (mg/100mg dwt) 0.04±0.00 0.04±0.00 0.02±0.00 0.29±0.01 1.64±0.09 0.12±0.01 32.43±0.37 0.14±0.00 34.70±0.42
% (sugar/total sugar) 0.1±0.0 0.1±0.0 0.0±0.0 0.8±0.0 4.7±0.2 0.3±0.0 93.5±0.3 0.4±0.0
Soluble % (mg/100mg dwt) 0 0 0 0 0 0 0 0 0
% (sugar/total sugar) 0 0 0 0 0 0 0 0 0
a % = mg/100 mg dry weight of sample
b Data are means ± SE, n=3

79
The seed coat fractions of ‘Canstar’ had higher soluble NSP levels than those
of ‘Solido’. The cooking treatment did not significantly change soluble NSPs of
‘Solido’ or ‘Canstar’ seed coats (Tables 3.12, 3.13), but likely hydrated the fibre
components. The hydrolysis treatment completely removed the soluble NSP from
the seed coat fibre fraction (Tables 3.12, 3.13). These characterized pea seed coat
fractions can now be used to test if insoluble, soluble and/or hydrated pea seed
coat fibre has health-beneficial effects when consumed. Soluble NSPs have been
shown to help normalize blood glucose and insulin levels (Kumar et al., 2012).
The ability of soluble NSPs to ameliorate symptoms of diabetes mellitus has been
attributed to their effects on small intestinal viscosity and nutrient absorption, and
systemic effects from colonic-derived short chain fatty acids produced from
fermentable NSP (Kumar et al., 2012; Ou et al., 2001). The characterization of the
grain legume seed fibre components and pea seed coat fractions in this study will
aid nutritional studies aimed at determining if legume seed fibre with higher
soluble NSP levels (like ‘Canstar’ seed coats) or specifically processed seed coat
fractions have health-related benefits on consumption.
80
Chapter 4 Summary and conclusion
Summary of thesis work
This thesis aims to investigate the bioactive component proanthocyanidins
(PAs) with antimicrobial activity against food pathogens; and the nutrient profile
of legume seeds, including fibre, starch, and protein.
PAs were isolated from pea seed coat (from Pisum sativum L., cv. Solido) by
extraction, solvent partition and size exclusive chromatography. The PA-enriched
extract underwent acid-catalyzed cleavage and the cleaved products were
derivatized with phloroglucinol to their subsequent flavan-3-ol phloroglucinol
adducts and the free flavan-3-ols terminal subunits. The phloroglucinolysis
products were identified using HPLC-DAD by comparing their retention times
with the standard flavan-3-ols’ retention times. The PA subunit composition,
average degree of polymerization, and the conversion yield of PA-enriched
extract were determined using HPLC-DAD analysis method. The antimicrobial
activity of flavan-3-ol monomers and PA-enriched extract were tested against
food pathogens including three Gram-positive bacteria by MIC assays. The
structure-antimicrobial activity relationship was analyzed by comparison of MIC
values of flavan-3-ols with two or three hydroxyl groups on the flavonoid B-ring.
The antimicrobial mode of action for flavan-3-ols and PA-enriched extract were
analyzed by comparison of MIC values in the condition of with or without iron
during bacterial growth.
Different cultivars of mature legume seeds including pea, faba bean, and
lentil were studied for their nutrients composition in whole seeds, embryos and
seed coats respectively. The total starch and resistant starch of raw and cooked
legume whole seeds were determined using Megazyme methods. The protein
content in legume seed embryos and seed coats were determined by multiplying a
conversion factor of 6.25 with the nitrogen content analyzed by a nitrogen
analyzer. The non starch polysaccharides (fibre) in legume seed embryos and seed
coats were first cleaved in acidic condition, and the cleaved subunits were

81
derivatized to alditol acetates as the constituent sugars and determined by GC
analysis.
In order to investigate the health benefits of pea seed coats on the
amelioration of type 2 diabetes, the seed coats of two pea cultivars (contain or do
not contain PAs) were prepared as cooked and acid-hydrolyzed samples. The
reason to prepare cooked samples of legume seeds is that they are consumed in
this form in the human diet. The reason to prepare acid-hydrolyzed samples is that
the PAs from pea seed coats can be acid-hydrolyzed to anthocyanidins.
Anthocyanins are glycosides of anthocyanidins which have health benefits such as
antioxidant, anti-carcinogenic, and antidiabetic activities (Zafra-Stone et al.,
2007). We would like to investigate the health benefits with respects to
proanthocyanidins/anthocyanins and/or fibre from legumes seeds. The pea seed
coat fraction preparations and components analyse were my original work. The
pea seed fractions were provided to our collaborator Dr. Catherine Chan (human
nutrition lab at Department of Agricultural, Food and Nutritional Science,
University of Alberta) to test for their effects on amelioration of type 2 diabetes in
a diabetic rat model.
General conclusions
Overall, the thesis work showed that legume seeds are a good source of
proanthocyanidins, starch, protein and fibre for the human diet.
1. Proanthocyanidin in legume seed coat and their antimicrobial activity.
From the study of proanthocyanidins from legume seed coats (Chapter 2), we
confirmed that the PA content in cultivar ‘Solido’ seed coats consisted mainly of
gallocatechin and epigallocatechin flavan-3-ol subunits. These flavan-3-ols and
pea seed PAs showed antimicrobial activity against Staphylococcus aureus and
Staphylococcus pasteuri. The antimicrobial activity was enhanced with increased
hydroxyl substitution on the flavonoid B-ring. The flavan-3-ol stereochemistry of

82
the cis-2,3 and trans-2,3 configuration was not associated with antimicrobial
activity. The antimicrobial mode of action for PAs and their flavan-3-ol subunits
appeared to involve iron-binding. The hydroxyl groups of flavan-3-ols and PAs
can bind with iron which is an element that is required for most aerobic bacterial
growth. These results show that PAs in pea seeds coats can act as an antibacterial
agent. The antibacterial activity of flavan-3-ol monomers was higher than that of
pea seed coats PA extracts (flavan-3-ol oligomers/polymers). The iron chelating
capacity of PAs extracted from Sea buckthorne was reported to decrease with
increasing PA polymer length (Arimboor and Arumughan, 2012). This is likely
due to increasing steric hindrance of hydroxyl groups with increasing PA polymer
size.
2. Fibre, protein and starch content in legume seeds
In Chapter 3, we studied the protein, starch and fibre content in the seeds of
grain legumes including pea (Pisum sativum L.), faba bean (Vicia faba L.), and
lentil (Lens culinaris L.) grown in western Canada. Legume seeds are a rich
source of protein, starch and fibre. Cooked legume whole seeds contained less
resistant starch than raw seeds. Resistant starch has health beneficial effects
involved in ameliorating blood glucose since it is not digested in human small
intestine (Bornet et al., 1989; Shen et al., 2011). Legume seed coats are also a
major source of dietary fibre. We found that the composition of fibre differed
among the legume seed crops of pea, faba bean and lentil, as well as between
cultivars within each crop. The health benefits of fibre include amelioration type 2
diabetes, mainly from soluble non-starch polysaccharides (Kumar et al., 2012; Ou
et al., 2001). These data on protein, starch and fibre content among pea, faba bean
and lentil (and within specific cultivars of each crop) grown in western Canada
can be used to target specific uses. For example, faba bean seeds have higher
protein content, lentil and pea seeds have higher starch content. For soluble fibre,
pea seed cultivars have the highest amount compared to lentil and faba bean seeds.

83
Overall, the high content of protein and starch content in seed embryos, and
the high fibre content in seed coats indicate that these legume grain seeds are a
good food source for the human diet. These food attributes along with the
presence of bioactive PAs in the seed coats of specific legume cultivars, give
legume seeds great potential for enhancing human health.

84
References
Akiyama H, Fujii K, Yamasaki O, Oono T, Iwatsuki K (2001) Antibacterial
action of several tannins against Staphylococcus aureus. The Journal of
Antimicrobial Chemotherapy 48:487-491
Amarowicz R, Naczk M, Zadernowski R, Shahidi F (2000) Antioxidant
activity of condensed tannins of beach pea, canola hulls, evening primrose, and
faba bean. Journal of Food Lipids 7: 195-205
Andersen ØM, Markham KR (2006) Flavonoids: Chemistry, Biochemistry, and
Applications. CRC, Taylor & Francis
Andrew JM (2001) Determination of minimum inhibitory concentrations.
Journal of Antimicrobial Chemotherapy 48:5-16
Ariga T, Asao Y, Sugimoto H, Yokotsuka T (1981) Studies on a stringent
components in legume seeds.1. Occurrence of astringent oligomeric
proanthocyanidins in legume seeds. Agricultural and Biological Chemistry 45:
2705-2708
Arimboor R, Arumughan C (2012) Effect of polymerization on antioxidant and
xanthine oxidase inhibitory potential of sea buckthorn (H. rhamnoides)
proanthocyanidins. Journal of Food Science 77: C1036–C1041
Aron PM, Kennedy JA (2008) Flavan-3-ols: Nature, occurrence and biological
activity. Molecular Nutrition & Food Research 52: 79-104
Asp N, Johansson C, Hallmer H, Siljestrom M (1983) Rapid enzymatic assay
of insoluble and soluble dietary fiber. Journal of Agricultural and Food Chemistry.
31: 476–482
Ayres MP, Clausen TP, MacLean SF, Redman AM, Reichardt PB (1997)
Diversity of structure and antiherbivore activity in condensed tannins. Ecology
78:1696–1712
85
Bailey RW (1973) Structural carbohydrates. In G. W. Butler & R. W. Bailey
(Eds.). Chemistry and Biochemistry of Herbage 1: 157–211 New York:
Aacademic Press.
BeMiller J and Whistler R (2009) Starch. Third edition. Chemistry and
technology.
Berg JM, Tymoczko JL, Stryer L (2002) Biochemistry.5th edition. Chapter 11
Blakeney AB, Flinn PC (2005) Determination of non-starch polysaccharides in
cereal grains with near-infrared reflectance spectroscopy. Molecular Nutrition &
Food Research 49: 546–550
Bornet FRJ, Fontvieille AM, Rizkalla S, Colonna P, Blayo A, Mercier C,
Slama G (1989) Insulin and glycaemic responses in healthy humans to native
starches processed in different ways: correlation with in vitro -amylase
hydrolysis. The American Journal of Clinical Nutrition 50: 315–323
Brennan M, Harris PJ (2010) Distribution of fucosylated xyloglucans among
the walls of different cell types in monocotyledons determined by
immunofluorescence microscopy. Molecular Plant 4: 144-156.
Brillouet JM, Carre B (1983) Composition of cell walls from cotyledons of
Pisum sativum, Vicia faba and Glycine max. Phytochemistry 22: 841–847.
Brillouet JM, Riochet D (1983) Cell wall polysaccharides and lignin in
cotyledons and hulls of seeds from various lupin (Lupinus L.) species. Journal of
Science and Food Agriculture 34: 861–868.
Brooks M, Campbell R, Mccleary BV (2008) Advanced dietary fibre
technology. Part 8: Legume-seed Polysaccharides. Fl: Blackwell Science Ltd.
333–344.
Bryneel BM, Woestyne V, Verstraete W (1989) Lactic acid bacteria:
microorganisms able to grow in the absence of available iron and copper.
Biotechnology Letters 11:401–406
86
Buchanan B, Gruissem W, Jones R (2002) Biochemistry molecular biology of
plants. 1st edition. Chapter 11
Buzzini P, Turchetti B, Ieri F, Goretti M, Branda E, Mulinacci N,
Romani A (2007) Catechins and Proanthocyanidins: Naturally Occurring O-
heterocycles with Antimicrobial Activity. Topics in Heterocyclic Chemistry 10:
239-263
Carmona-Garcia R, Osorio-Diaz P, Agama-Acevedo E, Tovar J, Bello-Perez
LA (2007) Composition and effect of soaking on starch digestibility of Phaseolus
vulgaris (L.) cv. ‘Mayocoba’. International Journal of Food Science and
Technology 42: 296–302
Cheetham NWH, Cheung PCK, Evans AJ (1993) Structure of the principal
non-starch polysaccharide from the cotyledons of Lupinus angustifolius (cultivar
Gungurru). Carbohydrate Polymers 22: 37-47
Chen LJ, Games DE, Jones J, Kidwell H (2003) Separation and identification
of flavonoids in an extract from the seeds of Oroxylum indicum by CCC. Journal
of Liquid Chromatography & Related Technologies 26:1623-1636
Chen R, Wang JB, Zhang XQ, Ren J, Zeng CM (2011) Green tea polyphenol
epigallocatechin-3-gallate (EGCG) induced intermolecular cross-linking of
membrane proteins. Archives of Biochemistry and Biophysics 507: 343-9
Choct M (1997) Feed non-starch polysaccharides: Chemical structures and
nutritional significance. Feed Milling International 13–26
Chung HJ, Liu Q, Hoover R, Warkentin TD, Vandenberg A (2008) In vitro
starch digestibility, expected glycemic index, and thermal and pasting properties
of flours from pea, lentil and chickpea cultivars. Food Chemistry 111:316-321
Cos P, De Bruyne T, Hermans N, Apers S, Berghe DV, Vlietinck AJ (2003)
Proanthocyanidins in Health Care: Current and New Trends. Current Medicinal
Chemistry 10: 1345-1359

87
Costa GEA, Queiroz-Monici KS, Reis SMP, Oliveira MAC (2006) Chemical
composition, dietary fibre and resistant starch contents of raw and cooked pea,
common bean, chickpea and lentil legumes. Food Chemistry 94:327–330
Crépon K, Marget P, Peyronnet C, Carrouee B, Arese P, Duc G (2010)
Nutritional value of faba bean (Vicia faba L.) seeds for feed and food. Field Crops
Research 115:329-339
Crozier A, Jaganath IB, Clifford MN (2009) Dietary phenolics: chemistry,
bioavailability and effects on health. Natural Products Reports 26: 1001-1043
Cushnie TP, Lamb AJ (2005) Antimicrobial activity of flavonoids. International
Journal of Antimicrobial Agents 26:343-356
Daglia M (2012) Polyphenols as antimicrobial agents. Current Opinion in
Biotechnology 23:174-181
Dahl WJ, Foster LM, Tyler RT (2012) Review of the health benefits of peas
(Pisum sativum L.). British Journal of Nutrition 108: S3–S10
Daveby YD, Abrahamsson, Åman P (1993) Changes in chemical composition
during development of three different types of peas. Journal of the Science of
Food and Agriculture 63:21-28
Davidson MH, McDonald A (1998) Fiber: Forms and functions. Nutrition
Research 18: 617–624
Degen L, Halas V, Babinszky L (2007) Effect of dietary fibre on protein and fat
digestibility and its consequences on diet formulation for growing and fattening
pigs: A review. Acta Agriculturæ Scandinavica, Section A - Animal Science
57:1–9
Dixon RA, Xie D, Sharma SB (2005) Proanthocyanidins-a final frontier in
flavonoids research? New Phytologist 165:9-28

88
Duenas M, Estrella I, Hernandez T (2004) Occurrence of phenolic compounds
in the seed coat and the cotyledon of peas (Pisum sativum L.). European Food
Research and Technology 219: 116-123
Duenas M, Sun B, Hernandez T, Estrella I, Spranger MI (2003)
Proanthocyanidin composition in the seed coat of lentils (Lens culinaris L.).
Journal of Agricultural and Food Chemistry 51: 7999-8004
Engels C, Knödler M, Zhao YY, Carle R, Gänzle MG, Schieber A (2009)
Antimicrobial activity of gallotannins isolated from mango (Mangifera indica l.)
kernels. Journal of Agricultural and Food Chemistry 57: 7712-7718
Engels C, Schieber A, Gänzle MG (2011) Inhibitory spectra and modes of
antimicrobial action of gallotannins from mango kernels (Mangifera indica l.)
applied and environmental microbiology 77: 2215–2223
Englyst HN (1989) Classification and measurement of plant polysaccharides.
Animal Feed Science and Technology 23: 27-42
Englyst HN, Hudson GJ (1987) Colorimetric method for routine measurement
of dietary fibre as non-starch polysaccharides. A comparison with gas-liquid
chromatography. Food Chemistry 24: 63-76.
Englyst HN, Quigley ME, Hudson GJ (1994) Determination of dietary fibre as
non-starch polysaccharides with gas–liquid chromatographic, high-performance
liquid chromatographic or spectrophotometric measurement of constituent sugars.
Analyst 119:1497-1509
Faris MAE, Takruri HR, Issa AY (2013) Role of lentils (Lens culinaris L.) in
human health and nutrition: a review. Mediterranean Journal of Nutrition and
Metabolism 6: 3-16
Foo LY, Lu YR, Howell AB, Vorsa N (2000) A-type proanthocyanidin trimers
from cranberry that inhibit adherence of uropathogenic P-fimbriated Escherichia
coli. Journal of Natural Products 63: 1225-1228

89
Freudenberg K, Nash AC (1968) Constitution and Biosynthesis of Lignin.
Berlin: Springer-Verlag
Friedman M, Henika PR, Levin CE, Mandrell RE, Kozukue N (2006)
Antimicrobial Activities of Tea Catechins and Theaflavins and Tea Extracts
against Bacillus cereus. Journal of Food Protection 69:354-361
Fry SC (1986) Cross-linking of matrix polymers in the growing cell walls of
angiosperms. Annual Review of Plant Physiology 37:165-186
García-Alonso A, Goñi I, Saura-Calixto F (1998) Resistant starch and
potential glycaemic index of raw and cooked legumes (lentils, chickpeas and
beans). Zeitschrift für Lebensmittel-Untersuchung und –Forschung 206: 284-287
Gaulejac NSC, Vivas N, Freitas V, Bourgeois G (1999) The influence of
various phenolic compounds on scavenging activity assessed by an enzymatic
method. Journal of the Science of Food and Agriculture 79: 1081-1090
Gibbons S, Moser E, Kaatz GW (2004) Catechin gallates inhibit multidrug-
resistance (MDR) in Staphylococcus aureus. Planta Medica 70:1240–1242
Giczewska A, Borowska J (2003) Nutritional value of broad bean seeds. Part 1:
Starch and fibre. Nahrung/Food 47:95-97
Goering RV, Dockrell HM, Zuckerman M, Chiodini PL, Roitt IM (2012)
Mims' Medical Microbiology, 5th
edition. Saunders. Section 5, Chapter 33: 448-
449
Green CJ (2001) Fiber in enteral nutrition. Clinical Nutrition 20: 23-39
Green MM, Blankenhorn G, Hart H (1975) Which starch fraction is water
soluble, amylose or amylopectin? Journal of Chemical Education 52:729-730
Grotewold E (2005) The science of flavonoids. Springer
Harris LG, Foster SJ, Richards RG (2002) An introduction to Staphylococcus
aureus, and techniques for identifying and quantifying S. aureus adhesins in

90
relation to adhesion to biomaterials: review. European Cells and Materials 4: 39-
60
Hatano T, Kusuda M, Inada K, Ogawa TO, Shiota S, Tsuchiya T, Yoshida T
(2005) Effects of tannins and related polyphenols on methicillin resistant
Staphylococcus aureus, Phytochemistry 66: 2047 –2055
Hou DX (2004) Potential mechanisms of cancer chemoprevention by
anthocyanins. Current Molecular Medicine 3: 149–159
Ikigai H, Nakae T, Hara Y, Shimamura T (1993) Bactericidal catechins
damage the lipid bilayer. Biochimica et Biophysica Acta 1147:132–136
Jin L, Ozga JA, Lopes-Lutz D, Schieber A, Reinecke RD (2012)
Characterization of proanthocyanidins in pea (Pisum sativum L.), lentil (Lens
culinaris L.), and faba bean (Vicia faba L.) seeds. Food Research International 46:
528–535
Jin L (2011) PhD thesis. Flavonoids in Saskatoon Fruits, Blueberry Fruits, and
Legume Seeds. University of Alberta. Edmonton, Alberta, Canada
Jin L, Ozga JA, Lopes-Lutz D, Schieber A, Reinecke RD (2012)
Characterization of proanthocyanidins in pea (Pisum sativum L.), lentil (Lens
culinaris L.), and faba bean (Vicia faba L.) seeds. Food Research International 46:
528–535
Kennedy JA (2003) UNIT I1.4 Proanthocyanidins: Extraction, Purification, and
Determination of Subunit Composition by HPLC. Current Protocols in Food
Analytical Chemistry 499-509
Kennedy JA, Jones GP (2001) Analysis of proanthocyanidin cleavage products
following acid-catalysis in the presence of excess phloroglucinol. Journal of
Agricultural and Food Chemistry 49: 1740–1746

91
Khokhar S, Owusu-Apenten RK (2003) Iron binding characteristics of phenolic
compounds: some tentative structure-activity relations. Food Chemistry 8:133–
140
Klaenhammer TR (1993) Genetics of bacteriocins produced by lactic acid
bacteria. FEMS Microbiology Reviews 12: 39-85
Kloos WE, Bannerman TL (1994) Update on clinical significance of coagulase-
negative staphylococci. Clinical Microbiology Reviews 7: 117-140
Koes RE. Quattocchio F, Mol JNM (1994) The flavonoid biosynthetic pathway
in plants: Function and evolution. BioEssays 16: 123-132
Kubicka E, Troszyn ska A (2003) Antioxidative potential of lentil seed coat
towards lipoxygenase activity and β-carotene oxidation. Polish Journal of Food
and Nutrition Sciences 12: 147-150
Kumar V, Sinha AK, Makkar HP, de Boeck G, Becker K (2012) Dietary roles
of non-starch polysaccharides in human nutrition: a review. Critical Reviews in
Food Science and Nutrition 52:899–935
Lavoine N, Desloges I, Dufresne A, Bras J (2012) Microfibrillated cellulose-Its
barrier properties and applications in cellulosic materials: A review. Carbohydrate
Polymers 90: 735– 764
Leszczyński W (2004) Resistant starch – classification, structure, production.
Polish journal of food and nutrition sciences 13: 37–50
Mahesh B, Satish S (2008) Antimicrobial activity of some important medicinal
plants against plant and human pathogens. World Journal of Agricultural Sciences
4: 839-843
Merken HM, Beecher GR (2000) Measurement of food flavonoids by high-
performance liquid chromatography: A review. Journal of Agricultural and Food
Chemistry 48: 577-599

92
Mohnen D (2008) Pectin structure and biosynthesis. Current Opinion in Plant
Biology 11:266-277
Murray PR, Rosenthal KS, Pfaller MA (2013) Bacterial classification, structure,
and replication. Medical microbiology. 7th
edition. Saunders
Neukom H (1976) Chemistry and properties of the non-starchy polysaccharides
(NSP) of wheat flour. Lebensm. Wiss Technology 9: 143
Ou S, Kwok K, Li Y, Fu L (2001) In vitro study of possible role of dietary fiber
in lowering postprandial serum glucose. Journal of Agricultural and Food
Chemistry 49:1026–1029
Pourcel L, Routaboul JM, Cheynier V, Lepiniec L, Debeaujon I (2007)
Flavonoid oxidation in plants: from biochemical properties to physiological
functions. Trends in Plant Science 12: 29-36
Reyes-Moreno C, Paredes-López O (1993) Hard-to-cook phenomenon in
common beans. A review. Critical Reviews in Food Science and Nutrition 33:
227–286
Ricardo DS, Darmon N, Fernandez Y,Mitjavila S (1991) Oxygen free radical
scavenger capacity in aqueous models of different procyanidins from grape seeds.
Journal of Agricultural and Food Chemistry 39: 1549–1552
Santos-Buelga C, Scalbert A (2000) Proanthocyanidins and tannin-like
compounds-nature, occurrence, dietary intake and effects on nutrition and health.
Journal of the Science of Food and Agriculture 80: 1094-1117
Savini V, Catavitello C, Bianco A, Balbinot A, D'Antonio D (2009)
Epidemiology, pathogenicity and emerging resistances in Staphylococcus pasteuri:
from mammals and lampreys, to man. Recent Patents on Anti-Infective Drug
Discovery 4:123-129
Scalbert A (1991) Antimicrobial properties of tannins. Phytochemistry 30:3875-
3883
93
Scheller H V, Ulvskov P (2010) Hemicelluloses. Annual Review of Plant
Biology 61: 263-289
Serrano J, Puupponen-Pimia R, Dauer A, Aura AM, Saura-Calixto F (2009)
Tannins: current knowledge of food sources, intake, bioavailability and biological
effects. Molecular Nutrition & Food Research 53: 310-329
Shen L, Keenan MJ, Raggio A, Williams C, Martin RJ (2011) Dietary-
resistant starch improves maternal glycemic control in Goto-Kakizaki rat.
Molecular Nutrition & Food Research 55: 1499
Shimamura T, Zhao W, Hu Z (2007) Mechanism of action and potential for use
of tea catechin as an antiinfective agent. Anti-Infective Agents in Medicinal
Chemistry 6: 57-62
Silver L, Bostian K (1990) Screening of natural products for antimicrobial agents.
European Journal of Clinical Microbiology & Infectious Diseases 9:455-461
Sinha AK, Kumar V, Makkar HPS, De Boeck G, Becker K (2011) Non-starch
polysaccharides and their role in fish nutrition – A review. Food Chemistry
127:1409–1426
Taylor PW, Hamilton-Miller JM, Stapleton PD (2005) Antimicrobial
properties of green tea catechins. Food Science & Technology Bulletin 2: 71–81
Tits M, Angenot L, Poukens P, Warin R, Dierckxsens Y (1992)
Prodelphinidins from Ribes nigrum. Phytochemistry 31: 971–973
Tosh SM, Yada S (2010) Dietary fibres in pulse seeds and fractions:
Characterization, functional attributes, and applications. Food Research
International 43: 450–460
Weightman RM, Renard CMGC, Thibault JF (1994) Structure and properties
of the polysaccharides from pea hulls. I: Chemical extraction and fractionation of
the polysaccharides. Carbohydrate Polymers 24: 139–148

94
Whitlock KA, Kozicky L, Jin A, Yee H, Ha C, Morris J, Field CJ, Bell RC,
Ozga JA, Chan CB (2012) Assessment of the mechanisms exerting glucose-
lowering effects of dried peas in glucose-intolerant rats. British Journal of
Nutrition 108: S91–S102
Zafra-Stone S, Yasmin T, Bagchi M, Chatterjee A, Vinson JA, Bagchi D
(2007) Berry anthocyanins as novel antioxidants in human health and disease
prevention. Molecular Nutrition & Food Research 51: 675-683
Zang X, Shang M, Xu F, Liang J, Wang X, Mikage M, Cai S (2013) A-Type
proanthocyanidins from the stems of Ephedra sinica (Ephedraceae) and their
antimicrobial activities. Molecules 18: 5172-5189
Zobel HF (1988) Molecules to granules: a comprehensive starch review. Starch
40: 44-50