Embed Size (px)
Citation preview
81
Vol. 9, No. 3, 2018
ISSN 2233-4203/ e-ISSN 2093-8950LETTER www.msletters.org | Mass Spectrometry Letters
Characterization of Molecular Composition of Bacterial Melanin Isolated
from Streptomyces glaucescens Using Ultra-High-Resolution FT-ICR Mass
Spectrometry
Mira Choi1, A Young Choi
1, Soo-Yeon Ahn
2, Kwon-Young Choi
2,*, and Kyoung-Soon Jang1,3,*
1Biomedical Omics Center, Korea Basic Science Institute, Cheongju 28119, Republic of Korea2Department of Environmental Engineering, College of Engineering, Ajou University, Suwon 21990, Republic of Korea3Division of Bio-Analytical Science, University of Science and Technology, Daejeon 34113, Republic of Korea
Received August 14, 2018; Revised September 1, 2018; Accepted September 9, 2018
First published on the web September 30, 2018; DOI: 10.5478/MSL.2018.9.3.81
Abstract : In this study, the chemical composition of bacterial melanin isolated from the Streptomyces glaucescens strain waselucidated by ultra-high-resolution Fourier transform ion cyclotron resonance (FT-ICR) mass spectrometry. Ultra-high-resolu-tion mass profiles of the microbial melanin product were acquired using a 15 Tesla FT-ICR mass spectrometer in positive andnegative ion modes via electrospray ionization to obtain more complete descriptions of the molecular compositions of melanin-derived organic constituents. A mass resolving power of 500,000 (at m/z 400) was achieved for all spectra while collecting 400scans per sample with a 4 M transient. The results of this analysis revealed that the melanin pigment isolated from S. glaucescenspredominantly exhibits CHON and CHO species, which belong to the proteins class of compounds, with the mean C/O and C/Nratios of 4.3 and 13.1, thus suggesting that the melanin could be eumelanin. This analytical approach could be utilized to investi-gate the molecular compositions of a variety of natural or synthetic melanins. The compositional features of melanins areimportant for understanding their formation mechanisms and physico-chemical properties.
Key words: Melanin, Streptomyces glaucescens, FT-ICR MS, Chemical composition, Eumelanin
Introduction
Melanins, a group of complex natural pigments found in
most organisms, are synthesized via polymerization of indolic
and phenolic compounds and classified into three major types
(i.e., eumelanins, pheomelanins and allomelanins) based on
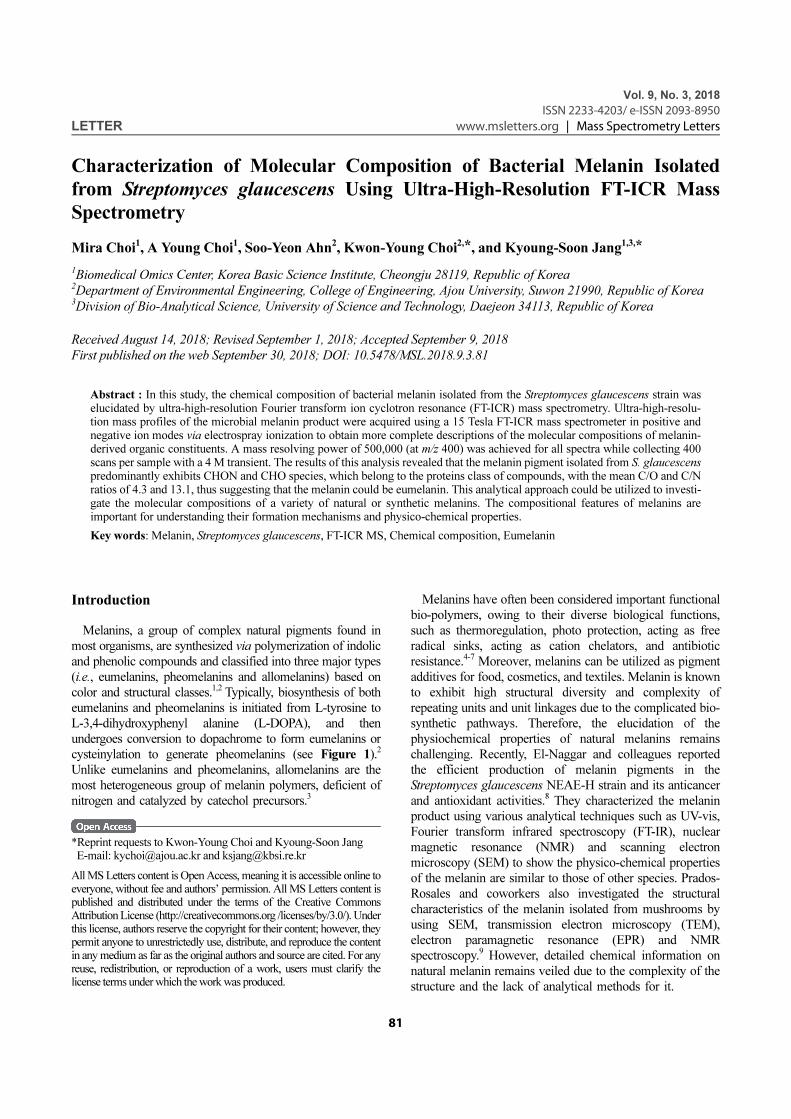
color and structural classes.1,2 Typically, biosynthesis of both
eumelanins and pheomelanins is initiated from L-tyrosine to
L-3,4-dihydroxyphenyl alanine (L-DOPA), and then
undergoes conversion to dopachrome to form eumelanins or
cysteinylation to generate pheomelanins (see Figure 1).2
Unlike eumelanins and pheomelanins, allomelanins are the
most heterogeneous group of melanin polymers, deficient of
nitrogen and catalyzed by catechol precursors.3
Melanins have often been considered important functional
bio-polymers, owing to their diverse biological functions,
such as thermoregulation, photo protection, acting as free
radical sinks, acting as cation chelators, and antibiotic
resistance.4-7 Moreover, melanins can be utilized as pigment
additives for food, cosmetics, and textiles. Melanin is known
to exhibit high structural diversity and complexity of
repeating units and unit linkages due to the complicated bio-
synthetic pathways. Therefore, the elucidation of the
physiochemical properties of natural melanins remains
challenging. Recently, El-Naggar and colleagues reported
the efficient production of melanin pigments in the
Streptomyces glaucescens NEAE-H strain and its anticancer
and antioxidant activities.8 They characterized the melanin
product using various analytical techniques such as UV-vis,
Fourier transform infrared spectroscopy (FT-IR), nuclear
magnetic resonance (NMR) and scanning electron
microscopy (SEM) to show the physico-chemical properties
of the melanin are similar to those of other species. Prados-
Rosales and coworkers also investigated the structural
characteristics of the melanin isolated from mushrooms by
using SEM, transmission electron microscopy (TEM),
electron paramagnetic resonance (EPR) and NMR
spectroscopy.9 However, detailed chemical information on
natural melanin remains veiled due to the complexity of the
structure and the lack of analytical methods for it.
*Reprint requests to Kwon-Young Choi and Kyoung-Soon Jang E-mail: [email protected] and [email protected]
All MS Letters content is Open Access, meaning it is accessible online toeveryone, without fee and authors’ permission. All MS Letters content ispublished and distributed under the terms of the Creative CommonsAttribution License (http://creativecommons.org /licenses/by/3.0/). Underthis license, authors reserve the copyright for their content; however, theypermit anyone to unrestrictedly use, distribute, and reproduce the contentin any medium as far as the original authors and source are cited. For anyreuse, redistribution, or reproduction of a work, users must clarify thelicense terms under which the work was produced.
Mira Choi, A Young Choi, Soo-Yeon Ahn, Kwon-Young Choi, and Kyoung-Soon Jang
82 Mass Spectrom. Lett. 2018 Vol. 9, No. 3, 81–85 ©Korean Society for Mass Spectrometry
Fourier transform ion cyclotron resonance mass
spectrometry (FT-ICR MS) has emerged as a powerful tool
for the analysis of extremely complex mixtures (e.g., crude
oils, water and soil-derived organic substances), resulting
in rapid and accurate interpretation of the elemental
compositions of complicated samples.10-15 From the highly
accurate mass data acquired by using FT-ICR MS, the
assignment of elemental compositions based on exact mass
differences is made, and then the assigned formulas are
sorted by chemical class, double bond equivalent and carbon
number. Marshall et al. demonstrated that a mass accuracy
of ~1 mDa at 500 Da (e.g., ~200 ppb), corresponding to the
mass resolving power of ~400,000, is required to efficiently
achieve unique elemental composition assignment;16
therefore, the unsurpassed resolving power (full width at half
maximum, FWHM: >400,000 at m/z 400) and mass
accuracy (<1 ppm) of FT-ICR MS and the development of
advanced data processing tools and graphical methods has
made it possible to successfully identify the chemical
compositions of extremely complicated samples, compared
to other types of high-resolution mass analyzers such as
Orbitrap and Q-TOF.11,17,18 Recently, high-resolution FT-
ICR MS has also been utilized to characterize chemically
or enzymatically synthesized humic-like substances.19,20
In this study, we examined the chemical composition of
natural melanin isolated from the S. glaucescens strain
using an ultra-high-resolution 15 Tesla FT-ICR MS. The
resulting data were interpreted to investigate the molecular
characteristics of the microbial melanin, providing clues to
the type of melanin. This approach has offered insights into
melanin structure and physico-chemical properties.
Experimental
Preparation of bacterial melanin for MS analysis
The isolation of melanin pigment from the culture of
Streptomyces glaucescens strain was done, as previously
described by El-Naggar et al.8 The isolated melanin was
dissolved in 7% (v/v) aqueous ammonium hydroxide
solution and filtered using a 0.45 µm PTFE (Teflon)
syringe filter to remove insoluble materials. Inorganic
constituents included in the resultant were removed by
using a Bond Elut PPL cartridge (Agilent, Santa Clara,
CA). The cartridge was first conditioned with 3 mL of
methanol, followed by 3 mL of 0.1% formic acid. Then,
the melanin sample was loaded to the cartridge, then
washed with ultrapure water three times. The melanin-
derived organic components, retained on the cartridge,
were eluted with 1.5 mL of methanol containing 2%
ammonium hydroxide solution. The resulting eluates were
immediately dried under a gentle nitrogen stream and
redissolved with 50% aqueous methanol containing 0.1%
formic acid for FT-ICR MS analysis with positive ion
mode. For negative ion mode analysis, it was reconstituted
with 50% aqueous methanol containing 7% ammonium
hydroxide solution.
FT-ICR MS analysis
Ultra-high-resolution mass spectrometric analysis was
performed on a 15T FT-ICR mass spectrometer equipped
with an electrospray ionization source (solariX XRTM
system, Bruker Daltonics, Billerica, MA), as demonstrated
previously21 with some modification. The melanin samples
were directly infused into the 15T FT-ICR mass
spectrometer using a chip-based nano-electrospray system
(TriVersa NanoMate, Advion BioSciences, Ithaca, NY) at
a flow rate of approximately 400 nL/min by a spray
voltage of 1.4 kV and a gas pressure of 0.3 bar and
analyzed in negative ion mode within the mass range of m/
z 150-1200. The mass resolving power was set at 500,000
(at m/z 400) for all spectra, and 400 scans per sample were
collected with a 4 M transient. The other MS parameters
were as follows: a drying gas flow rate of 1.5 L/min,
drying gas temperature of 180oC, ion accumulation time of
0.05 s and transient length of 1.39 s. All FT-ICR mass
spectra were externally calibrated using a NaTFA solution
(10 µg/mL in methanol). Data acquisition was controlled
by ftmsControl 2.0 software (Bruker Daltonics).
Assignment of elemental compositions
Raw data obtained from 15T FT-ICR MS were processed
using DataAnalysis (ver. 4.2, Bruker Daltonics) and
Composer (Sierra Analytics, Modesto, CA) softwares.
After 15T FT-ICR MS measurements, the raw spectra were
imported to the DataAnalysis 4.2 for peak detection and
recalibration. The Composer, a formula calculator, was
employed for assignment of elemental compositions, as
described previously,22 with some modifications. Briefly,
the empirical molecular formulae were calculated for the
masses of singly charged ions in the range of m/z 150–
1,000 by allowing up to the combinations of 200 12C, 400
Figure 1. Simplified melanin biosynthesis pathway.
Characterization of Molecular Composition of Bacterial Melanin Isolated from Streptomyces glaucescens ...
©Korean Society for Mass Spectrometry Mass Spectrom. Lett. 2018 Vol. 9, No. 3, 81–85 83
1H and 60 16O atoms, followed by additional calculations
of molecular formula including up to 5 14N and 2 32S
atoms, as described by Koch et al.23 The FTMS spectra
were recalibrated iteratively using the exact masses of the
assigned chemical formulae with assignment errors < 0.3
ppm and then the molecular formulas with assignment
errors > 0.3 ppm were ruled out from the final list for
further processing, as previously demonstrated.21 The van
Krevelen plot was used to visualize the assigned
compositions of the samples based on their molar H/C and
O/C ratios.17
Results and Discussion
Ultra-high-resolution FT-ICR MS analysis of melanin
isolated from S. glaucescens
The melanin sample isolated from S. glaucescens was
analyzed using an ultra-high-resolution 15T FT-ICR mass
spectrometer equipped with an ESI source with positive
and negative ion modes. As shown in Figure 2a, the FT-
ICR MS spectra of the melanin extract appear to differ by
ionization mode. After processing the raw data using
Composer software, 1546 and 851 molecular formulas
were assigned to the ESI (+) and (-) FT-ICR MS data,
respectively. All chemical characteristics of the assigned
elemental formulae that were calculated using the
Composer software from the FTMS data of the bacterial
melanin were listed in Supplementary Tables 1 and 2.
442 chemical formulas identified via negative ion mode
were also analysed via positive ion mode. After excluding
duplicate formulas, 1955 molecular compositions were
identified from the bacterial melanin pigment. The overall
chemical attributions of the melanin compounds are
summarized in Table 1. Regardless of the ion detection
mode, we observed that certain chemical properties [i.e.,
double bond equivalent (DBE), aromaticity index (AI) and
hydrogen-to-carbon (H/C) ratio] were consistent (see
Table 1). In particular, relatively low carbon-to-oxygen (C/
O) and carbon-to-nitrogen (C/N) ratios were observed in
negative ion and positive ion modes, respectively,
compared to the opposite modes. This is perhaps due to the
intrinsic properties of analytes: organic compounds
possessing hydroxyl and carboxyl functional groups are
more readily detected by ESI in negative ion mode,
whereas nitrogen-containing compounds are preferentially
ionized on the ESI positive ion mode.
Molecular compositions and chemical class distribu-
tions of S. glaucescens melanin
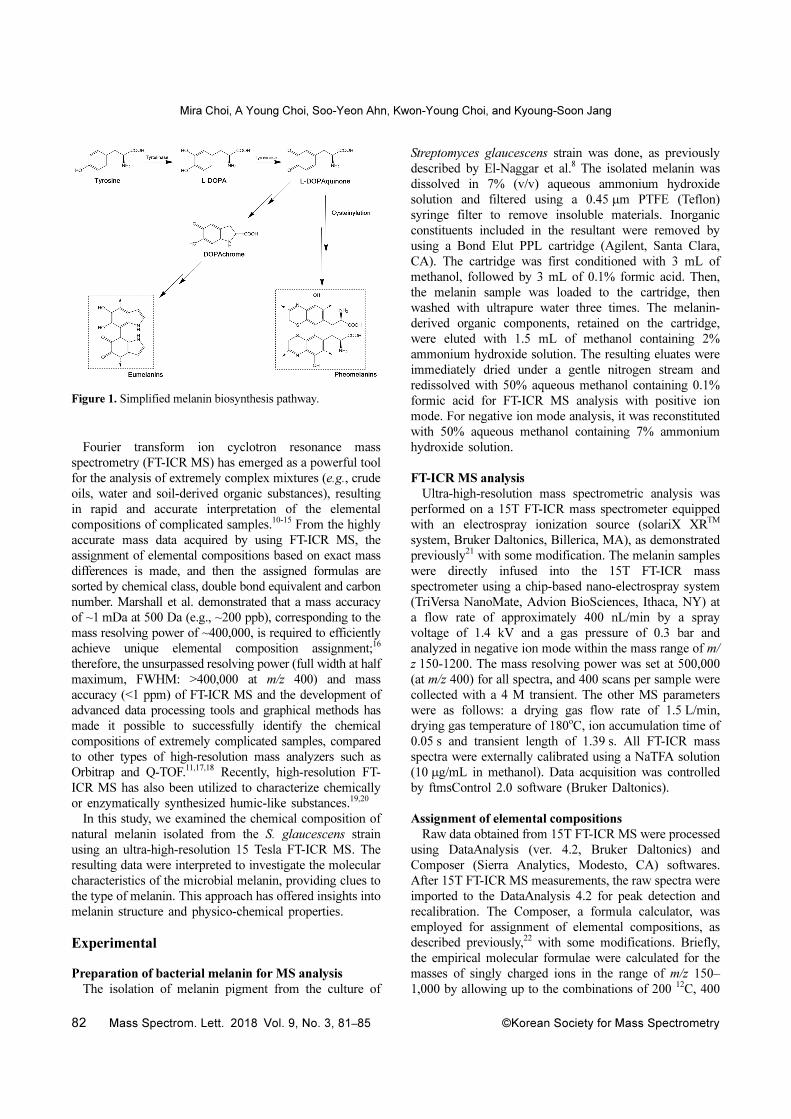
ESI (+) FTMS analysis revealed that CHON class
compounds were abundant in the melanin extract (82.8%
of the total based on the relative ion intensity), whereas the
CHON class species were 33.3% of the total in the ESI (-)
FTMS analysis (Figure 2b). In contrast, CHO class
compounds occupied 8.8% of the total in ESI (+) and made
up a high proportion in ESI (-) (46.4% of the total). Sulfur-
containing molecules were also detected in both ion modes
in low proportion (6 to 20% of the total).
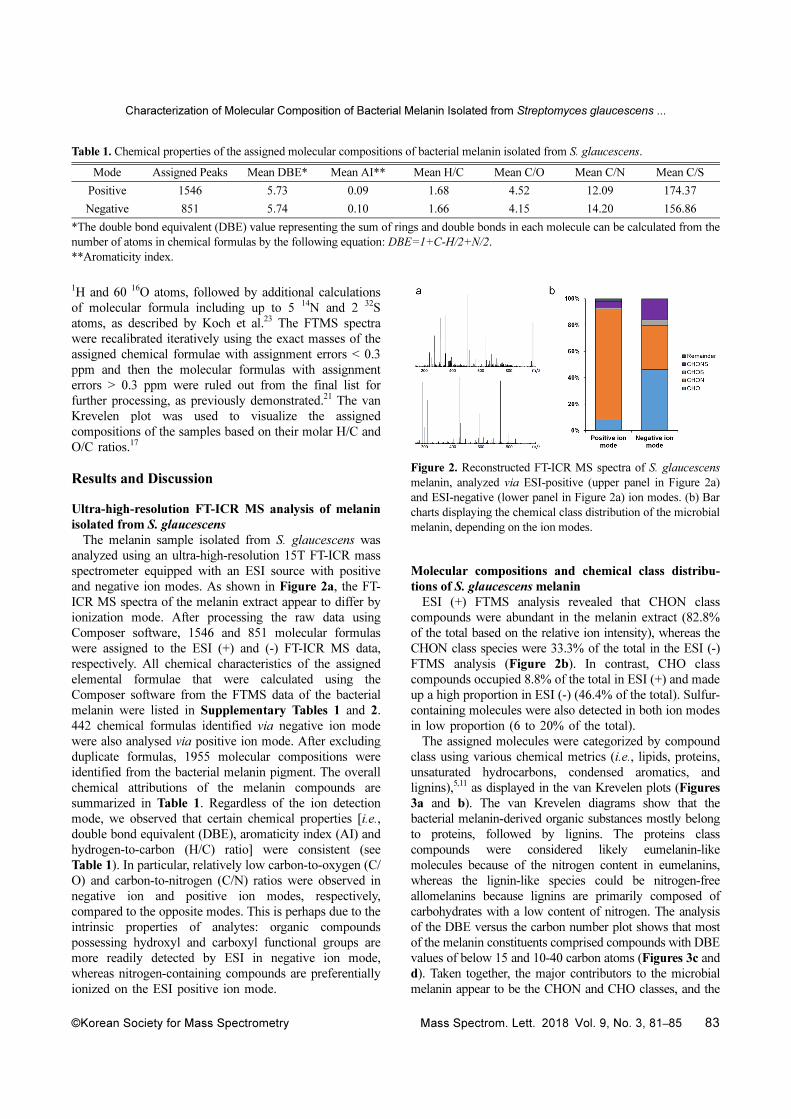
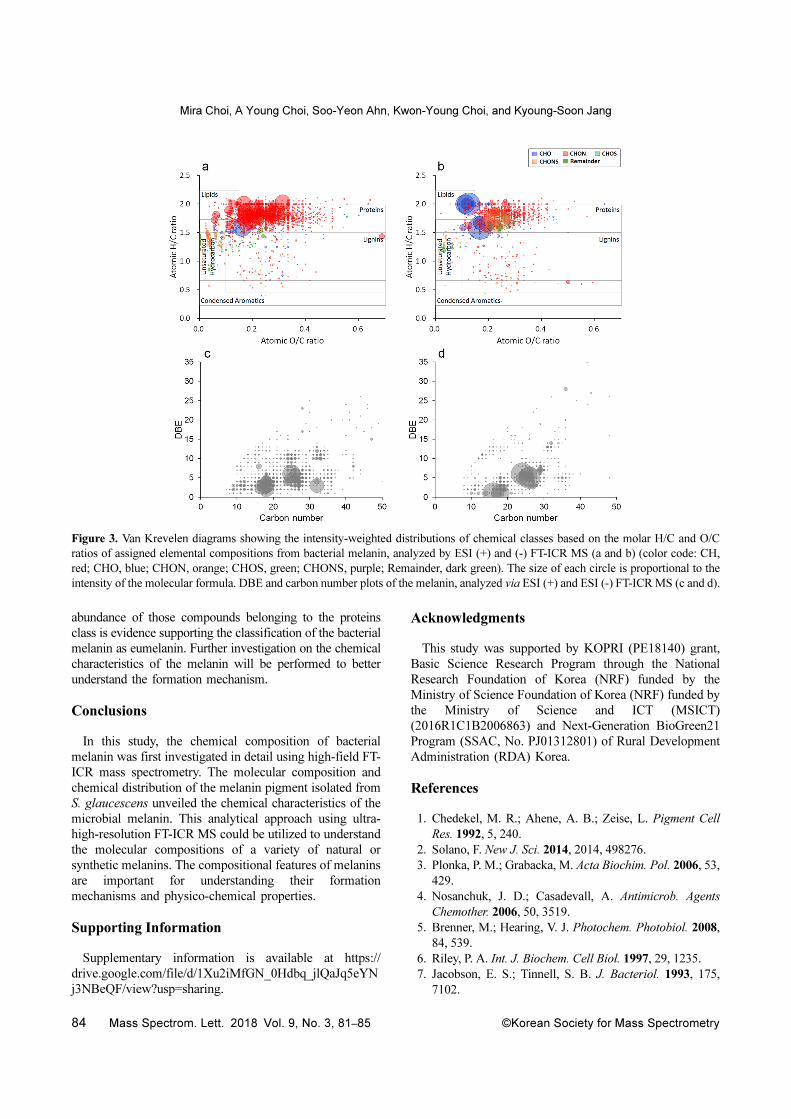
The assigned molecules were categorized by compound
class using various chemical metrics (i.e., lipids, proteins,
unsaturated hydrocarbons, condensed aromatics, and
lignins),5,11 as displayed in the van Krevelen plots (Figures
3a and b). The van Krevelen diagrams show that the
bacterial melanin-derived organic substances mostly belong
to proteins, followed by lignins. The proteins class
compounds were considered likely eumelanin-like
molecules because of the nitrogen content in eumelanins,
whereas the lignin-like species could be nitrogen-free
allomelanins because lignins are primarily composed of
carbohydrates with a low content of nitrogen. The analysis
of the DBE versus the carbon number plot shows that most
of the melanin constituents comprised compounds with DBE
values of below 15 and 10-40 carbon atoms (Figures 3c and
d). Taken together, the major contributors to the microbial
melanin appear to be the CHON and CHO classes, and the
Figure 2. Reconstructed FT-ICR MS spectra of S. glaucescens
melanin, analyzed via ESI-positive (upper panel in Figure 2a)
and ESI-negative (lower panel in Figure 2a) ion modes. (b) Bar
charts displaying the chemical class distribution of the microbial
melanin, depending on the ion modes.
Table 1. Chemical properties of the assigned molecular compositions of bacterial melanin isolated from S. glaucescens.
Mode Assigned Peaks Mean DBE* Mean AI** Mean H/C Mean C/O Mean C/N Mean C/S
Positive 1546 5.73 0.09 1.68 4.52 12.09 174.37
Negative 851 5.74 0.10 1.66 4.15 14.20 156.86
*The double bond equivalent (DBE) value representing the sum of rings and double bonds in each molecule can be calculated from the
number of atoms in chemical formulas by the following equation: DBE=1+C-H/2+N/2.
**Aromaticity index.
Mira Choi, A Young Choi, Soo-Yeon Ahn, Kwon-Young Choi, and Kyoung-Soon Jang
84 Mass Spectrom. Lett. 2018 Vol. 9, No. 3, 81–85 ©Korean Society for Mass Spectrometry
abundance of those compounds belonging to the proteins
class is evidence supporting the classification of the bacterial
melanin as eumelanin. Further investigation on the chemical
characteristics of the melanin will be performed to better
understand the formation mechanism.
Conclusions
In this study, the chemical composition of bacterial
melanin was first investigated in detail using high-field FT-
ICR mass spectrometry. The molecular composition and
chemical distribution of the melanin pigment isolated from
S. glaucescens unveiled the chemical characteristics of the
microbial melanin. This analytical approach using ultra-
high-resolution FT-ICR MS could be utilized to understand
the molecular compositions of a variety of natural or
synthetic melanins. The compositional features of melanins
are important for understanding their formation
mechanisms and physico-chemical properties.
Supporting Information
Supplementary information is available at https://
drive.google.com/file/d/1Xu2iMfGN_0Hdbq_jlQaJq5eYN
j3NBeQF/view?usp=sharing.
Acknowledgments
This study was supported by KOPRI (PE18140) grant,
Basic Science Research Program through the National
Research Foundation of Korea (NRF) funded by the
Ministry of Science Foundation of Korea (NRF) funded by
the Ministry of Science and ICT (MSICT)
(2016R1C1B2006863) and Next-Generation BioGreen21
Program (SSAC, No. PJ01312801) of Rural Development
Administration (RDA) Korea.
References
1. Chedekel, M. R.; Ahene, A. B.; Zeise, L. Pigment Cell
Res. 1992, 5, 240.
2. Solano, F. New J. Sci. 2014, 2014, 498276.
3. Plonka, P. M.; Grabacka, M. Acta Biochim. Pol. 2006, 53,
429.
4. Nosanchuk, J. D.; Casadevall, A. Antimicrob. Agents
Chemother. 2006, 50, 3519.
5. Brenner, M.; Hearing, V. J. Photochem. Photobiol. 2008,
84, 539.
6. Riley, P. A. Int. J. Biochem. Cell Biol. 1997, 29, 1235.
7. Jacobson, E. S.; Tinnell, S. B. J. Bacteriol. 1993, 175,
7102.
Figure 3. Van Krevelen diagrams showing the intensity-weighted distributions of chemical classes based on the molar H/C and O/C
ratios of assigned elemental compositions from bacterial melanin, analyzed by ESI (+) and (-) FT-ICR MS (a and b) (color code: CH,
red; CHO, blue; CHON, orange; CHOS, green; CHONS, purple; Remainder, dark green). The size of each circle is proportional to the
intensity of the molecular formula. DBE and carbon number plots of the melanin, analyzed via ESI (+) and ESI (-) FT-ICR MS (c and d).
Characterization of Molecular Composition of Bacterial Melanin Isolated from Streptomyces glaucescens ...
©Korean Society for Mass Spectrometry Mass Spectrom. Lett. 2018 Vol. 9, No. 3, 81–85 85
8. El-Naggar, N. E.; El-Ewasy, S. M. Sci. Rep. 2017, 7,
42129.
9. Prados-Rosales, R.; Toriola, S.; Nakouzi, A.; Chatterjee,
S.; Stark, R.; Gerfen, G.; Tumpowsky, P.; Dadachova, E.;
Casadevall, A. J. Agric. Food Chem. 2015, 63, 7326.
10. Antony, R.; Grannas, A. M.; Willoughby, A. S.; Sleighter,
R. L.; Thamban, M.; Hatcher, P. G. Environ. Sci. Technol.
2014, 48, 6151.
11. Cho, Y.; Ahmed, A.; Islam, A.; Kim, S. Mass Spectrom.
Rev. 2015, 34, 248.
12. Guigue, J.; Harir, M.; Mathieu, O.; Lucio, M.; Ranjard,
L.; Lévêque, J.; Schmitt-Kopplin, P. Biogeochemistry
2016, 128, 307.
13. Ksionzek, K. B.; Lechtenfeld, O. J.; McCallister, S. L.;
Schmitt-Kopplin, P.; Geuer, J. K.; Geibert, W.; Koch, B.
P. Science 2016, 354, 456.
14. Lobodin, V. V.; Juyal, P.; McKenna, A. M.; Rodgers, R.
P.; Marshall, A. G. Energy Fuels 2014, 28, 6841.
15. Mazur, D. M.; Harir, M.; Schmitt-Kopplin, P.; Polyakova,
O. V.; Lebedev, A. T. Sci. Total Environ. 2016, 557, 12.
16. Marshall, A. G.; Blakney, G. T.; Chen, T.; Kaiser, N. K.;
McKenna, A. M.; Rodgers, R. P.; Ruddy, B. M.; Xian, F.
Mass Spectrom. (Tokyo) 2013, 2, S0009.
17. Kim, S.; Kramer, R. W.; Hatcher, P. G. Anal. Chem. 2003,
75, 5336.
18. Wu, Z.; Rodgers, R. P.; Marshall, A. G. Anal. Chem. 2004,
76, 2511.
19. Jeong, H. J.; Cha, J. Y.; Choi, J. H.; Jang, K. S.; Lim, J.;
Kim, W. Y.; Seo, D. C.; Jeon, J. R. ACS Omega 2018, 3,
7441.
20. Cha, J. Y.; Kim, T. W.; Choi, J. H.; Jang, K. S.; Khaleda,
L.; Kim, W. Y.; Jeon, J. R. J. Agric. Food Chem. 2017, 65,
1167.
21. Choi, J. H.; Kim, Y. G.; Lee, Y. K.; Pack, S. P.; Jung, J. Y.;
Jang, K. S. Biotechnol. Bioprocess Eng. 2017, 22, 637.
22. Choi, J. H.; Ryu, J.; Jeon, S.; Seo, J.; Yang, Y. H.; Pack, S.
P.; Choung, S.; Jang, K. S. Environ. Pollut. 2017, 225,
329.
23. Koch, B. P.; Witt, M.; Engbrodt, R.; Dittmar, T.; Kattner,
G. Geochim. Cosmochim. Acta 2005, 69, 3299.